Embed Size (px)
Citation preview
UFC 3-280-05 31 July 2006
UNIFIED FACILITIES CRITERIA (UFC)
DESIGN: IN SITU THERMAL REMEDIATION
APPROVED FOR PUBLIC RELEASE; DISTRIBUTION UNLIMITED

UFC 3-280-05 31 July 2006
UNIFIED FACILITIES CRITERIA (UFC)
CRITERIA FORMAT STANDARD Any copyrighted material included in this UFC is identified at its point of use. Use of the copyrighted material apart from this UFC must have the permission of the copyright holder. U.S. ARMY CORPS OF ENGINEERS (Preparing Activity) NAVAL FACILITIES ENGINEERING COMMAND AIR FORCE CIVIL ENGINEER SUPPORT AGENCY Record of Changes (changes are indicated by \1\ ... /1/) Change No. Date Location
UFC 3-280-05 31 July 2006
i
FOREWORD The Unified Facilities Criteria (UFC) system is prescribed by MIL-STD 3007 and provides planning, design, construction, sustainment, restoration, and modernization criteria, and applies to the Military Departments, the Defense Agencies, and the DoD Field Activities in accordance with USD(AT&L) Memorandum dated 29 May 2002. UFC will be used for all DoD projects and work for other customers where appropriate. UFC are living documents and will be periodically reviewed, updated, and made available to users as part of the Services’ responsibility for providing technical criteria for military construction. Headquarters, U.S. Army Corps of Engineers (HQUSACE), Naval Facilities Engineering Command (NAVFAC), and Air Force Civil Engineer Support Agency (AFCESA) are responsible for administration of the UFC system. Defense agencies should contact the preparing service for document interpretation and improvements. Technical content of UFC is the responsibility of the cognizant DoD working group. Recommended changes with supporting rationale should be sent to the respective service proponent office by the following electronic form: Criteria Change Request (CCR). The form is also accessible from the Internet sites listed below. UFC are effective upon issuance and are distributed only in electronic media from the following sources: • Unified Facilities Criteria (UFC) Index http://65.204.17.188//report/doc_ufc.html. • USACE TECHINFO Internet site http://www.hnd.usace.army.mil/techinfo/index.htm. • NAVFAC Engineering Innovation and Criteria Office Internet site http://criteria.navfac.navy.mil. • Construction Criteria Base (CCB) system maintained by the National Institute of Building
Sciences at Internet site http://www.nibs.org/ccb. Hard copies of UFC printed from electronic media should be checked against the current electronic version prior to use to ensure that they are current. AUTHORIZED BY: ______________________________________ Don Basham, P.E. Chief, Engineering and Construction Division U.S. Army Corps of Engineers
______________________________________Dr. James W Wright, P.E. Chief Engineer Naval Facilities Engineering Command
______________________________________ Kathleen I. Ferguson, P.E. The Deputy Civil Engineer DCS/Installations & Logistics Department of the Air Force
______________________________________Get Moy Director of Analysis & Investment Deputy Under Secretary of Defense for Installations and Environment Department of Defense
UFC 3-280-05 31 July 2006
ii
CONTENTS
Page CHAPTER 1 INTRODUCTION Paragraph 1-1 PURPOSE ......................................................................................... 1-1
1-2 APPLICABILITY...................................................................................1-1 1-3 REFERENCES ....................................................................................1-1 1-4 BACKGROUND ...................................................................................1-1 1-4.1 ISTR Methods......................................................................................1-1 1-4.2 Brief History of ISTR............................................................................1-2 1-4.3 Appropriateness of Aggressive Source Removal ................................1-3 1-4.4 Advantages of ISTR.............................................................................1-3 1-4.5 Limitations of ISTR ..............................................................................1-4 1-5 SCOPE ................................................................................................1-4 1-5.1 General Content ..................................................................................1-4 1-5.2 Other Information Sources...................................................................1-4 1-6 ORGANIZATION .................................................................................1-5 1-6.1 General Organization Philosophy ........................................................1-5 1-6.2 Sequence of Presentation ...................................................................1-5
CHAPTER 2 UNDERLYING PHYSICAL PRINCIPLES AND TECHNOLOGY DESCRIPTIONS Paragraph 2-1 FUNDAMENTAL PRINCIPLES..................................................... 2-1
2-1.1 Chemical Principles .............................................................................2-1 2-1.2 Thermal Principles ...............................................................................2-7 2-1.3 Hydrogeologic Principles ...................................................................2-11 2-2 TECHNOLOGY DESCRIPTIONS......................................................2-24 2-2.1 Thermal Conductive Heating .............................................................2-24 2-2.2 Electrical Resistivity Heating..............................................................2-28 2-2.3 Steam Enhanced Extraction ..............................................................2-34 2-3 UNAVOIDABLE AND POTENTIAL EFFECTS. .................................2-41 2-3.1 Ecological Impacts.............................................................................2-41 2-3.2 Physical Impacts................................................................................2-42
CHAPTER 3 SITE CHARACTERIZATION FOR ISTR TECHNOLOGY SCREENING AND DESIGN Paragraph 3-1 INTRODUCTION ............................................................................... 3-1
3-2 DATA COLLECTION REQUIREMENTS TO SUPPORT REMEDY SELECTION AND DESIGN .................................................................3-1
3-3 SITE PHYSICAL PROPERTIES AND SITE CONDITIONS.................3-1 3-3.1 Description of Site Including Site Plan.................................................3-2 3-3.2 Stratigraphic Features .........................................................................3-2 3-3.3 Hydrogeologic and Hydraulic Parameters ...........................................3-2 3-3.4 Site Accessibility ..................................................................................3-3 3-3.5 NAPL Location and Volume Estimates................................................3-3 3-3.6 Evaluation of Contaminant Mobility .....................................................3-4 3-4 CHEMICAL ANALYSES AND CONTAMINANT PROPERTIES ..........3-4 3-4.1 Organic Parameters.............................................................................3-4 3-4.2 Inorganic Parameters ..........................................................................3-4

UFC 3-280-05 31 July 2006
iii
3-4.3 NAPL Characteristics...........................................................................3-4 3-4.4 Trends in Dissolved Phase Compounds..............................................3-5 3-5 DATA NEEDS SPECIFIC TO EACH TECHNOLOGY .........................3-5 3-5.1 Thermal Conductive Heating ...............................................................3-5 3-5.2 Electrical Resistivity Heating................................................................3-7 3-5.3 Steam Enhanced Extraction ................................................................3-8 3-6 EVALUATION OF BIOLOGICAL DEGRADATION POTENTIAL .......3-10 3-6.1 Thermal Conductive Heating .............................................................3-10 3-6.2 Electrical Resistivity Heating..............................................................3-11 3-6.3 Steam Enhanced Extraction ..............................................................3-11
CHAPTER 4 TECHNOLOGY SCREENING AND FEASIBILITY STUDIES FOR ISTR Paragraph 4-1 INTRODUCTION ............................................................................... 4-1 4-2 IDENTIFY REMEDIAL ACTION STRATEGIES................................. 4-1
4-2.1 Source Removal/Reduction/Recovery.................................................4-1 4-2.2 Other Remediation Strategies .............................................................4-4 4-3 MEASURES OF SUCCESS FOR ISTR...............................................4-5 4-4 FEASIBILITY EVALUATION FLOW CHARTS.....................................4-6 4-5 EVALUATION OF SHORT-TERM IMPACTS OF ISTR .......................4-9
CHAPTER 5 BENCH- AND PILOT-SCALE STUDIES Paragraph 5-1 INTRODUCTION AND CONSIDERATIONS IN DETERMINING
TESTING APPROACHES ................................................................. 5-1 5-2 THERMAL CONDUCTIVE HEATING..................................................5-3 5-2.1 Bench-Scale Studies ...........................................................................5-3 5-2.2 Pilot-Scale Studies...............................................................................5-4 5-3 ELECTRICAL RESISTIVITY HEATING...............................................5-7 5-3.1 Bench-Scale Studies ...........................................................................5-7 5-3.2 Pilot Tests ............................................................................................5-8 5-4 STEAM ENHANCED EXTRACTION ...................................................5-8 5-4.1 Physical Properties ..............................................................................5-8 5-4.2 Steam Injection Experiments ...............................................................5-9 5-4.3 Pilot Tests ..........................................................................................5-11
CHAPTER 6 DESIGN CONSIDERATIONS Paragraph 6-1 INTRODUCTION AND OVERALL DESIGN STRATEGY .................. 6-1
6-2 CONDUCTIVE HEATING ....................................................................6-1 6-2.1 Example Calculation ............................................................................6-2 6-2.2 Subsurface Design ..............................................................................6-5 6-2.3 Thermal Wells......................................................................................6-8 6-2.4 Energy Input and Conveyance Systems............................................6-11 6-2.5 Aboveground Systems.......................................................................6-13 6-3 ELECTRICAL RESISTIVITY HEATING.............................................6-15 6-3.1 Subsurface Design ............................................................................6-15 6-3.2 Energy Input and Conveyance Systems............................................6-16 6-3.3 Above-Ground Equipment .................................................................6-17 6-3.4 Design Review Checklist ...................................................................6-18 6-4 STEAM ENHANCED EXTRACTION .................................................6-19 6-4.1 Subsurface Design ............................................................................6-19
UFC 3-280-05 31 July 2006
iv
6-4.2 Energy Input and Conveyance Systems............................................6-21 6-4.3 Above-Ground Equipment .................................................................6-22 6-4.4 Design Review Checklist ...................................................................6-22 6-5 WASTE STREAM TREATMENT OPTIONS......................................6-23 6-5.1 Liquid Treatment................................................................................6-26 6-5.2 Vapor Treatment................................................................................6-28 6-5.3 Process Residuals and Offsite Waste Management .........................6-29 6-6 OTHER SYSTEM CONSIDERATIONS .............................................6-29 6-6.1 Enclosures/Buildings .........................................................................6-29 6-6.2 Surface Covers ..................................................................................6-29 6-6.3 Noise Control .....................................................................................6-29 6-6.4 Subsurface Barriers ...........................................................................6-30 6-7 MODELING........................................................................................6-31 6-7.1 General ..............................................................................................6-31 6-7.2 Applicability and Objectives ...............................................................6-32 6-7.3 Model Solutions and Codes...............................................................6-33 6-7.4 Numerical Modeling Codes................................................................6-35 6-7.5 Input Data ..........................................................................................6-36 6-7.6 Implementation of Model Results ......................................................6-36 6-7.7 Modeling Aspects for Thermal Conductive Heating...........................6-36 6-7.8 Modeling Aspects for Electrical Resistivity Heating ...........................6-37 6-7.9 Modeling Aspects for Steam Injection ...............................................6-38 6-7.10 Checklist for Review of Models for In Situ Thermal Remediation......6-39
CHAPTER 7 COST AND PERFORMANCE RESULTS Paragraph 7-1 INTRODUCTION ............................................................................... 7-1 7-2 GENERAL OBSERVATIONS ............................................................ 7-1
7-3 TECHNOLOGY-SPECIFIC APPLICATIONS.......................................7-3 7-3.1 Thermal Conductive Heating ...............................................................7-3 7-3.2 Electrical Resistivity Heating................................................................7-4 7-3.3 Steam Enhanced Extraction ................................................................7-5
CHAPTER 8 PERFORMANCE MONITORING AND OPERATIONS AND
MAINTENANCE (O&M) Paragraph 8-1 SUBSURFACE MONITORING FOR ISTR TECHNOLOGIES........... 8-1
8-1.1 Fluid Pressure......................................................................................8-1 8-1.2 Fluid Flow ............................................................................................8-2 8-1.3 Temperature ........................................................................................8-2 8-1.4 Chemistry.............................................................................................8-4 8-1.5 Saturation ............................................................................................8-6 8-2 OPERATIONS AND MAINTENANCE FOR ISTR TECHNOLOGIES ..8-6 8-2.1 Thermal Conductive Heating ...............................................................8-6 8-2.2 Electrical Resistivity Heating................................................................8-7 8-2.3 Steam Enhanced Extraction ................................................................8-9
CHAPTER 9 SYSTEM SHUTDOWN AND CONFIRMATION OF CLEANUP Paragraph 9-1 INTRODUCTION ............................................................................... 9-1
9-2 SHUTDOWN STRATEGY ...................................................................9-1 9-3 SHUTDOWN CRITERIA......................................................................9-3
UFC 3-280-05 31 July 2006
v
9-3.1 Mass Removal .....................................................................................9-3 9-3.2 Temperature Distribution .....................................................................9-4 9-3.3 Groundwater Concentration.................................................................9-4 9-3.4 Plume Load..........................................................................................9-4 9-3.5 Emerging Methods to Track Remediation Progress ............................9-5 9-4 CONFIRMATION OF CLEANUP .........................................................9-7 9-4.1 Sampling Strategy ...............................................................................9-7 9-4.2 Sampling Hot Media ............................................................................9-8
CHAPTER 10 OTHER ISSUES Paragraph 10-1 PATENT ISSUES .............................................................................. 10-1
10-1.1 Conductive Heating ...........................................................................10-1 10-1.2 Steam Enhanced Extraction ..............................................................10-2 10-1.3 Electrical Heating...............................................................................10-3 10-1.4 Steam Injection and Electrical Heating ..............................................10-4 10-2 SAFETY.............................................................................................10-5 10-2.1 Thermal Conductive Heating .............................................................10-5 10-2.2 Electrical Resistance Heating ............................................................10-6 10-2.3 Steam Enhanced Extraction ..............................................................10-6 10-3 COMMUNITY ACCEPTANCE AND EDUCATION ............................10-7 10-4 CONTRACTING ................................................................................10-8 10-4.1 Planning for Contracting ....................................................................10-8 10-4.2 Contracting Approaches ....................................................................10-8 10-5 EQUIPMENT PURCHASE, OPERATIONS AND MAINTENANCE ...10-9 10-6 REGULATORY ISSUES..................................................................10-10 10-6.1 Introduction ......................................................................................10-10 10-6.2 Permitting of Discharges to the Environment ..................................10-11 10-6.3 Underground Injection Control (UIC) ...............................................10-11 10-6.4 Air Emissions ...................................................................................10-12 10-6.5 Wastewater and Sewer Discharges.................................................10-12 10-6.6 Preventing Uncontrolled Migration...................................................10-12
APPENDIX A REFERENCES APPENDIX B CASE STUDIES APPENDIX C EXAMPLE CHECKLISTS APPENDIX D EXAMPLE TABLE OF CONTENTS FOR OPERATIONS MANUAL GLOSSARY AND LIST OF ACRONYMS

UFC 3-280-05 31 July 2006
vi
FIGURES Figure Title 2-1 Aqueous Solubilities of Trichloroethylene (solid line) and Tetrachloroethylene
(dashed line) as a Function of Temperature ...........................................................2-2 2-2 Calculated Aqueous Solubility of Naphthalene as a Function of Temperature .......2-3 2-3 Vapor Pressure of Selected Compounds vs. Temperature .....................................2-4 2-4 Vapor-Phase Concentrations of Trichloroethylene and Tetrachloroethylene as
Functions of Temperature Calculated with the Clapeyron Equation Assuming Ideal-Gas Behavior............................................................................................................2-5
2-5 Henry’s Law Constants versus Temperature for Various Compounds ...................2-5 2-6 Conductive Heating of 1, 2, and 3m-Thick Impermeable Layers from Both Sides...2-8 2-7 Thermal Conductivity and specific Heat Capacity of Dry Silty Sand vs.
Temperature ..........................................................................................................2-10 2-8 Viscosity vs. Temperature for Liquids ....................................................................2-13 2-9 Density vs. Temperature for Liquids ......................................................................2-14 2-10 Conceptual Diagram of Multiphase Flow at a Dynamic Underground
Stripping Project ....................................................................................................2-15 2-11 Conceptual Diagrams of LNAPL in Soil, LNAPL Saturations vs. Elevation, and Level
in a Well..................................................................................................................2-16 2-12 Example of Oil Saturation as a Function of Air-NAPL Capillary Pressure and NAPL-
Water Capillary Pressure .......................................................................................2-17 2-13 Typical Relationship of Relative Permeability and Saturation, in a Soil Partially
Saturated with Air and Water ................................................................................2-18 2-14 ISTD System Schematic ........................................................................................2-25 2-15 Schematic of Typical ISTD Well Field ....................................................................2-26 2-16 Air Quality Control Components used in Conjunction with Conductive Heating ................................................................................................2-27 2-17 Sine Curves of Voltage vs. Time Depicting Six Phase Alternating Current............2-29 2-18 Relationship Between Voltage and Electrode Separation......................................2-29 2-19 Three-Phase Heating Pattern ................................................................................2-30 2-20 Six-Phase Heating Pattern .....................................................................................2-30 2-21 General Schematic of a Six-Phase ERH Treatment System..................................... 2-31 2-22 Example Sketch of a Steam Injection Remediation System for a Site with both
DNAPL and LNAPL, and Multiple Zones of Contamination ...................................2-36 2-23 The Three Temperature Zones that Form During a Steam Flood..........................2-37 4-1 Evaluation of Site Characteristics.............................................................................4-7 4-2 Selection of ISTR Technology..................................................................................4-8 5-1 Typical Thermal Conduction Pilot-Test Layout.........................................................5-5 5-2 Typical Thermal Conduction Pilot-Test Cross-Section.............................................5-6 5-3 Typical Thermal Conduction Pilot-Test Process Diagram........................................5-6 5-4 Laboratory Setup for One-Dimensional Steam Injection Experiments ...................5-10 6-1 Fractions of Initial Concentrations Remaining as a Function of Time at 300°C .......6-4 6-2 Example 3:1 Edge-Centered Pattern .......................................................................6-7 6-3 Typical Heater-Only Well..........................................................................................6-8 6-4 Typical Producer Well ..............................................................................................6-9 6-5 Typical ERH Energy Distribution in Subsurface .....................................................6-15 6-6 Typical Temperature Monitoring Detail ..................................................................6-21 6-7 Typical Steam Injection System .............................................................................6-22 6-8 Typical ISTR Treatment Process Flow m...............................................................6-24
UFC 3-280-05 31 July 2006
vii
8-1 Modified Monitoring Well ..........................................................................................8-5 9-1 Changes in Isotopic Composition of Groundwater Contaminated with Chlorinated
Organic Compounds Under Three Scenarios ..........................................................9-6 9-2 Well F3, Changes in Groundwater Isotopic Constituents During Thermal Treatment ............................................................................................................... 9-6 9-3 Well Ca6, Changes in Isotopic Constituents in Groundwater During Thermal Treatment ............................................................................................................... 9-7
TABLES Table Title 2-1 Rate of Hydrolysis by Compound and Temperature ................................................2-6 2-2 Thermal Properties of Representative Materials and Fluids ....................................2-8 2-3 Select NAPL Compounds and Steam Co-Distillation Boiling Points ......................2-10 2-4 Generally Recognized Optimum Growth Range for Various Groups of
Microorganisms ......................................................................................................2-20 2-5 Redox Processes that Consume Organic Matter and Reduce Inorganic Compounds
in Groundwater.......................................................................................................2-23 2-6 Nominal Upper Bound Temperatures Achieved for Various ISTR Technologies...2-24 6-1 Groundwater Treatment Technologies...................................................................6-23 6-2 Vapor Treatment Technologies ..............................................................................6-25 6-3 Applicability of Models to Individual Technologies .................................................6-33 6-4 Features of Numerical Modeling codes..................................................................6-34 7-1 Summary of Completed Thermal TCH/ISTD Projects ..............................................7-4 7-2 Summary of Selected ERH Projects ........................................................................7-5 8-1 ISTR Monitoring Summary .....................................................................................8-10
UFC 3-280-05 31 July 2006
1-1
CHAPTER 1
INTRODUCTION 1-1 PURPOSE. This Unified Facilities Criteria (UFC) document provides guid-ance and background for the appropriate screening and selection of in situ thermal remediation (ISTR) technologies, including steam enhanced extraction injection, electrical resistivity heating, and thermal conductive heating. This document is intended to help distinguish proper applications of the technology and identify important design, operational, and monitoring issues relevant to Government oversight personnel. It is intended for use by engineers, geologists, hydrogeologists, soil scientists, chemists, project managers, and others who possess a technical education but only the broadest familiarity with ISTR technologies. 1-2 APPLICABILITY. This manual applies to the Military Departments, the Defense Agencies, and the DoD Field Activities having hazardous, toxic, or radioactive waste responsibilities in accordance with USD(AT&L) Memorandum dated 29 May 2002. 1-3 REFERENCES. This UFC does not present a detailed, comprehensive discussion of each and every factor associated with ISTR systems. Such a presentation would require many volumes. This document does reference additional resources that do provide more detail. A listing of Government publications, books, and journal articles pertaining to ISTR technologies is presented in Appendix A.
Additional, updated references are available on the internet, including the following website maintained by the Corps of Engineers [website to be added upon completion of the UFC]. 1-4 BACKGROUND. A significant number of sites are contaminated with high levels of organic contaminants, including chlorinated solvents, oils and petroleum products, polychlorinated biphenyls, and wood-preserving compounds above and below the water table. These contaminated sites include hundreds of Federal installations and thousands of private facilities. Many of these sites are known or suspected to contain non-aqueous phase liquids (NAPL), either as mobile or residual immiscible fluids. Some of these compounds have low volatility and solubility. These contaminants, especially NAPL below the water table, have been difficult to treat with conventional technologies such as groundwater extraction, bioremediation, and soil vapor extraction. NAPL often represents a very significant long-term (decades to centuries) source of dissolved phase contaminants. More aggressive technologies have been sought that would address these conditions. These aggressive technologies include in situ chemical oxidation, surfactant/solvent flushing, and ISTR methods. The ISTR methods represent the most aggressive and effective of these techniques. 1-4.1 ISTR Methods. There are several mechanisms by which heat can be transferred into the subsurface, including 1) direct conduction of heat away from heaters placed in trenches or wells (thermal conductive heating or TCH), 2) electrical resistivity heating (ERH) of the subsurface by passing electrical currents through the soil, and 3)

UFC 3-280-05 31 July 2006
1-2
steam injection or steam enhanced extraction (SEE). These methods are addressed in this UFC. These techniques are typically applied in conjunction with vapor extraction, and steam injection is typically paired with both vapor and liquid recovery. The three ISTR methods can be used independently or in combination to treat both in the vadose zone and below the water table. Further descriptions of the technologies are provided in Chapter 2. These techniques have been used in full-scale applications and are cov-ered under a variety of patents, some held by Federal agencies, as described in Chapter 10. Vendors of the technologies typically operate under a license from the patent holders. 1-4.1.1 This UFC does not address the use of electrical heating for soil melting, also referred to as in situ vitrification (ISV), the use of steam injection accompanied by the use of soil augers, or radio frequency (RF) heating. ISV involves the total melting of contaminated soil, with concomitant destruction of the organic contaminants or containment of inorganic contaminant in the vitrified mass. Heating for ISV is accomplished using electrical currents passing between electrodes through the conductive melt. A conductive "starter frit" is placed between the electrodes to initiate the melting. ISV is a patented technology that was originally developed as a means to isolate radioactive isotopes for geologically long periods.
1-4.1.2 At least one vendor injects steam into the subsurface via large rotating augers drilled into the target treatment volume. The soil disruption caused by the augers results in good contact between the steam and the contaminated soil. The augers are moved around the site to ultimately treat the entire volume.
1-4.1.3 RF heating involves propagation of radio frequency energy into the soil from source transmitters and results in the heating of the soil. The use of radio frequency heating of soil was initially tested at the bench-scale level in the mid-1980s* and a well-documented field application was conducted in 1989 at Volk National Guard Base†. 1-4.2 Brief History of ISTR. The origins of several of the ISTR technologies can be traced back to the oil industry. Steam injection to enhance recovery of high-gravity oils has been used for several decades.‡ The use of steam injection to remediate contaminated soil and groundwater, however, was developed in the 1980s in the Netherlands§, and in the United States.** ERH, as with other thermal technologies, has its origins in the petroleum industry, where it was developed to heat oil sands and oil shales to enhance oil recovery. ERH was developed in its six-phase configuration by Battelle Memorial Institute for the U.S. Department of Energy at the Pacific Northwest
* Dev, H. Radio Frequency Enhanced In Situ Decontamination of Soils Contaminated with Halogenated Hydrocarbons. In Land Disposal, Remedial Action, Incineration and Treatment of Hazardous Waste. Proceedings of the Twelfth Annual Research Symposium, EPA/600/9-86/022, pp. 402-412 , April 1986. † USEPA. Analysis of Selected Enhancements for Soil Vapor Extraction. EPA/542/R-97/007, Sept. 1997. ‡ Ramey Jr., H.J. “A Current Review of Oil Recovery By Steam Injection,” Proceedings, Seventh World Petroleum Congress. 3, 471-476, 1966. § Hilberts, B. “In-situ steam stripping”. In Proceedings of the First International TNO Conference on Contaminated Soil, pp.680-686, Assink and van den Brink, Mortin Nuhoff, Dordrecht, N.L., Eds., 1986. ** Udell, K.S., and L.D. Stewart, Jr. Field Study of In Situ Steam Injection and Vacuum Extraction for Recovery of Volatile Organic Solvents. Department of Mechanical Engineering, University of California, June, 1989.
UFC 3-280-05 31 July 2006
1-3
National Laboratory over a period from 1988 to 1992 (Hadim et al., 1993). It was field tested and demonstrated at the Hanford Nuclear Reservation and Savannah River facility in 1993 and the first removal of DNAPL was demonstrated at Dover Air Force Base in 1996. The technology was first commercially applied in Illinois in 1996. The use of radio frequency heating of soil was initially tested at the bench-scale in the mid-1980s* and a well-documented field application was conducted in 1989 at Volk Air National Guard Base.† The use of thermal conductive heating for remediation was pioneered by a division of Shell Oil in 1989‡ based on experience gathered in enhanced oil recovery. More recently, well publicized successes with ISTR technologies such as those at the Savannah River Site, SC, and the Visalia Poleyard site in Visalia, CA, have prompted the remediation industry to look closer at ISTR. There are have been a substantial number of both pilot- and full-scale applications of ISTR technologies conducted to date and the number of ISTR sites continues to increase. Appendix C contains information about some of these projects. 1-4.3 Appropriateness of Aggressive Source Removal. The use of the ISTR methods may represent a significant expenditure. The benefits of this scope of investment have been debated in the remediation community over the past several years, with much of the discussion centered on the ability of the ISTR methods to achieve adequate "source" removal to reach strict remediation objectives. Some segments of the remediation community advocate source containment, while others promote the removal of the accessible mass.§ The benefits of the application of ISTR and other aggressive source removal technologies are still being evaluated. This philosophical issue of the appropriateness of source removal will not be debated in this UFC; rather, the focus will be on the technical issues surrounding the application of the ISTR technologies. 1-4.4 Advantages of ISTR. Techniques that rely solely on the flow of liquids to deliver reagents or to remove dissolved contaminants are dependent on (amongst other factors) the permeability distribution in or around the contaminated volume. Permeability may vary over many orders of magnitude in natural geological material. As a result, liquid diffusion into and out of zones of low permeability often limits our ability to deliver reagents and remove contaminant mass. The effectiveness of heat in the removal of contaminant mass depends, in part, on the conduction of heat as governed by the thermal conductivity distribution and the thermal gradient. In most earth materials, thermal conductivities range over less than one order of magnitude. The relatively small range of thermal conductivities allows much more uniform heating and treatment within a contaminated zone when compared to delivery of reagents. As heat is transmitted into the contaminated materials, various processes occur to enhance the removal of contaminants. The vapor pressure of organic materials increases, viscosity of separate-phase liquids decreases, diffusion rates and solubility often increase, and rates of abiotic degradation (e.g., oxidation) may increase. Even biological degradation has been observed to increase at higher temperatures, up to a point where microbial
* Dev, 1986. † USEPA, 1997 ‡ Stegemeier, G.L., and H.J. Vinegar. “Soil Remediation By Surface Heating And Vacuum Extraction.” Proceedings, 1995 SPE/EPA Exploration & Production Environmental Conference. Houston, Texas, March 27-29, 1995. § ITRC. Regulatory Overview: DNAPL Source Reduction: Facing the Challenge. April 2002.
UFC 3-280-05 31 July 2006
1-4
dormancy (or, at temperatures well above 100oC, sterilization) occurs. The removal of contaminants using heat can, therefore, be more complete than is possible with other techniques. Unfortunately, the conduction of heat in earth materials is relatively slow as these materials are generally good insulators. Efficient in situ thermal treatment depends on the economical and effective delivery of heat into the subsurface. 1-4.5 Limitations of ISTR. The ISTR methods discussed in this UFC will not remediate inorganic contaminants (with the probable exception of volatile metals such as mercury). Some of the ISTR methods may not be appropriate for remediation of very low volatility organics, such as pesticides, some PAHs, dioxins, and PCBs. Site conditions that may not be conducive to ISTR include high groundwater fluxes, buried ordnance or explosive containers, or presence of critical subsurface facilities or utilities. Chapter 2 discusses these limitations further. Where the size of the treatment volume is large, the cost of ISTR may also be considered a "limitation," depending on financial resources. 1-5 SCOPE
1-5.1 General Content. This UFC provides guidance on the appropriate use of the ISTR technologies and information necessary for Government staff to properly plan and oversee the implementation of ISTR at a site. The UFC describes the guiding principles and thought processes for ISTR, as the numerous site-specific conditions that come into play in any given ISTR situation preclude a simple cookbook approach. Specifically, the UFC describes the technologies and the fundamental science and engineering behind them. This UFC does not provide detailed guidance on the design of ISTR systems, nor does it provide detailed information regarding treatment of associated waste streams, such as vapor-phase or wastewater treatment. The data necessary to decide whether or not ISTR is appropriate, both from site characterization and bench/pilot-testing, are described, as are the data necessary to monitor performance of ISTR. Guidance on screening the potential applicability of the technologies, based on site conditions, is provided. Considerations for review of ISTR designs are presented, as are the tools for modeling ISTR performance. Major construction and operations and maintenance (O&M) activities are discussed. The UFC also identifies issues related to the implementation of the technologies, such as regulatory considerations, contracting, safety, cost and performance, and patent/licensing. Applications of the technologies are summarized where the specific information is available. A flow chart is provided as a tool for technology selection. The reader is cautioned that he or she should contact vendors of the various technologies as part of the selection process to ensure that the most up to date information forms the basis of the selection. 1-5.2 Other Information Sources. This UFC was prepared to meet the needs of not only the USACE, but also other Federal and state agencies. The document was prepared with assistance from representatives of US EPA, the Navy, the Interstate Technology Regulatory Council, and the private sector. The electronic version of this document includes links to various documents and resources from these agencies, organizations, and other sources. A linked subject index is also provided.
UFC 3-280-05 31 July 2006
1-5
1-6 ORGANIZATION 1-6.1 General Organization Philosophy. The UFC is intended to assist a project team considering or overseeing an ISTR project. Material is organized sequentially, so that the reader can conveniently begin using it at any stage of an ISTR project. Where appropriate, such as in discussing design considerations, all aspects of a specific ISTR technology are discussed together. It is recommended that regardless of the stage of a project, Chapter 4 on technology selection be reviewed first if there is any question as to whether selection of ISTR at a given site is appropriate. 1-6.2 Sequence of Presentation. The UFC begins with this introduction. Chapter 2 describes fundamental processes and concepts of ISTR performance. Chapter 3 identifies site characterization data needs for ISTR technology screening, selection and design. Chapter 4 lays out an approach to screening the applicability of ISTR to a specific site. Chapter 5 describes current bench and pilot testing activities that may be appropriate for design of full-scale systems. Chapter 6 identifies key considerations in the design of ISTR systems so that Government staff can adequately oversee the design process and provide input as appropriate to better achieve agency objectives. Example checklists are provided in Appendix C. Alternatives for waste-stream treatment are briefly described. Information on modeling the performance of ISTR is also provided in Chapter 6. Chapter 7 summarizes the available cost and performance data for a number of ISTR applications. Appendix B provides more detailed information on the cost and performance for these sites. Chapter 8 describes the monitoring requirements and approaches, as well as operation and maintenance needs for ISTR systems. Chapter 9 presents approaches for assessing the attainment of remedial objectives for ISTR systems. Chapter 10 discusses regulatory issues that affect ISTR implementation and closure, contracting approaches for ISTR, safety issues, known patents for ISTR technologies, and community acceptance issues. A list of references is provided as Appendix A. A Glossary and list of acronyms is also provided.
CHAPTER 2
UNDERLYING PHYSICAL PRINCIPLES AND TECHNOLOGY DESCRIPTIONS
2-1 FUNDAMENTAL PRINCIPLES. Organic chemicals released to the subsurface may exist in as many as four phases: the solid soil matrix, the gas phase, the aqueous phase, and a NAPL phase. Application of heat to the subsurface can mobilize NAPL phase contaminants from the soil matrix, allowing them to be removed in the fluid phases via groundwater recovery wells or vapor collection systems. This section presents a general overview of the processes of multiphase flow and multi-component mass transfer in the subsurface, and the manner in which elevated temperatures can enhance those processes for removal of contaminants. 2-1.1 Chemical Principles. Presented in the following sections are chemical, thermal, hydrogeological, and biological concepts to provide a basis of understanding of the changes that take place under ISTR.

UFC 3-280-05 31 July 2006
2- 2
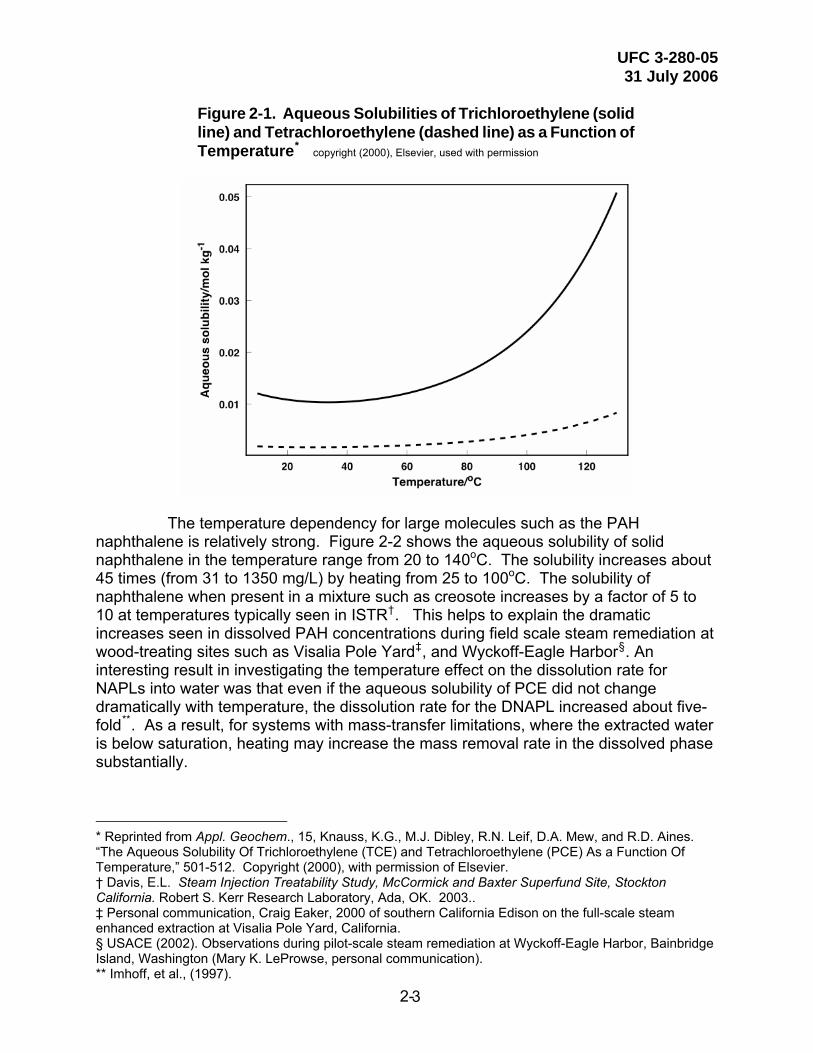
2-1.1.1 Aqueous Solubility. For hydrocarbons, data on solubility at the temperatures used during ISTR are scarce. The aqueous solubilities of TCE and PCE as functions of temperature are presented in Figure 2-1. While the solubilities of the two compounds depicted increase exponentially with temperature, they do so only at temperatures above the conventional boiling point of water. A local solubility minimum around 30 to 50ºC has been observed in experimental studies for both TCE and PCE.* † ‡ §
* Imhoff, P.T., A. Frizzel, and C.T. Miller. “Evaluation of thermal effects on the dissolution of a nonaqueous phase liquid in porous media.” Environmental Science and Technology, 31(6), 1615-1622, 1997. † Knauss, K.G., M.J. Dibley, R.N. Leif, D.A. Mew, and R.D. Aines. “The Aqueous Solubility Of Trichloroethylene (TCE) and Tetrachloroethylene (PCE) As a Function Of Temperature.” Appl. Geochem., 15, 2000: 501-512. ‡ Heron, G., T.H. Christensen, and C.G. Enfield. “Henry's Law Constant for Trichloroethylene between 10 and 95oC.” Environmental Science and Technology, 32 (10), 1433-1437, 1998a. § Heron, G., T.H. Christensen, T. Heron, and T. Larsen. “Thermally Enhanced Remediation at DNAPL Sites: The Competition Between Downward Mobilization and Upward Volatilization.” Proceedings of the First International Conference on Remediation of Chlorinated and Recalcitrant Compounds, Battelle Press, Columbus, Ohio. 193-198, 1998b.
UFC 3-280-05 31 July 2006
2- 3
Figure 2-1. Aqueous Solubilities of Trichloroethylene (solid line) and Tetrachloroethylene (dashed line) as a Function of Temperature* copyright (2000), Elsevier, used with permission
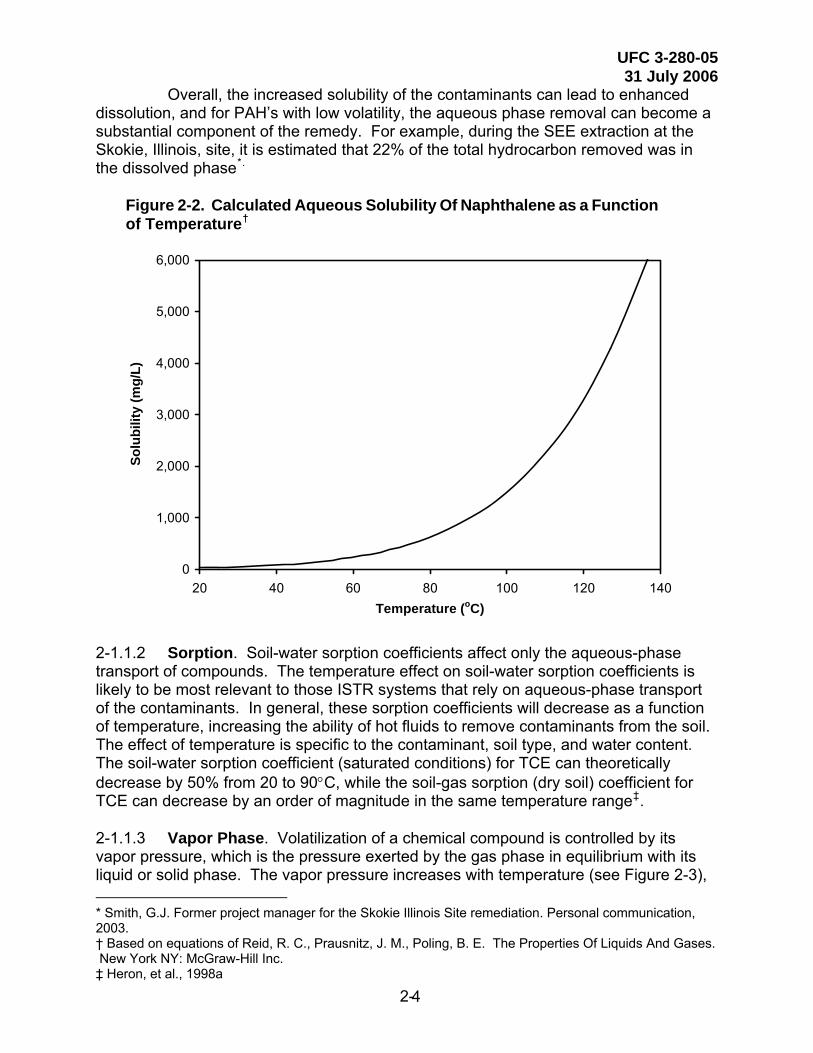
The temperature dependency for large molecules such as the PAH naphthalene is relatively strong. Figure 2-2 shows the aqueous solubility of solid naphthalene in the temperature range from 20 to 140oC. The solubility increases about 45 times (from 31 to 1350 mg/L) by heating from 25 to 100oC. The solubility of naphthalene when present in a mixture such as creosote increases by a factor of 5 to 10 at temperatures typically seen in ISTR†. This helps to explain the dramatic increases seen in dissolved PAH concentrations during field scale steam remediation at wood-treating sites such as Visalia Pole Yard‡, and Wyckoff-Eagle Harbor§. An interesting result in investigating the temperature effect on the dissolution rate for NAPLs into water was that even if the aqueous solubility of PCE did not change dramatically with temperature, the dissolution rate for the DNAPL increased about five-fold**. As a result, for systems with mass-transfer limitations, where the extracted water is below saturation, heating may increase the mass removal rate in the dissolved phase substantially.
* Reprinted from Appl. Geochem., 15, Knauss, K.G., M.J. Dibley, R.N. Leif, D.A. Mew, and R.D. Aines. “The Aqueous Solubility Of Trichloroethylene (TCE) and Tetrachloroethylene (PCE) As a Function Of Temperature,” 501-512. Copyright (2000), with permission of Elsevier. † Davis, E.L. Steam Injection Treatability Study, McCormick and Baxter Superfund Site, Stockton California. Robert S. Kerr Research Laboratory, Ada, OK. 2003.. ‡ Personal communication, Craig Eaker, 2000 of southern California Edison on the full-scale steam enhanced extraction at Visalia Pole Yard, California. § USACE (2002). Observations during pilot-scale steam remediation at Wyckoff-Eagle Harbor, Bainbridge Island, Washington (Mary K. LeProwse, personal communication). ** Imhoff, et al., (1997).
UFC 3-280-05 31 July 2006
2- 4
Overall, the increased solubility of the contaminants can lead to enhanced dissolution, and for PAH’s with low volatility, the aqueous phase removal can become a substantial component of the remedy. For example, during the SEE extraction at the Skokie, Illinois, site, it is estimated that 22% of the total hydrocarbon removed was in the dissolved phase*.
Figure 2-2. Calculated Aqueous Solubility Of Naphthalene as a Function of Temperature†
0
1,000
2,000
3,000
4,000
5,000
6,000
20 40 60 80 100 120 140Temperature (oC)
Solu
bilit
y (m
g/L)
2-1.1.2 Sorption. Soil-water sorption coefficients affect only the aqueous-phase transport of compounds. The temperature effect on soil-water sorption coefficients is likely to be most relevant to those ISTR systems that rely on aqueous-phase transport of the contaminants. In general, these sorption coefficients will decrease as a function of temperature, increasing the ability of hot fluids to remove contaminants from the soil. The effect of temperature is specific to the contaminant, soil type, and water content. The soil-water sorption coefficient (saturated conditions) for TCE can theoretically decrease by 50% from 20 to 90°C, while the soil-gas sorption (dry soil) coefficient for TCE can decrease by an order of magnitude in the same temperature range‡. 2-1.1.3 Vapor Phase. Volatilization of a chemical compound is controlled by its vapor pressure, which is the pressure exerted by the gas phase in equilibrium with its liquid or solid phase. The vapor pressure increases with temperature (see Figure 2-3), * Smith, G.J. Former project manager for the Skokie Illinois Site remediation. Personal communication, 2003. † Based on equations of Reid, R. C., Prausnitz, J. M., Poling, B. E. The Properties Of Liquids And Gases. New York NY: McGraw-Hill Inc. ‡ Heron, et al., 1998a

UFC 3-280-05 31 July 2006
2- 5
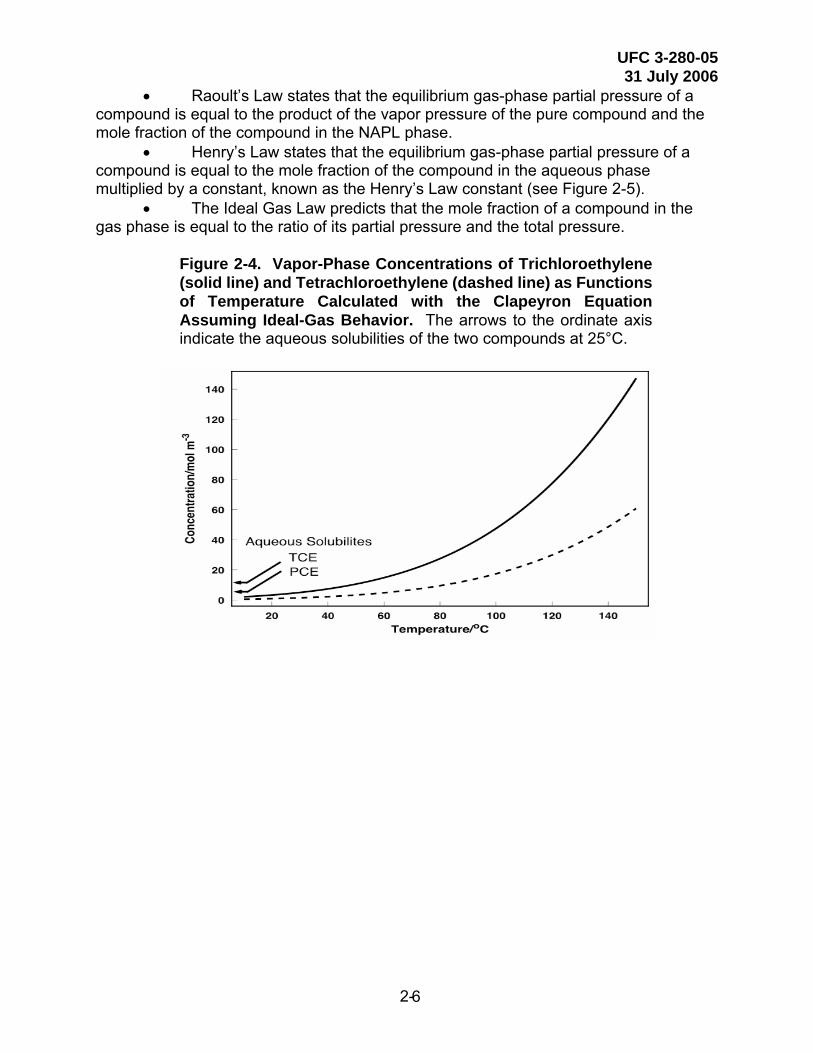
and boiling occurs when the vapor pressure exceeds atmospheric pressure. Evaporation or vaporization by steam distillation may occur below the pure-component boiling point. Because the gas-phase concentration of a hydrocarbon compound strongly depends on its vapor pressure, a temperature increase will improve mass transport by increasing the concentration in the vapor phase, even if the temperature is below the boiling point. Figure 2-3 shows the vapor pressure of several compounds as a function of temperature. Figure 2-4 presents the predicted vapor-phase volumetric concentration of TCE and PCE as a function of temperature; the volumetric aqueous solubilities at room temperature are noted.
Figure 2-3. Vapor Pressure of Selected Compounds vs. Temperature Note that atmospheric pressure is 760 mm Hg.* (copyright, 2001, CRC Press, Used with permission)
1.E-07
1.E-06
1.E-05
1.E-04
1.E-03
1.E-02
1.E-01
1.E+00
1.E+01
1.E+02
1.E+03
1.3 1.5 1.7 1.9 2.1 2.3 2.5 2.7 2.9 3.1 3.3 3.5 3.7 3.91000/T [ 1000 / deg K ]
PRES
SUR
E (m
m H
g)
PCB 1242
TCDD Dioxin
PCB 1260
Water
Mercury
BenzeneTCE
Naphthalene
PCE
n-C16H34
n-C29H60
PCP
As
n-C10H22
Dieldrin
Pb Zn
TELB(a)Pyrene
CdCl2
As2O3
Sb
SbCl3
400 300 200 T oC 100 25 0760 mm
2-1.1.4 Gas Mixtures. Four fundamental laws of thermodynamics describe the composition of a gas mixture:
• Dalton’s Law states that the pressure exerted by a mixture of gases is the sum of the pressures that could be exerted by each individual gas occupying the same volume alone. The pressure that could be exerted by an individual gas is referred to as the partial pressure.
* Stegemeier, G.L. and H.J. Vinegar. “Thermal Conduction Heating For In Situ Desorption of Soils.” Hazardous & Radioactive Waste Treatment Technologies Handbook. Boca Raton, FL: CRC Press, 2001.
UFC 3-280-05 31 July 2006
2- 6
• Raoult’s Law states that the equilibrium gas-phase partial pressure of a compound is equal to the product of the vapor pressure of the pure compound and the mole fraction of the compound in the NAPL phase.
• Henry’s Law states that the equilibrium gas-phase partial pressure of a compound is equal to the mole fraction of the compound in the aqueous phase multiplied by a constant, known as the Henry’s Law constant (see Figure 2-5).
• The Ideal Gas Law predicts that the mole fraction of a compound in the gas phase is equal to the ratio of its partial pressure and the total pressure.
Figure 2-4. Vapor-Phase Concentrations of Trichloroethylene (solid line) and Tetrachloroethylene (dashed line) as Functions of Temperature Calculated with the Clapeyron Equation Assuming Ideal-Gas Behavior. The arrows to the ordinate axis indicate the aqueous solubilities of the two compounds at 25°C.

UFC 3-280-05 31 July 2006
2- 7
Figure 2-5. Henry’s Law Constants vs. Temperature for Various Compounds*
1.E+03
1.E+04
1.E+05
1.E+06
1.E+07
0 50 100 150 200 250 300 350 400
Temperature (deg C)
Hen
ry's
Law
con
stan
t (m
m H
g)
BenzeneTCEXyleneNapthaleneBenzo(k)flouranthenePhenanthrene
Based on these four principles, the concentrations of hydrocarbon contaminants in vapor extracted from a thermal treatment zone will increase with temperature. Further, the relative proportion of each component in the vapor phase is dependent on its volatility (vapor pressure) and its concentration in the liquid phase. 2-1.1.5 Hydrolysis, Pyrolysis, and Oxidation. Hydrolysis is a process by which compounds decompose into simpler compounds while dissolving in, or reacting with, water. If oxygen or naturally occurring oxides are present in the soil, contaminants can also be altered or decomposed by oxidation. The potential for both hydrolysis and oxidation increases at with increasing temperatures. In addition, organic contaminants are subject to pyrolysis, or high-temperature decomposition with or without the presence of water or oxygen. These processes are often undifferentiated during ISTR, owing to the conditions and byproducts they have in common. Contaminant destruction under steam and liquid water conditions often relies on recharge of oxygenated groundwater to the treatment zone, and may be referred to as hydrous pyrolysis and oxidation. Thermal destruction at these temperatures is slow but significant, and has accounted for as much as 17% of the apparent contaminant destruction during steam injection treatment of creosote-contaminated soil (Subsurface Contaminants Focus Area, 2000). The rate of hydrolysis varies by compound and with temperature as shown in Table 2-1.
* EPA. Process Design Manual for Stripping of Organics, 600/2/84/139, 1984.

UFC 3-280-05 31 July 2006
2- 8
Table 2-1. Rate of Hydrolysis by Compound and Temperature* † ‡ §
Half-life (days) Half-life
at 25°CActivation
Energy Temperature (°C) Compound (years) (kJ/mol)
Hydrolysis Product 80 100 120
chloroform 1850 123 mineralizes 294 31 4 carbon tetrachloride 41 115 mineralizes 11 1.3 0.2
1,1-DCA 61 110 vinyl chloride 22 3 0.5 1,1-DCE 1.2×10⁸ 130 insignificant 1×10⁷ 1×10⁶ 1×10⁵
1,2-DCE 2.1×10¹⁰ 130 insignificant 2×10⁹ 2×10⁸ 2×10⁷
1,1,2-TCA 139 121 DCE 25 3 0.4 1,1,1-TCA 1.1 116 mineralizes or 1,1-DCE 0.3 0.03 0.005
TCE 1.3×10⁶ 127 insignificant 2×10⁵ 2×10⁴ 1960 1,1,2,2
tetrachloroethane 0.4 92 TCE 0.4 0.1 0.02 1,1,1,2
tetrachloroethane 47 95 TCE 44 8 1.6 PCE 9.9×10⁸ 123 insignificant 2×10⁸ 2×10⁷ 2×10⁶
EDB (ethylene dibromide) 2.5 92 mineralizes 3 0.5 0.1
methylene chloride 1.6 119 mineralizes 0.3 0.04 0.01 1,2-DCA 5.9 104 ethylene glycol 3 0.5 0.1
As can be seen from Table 2-1, the hydrolysis rates for halogenated alkenes (e.g., TCE and PCE) tend to be very slow, even at steam temperatures. However, the hydrolysis rates for halogenated alkanes (e.g., TCA and carbon tetrachloride) tend to be very fast. These compounds tend to be destroyed as quickly as they dissolve. 2-1.2 Thermal Principles 2-1.2.1 Heat Transport (Conduction, Advection and Convection). Energy transport in the subsurface is attributable to heat conduction in the porous matrix as well as heat transport by fluid motion. In the absence of fluid movement, energy flow by conduction only is described by the relationship:
q”x = –k(dT/dx) (2-2) Where: q”x = heat energy flux in the x direction (W•m–2) k = thermal conductivity (W•m–1• K–1) dT/dx = temperature gradient in the x direction (K•m–1).
* Jeffers, P.M., L.M. Ward, L.M. Woytowitch, and N.L. Wolfe “Homogeneous Hydrolysis Rate Constants for Selected Chlorinated Methanes, Ethanes, Ethenes, and Propanes.” Environmental Science Technology, Volume 23, No. 8, pp 965-969, 1989. † Weintraub, R.A., G.W. Jex, and H.A. Moye (1986) “Chemical and Microbial Degradation of 1,2-Dibromoethane (EDB) in Florida Ground Water, Soil, and Sludge.” American Chemical Society 0097-6156/86/0315-0294$06.00/0 ‡ ETC8. Data obtained from world wide web, with the source identified as ETC8 (1993). § Barbash, J.E. and M. Reinhard. “Abiotic Dehalogenation of 1,2-dichloroethane and 1,2-dibromoethane in Aqueous Solutions Containing Hydrogen Sulfide.” Environmental Science and Technology, Volume 23, 1989, pp 1349-1358, 1989.

UFC 3-280-05 31 July 2006
2- 9
The terms “convection” and “advection” are often used interchangeably to describe energy transport due to movement of heated fluids. Convection actually includes heat diffusion as well as advection; however heat transport by fluid diffusion tends to be minor compared to advection and conduction. In general, heat convection is the most effective transport mechanism in materials with moderate to high permeability, such as sand and gravel, while conduction is the dominant process in materials with lower permeability such as silt and clay (Figure 2-6). 2-1.2.2 Thermal Conductivity and Thermal Diffusivity. Thermal conductivity is a measure of the ability of a material to conduct heat. Thermal diffusivity is a measure of material’s ability to conduct heat relative to its ability to store heat (i.e., thermal conductivity divided by heat capacity; see next section). Heat can migrate relatively quickly through a material with high thermal conductivity, while heat flow into a material with high thermal diffusivity will result in a relatively rapid temperature increase. Typical values of thermal conductivity are shown in Table 2-2.
Figure 2-6. Conductive Heating of 1-, 2-, and 3-m-Thick Impermeable Layers from Both Sides. Steam temperature above and below the layer is 120°C, ambient temperature = 10°C, soil diffusivity is 5.82 ×10⁻⁷ m2/s.
10
20
30
40
50
60
70
80
90
100
110
120
0 10 20 30 40 50 60
Time (days)
Tem
pera
ture
(deg
C)
1 m thick
2 m thick
3 m thick
UFC 3-280-05 31 July 2006
2- 10
Table 2-2. Thermal Properties of Representative Materials and Fluids* † ‡
Thermal conductivity Heat capacity Diffusivity Density
Material (W/m K) (KJ/m3 K) (m2/s) (g/cm3)
Quartz1 8.79 2008 4.38×10⁻⁶ 2.66 Clay minerals1 2.93 2008 1.46×10⁻⁶ 2.65 Organic matter1 0.25 2510 9.96×10⁻⁸ 1.30
Silty sand (dry)2 1.23 1906 9.76×10⁻⁷ 1.52 Silty sand (wet)2 1.41 4359 5.82×10⁻⁷ 1.80 Silt (dry)2 0.96 1078 1.29×10⁻⁶ 1.44 Silt (wet)2 1.26 5030 4.77×10⁻⁷ 1.90 Water1 0.57 4184 1.36×10⁻⁷ 1.00 Air1 0.0218 1.3 1.68×10⁻⁵ 0.0013 Engine oil3 0.15 1669 7.71×10⁻⁸ 0.89
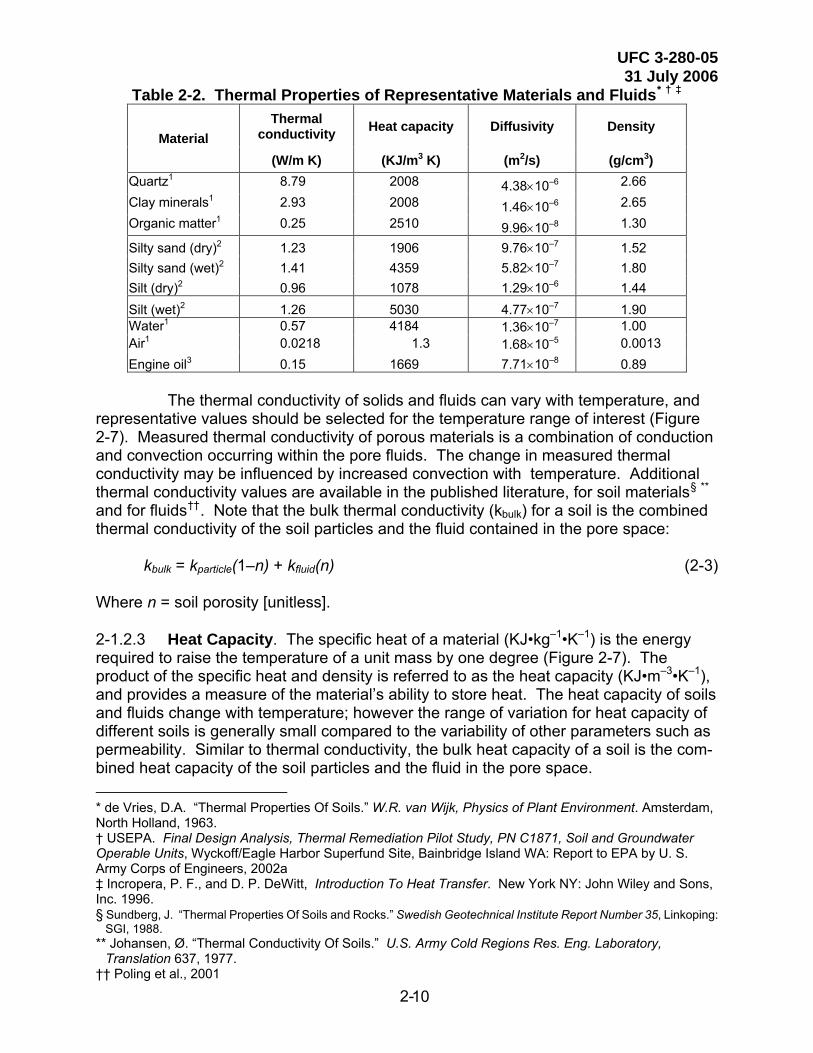
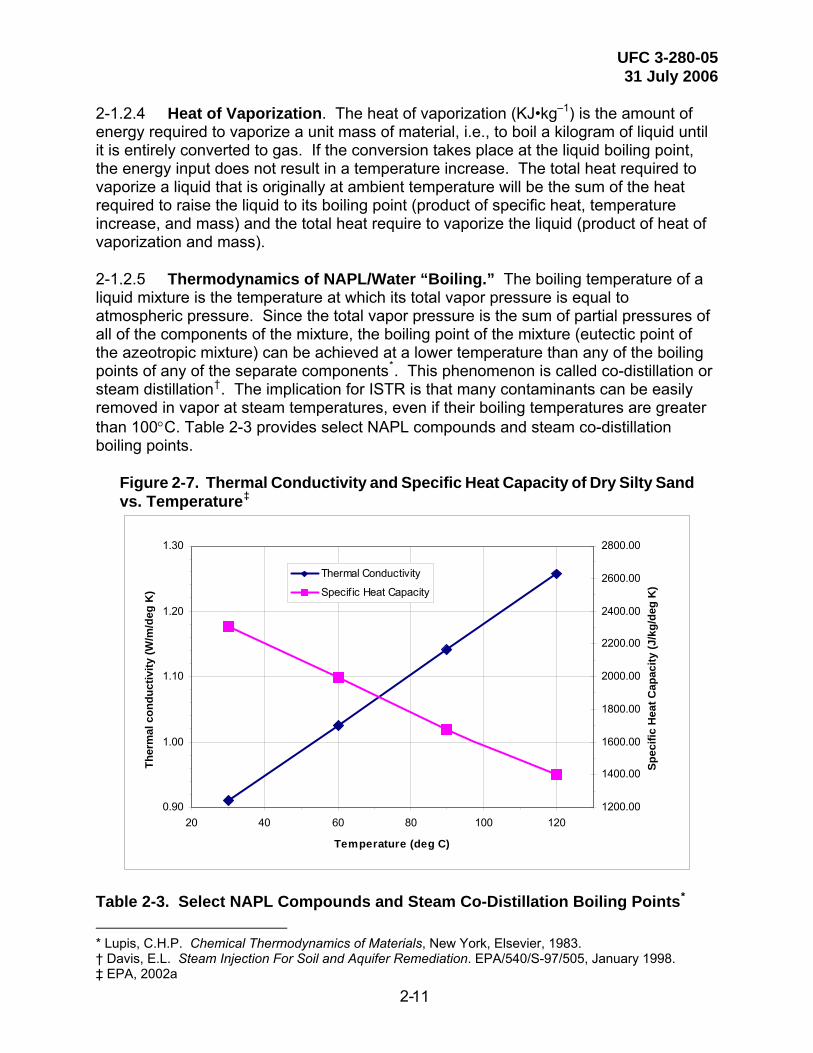
The thermal conductivity of solids and fluids can vary with temperature, and representative values should be selected for the temperature range of interest (Figure 2-7). Measured thermal conductivity of porous materials is a combination of conduction and convection occurring within the pore fluids. The change in measured thermal conductivity may be influenced by increased convection with temperature. Additional thermal conductivity values are available in the published literature, for soil materials§ ** and for fluids††. Note that the bulk thermal conductivity (kbulk) for a soil is the combined thermal conductivity of the soil particles and the fluid contained in the pore space:
kbulk = kparticle(1–n) + kfluid(n) (2-3) Where n = soil porosity [unitless]. 2-1.2.3 Heat Capacity. The specific heat of a material (KJ•kg–1•K–1) is the energy required to raise the temperature of a unit mass by one degree (Figure 2-7). The product of the specific heat and density is referred to as the heat capacity (KJ•m–3•K–1), and provides a measure of the material’s ability to store heat. The heat capacity of soils and fluids change with temperature; however the range of variation for heat capacity of different soils is generally small compared to the variability of other parameters such as permeability. Similar to thermal conductivity, the bulk heat capacity of a soil is the com-bined heat capacity of the soil particles and the fluid in the pore space. * de Vries, D.A. “Thermal Properties Of Soils.” W.R. van Wijk, Physics of Plant Environment. Amsterdam, North Holland, 1963. † USEPA. Final Design Analysis, Thermal Remediation Pilot Study, PN C1871, Soil and Groundwater Operable Units, Wyckoff/Eagle Harbor Superfund Site, Bainbridge Island WA: Report to EPA by U. S. Army Corps of Engineers, 2002a ‡ Incropera, P. F., and D. P. DeWitt, Introduction To Heat Transfer. New York NY: John Wiley and Sons, Inc. 1996. § Sundberg, J. “Thermal Properties Of Soils and Rocks.” Swedish Geotechnical Institute Report Number 35, Linkoping:
SGI, 1988. ** Johansen, Ø. “Thermal Conductivity Of Soils.” U.S. Army Cold Regions Res. Eng. Laboratory,
Translation 637, 1977. †† Poling et al., 2001
UFC 3-280-05 31 July 2006
2- 11
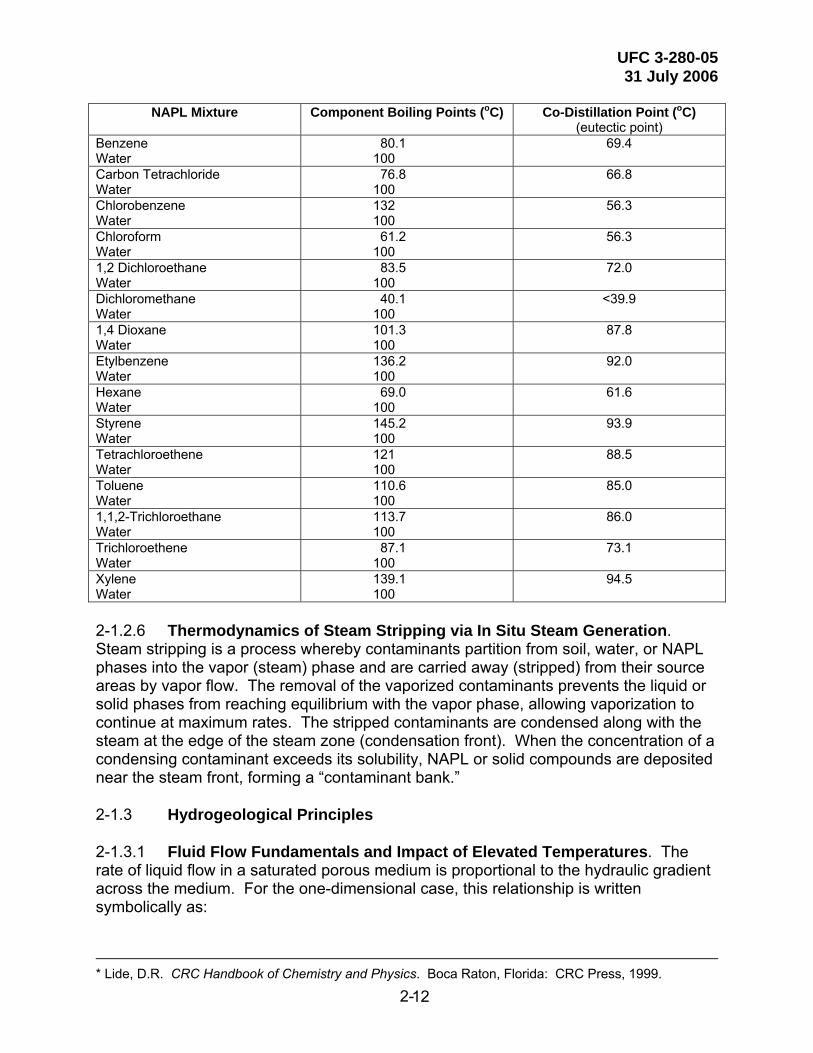
2-1.2.4 Heat of Vaporization. The heat of vaporization (KJ•kg–1) is the amount of energy required to vaporize a unit mass of material, i.e., to boil a kilogram of liquid until it is entirely converted to gas. If the conversion takes place at the liquid boiling point, the energy input does not result in a temperature increase. The total heat required to vaporize a liquid that is originally at ambient temperature will be the sum of the heat required to raise the liquid to its boiling point (product of specific heat, temperature increase, and mass) and the total heat require to vaporize the liquid (product of heat of vaporization and mass). 2-1.2.5 Thermodynamics of NAPL/Water “Boiling.” The boiling temperature of a liquid mixture is the temperature at which its total vapor pressure is equal to atmospheric pressure. Since the total vapor pressure is the sum of partial pressures of all of the components of the mixture, the boiling point of the mixture (eutectic point of the azeotropic mixture) can be achieved at a lower temperature than any of the boiling points of any of the separate components*. This phenomenon is called co-distillation or steam distillation†. The implication for ISTR is that many contaminants can be easily removed in vapor at steam temperatures, even if their boiling temperatures are greater than 100°C. Table 2-3 provides select NAPL compounds and steam co-distillation boiling points.
Figure 2-7. Thermal Conductivity and Specific Heat Capacity of Dry Silty Sand vs. Temperature‡
0.90
1.00
1.10
1.20
1.30
20 40 60 80 100 120
Temperature (deg C)
Ther
mal
con
duct
ivity
(W/m
/deg
K)
1200.00
1400.00
1600.00
1800.00
2000.00
2200.00
2400.00
2600.00
2800.00
Spec
ific
Hea
t Cap
acity
(J/k
g/de
g K
)
Thermal Conductivity
Specif ic Heat Capacity
Table 2-3. Select NAPL Compounds and Steam Co-Distillation Boiling Points*
* Lupis, C.H.P. Chemical Thermodynamics of Materials, New York, Elsevier, 1983. † Davis, E.L. Steam Injection For Soil and Aquifer Remediation. EPA/540/S-97/505, January 1998. ‡ EPA, 2002a
UFC 3-280-05 31 July 2006
2- 12
NAPL Mixture Component Boiling Points (oC) Co-Distillation Point (oC)
(eutectic point) Benzene Water
80.1 100
69.4
Carbon Tetrachloride Water
76.8 100
66.8
Chlorobenzene Water
132 100
56.3
Chloroform Water
61.2 100
56.3
1,2 Dichloroethane Water
83.5 100
72.0
Dichloromethane Water
40.1 100
<39.9
1,4 Dioxane Water
101.3 100
87.8
Etylbenzene Water
136.2 100
92.0
Hexane Water
69.0 100
61.6
Styrene Water
145.2 100
93.9
Tetrachloroethene Water
121 100
88.5
Toluene Water
110.6 100
85.0
1,1,2-Trichloroethane Water
113.7 100
86.0
Trichloroethene Water
87.1 100
73.1
Xylene Water
139.1 100
94.5
2-1.2.6 Thermodynamics of Steam Stripping via In Situ Steam Generation. Steam stripping is a process whereby contaminants partition from soil, water, or NAPL phases into the vapor (steam) phase and are carried away (stripped) from their source areas by vapor flow. The removal of the vaporized contaminants prevents the liquid or solid phases from reaching equilibrium with the vapor phase, allowing vaporization to continue at maximum rates. The stripped contaminants are condensed along with the steam at the edge of the steam zone (condensation front). When the concentration of a condensing contaminant exceeds its solubility, NAPL or solid compounds are deposited near the steam front, forming a “contaminant bank.” 2-1.3 Hydrogeological Principles 2-1.3.1 Fluid Flow Fundamentals and Impact of Elevated Temperatures. The rate of liquid flow in a saturated porous medium is proportional to the hydraulic gradient across the medium. For the one-dimensional case, this relationship is written symbolically as:
* Lide, D.R. CRC Handbook of Chemistry and Physics. Boca Raton, Florida: CRC Press, 1999.
UFC 3-280-05 31 July 2006
2- 13
Q/A = –K(dh/dL) (2-4) Where: Q/A = volumetric flow rate of water per unit of surface area [L•T–1] K = hydraulic conductivity [L•T–1] dh/dl = hydraulic gradient [L•L–1]. Darcy’s Law is obeyed for liquid flow in fully saturated soils; however, the hydraulic gradient in partially saturated soil is affected by capillary pressure. Darcy’s Law can also be used to describe gas flow in soils; however, adjustments must be made for pressure-induced fluid-density changes. 2-1.3.1.1 Hydraulic Conductivity. Hydraulic conductivity in liquid-saturated porous media is dependent on liquid density, liquid viscosity, and soil characteristics including grain size*; that is, hydraulic conductivity (K) is separable into distinct contributions due to the fluid properties and porous media permeability:
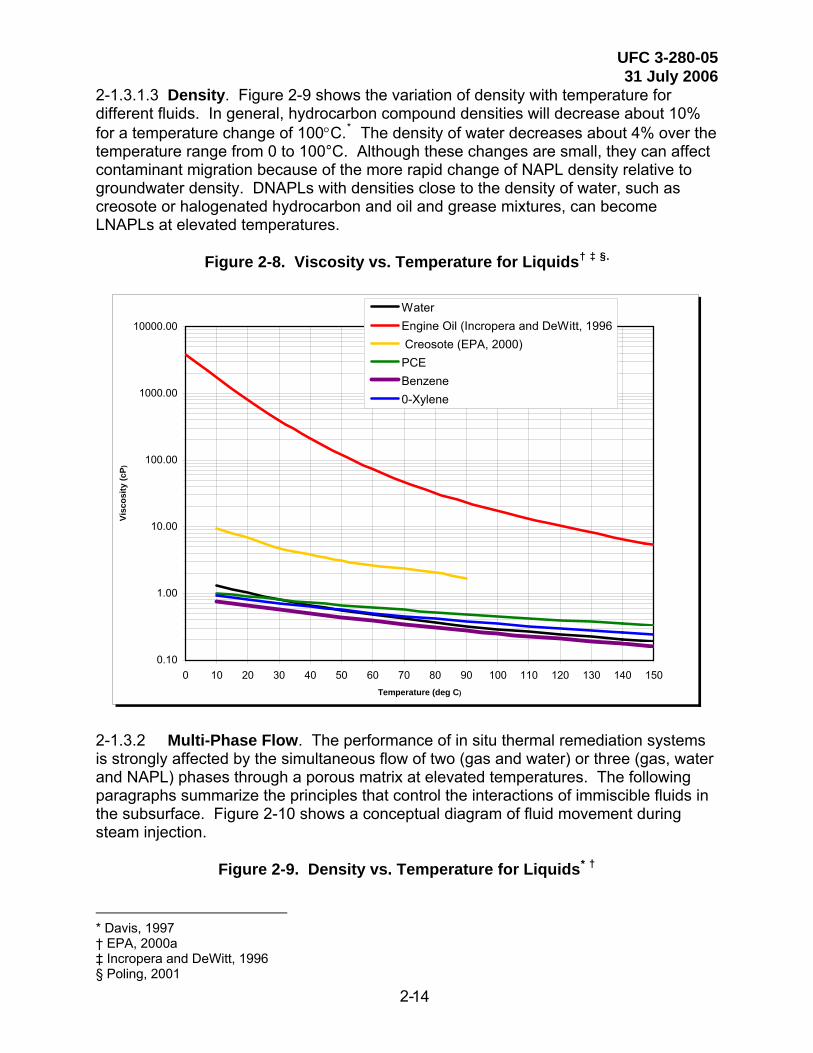
K = kρg/η (2-5) Where: ρ = density of the liquid [M•L–3] η = dynamic viscosity of the liquid [M•L–1•T] g = gravitational constant [L•T–2] k = intrinsic permeability of the porous matrix [L2] (Table 2-2). Laboratory testing has not shown significant variations of intrinsic permeability of sands with temperature.† Saturated hydraulic conductivity values are not applicable under partially saturated conditions, i.e., in the vadose zone, or when various combinations of air, steam, liquid water, or NAPL are present (see Paragraph 3-1.3.2). In general, the permeability of granular soil is not significantly affected by application of heat; however, ISTR techniques can improve the permeability of fine-grained materials, either by hydraulic fracturing from in situ steam generation, or by desiccation from drying at temperatures above the boiling point of groundwater. 2-1.3.1.2 Viscosity. Figure 2-8 shows the temperature dependence of viscosity for different fluids. NAPL-recovery during ISTR is enhanced by the reduction of liquid viscosities at higher temperatures. In general, the viscosity of most liquid organic chemicals decreases by about one percent for a temperature increase of 1ºC.‡ § Gas viscosities tend to be one to two orders of magnitude less than liquid viscosities, but increase proportionally with temperature. Typically, the viscosity of a gas will increase about 30% with a temperature increase of 100°C.**.
* Hubbert, M.K. “Darcy’s Law and The Field Equations Of The Flow Of Underground Fluids.” Trans. Am. Min. Met. Engrs. 207, 222–239, 1956. † Sageev, A., B.D. Gobran, W.E. Birgham, and H.J. Ramey, Jr. “The Effect of Temperature on Absolute Permeability to Distilled Water of Unconsolidated Sand Cores.” Proceedings, 6th Workshop on Geothermal Reservoir Engineering, SGP-TR-50, Stanford University, Stanford, California, 297-300: 1980. ‡ Davis, E.L. How Heat Can Enhance In Situ Soil and Aquifer Remediation: Important Chemical Properties and Guidance On Choosing The Appropriate Technique. EPA/540/S-97/502, April, 1997. § Poling, et al., (2001) ** Davis, 1997
UFC 3-280-05 31 July 2006
2- 14
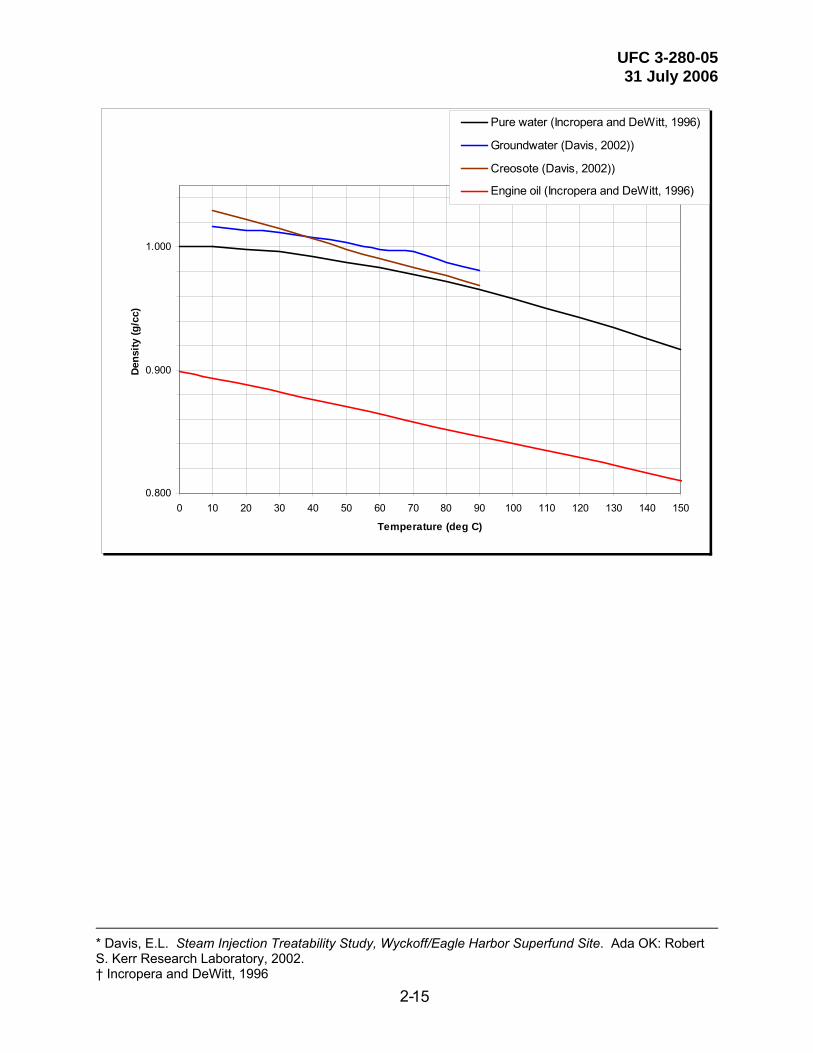
2-1.3.1.3 Density. Figure 2-9 shows the variation of density with temperature for different fluids. In general, hydrocarbon compound densities will decrease about 10% for a temperature change of 100°C.* The density of water decreases about 4% over the temperature range from 0 to 100°C. Although these changes are small, they can affect contaminant migration because of the more rapid change of NAPL density relative to groundwater density. DNAPLs with densities close to the density of water, such as creosote or halogenated hydrocarbon and oil and grease mixtures, can become LNAPLs at elevated temperatures.
Figure 2-8. Viscosity vs. Temperature for Liquids† .‡ §
0.10
1.00
10.00
100.00
1000.00
10000.00
0 10 20 30 40 50 60 70 80 90 100 110 120 130 140 150Temperature (deg C)
Visc
osity
(cP )
WaterEngine Oil (Incropera and DeWitt, 1996 Creosote (EPA, 2000)PCEBenzene0-Xylene
2-1.3.2 Multi-Phase Flow. The performance of in situ thermal remediation systems is strongly affected by the simultaneous flow of two (gas and water) or three (gas, water and NAPL) phases through a porous matrix at elevated temperatures. The following paragraphs summarize the principles that control the interactions of immiscible fluids in the subsurface. Figure 2-10 shows a conceptual diagram of fluid movement during steam injection.
Figure 2-9. Density vs. Temperature for Liquids* †
* Davis, 1997 † EPA, 2000a ‡ Incropera and DeWitt, 1996 § Poling, 2001
UFC 3-280-05 31 July 2006
2- 15
0.800
0.900
1.000
0 10 20 30 40 50 60 70 80 90 100 110 120 130 140 150
Temperature (deg C)
Dens
ity (g
/cc)
Pure water (Incropera and DeWitt, 1996)
Groundwater (Davis, 2002))
Creosote (Davis, 2002))
Engine oil (Incropera and DeWitt, 1996)
* Davis, E.L. Steam Injection Treatability Study, Wyckoff/Eagle Harbor Superfund Site. Ada OK: Robert S. Kerr Research Laboratory, 2002. † Incropera and DeWitt, 1996
UFC 3-280-05 31 July 2006
2- 16
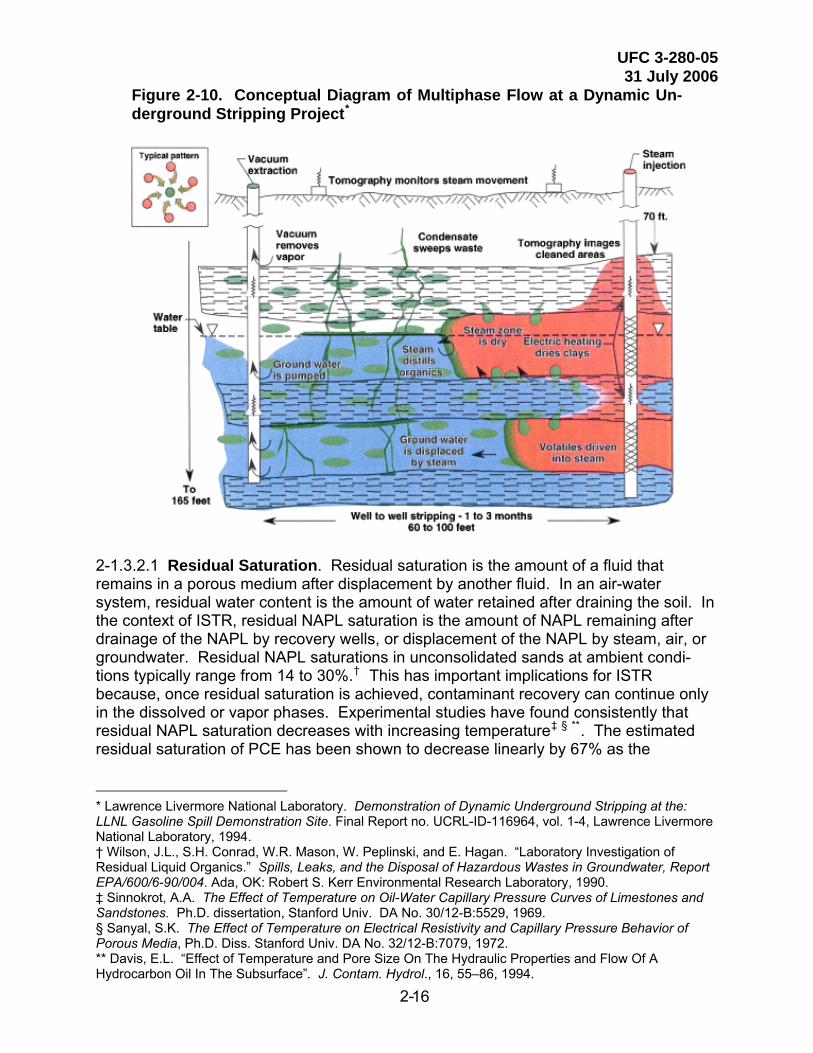
Figure 2-10. Conceptual Diagram of Multiphase Flow at a Dynamic Un-derground Stripping Project*
2-1.3.2.1 Residual Saturation. Residual saturation is the amount of a fluid that remains in a porous medium after displacement by another fluid. In an air-water system, residual water content is the amount of water retained after draining the soil. In the context of ISTR, residual NAPL saturation is the amount of NAPL remaining after drainage of the NAPL by recovery wells, or displacement of the NAPL by steam, air, or groundwater. Residual NAPL saturations in unconsolidated sands at ambient condi-tions typically range from 14 to 30%.† This has important implications for ISTR because, once residual saturation is achieved, contaminant recovery can continue only in the dissolved or vapor phases. Experimental studies have found consistently that residual NAPL saturation decreases with increasing temperature‡ § **. The estimated residual saturation of PCE has been shown to decrease linearly by 67% as the
* Lawrence Livermore National Laboratory. Demonstration of Dynamic Underground Stripping at the: LLNL Gasoline Spill Demonstration Site. Final Report no. UCRL-ID-116964, vol. 1-4, Lawrence Livermore National Laboratory, 1994. † Wilson, J.L., S.H. Conrad, W.R. Mason, W. Peplinski, and E. Hagan. “Laboratory Investigation of Residual Liquid Organics.” Spills, Leaks, and the Disposal of Hazardous Wastes in Groundwater, Report EPA/600/6-90/004. Ada, OK: Robert S. Kerr Environmental Research Laboratory, 1990. ‡ Sinnokrot, A.A. The Effect of Temperature on Oil-Water Capillary Pressure Curves of Limestones and Sandstones. Ph.D. dissertation, Stanford Univ. DA No. 30/12-B:5529, 1969. § Sanyal, S.K. The Effect of Temperature on Electrical Resistivity and Capillary Pressure Behavior of Porous Media, Ph.D. Diss. Stanford Univ. DA No. 32/12-B:7079, 1972. ** Davis, E.L. “Effect of Temperature and Pore Size On The Hydraulic Properties and Flow Of A Hydrocarbon Oil In The Subsurface”. J. Contam. Hydrol., 16, 55–86, 1994.

UFC 3-280-05 31 July 2006
2- 17
temperature is increased from 20 to 80°C.* These data indicate favorable conditions for recovery of NAPL contaminants by ISTR.
2-1.3.2.2 Interfacial Tension and Capillary Pressure. If two immiscible fluids occupy the voids of a porous medium, the pressure of the fluid that wets the porous matrix is less than that of the nonwetting fluid. This pressure difference is made possible by the tension in the meniscus between the two fluids (interfacial tension), similar to the pressure difference between the inside of a balloon and the surrounding atmosphere. Capillary pressure increases as the nonwetting fluid displaces the wetting fluid, and the degree of saturation by the wetting liquid decreases (Figures 2-11 and 2-12). Gas and NAPL are expected to be the nonwetting fluids in most soils; however, geochemical conditions can cause a soil to become NAPL-wet over time. Because retention of immiscible fluid in soil pore space is partially the result of capillary pressure, mobility and potential recovery of NAPL could be improved by reducing interfacial tensions. Although the air-water interfacial tension is known to decrease with increasing temperature, available data indicate that temperature has only a minor effect on oil-water interfacial tensions.† ‡ §
Figure 2-11. LNAPL in Soil, Saturations vs. Elevation, and Level in a Well Figure courtesy of Dr. Ralph Baker, TerraTherm, Inc. Used with permission
* She, H.Y. and B. Sleep. “The Effect of Temperature On Capillary Pressure-Saturation Relationships For Air-Water and Perchloroethylene-Water Systems.” Water Resour. Res., 34, 2587–2597. 1998. † Davis, 1994 ‡ Davis 1997 § Davis, E.L. Steam Injection Treatability Study, McCormick and Baxter Superfund Site, Stockton California. Ada OK: Robert S. Kerr Research Laboratory, 2003.
UFC 3-280-05 31 July 2006
2- 18
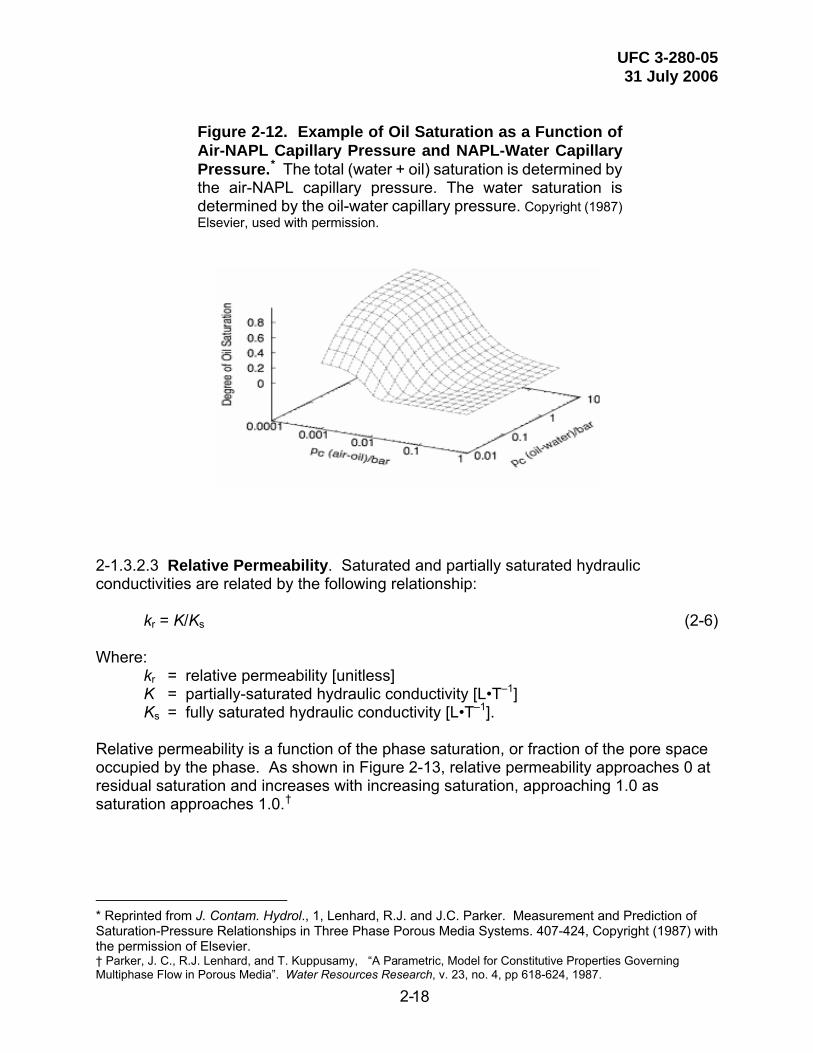
Figure 2-12. Example of Oil Saturation as a Function of Air-NAPL Capillary Pressure and NAPL-Water Capillary Pressure.* The total (water + oil) saturation is determined by the air-NAPL capillary pressure. The water saturation is determined by the oil-water capillary pressure. Copyright (1987) Elsevier, used with permission.
2-1.3.2.3 Relative Permeability. Saturated and partially saturated hydraulic conductivities are related by the following relationship:
kr = K/Ks (2-6) Where: kr = relative permeability [unitless] K = partially-saturated hydraulic conductivity [L•T–1] Ks = fully saturated hydraulic conductivity [L•T–1]. Relative permeability is a function of the phase saturation, or fraction of the pore space occupied by the phase. As shown in Figure 2-13, relative permeability approaches 0 at residual saturation and increases with increasing saturation, approaching 1.0 as saturation approaches 1.0.†
* Reprinted from J. Contam. Hydrol., 1, Lenhard, R.J. and J.C. Parker. Measurement and Prediction of Saturation-Pressure Relationships in Three Phase Porous Media Systems. 407-424, Copyright (1987) with the permission of Elsevier. † Parker, J. C., R.J. Lenhard, and T. Kuppusamy, “A Parametric, Model for Constitutive Properties Governing Multiphase Flow in Porous Media”. Water Resources Research, v. 23, no. 4, pp 618-624, 1987.
UFC 3-280-05 31 July 2006
2- 19
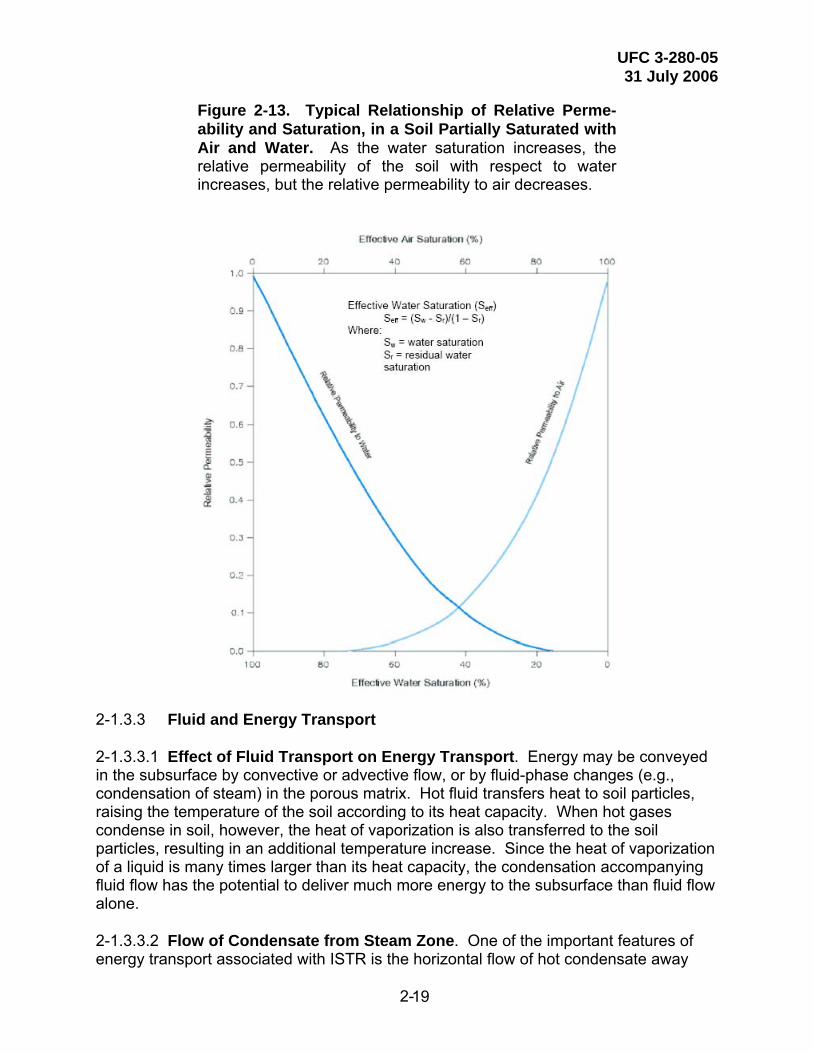
Figure 2-13. Typical Relationship of Relative Perme-ability and Saturation, in a Soil Partially Saturated with Air and Water. As the water saturation increases, the relative permeability of the soil with respect to water increases, but the relative permeability to air decreases.
2-1.3.3 Fluid and Energy Transport 2-1.3.3.1 Effect of Fluid Transport on Energy Transport. Energy may be conveyed in the subsurface by convective or advective flow, or by fluid-phase changes (e.g., condensation of steam) in the porous matrix. Hot fluid transfers heat to soil particles, raising the temperature of the soil according to its heat capacity. When hot gases condense in soil, however, the heat of vaporization is also transferred to the soil particles, resulting in an additional temperature increase. Since the heat of vaporization of a liquid is many times larger than its heat capacity, the condensation accompanying fluid flow has the potential to deliver much more energy to the subsurface than fluid flow alone. 2-1.3.3.2 Flow of Condensate from Steam Zone. One of the important features of energy transport associated with ISTR is the horizontal flow of hot condensate away
UFC 3-280-05 31 July 2006
2- 20
from the steam zone. Injection of non-condensable gas in the saturated zone (i.e., air sparging) typically results in a conical zone of gas channels extending from the injection screen to the ground surface.* Introduction of steam into the subsurface, however, from injection wells or the propagation of steam resulting from in situ electrical or conductive heating, can create a gas-saturated zone of relatively greater horizontal extent owing to the horizontal flow of condensate. The condensate heats the media along its flow path toward extraction wells or away from the heated zone, creating a near-horizontal warm zone that can achieve steam temperature with less heat input than would be required for steam temperatures at ambient conditions. For typical ISTR arrays of vertical wells and electrodes installed at similar elevations, the condensate-heated zone is likely to be elongated in the horizontal direction, and can impart a significant horizontal component to the expansion of the steam zone. A potential goal in system design might be to optimize horizontal steam propagation, allowing maximum well spacings to be used (see Chapter 6). 2-1.3.4 Biological Processes at Elevated Temperatures. It is generally recognized that dissolved-phase plumes of contaminated groundwater are stabilized or reduced at least to some extent by natural attenuation processes (biodegradation, dispersion, dilution, sorption, volatilization, and abiotic degradation mechanisms). Of these mechanisms, biodegradation is perhaps the most important because it represents actual reduction in contaminant mass. While in situ biodegradation may have limited impact on NAPL source removal, there is the potential for biologically mediated contaminant reduction to assist thermal remediation projects, both during treatment and as a polishing step, resulting in the reduction of downgradient contaminant plumes both during and after active thermal remediation. There are several possible effects of thermal remediation on the in situ biodegradation at a contaminated site. These range from complete inhibition within the heated zone to enhancement during and after thermal treatment. Neither effect is fully supported by current research, while there is only anecdotal indirect evidence of enhancement. There exist several lines of reasoning suggesting that in situ biodegradation should be enhanced by thermal remediation. It does seem clear, that based on existing data, thermal remediation does not result in permanently sterile soil conditions. Thermal remediation likely alters the consortia of microorganisms present and active at a site undergoing thermal treatment. 2-1.3.5 Temperature Tolerance of Microorganisms. The occurrence and abundance of microorganisms in a particular environment is controlled by the complex interaction of nutrients with physical and chemical factors (temperature, redox, pH, etc.) present in the environment through time. Consequently, the presence and success of a specific organism or consortia of microorganisms responsible for degrading hydrocarbons in a contaminated subsurface ecosystem depends on both nutrient requirements and tolerance for the range of physical and chemical conditions present. Temperature is considered to be one of the most important physical factors controlling the distribution and abundance of organisms. Bacteria, in particular, have adapted to a wide variety of environments, including habitats characterized by extreme temperatures,
* USACE. “In Situ Air Sparging.” U.S. Army Corps of Engineers Engineer Manual EM 1110-1-4005, Washington, DC: U.S. Army Corps of Engineers, 1997.
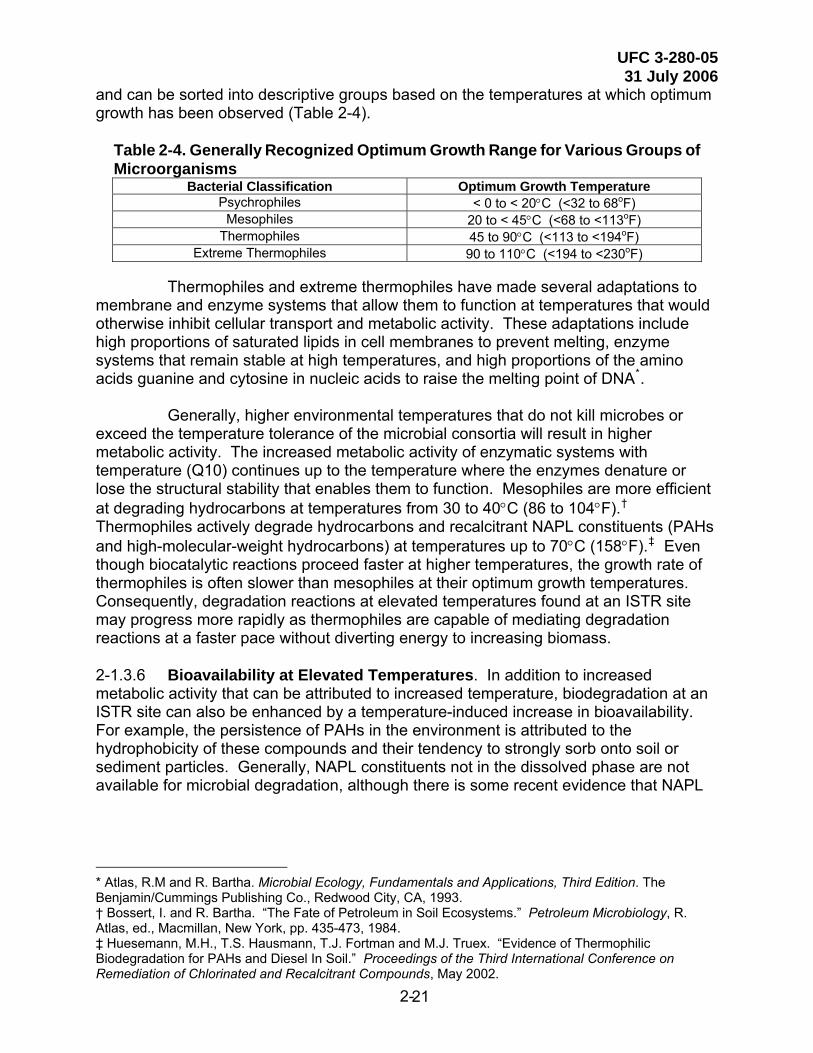
UFC 3-280-05 31 July 2006
2- 21
and can be sorted into descriptive groups based on the temperatures at which optimum growth has been observed (Table 2-4).
Table 2-4. Generally Recognized Optimum Growth Range for Various Groups of Microorganisms
Bacterial Classification Optimum Growth Temperature Psychrophiles < 0 to < 20°C (<32 to 68oF)
Mesophiles 20 to < 45°C (<68 to <113oF) Thermophiles 45 to 90°C (<113 to <194oF)
Extreme Thermophiles 90 to 110°C (<194 to <230oF)
Thermophiles and extreme thermophiles have made several adaptations to membrane and enzyme systems that allow them to function at temperatures that would otherwise inhibit cellular transport and metabolic activity. These adaptations include high proportions of saturated lipids in cell membranes to prevent melting, enzyme systems that remain stable at high temperatures, and high proportions of the amino acids guanine and cytosine in nucleic acids to raise the melting point of DNA*. Generally, higher environmental temperatures that do not kill microbes or exceed the temperature tolerance of the microbial consortia will result in higher metabolic activity. The increased metabolic activity of enzymatic systems with temperature (Q10) continues up to the temperature where the enzymes denature or lose the structural stability that enables them to function. Mesophiles are more efficient at degrading hydrocarbons at temperatures from 30 to 40°C (86 to 104°F).†
Thermophiles actively degrade hydrocarbons and recalcitrant NAPL constituents (PAHs and high-molecular-weight hydrocarbons) at temperatures up to 70°C (158°F).‡ Even though biocatalytic reactions proceed faster at higher temperatures, the growth rate of thermophiles is often slower than mesophiles at their optimum growth temperatures. Consequently, degradation reactions at elevated temperatures found at an ISTR site may progress more rapidly as thermophiles are capable of mediating degradation reactions at a faster pace without diverting energy to increasing biomass. 2-1.3.6 Bioavailability at Elevated Temperatures. In addition to increased metabolic activity that can be attributed to increased temperature, biodegradation at an ISTR site can also be enhanced by a temperature-induced increase in bioavailability. For example, the persistence of PAHs in the environment is attributed to the hydrophobicity of these compounds and their tendency to strongly sorb onto soil or sediment particles. Generally, NAPL constituents not in the dissolved phase are not available for microbial degradation, although there is some recent evidence that NAPL
* Atlas, R.M and R. Bartha. Microbial Ecology, Fundamentals and Applications, Third Edition. The Benjamin/Cummings Publishing Co., Redwood City, CA, 1993. † Bossert, I. and R. Bartha. “The Fate of Petroleum in Soil Ecosystems.” Petroleum Microbiology, R. Atlas, ed., Macmillan, New York, pp. 435-473, 1984. ‡ Huesemann, M.H., T.S. Hausmann, T.J. Fortman and M.J. Truex. “Evidence of Thermophilic Biodegradation for PAHs and Diesel In Soil.” Proceedings of the Third International Conference on Remediation of Chlorinated and Recalcitrant Compounds, May 2002.
UFC 3-280-05 31 July 2006
2- 22
contaminants may be degraded by specially adapted bacteria.* However, increases in temperature have been shown to increase the solubility of both PAHs and the rate of dissolution of chlorinated compounds.† ‡ § ** Consequently, increased subsurface temperatures should increase the concentration of contaminants in the dissolved phase and increase the availability of these compounds to degrading microorganisms. As discussed in Paragraph 2-1.1, the solubility of NAPL constituents increases at increased temperatures. At increased temperatures, the solubility of TCE and PCE increases, resulting in greater mass of contaminant in the dissolved phase and, therefore, greater potential availability to degrading microorganisms. Preliminary data have also shown that the increased solubility of selected PAHs at temperatures up to 60°C enables thermophiles to degrade the PAHs at a rate of up to 8 times faster than mesophiles at lower temperatures.††
2-1.3.7 Microorganism Population Changes and Ability to Degrade Contaminants. The combination of increased metabolic activity and greater bioavailability allows for enhancing in situ biodegradation at ISTR sites. During active thermal treatment, in situ degradation may be temporarily inhibited once subsurface temperatures increase above the tolerance range of indigenous mesophiles. Microorganisms have several mechanisms for surviving unfavorable conditions, however, including the formation of non-vegetative structures (i.e., spores or cysts) that are metabolically less active and allow the organism to survive until environmental conditions improve. Bacterial cells in bench-scale tests of creosote-contaminated soil have demonstrated the ability to rapidly become metabolically active following steam injection.‡‡
Further studies have also demonstrated that thermophilic degradation of PAHs and non-volatile hydrocarbons increased at temperatures likely to occur adjacent to the active treatment zone of an ISTR site§§. This observation is likely the result of shifts in the population of microorganisms from predominantly mesophilic to predominantly thermophilic. This type of community shift is usually associated with a reduction in the diversity of microorganisms, as the number of different types of organisms is smaller in extreme environments. As subsurface temperatures cool after active thermal treatment, the consortia within the heated zone will again shift as
* Wattiau, P. 2002. “Microbial Aspects in Bioremediation of Soils Polluted by Polyaromatic Hydrocarbons.” Biotechnology for the Environment, Strategy and Fundamentals, S.N. Agathos and W. Reineke, editors, Kluwer Academic Publishers, Netherlands, pp. 69-89, 2002. † Hulscher, E.M. and G. Cornelissen. “Effect of temperature on sorption equilibrium and sorption kinetics of organic micropollutants – a review.” Chemosphere, 32:609-626, 1996. ‡ Bonten, L.T.C., T.C. Grotenhuis and W.H. Rulkens. “Enhancement of PAH biodegradation in soil by physiochemical pretreatment.” Chemosphere, 38:3627-3636, 1999. § Imhoff, et al., 1997 ** Jayaweera, I.S., M. Marti-Perez and J. Diaz-Ferrero. “Solubility of Polycyclic Aromatic Hydrocarbons Under Hydrothermal Conditions.” Proceedings of the Third International Conference on Remediation of Chlorinated and Recalcitrant Compounds, May, 2002. †† Peyton, B.M. Assistant Professor, Chemical Engineering, Washington State University, Pullman, Washington. Personal communication, 2003. ‡‡ Richardson, R. E. Final Report on Post-Steam Microbial Experiments Performed at U.C. Berkeley for the Wyckoff/Eagle Harbor Superfund Site. Submitted for publication, 2000. §§ Huesemann, et. al., 2002

UFC 3-280-05 31 July 2006
2- 23
conditions become less favorable for thermophiles and return to the optimum temperatures for mesophiles. The effect these population shifts may have on the actual make-up of the community of microorganism at an ISTR site, and the resulting impact on the rate of in situ biodegradation, has not been well quantified. This question remains an important research topic that needs to be addressed for a more complete understanding of the fundamental processes that occur following ISTR. While there are limited data to support claims of enhanced bioremediation at thermal remediation sites, it is possible to infer that in situ biodegradation rates are likely to increase both following thermal remediation (as the site cools) and adjacent to an ISTR site as groundwater passes through a heated zone, carrying heat and increased contaminant concentrations downgradient. The EPA Technology Innovation Office has published a more detailed review of this topic, available at the website www.clu-in.org.*
2-1.3.8 Redox Theory of Biodegradation. Established natural attenuation protocols may be used to document evidence of in situ biodegradation after active thermal treatment. Most biologically mediated degradation activity is conducted by enzymatic systems that carry out oxidation-reduction reactions. In these reactions, microorganisms obtain energy for growth and synthesis of proteins and other cellular components by transferring electrons from electron donors to electron acceptors. In the context of aerobic degradation reactions, organic contaminants in the dissolved phase act as electron donors, giving up electrons to electron acceptors such as oxygen, nitrate, Fe(III), Mn (IV) sulfate, or carbon dioxide. In some cases, such as the reductive dechlorination reactions responsible for the degradation of chlorinated solvents, the organic contaminant acts as an electron acceptor. 2-1.3.8.1 The release of organic compounds to the subsurface and groundwater flow systems results in changes to the oxidation-reduction (redox) conditions in groundwater. Under natural conditions, infiltrating groundwater interacts with soil organic and mineral compounds, oxidizing the organic material, and, in turn, reducing the minerals. The consortium of microorganisms present catalyzes these reactions. Oxygen in the groundwater is utilized first as a terminal electron acceptor in biocatalyzed degradation reactions, because the use of oxygen is thermodynamically more favorable for aerobic microbes. Once oxygen concentrations decrease, oxidation can still occur, but the oxidizing agents are NO3, MnO2, Fe(OH)3, and SO4. The normal progression is from nitrate reducing, to manganese or iron-reducing conditions, to sulfate-reducing conditions; and may eventually progress to methanogenic conditions, resulting in the production of methane. As these oxidizing agents are consumed, the groundwater environment becomes increasingly reduced to the point where methanogenic conditions may result, if there are: 1) sufficient oxidizeable organics, 2) sufficient nutrients, and 3) temperature conditions conducive to bacterial growth. These processes are shown in Table 2-5. 2-1.3.8.2 The role of in situ biodegradation may be evaluated through both primary and secondary field evidence. Primary evidence includes quantitative evaluation of plume
* USEPA. A Discussion of the Effects of Thermal Remediation Treatments on Microbial Degradation Processes. Office of Solid Waste and Emergency Response, Technology Innovation Office, Washington, DC, 2002b, www.clu-in.org.

UFC 3-280-05 31 July 2006
2- 24
stability, or whether it is shrinking or growing, based on historical data trends. Secondary evidence includes indirect indicators of biodegradation such as variations in geochemical parameters discussed below.
Table 2-5. Redox Processes that Consume Organic Matter and Reduce Inorganic Compounds in Groundwater*
Process Equation* Aerobic Respiration CH2O + O = CO2 + H2O Denitrification CH2O + 4/5NO3
- = 2/5N2(g) + HCO3- + 1/5H+ + 2/5H2O
Manganese Reduction CH2O + 2MnO2(s) + 3H+ = 2Mn2+ + HCO3- + 2H2O
Iron (III) Reduction CH2O + 4Fe(OH)3(s) + 7H+ = 4Fe2+ + HCO3- + 10H2O
Sulfate Reduction CH2O + 1/2SO42- = 1/2HS- + HCO3
- +1/2H+
Methane Fermentation CH2O + 1/2H2O = 1/2CH4 + 1/2HCO3- + 1/2H+
* CH2O represents organic matter; other organic compounds can also be oxidized and substituted in the equations.
2-1.3.8.3 When oxidizeable organic compounds are released to the subsurface, these compounds result in the consumption of oxygen. During aerobic respiration, oxygen is the favored terminal electron acceptor. Anaerobic respiration requires an alternative electron acceptor to be present, such as nitrate, sulfate, or iron(III). Denitrification, the chemical reduction of nitrate, occurs once the dissolved oxygen concentrations have been depleted to an anaerobic level and the nitrate is used as the terminal electron acceptor. Organic carbon may be biodegraded by anaerobic respiration, if the concentration of nitrate is less than 1.0 mg/L. 2-1.3.8.4 Sulfate is another terminal electron acceptor used in anaerobic respiration. Depleted levels of sulfate or elevated levels of sulfide are good indicators of sulfate reduction. Areas of lower sulfate concentrations likely indicate that anaerobic respiration has progressed from denitrification, through iron reduction, to sulfate reduction. As sulfate is reduced, methane fermentation occurs. At this redox level, mineral sources of oxygen become very limited and the oxidative capacity of the aquifer is said to be depleted. 2-1.3.8.5 The oxidation-reduction (redox) potential of the groundwater is a good indication of the type of electron activity present. Anaerobic microbial processes, such as denitrification and sulfate reduction, occur at and result in negative redox potentials. Redox potentials under these conditions have been measured in the field and reported primarily as negative. The negative redox potentials indicate that available dissolved oxygen has been consumed and that the bacteria are scavenging mineral sources of oxygen. 2-1.3.8.6 Several guidance documents published by EPA† and DoD* are available, describing in greater detail the physical, chemical and biological process involved in situ
* Freeze, R.A. and J.A. Cherry. Groundwater. Prentice Hall, Englewood Cliffs, NJ, 1979 † USEPA. Microbial Processes Affecting Monitored Natural Attenuation of Contaminants in the Subsurface. Office of Solid Waste and Emergency Response, National Risk Management Research Laboratory, Subsurface Protection and Remediation Division, Robert S. Kerr Environmental Research Center, Ada, Oklahoma. EPA/540/S-99/001.1999a.
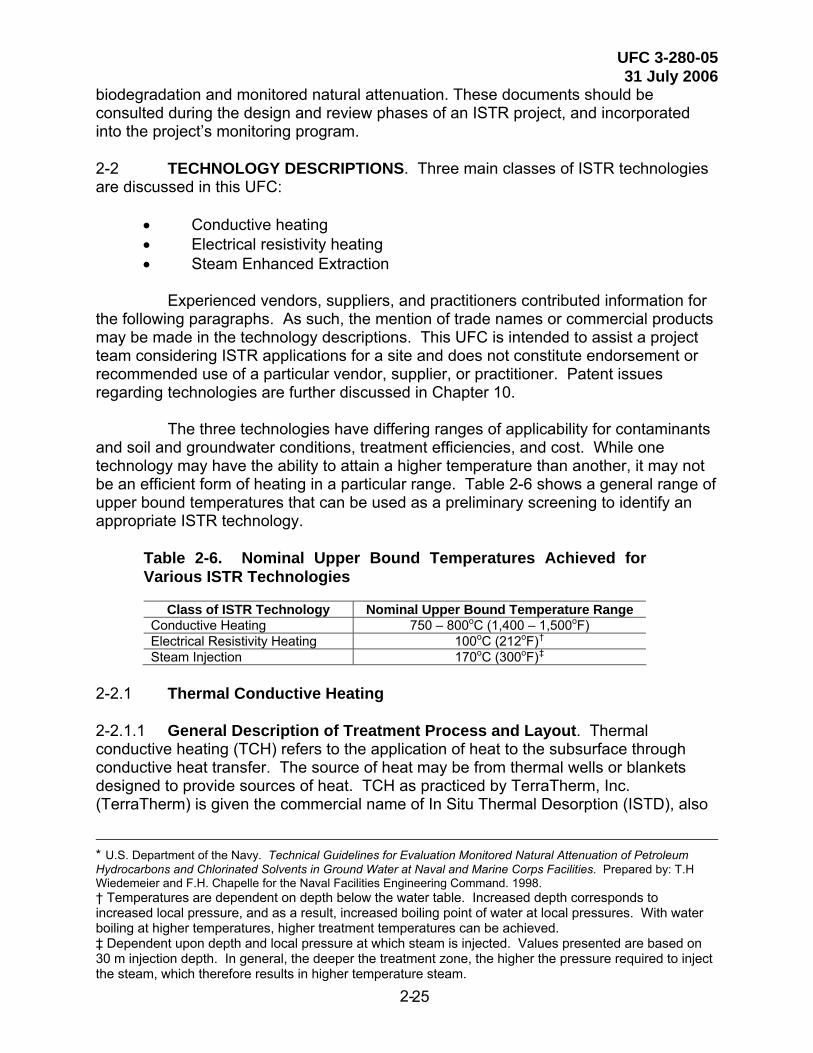
UFC 3-280-05 31 July 2006
2- 25
biodegradation and monitored natural attenuation. These documents should be consulted during the design and review phases of an ISTR project, and incorporated into the project’s monitoring program. 2-2 TECHNOLOGY DESCRIPTIONS. Three main classes of ISTR technologies are discussed in this UFC:
• Conductive heating • Electrical resistivity heating • Steam Enhanced Extraction
Experienced vendors, suppliers, and practitioners contributed information for the following paragraphs. As such, the mention of trade names or commercial products may be made in the technology descriptions. This UFC is intended to assist a project team considering ISTR applications for a site and does not constitute endorsement or recommended use of a particular vendor, supplier, or practitioner. Patent issues regarding technologies are further discussed in Chapter 10. The three technologies have differing ranges of applicability for contaminants and soil and groundwater conditions, treatment efficiencies, and cost. While one technology may have the ability to attain a higher temperature than another, it may not be an efficient form of heating in a particular range. Table 2-6 shows a general range of upper bound temperatures that can be used as a preliminary screening to identify an appropriate ISTR technology.
Table 2-6. Nominal Upper Bound Temperatures Achieved for Various ISTR Technologies
Class of ISTR Technology Nominal Upper Bound Temperature Range
Conductive Heating 750 – 800oC (1,400 – 1,500oF) Electrical Resistivity Heating 100oC (212oF)†
Steam Injection 170oC (300oF)‡
2-2.1 Thermal Conductive Heating 2-2.1.1 General Description of Treatment Process and Layout. Thermal conductive heating (TCH) refers to the application of heat to the subsurface through conductive heat transfer. The source of heat may be from thermal wells or blankets designed to provide sources of heat. TCH as practiced by TerraTherm, Inc. (TerraTherm) is given the commercial name of In Situ Thermal Desorption (ISTD), also
* U.S. Department of the Navy. Technical Guidelines for Evaluation Monitored Natural Attenuation of Petroleum Hydrocarbons and Chlorinated Solvents in Ground Water at Naval and Marine Corps Facilities. Prepared by: T.H Wiedemeier and F.H. Chapelle for the Naval Facilities Engineering Command. 1998. † Temperatures are dependent on depth below the water table. Increased depth corresponds to increased local pressure, and as a result, increased boiling point of water at local pressures. With water boiling at higher temperatures, higher treatment temperatures can be achieved. ‡ Dependent upon depth and local pressure at which steam is injected. Values presented are based on 30 m injection depth. In general, the deeper the treatment zone, the higher the pressure required to inject the steam, which therefore results in higher temperature steam.

UFC 3-280-05 31 July 2006
2- 26
referred to as In Situ Thermal Destruction. TCH utilizes both conductive heating and vacuum to remediate soils contaminated with a wide range of organic compounds. Heat and vacuum are applied simultaneously to the soil with an array of vertical or horizontal heaters. For the ISTD technology (which will be the main focus of this UFC), each heater contains a heating element (typically electrically powered resistance heaters), with an operating temperature of approximately 1400 to 1500°F (~750 to 800°C). Heat flows through the soil from the heating elements primarily by thermal conduction. Figure 2-14 provides an overall schematic of the ISTD technology, depicting the two most common applications of the technology: 1) vertical “thermal wells” (at right); and 2) horizontal thermal wells (at left), which, when used to treat shallow contamination less than 0.4 m deep, are termed “thermal blankets.”
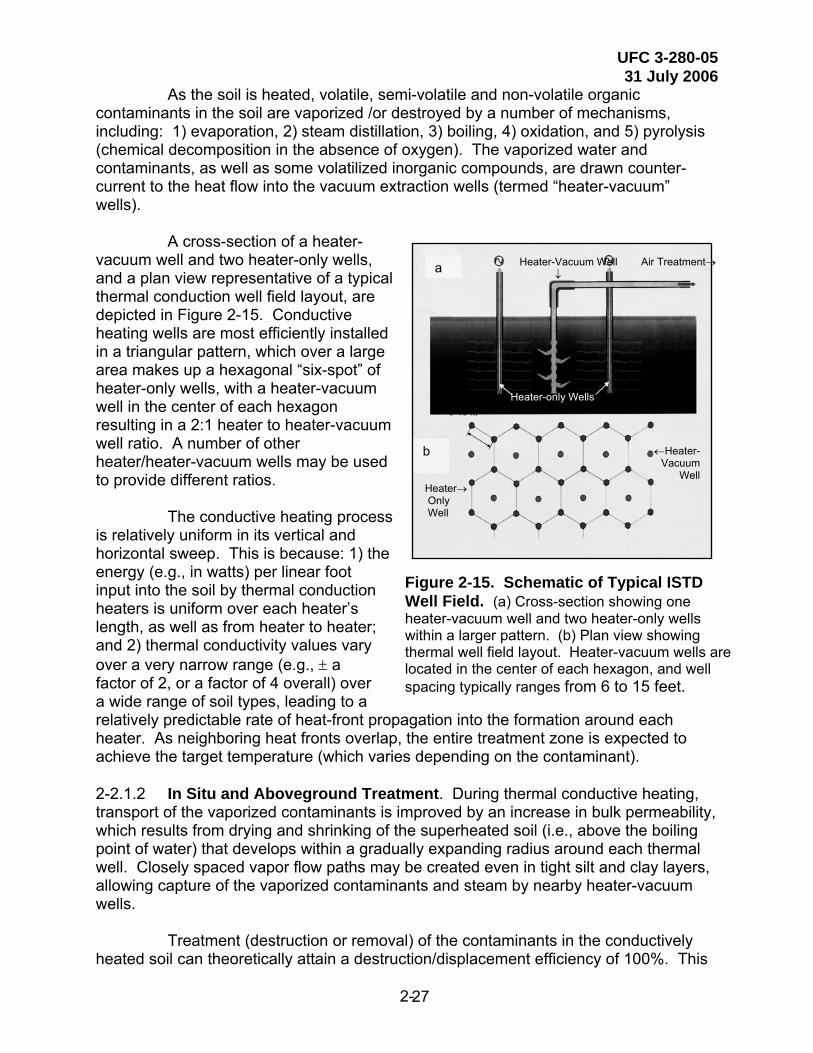
UFC 3-280-05 31 July 2006
2- 27
As the soil is heated, volatile, semi-volatile and non-volatile organic contaminants in the soil are vaporized /or destroyed by a number of mechanisms, including: 1) evaporation, 2) steam distillation, 3) boiling, 4) oxidation, and 5) pyrolysis (chemical decomposition in the absence of oxygen). The vaporized water and contaminants, as well as some volatilized inorganic compounds, are drawn counter-current to the heat flow into the vacuum extraction wells (termed “heater-vacuum” wells). A cross-section of a heater-vacuum well and two heater-only wells, and a plan view representative of a typical thermal conduction well field layout, are depicted in Figure 2-15. Conductive heating wells are most efficiently installed in a triangular pattern, which over a large area makes up a hexagonal “six-spot” of heater-only wells, with a heater-vacuum well in the center of each hexagon resulting in a 2:1 heater to heater-vacuum well ratio. A number of other heater/heater-vacuum wells may be used to provide different ratios. The conductive heating process is relatively uniform in its vertical and horizontal sweep. This is because: 1) the energy (e.g., in watts) per linear foot input into the soil by thermal conduction heaters is uniform over each heater’s length, as well as from heater to heater; and 2) thermal conductivity values vary over a very narrow range (e.g., ± a factor of 2, or a factor of 4 overall) over a wide range of soil types, leading to a relatively predictable rate of heat-front propagation into the formation around each heater. As neighboring heat fronts overlap, the entire treatment zone is expected to achieve the target temperature (which varies depending on the contaminant).
Heater-Vacuum Well Air Treatment→ ↓ Heater-only Wells
6-15 ft.
←Heater-
Vacuum Well
Heater→ Only Well
a
b
Figure 2-15. Schematic of Typical ISTD Well Field. (a) Cross-section showing one heater-vacuum well and two heater-only wells within a larger pattern. (b) Plan view showing thermal well field layout. Heater-vacuum wells are located in the center of each hexagon, and well spacing typically ranges from 6 to 15 feet.
2-2.1.2 In Situ and Aboveground Treatment. During thermal conductive heating, transport of the vaporized contaminants is improved by an increase in bulk permeability, which results from drying and shrinking of the superheated soil (i.e., above the boiling point of water) that develops within a gradually expanding radius around each thermal well. Closely spaced vapor flow paths may be created even in tight silt and clay layers, allowing capture of the vaporized contaminants and steam by nearby heater-vacuum wells. Treatment (destruction or removal) of the contaminants in the conductively heated soil can theoretically attain a destruction/displacement efficiency of 100%. This
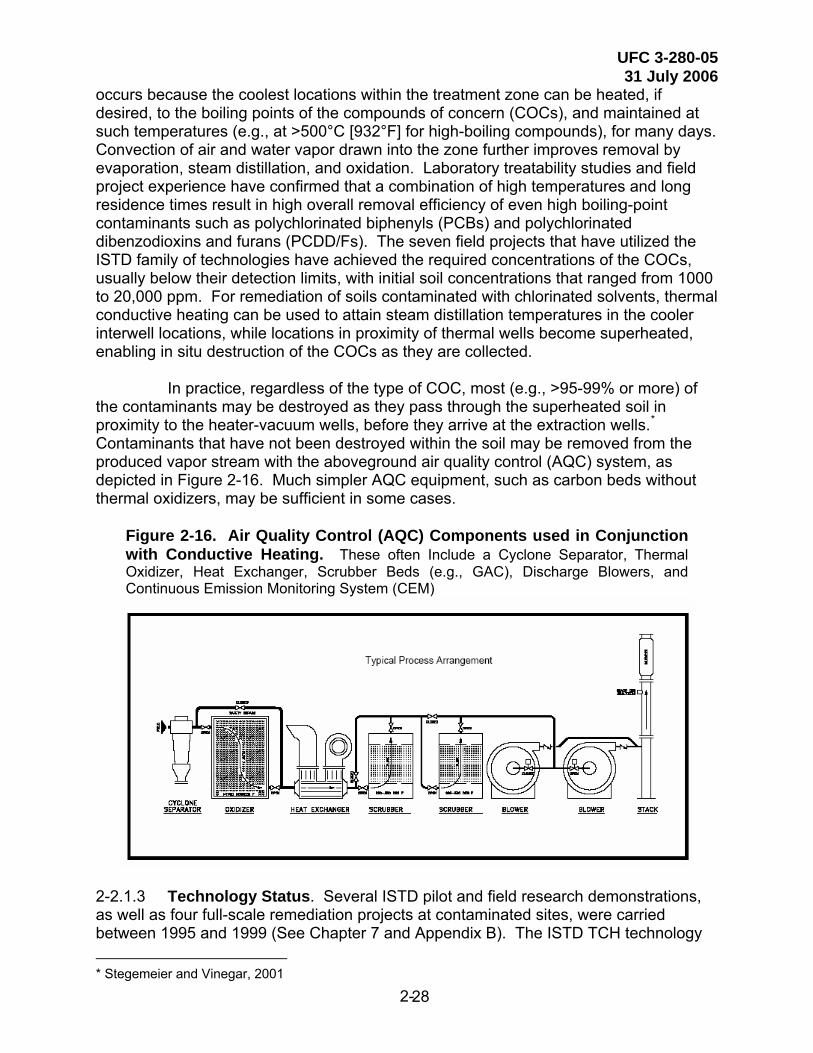
UFC 3-280-05 31 July 2006
2- 28
occurs because the coolest locations within the treatment zone can be heated, if desired, to the boiling points of the compounds of concern (COCs), and maintained at such temperatures (e.g., at >500°C [932°F] for high-boiling compounds), for many days. Convection of air and water vapor drawn into the zone further improves removal by evaporation, steam distillation, and oxidation. Laboratory treatability studies and field project experience have confirmed that a combination of high temperatures and long residence times result in high overall removal efficiency of even high boiling-point contaminants such as polychlorinated biphenyls (PCBs) and polychlorinated dibenzodioxins and furans (PCDD/Fs). The seven field projects that have utilized the ISTD family of technologies have achieved the required concentrations of the COCs, usually below their detection limits, with initial soil concentrations that ranged from 1000 to 20,000 ppm. For remediation of soils contaminated with chlorinated solvents, thermal conductive heating can be used to attain steam distillation temperatures in the cooler interwell locations, while locations in proximity of thermal wells become superheated, enabling in situ destruction of the COCs as they are collected. In practice, regardless of the type of COC, most (e.g., >95-99% or more) of the contaminants may be destroyed as they pass through the superheated soil in proximity to the heater-vacuum wells, before they arrive at the extraction wells.* Contaminants that have not been destroyed within the soil may be removed from the produced vapor stream with the aboveground air quality control (AQC) system, as depicted in Figure 2-16. Much simpler AQC equipment, such as carbon beds without thermal oxidizers, may be sufficient in some cases.
Figure 2-16. Air Quality Control (AQC) Components used in Conjunction with Conductive Heating. These often Include a Cyclone Separator, Thermal Oxidizer, Heat Exchanger, Scrubber Beds (e.g., GAC), Discharge Blowers, and Continuous Emission Monitoring System (CEM)
2-2.1.3 Technology Status. Several ISTD pilot and field research demonstrations, as well as four full-scale remediation projects at contaminated sites, were carried between 1995 and 1999 (See Chapter 7 and Appendix B). The ISTD TCH technology * Stegemeier and Vinegar, 2001
UFC 3-280-05 31 July 2006
2- 29
was demonstrated to be effective in removing a variety of contaminants including PCBs, chlorinated solvents,* coal tar products, and heavy and light petroleum hydrocarbons. Additional field-scale projects are ongoing. Pilot- and bench-scale studies have also demonstrated the potential of TCH remediation for soil contaminated with polyaromatic hydrocarbons (PAHs), and explosive compound residues, including 2,4,6-trinitrotoluene (TNT), 2,4-dinitrotoluene (2,4-DNT), hexahydro-1,3,5-trinitro-1,3,5-triazine (RDX), and nitroglycerin. 2-2.2 Electrical Resistivity Heating 2-2.2.1 General. Electrical resistivity heating (ERH) is a remediation technology that involves passing electrical current through saturated or unsaturated soil, resulting in increased subsurface temperatures, usually to the boiling point of water. ERH is generally applied using either six-phase or three-phase electrical heating. ERH has been demonstrated as an effective technology for the removal of volatile and some semivolatile contaminants from soil and groundwater†. 2-2.2.1.1 The soil is heated by the passage of current between the electrodes, not by the electrodes themselves. Electrical current passes preferentially through the most conductive soil or groundwater zones initially (e.g., areas having high concentrations of chlorides resulting from the reductive dehalogenation chlorinated organic compounds). Because the electrical current naturally seeks pathways to conduct through the subsurface, the more electrically conductive zones heat first. As water in the more conductive zones heats up and is boiled away, the less electrically conductive zones subsequently heat up. Further, thermal conduction also plays a role in the heating of the subsurface, such that at the completion of treatment (and barring the presence of thermal sinks), a relatively uniform heating of the desired remediation region results. ERH accelerates VOC remediation by the following principal mechanisms:
• ERH increases subsurface temperatures beyond the boiling point of most VOCs, causing them to transition to the vapor phase to be removed through conventional vapor recovery (VR) wells.
• ERH boils a portion of the pore water in all soil types, regardless of permeability. If geological conditions are favorable, the resulting steam promotes removal of VOC vapors from low-permeability soil for collection by the vapor recovery systems.
• As subsurface temperatures rise, the rates of intrinsic biological activity and chemical reactions are dramatically increased. These processes are discussed in greater detail in Paragraph 2-1. 2-2.2.1.2 From a perspective of basic electrical principles, there is no great distinction between the two methods (i.e., six or three phase) and it is becoming common practice
* Vinegar, H.J., G.L. Stegemeier, F.G. Carl, J.D. Stevenson, and R.J. Dudley. “In Situ Thermal Desorption of Soils Impacted with Chlorinated Solvents.” Proceedings of the Annual Meetings of the Air and Waste Management Association, Paper No. 99-450, 1999. † USEPA, Cost and Performance Report, Six Phase™ Heating (SPH) at a Former Manufacturing Facility, Skokie Illinois. Office of Solid Waste and Emergency Response, Technical Innovation Office. October, 1999.

UFC 3-280-05 31 July 2006
2- 30
to use six-phase heating for a pilot test and then complete the remediation using three-phase heating. For this reason, this UFC will treat the two technologies similarly under the term of electrical resistivity heating (ERH). Six-phase heating involves splitting standard line current from three phases to six phases. Figure 2-17. Sine Curves of Voltage vs. Time Depicting Six Phase Alternating Current 2-2.2.1.3 A depiction of six-phase alternating current (AC) is shown in Figure 2-17. In a hexagonal six-phase heating array, the electrodes are configured with a central neutral electrode surrounded by six charged electrodes (Figure 2-18). The electrodes are charged 60º out-of-phase from each other. The voltage of all phases is constantly changing with respect to neutral; however, the average voltage difference between two adjacent electrodes (e.g., between electrodes 1 and 2, or between 1 and 6) is less than the voltage difference between electrodes that are two apart (e.g., between electrodes 1 and 3, and between electrodes 4 and 6). Electrodes that are separated by two phase numbers are completely out-of-phase with each other and have the maximum average voltage difference. The average voltage ratios of these three possibilities are: 1:1.7 to 1:2. 2-2.2.1.4 When applied to a circular treatment region, the geometry of the six-phase electrode layout, and the out of phase charging, results in a uniform voltage potential between the electrodes as illustrated in Figure 2-18. The ratio of distances in a hexagon directly correlates with the ratio of voltages in six-phase AC. However, this ideal distance-to-voltage correlation only occurs within a single six-phase heating array, not in situations where there are adjacent six-phase configurations. A single six-phase array can treat a circular area up to a diameter of about 60 feet (18.3 m).
Figure 2-18
2-2.2.1.5 Three-phase heating provides a simple method to implement uniform voltage potential between electrodes, especially in treating irregularly shaped areas. An example site is illustrated below, showing the optimum phasing for three-phase heating (Figure 2-19) and for six-phase heating (Figure 2-20):

UFC 3-280-05 31 July 2006
2- 31
Figure 2-19. Three-Phase Heating Pattern Figure 2-20. Six-Phase Heating Pattern 2-2.2.1.6 When using three-phase heating (Figure 2-19), the current flow and heating pattern (shown as thin black lines) is relatively simple, uniform, and regular. The electrodes can be easily “mapped” over the region to be treated. Three-phase heating is balanced electrically, with similar numbers of electrodes connected to all three phases. 2-2.2.1.7 The optimum configuration of six-phase heating to treat the same region is shown in Figure 2-20, consisting of three complete arrays and seven peripheral electrodes. If an electrode is adjacent to an electrode that is one different in phase number, normal electrical current and heating will occur. Normal electrical conduction and heating will occur when an adjacent electrode: 1) differs by one phase number from the electrode, or 2) the adjacent electrode is neutral (labeled “N” above). If adjacent electrodes differ by more than one phase number, excess current will flow and a hot spot will develop as shown between the electrodes labeled as phases “3” and “5” above. Similarly, if adjacent electrodes are the same phase, no current flow or heating will occur as shown in the “cold region” above. Vendors of poly-phase ERH have developed electrical controls to switch configurations or sequences of applying voltages to compensate for hot spots and cold regions in the six phase geometry. 2-2.2.2 General Description of Treatment Process and Layout. The components required to implement ERH include:
• Electrodes. • Vapor recovery wells (which are often co-located in the same boreholes
as the electrodes). • A steam and vapor collection system, including piping, blower, and con-
denser. • A vapor treatment system. • An ERH power control unit to condition power for application to the
subsurface. • Data acquisition systems. • A computer control system with modem for continuous remote monitoring
and control of power. A typical ERH schematic is shown in Figure 2-21.

UFC 3-280-05 31 July 2006
2- 32
Figure 2-21. General Schematic of a Six-Phase ERH Treatment System. 2-2.2.2.1 The ERH electrodes conduct electrical energy into the subsurface and can be designed to allow independent control of the energy input to discrete depth intervals. Electrodes are typically constructed using either galvanized steel pipe or copper plate to treat distinct zones in the subsurface, such that multiple electrodes can be installed within the same boring. Electrodes constructed using galvanized steel pipe are installed in the subsurface in a way similar to the methods for installing groundwater monitoring wells. In the electrically conductive intervals, the surrounding borehole annulus is packed with a conductive material, such as graphite or steel shot, to increase the effective diameter of the electrode. In those portions of the subsurface where electrical resistivity heating is not desired, the electrode construction materials are insulated and the surrounding annulus is filled with relatively non-electrically conductive materials such as sand, bentonite, or cement. Electrode design and construction is discussed in Paragraph 6-3.1. 2-2.2.2.2 The electrodes provide the opportunity to heat discrete subsurface depth intervals. In applications having layered sequences, it may be desired to treat discrete layers separately or to create thermal barriers. ERH allows this flexibility by placing electrically conductive materials at discrete intervals within the same borehole in which the electrode is constructed. Based on the current state of the technology and experience, the practical minimum thickness of the discrete zone is 8 feet because of electrical fanning and thermal conduction.
UFC 3-280-05 31 July 2006
2- 33
2-2.2.2.3 Vapor recovery (VR) is accomplished using conventional vapor extraction techniques utilizing shallow wells installed either vertically or horizontally. The wells may extend into the water table, depending upon site conditions. Once steam and volatile contaminants have been collected by the VR system, the steam is condensed and the vapor is cooled to ambient temperatures. Conventional vapor treatment techniques are used to adsorb or destroy the vapors. However, owing to temperatures resulting from application of ERH, the materials for the construction of the wells and headers must be able to withstand temperatures in the order of 100ºC. VR wells and materials are discussed in Paragraphs 6-3.1 and 6-3.3. 2-2.2.2.4 An ERH power control unit (PCU) is used to convert standard three-phase electrical power to six separate electrical phases (if desired) and to adjust the utility voltage to the appropriate level for subsurface heating. The PCU includes isolation transformers that force ERH current to flow between the electrodes only, preventing ERH current from flowing to a distant electrical sink. Isolation transformers are so named because there is no conductive path between the isolated circuit and the rest of the electrical grid - the energy is transmitted via a magnetic field. Because there is no electrical path through the isolation transformer, electricity cannot leave the ERH field and move away from the site - the current cannot find a return path to complete the circuit. Resistance by the subsurface environment to this flow of electrical current uniformly heats the soil and groundwater between the electrodes. Because electrically conductive intervals can be installed to different depth intervals, and the application of energy to the different parts of the electrode field can be controlled, it is possible to heat separate subsurface zones either independently or in unison. 2-2.2.2.5 The ERH process is typically automated, with an onsite computer equipped with a modem and appropriate software for remote access and monitoring. Multiple applications can be monitored and controlled remote from the remediation site or sites, connected via dial-up modem. Site visits are required for periodic checks of the equipment, maintenance of mechanical equipment, monitoring, manual adjustments to the electrode configurations, and troubleshooting equipment malfunctions. 2-2.2.2.6 The only additive normally required for ERH is a drip source of potable water that is applied to soil immediately surrounding the operational electrodes. This water addition, normally incorporated in low permeability environments, prevents the soil adjacent to the electrodes from drying out and becoming nonconductive. Most aquifers contain sufficient recharge capacity to keep the electrodes moist and conductive throughout the heating process and water addition to the deeper sections of the electrodes is typically not required. 2-2.2.2.7 As the subsurface is resistively heated, contaminants are volatilized and soil moisture and groundwater are converted to steam. The production of steam during ERH operations effectively provides for the in situ steam stripping of VOC contaminants from the soil matrix. By raising subsurface temperatures above the boiling point of the mixture of targeted contaminants and groundwater, ERH significantly enhances the speed and effectiveness of physical contaminant removal. On its own, ERH does not necessarily remove contaminants from the subsurface. Rather, it provides the physical

UFC 3-280-05 31 July 2006
2- 34
conditions that result in the chemical, physical, and biological reactions for their removal from the subsurface. 2-2.2.2.8 The rate of steam formation during ERH is very slow, typically requiring approximately 2 weeks to reach the boiling point of water. Once boiling does begin, it is a very gentle process, comparable to the rate of bubble formation in a glass of carbonated beverage. 2-2.2.2.9 The process of in situ steam generation converts groundwater to steam and then vapor recovery removes the steam from the subsurface. This has the same effect as groundwater pumping. The net result is a slight drawdown of the water table and some measure of hydraulic control. Within the vadose zone, some decrease of soil moisture may occur if the site is covered (preventing rainfall percolation); however, the reduction of moisture observed under ERH applications has not significantly enhanced the vapor permeability of the soil and to date has not been observed to adversely affect soil geotechnical characteristics. 2-2.2.2.10 After the initial heat up to steam temperature, contaminant concentrations in the recovered soil vapors decrease. In a remedial cleanup, when these concentrations decrease by approximately 80% from peak concentrations, electrical resistivity heating typically is stopped and interim groundwater or soil sampling is performed. The analytical results are then evaluated to determine if additional treatment is required. Natural attenuation processes (most importantly intrinsic biodegradation) are also commonly assessed at this time to determine if remediation goals can be attained under post-thermal treatment conditions. Based upon the results of interim sampling, heating can be continued or post-remedial sampling can be conducted to document that the remedial action objectives for soil and groundwater have been met. 2-2.2.3 In Situ and Aboveground Treatment. During heating, pore water increases in volume 1700-fold as it is converted to steam. This has the potential to create fissures in clayey and silty soils, facilitating vapor transport. The steam forms very slowly, so that the formation of fissures is on a very small scale. The high temperatures and application of adequate vacuum and vapor control should prevent downward migration of liquid contaminant via these small fractures. The possibility of such migration may need to be considered in assessing the application of the technology at a subset of sites. 2-2.2.3.1 In situ treatment by ERH involves removal of compounds primarily through increases in vapor pressure, as well as increased intrinsic biodegradation, and increased rate of hydrolysis resulting from temperature increases. 2-2.2.3.2 Above ground treatment typically involves treating vapors, condensate, and entrained water. Vapor treatment involves reducing the moisture content, typically through conventional “knock-out” pot arrangements, followed by appropriate treatment (e.g., granular activated carbon, combustion, thermal oxidation, etc.) prior to atmospheric discharge. Treatment of condensate and entrained water involves condensation and cooling through a cooling tower. The cooling tower in analogous an air stripper, with the vapor fed to the vapor stream treatment equipment. Typically, the
UFC 3-280-05 31 July 2006
2- 35
condensate and entrained water makes multiple passes through the cooling tower, significantly reducing concentrations of volatile constituents. The treated water is then disposed as appropriate for the site (e.g., offsite treatment and disposal, discharge to the local POTW, NPDES-permitted discharge, etc.). 2-2.2.4 Technology Status. ERH is currently widely applied at a variety of sites at both pilot and full-scale. Several vendors offer ERH services, and have the personnel and equipment to address multiple sites concurrently. Appendix B provides summaries of projects to date. 2-2.3 Steam Enhanced Extraction 2-2.3.1 General. Steam injection for hazardous waste site remediation has its background in the petroleum industry where it has been used for enhanced recovery of crude oil from reservoirs. In the oil industry, two modes of steam injection were developed: 1) steam soak, and 2) steam drive. The steam soak approach involved injecting steam into a production well, and holding the steam in the well and formation for a period of time, and then releasing the pressure to resume production from the well. This had the effect of heating up the formation in the vicinity of the well, reducing the viscosity of the oil, and modifying pressures in the oil reservoir to enhance production. Since the collapse of pressure propagated from the well to the formation, there is a net increase in pressure gradient from the formation to the well. 2-2.3.1.1 The steam drive approach involves the use of steam injection wells to “drive” the oil in the reservoir to production wells as an “oil bank” ahead of the injected steam front. For this purpose, on the order of one pore volume of steam is injected into the aquifer to drive the oil to the production wells. Because peak oil production rates may not be observed for years after the start of injection in a steam drive application, steam soaks have been generally favored over steam drives for enhanced oil recovery. The petroleum industry has sought to use steam injection to increase oil production through modifying subsurface pressures, decreasing viscosity, and mobilizing oil from locations that may not have been accessible through gravity drainage. 2-2.3.1.2 For environmental applications, the analogous oil production technique is the steam drive technology. The major difference between petroleum experience and environmental restoration is that the petroleum industry deals with deep, confined condi-tions, whereas environmental remediation projects typically involve shallower, uncon-fined conditions. As such, there are differences in injection pressures and scale of the application, as well as application goals. The use of steam in the oil industry was typically for reduction of viscosity, to induce a pressure gradient and increase the mobility of light oils, typically involving the injection of in the order of one pore volume of steam. In environmental restoration projects, steam injection is used to create a pressure gradient for recovery of fluids, to reduce viscosity, to manipulate formation pressures, and to increase the vapor pressure for vapor as well as liquid recovery. In environmental remediation applications, more than one pore volume of injected steam may be required to attain the desired cleanup criteria. Because environmental remediation applications are typically shallow and under unconfined conditions, injected

UFC 3-280-05 31 July 2006
2- 36
pressures and hence steam temperatures are typically lower than those used in the petroleum industry.
2-2.3.1.3 Figure 2-22 presents simplified steam injection in a pool of volatile organic compounds in the subsurface. The figure illustrates steam injection above the water table for simplicity, but steam enhanced extraction (SEE) has also been successfully injected below the water table.* † ‡ § ** †† The initial injection of steam heats the well bore and the formation immediately surrounding the injection zone of the well. The steam condenses, transferring the latent heat of condensation from the steam to the well bore and the groundwater and the matrix of the formation. As steam injection continues, the hot water (condensate) moves into the formation, pushing the cold (ambient temperature) formation water in advance of this front. When the material surrounding the steam injection point has absorbed sufficient heat from the condensate, steam will begin to enter the formation, pushing ahead of it the cold formation water and hot (condensate) water.
Figure 2-22. Example Sketch of a Steam Injection Remediation System for a Site with both DNAPL and LNAPL, and Multiple Zones of Contamination‡‡
Unsaturated zone
Upper aquifer
Lower Aquifer
Effluent treatment system
Clean air
Clean water
NAPLWater
AirFuel
Extracted liquid and vapor
Steam
Fill
DNAPL
LNAPL
Injection well
Extraction well
Steam generator
Aquitard
Unsaturated zone
Upper aquifer
Lower Aquifer
Effluent treatment system
Clean air
Clean water
NAPLWater
AirFuel
Extracted liquid and vapor
Steam
Fill
DNAPL
LNAPL
Injection well
Extraction well
Steam generator
Aquitard
* Udell, K.S., and L.D. Stewart, Jr. Field Study of In Situ Steam Injection and Vacuum Extraction for Recovery of Volatile Organic Solvents. Department of Mechanical Engineering, University of California, June, 1989. † Newmark, R.L. and R.D. Aines. Summary of the LLNL Gasoline Spill Demonstration—Dynamic Underground Stripping Project, UCRL-ID-120416. Berkeley: Lawrence Livermore National Laboratory, Berkeley Environmental Restoration Center, April 3, 1995. ‡ SteamTech Environmental Services. “Steam Stripping and Hydrous Pyrolysis Pilot Project for the Portsmouth Gaseous Diffusion Plant, Portsmouth, Ohio.” Final Report for DoE #DOE/OR/11-3032&D1, 1999. § Smith, G.J., T.V. Adams and V. Jurka. “Closing a DNAPL Site Through Source Removal and Natural Attenuation.” Proceedings of the First International Conference on Remediation of Chlorinated and Recalcitrant Compounds. 1998. ** Heron, G., D. LaBreque, and H. Sowers. “Steam Stripping/Hydrous Pyrolysis Oxidation for In-situ Remediation of a TCE DNAPL Spill.” Proceedings of the Second International Conference on Remediation of Chlorinated and Recalcitrant Compounds, Monterey, California. Volume C2-5, pp. 149-156, Battelle Press, Columbus, Ohio, 2002. †† Southern California Edison, 2000. Full-scale steam enhanced extraction at Visalia Pole Yard, California (personal communication, Craig Eaker). ‡‡ Heron, G. Personal communication. 2003.
UFC 3-280-05 31 July 2006
2- 37
2-2.3.1.4 From Figure 2-23, the first fluid to come in contact with the compounds of concern is the cold-water bank, which flushes mobile compounds in groundwater. The hot water that follows reduces the viscosity of the NAPL, displacing the compounds of concern by viscous forces, potentially reducing residual saturation and may enhance intrinsic biodegradation of the compounds in groundwater. When the steam front reaches the zone being remediated, additional removal occurs through volatilization, evaporation, and or steam distillation of volatile and semi-volatile compounds.*
2-2.3.1.5 In some cases where the NAPL saturation is high, and the steam injection rate is modest, a bank of NAPL or highly concentrated contaminants can be formed in front of the steam zone. A NAPL bank forms when fluids flowing from the steam zone have displaced the contaminants, or those volatilized from the steam zone were then deposited by condensation at the steam front. The residual compounds volatilized by steam are also added to the bank of compounds being mobilized and condense in advance of the steam front. Studies at University of Stuttgart† and University of California at Berkeley have indicated that the formation of NAPL banks can be eliminated by co-injection of air. Other practitioners use pre-heating of the highly contaminated zones by ERH prior to steam injection to minimize the chance of NAPL bank formation.‡ By heating part of the treatment zone prior to injection of steam, the formation of a cool bank of condensate is prevented. 2-2.3.1.6 After the target zone is heated to near steam temperature, mass removal has been increased by inducing pressure cycling between the injection and extraction wells.§ This is described in Paragraph 2-2.3.2.1. 2-2.3.1.7 Experimental work has shown that liquid phase compounds with boiling points less than that of water can be completely removed from porous media, except for a small amount absorbed into the formation matrix.** Steam is considered effective for liquid hydrocarbon having boiling points up to 175ºC (approximately 350ºF), and can remove 96.8 to 99.9% of #2 fuel oil and jet fuel, given sufficient number of pore volumes of injected steam.†† Applications of greater volumes (i.e., greater than one pore volume) of steam can result in further reduction in concentration in groundwater and the aquifer matrix. One -dimensional laboratory experiments have shown that compounds, or mixtures of compounds with boiling points of up to 300ºC, were removed by continuing steam injection past its breakthrough point (i.e., one pore volume).‡‡
* Stewart, L.D. and K.S. Udell. “Mechanisms of Residual Oil Displacement By Steam Injection.” SPE Res. Eng. 1233-1424: November 1988. † Schmidt, R., C. Betz, and A. Farber. Behaviour During Steam Injection into the Unsaturated Zone. Institut Fur Wasserbau Universitat Stuttgart, Pfaffenwaldring Stuttgart, Germany: LNAPL and DNAPL, 61, D-70569: 1998. ‡ Heron, personal communication, 2003 § Udell, K.S. N. Sitar, J.R. Hunt, and L.D. Stewart. “Process for In Situ Decontamination of Subsurface Soil and Groundwater.” United States Patent # 5,018,576, 1991. ** Hunt, J.R., N. Sitar, and K.S. Udell. “Nonaqueous Phase Liquid Transport and Cleanup, Experimental Studies.” Water Resour. Res., 24(8): 1259-1267, 1988. †† Hadim, et. al., 1993 ‡‡ Udell, K.S. and R. McCarter. Treatability Tests of Steam Enhanced Extraction for the Removal of Wood Treatment Chemicals from Visalia Pole Yard Soils. Report prepared for Southern California Edison by Berkeley Environmental restoration Center, University of California Berkeley, Berkeley, CA, 1997.
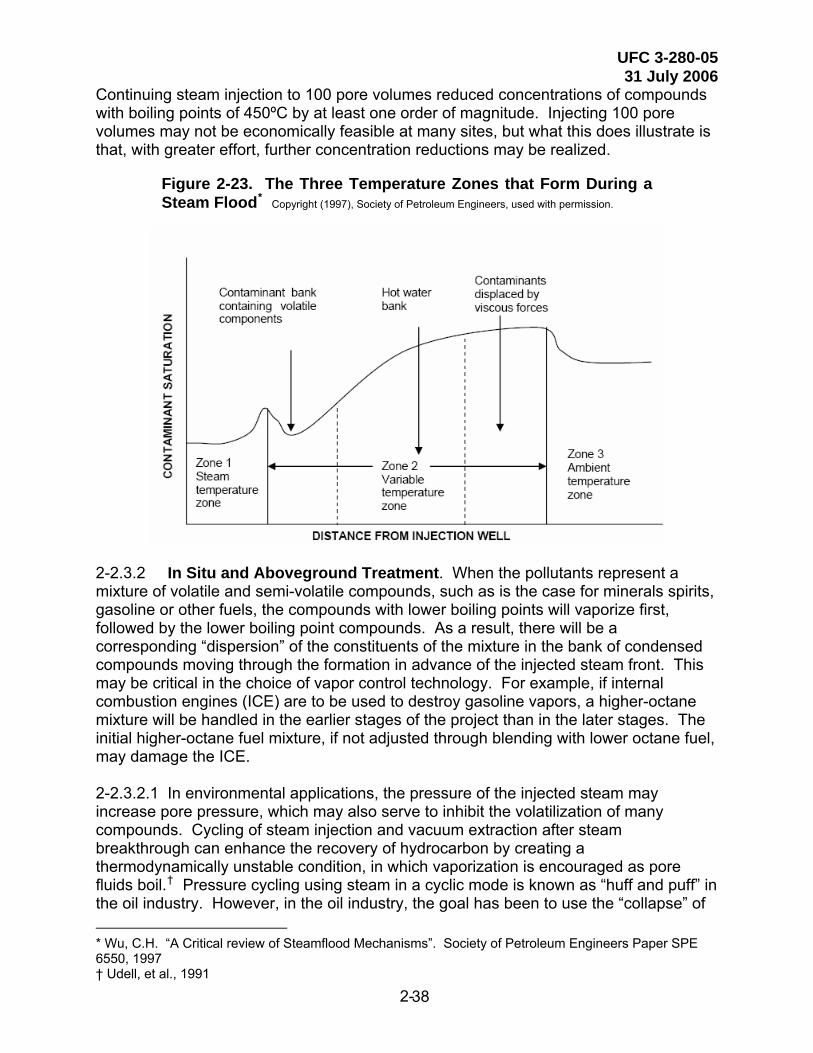
UFC 3-280-05 31 July 2006
2- 38
Continuing steam injection to 100 pore volumes reduced concentrations of compounds with boiling points of 450ºC by at least one order of magnitude. Injecting 100 pore volumes may not be economically feasible at many sites, but what this does illustrate is that, with greater effort, further concentration reductions may be realized.
Figure 2-23. The Three Temperature Zones that Form During a Steam Flood* Copyright (1997), Society of Petroleum Engineers, used with permission.
2-2.3.2 In Situ and Aboveground Treatment. When the pollutants represent a mixture of volatile and semi-volatile compounds, such as is the case for minerals spirits, gasoline or other fuels, the compounds with lower boiling points will vaporize first, followed by the lower boiling point compounds. As a result, there will be a corresponding “dispersion” of the constituents of the mixture in the bank of condensed compounds moving through the formation in advance of the injected steam front. This may be critical in the choice of vapor control technology. For example, if internal combustion engines (ICE) are to be used to destroy gasoline vapors, a higher-octane mixture will be handled in the earlier stages of the project than in the later stages. The initial higher-octane fuel mixture, if not adjusted through blending with lower octane fuel, may damage the ICE. 2-2.3.2.1 In environmental applications, the pressure of the injected steam may increase pore pressure, which may also serve to inhibit the volatilization of many compounds. Cycling of steam injection and vacuum extraction after steam breakthrough can enhance the recovery of hydrocarbon by creating a thermodynamically unstable condition, in which vaporization is encouraged as pore fluids boil.† Pressure cycling using steam in a cyclic mode is known as “huff and puff” in the oil industry. However, in the oil industry, the goal has been to use the “collapse” of * Wu, C.H. “A Critical review of Steamflood Mechanisms”. Society of Petroleum Engineers Paper SPE 6550, 1997 † Udell, et al., 1991

UFC 3-280-05 31 July 2006
2- 39
the formation pressures around the well during a steam soak to create a higher-pressure gradient around the well to promote flow of oil. 2-2.3.2.2 For sites contaminated by volatiles, the goal of cyclic steam injection is to create temperature and pressure changes that promote volatilization of volatile organic compounds, so the contaminants boil out and are recovered by vacuum extraction. After steam breakthrough, the steam injection is discontinued, while maintaining vapor and groundwater recovery. This reduces the effective air pressure in the formation, resulting in rapid evaporation of water and contaminants, as the formation releases energy by boiling to reach equilibrium at a lower pressure and temperature. 2-2.3.2.3 For sites contaminated with semi-volatile or non-volatile chemicals, such as creosote, pressure cycling is used both to enhance vaporization of the lighter fractions of contaminants, and to induce mixing of injected steam and air with the contaminated groundwater. This may stimulate both dissolution of NAPL phases into the groundwater, and degradation reactions that take place under aerobic condition at elevated temperatures (HPO or biological degradation). Also, at creosote sites, the pressure cycling may enhance liquid phase NAPL displacement and removal as a NAPL by mechanisms similar to those used in enhanced oil recovery. Steam breakthrough at all extraction wells is not necessary to operate in a cyclical mode. This technique has been applied at a variety of locations at a remediation site under differing conditions.* For example, at one location, a void resulting from a previously undetected abandoned catch basin did not provide for steam break through at a nearby recovery well. As the injected steam exited from the soils into the void, the resulting pressure drop is believed to have resulted in cooling of the steam. The steam generators that were being used could not provide sufficient steam to pressurize the void, such that steam breakthrough was not observed at the recovery well. However, operation in a cyclic mode greatly improved the removal of volatile organic compounds and improved the heating of the area. At another location at the same site, cyclic operations resulted in the observation of a “solvent bank” being produced from a recovery well, where steam breakthrough had not been previously observed.†
2-2.3.2.4 Other steam injection projects that have used pressure cycling to enhance mass removal include:
• Solvent Services, San Jose, CA.‡ • Livermore Gas Pad.§ • Visalia Pole Yard, Visalia, CA.** • Alameda Point, Alameda, CA.††
• Portsmouth Gaseous Diffusion Plant, Piketon, OH.‡‡ *
* Smith, G., D. Fleming, V. Jurka, and T. Adams. “Closure of a Trichloroethene and 1,1,1-Trichloroethane DNAPL Remediation Using Thermal Technologies.” Proceedings of the Second International Conference on Remediation of Chlorinated and Recalcitrant Compounds. Monterey, CA, May 22-25, 2000. † Smith, personal communication, 2003 ‡ Udell and Stewart, 1989 § LLNL, 1994 ** Craig Eaker, personal communication, 2000 †† Udell and Heron, manuscript in preparation ‡‡ SteamTech Environmental Services, 1999
UFC 3-280-05 31 July 2006
2- 40
• Savannah River Site, Aiken, SC.† • Edwards Air Force Base Site 61, Edwards, CA.‡ • Loring Quarry Site, Limestone, ME.§ • Pinellas STAR Center, Pinellas, FL.**
2-2.3.2.5 At some sites, air is injected to create conditions for direct oxidation. After steam breakthrough, hot air is injected or drawn into the formation by the vapor recovery system. Many compounds are more susceptible to oxidation at higher concentrations. This provides a means of in situ destruction of residual compounds that may not be easily removed through steam injection. 2-2.3.2.6 In summary, there are four main removal mechanisms employed in steam injection for which recovery of pollutants can be made:
• Physical displacement of NAPL as the steam migrates from injection to extraction wells (the contaminants are mobilized owing to reduction in viscosity and interfacial tension, and mobilized via hydrodynamic forces).
• Vaporization and extraction as a vapor phase (boiling of the NAPL or volatilization of dissolved and adsorbed contaminants).
• Solubilization and condensation of contaminants with subsequent removal in the dissolved state by the groundwater extraction system.
• In-situ destruction attributable to either chemical or biological reactions. 2-2.3.2.7 At the field scale, the mechanisms listed above may occur simultaneously, and often cannot be identified individually. However, simple monitoring and sampling can help to identify the dominant mechanisms, and to optimize the mass removal and remedial results. This optimization involves adjusting the steam injection strategy, deciding on the duration of pressure cycling, determining whether to coinject air or oxygen, and adjusting the groundwater and vapor extraction rates. 2-2.3.3 Technology Status. In 1991, the application for the first patent for steam injection for environmental restoration was submitted.†† It was first applied in the field at the Solvent Services, Inc., site in San Jose, California, in 1988. This involved a demonstration using a single recovery well surrounded by six injection wells and was used to remove a wide variety of compounds. In general, the following statements can be made for the status of steam injection for remedial purposes:
* Heron et al., 2002 † Integrated Water Resources. Deployment of a Steam Injection/Extraction System at LC34, Cape Canaveral Air Station, as part of the Interagency DNAPL Consortium Demonstration, Final Report. Prepared for MSE-Technology Applications Inc., March 2003. ‡ Earth Tech, Inc. and SteamTech Environmental Services, Inc. Site 61 Treatability Study Report, Steam Injection, Draft Final. Prepared for U.S. Air Force, April 2003. § Davis, 2003 ** Heron, personal communication, 2003 †† Udell, et al., (1991)
UFC 3-280-05 31 July 2006
2- 41
• For gasoline and chlorinated solvents such as TCE, and PCE, both pilot tests and full scale remediation in porous media have shown great promise for increasing mass removal compared to traditional techniques, and for achieving very low concentrations in soil and groundwater.
• For oils such as JP-4, kerosene, and motor oil, removal of the bulk of the mass is possible. However, the evidence gathered so far indicates that the treatment will be less effective for the heavier components of the oil, owing to their lower volatility and mobility as a fluid. Therefore, while the mobile fractions of the oils can be removed, and the groundwater quality greatly improved, the soil concentrations of TPH may still be above background concentrations following treatment (e.g., Alameda Point, CA).
• For wood-treating chemicals such as creosote and PCP, laboratory studies show that partial to complete NAPL removal is possible, and that the lower boiling point compounds such as naphthalene and PCP can be effectively treated using more steam and longer treatment time than used for chlorinated solvents. Field evidence from Visalia Pole Yard indicates that mass removal can be highly effective, and that it is possible over several years of treatment to lower the groundwater concentrations of the risk-driving chemicals (in this case pentachlorophenol [PCP] and naphthalene), thereby significantly reducing the impact to down-gradient water recipients.
• Fractured rock studies conducted in 2002 indicate that NAPL sources can be eliminated in relatively weathered rock settings such as Edwards AFB,* and that it is possible to accelerate mass removal from sparsely fractured, complex sites such as the Loring Quarry site, Maine.† However, so far, steam injection in fractured rock settings have only been tested at these two locations in the United States, and conclusions regarding remedial end-points are still not available.
• Concerns about formation of a NAPL bank, and possible downward migra-tion of contaminants, have so far been eliminated either by co-injection of air with the steam, or by pre-heating part of the treatment zone prior to steam injection. Soils have been pre-heated using ERH techniques. This will increase project costs to some degree, and the economic impacts of this should be assessed.
• Steam injection equipment is readily available, and can be rented or purchased based on the duration of the project.
• Extraction and treatment systems for vapor and water are relatively straight-forward for sites with chlorinated solvents, and complex for wood-treating sites where high naphthalene concentrations, the presence of polar compounds such as PCP, the presence of dioxins and furans, and the presence of heavy metals such as chromium and arsenic in the extracted fluids, complicate treatment and separation.
• Several new areas are being investigated for steam injection as a remedial technique. These include the use of air and oxygen to enhanced in-situ destruction reactions (biological or chemical, such as hydrous pyrolysis oxidation), use of single-well treatment schemes for small sites (Beale AFB)‡ and innovative pressure cycling modes for difficult fractured rock sites.§
* Heron, personal communication, 2003 † Davis, 2003 ‡ Heron, personal communication, 2003 § Heron, personal communication, 2003
UFC 3-280-05 31 July 2006
2- 42
2-3 UNAVOIDABLE AND POTENTIAL EFFECTS. The use of ISTR may result in detrimental impacts to both the treated area and the surrounding vicinity. These impacts may be considered significant and need to be evaluated on a site-specific basis. At many sites, the potential effects of ISTR are of little to no significance compared to the ongoing negative impact of site contamination. In some cases, these potential effects may require engineering controls, mitigation, or modification of the ISTR approach. In other cases, the economics or logistics of implementing the ISTR technology may be so profoundly affected by these impacts that ISTR may be inappropriate. 2-3.1 Ecological Impacts. The use of heat to remediate the undisturbed soil will affect the biological community within the treated volume and impacts may extend outward from this zone due to the conduction of heat to surrounding soils. Both microorganisms and larger organisms may be directly affected in the treatment zone. 2-3.1.1 Microbiological Impacts. Microbial communities will be heavily skewed toward mesophiles and thermophiles during and following ISTR. The predominant species under ambient conditions will be significantly diminished in the treated volume. This effect, though diminished in intensity, will extend outward from the treated volume as temperatures rise in the surrounding soils. Soil drying that takes place during conductive and electrical resistivity heating reduces the active populations of all microorganisms where the drying occurs, but may enhance the activity outside of these areas. High temperatures associated with thermal conductive heating may locally sterilize the soil or at least force the organisms into an inactive state. 2-3.1.2 Impacts on Higher Organisms. Lesser multi-celled organisms, such as worms and insects, will be killed or driven from the treated volumes and from the surrounding soils that experience temperature increases to levels outside those tolerated by the species. Burrowing mammals will be forced from the treated zone, and the noise and activity will further drive them from the surrounding vicinity. Animals that prey on the lower species may see an impact on their hunting success. In cases where the impacted species are threatened or endangered, a biological survey and relocation of at least some of the species may be necessary. However, it was also observed that, during the steam injection and later ERH applications in Skokie Illinois (an urban mix of industrial commercial and residential land uses), small mammals and birds were drawn to the treatment area by the warmth, especially during winter.* 2-3.1.3 Vegetation and Habitat Impacts. The heat and construction will destroy vegetation within and near the treatment area and the site restoration activities may need to include revegetation for aesthetic or ecological reasons. Site activities may need to avoid certain areas to protect unique habitat or engineering controls may be needed to prevent heat-related impacts from propagating into certain areas. However, it has also been observed that vegetation flourishes at the fringe of ISTR applications and in the treatment area after completion. Weed control in the fringe of the treatment area may be an issue during longer-term applications of ISTR.
* Smith, Personal communications, 2003.
UFC 3-280-05 31 July 2006
2- 43
2-3.1.4 Aquatic Habitat. ISTR applications adjacent to surface water bodies are difficult owing to the heat losses that would occur. The implementation of ISTR adjacent to or under aquatic habitat may be particularly disruptive to the ecological community. Many benthic and free-swimming species are sensitive to water temperatures. The conductive loss of heat to the water or the discharge of hot groundwater to surface water bodies may result in elimination or diminishment of certain species, while the heating of the water may enhance the growth of others. Engineering controls to minimize heat loss may be necessary, ranging from alternate injection and extraction point layout (that emphasize extraction near the water bodies to be protected), to barriers for both water and heat flow (low permeability and thermal conductivity clay barriers) to extreme measures such as soil refrigeration near the water bodies. 2-3.2 Physical Impacts. The use of heat will also significantly affect the physical characteristics of the soil, groundwater, and buried objects. Potential impacts and remedies are discussed below. 2-3.2.1 Soil Impacts. The drying that may occur with electrical resistivity heating*
and thermal conductive heating may affect the engineering properties of the soils. In cases where the soils are expansive, the drying has the potential to cause shrinkage and desiccation, which may affect nearby or overlying structures. Dewatering associated with thermal remediation may result in consolidation of the soils, which also may result in some subsidence, potentially damaging foundations. Soils may require rewetting following ISTR. Some engineering properties may not be the same following rewetting. Injection of steam at pressures that approach the overburden pressure potentially could fracture the soils, possibly causing ground heaving, structural damage, and steam breakout in unexpected places. Changes in moisture content may affect the bearing strength of soils, threatening foundation stability. 2-3.2.1.1 Moisture content was measured in soils prior to and after ERH treatment at a site containing clay soils in the metropolitan Chicago area, where ERH was used to remove trichloroethene DNAPL from a dense glacial clay till. The minimum measured moisture content was reduced from a range of 10 - 11% to 8 - 9%, but the maximum measured moisture content was actually higher in the set of post-treatment samples compared to the pre-treatment set of samples. The post-treatment samples with the lowest moisture contents were measured in the 1.5 – 2.7 m (5 to 9 ft) depth interval. Monitoring during remediation showed that this depth interval was in the vicinity of the water table and was in fact de-watered as part of the remediation. 2-3.2.1.2 While hardly a comprehensive study, this data appears to indicate that only soils at or near the water table experience a reduction in moisture content. Soils in the saturated zone showed less variability in moisture content compared to the samples obtained from the water table and above in the post-treatment sampling. Soils in the vadose zone do not appear to experience significant moisture loss since steam continues to rise from the water table throughout the treatment period. However, the
* During the application of ERH methods, the reduction in moisture content appears to be restricted to depths at or around the water table (Smith, 2003, personal communication, 2003).
UFC 3-280-05 31 July 2006
2- 44
post-remediation moisture content values show a greater variability than the pre-remediation values. Therefore, if soil shrinkage were to occur, it would be in a zone experiencing de-watering in the vicinity of the water table. The project manager would need to evaluate potential shrinkage at the depth of the water table and capillary fringe and impacts to foundations also found in the vicinity of the water table. 2-3.2.2 Groundwater and NAPL Impacts. Groundwater withdrawal from the site as part of ISTR may reduce water resources available to nearby groundwater users. Reinjection of treated water may be necessary to sustain adequate supply. Groundwater in contact with the treated zone (both during and following treatment) will transport heat away from the site. These higher temperatures may persist for some distance down-gradient of the site and affect water resources used by others. The higher groundwater temperatures can also alter geochemical conditions. The solubility of many materials is modified by temperature, which may increase the dissolved solids, including silica, or may cause others to precipitate near the treated zone. These impacts are generally unavoidable unless steps are taken to prevent groundwater contact with hot and warm soils, or unless groundwater does not naturally contact warmed soil. NAPL often undergoes significant physical change at elevated temperatures, many of which enhance mobility. If migration is not controlled adequately by the design of the recovery system, the NAPL may migrate away from the treated zone. The increased mobility of NAPL outside the treatment zone (due to heat loss to surrounding soils) may result in unwanted NAPL migrating to adjacent or deeper soils or to surface water bodies. The recovery system design can be modified in most cases to assure such migration is controlled. 2-3.2.3 Impacts on Buried Objects and Utilities. Heating soils that contain buried utilities risks damage to them both from heat and electrical currents and fields. Plastic piping, electrical lines, and communication cables may be particularly susceptible to damage. Furthermore, the utilities may be a pathway for steam, vapors, or hot air to migrate to buildings or other facilities and, as such, may be a safety consideration. All ISTR remediation sites must be carefully surveyed for buried utilities prior to treatment. Utilities may need to be rerouted prior to treatment. Subsurface utilities may also allow water to accumulate within sewers or utility backfill after precipitation events, providing localized cooling of soils, which may result in condensation of VOCs, in turn providing localized zones for VOC accumulation during treatment. For example, an application of ERH in the Chicago area involved treating soils in a sub-grade loading dock. The sub-grade loading dock represented the lowest point onsite, hence the location to which water drained. Storm sewers were redirected away from the treatment area prior to the start of treatment. However, the building roof drains and downspouts did not sufficiently direct water away from the building foundation during precipitation. As a result, even though drainage within the loading dock was redirected, water infiltrated the area after each precipitation event. This had the effect of cooling the near surface soils, condensing the vapors, and creating local zones of accumulation for the condensed VOCs.
UFC 3-280-05 31 July 2006
3-1
CHAPTER 3
SITE CHARACTERIZATION FOR ISTR TECHNOLOGY SCREENING AND DESIGN 3-1 INTRODUCTION. This chapter describes the site characterization data necessary for screening and designing remediation systems using the three ISTR technologies that are the subject of this UFC. ISTR techniques can be used for a variety of applications where providing heat accelerates physical, chemical, and biological reactions to affect remediation. The most common applications of ISTR technologies to date are for source treatment, where non-aqueous phase liquids are encountered. As a result, this will be the perspective used in this UFC.* This UFC does not focus on describing, or prescribing, the most appropriate investigative techniques, but instead presents the data requirements for designing and implementing the three ISTR methods. The project engineer/manager must then determine the most appropriate means to obtain the required information based on project objectives, site constraints, and budget. 3-2 DATA COLLECTION REQUIREMENTS TO SUPPORT REMEDY SELECTION AND DESIGN. To adequately characterize a site for remediation, a conceptual site model should be developed that explains the distribution of the contaminants in the subsurface (defining treatment area and depth). The basic elements of the conceptual model are the nature and extent of the plume, the extent of the source zone, and locations of known or suspected NAPL. In developing a conceptual site model, an understanding of the geological history is also important to help explain the distribution of the contaminants in the subsurface. For example, in glaciated terrains, multiple advances and retreats of glaciers leave behind separate till units (that may or may not be readily differentiable). At many locations in the Chicago area, till units may be separated by an inter-till layer, typically containing sand and gravel in the order of a few inches to 2 ft (0.015 to 0.61 m) thick. Because these inter-till layers may be thin, they may be missed or ignored in the logging of the boreholes. However, inter-till layers have been observed to be zones of accumulation and migration of NAPL. The development of the site conceptual model also involves groundwater flow, subsurface stratigraphy (boundaries between till units, inter-till deposits), joints and fractures in tills, mineralogy, and manmade influences (groundwater pumping, artificial conduits or barriers such as building footings, subsurface fill, abandoned foundations, fill material, proof-rolled soil surfaces, caissons, sheet piling, and subsurface utilities). 3-3 SITE PHYSICAL PROPERTIES AND SITE CONDITIONS. As with other in situ technologies, when evaluating the application of ISTR technologies, one should
* ISTR methods (ERH) have also been used to enhance biodegradation in Alaska, and to reduce aqueous phase concentrations to facilitate the sale of a commercial property in Washington State. It is also believed that in situ thermally enhanced hydrolysis represented a significant destruction mechanism for a methylene chloride cleanup in Waukegan, IL. As well, ISTR methods are also used for in situ destruction through oxidation and hydrolysis pyrolysis oxidation.

UFC 3-280-05 31 July 2006
3-2
acquire and evaluate information regarding the physical properties and conditions of the site. Physical site information needs include:
• Description of the site and setting, including a scaled site plan. • Stratigraphic features. • Hydrogeological and hydraulic parameters. • Accessibility of the area to be treated. • NAPL volume estimates. • Evaluation of contaminant mobility to determine cost-effectiveness of
ISTR. 3-3.1 Description of Site Including Site Plan. To adequately design a remediation system, one of the most basic needs is for scalable maps of the site. The maps should have surveyed locations of site features, including utilities (above and below ground), surface features (e.g., paved surfaces, creeks, rivers, overhead lines), natural subsurface features such as bedrock faulting and joint orientation, neighboring facilities, and locations of buried features (underground storage tanks, subsurface vaults, abandoned foundations, pipelines, etc.). These maps are used to present and interpret data from the site characterization, and to lay out the remedial design. Further, the survey information needs to be field checked for accuracy prior to or during the design phase. 3-3.2 Stratigraphic Features. Stratigraphic features are typically depicted in boring logs and or geological cross-sections. Information from these sources should include soil type, rock type, observations on fractures and joints, mineral infilling of fractures and joints, depth to groundwater, location of perched zones, piezometric information, contaminant distribution, and stratigraphic boundaries. Some information may be collected or confirmed as part of the installation process. Information on stratigraphic boundaries should also carry with it an understanding of geological history. For settings were there have been multiple glacial advances and retreats, the stratigraphic boundaries between the till zones may have associated with it thin layers of ablation material from the glaciers or glacio-fluvial or glacio-lacustrine deposits. These may provide zones for NAPL accumulation, and may also provide zones to focus treatment, providing zones of elevated permeability for steam injection in an otherwise clayey sediments. 3-3.3 Hydrogeologic and Hydraulic Parameters. In heating the subsurface, it must be recognized that the specific heat capacity of water (4.21 kJ•kg–1• ºC–1) is more than four times greater than the rock or soil matrix (1.0 kJ•kg–1• ºC–1). Therefore, to control the cost of the remediation, it is important to minimize the flux of groundwater into the treatment zone to minimize heating water. Groundwater velocity is a key design factor in the design of ISTR systems. A good understanding of groundwater velocity and flow, and potentially more detailed hydrogeological information on well yield and distance–drawdown relationships from pump tests are parameters for input into selecting the appropriate ISTR technique and designing a successful ISTR application.

UFC 3-280-05 31 July 2006
3-3
Hydraulic conductivity is an important input parameter for steam injection to estimate the steam injection and fluid recovery rates. Soil permeability is less critical in thermal conduction and ERH applications, but is important to design vapor recovery systems. When soil is completely dried by the thermal conduction process, even tight soils develop sufficient permeability for removal of contaminants. 3-3.4 Site Accessibility. Site accessibility can determine the ease or difficulty of implementing an in situ remediation technique, which affects cost and feasibility. These accessibility issues include obstacles to drilling, such as low overhead clearance because of ceilings, obstructions, and power lines, or steep slopes that do not allow conventional drilling rigs that would be used as part of the installation of ISTR systems to safely operate.
Constraints on construction activity also need to be determined. Access, noise, dust (during construction), length of working hours, and odors all may be restricted, and personal protective equipment may be required. Operation of ISTR systems during winter may melt snow that has the potential to run-off from the site on to traveled ways. Care must be taken to prevent hazards resulting from the implementation of the remediation effort. 3-3.5 NAPL Location and Volume Estimates. Each of the ISTR technologies may be implemented in a modular fashion, and as a result, it may be only necessary to know the extent of the zone to be treated relative to the dimensions of the module of the particular technology to be used. For instance, if using ERH, the distance between electrodes is typically, 2.6 to 6.1 m (8.5 to 20 ft).* Therefore, the lateral extent of the area containing NAPL need only be defined to this level of accuracy (i.e., ± 8.5 to 20 ft; ± 2.6 to 6.1 m). In many cases where the extent of the NAPL is uncertain, it may be less expensive to simply expand the array of heater wells/electrodes/wells to account for the uncertainty, rather than to further characterize the spill. It is good practice to sample the soils from the perimeter heater wells/electrodes/wells as confirmation of adequate coverage of the treatment area. Estimating NAPL volume is typically an exercise involving broad simplifying assumptions with uncertain results. The mass of NAPL removed or recovered or destroyed typically exceeds NAPL estimates. However, NAPL volume should be estimated to at least approximate the volumes that can be expected to be recovered. The reason for this is fourfold: 1) for permitting purposes to estimate organic discharges from the remediation system; 2) to determine the most appropriate and cost effective air quality control technique; 3) to budget for the air quality control treatment; and 4) to indicate for the project engineer and manager the mass to be produced to compare against the conceptual site model. If the recovered NAPL volume greatly exceeds the calculated volume, the engineer may need to re-evaluate his or her site
* At several ERH sites because of site conditions and the compounds being treated, the spacing has been considerably closer (e.g., 2.74 m at Lowry AFB North Pit, Denver, CO [Greg Beyke, TRS, personal communication]; 4 to 6 meters at ‘Inhabited Residential Apartment Building’ [McMillan & McGee, per Bruce McGee, 2002, USEPA-TIO NAPL conference, Chicago, IL]; and ~1.5 to 3 m at ICN Pharmaceutical Portland, Oregon [CES, per J. Sutter of ODEQ, 2002, USEPA-TIO NAPL conference, Chicago, IL].
UFC 3-280-05 31 July 2006
3-4
conceptual model and assess impacts on schedule and budget. Alternate sources of NAPL may be present that were not identified in the site characterization. This may influence the length of remediation time and, hence, the budget. If the quantity is significantly less than calculated, the remediation engineer should evaluate the effectiveness of the recovery technique or techniques. There may be blockages in the piping and treatment equipment (e.g., condensate buildup in the carbon canisters) that are affecting the determination of the recovered mass. If poor recovery is taking place, this also affects the length of remediation time and, hence, the budget. 3-3.6 Evaluation of Contaminant Mobility. ISTR techniques have the potential to mobilize NAPL. If heating can significantly change the physical characteristics of the NAPL, the remediation engineer must ensure that it can be captured. Therefore, NAPL characteristics such as specific gravity and changes in viscosity with temperature should be measured to appropriately design the recovery system. 3-4 CHEMICAL ANALYSES AND CONTAMINANT PROPERTIES. Chemical analyses required for ISTR techniques include conventional analyses for VOCs and SVOCs (in both soil and groundwater) to define the extent of the compounds of concern and to estimate the organic loading to the vapor treatment equipment. Additional analyses should also be done to address issues that may affect the operation or effectiveness of the remediation system. 3-4.1 Organic Parameters. Concentrations of target and non-target compounds need to be evaluated to determine the loading and to properly design the treatment system. Non-target compounds may impact the effectiveness of the remediation. For example, VOC evaporation rates will be slowed if the target contaminant is dissolved into oil or grease, as described by Raoult’s Law. A parameter that is typically overlooked for active in situ remediation applications is total organic carbon (TOC). The TOC content of the soil influences lower-temperature methods of in situ remediation (i.e., ERH and shallow SEE applications) because TOC preferentially adsorbs VOCs that may be present in the subsurface. 3-4.2 Inorganic Parameters. Concentrations of major anions and cations in groundwater are important in evaluating treatment options. Calcium and iron compounds may precipitate on well screens and treatment equipment during heating, affecting maintenance and, potentially, feasibility. At the high temperatures that can be achieved using thermal conduction, anions such as carbonates can provide in situ buffering capacity for the acidic products of in situ destruction of chlorinated hydrocarbons (HCl). 3-4.3 NAPL Characteristics. The characteristics of the NAPL need to be known prior to selecting and designing an ISTR application. Characteristics include specific gravity, interfacial tension, viscosity, vapor pressure, and aqueous solubility, including
UFC 3-280-05 31 July 2006
3-5
variability with temperature. Many of these characteristics may be obtained from literature sources. 3-4.4 Trends in Dissolved Phase Compounds. If the site to be remediated has historical groundwater monitoring data associated with it, the remediation engineer should evaluate concentration trends. These concentrations trends can be used to evaluate whether natural attenuation is taking place, whether investigations have mobilized NAPL, and the effectiveness of a pre-existing remediation system (which may provide insight into the probability of success for the ISTR method to be implemented). Further, historical concentration trends may provide insight into the presence of NAPL (especially at sites where it may not have been physically observed) to appropriately place the ISTR system. Upon initial heating, concentrations of most VOCs in groundwater will increase in the zone being heated until the temperature of the water reaches the eutectic point of the azeotropic mixture. As temperatures increase beyond this point, concentrations will decline. Therefore, groundwater concentrations can be expected to vary over the period of the ISTR application and it will be necessary to determine if there will be potential adverse effects and engineer the remediation system accordingly. 3-5 DATA NEEDS SPECIFIC TO EACH TECHNOLOGY 3-5.1 Thermal Conductive Heating. TCH is the least sensitive of any in situ remediation technology to variations in soil type* and total dissolved solids in groundwater. This is because thermal conductivity varies by only a factor of ±2 for a wide range of common earth materials. This lack of variability in soil heat conductivity is one of the key factors in the versatility of ISTD. 3-5.1.1 There is no practical limitation to the geometry of the TCH treatment zone, i.e., it can be thin, irregular, or deeper than 30 m. Nor does the presence of subsurface debris, such as concrete walls, tanks, or landfill debris (including metallic objects), impede thermal conductive heating. Site characteristics do, however, influence TCH design. For example, treatment of shallow contamination requires that an insulating surface cover be installed to manage heat losses. Shallow contamination may be addressed more cost-effectively by using fewer long horizontal heaters placed in trenches than by employing numerous short vertical heater wells. Lithology does affect the choice of drilling methods, with direct-push commonly used for heater-only wells, and auger methods for heater-vacuum wells. Subsurface debris may also affect drilling methods for the installation of heater wells. High permeability zones can affect the ability to achieve superheated temperatures, if needed, and may dictate the need to employ measures to control recharge into the treatment zone. Treatment of VOCs with ISTD TCH, by contrast, is much less affected by recharge zones, and can be readily performed below the water table except in highly permeable aquifers. Generally, the upper limit for hydraulic conductivity is approximately 10–3 cm/s.
* Vapor recovery may be influenced by soil type and variations in lithology
UFC 3-280-05 31 July 2006
3-6
3-5.1.2 The electrical load of a thermal conductive heating system is comparable to what is typically available at industrial or commercial sites. 3-5.1.3 The overall size of the treatment zone is an important site characteristic. As with other on-site treatment technologies, economies of scale affect treatment costs, such that large sites exhibit much lower unit costs, whereas very small sites may be more cost-effectively addressed by other means such as excavation. 3-5.1.4 As with other ISTR technologies, site information needs for ISTD include:
• Concentrations and characteristics of COCs. • Extent of contamination (lateral and vertical). • Approximate location, nature, and extent of free product or “neat” contami-
nant. • Concentrations of non-target contaminants that may contribute to the load-
ing on off-gas treatment equipment, e.g., granular activated carbon. 3-5.1.5 As a result of the high temperatures achieved using ISTD TCH, inorganic groundwater chemistry can have significant effects. That is, concentrations of anions, such as carbonates, can provide in situ buffering capacity, where the in situ destruction of chlorinated hydrocarbons has the potential to produce hydrochloric acid (HCl). If there is insufficient buffering capacity, the lowered pH must be considered in the selection of piping and treatment equipment materials and possibly in the treatment processes. 3-5.1.6 Because ISTD TCH can be used to treat a wide variety of organic (and some inorganic) contaminants in a range of settings, the data needs vary depending on the remedial context. Four general categories of applications include:
• Vadose zone VOCs. • Vadose zone SVOCs (may include VOCs). • Saturated zone VOCs. • Saturated zone SVOCs (may include VOCs).
3-5.1.7 Although soils above the water table (i.e., in the vadose zone) and below it can both be treated with TCH, measures will need to be taken to control the rate of water recharge into the thermal treatment zone, particularly below the water table, in the event that the recharge rate is too high. Such measures can include dewatering with wells or trenches, and installation of hydraulic barriers, such as steel sheeting, slurry walls, jet-grout walls and freeze walls, keyed into an underlying aquitard. These actions may have a significant cost impact on the project. A key information requirement for TCH, especially below the water table, is data allowing estimation of recharge rates, including permeability and hydraulic gradient, and spatial variations in the treatment zone. The results of pumping tests are particularly relevant.
UFC 3-280-05 31 July 2006
3-7
3-5.1.8 Although ISTD TCH typically destroys approximately 95 to 99% of the contaminant mass in situ,* the contaminant category and concentration as well as emission standards are of importance as they dictate the selection and design of aboveground Air Quality Control equipment. 3-5.2 Electrical Resistivity Heating. The application of ERH is not sensitive to variations in site lithology in achieving even heating.† Some soils or zones of groundwater with total dissolved solids above background concentrations may heat preferentially to others as the treatment volume is heated up. However, as the soils tend to warm toward the limiting threshold of the boiling point of water, soils that may have lagged in the rate of temperature increase also rise in temperature to the boiling point of water. A key role of site lithology in ERH applications is the influence on how NAPL migrates and accumulates, which should be evaluated prior to implementing the remediation. Important information required for site characterization and technology screening includes:
• The area and depth of the remediation. • The contaminant characteristics—especially boiling point, water solubility,
and hydrolysis rate. • The contaminant percent reduction required. • The total organic carbon (TOC) content of the soil. • The presence of low volatility co-contaminants such as oil and grease. • The location of subsurface utilities.
3-5.2.1 Other common site information can refine technology selection and design, but generally does not affect cost or effectiveness significantly. This information includes:
• Soil lithology (to identify subsurface features that may retard migration, or accumulate NAPL).
• Soil saturation or moisture content. • Presence or absence of separate phase NAPL. • Soil and groundwater electrical (e.g., specific conductance of
groundwater) or thermal properties (and delineation as to where these may vary). 3-5.2.2 Because the treatment interval is typically uniformly heated, information regarding the precise distribution of contamination or NAPL is not required. However, it is important to have enough contaminant distribution information to allow designation of a “box” or boundary that includes the contaminant mass to be treated. The remediation boundary can be irregular and the depth interval can vary across the site. If extensive treatment of the upper 2 feet of soil is required, this adds to the cost owing to heat losses to the atmosphere. If extensive (greater than 90%) reduction of such shallow VOCs is required, an insulating surface blanket is often used to achieve higher
* Stegemeier, G.L. and H.J. Vinegar. “Thermal Conduction Heating For In Situ Desorption of Soils.” Hazardous & Radioactive Waste Treatment Technologies Handbook. Boca Raton, FL: CRC Press, 2001. † Vapor recovery may be influenced by soil type and site lithology.
UFC 3-280-05 31 July 2006
3-8
temperatures. An 8-foot thick interval is the thinnest region that can be practically treated owing to both vertical fanning of the current as it travels between the electrodes and thermal conduction of heat out of the target zone. 3-5.2.3 The physical and chemical characteristics of the target contaminant affect the remediation energy, time, and cost. The percentage of contaminant reduction (as measured by contaminant mass, before and after soil sampling, or groundwater sampling) is another important remediation parameter. The percentage of reduction desired might be based on a health risk assessment or on the dissolved groundwater concentration at a downgradient receptor. For most VOCs, “adding a nine” to the desired percent contaminant reduction (e.g. changing from 90 to 99% or changing from 99 to 99.9%) will increase the overall project cost by 10 to 20%. 3-5.2.4 If high levels of contamination extend to within 4 feet of the soil surface, subsurface utilities should be evaluated. Most utilities are not affected by ERH if they are constructed of metal, vitrified clay, or other temperature-insensitive material. ERH has been applied in regions that are traversed by metal natural gas pipelines, telephone, fiber optic cables, water, and sewer lines. Temperature-sensitive utilities include plastic water and natural gas lines, and electrical cables that carry significant power. 3-5.2.5 The electrical load of an ERH system is relatively small compared to most industrial and military activities, but significantly larger that most remediation approaches. Utility locations, age, capacity, and rate structures are important issues to be considered. The existing utility infrastructure should be evaluated during the technology screening to determine if it has sufficient capacity to provide power for an ERH system. 3-5.3 Steam Enhanced Extraction. The major design data needs for steam injection include:
• The lateral and vertical extent of the treatment zone. This is used to estimate the volume to be heated, steam need, and overall cost.
• NAPL presence and contaminants of concern (density, vapor pressure, solubility). This drives the treatment strategy and effluent treatment system component selection.
• Target cleanup levels for groundwater and soils. This is used to evaluate feasibility and treatment duration, and to determine if polishing steps are desirable.
• Geological stratification (affecting steam injection strategy and number of injection intervals with depth).
• Horizontal and vertical permeability of target layers (this drives well spacing and screen length selection).
• Hydrological data (hydraulic gradients, seepage velocity, hydraulic conductivity). This affects the necessary pumping rates for maintaining hydraulic control.
• Obstructions to well installation (buildings, subsurface installations, etc.). This affects choice of well design and feasibility.
UFC 3-280-05 31 July 2006
3-9
3-5.3.1 Small sites, located at shallow depths, may not be economically treated using steam injection, unless cheaper options such as excavation are ruled out owing to site-specific constraints such as buildings or underground lines that cannot be removed. The pressure of the injected steam is limited by the overburden pressure, which is directly related to the thickness of soil above the injection zone. A general rule-of-thumb is that the injection pressure should not exceed 0.5 psig per foot of overburden. However, recent field demonstrations have shown that this value can be exceeded safely at shallow sites with a surface cover (Alameda Point, Pinellas STAR Center), and at fractured rock size with significant rock strength (Edwards AFB Site 61, Loring Quarry Site).*
3-5.3.2 In practice, the injection rates for shallow sites are restricted by the limited weight of the overburden, and thereby the minimum practical injection pressures that can be attained in the field. As an example, steam was injected at 10 feet below grade at Alameda Point, and the pressure was limited to about 8 psig. This limited the achievable steam injection rates to below 200 lb/hr per well, which in turn led to a design with the injection wells less than 30 feet away from the central extraction well.†
3-5.3.3 Injection of steam below paved surfaces and concrete floors may allow for treatment at shallower depths, providing building foundations are not negatively affected. Generally, steam is effective for treating zones deeper than 1–2 m, making this a highly versatile method. 3-5.3.4 Given the infrastructure required for steam injection (steam generators, wells, controls, sources of high quality water, fuel, electricity, etc.), an economy of scale needs to be realized for treatment. Small quantities may not be economically treated. 3-5.3.5 Higher permeability soils are more conducive to steam injection than lower permeability soils. The lower the permeability is, the higher the injection pressures required, resulting in higher steam temperatures. Higher pressures can also result in soil instability. Higher pressure in turn limits mass flux to the vapor phase, because the vapor pressure of the compounds of concern must overcome the induced pressures in the soil resulting from the steam injection. Generally, the lower limit for hydraulic conductivity for steam penetration is approximately 10–5 cm/s for sites deeper than 30 feet (9.1 m), with higher permeability needed for shallower sites. For sites less than 20 feet (6.1 m) deep, a practical limit for steam injection is probably around 10–3 cm/s. However, if the hydraulic conductivity varies around this value, steam injection can be combined with electrical heating to overcome heat transfer limitations of the tighter zones (as done at Pinellas STAR Center).‡
* Heron, personal communication, 2003 † Udell and Heron, personal communication, 2003 ‡ Heron, personal communication, 2003

UFC 3-280-05 31 July 2006
3-10
3-5.3.6 Steam can still be effective in treating low permeability soils when the steam is injected into adjacent higher permeability lenses and layers.* Steam has been injected into gravel-filled inter-till zones to treat clay till with a matrix hydraulic conductivity in the order of 10–8 cm/s. In that application, steam was injected into a dewatered thin (0.1 to 0.6 m) sand and gravel zone at the stratigraphic break between two ground moraines. The steam apparently migrated laterally through the inter-till layer and vertically through the joints and fractures in the till, which is believed also represented the vertical migration pathways for the perchloroethene and mineral spirits that were released at the site, rapidly heating approximately 40 feet (12 m) of clay till overlying the inter-till unit. 3-6 EVALUATION OF BIOLOGICAL DEGRADATION POTENTIAL. Source removal, reduction, and recovery achievable using ISTR methods results in a reduction in mass flux to groundwater. At some sites, sufficient mass removal may occur that the assimilative capacity of the aquifer may play an important role in attaining remediation goals. As such, depending upon the remediation goal, it may be appropriate to also evaluate natural attenuation (of which intrinsic biodegradation is typically a significant component) as a component of the overall remediation. It is beyond the scope of this UFC to provide background on what natural attenuation parameters to analyze for and how to interpret the data. The reader is referred to the following sources of information:
• American Society for Testing and Materials (ASTM) (1997a). Standard Guide for Remediation of Ground Water by Natural Attenuation at Petroleum Release Sites.
• Committee on Intrinsic Remediation (2000). Natural Attenuation for Groundwater Remediation. National Academy Press, Washington, DC.
• USEPA (1999b). Use of Monitored Natural Attenuation at Superfund, RCRA Corrective Action and Underground Storage Tank Sites. Directive Number 9200.4-17P. Washington, DC: EPA Office of Solid Waste and Emergency Response.
• ITRC (1999). Natural Attenuation of Chlorinated Solvents in Groundwater: Principles and Practices.
• Rafai, H.R., Borden, J. Wilson, and C.H. Ward (1995). Intrinsic Bioattenuation for Subsurface Restoration. pp 1-30 in Hinchee, R.E., J. Wilson, and D. Downey (eds.) Intrinsic Bioremediation, Battelle Memorial Institute, Columbus, Ohio.
• Wiedemeier, T.H., J.T. Wilson, D.H. Kampbell, R.N. Miller, and J.E. Hanson (1995). Technical Protocol for Implementing Intrinsic Remediation With Long Term Monitoring for Natural Attenaution of Fuel Contamination Dissolved in Groundwater. Vols. 1 and 2. San Antonio, TX: Air Force Center for Environmental Excellence, Brooks Air Force Base.
• Wiedemeier, T. H., M. A. Swanson, D. E. Moutoux, E. K. Gordon, J. T. Wilson, B. H. Wilson, D. H. Kampbell, P. E. Haas, R. N. Miller, J. E. Hansen, and F. G. Chapelle (1998). Technical Protocol for Evaluating Natural Attenuation of Chlorinated Solvents in Groundwater. EPA/600/R—98/128.
* Adams, T.V. and G.J. Smith. “LNAPL/DNAPL Removal in Clay Till Using Steam-Enhanced Extraction.” Proceedings of the First International Conference on Remediation of Chlorinated and Recalcitrant Compounds. Monterey, CA. May 1998.
UFC 3-280-05 31 July 2006
3-11
General observations regarding the three ISTR technologies follow. 3-6.1 Thermal Conductive Heating. When operated with the aim of having the entire treatment zone attain temperatures above the boiling point of water (as for treatment of SVOCs), the temperatures achieved using ISTD TCH effectively sterilizes the soil in the treatment zone. When operated to accomplish in situ steam distillation of VOCs at temperatures below the boiling point of water, the sterilization effect may be somewhat lessened. In either case, however, microbiota are not permanently eradicated from the treated soil, and may repopulate the soil as it cools. Evidence suggests that a large fraction of the total organic carbon (TOC) remains after ISTD, probably because very high molecular weight compounds such as humic and fulvic acids are not destroyed at such temperatures. This TOC may serve as a carbon source for re-emerging microbiota. At the same time, ISTD tends to mineralize a certain fraction of the organic nutrients into inorganic forms which, being more water-soluble, are likely more bioavailable than prior to thermal treatment. This may help to explain the observation that vegetation has rapidly invaded and flourished on sites where ISTD had been conducted.* Therefore, although research is currently lacking, one may expect that in situ biological degradation can resume after TCH, particularly in fringe zones surrounding the thermal treatment zone, and in the associated dissolved plume, where hydrocarbons may remain following thermal treatment of the source zone. In addition to high temperature applications, TCH may also be used in cold climates to slowly warm soils to accelerate biodegradation of organic contaminants. 3-6.2 Electrical Resistivity Heating. Biodegradation can be incorporated into ERH remediation applications. While ERH has the potential to heat the subsurface to the boiling point of water, this does not necessarily sterilize the subsurface. At one of the earliest full-scale applications of ERH in Skokie, Illinois, cis-1,2-dichloroethene (a daughter compound from the biodegradation of trichloroethene) was observed in the off-gas from the treatment area throughout the entire process.† During this period, concentrations of methane were also observed to increase in the off-gas. Methane (based on oxidation-reduction potential measurements in the groundwater) is believed to have been the result of the anaerobic biodegradation of organic material in the groundwater. Biodegradation was also tracked isotopically at the Skokie Illinois location. Groundwater impacted by chlorinated aliphatic hydrocarbon becomes depleted in 13C and enriched in 37Cl during evaporation (ISTR operations), while during microbial degradation, isotopic concentrations in groundwater become enriched in both 13C and 37Cl.‡ This relationship allowed researchers and the remediation engineer or project manager track the fate of the chlorinated aliphatic hydrocarbon and determine the
* Vinegar and Stegemeier, Personal Communication, 1999. † Beyke, G., G. Smith, and V. Jurka. “DNAPL Remediation Closure with Six-Phase Heating”. Proceedings of the Second International Conference on Remediation of Chlorinated and Recalcitrant Compounds, Monterey, CA, May 2000. ‡ Sturchio, N. C., L. Heraty, B. D. Holt, L. Huang, T. Abrajano, and G. Smith. “Stable Isotope Diagnostics of Chlorinated Solvent Behavior in Contaminated Aquifers”. Proceedings of the Second International Conference on Remediation of Chlorinated and Recalcitrant Compounds, Monterey, CA, May 2000.
UFC 3-280-05 31 July 2006
3-12
nature of the remediation taking place. The isotopic data from the Skokie site showed biodegradation to be taking place during and after treatment. 3-6.3 Steam Enhanced Extraction. Biological degradation potential under steam injection can be assessed as part of a natural attenuation evaluation. The injection of steam, as described in Paragraph 2-3.3.1.4, creates a steam zone, a variable temperature zone, and an ambient temperature zone. The variable temperature zone, which may be relatively extensive in lower permeability settings, provides an environment to enhance biological activity. Biological activity may increase two- to three-fold for each 10ºC rise in temperature. Nutrients may be added (if necessary) to enhance bioactivity.* At the first application of this approach in Skokie, Illinois, it is estimated that approximately 10,400 kg (23,000 lb) of trichloroethene and 1,1,1-trichloroethane were reductively dehalogenated (biodegraded) as part of the remediation, representing 36% of the mass removed or destroyed during the application period.†
* Basile, A.J., G.J. Smith and J.W. Aiken. Ground Contamination Remediation Process. US Patent No. 5,279,740, 1994. † Smith, G., D. Fleming, V. Jurka, and T. Adams. “Closure of a Trichloroethene and 1,1,1-Trichloroethane DNAPL Remediation Using Thermal Technologies.” Proceedings of the Second International Conference on Remediation of Chlorinated and Recalcitrant Compounds. Monterey, CA, May 22-25, 2000.
UFC 3-280-05 31 July 2006
4-1
CHAPTER 4
TECHNOLOGY SCREENING AND FEASIBILITY STUDIES FOR ISTR 4-1 INTRODUCTION. To effectively select the appropriate remedial technology, it is important to define the remediation goals. As discussed in previous sections, increases in temperature greatly affect chemical properties, and chemical, biological, and physical reactions. It is these enhancements of physical, chemical, and biological reactions that ISTR methods seek to utilize to effect remediation. Possible operations that can be performed as part of ISTR applications are:
• Source removal/reduction/recovery (the most common application). • Enhance chemical reactions such as hydrous pyrolysis oxidation. • Enhance biological reactions.
The remediation strategy may involve one, or a combination of these options. 4-2 IDENTIFY REMEDIAL ACTION STRATEGIES. The ISTR technologies have been most commonly applied to remove of NAPL. For this reason, this is the focus that this UFC will take to describe various processes. However, ISTR technologies have also been used to enhance biological processes, volatilize aqueous phase concentrations, and induce oxidation (through cyclic application of injected steam and air to cause hydrous pyolysis oxidation). The application of heat modifies chemical, physical, and biological processes and reactions, which play important roles in environmental remediation. 4-2.1 Source Removal/Reduction/Recovery. Typically thermal methods have been applied for source removal/reduction/recovery of NAPL. Typical industrial organic chemicals found at many hazardous waste sites (e.g., PCE, TCE, 1,1,1-TCA, benzene, ethylbenzene, toluene, and xylenes) have boiling points of less than 150ºC. The main removal mechanism where these compounds are present as NAPL involves enhanced volatilization, steam distillation (utilizing the azeotropic mixture eutectic point* ), hydrous pyrolysis oxidation, and vapor-phase oxidation and pyrolysis. Source removal, reduction, and recovery also have the ability to significantly reduce the mass flux of organic chemicals from the source zone, such that when coupled with natural attenuation processes, the aqueous phase is also significantly cleaned up.†
4-2.1.1 Identification of Thermal Treatment Areas. A preliminary step in the setting of remedial action objectives (RAOs) for ISTR is to identify treatment areas. The
* Two or more liquids when heated together will boil at a temperature (the eutectic point) below the boiling point of the individual components of that mixture. For instance, a mixture of trichloroethene in water has an eutectic point of 73.1oC, while trichloroethene in air at standard atmospheric pressure boils at 87oC. † Smith, G., D. Fleming, V. Jurka, and T. Adams. “Closure of a Trichloroethene and 1,1,1-Trichloroethane DNAPL Remediation Using Thermal Technologies.” Proceedings of the Second International Conference on Remediation of Chlorinated and Recalcitrant Compounds. Monterey, CA, May 22-25, 2000.

UFC 3-280-05 31 July 2006
4-2
lateral and vertical extent of NAPL at a site is best defined by the use of multiple lines of evidence rather than a single measurement. Possible lines of evidence include:
• Groundwater and soil chemical data. • Inferences from site characterization tools such as the Corps of Engineers
Site Characterization and Analysis Penetrometer System (SCAPS) and the Loral Corporation Rapid Optical Screening Tool (ROST®).
• Visual observations in groundwater or soil samples, where possible. • Direct measurement of NAPL in groundwater. • Comparison of concentrations to aqueous solubility data.
At some large or complex sites, it may be appropriate to divide the site into subareas for thermal treatment. Treatment subareas allow different parts of a site to be prioritized when the entire site cannot be treated because of implementation constraints or limited funding. The use of treatment subareas assists the phased implementation of thermal treatment. Treatment subareas may be identified and prioritized by many different factors, for example:
• The relative amount of NAPL estimated in each subarea. • Relative differences in NAPL mobility, if any, between subareas. • The proximity of each NAPL subarea to drinking water sources/risk
receptors. • The degree of data certainty regarding the presence of mobile NAPL in
each subarea. • The expected future land use in each subarea. • The relative ease of access for implementation in each subarea.
4-2.1.2 Setting Remedial Action Objectives. Although remedial action objectives (RAOs) are specific to each site and regulatory program, there are several common approaches to consider in setting RAOs for ISTR. 4-2.1.2.1 RAOs include general remediation goals and site-specific numerical cleanup standards that address current and potential groundwater risk pathways at a site. RAOs depend on the expected future land use of the site and the designated beneficial uses of the groundwater aquifer beneath the site. For example, when groundwater poses an actual or potential health risk and is a potential drinking water source or could affect a drinking water source, the National Contingency Plan (NCP) directs EPA to restore groundwater to Federal and state drinking water standards whenever possible, in a reasonable time.*
4-2.1.2.2 EPA Record of Decision (ROD) guidance† states that “different remediation objectives should be developed for the NAPL zone and for the portion of the aquifer outside of the NAPL zone.” This is based on the conclusion in the guidance that, “in
* NCP, 40 CFR 300.430(a)(1)(iii)(F) † USEPA. Guide to Preparing Superfund Proposed Plans, Records of Decision, and Other Remedy Selection Documents. EPA 540-R-98-031. July 1999c.

UFC 3-280-05 31 July 2006
4-3
general, restoration of an aquifer contaminated with NAPLs to ARARs (e.g., Federal and state MCLs) or other risk-based cleanup levels in a reasonable time frame will not be attainable in the NAPL zone unless the NAPLs can be removed.” If an aquifer can not be cleaned up in a reasonable time, a waiver of ARARs based on technical impracticability may be necessary. 4-2.1.2.3 As required by the NCP for sites under the Comprehensive Environmental Response Compensation Liability Act (CERCLA), the remediation objectives for the area outside of the NAPL zone (i.e., dissolved phase contamination) are ARARs or risk-based cleanup levels. To the extent that NAPL can be removed from the NAPL zone, that zone would then be subject to the same remediation objectives as the aqueous plume. In this respect, there are short-term and long-term remediation objectives for the NAPL zone. 4-2.1.2.4 In setting the remediation objectives for the NAPL zone, several different approaches are possible. The remediation objectives for the NAPL zone relevant to in situ treatment do not need to be numerical standards, but need to be measurable. Examples of non-numerical remedial goals for ISTR include the following:
• Remove mobile NAPL. • Remove NAPL “to the maximum extent technically feasible.” • Remove a specified amount of NAPL based on estimated quantities (as
gallons or a percentage of the estimated total NAPL-e.g. remove 90% of the NAPL or remove 90% of the most volatile fraction of the NAPL).
• Achieve an order of magnitude reduction of NAPL. • Demonstrate that “significant” NAPL recovery equals real risk reduction
(e.g., by removing 90% of NAPL, the remaining 10% represents only a negligible risk). • Achieve a net reduction in flux of contaminant to groundwater that is lower
than the assimilative capacity of the aquifer, allowing natural attenuation processes to achieve water quality goals at some point of compliance.
• Achieve specific performance standards (e.g., heating criteria or treatment time periods).
• Use a goal structure similar to what has been used for SVE-i.e. achieving asymptotic recovery curves indicating that a well designed, installed, operated, and optimized system has reached a point of diminishing returns.
• Achieve indirect goals such as reducing the time or lateral extent of follow-up actions such as pump-and-treat.
• Conduct a “cost-effective” removal of NAPL. 4-2.1.2.5 There are obvious shortcomings to several of these approaches. Remedial goals based on a specific quantity of NAPL recovery are problematic because of the uncertainty associated with estimating the initial NAPL volume. It is also difficult to quantify residual risk (or risk reduction) after ISTR to demonstrate that a specific risk-reduction goal has been achieved. Demonstrating that NAPL removal has been cost-effective raises the question of what cost per gallon of NAPL recovered is cost-effective in relation to the total groundwater remediation costs, including long-term O&M.

UFC 3-280-05 31 July 2006
4-4
4-2.1.2.6 In the end, RAOs for ISTR must be determined on a site-specific basis and must fit into the overall, long-term cleanup strategy for the site. Because of the uncertainties currently associated with ISTR technology, RAOs may need to include contingencies in the event that sufficient NAPL is not recovered-e.g. contingencies to conduct follow-up actions such as pump and treat to contain NAPL sources that cannot be removed and that are considered a continuing threat to groundwater. 4-2.2 Other Remediation Strategies. As mentioned above, ISTR methods may be used for a variety of applications to enhance physical, chemical, and biological reactions to effect remediation. This paragraph is presented to inform the reader about the applications of ISTR where removal of NAPL has not been the goal. 4-2.2.1 Enhance Physical Changes. Physical changes involve changes in state (i.e., changes from solid to liquid to vapor). Thermal methods have been used to vaporize dissolved compounds in groundwater, which essentially involves boiling the groundwater. At a site in Washington State, ERH was used to reduce relatively low concentrations of chlorinated solvents in slow-moving groundwater to rapidly clean up a property for sale. Selling the site with the groundwater cleaned up would result in a higher sales price than if PCE and TCE were present in the groundwater. Changing the physical conditions can also result in a change in the physical property of a particular compound. For instance, the viscosity of many materials is re-duced using heat. This may facilitate the recovery of such materials as lube oils in the subsurface. At the Yorktown Naval Facility, steam within horizontal stainless steel wells is being used to reduce the viscosity of Navy Special Fuel Oil to facilitate recovery in a system of trenches. Engineering studies have also been performed to evaluate the feasibility of using steam, ERH, and TCH at a number of refineries to enhance the removal of lube materials currently being recovered from the subsurface using more conventional means. 4-2.2.2 Enhance Chemical Reactions. Hydrous pyrolysis oxidation (HPO) involves chemical oxidation in the presence of heat. Reactions between oxygen and common organic pollutants are orders of magnitude faster at or close to steam temperature than under ambient temperatures. To utilize HPO for in-situ destruction, the subsurface is heated up, typically through the use of TCH or SEE. In all TCH field projects, a large amount of water is naturally in place for the HPO reaction. Typically, the product stream contains greater than 50% water and may also contain air. In addition, steam and oxygen, or oxygen alone (typically supplied as air) are injected in a pulsed fashion, building a heated, oxygenated zone in the subsurface. When injection is stopped, pressures dissipate, resulting in condensation of steam and the contaminated groundwater returns to the heated zone for in situ treatment. The dissolved contaminants in the groundwater mix with the oxygen and condensate and, in the presence of heat, rapidly oxidize to form carbon dioxide and chloride ions (in the case of treating chlorinated compounds, such as pentachlorophenol, trichloroethene, or perchloroethene). Reaction kinetics of gas-phase oxidation and pyrolysis exhibit dramatic increases with temperature above the boiling point of water. Using HPO, it is estimated that more than 150,000 pounds of wood treating chemicals were degraded at the Visalia Pole Yard site.
UFC 3-280-05 31 July 2006
4-5
As presented in Paragraph 2-1.1.5, chemical reactions such as hydrolysis sig-nificantly increase with temperature, especially in the cleanup of alkanes. At the time of preparation of this UFC, there had been no known application of ISTR solely for the purpose of enhancing hydrolysis. However, it is believed that thermally enhanced hydrolysis of methylene chloride was a significant mechanism in the ERH remediation in Waukegan, Illinois. Further, upon review of the data from the ERH remediation in Skokie, Illinois, thermally enhanced hydrolysis may have been significant in the removal of 1,1,1-trichloroethane from the groundwater.* 4-2.2.3 Enhance Biological Reactions. The application of heat results in increased biological activity. It is estimated that biological activity increases three-fold for each 10ºC rise in temperature. Where temperature is a limiting factor for in situ biodegradation remediation, heat may be added using ISTR methods. ERH was used in Alaska (Ft. Richardson) to provide a heat source to stimulate in situ intrinsic biodegradation of fuels during winter months (Appendix B). It has been observed that biodegradation occurs during ERH, even to the boiling point of water. At a site where ERH was applied in Skokie, Illinois,† cis-1,2-dichloroethene (a biodegradation daughter compound of trichloroethene) was detected throughout the treatment period. Further, concentrations of methane were also detected in the off-gas from the treatment, evidencing biological activity. Steam injection coupled with simultaneous enhanced biodegradation‡ was successfully used to clean up two sites in Illinois.§ ** At one site, it is estimated that approximately one-third of the released chlorinated solvents were destroyed by in situ biodegradation. 4-3 MEASURES OF SUCCESS FOR ISTR. If residual NAPL is present, MCLs or other cleanup standards may not be achieved in groundwater at a site until some time after completion of thermal treatment. In some cases, natural degradation of the residual NAPL may be adequate to meet RAOs. At other sites, follow-up activities such as pump-and-treat or enhanced biodegradation are implemented. Depending on the size of the remediation, the benefits of ISTR may be realized in as little as 18 months,††
* Beyke, G. personal communication on observations on ERH applications at Waukegan and Skokie Illinois. 2002 † Beyke, G., G. Smith, and V. Jurka. “DNAPL Remediation Closure with Six-Phase Heating”. Proceedings of the Second International Conference on Remediation of Chlorinated and Recalcitrant Compounds, Monterey, CA, May 2000. ‡ Basile, A.J., G.J. Smith and J.W. Aiken. Ground Contamination Remediation Process. US Patent No. 5,279,740, 1994. § Smith, G., D. Fleming, V. Jurka, and T. Adams. “Closure of a Trichloroethene and 1,1,1-Trichloroethane DNAPL Remediation Using Thermal Technologies.” Proceedings of the Second International Conference on Remediation of Chlorinated and Recalcitrant Compounds. Monterey, CA, May 22-25, 2000. ** Adams, T.V. and G.J. Smith. “LNAPL/DNAPL Removal in Clay Till Using Steam-Enhanced Extraction.” Proceedings of the First International Conference on Remediation of Chlorinated and Recalcitrant Compounds. Monterey, CA. May 1998. †† Adams, T.V., Personal communication on post-treatment monitoring after active remediation at the Skokie, IL site. 2000.
UFC 3-280-05 31 July 2006
4-6
or it may require years of monitoring to assess the full benefits at a site. Therefore, different measures of “success” are needed for ISTR technologies. Success can be defined by mass removal goals, but this approach has limitations, as noted above. Narrative goals such as reducing the need for long-term pump-and-treat are also measures of success, but may not be demonstrated in the short-term. 4-3.1 When applying ISTR technologies, it is important to realize that complete removal of the source area is impractical. For a variety of compounds, reduction of source mass may be sufficient to reduce the contaminant flux to groundwater to levels that, for instance, do not represent residual NAPL, or where there is lack of rebound, which would then allow the natural assimilative capacity of the aquifer to control plume migration. This would involve evaluating natural attenuation. 4-3.2 For chlorinated solvents, this may be determined by the organic carbon demand. Each 1 mg of dissolved organic carbon oxidized via reductive dechlorination, consumes 5.65 mg of organic chlorine.* This ratio can be used to determine organic carbon demand and the change in this organic carbon demand as the compounds degrade. Organic chlorine can be determined from the following relationship for trichloroethene. 4-3.3 For example, as two moles of TCE are reduced to ethene, six moles of chlorine (shown below as Cl2 gas) are produced (TCE: 2C2HCl3 + 3H2 → 2C2H4 + 3Cl2). Molecular weights: TCE 2(12.011) + 3(35.453) + 1.01 = 131.39 Chlorine 3(35.453) = 106.359 Mass Ratio of Chlorine to TCE = 106.359:131.30 = 0.81:1 Therefore, 10 mg/L of TCE would be equivalent to 8.1 mg/L of organic chlorine, which would in turn represent 1.43 (8.1÷5.65) mg/L of organic carbon demand. 4-3.4 Organic carbon demand is then compared to concentrations of organic carbon in groundwater. Where organic carbon exceeds the organic carbon demand and appropriate redox conditions are present, reductive dehalogenation is occurring and there is sufficient assimilative capacity in the aquifer. Conversely, where organic carbon demand exceeds available organic carbon in groundwater, the dehalogenation process may be inhibited. 4-3.5 Similarly, for fuels, where the oxygen demand is satisfied by the dissolved oxygen concentrations or other electron donor sources, the aquifer may assimilate continued flux to groundwater from the source area. 4-4 FEASIBILITY EVALUATION FLOW CHART. Once the remediation goal is established, each ISTR technology has a range of effectiveness, depending on the
* Wiedemeier, T.H., M.A. Swanson, D.E. Moutoux, E.K. Gordon, J.T. Wilson, B.H. Wilson, D.H. Kampbell, J.E. Hansen, P. Haas, and F.H. Chapelle. Draft Technical Protocol for Evaluating Natural Attenuation of Chlorinated Solvents in Groundwater. San Antonio, TX: Air Force Center for Environmental Excellence, 1996.
UFC 3-280-05 31 July 2006
4-7
desired temperature range to be achieved, the soil* type in which it will be applied, depth of contaminant, setting of contaminant (e.g., perched on a clay layer, potential for mobilization as a result of heating), and the potential for vapor recovery (i.e., the feasibility of engineering a cost-effective recovery system). Figure 4-1 presents a flow chart for evaluating site conditions to determine whether ISTR is potentially applicable for the site given its setting and infrastructure. Conditions to be evaluated include: delineation of the source area, nature of compounds to be remediated, availability of utilities, geotechnical issues, drainage in the remediation area, and drilling access issues. 4-4.1 The selection of the appropriate technology for a given site is site specific, dependent upon a variety of factors such as cost (and cash flow constraints), geology, hydrogeology, community acceptance, availability of power, depth of treatment, etc. The technologies that are the subject of this manual have been undergoing continuous improvement as more and more sites are treated. Engineering solutions have been developed to issues that have been encountered, providing the knowledge base to expand the settings where the technologies may be applicable. It is recommended that a number of vendors be contacted once it is determined that ISTR may be applicable for a given site, to evaluate the issues involved in applying the technology at said site.
4-4.2 Steam injection temperatures that can be achieved are based on the injection pressures that can be achieved. Since most environmental restoration projects are typically performed at depths of less than 30 m (100 feet), the highest temperature that can be reasonably achieved in soil using steam is approximately 170ºC (~350ºF). 4-4.3 ERH and thermal conductance methods heat the subsurface relatively evenly. Steam injection, on the other hand, is susceptible to the steam following zones of higher hydraulic conductivity. Unfortunately, contaminants in soil can migrate by diffusion into very tight layers from which they require very long times for removal again by diffusion. In highly anisotropic conditions (e.g., braided stream deposits, fractured bedrock) injected steam is susceptible to following paths of least resistance and may not heat the desired zone. Depending upon the degree to which anisotropy is present, zones where steam is not conveyed will be heated by conduction and convection.
* ISTR technologies have seen limited testing in bedrock environments at the time of preparing this manual. As a result, the experience base does not exist to develop procedures for application in bedrock
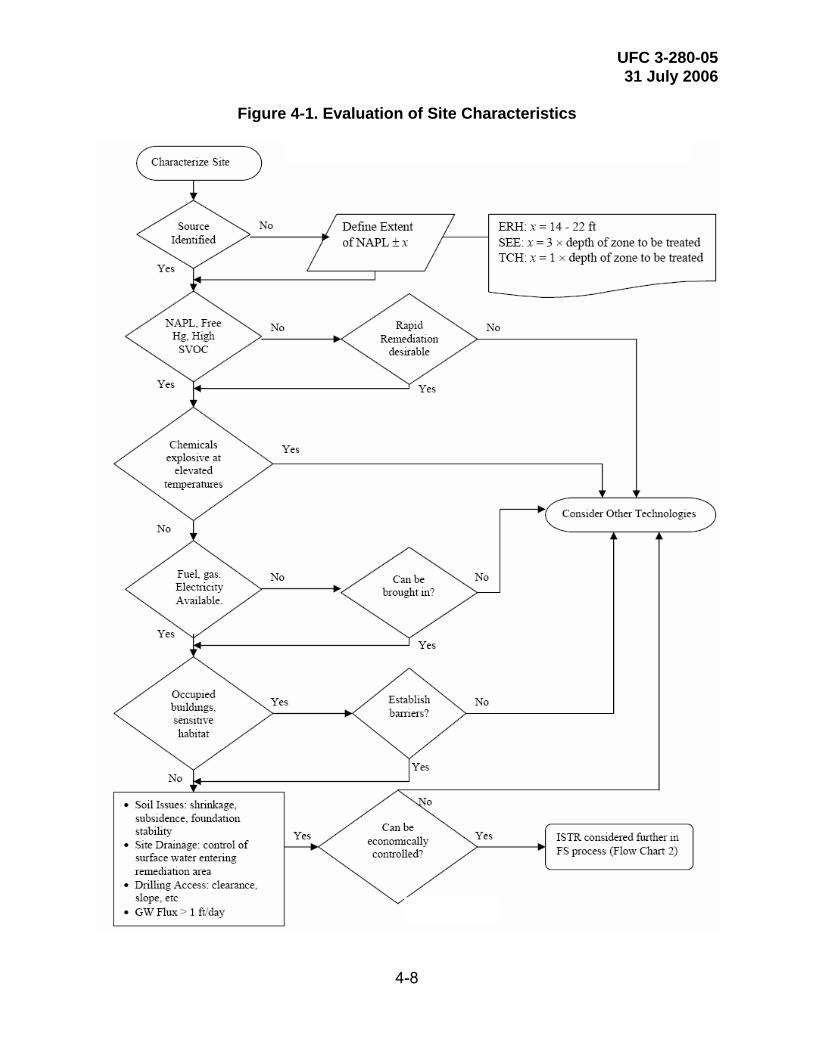
UFC 3-280-05 31 July 2006
4-8
Figure 4-1. Evaluation of Site Characteristics
UFC 3-280-05 31 July 2006
4-9
4-4.4 Depth of treatment is a critical issue. The spacing of heater wells, electrodes, and injection wells is based on what is known as an aspect ratio. For thermal conduction, the (heater) well spacing should not exceed the thickness of the heated zone.* Well spacing, not the thickness of the heated zone, determines the time required to heat the formation. As such, this is defined as a 1:1 aspect ratio (distance between heater wells: thickness of zone to be treated).† For ERH, the spacing of the electrodes is based on soil type, applied voltage, and electrical resistance of the soil/groundwater system to be treated. Typical spacing between electrodes is 2.6 to 6.1 m (8.5 to 20 feet). Therefore, at depths of greater than 2.6 to 6.1 m, the ERH aspect ratio is less than 1:1, indicating that significant drilling is required to treat a large, deep area. For steam injection in the vadose zone, the aspect ratios that have been used range from 3:1 to 5:1.‡ In the saturated zone, steam sparging§ aspect ratios have ranged from 1:1 to 3:1. 4-5 EVALUATION OF SHORT-TERM IMPACTS OF ISTR. The short-term impacts of a remedial action are evaluated in terms of the potential effects on human health and the environment during implementation of the action as well as site issues. The assessment of short-term impacts is primarily based on four key factors:
• Potential short-term risks to and protection of the community during implementation of a remedial action.
• Potential impacts to and protection of workers during a remedial action, and the effectiveness and reliability of protective measures.
• Potential environmental impacts of the remedial action, and the effectiveness and reliability of mitigation measures during implementation.
• Impacts to soils and foundations. 4-5.1 As with other remediation technologies, ISTR presents the potential for expo-sure of nearby communities to site contaminants via fugitive emissions of vapors, incomplete hydraulic control and capture of contaminated groundwater and vapors, and on- and off-site management of process wastes generated by the action. Short-term risks also include dust generated during construction and noise from equipment operation and drilling. During implementation, access restrictions and engineering controls can be used to protect the public from construction and O&M-related activities at the site. During active thermal heating and cool-down, engineering controls would be necessary to control potential exposure routes to the surrounding community. The controls may include groundwater and vapor extraction; on-site physical and chemical treatment of vapor, water and air waste streams; and off-site treatment and disposal of process wastes at permitted disposal facilities.
* Stegemeier, G.L. and H.J. Vinegar. “Thermal Conduction Heating For In Situ Desorption of Soils.” Hazardous & Radioactive Waste Treatment Technologies Handbook. Boca Raton, FL: CRC Press, 2001. † It should be noted that most applications of TCH have involved heater well spacings of 6 to 8 ft (1.8 to 2.4 m). Depending on the desired goal, the heater well spacing can also exceed the thickness of the zone targeted for treatment. If the objective of TCH is to accomplish in situ steam distillation, rather than to achieve superheated temperatures, aspect ratios of somewhat greater than 1:1 can be utilized ‡ Heron, 2002, personal communication § Steam sparging is used by SteamTech for steam injection into the saturated zone (Heron, personal communication, 2002)
UFC 3-280-05 31 July 2006
4-10
4-5.2 Extensive performance monitoring requirements, including well-field measurement of temperature, pressure, and steam distribution, rates and effectiveness of contaminant removal, and treatment plant discharges to the air and groundwater, are important elements of the remedy. Specific monitoring activities to ensure protection of the surrounding community could include monitoring of fugitive and stack emissions (treatment units and boilers), dust and opacity, noise and groundwater. 4-5.3 Short-term impacts on workers associated with ISTR include potential exposures to construction-related risks (ranging from the risks of working around mobile equipment to trips, slips and falls), potential worker exposure to NAPL and dissolved-phase contaminants, unique physical hazards (high temperatures and high-voltage electricity) during installation and O&M of the remedy, and fugitive air emissions. These risks and the protective measures to address them are discussed in Paragraph 10-2. 4-5.4 Potential ISTR short-term impacts on the environmental receptors identified at a site are primarily fugitive emissions from treatment operations and the direct thermal effects of actively heating soil. Other potential environmental impacts are associated with construction activities, such as noise, traffic and dust. Mitigation measures include engineering controls similar to those used for community protection. Sites located near surface water bodies present special concerns in terms of potential impacts and mitiga-tion measures. Different statutory requirements exist for conducting ecological assess-ments at a site. If endangered species have been identified at a Federal Superfund site, consultation with Federal and state Natural Resource Trustees is required prior to implementation of a remedy. 4-5.5 TCH and ERH have the ability to reduce soil moisture content. This could have the potential for soil shrinkage in expansive clays, potentially impacting foundations. Data evaluations to date have shown that under ERH applications, moisture content is reduced by approximately 50% in the vicinity of the water table in clay soils. Moisture content above the water table remains relatively consistent owing to the continued steaming from below during treatment. The thickness of the zone experiencing reductions in moisture content is believed to be a factor of the duration of heating and the hydraulic conductivity of the soils.
UFC 3-280-05 31 July 2006
5-1
CHAPTER 5
BENCH- AND PILOT-SCALE STUDIES 5-1 INTRODUCTION AND CONSIDERATIONS IN DETERMINING TESTING APPROACHES. 5-1.1 The goals of a bench- or pilot-study typically are:
• Feasibility demonstration. • Evaluate process design and potentially optimize.
It is therefore important to define the need for a bench- or pilot-scale testing and the goals that are to be achieved. Bench-scale testing assesses the treatability of a particular compound or suite of compounds and defines potential chemical reactions (adverse or desired) when heating occurs. Pilot testing typically confirms design parameters in situations where uncertainty exists about treatment of compounds of concern or process performance under site-specific conditions. For large and complex sites, the use of bench- or pilot-scale testing can supplement the modeling and assist the engineer or scientist in determining if ISTR is an appropriate means to remediate a site. 5-1.2 Bench-scale tests usually consist of column studies. Column tests gauge the effectiveness of the ISTR technology on specific contaminants existing at the site. ISTR has been demonstrated to be effective for most VOCs. However, if the chemicals of concern are not VOCs, or there is a mixture of chemicals of concern, column studies should be performed to evaluate the feasibility of ISTR technologies. Column studies refer to packing a column with site soil and site contaminants, applying a representative ISTR technology, and measuring effluent concentrations as a function of the time. The test results usually cannot be directly scaled up to the full-scale ISTR system unless the site lithology consists of homogeneous isotropic soils. 5-1.3 Because pilot testing is expensive, it can be justified if uncertainties arise that (1) are critical to the success of the project and (2) can be answered by the pilot. Therefore, the pilot must be carefully designed to obtain critical data and not simply to satisfy curiosity. Pilot-scale tests are conducted at the site, the location of which is determined by the goals of the pilot test and site-specific constraints. The pilot should be of sufficient size to encompass a significant portion of the site variability, or the results from the pilot test may not be applicable to the rest of the site. A pilot test is usually designed so that the pilot test system can be incorporated into the full-scale system should a full-scale application of the ISTR be merited. This phased approach can significantly speed the overall remediation process. The size of the equipment installed for the pilot test should be carefully considered if such a phased approach is to be used so that, if the test is successful, the rest of the remediation can be cost-effectively conducted. 5-1.4 A pilot test should achieve the following goals:
UFC 3-280-05 31 July 2006
5-2
5-1.4.1 Mass Removal. A pilot test may be used to demonstrate that the ISTR technology can remove contaminant mass at sufficient rates and has the potential to achieve the remedial goals. It should be kept in mind that the most readily extracted fraction of the contaminant mass would be removed by advection no matter what ISTR technology is chosen for the pilot test. The removal rate is expected to decline sharply after a period of time when diffusion-limited mass transfer ensues (except in the case of thermal conductive heating). When designing the pilot test, the test should be long enough to accurately capture the long-term contaminant removal rate. 5-1.4.2 Radius of Influence. The radius of influence of each steam injection well, ERH electrode, or thermal conduction well can be calculated theoretically. However, a pilot test should be designed to provide the vadose and saturated zone responses to the application of heating. The well-field layout in the full-scale system can be adjusted accordingly. 5-1.4.3 Subsurface Characteristics. A pilot test can provide information on the nature and variability of site-specific subsurface parameters, such as soil permeability, hydraulic conductivity, soil moisture retention, and contaminant distribution. 5-1.4.4 Design Parameters. A pilot test would provide valuable information on the design parameters, such as the size of the equipment and treatment system for the full-scale application. ISTR pilot tests may be designed to meet the remedial goal at a small area of the site; for this situation, it is relatively simple to scale up the system to remediate the site. The size of the treatment system can be adjusted if inadequacies are discovered during the pilot test. 5-1.4.5 Cost Estimates. The cost for full-scale system implementation and operation can be deduced from the pilot test. Some adjustments may need to be made if the well spacing is found inefficient or if the treatment system size has to be scaled up. 5-1.5 Performing a pilot test in an sub-area of the main portion of the plume risks impacts from influx of contamination from surrounding areas during and following treatment. This complicates the interpretation of mass removal rates and the achievable contaminant concentrations. Several published reports on pilot testing of ISTR methods have noted these complications. Also, adjustments made to the pattern of the injection and extraction wells or electrodes to carve out a small section for the pilot may limit the ability of the system to heat the entire area, or may cause the spread of contaminants. 5-1.6 A pilot-test work plan should be prepared before conducting pilot- or bench-scale tests. The work plan is crucial for specifying test objectives, the range of operation conditions, and parameters to be monitored, including the location, methods, and frequency of measurements to be taken. A Site Safety and Health Plan (SSHP) is also required to assure safety of all on-site workers. A schedule showing critical tasks and the various phases of the work should be included. A materials list for necessary equipment and supplies should be prepared. Necessary permits should be obtained for
UFC 3-280-05 31 July 2006
5-3
the pilot system installation and discharge streams. Refer to EM 1110-1-4001, Paragraph 4-4, for Work Plan Requirement and Preparation. 5-2 THERMAL CONDUCTIVE HEATING 5-2.1 Bench-Scale Studies. Two general types of bench-scale thermal conduction studies can be outlined:
• Feasibility Demonstration. • Process Design Evaluation.
5-2.1.1 Feasibility Demonstration. The principal focus of the feasibility demonstra-tion is to confirm that the soil will become decontaminated by TCH and to determine the extent of remediation as a function of temperature and, to a lesser extent, the duration of heating. Bench-scale feasibility may be demonstrated by placing a soil sample in a cylindrical metal tube and passing air through the sample while heating the assembly within a muffle furnace. A thermocouple inserted into the soil sample monitors that the soil is heated to the target temperature and then maintained at that temperature for the requisite amount of time (e.g., 48–72 hr), while minimizing thermal overshoot. A typical objective is to demonstrate the extent of removal of COCs as a function of target temperatures; therefore, temperatures are selected to cover the range of interest based on the properties of the COCs. For example, 200, 250 and 300°C were selected to test soil contaminated with explosive compounds such as hexahydro-1,3,5-trinitro-1,3,5-triazine (RDX), octahydro-1,3,5,7-tetranitro-1,3,5,7-tetrazine (HMX), 2,4,6-trinitrotoluene (TNT), nitroglycerin, and isomers of 2,4- and 2,6-dinitrotoluene (DNT). As the compounds being tested were SVOCs, the soil undergoing testing was homogenized prior to subsamples for thermal testing being collected. Analysis of pre- versus post-treatment samples enabled assessment of the degree of contaminant removal as a function of temperature and treatment time.*
5-2.1.2 Process Design Evaluation. The principal focus of the process design evaluation is to design and optimize a cost-effective remediation program. The total remediation program consists of the in situ heating requirements, plus the associated air quality control (AQC) system for the control of well field emissions. In addition to the fundamental demonstration of the decontamination of the soil, additional issues that are addressed during a process design evaluation program are:
• What contaminants are desorbed from the soil (as opposed to being de-stroyed in situ) and at what characteristic temperatures?
* Baker, R.S., J.P. Galligan, H. McLaughlin, R. Semenak, M.P. Pologruto, and K.R. Weeks. “In-Situ Thermal Destruction Treatability Study of Explosives-Contaminated Soil from Massachusetts Military Reservation”. Proceedings of the Fourth Tri-Service Technology Symposium. San Diego, CA, June 2001
UFC 3-280-05 31 July 2006
5-4
• If there are chlorinated organics present in the soil, does the chlorine exit the soil matrix as a chlorinated hydrocarbon or as hydrochloric acid (HCl) vapor? And to what extent is the gaseous HCl neutralized by the buffering capacity of the soils?
• For the contaminants desorbed from the soil matrix, can the emissions be adsorbed on activated carbon or is a thermal oxidizer or acid gas scrubber required to reduce the emission levels to below air discharge limits?
• For the contaminants desorbed from the soil matrix, will the hydrocarbons desorb in a manner such that char (i.e., coke) formation in the vacuum extraction wells is a concern? And should supplemental precautions, such as air bleeds, be provided to clean the extraction wells in the event of excessive char deposition? 5-2.1.2.1 In general, the cost of the process design evaluation is greater than a feasibility demonstration, with the principal differences being the additional analytical work and the time required to do two sequential studies. The only circumstance where a feasibility demonstration should be done before the process design evaluation is where the issue of achievement of treatment objectives or the appropriateness of TCH for a given COC is in question. PCBs and dioxins fall within the former category (i.e., contaminants whose treatability with TCH has been well established) and new applications of TCH, such as mercury removal, are an example of the latter. 5-2.1.2.2 To gain insight into the process design issues, several modifications to the standard feasibility demonstration apparatus and testing procedures are instituted:
• A custom test chamber is utilized with uniform heating and multiple temperature measurements in the soil sample.
• The purge gas flow rate through the test chamber is controlled at a much lower flow rate.
• The off-gases pass through a gas cleanup train consisting of a condenser and activated carbon trap. Additional filtering through a packed bed scrubber is used when the contaminants of concern include significant concentrations of chlorinated hydrocarbons.
• The off-gases are monitored for total hydrocarbon level, either by use of an FID detector or a combustible gas detector.
• Air sampling and impinger tubes may also be used to examine the loading of a specific COC or its vapor-phase concentration.
• The test chamber temperatures are charted to detect short-term transients, in addition to data-logged temperature data. 5-2.1.2.3 The data produced during the process design evaluation is analyzed using procedures appropriate for the COCs in the soil matrix. Further, these data are also used to select and design the AQC equipment. As such, each process design evaluation effort and analytical plan is configured for the site-specific requirements of the individual remediation application. 5-2.1.2.4 Data produced during feasibility demonstrations or process design evaluations can provide valuable input parameters for simulation modeling during design.
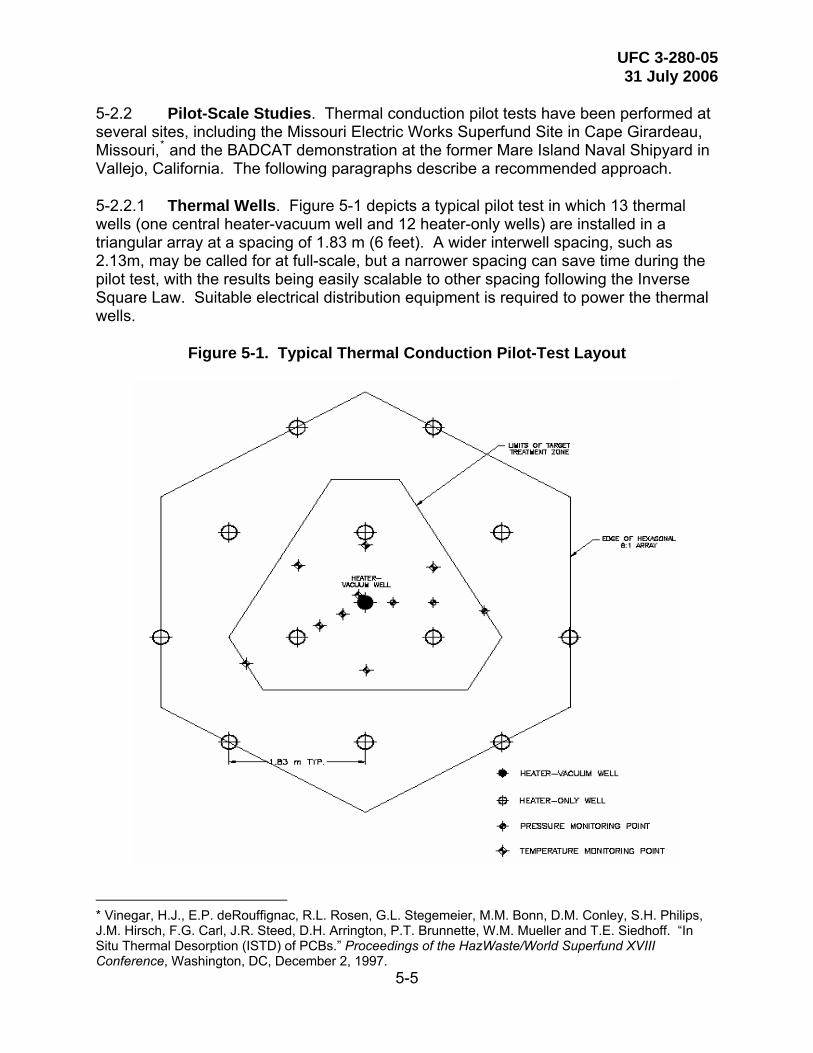
UFC 3-280-05 31 July 2006
5-5
5-2.2 Pilot-Scale Studies. Thermal conduction pilot tests have been performed at several sites, including the Missouri Electric Works Superfund Site in Cape Girardeau, Missouri,* and the BADCAT demonstration at the former Mare Island Naval Shipyard in Vallejo, California. The following paragraphs describe a recommended approach. 5-2.2.1 Thermal Wells. Figure 5-1 depicts a typical pilot test in which 13 thermal wells (one central heater-vacuum well and 12 heater-only wells) are installed in a triangular array at a spacing of 1.83 m (6 feet). A wider interwell spacing, such as 2.13m, may be called for at full-scale, but a narrower spacing can save time during the pilot test, with the results being easily scalable to other spacing following the Inverse Square Law. Suitable electrical distribution equipment is required to power the thermal wells.
Figure 5-1. Typical Thermal Conduction Pilot-Test Layout
* Vinegar, H.J., E.P. deRouffignac, R.L. Rosen, G.L. Stegemeier, M.M. Bonn, D.M. Conley, S.H. Philips, J.M. Hirsch, F.G. Carl, J.R. Steed, D.H. Arrington, P.T. Brunnette, W.M. Mueller and T.E. Siedhoff. “In Situ Thermal Desorption (ISTD) of PCBs.” Proceedings of the HazWaste/World Superfund XVIII Conference, Washington, DC, December 2, 1997.
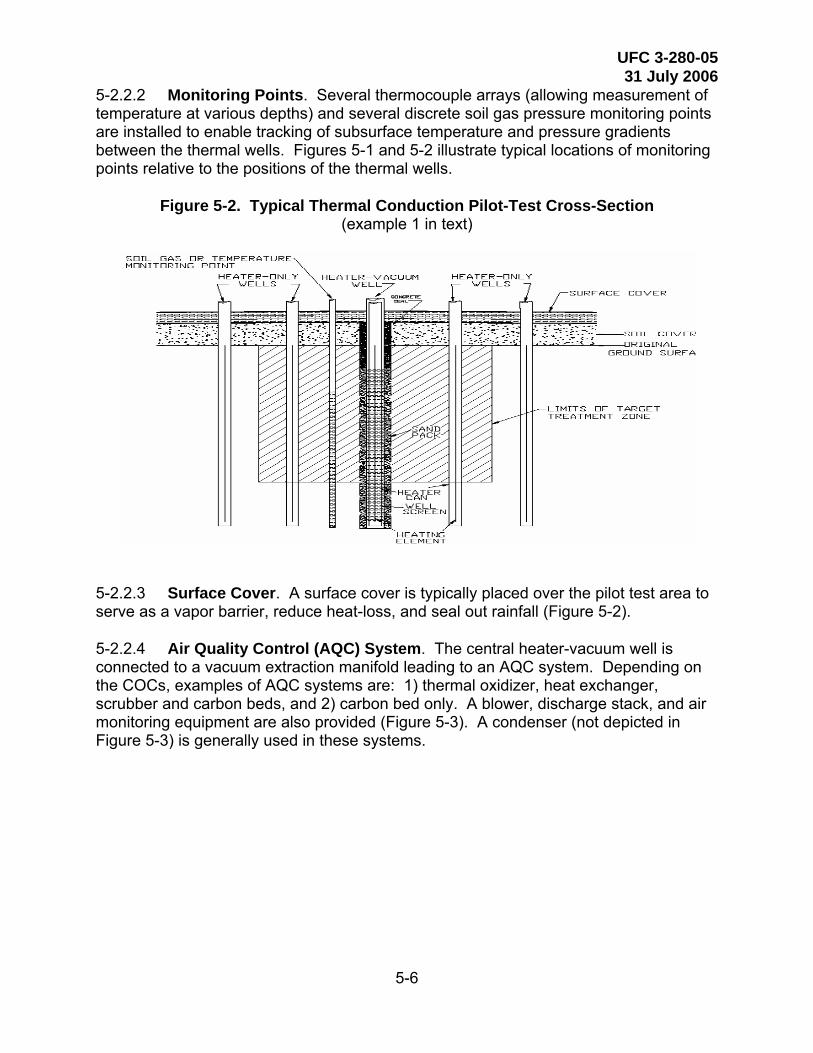
UFC 3-280-05 31 July 2006
5-6
5-2.2.2 Monitoring Points. Several thermocouple arrays (allowing measurement of temperature at various depths) and several discrete soil gas pressure monitoring points are installed to enable tracking of subsurface temperature and pressure gradients between the thermal wells. Figures 5-1 and 5-2 illustrate typical locations of monitoring points relative to the positions of the thermal wells.
Figure 5-2. Typical Thermal Conduction Pilot-Test Cross-Section (example 1 in text)
5-2.2.3 Surface Cover. A surface cover is typically placed over the pilot test area to serve as a vapor barrier, reduce heat-loss, and seal out rainfall (Figure 5-2).
5-2.2.4 Air Quality Control (AQC) System. The central heater-vacuum well is connected to a vacuum extraction manifold leading to an AQC system. Depending on the COCs, examples of AQC systems are: 1) thermal oxidizer, heat exchanger, scrubber and carbon beds, and 2) carbon bed only. A blower, discharge stack, and air monitoring equipment are also provided (Figure 5-3). A condenser (not depicted in Figure 5-3) is generally used in these systems.
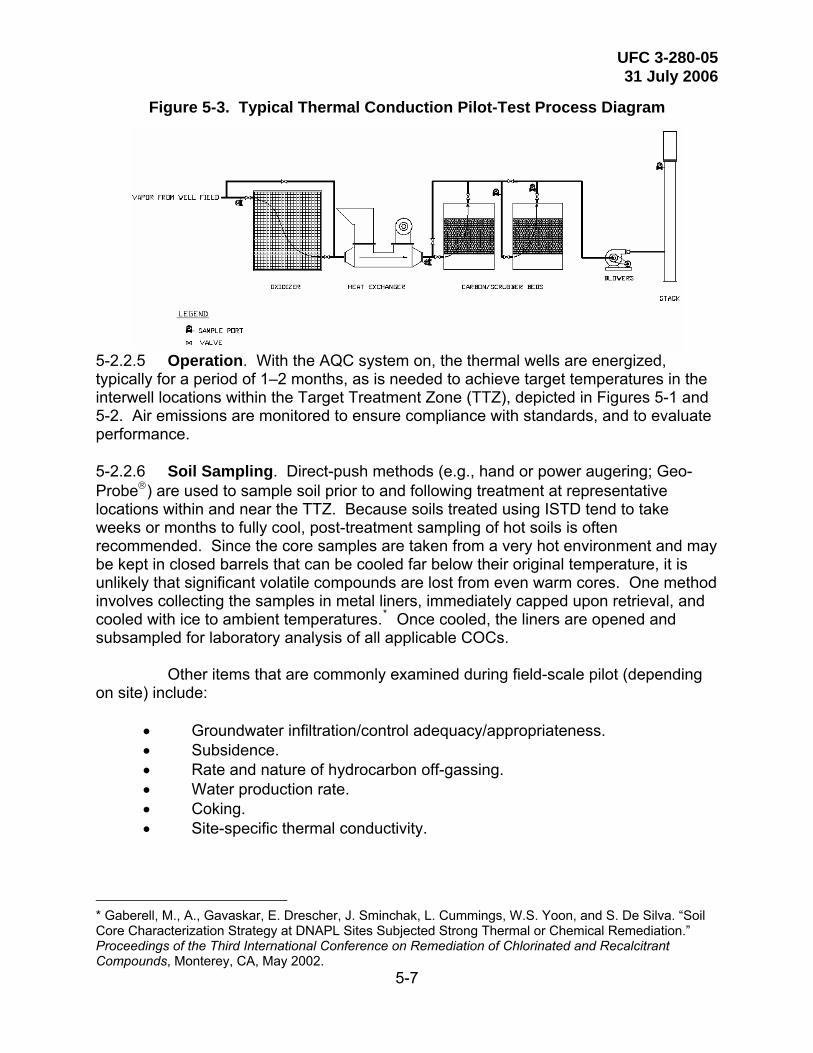
UFC 3-280-05 31 July 2006
5-7
Figure 5-3. Typical Thermal Conduction Pilot-Test Process Diagram
5-2.2.5 Operation. With the AQC system on, the thermal wells are energized, typically for a period of 1–2 months, as is needed to achieve target temperatures in the interwell locations within the Target Treatment Zone (TTZ), depicted in Figures 5-1 and 5-2. Air emissions are monitored to ensure compliance with standards, and to evaluate performance. 5-2.2.6 Soil Sampling. Direct-push methods (e.g., hand or power augering; Geo-Probe®) are used to sample soil prior to and following treatment at representative locations within and near the TTZ. Because soils treated using ISTD tend to take weeks or months to fully cool, post-treatment sampling of hot soils is often recommended. Since the core samples are taken from a very hot environment and may be kept in closed barrels that can be cooled far below their original temperature, it is unlikely that significant volatile compounds are lost from even warm cores. One method involves collecting the samples in metal liners, immediately capped upon retrieval, and cooled with ice to ambient temperatures.* Once cooled, the liners are opened and subsampled for laboratory analysis of all applicable COCs. Other items that are commonly examined during field-scale pilot (depending on site) include:
• Groundwater infiltration/control adequacy/appropriateness. • Subsidence. • Rate and nature of hydrocarbon off-gassing. • Water production rate. • Coking. • Site-specific thermal conductivity.
* Gaberell, M., A., Gavaskar, E. Drescher, J. Sminchak, L. Cummings, W.S. Yoon, and S. De Silva. “Soil Core Characterization Strategy at DNAPL Sites Subjected Strong Thermal or Chemical Remediation.” Proceedings of the Third International Conference on Remediation of Chlorinated and Recalcitrant Compounds, Monterey, CA, May 2002.

UFC 3-280-05 31 July 2006
5-8
5-3 ELECTRICAL RESISTIVITY HEATING 5-3.1 Bench-Scale Studies. Bench tests are usually not done prior to electrical resistivity heating (ERH) projects. Removal of VOCs through steam distillation is a physical process that is relatively well understood in comparison to the removal processes of most other remediation techniques. However, an ERH bench test may be warranted under the following circumstances:
• The treatment region consists of landfill debris or other non-soil material. • The treatment region includes peat layers or buried wood debris (the
effects of extremely high TOC levels are not well known at present). • The target VOC is dissolved into a greater mass of oil or other low
volatility hydrocarbon (Raoult’s Law effects are difficult to predict). • For determining attainable concentrations, where significant groundwater
flow exists, or to evaluate materials of construction (e.g., to determine corrosion potential). An ERH bench test usually includes the following steps:
• Pre-test aliquots of soil are analyzed. • Soil is packed into a small sealed reactor vessel and heated, usually by
placing the reactor in a muffle furnace (for the purpose of bench testing, the method of heating is not important).
• As the soil is heated, a very small amount of air is injected into the reactor as a carrier gas and the off-gas from the reactor is condensed.
• When a target condensate production is reached (typically 10 to 15 volume percent of the soil sample), heating is terminated and the reactor is cooled to 4°C and a post-test soil sample is analyzed. For best results, bench testing should be performed in triplicate.*
5-3.2 Pilot Tests. Pilot tests may be conducted using either three or six phase modes of heating. Typically, pilot tests have been conducted to demonstrate feasibility rather than evaluate a process design or optimization. This is because the process design is relatively straightforward using ERH. Pilot testing typically involves installing a six phase array of electrodes to heat a selected portion of the impacted area to be treated. The major difference between a pilot- and full-scale application is the number of arrays and, hence, the capacity of the power control unit and ancillary treatment equipment. 5-4 STEAM ENHANCED EXTRACTION. Laboratory treatability studies for steam injection should be done when the contaminants are semi-volatile and, thus, some question exists of the amount of steam or energy that might be needed to achieve
* Dozens of bench scale tests similar to what is described above have been conducted for TCH. This experience has shown the results to be highly repeatable, such that it may not be necessary to conduct testing for ERH applications in triplicate. Existing vendor databases should be checked before bench-scale testing is undertaken.
UFC 3-280-05 31 July 2006
5-9
the desired residual concentrations of contaminants in the soil, or to estimate the likely residual concentrations for a given number of pore volumes of steam injection. When there is a mixture of contaminants present, it may also be beneficial to determine the physical properties of the non-aqueous phase liquids as a function of temperature. Brief descriptions of the laboratory experiments follow. 5-4.1 Physical Properties. Density can be measured as a function of temperature using a method similar to ASTM D1217-93, with a water bath to control the temperature of the sample in the range from ambient temperatures to near steam temperatures. These data can be used to determine if DNAPLs, such as creosote or coal tar, will become LNAPLs as the temperature is increased. Because chlorinated solvents remain denser than water at temperatures below their boiling point, this testing is of less use for chlorinated NAPLs. Viscosity can be measured by a method similar to ASTM D1296, using a jack-eted beaker to maintain the sample at the desired temperature and allowing measurements to be made ranging from ambient to steam temperatures. These data demonstrate the increased mobility of the liquid as the temperature is increased. Generally, contaminants such as creosote or coal tar, which have relatively high viscosities at ambient temperatures, will show significant increases in mobility as the temperature is increased. Chlorinated solvents generally have relatively low viscosities at ambient temperatures, and the increased mobility with temperature is not as great. Surface and interfacial tension measurements can also be made using ASTM D971 and jacketed beakers to maintain the samples at the desired temperature. Decreases in surface and interfacial tension with temperature may reduce residual liquid saturations and allow more of the contaminants to be collected as a liquid, and, therefore, more of the high boiling point contaminants may be recovered. 5-4.2 Steam Injection Experiments. The laboratory setup for a one-dimensional steam injection experiment is shown in Figure 5-4. Metering pumps are used to deliver a set flow rate (50–100 mL•hour-1 for the size soil sample used here) of water to the steam generator. The power input to the steam generator was set to produce steam at a temperature of 150ºC (302ºF). Steam is injected into the top of the soil column to produce a vertical downward flow through the column. Galvanized steel columns, approximately 5 cm (2 inches) in diameter and 15 cm (6 inches) long, which are threaded on both ends, and for which endcaps, can be purchased are convenient for these experiments. Clean sand should be placed in the bottom endpiece of the column to facilitate collection of the effluent steam and recovered contaminants, and the column itself is then filled with approximately 600 to 700 g (1.3 to 1.5 pounds) of contaminated soil from the site. Soil from the most contaminated areas of the site should be used. The top endpiece of the column is not packed with soil to help distribute steam evenly to the top of the soil. Thermocouples can be used at the effluent of the steam generator, in the top of the column, at the midpoint of the column, and in the effluent line. The column is wrapped with heater tape and then covered with insulation to ensure that the entire column remains at steam temperatures. Rubber-coated heater tape, 2.5 cm- (1 inch) wide and 1.22 m (4 feet) long, has been used to wrap the column. The heater tape is plugged into a variable autotransformer to control the heat input to the column.

UFC 3-280-05 31 July 2006
5-10
5-4.2.1 Column effluent goes through a heat exchanger before being collected in a sample bottle immersed in an ice bath. For most cases, two to four pore volumes of steam will be adequate to recover most of the contaminants. Effluent sample containers should be changed approximately every half pore volume so that approximately how rapidly the contaminants are recovered as a function of the pore volumes of steam injected can be determined. However, when determining the sample size, the size needed for the chemical analysis to be performed should be considered. For some semi-volatile contaminants that are present in the initial soil at high concentrations, there may be the potential for them to condense and plug the effluent line. Care should be taken to monitor the sample collection and the pressure in the column to determine if this is happening. If volatile contaminants are being recovered, collection of the effluent vapors may be improved by using a solvent, such as dichloromethylene or methanol, in the sample collection bottle to trap the vapors.
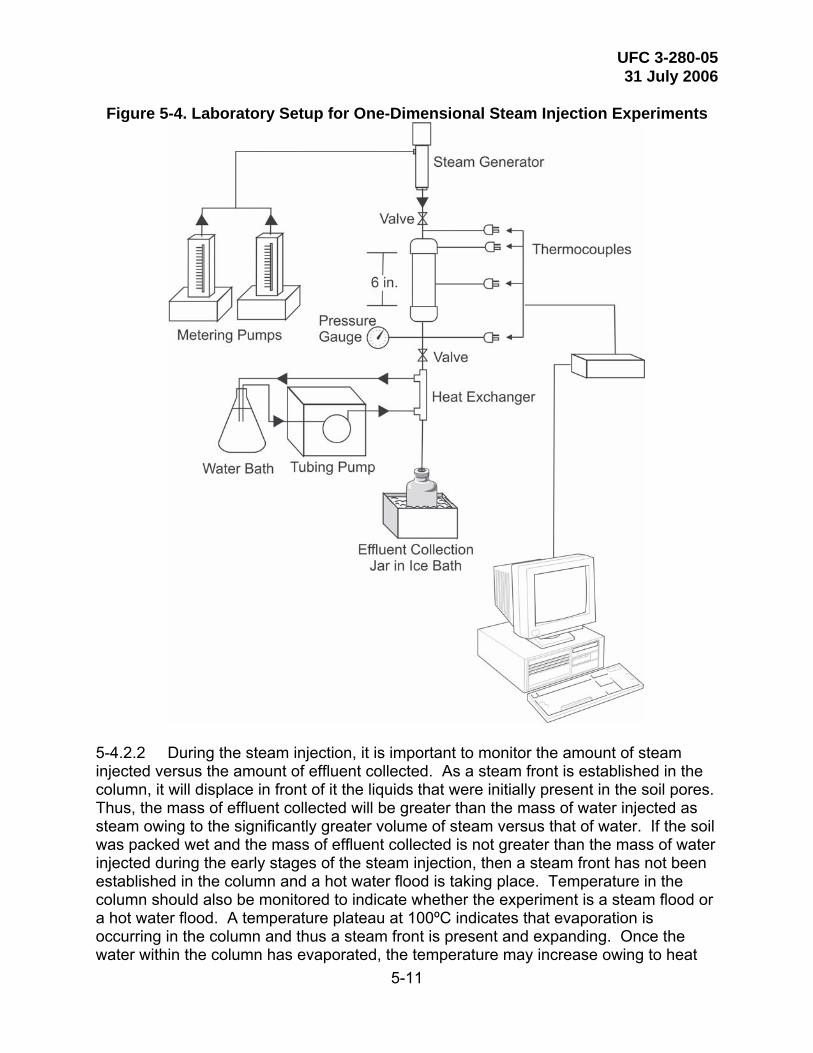
UFC 3-280-05 31 July 2006
5-11
Figure 5-4. Laboratory Setup for One-Dimensional Steam Injection Experiments
5-4.2.2 During the steam injection, it is important to monitor the amount of steam injected versus the amount of effluent collected. As a steam front is established in the column, it will displace in front of it the liquids that were initially present in the soil pores. Thus, the mass of effluent collected will be greater than the mass of water injected as steam owing to the significantly greater volume of steam versus that of water. If the soil was packed wet and the mass of effluent collected is not greater than the mass of water injected during the early stages of the steam injection, then a steam front has not been established in the column and a hot water flood is taking place. Temperature in the column should also be monitored to indicate whether the experiment is a steam flood or a hot water flood. A temperature plateau at 100ºC indicates that evaporation is occurring in the column and thus a steam front is present and expanding. Once the water within the column has evaporated, the temperature may increase owing to heat
UFC 3-280-05 31 July 2006
5-12
input from the heater tape. In some cases, the temperature may be above 100ºC, but pressure within the column can cause condensation of the steam and thus a hot water flood. For most types of contaminants, a steam flood is going to recover significantly more of the contaminants than a hot water flood. Thus, it is important to ensure that a steam front is formed in the column to get a valid laboratory test of the steam enhanced extraction technology. 5-4.2.3 After a steam front has been established throughout the column, pressure cycling can be used to increase contaminant recovery rates as a vapor. This is done by closing a valve on the effluent line of the column (while steam injection continues) allowing pressure to build up in the column. The pressure should be monitored by a pressure gauge in the effluent line above the valve. After approximately 70-100 kPa (10-15 psi) of pressure has built up in the column, the valve is opened and the pressure is allowed to dissipate. This process mimics pressure cycling that can be done in the field during steam injection to increase the rate of volatile contaminant recovery. 5-4.2.4 After completion of the steam injection, the column should be taken apart and the soil divided into two or three samples (for example, top, middle, and bottom of the column) for analysis. A sample of the initial soil should also be analyzed. 5-4.2.5 It may be desirable to know the groundwater concentrations of contaminants in equilibrium with the residual contaminants adsorbed onto the soil after a steam injection. If so, water can be added to the column after the steam injection is complete and allowed to equilibrate with the steamed soil for a period of time. Twenty-four hour contact periods have been used in the past; however, that time may not be adequate for full equilibrium between the adsorbed contaminants and the water. For comparison, an initial leachate sample should also be obtained before steam injection is started. After the equilibration period, the water is drained from the column and analyzed separately. 5-4.3 Pilot Tests. For SEE, pilot tests may be carried out:
• To confirm design parameters, such as well spacing, injection pressures and rates, pumping rates, etc.
• To assess feasibility of technology with respect to site conditions or contaminant-e.g. applications in bedrock where the technology is less proven, determine feasibility with high boiling point compounds, soil stability or stratification issues.
• Where there is uncertainty in the operation of the treatment equipment in dealing with the ranges of concentrations that may be encountered.
• Most of the considerations regarding the approach to pilot tests discussed in Paragraph 5.1 are applicable to SEE.
UFC 3-280-05 31 July 2006
6-1
CHAPTER 6
DESIGN CONSIDERATIONS 6-1 INTRODUCTION AND OVERALL DESIGN STRATEGY. Once the overall remediation strategy is defined (Chapter 4), the area to be treated is defined, and subsurface extent is established, the design process can begin. What must be kept in mind is that the application of these ISTR techniques is modular in nature:
• Thermal conduction is applied using a central vacuum well surrounded by heater wells and the pattern is repeated to cover the area to be treated. The spacing is determined by the rate of heat input versus heat losses, the target temperature, desired duration of treatment, and, to a lesser extent, by the thickness of soil to be treated.
• ERH, whether applied in six or three phase approaches, involves a regular pattern of electrodes-hexagonal arrangements for six phase and triangular for three phase. The spacing of the electrodes is dictated in large part by the effective diameter of the individual electrodes. The diameter of the electrode array for six-phase heating is typically 5.2 to 12.2 m (17 to 40 feet), and the distance between electrodes is typically 2.6 to 6.1 m (8.5 to 20 feet) for three-phase heating. Heat losses are an input parameter for determining treatment time, but do not influence electrode spacing.
• Steam is applied in either a 5-spot (four injection wells surrounding a central groundwater recovery well) or a 7-spot (six injection wells surrounding a central groundwater recovery well) pattern. The patterns are repeated, if necessary, to treat the area. Well spacing is determined by both vertical and horizontal hydraulic conductivity, time desired for heating, and depth and thickness of the zone to be treated. Heat losses are not typically factored into the design. The following paragraphs discuss the factors to consider in designing remediation systems using the individual technologies. The reader is directed to ER 1110-1-8155, Specifications, ER 1110-345-700, Design Analysis, Drawings, and Specifications, and ER 1180-1-9, Design-Build Contracting, for the design requirements. 6-2 THERMAL CONDUCTIVE HEATING. As with other thermal remediation technologies, design of a thermal conduction remediation system, whether for an in situ application (ISTD) or an ex-situ application (e.g., soil pile, in-pile thermal destruction [IPTD]), requires consideration of a number of site- and contaminant-specific factors. These include, but are not limited to, the target soil treatment temperature and desired remediation time, heater and extraction well components, energy and power delivery and distribution, vapor collection/conveyance system configuration, air quality control system, and other regulatory requirements. These design considerations are discussed in the following paragraphs.

UFC 3-280-05 31 July 2006
6-2
6-2.1 Example Calculation. The energy balance for raising the subsurface temperature to the boiling point of water and boiling off all of the pore water initially present (e.g., to thoroughly treat SVOCs) is*
( ) ( )1 bR R w w w b i w w w
tC C S T T h SAβρ φ ρ φ ρ φ⎡ ⎤− + − + =⎣ ⎦ (6-1)
where values to electrically heat a typical silica sandy soil are: ρR = 2.650×10⁶ g•m–3 (density of quartz grains) CR = 1.211×10⁻⁵ W•day•g–1•°C (heat capacity of silica) φ = 0.35 (typical porosity value for sandy soil) ρw = 1.00 ×10⁶ g•m–3 (density of water) Cw = 4.846 ×10⁻⁵ W•day•g–1•°C (heat capacity of water) Sw = 0.6 (typical water saturation [fraction of the pore space occupied by liquid
water] as estimated from descriptions of moisture content in soil boring logs, which range from dry to moist above the water table)
Tb = 100°C (boiling point of water at atmospheric pressure) Ti = 13°C (typical initial temperature value for near-surface soil) hw = 0.0261 W•day•g–1 (latent heat of vaporization of water at atmospheric
pressure) β = 984.2 W•m–1 (average power input per unit length of thermal conduction
well) tb = time (days) required to heat and boil off all the initial water A = (2.13 m)(2.13 m)(sin 60°) = 3.942 m2 (area heated by each well
embedded within an equilateral triangular pattern of wells spaced 2.13 m or 7 feet apart)
6-2.1.1 The first term on the left is the energy required to heat the mineral grains, the middle term is the energy required to heat the water, and the third term is the energy required to vaporize the water. The right-hand side of the equation is the energy input by a heating well into the soil volume surrounding it. Note that φ, Sw, Ti, β and A are typically user-specified input values, while the remaining terms are constants, except for tb (to be solved for). This equation does not account for conductive heat losses to the adjacent formation and overlying surface, or for convective heat losses through collected gas and water that originate from outside the treated volume. Rearranging 6-1 to solve for tb:
( ) ( ){ }1R R w w w b i w w wb
A C C S T T h St
ρ φ ρ φ ρ φ
β
⎡ ⎤− + − +⎣ ⎦= (6-2)
For the values given above, the time tb required to heat the soil and boil off all the water initially present is approximately 33 days. From the result of equation (6-2), it is seen
* TerraTherm and Weston. “Final RCRA Closure Plan, Basis for Design/Final Report.” TherraTherm Environmental Services, Inc., The Woodlands, TX and Roy F Weston Inc., Vernon Hills, IL. December 1997.
UFC 3-280-05 31 July 2006
6-3
that over the thermal treatment period, the amount of electrical power that each thermal well will consume, tb β = 780 kWhr•m–1 (238 kWhr•ft–1) of heater length. Dividing by the treatment volume, tb β /A = ~200 kWhr•m–3 treated, which at $0.075/kWhr is about $11/cy of electrical cost. 6-2.1.2 The impact of water recharge is more complicated and requires numerical simulation to adequately address. Above the water table, there can still be recharge during remediation from rain falling directly on the site or seeping in from the subsurface around the lateral boundaries, and to a lesser extent from capillary rise if the treatment zone is within the capillary fringe zone. Below the water table, sand or gravel layers that are laterally contiguous to the targeted interval, or utility trenches, especially, offer possible pathways for subsurface recharge. The capability of thermal conduction heaters to tolerate recharge of groundwater at a given site can be estimated by comparing 1) the rate of energy injection per volume of treatment zone to 2) the energy required to heat soil grains and water within that volume to the treatment temperature. The following example calculation illustrates this. 6-2.1.3 As a first approximation, the flux of water Qw in L•day–1- that can be heated and boiled off by a row of n thermal wells, with submerged heaters b m deep may be estimated as follows (preserving the units given above):
( )( ) ( )31m /1000w
w w b i w w
bnQ
C T T hβ
ρ ρ=⎡ ⎤− +⎣ ⎦
(6-3)
6-2.1.4 Thus, continuing the example, a row of 10 thermal wells, the heaters of which are initially submerged 4 m deep, has the capacity to heat and boil off approximately 1300 L•day–1, or 0.24 gpm. This equation does not account for the potential of the generated steam to exert a pressure around each thermal well that diminishes or even opposes the pre-existing hydraulic gradient, and which may therefore prevent the influx of outside water into the heated zone. 6-2.1.5 Treatment of VOC-contaminated soil and waste located above the water table (i.e., in the vadose zone) by conductive heating may be considered a form of thermally enhanced soil vapor extraction (SVE). As such, the requisite data needs are addressed in large part in other guidance, such as the EM 1110-1-4001, Soil Vapor Extraction and Bioventing. With the addition of in situ heating, however, permeability becomes much less of an issue than with SVE that is not thermally enhanced. Heating soil to raise the formation temperature a modest amount may substantially increase VOC removal rates, as a 10°C temperature increase results in approximately a three to four-fold increase in vapor pressure, which in turn results in greater VOC mass transfer to the vapor phase for removal by the SVE system. Heating of low-permeability or nearly saturated soil to the boiling point of water creates in situ steam generation, whereby VOCs can be effectively steam-stripped out of the soil. 6-2.1.6 In the case of non-aqueous phase liquids (NAPL) forming azeotropes with water, steam distillation can be accomplished at a compound’s eutectic point, which in the case of TCE in water is 73.1°C (versus the boiling point of TCE of 87.1ºC).
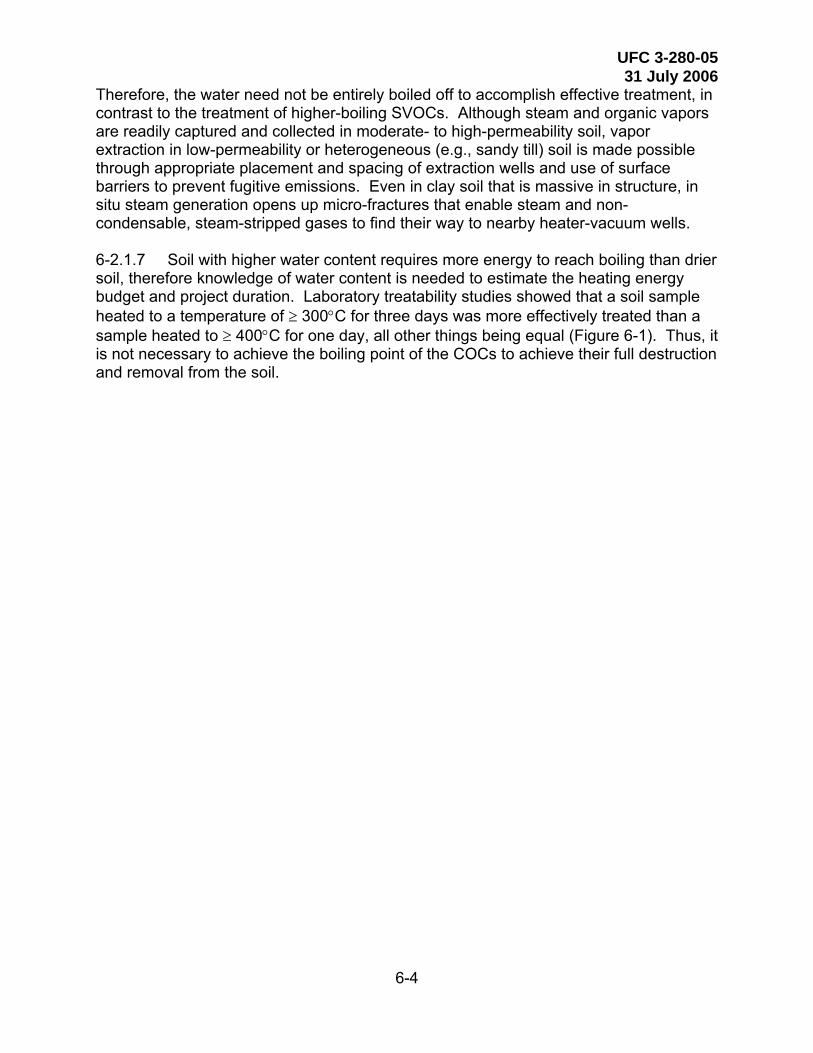
UFC 3-280-05 31 July 2006
6-4
Therefore, the water need not be entirely boiled off to accomplish effective treatment, in contrast to the treatment of higher-boiling SVOCs. Although steam and organic vapors are readily captured and collected in moderate- to high-permeability soil, vapor extraction in low-permeability or heterogeneous (e.g., sandy till) soil is made possible through appropriate placement and spacing of extraction wells and use of surface barriers to prevent fugitive emissions. Even in clay soil that is massive in structure, in situ steam generation opens up micro-fractures that enable steam and non-condensable, steam-stripped gases to find their way to nearby heater-vacuum wells. 6-2.1.7 Soil with higher water content requires more energy to reach boiling than drier soil, therefore knowledge of water content is needed to estimate the heating energy budget and project duration. Laboratory treatability studies showed that a soil sample heated to a temperature of ≥ 300°C for three days was more effectively treated than a sample heated to ≥ 400°C for one day, all other things being equal (Figure 6-1). Thus, it is not necessary to achieve the boiling point of the COCs to achieve their full destruction and removal from the soil.
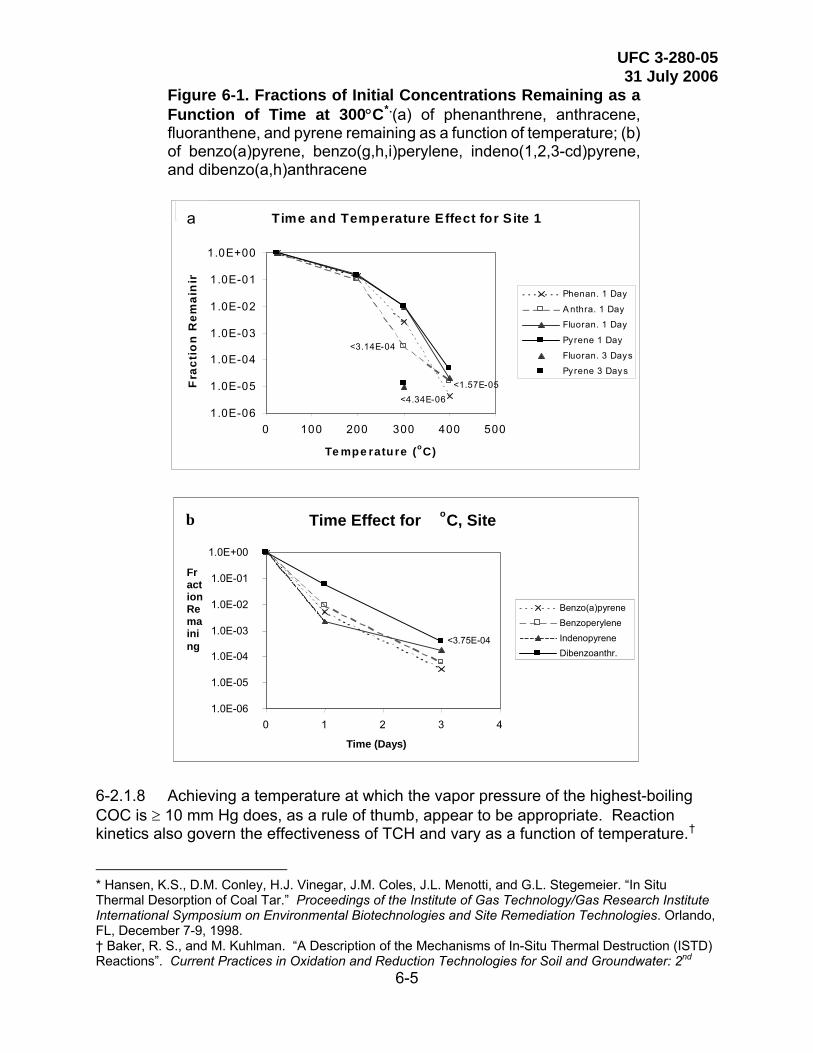
UFC 3-280-05 31 July 2006
6-5
Figure 6-1. Fractions of Initial Concentrations Remaining as a Function of Time at 300°C*.(a) of phenanthrene, anthracene, fluoranthene, and pyrene remaining as a function of temperature; (b) of benzo(a)pyrene, benzo(g,h,i)perylene, indeno(1,2,3-cd)pyrene, and dibenzo(a,h)anthracene
Time and Temperature Effect for S ite 1
<4.34E-06<1.57E-05
<3.14E-04
1.0E-06
1.0E-05
1.0E-04
1.0E-03
1.0E-02
1.0E-01
1.0E+00
0 100 200 300 400 500
Te mpe rature (oC)
Fra
ctio
n R
emai
nin
Phenan. 1 Day
A nthra. 1 Day
Fluoran. 1 Day
Pyrene 1 Day
Fluoran. 3 Days
Pyrene 3 Days
a
a
Time Effect for oC, Site
<3.75E-04
1.0E-06 1.0E-05 1.0E-04 1.0E-03 1.0E-02 1.0E-01 1.0E+00
0 1 2 3 4
Time (Days)
Fraction Remaining
Benzo(a)pyrene Benzoperylene Indenopyrene Dibenzoanthr.
b
6-2.1.8 Achieving a temperature at which the vapor pressure of the highest-boiling COC is ≥ 10 mm Hg does, as a rule of thumb, appear to be appropriate. Reaction kinetics also govern the effectiveness of TCH and vary as a function of temperature.†
* Hansen, K.S., D.M. Conley, H.J. Vinegar, J.M. Coles, J.L. Menotti, and G.L. Stegemeier. “In Situ Thermal Desorption of Coal Tar.” Proceedings of the Institute of Gas Technology/Gas Research Institute International Symposium on Environmental Biotechnologies and Site Remediation Technologies. Orlando, FL, December 7-9, 1998. † Baker, R. S., and M. Kuhlman. “A Description of the Mechanisms of In-Situ Thermal Destruction (ISTD) Reactions”. Current Practices in Oxidation and Reduction Technologies for Soil and Groundwater: 2nd
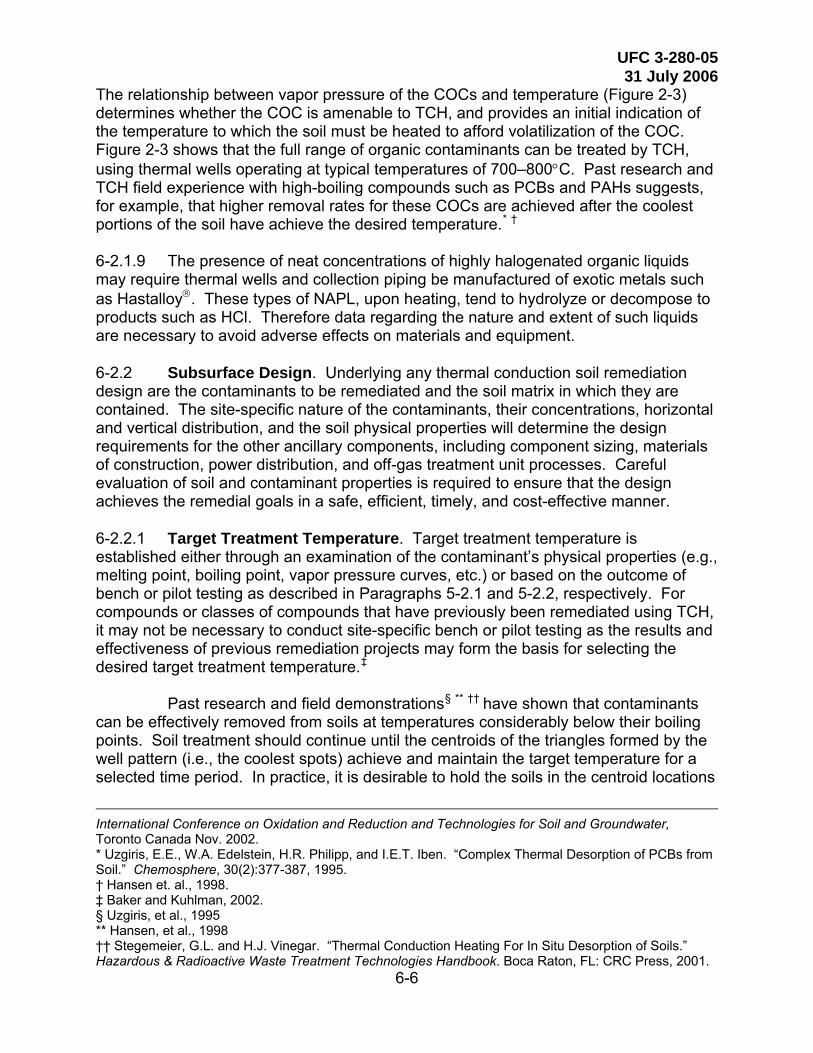
UFC 3-280-05 31 July 2006
6-6
The relationship between vapor pressure of the COCs and temperature (Figure 2-3) determines whether the COC is amenable to TCH, and provides an initial indication of the temperature to which the soil must be heated to afford volatilization of the COC. Figure 2-3 shows that the full range of organic contaminants can be treated by TCH, using thermal wells operating at typical temperatures of 700–800°C. Past research and TCH field experience with high-boiling compounds such as PCBs and PAHs suggests, for example, that higher removal rates for these COCs are achieved after the coolest portions of the soil have achieve the desired temperature.* †
6-2.1.9 The presence of neat concentrations of highly halogenated organic liquids may require thermal wells and collection piping be manufactured of exotic metals such as Hastalloy®. These types of NAPL, upon heating, tend to hydrolyze or decompose to products such as HCl. Therefore data regarding the nature and extent of such liquids are necessary to avoid adverse effects on materials and equipment. 6-2.2 Subsurface Design. Underlying any thermal conduction soil remediation design are the contaminants to be remediated and the soil matrix in which they are contained. The site-specific nature of the contaminants, their concentrations, horizontal and vertical distribution, and the soil physical properties will determine the design requirements for the other ancillary components, including component sizing, materials of construction, power distribution, and off-gas treatment unit processes. Careful evaluation of soil and contaminant properties is required to ensure that the design achieves the remedial goals in a safe, efficient, timely, and cost-effective manner. 6-2.2.1 Target Treatment Temperature. Target treatment temperature is established either through an examination of the contaminant’s physical properties (e.g., melting point, boiling point, vapor pressure curves, etc.) or based on the outcome of bench or pilot testing as described in Paragraphs 5-2.1 and 5-2.2, respectively. For compounds or classes of compounds that have previously been remediated using TCH, it may not be necessary to conduct site-specific bench or pilot testing as the results and effectiveness of previous remediation projects may form the basis for selecting the desired target treatment temperature.‡
Past research and field demonstrations§ ** †† have shown that contaminants can be effectively removed from soils at temperatures considerably below their boiling points. Soil treatment should continue until the centroids of the triangles formed by the well pattern (i.e., the coolest spots) achieve and maintain the target temperature for a selected time period. In practice, it is desirable to hold the soils in the centroid locations
International Conference on Oxidation and Reduction and Technologies for Soil and Groundwater, Toronto Canada Nov. 2002. * Uzgiris, E.E., W.A. Edelstein, H.R. Philipp, and I.E.T. Iben. “Complex Thermal Desorption of PCBs from Soil.” Chemosphere, 30(2):377-387, 1995. † Hansen et. al., 1998. ‡ Baker and Kuhlman, 2002. § Uzgiris, et al., 1995 ** Hansen, et al., 1998 †† Stegemeier, G.L. and H.J. Vinegar. “Thermal Conduction Heating For In Situ Desorption of Soils.” Hazardous & Radioactive Waste Treatment Technologies Handbook. Boca Raton, FL: CRC Press, 2001.
UFC 3-280-05 31 July 2006
6-7
at or above the target treatment temperature for a minimum period of 2 to 3 days to ensure complete and thorough remediation of the COCs. It should be noted however, that soils closer to the operating thermal wells will be much hotter, typically on the order of 500 to 550°C (approx. 900 to 1000°F). As contaminants are desorbed from the soil, they travel toward the heater-vacuum wells through increasingly hotter soils, over a period of hours or days. It is the extended residence time at these elevated temperatures that provides TCH with such high in situ destruction of contaminants. 6-2.2.2 Thermal Well Spacing and Orientation. Once the target treatment temperature has been selected, it then falls to the designer to determine the appropriate orientation and spacing of thermal wells to achieve the target temperature in an efficient and cost-effective manner. In most cases, a hexagonal heater pattern is used, with six heater wells installed around the perimeter of the hexagon and a single producer (heater-vacuum) well installed at the center of the pattern. Edge-centered heater patterns (i.e., heaters wells located at the mid-point of the perimeter segments of the hexagon) typically provide better superposition and less heat loss than apex patterns (i.e., heater wells located at the points of the hexagon, Figure 6-2).
Figure 6-2. Example of 3:1 Edge-Centered Pattern (producer well = heater vacuum well)
6-2.2.2.1 This edge-centered hexagonal pattern results in a greater 3:1 heater to producer well ratio, as the heaters on the perimeter of the hexagons are each shared by two producers (refer to Figure 6-2 for an example of such a well pattern). Other patterns and ratios are possible and may be used by the designer to optimize the site design or to achieve a specific goal (e.g., early containment of contaminant vapors). For a given heater power (expressed as W•m-1), smaller spacing between the thermal wells will result in a shorter remediation period, as there is a higher energy density per unit volume of soil. Increasing the spacing between thermal wells will reduce material requirements; however, it will also extend the time required to achieve the target treatment temperature at the centroids and increase the amount of heat loss to areas above and below the target zone. Heating duration is proportional to the square of the
UFC 3-280-05 31 July 2006
6-8
distance between thermal wells. As such, there is a tradeoff between the cost of capital equipment (e.g., well materials, electrical distribution equipment, fume manifold piping, etc.) and operating cost, which the designer should seek to optimize. Other site-specific factors may also enter into the selection of appropriate well spacing, including minimizing disturbance to ongoing facility operations, property clean up or transfer deadlines, or seasonal weather considerations. 6-2.2.2.2 Another factor to consider in the layout of the well field may be termed “edge effects.” These edge effects include heat losses along the perimeter of the treatment zone or at the top and bottom of the treatment zone, where there is no superposition of the heat fronts from adjacent wells. To counteract the edge effects around the perimeter of the target treatment zone, the thermal well field typically extends at least 1.5 m (5 feet) laterally beyond the limits of the delineated target treatment zone. To counteract the heat losses at the top and bottom surfaces of the target treatment zone, heater elements typically extend at least 0.6 m (2 feet) vertically beyond the limits of the delineated target treatment zone. In addition, at some sites, the top or bottom of the heater elements may be boosted to deliver more power to upper or lower zones. To minimize heat losses from the top of the treatment zone, thermal insulation may need to be added in the form of a surface cover (e.g., constructed of mineral board insulation or light-weight concrete). 6-2.2.2.3 In addition, vapors and air withdrawn from the producer wells for transmission to the off-gas treatment system carry away a portion of the heat energy delivered by the producer wells, reducing their thermal efficiency by approximately 30%. Thus, it may be desirable to alter the well pattern to minimize or eliminate producer wells along the well field perimeter. In other cases, where vapor containment along a perimeter is a primary and overriding concern (e.g., adjacent to residences), it may be necessary to sacrifice thermal efficiency and have an entire segment of the well field perimeter composed of producer wells. These perimeter heater-vacuum wells can be switched over to function as heater-only wells once vapor capture at the edge of the contaminated zone has been achieved. 6-2.3 Thermal Wells. As stated previously, there are two types of wells used for thermal conductive heating projects: heater-only wells and heater-vacuum (producer) wells. These are discussed in the following paragraphs.
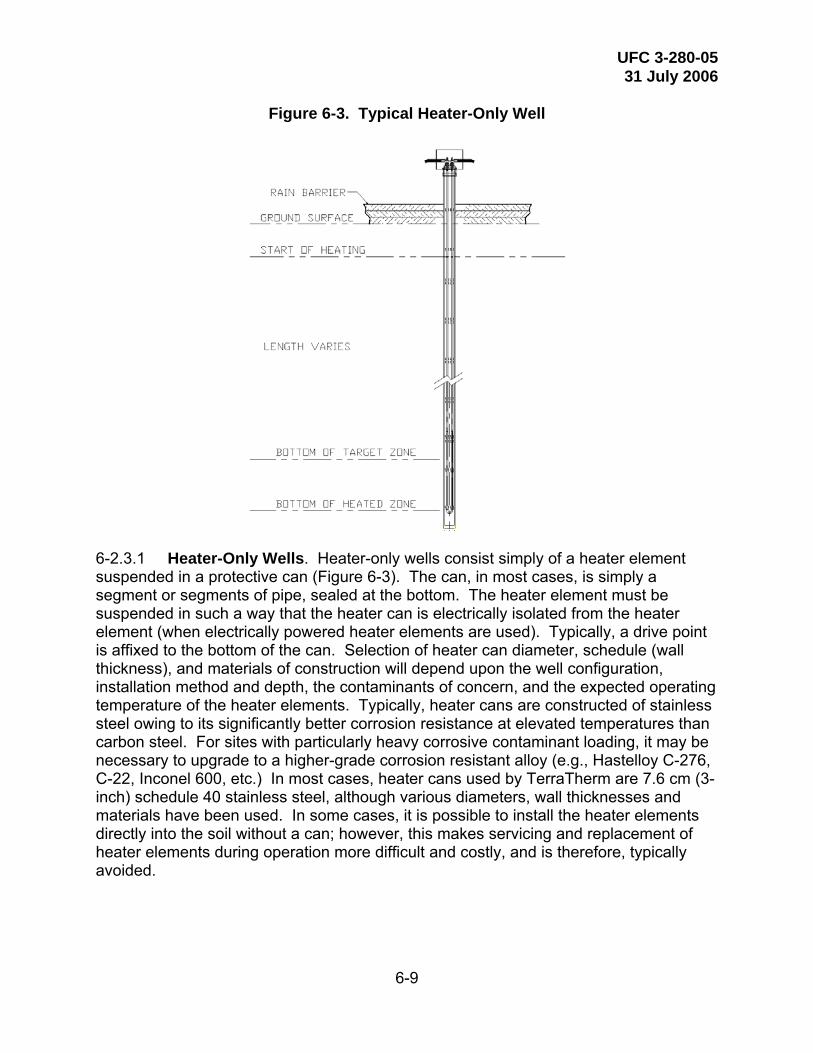
UFC 3-280-05 31 July 2006
6-9
Figure 6-3. Typical Heater-Only Well
6-2.3.1 Heater-Only Wells. Heater-only wells consist simply of a heater element suspended in a protective can (Figure 6-3). The can, in most cases, is simply a segment or segments of pipe, sealed at the bottom. The heater element must be suspended in such a way that the heater can is electrically isolated from the heater element (when electrically powered heater elements are used). Typically, a drive point is affixed to the bottom of the can. Selection of heater can diameter, schedule (wall thickness), and materials of construction will depend upon the well configuration, installation method and depth, the contaminants of concern, and the expected operating temperature of the heater elements. Typically, heater cans are constructed of stainless steel owing to its significantly better corrosion resistance at elevated temperatures than carbon steel. For sites with particularly heavy corrosive contaminant loading, it may be necessary to upgrade to a higher-grade corrosion resistant alloy (e.g., Hastelloy C-276, C-22, Inconel 600, etc.) In most cases, heater cans used by TerraTherm are 7.6 cm (3-inch) schedule 40 stainless steel, although various diameters, wall thicknesses and materials have been used. In some cases, it is possible to install the heater elements directly into the soil without a can; however, this makes servicing and replacement of heater elements during operation more difficult and costly, and is therefore, typically avoided.

UFC 3-280-05 31 July 2006
6-10
Figure 6-4. Typical Producer Well
6-2.3.2 Heater-Vacuum Wells. Heater-vacuum wells, or producers, consist of a flat-bottomed heater can as described in the previous section, suspended in a well screen (Figure 6-4). Well screen slot size, screen placement, and sand pack selection may follow typical SVE system design methods (refer to EM 1110-1-4001). Screened sections may be continuous over the entire heated interval or focused in specific segments of the heated sections where the greatest load of contaminant laden vapors is expected to be produced. Selection of screen can diameter, schedule (wall thickness), and materials of construction will depend upon the factors described in the preceding paragraph. Typically, the selected well screen is at least one or two nominal pipe sizes up from the heater can suspended within it. In most cases it is strongly recommended that a seal be installed in the annular space between the borehole wall and the heater-vacuum well casing to prevent leakage of vapors and steam upward thorough the borehole. Typically, a lean concrete or concrete grout seal is preferred over a hydrated bentonite seal as it will withstand the heat and resist desiccation longer than bentonite alone. 6-2.3.3 Thermal Well Installation Methods. Thermal wells may be installed using conventional hollow stem auger drilling equipment. However, because it is desirable to maintain close soil to well contact for efficient thermal conductive heating whenever possible, it is desirable to directly drive the heater-only wells into the soil, thereby locally increasing the density and effective thermal conductivity (i.e., there is more grain to grain contact) of the soils around the heater can. Given the relatively large diameter
UFC 3-280-05 31 July 2006
6-11
and closed bottom of the heater cans and the large number of thermal wells typically installed at a site, the rig selected for driving thermal well cans must have a sufficiently high hammer cycle rate and have sufficient down force to drive the cans efficiently. 6-2.3.3.1 Heater-vacuum wells are typically installed in augered holes, as driving screens can damage the screen and can lead to soil smearing and clogging of the slots. Solid stem augers may be used if soil conditions are such that the boreholes will not collapse when the auger is withdrawn to allow installation of the screen. This method offers the advantage of faster installation and minimizes drill cuttings; however, it is not possible at all sites. Otherwise, hollow stem augers are typically used. 6-2.3.3.2 Rotary sonic installation methods also work well and achieve the goal of maintaining close contact between vibration driven cans and the surrounding soil. Heater-vacuum well screens installed by rotary sonic drilling are typically installed in a casing that has been vibrated into the ground. The casing is then withdrawn as the sandpack is installed. Rotary sonic methods can achieve good installation production rates (installed meters per day). This technique works well for sites with a significant amount of debris; however, this method is substantially more expensive than hollow stem auger installation methods. 6-2.3.3.3 Heater-vacuum well screens and heater cans may also be installed using angled, horizontal, or directional drilling methods. In this case, minor modifications are necessary to ensure that heater elements and producer well cans are centralized. Material selection may also need to consider the bend radius of the proposed angled or directionally drilled borehole. Installation in trenches is an additional option. 6-2.3.4 Quality Control Requirements. Well and screen materials need to be inspected to ensure that the components are of the desired quality and material composition. In vertical applications, a maximum tolerance for deviation from verticality, particularly in long or deep wells, to ensure that the concentric components (e.g., heaters in cans, and cans in heater-vacuum wells) can be installed after the wells are drilled or driven is necessary. 6-2.3.5 Groundwater Control Systems. At sites where groundwater intersects the target treatment zone or where water-bearing stringers may transmit groundwater to the treatment zone, groundwater control may be required. It may not be possible for the thermal wells to deliver sufficient energy to boil off infiltrating groundwater (or surface water runoff, for that matter) and still raise the temperature of the target soils above the boiling point of water. Excessive or uncontrolled groundwater or surface water infiltration may limit the ability of ISTD to achieve the required target treatment temperature in some or all locations throughout the target treatment zone. Therefore, it is critically important to identify potential sources of groundwater or surface water infiltration and take appropriate measures to control them. In the case of groundwater, these control measures may include sheet pile or jet-grout barrier walls keyed into an aquitard layer, well-point dewatering systems, trenched or horizontally or directionally drilled dewatering wells, or freeze wall barriers. These actions may have a significant cost impact on the project. It may be cost-effective to remove any recoverable
UFC 3-280-05 31 July 2006
6-12
groundwater prior to the start of heating at those sites where groundwater can be readily contained and pumped out of the target treatment zone. 6-2.4 Energy Input and Conveyance Systems 6-2.4.1 Energy Requirements. Assuming negligible water infiltration or recharge into the target treatment zone and neglecting edge losses, a fixed amount of energy is required to raise the temperature of the soil to the boiling point of water, boil off a single pore volume of soil moisture and then, for most TCH sites, raise the dried soil to the superheated target treatment temperature. For sites with relatively low boiling contaminants (e.g., PCE, TCE, benzene, styrene, etc.), it is not necessary to boil off the soil moisture, provided there is sufficient permeability in clayey soils to remove contaminants without drying the soil. At these sites it may be sufficient to simply approach the boiling point of water (100°C, 212°F) to achieve the desired degree of contaminant removal or destruction. Therefore, the energy required to raise the soil to the desired temperature can be estimated relatively easily using an analytical spreadsheet calculation. Numerical modeling may be used to provide a more accurate estimate of the energy requirements, allowing for the benefits of superposition, convection, edge losses, heat loss through producer wells, infiltration, and other factors. As a general rule of thumb, most soils cannot accept more than approximately 985 W•m–1 (300 W•ft–1) of heat input from a line source (such as a thermal well).* During the early stage of heating, when the soil is cool and moist, its thermal conductivity is high and the soil is capable of absorbing high heat input from the heater with only a moderate increase in temperature. As the soil is heated and dried, the thermal conductivity decreases, thereby accelerating the natural temperature rise. Eventually, a stabilized heating rate is attained with relatively small increases in temperature at the well. 6-2.4.2 Heat Delivery Mechanisms. Energy in the form of heat may be delivered to the soil using a number of methods, including: electrical, gas combustion, or other methods. Electrically powered heater elements, proprietary stainless steel elements, and mineral insulated cable elements have been used in all testing, demonstration, and full-scale projects to date. Gas combustion soil heaters, which are claimed and protected by early ISTD patents, are currently under development for specific applications. 6-2.4.3 Heater Elements (Electrical). Electrically powered heater elements may be operated with or without the use of controllers. In the first case, a power controller, typically a silicon-controlled rectifier (SCR), is used to modulate (automatically or manually) the power delivered to the heater elements based on the temperature input from one or more thermocouples on or in the immediate vicinity of the heater element. In the controllerless configuration, the resistive properties of the metal heater element (increasing resistance with temperature) may be used to construct essentially self-regulating heaters. In this configuration a constant voltage is applied to the heaters. As the heater element gets hotter, its resistance increases and by Ohm’s Law, the current decreases, resulting in a “self-regulating” watt output. The preferred approach is to use
* Stegemeier and Vinegar, 2001
UFC 3-280-05 31 July 2006
6-13
self-regulating heaters; however, for specific applications, controlled-output heaters may be desirable (e.g., for ramping up to temperature slowly, or in instances where it is desirable to maintain the heaters or soil below a certain temperature). Careful consideration of the thermal expansion of the heater element, the heater can, and for heater-vacuum wells, the well screen, is required. Heater-only cans and heater-vacuum well screens are constrained at the bottom by the soil matrix and therefore tend to expand upward when heated. However, the heater elements suspended in the cans and heater cans suspended in heater-vacuum wells are free hanging and tend to expand downward when they are heated. Adequate room for thermal expansion is required to prevent damage to the components. This is critically important on electrically powered systems, where contact between components during heating could potentially cause damage or, although unlikely, could cause the heater to ground out on the can. 6-2.4.4 Wellhead Power and Vapor Connections. Wellhead power connections are made in weatherproof electrical junction boxes that are attached to the heater cans with an electrical conduit compression fitting. Cold pin conductors welded to the free ends of the heater rods extend through an electrically insulated bulkhead or support plate at the top of each heater can, and into the junction box. Mechanical lugs or other suitable terminations are used to attach the power cables to the heater rods. Heater-vacuum wells are typically completed with a flanged vapor tee, through which the internal heater can is inserted. The lower flange of the vapor tee mates with the well screen riser and the upper flange on the vapor tee mates with a plate flange welded on the internal heater can, thus sealing the well screen annulus. Vapors exit through the branch of the tee to the piping manifold, under vacuum. The branch of the tee may also be fitted with an individual flow control valve, sample port or pressure monitoring port where desired. The internal heater can riser extends above the vapor tee, such that electrical connections for heater-vacuum wells are similar to those for heater-only wells. 6-2.4.5 Vapor Conveyance Piping Systems. 6-2.4.5.1 Design of TCH vapor conveyance piping should follow existing USACE piping system design guidance. In selecting and specifying piping system components (including pipe, fittings, and valves), designers must consider the changing composition and state of the vapor stream (from relatively cool, moist steam to hot, dry air). Piping system materials of construction must be sufficient to withstand the nature of the contaminants, the potential acidity of the vapor stream, and the elevated temperatures to which they will be exposed. Corrosion is often most troublesome in parts of the system where liquid can collect. Design of the system should provide against zones of liquid accumulation. Allowance must be made for thermal expansion as the piping system is heated to operating temperature. 6-2.4.5.2 Typically, supplemental heat must be added to the piping system to prevent the extracted vapor stream from condensing in the conveyance piping. Supplemental heat may be added either through internal insertion heaters (installed in cans inside the
UFC 3-280-05 31 July 2006
6-14
manifold pipe spools) or through external heat tracing, as appropriate to the particular case. Insulation must be provided for personnel protection and to minimize heat losses. In some cases it is desirable to allow vapors to condense in the pipe manifold and withdraw the condensed liquid for treatment separate from the air stream. In this condensing case, insulation need only provide protection for personnel exposures. Because the piping systems are typically installed outdoors, external jacketing must be weatherproof. Manifold piping spool pieces are typically pre-fabricated in standard lengths and fitted with flanged ends to allow a relatively rapid assembly of the manifold in the field. Since the TCH piping system is typically a temporary installation (on the order of months), the piping network is frequently supported on portable jack stands. However, in areas prone to seismic activity or where the piping system will be in place for an extended period, more elaborate supports and bracing may be required. 6-2.5 Aboveground Systems 6-2.5.1 Power Distribution. In electrically powered TCH systems, there can be a very significant power demand, depending upon the volume of contaminant to be remediated. Once a preliminary estimate of the power requirement is available, designers should consult with the on-site engineers, infrastructure managers and local utility company representatives to determine whether there is sufficient power transmission and distribution capacity at the facility or off the local grid. Designers should weigh the cost and schedule impacts of running new power transmission lines from a nearby substation versus operating the TCH project in multiple smaller phases to reduce the overall demand load of a large project. 6-2.5.1.1 Power is fed from the high-voltage transmission lines to a transformer with a typical secondary voltage of 480 VAC. Power is fed from the transformer to a fused main disconnect switch or a main circuit breaker in an electrical switchboard. There may be one or more switchboards to distribute power to the well heaters, manifold pipe heaters, and vapor treatment equipment. Vapor treatment equipment may be operated from a packaged motor control center (MCC) or fed separately through individual motor starters, or variable frequency drives (VFDs). Well heaters can be designed to operate at a variety of voltages to balance circuits and obtain the desired power output; therefore, power distribution depends on the site configuration. Owing to the temporary nature of TCH installations and to speed field construction, portable power cables (also called mining cables) are typically used to feed power from the circuit breakers to the well field heaters. 6-2.5.1.2 Where required by National Electrical Code* and local codes, distribution gear must be provided with ground fault protection. Electrical distribution gear should be provided with appropriately sized over-current protection. Designers must remember to consider the length of heater power cable runs as well as the fact that the heaters will operate continuously once energized, and apply appropriate component size
* NEC, NFPA 70

UFC 3-280-05 31 July 2006
6-15
adjustments to comply with NEC requirements for continuous duty loads and minimizing voltage drops. 6-2.5.1.3 Conductive components within the well field should be bonded and grounded. In addition, transformers, distribution panels, process equipment, trailers, and other conductive system components should be bonded and grounded in accordance with the National Electrical Code and any local requirements. 6-2.5.2 Vapor Treatment Systems. Vapor treatment systems for field pilot tests were discussed in Paragraph 5-2.2 and a typical system is depicted schematically in Figure 5-4. Vapor treatment systems for full-scale systems are similar to pilot-scale systems, although typically larger to accept the larger flow rates in full-scale systems. Vapor treatment systems may be as simple as one or more carbon adsorbers or may require a more comprehensive vapor treatment system consisting of a thermal oxidizer, heat exchanger, acid gas scrubbers, silt knock outs, and one or more carbon adsorbers. Selection and sizing of vapor treatment system components will depend on the expected peak vapor generation rate (typically estimated at a peak of 0.028 standard cubic meters per minute (1 scfm) of vapor per kW of heater power), the projected COC loading, and the applicable air emission limits. 6-2.5.3 Emission Monitoring. Emission monitoring requirements will vary depending on the site COCs and the applicable air emission standards. Emission monitoring can be as simple as daily screening of exhaust vapors with a flame ionization detector (FID) or photo ionization detector (PID), or may entail the use of a continuous emission monitoring (CEM) system. Typically, the former is used with a simple carbon-only vapor treatment system while the latter is usually required for vapor treatment systems that incorporate a thermal oxidizer. Typical CEM system monitoring parameters for ISTD applications include Wet O2, Dry O2, CO, CO2, and total hydrocarbons. Dust and opacity monitoring, and chlorine/HCl monitoring may also be required. In some cases, stack testing using isokinetic sampling methods may be required to comply with emission standards. 6-2.5.4 Emergency Power Supply. A source of standby power, typically a diesel-powered emergency generator, is required to enable continuous operation of vapor collection and treatment equipment in the event of a temporary interruption in shore (grid) power, as the hot soil mass will continue generating steam and vapors during a power interruption. The emergency power supply may also be used to feed power to the fume pipe manifold to ensure that the pipe heating system remains operational. An automatic transfer switch is the preferred method of starting the generator in the event of a power interruption, although for a continuously manned site, a manual transfer switch may be acceptable. 6-2.5.5 Design Review Checklist. The Design Review Checklist in Appendix C provides a general guideline for information required to carry a design for an ISTD project from conceptual level through completion.
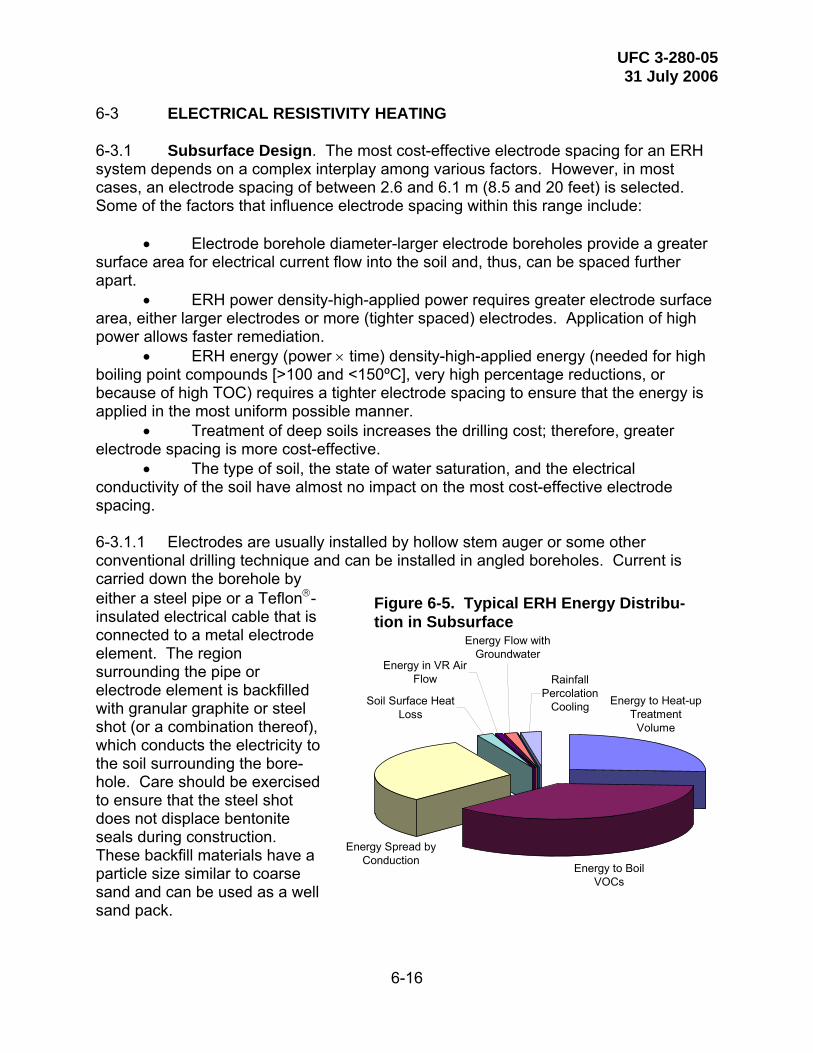
UFC 3-280-05 31 July 2006
6-16
6-3 ELECTRICAL RESISTIVITY HEATING 6-3.1 Subsurface Design. The most cost-effective electrode spacing for an ERH system depends on a complex interplay among various factors. However, in most cases, an electrode spacing of between 2.6 and 6.1 m (8.5 and 20 feet) is selected. Some of the factors that influence electrode spacing within this range include:
• Electrode borehole diameter-larger electrode boreholes provide a greater surface area for electrical current flow into the soil and, thus, can be spaced further apart.
• ERH power density-high-applied power requires greater electrode surface area, either larger electrodes or more (tighter spaced) electrodes. Application of high power allows faster remediation.
• ERH energy (power × time) density-high-applied energy (needed for high boiling point compounds [>100 and <150ºC], very high percentage reductions, or because of high TOC) requires a tighter electrode spacing to ensure that the energy is applied in the most uniform possible manner.
• Treatment of deep soils increases the drilling cost; therefore, greater electrode spacing is more cost-effective.
• The type of soil, the state of water saturation, and the electrical conductivity of the soil have almost no impact on the most cost-effective electrode spacing. 6-3.1.1 Electrodes are usually installed by hollow stem auger or some other conventional drilling technique and can be installed in angled boreholes. Current is carried down the borehole by either a steel pipe or a Teflon®-insulated electrical cable that is connected to a metal electrode element. The region surrounding the pipe or electrode element is backfilled with granular graphite or steel shot (or a combination thereof), which conducts the electricity to the soil surrounding the bore-hole. Care should be exercised to ensure that the steel shot does not displace bentonite seals during construction. These backfill materials have a particle size similar to coarse sand and can be used as a well sand pack.
Energy to Boil VOCs
Energy Flow with Groundwater
Soil Surface Heat Loss
Energy in VR Air Flow Rainfall
Percolation Cooling
Energy Spread by Conduction
Energy to Heat-up Treatment
Volume
Figure 6-5. Typical ERH Energy Distribu-tion in Subsurface
UFC 3-280-05 31 July 2006
6-17
6-3.1.2 To maintain soil moisture and electrical contact, a ¼-inch Teflon tube is often inserted into the electrode backfill to provide a method to drip potable water. If the electrode is completed in geological material that readily transmits water, then a drip system is usually not required. Electrodes can also have multiple completions, and up to six independent electrode elements have been installed in a single borehole to allow independent heating of six different depth zones. 6-3.1.3 Electrodes can also be installed by driving a steel pipe into the ground. This method of electrode installation is usually reserved for treatment of shallow soils under saturated water conditions. 6-3.1.4 Electrode boreholes often include one or more co-located vapor recovery wells. These vapor recovery wells may consist of steam vents that are located below the water table and operated at negative pressures for vapor capture. Within the vadose zone, there are trade-offs associated with co-locating a vapor recovery well within the electrically conductive zone of an electrode: the vapor recovery well tends to desiccate the soils immediately adjacent to the borehole, resulting in restricted electrical conduction. 6-3.1.5 The purpose of the vapor recovery wells is to collect the produced vapors and prevent vapor migration. It is not necessary to try to drive airflow through the lithological unit (as in an SVE system), because it is the uniform in situ steam generation of ERH that produces the steam carrier gas for removal of VOCs from the soils as vapor. A surface seal is incorporated into the installation to maintain negative pressure to collect the vapors and to prevent steam breakthrough or exposure at the surface. 6-3.1.6 If the depth to water is quite shallow (less than 5 feet [1.5 m] below grade), then horizontal vapor recovery wells or trenches may be preferred. Further, if there is the potential for a shallow water table to rise above the ground surface during the treatment process as a result of climatic conditions or generation of steam, controls may be necessary to prevent electrical hazards or exposure to hot liquids and vapors. 6-3.2 Energy Input and Conveyance Systems. The vapor recovery piping is usually constructed of chlorinated polyvinyl chloride (CPVC), a high temperature version of PVC. This piping has the advantage of relatively low cost and good chemical and corrosion resistance. Its low heat conductivity keeps the outer surface sufficiently cool to avoid a burn hazard and no insulation is required. CPVC expands significantly when heated. This requires some care in piping design, as the vapor recovery piping will expand by about 0.4% in length. The wells are especially rigid locations and the use of piping offsets or expansion loops within the well field is often required. Below grade piping installations often require expansion joints. CPVC piping will lose strength and sag as temperatures rise. This must be considered in the design of piping supports. Although CPVC has been successfully used in thousands of vapor recovery wells and for miles of recovery piping at thermal remediation sites, it is not recommended for use in monitoring wells that are screened completely below the water
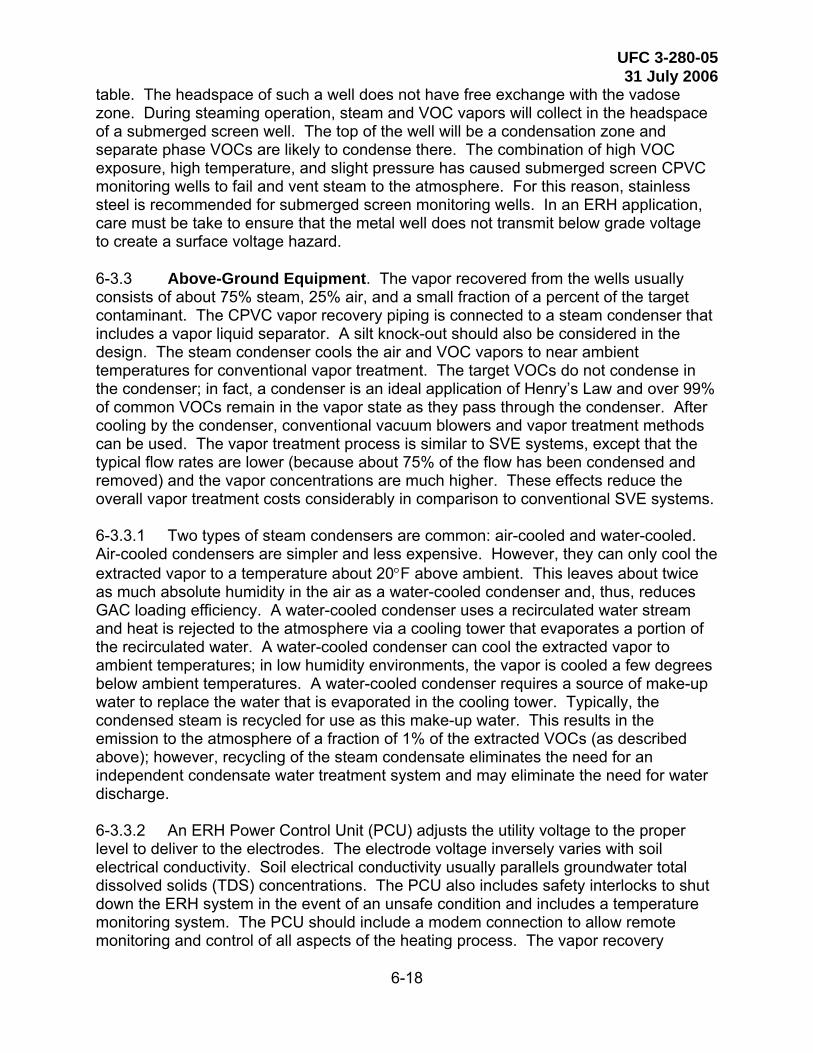
UFC 3-280-05 31 July 2006
6-18
table. The headspace of such a well does not have free exchange with the vadose zone. During steaming operation, steam and VOC vapors will collect in the headspace of a submerged screen well. The top of the well will be a condensation zone and separate phase VOCs are likely to condense there. The combination of high VOC exposure, high temperature, and slight pressure has caused submerged screen CPVC monitoring wells to fail and vent steam to the atmosphere. For this reason, stainless steel is recommended for submerged screen monitoring wells. In an ERH application, care must be take to ensure that the metal well does not transmit below grade voltage to create a surface voltage hazard. 6-3.3 Above-Ground Equipment. The vapor recovered from the wells usually consists of about 75% steam, 25% air, and a small fraction of a percent of the target contaminant. The CPVC vapor recovery piping is connected to a steam condenser that includes a vapor liquid separator. A silt knock-out should also be considered in the design. The steam condenser cools the air and VOC vapors to near ambient temperatures for conventional vapor treatment. The target VOCs do not condense in the condenser; in fact, a condenser is an ideal application of Henry’s Law and over 99% of common VOCs remain in the vapor state as they pass through the condenser. After cooling by the condenser, conventional vacuum blowers and vapor treatment methods can be used. The vapor treatment process is similar to SVE systems, except that the typical flow rates are lower (because about 75% of the flow has been condensed and removed) and the vapor concentrations are much higher. These effects reduce the overall vapor treatment costs considerably in comparison to conventional SVE systems. 6-3.3.1 Two types of steam condensers are common: air-cooled and water-cooled. Air-cooled condensers are simpler and less expensive. However, they can only cool the extracted vapor to a temperature about 20°F above ambient. This leaves about twice as much absolute humidity in the air as a water-cooled condenser and, thus, reduces GAC loading efficiency. A water-cooled condenser uses a recirculated water stream and heat is rejected to the atmosphere via a cooling tower that evaporates a portion of the recirculated water. A water-cooled condenser can cool the extracted vapor to ambient temperatures; in low humidity environments, the vapor is cooled a few degrees below ambient temperatures. A water-cooled condenser requires a source of make-up water to replace the water that is evaporated in the cooling tower. Typically, the condensed steam is recycled for use as this make-up water. This results in the emission to the atmosphere of a fraction of 1% of the extracted VOCs (as described above); however, recycling of the steam condensate eliminates the need for an independent condensate water treatment system and may eliminate the need for water discharge. 6-3.3.2 An ERH Power Control Unit (PCU) adjusts the utility voltage to the proper level to deliver to the electrodes. The electrode voltage inversely varies with soil electrical conductivity. Soil electrical conductivity usually parallels groundwater total dissolved solids (TDS) concentrations. The PCU also includes safety interlocks to shut down the ERH system in the event of an unsafe condition and includes a temperature monitoring system. The PCU should include a modem connection to allow remote monitoring and control of all aspects of the heating process. The vapor recovery
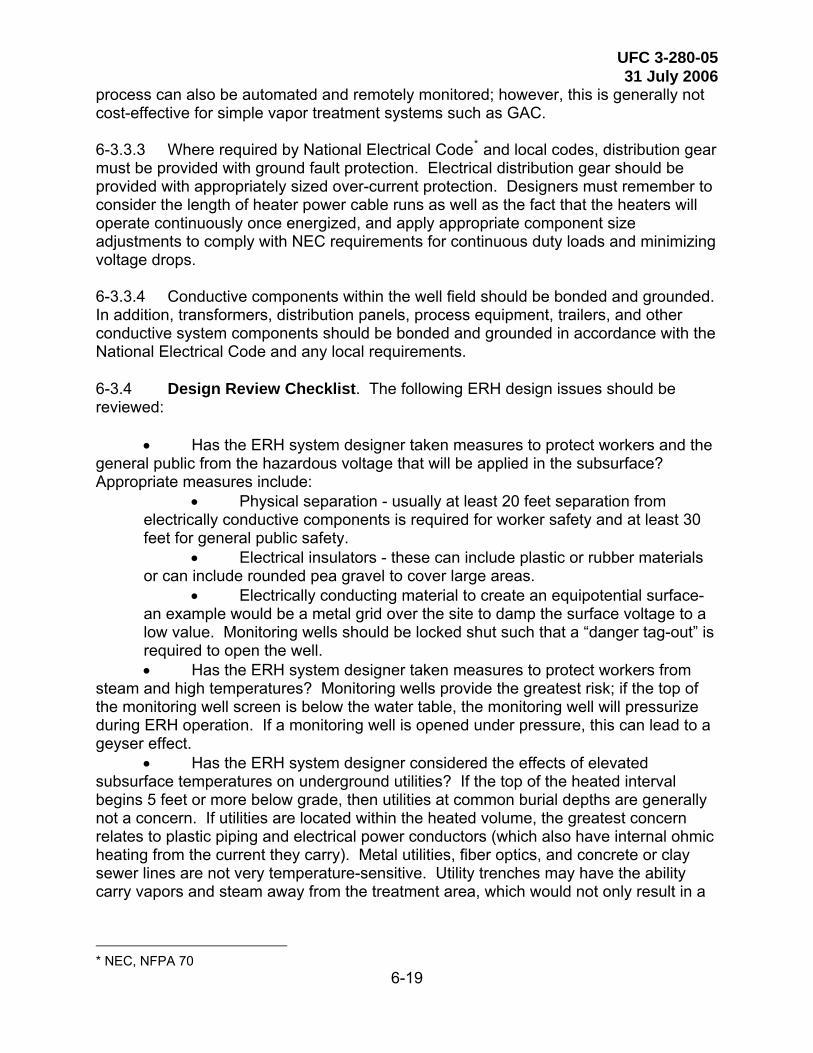
UFC 3-280-05 31 July 2006
6-19
process can also be automated and remotely monitored; however, this is generally not cost-effective for simple vapor treatment systems such as GAC. 6-3.3.3 Where required by National Electrical Code* and local codes, distribution gear must be provided with ground fault protection. Electrical distribution gear should be provided with appropriately sized over-current protection. Designers must remember to consider the length of heater power cable runs as well as the fact that the heaters will operate continuously once energized, and apply appropriate component size adjustments to comply with NEC requirements for continuous duty loads and minimizing voltage drops. 6-3.3.4 Conductive components within the well field should be bonded and grounded. In addition, transformers, distribution panels, process equipment, trailers, and other conductive system components should be bonded and grounded in accordance with the National Electrical Code and any local requirements. 6-3.4 Design Review Checklist. The following ERH design issues should be reviewed:
• Has the ERH system designer taken measures to protect workers and the general public from the hazardous voltage that will be applied in the subsurface? Appropriate measures include:
• Physical separation - usually at least 20 feet separation from electrically conductive components is required for worker safety and at least 30 feet for general public safety.
• Electrical insulators - these can include plastic or rubber materials or can include rounded pea gravel to cover large areas.
• Electrically conducting material to create an equipotential surface-an example would be a metal grid over the site to damp the surface voltage to a low value. Monitoring wells should be locked shut such that a “danger tag-out” is required to open the well. • Has the ERH system designer taken measures to protect workers from
steam and high temperatures? Monitoring wells provide the greatest risk; if the top of the monitoring well screen is below the water table, the monitoring well will pressurize during ERH operation. If a monitoring well is opened under pressure, this can lead to a geyser effect.
• Has the ERH system designer considered the effects of elevated subsurface temperatures on underground utilities? If the top of the heated interval begins 5 feet or more below grade, then utilities at common burial depths are generally not a concern. If utilities are located within the heated volume, the greatest concern relates to plastic piping and electrical power conductors (which also have internal ohmic heating from the current they carry). Metal utilities, fiber optics, and concrete or clay sewer lines are not very temperature-sensitive. Utility trenches may have the ability carry vapors and steam away from the treatment area, which would not only result in a
* NEC, NFPA 70

UFC 3-280-05 31 July 2006
6-20
loss of control during treatment, but may represent a health and safety risk is the steam or vapors are carried offsite.
• Has the designer considered potential for migration of vapors into basements?
• Has the designer considered a rising shallow water table to the ground surface from climatic events or steam generation and the potential for electrical hazards or exposure to hot liquids and vapors?
• Are the soils expansive clays and will soil dessication and the resultant shrinkage that would occur in the vicinity of the water table a concern for foundations and utilities?
• How will vapor and steam be captured? Within the vadose zone, the application of vacuum influence will capture the steam and vapor. Within the saturated zone, low permeability lenses can pool or divert rising steam and VOC vapors.
6-4 STEAM ENHANCED EXTRACTION 6-4.1 Subsurface Design. The design of a full-scale steam injection system should maximize the removal of contaminants from the subsurface in an efficient manner. To achieve this objective, the design should incorporate thermal modeling, analysis of site hydrogeological and contaminant distribution data, and analysis of mass movements both above and below the source zone. 6-4.1.1 To control the migration of the contaminants, steam should be injected outside, below, and above the source zone.* The injected steam creates a thermodynamic driving force, moving the contaminants towards the center of the target volume, where liquids and vapors will be extracted. The success of this strategy depends on the careful delineation of NAPL in the source zone. The vertical and horizontal extent of the NAPL should be well defined, as discussed in Chapter 3. In this way, steam will always sweep from the outside in, carrying NAPL with it and thus preventing NAPL spreading to the surrounding area. Downward NAPL migration can be prevented by sweeping steam below the source zone first.† ‡ This creates a steam blanket below the NAPL. Droplets sinking into this zone will be vaporized and carried with the steam to the extraction well. Research conducted in Germany has also shown a benefit in the co-injection of air with the steam in preventing downward migration of NAPL.§ * The co-injection of air should be examined through additional design modeling work to determine its feasibility at the site.
* This assumes a single array of steam injection wells surrounding a vapor and groundwater recovery well. For applications having multiple arrays of wells, recovery would occur in the middle of each array. † Heron, G., T.H. Christensen, T. Heron, and T. Larsen. “Thermally Enhanced Remediation at DNAPL Sites: The Competition Between Downward Mobilization and Upward Volatilization.” Proceedings of the First International Conference on Remediation of Chlorinated and Recalcitrant Compounds, Battelle Press, Columbus, Ohio. 193-198, 1998b. ‡ Gerdes, K. S., S. Kaslusky, and K. S. Udell. “Containment of Downward Migration of DNAPLs During Steam Enhanced Extraction.” Proceedings of the First International Conference on Remediation of Chlorinated and Recalcitrant Compounds. Columbus, Ohio: Battelle Press, 1998. § Schmidt, R., C. Betz, and A. Farber. Behaviour During Steam Injection into the Unsaturated Zone. Institut Fur Wasserbau Universitat Stuttgurt, Pfaffenwaldring Stuttgart, Germany: LNAPL and DNAPL, 61, D-70569: 1998.
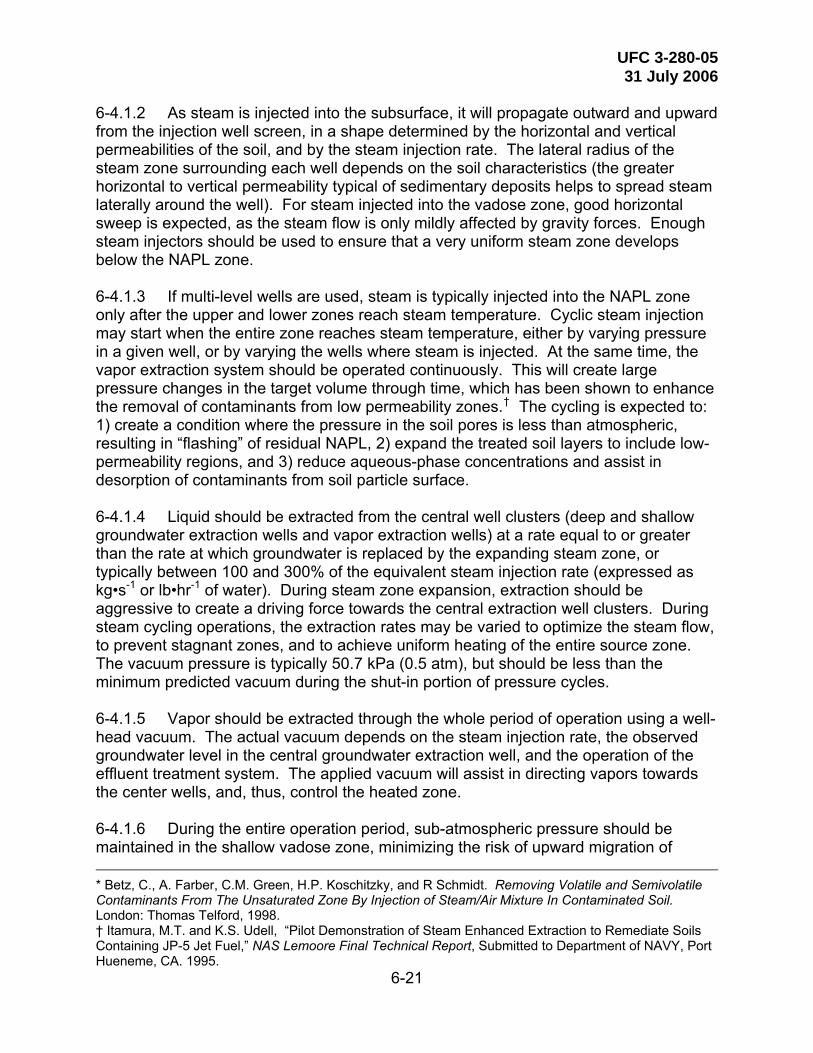
UFC 3-280-05 31 July 2006
6-21
6-4.1.2 As steam is injected into the subsurface, it will propagate outward and upward from the injection well screen, in a shape determined by the horizontal and vertical permeabilities of the soil, and by the steam injection rate. The lateral radius of the steam zone surrounding each well depends on the soil characteristics (the greater horizontal to vertical permeability typical of sedimentary deposits helps to spread steam laterally around the well). For steam injected into the vadose zone, good horizontal sweep is expected, as the steam flow is only mildly affected by gravity forces. Enough steam injectors should be used to ensure that a very uniform steam zone develops below the NAPL zone. 6-4.1.3 If multi-level wells are used, steam is typically injected into the NAPL zone only after the upper and lower zones reach steam temperature. Cyclic steam injection may start when the entire zone reaches steam temperature, either by varying pressure in a given well, or by varying the wells where steam is injected. At the same time, the vapor extraction system should be operated continuously. This will create large pressure changes in the target volume through time, which has been shown to enhance the removal of contaminants from low permeability zones.† The cycling is expected to: 1) create a condition where the pressure in the soil pores is less than atmospheric, resulting in “flashing” of residual NAPL, 2) expand the treated soil layers to include low-permeability regions, and 3) reduce aqueous-phase concentrations and assist in desorption of contaminants from soil particle surface. 6-4.1.4 Liquid should be extracted from the central well clusters (deep and shallow groundwater extraction wells and vapor extraction wells) at a rate equal to or greater than the rate at which groundwater is replaced by the expanding steam zone, or typically between 100 and 300% of the equivalent steam injection rate (expressed as kg•s-1 or lb•hr-1 of water). During steam zone expansion, extraction should be aggressive to create a driving force towards the central extraction well clusters. During steam cycling operations, the extraction rates may be varied to optimize the steam flow, to prevent stagnant zones, and to achieve uniform heating of the entire source zone. The vacuum pressure is typically 50.7 kPa (0.5 atm), but should be less than the minimum predicted vacuum during the shut-in portion of pressure cycles. 6-4.1.5 Vapor should be extracted through the whole period of operation using a well-head vacuum. The actual vacuum depends on the steam injection rate, the observed groundwater level in the central groundwater extraction well, and the operation of the effluent treatment system. The applied vacuum will assist in directing vapors towards the center wells, and, thus, control the heated zone. 6-4.1.6 During the entire operation period, sub-atmospheric pressure should be maintained in the shallow vadose zone, minimizing the risk of upward migration of
* Betz, C., A. Farber, C.M. Green, H.P. Koschitzky, and R Schmidt. Removing Volatile and Semivolatile Contaminants From The Unsaturated Zone By Injection of Steam/Air Mixture In Contaminated Soil. London: Thomas Telford, 1998. † Itamura, M.T. and K.S. Udell, “Pilot Demonstration of Steam Enhanced Extraction to Remediate Soils Containing JP-5 Jet Fuel,” NAS Lemoore Final Technical Report, Submitted to Department of NAVY, Port Hueneme, CA. 1995.

UFC 3-280-05 31 July 2006
6-22
contaminants to the soil surface. Vadose zone air pressure should be monitored, if feasible, based on the operational conditions. 6-4.1.7 The number and location of extraction and injection wells required is highly site-specific and depends on many factors, such as extent and depth of the contamination, physical and chemical properties of the contaminants, soil characteristics, and most important, soil permeability. The steam zone development can be estimated by a number of mathematical methods (see Paragraph 6-6). 6-4.1.8 Typical temperature monitoring detail is presented in Figure 6-6, while a simplified process and instrumentation diagram for a steam injection system is presented in Figure 6-7.
Figure 6-6. Typical Temperature Monitoring Detail
6-4.2 Energy Input and Conveyance Systems. A typical steam injection system consists of steam injection wells, groundwater/vapor extraction wells, conveyance piping, NAPL/water separator, transfer pump, controls, and gas/water treatment equipment. Figure 6-7 shows an example of process flow diagram of a typical steam injection system. The steam injection system usually uses steam generated by a
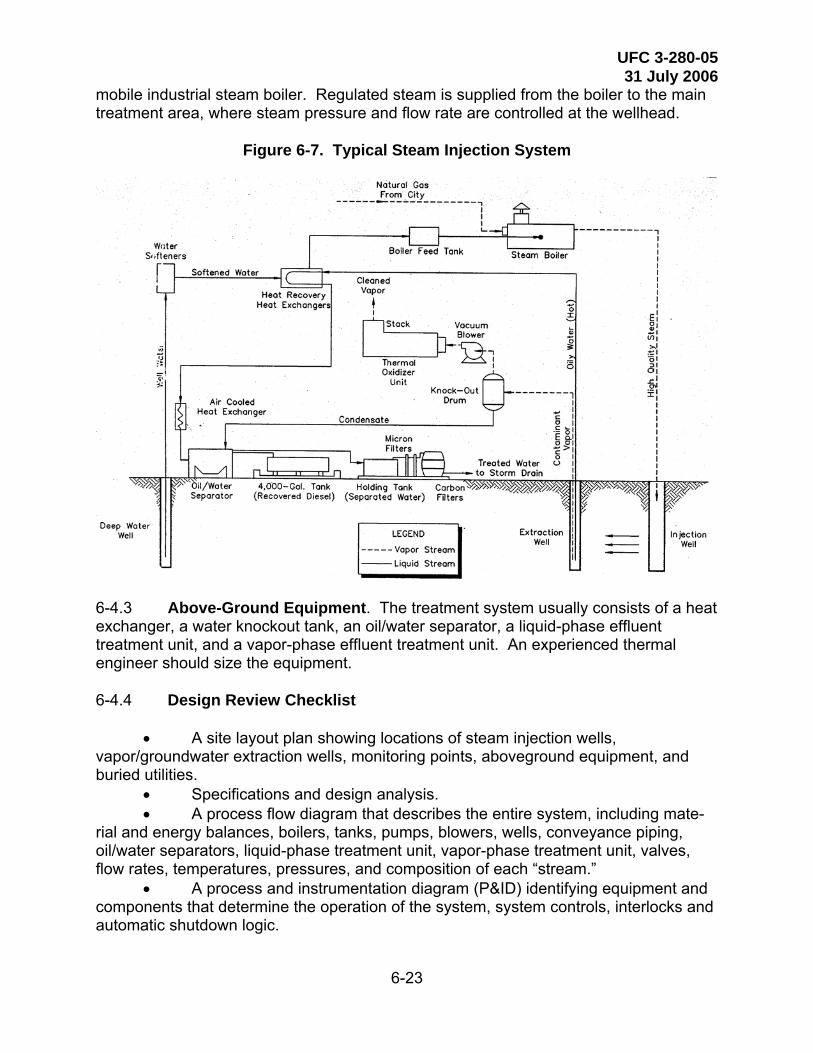
UFC 3-280-05 31 July 2006
6-23
mobile industrial steam boiler. Regulated steam is supplied from the boiler to the main treatment area, where steam pressure and flow rate are controlled at the wellhead.
Figure 6-7. Typical Steam Injection System
6-4.3 Above-Ground Equipment. The treatment system usually consists of a heat exchanger, a water knockout tank, an oil/water separator, a liquid-phase effluent treatment unit, and a vapor-phase effluent treatment unit. An experienced thermal engineer should size the equipment. 6-4.4 Design Review Checklist
• A site layout plan showing locations of steam injection wells, vapor/groundwater extraction wells, monitoring points, aboveground equipment, and buried utilities.
• Specifications and design analysis. • A process flow diagram that describes the entire system, including mate-
rial and energy balances, boilers, tanks, pumps, blowers, wells, conveyance piping, oil/water separators, liquid-phase treatment unit, vapor-phase treatment unit, valves, flow rates, temperatures, pressures, and composition of each “stream.”
• A process and instrumentation diagram (P&ID) identifying equipment and components that determine the operation of the system, system controls, interlocks and automatic shutdown logic.
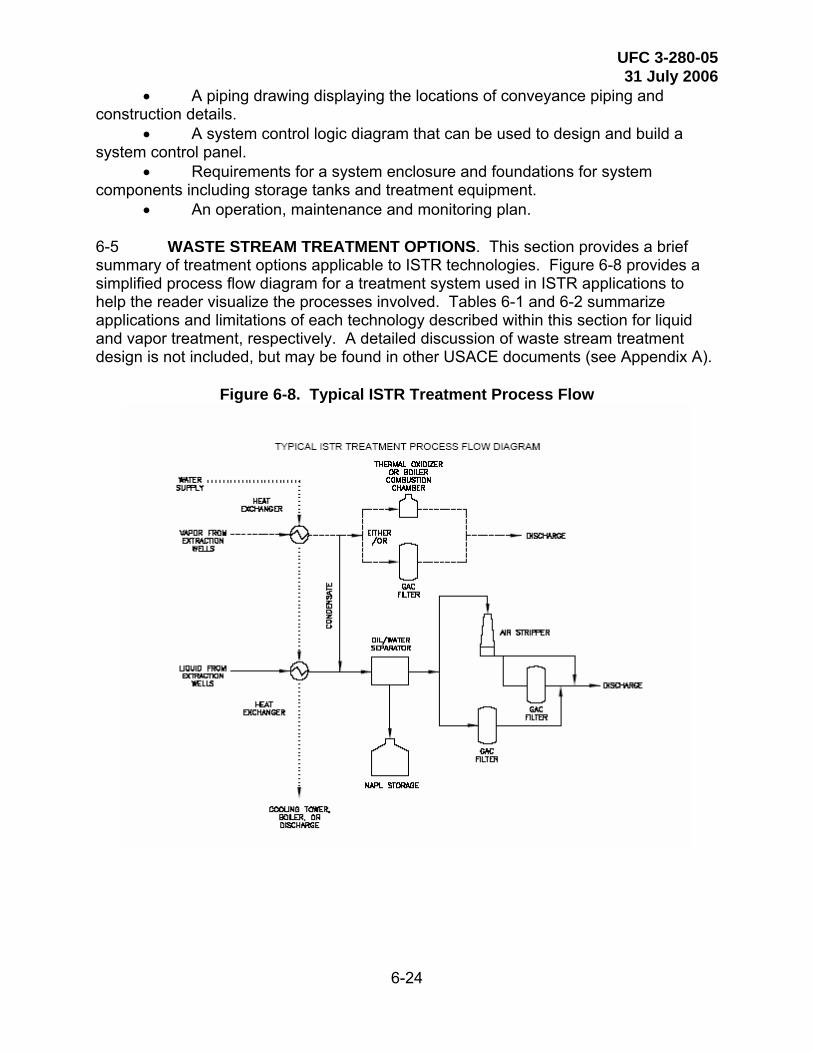
UFC 3-280-05 31 July 2006
6-24
• A piping drawing displaying the locations of conveyance piping and construction details.
• A system control logic diagram that can be used to design and build a system control panel.
• Requirements for a system enclosure and foundations for system components including storage tanks and treatment equipment.
• An operation, maintenance and monitoring plan. 6-5 WASTE STREAM TREATMENT OPTIONS. This section provides a brief summary of treatment options applicable to ISTR technologies. Figure 6-8 provides a simplified process flow diagram for a treatment system used in ISTR applications to help the reader visualize the processes involved. Tables 6-1 and 6-2 summarize applications and limitations of each technology described within this section for liquid and vapor treatment, respectively. A detailed discussion of waste stream treatment design is not included, but may be found in other USACE documents (see Appendix A).
Figure 6-8. Typical ISTR Treatment Process Flow

UFC 3-280-05 31 July 2006
6-25
Table 6-1. Groundwater Treatment Technologies
Technology Application Limitations
Carbon Adsorption • Target compounds include hydrocarbons, semi-volatile organics, and explosives, halogenated VOCs.
• Effective as a polishing step to other treatment technologies.
• High contaminant removal efficiencies.
• Effective for removing contaminants of low concentrations from a wide range of flow rates.
• Effective for removing contaminants of high concentrations from low flows (depends on size of vessel).
• Multiple contaminants may impact performance.
• High suspended solids and/or oil and grease may cause fouling and require frequent treatment.
• Spent carbon must be regenerated (on or offsite) or properly disposed.
• Can be costly for highly mobile compounds (low Koc).
• Biological growth on carbon or high particulate loadings can reduce flow through the bed.
• Elevated liquid stream temperatures may increase vessel corrosion.
• Water should be cooled prior to treatment.
Aerobic Biological Reactors • Primarily used to treat SVOCs and fuel hydrocarbons.
• Residual organic sludge that is generated must be properly disposed.
• Some compounds are difficult or slow to degrade.
• Cold or hot temperatures or rapid temperature fluctuations can cause operational difficulties.
• Volatile organics may require air emission controls or pretreatment.
• High contaminant concentrations may be toxic to microorganisms.
• Difficulties in acclimating microorganisms to changing contaminant concentrations, which could result in a longer startup time.
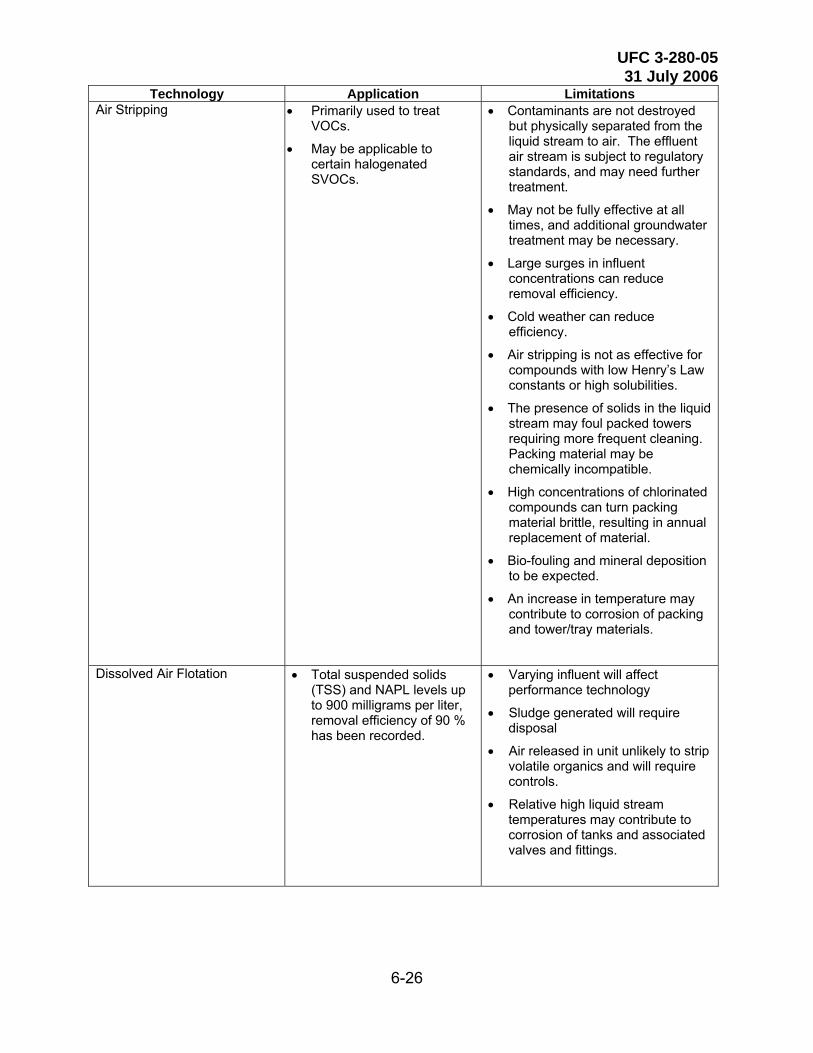
UFC 3-280-05 31 July 2006
6-26
Application Limitations Technology Air Stripping • Primarily used to treat
VOCs.
• May be applicable to certain halogenated SVOCs.
• Contaminants are not destroyed but physically separated from the liquid stream to air. The effluent air stream is subject to regulatory standards, and may need further treatment.
• May not be fully effective at all times, and additional groundwater treatment may be necessary.
• Large surges in influent concentrations can reduce removal efficiency.
• Cold weather can reduce efficiency.
• Air stripping is not as effective for compounds with low Henry’s Law constants or high solubilities.
• The presence of solids in the liquid stream may foul packed towers requiring more frequent cleaning. Packing material may be chemically incompatible.
• High concentrations of chlorinated compounds can turn packing material brittle, resulting in annual replacement of material.
• Bio-fouling and mineral deposition to be expected.
• An increase in temperature may contribute to corrosion of packing and tower/tray materials.
Dissolved Air Flotation • Total suspended solids (TSS) and NAPL levels up to 900 milligrams per liter, removal efficiency of 90 % has been recorded.
• Varying influent will affect performance technology
• Sludge generated will require disposal
• Air released in unit unlikely to strip volatile organics and will require controls.
• Relative high liquid stream temperatures may contribute to corrosion of tanks and associated valves and fittings.

UFC 3-280-05 31 July 2006
6-27
Table 6-2. Vapor Treatment Technologies
Technology Application Limitations Carbon Adsorption • Target compounds include
hydrocarbons, semi-volatile organics, explosives, and halogenated VOCs. However, removal of high contaminant concentrations using vapor-phase carbon may not be economically favorable. Pretreatment of the VOC stream, followed by the use of a vapor-phase GAC system as a polishing step would be more cost-effective.
• Spent carbon transport may require hazardous waste handling.
• Spent carbon must be disposed of or regenerated (off or on site) and the adsorbed contaminants must be destroyed, or regenerated on or offsite.
• Relative humidity greater than 50% can reduce carbon capacity.
• Elevated temperatures from ISTR operations (greater than 38° C or 100° F) inhibit adsorption capacity.
• Biological growth on carbon or high particulate loadings can reduce flow through the bed.
Thermal/Catalytic Oxidation • The target contaminant groups for oxidation are nonhalogenated VOCs and SVOCs, and fuel hydrocarbons.
• If sulfur or halogenated compounds or high particulate loadings are in the emissions stream, the catalyst can be poisoned/deactivated and require replacement.
• Destruction of halogenated compounds requires special materials, construction, or special catalysts (if using a catalytic oxidizer).
• Influent gas concentrations must be < 25% of the lower explosive limit for catalytic and thermal oxidation.
• The presence of chlorinated hydrocarbons (see comment above) and some heavy metals (e.g., lead) may poison a particular catalyst.
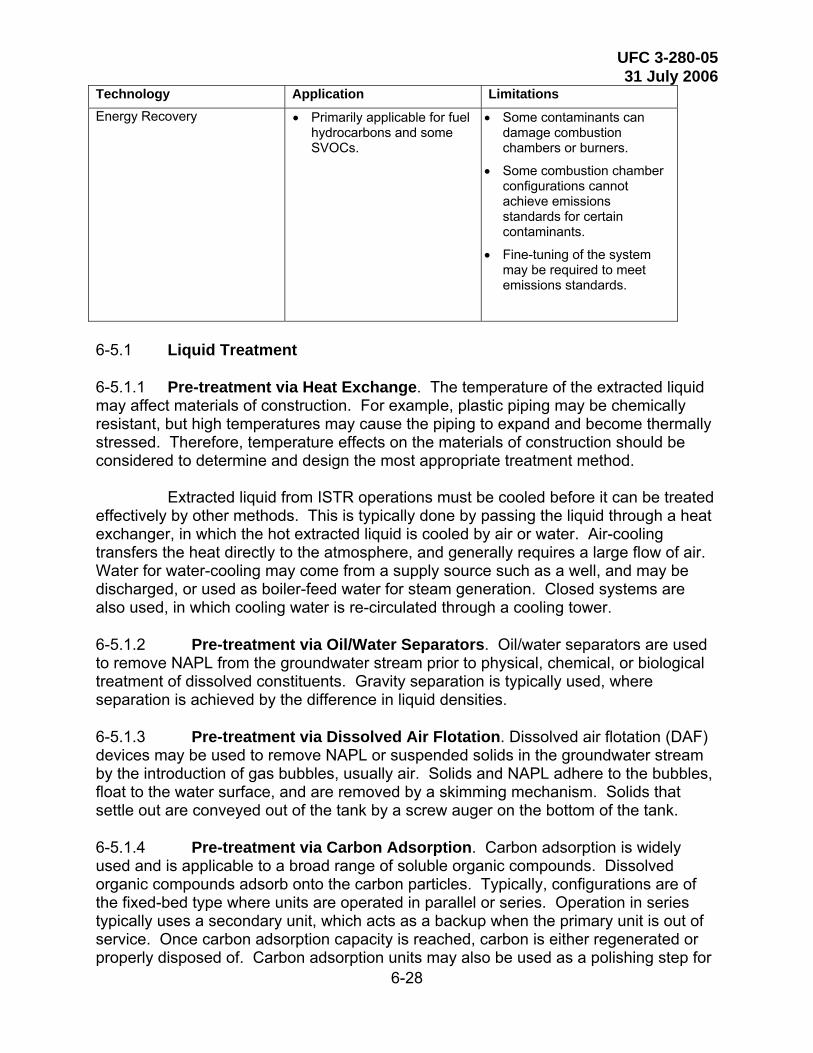
UFC 3-280-05 31 July 2006
6-28
Application Limitations Technology Energy Recovery • Primarily applicable for fuel
hydrocarbons and some SVOCs.
• Some contaminants can damage combustion chambers or burners.
• Some combustion chamber configurations cannot achieve emissions standards for certain contaminants.
• Fine-tuning of the system may be required to meet emissions standards.
6-5.1 Liquid Treatment 6-5.1.1 Pre-treatment via Heat Exchange. The temperature of the extracted liquid may affect materials of construction. For example, plastic piping may be chemically resistant, but high temperatures may cause the piping to expand and become thermally stressed. Therefore, temperature effects on the materials of construction should be considered to determine and design the most appropriate treatment method. Extracted liquid from ISTR operations must be cooled before it can be treated effectively by other methods. This is typically done by passing the liquid through a heat exchanger, in which the hot extracted liquid is cooled by air or water. Air-cooling transfers the heat directly to the atmosphere, and generally requires a large flow of air. Water for water-cooling may come from a supply source such as a well, and may be discharged, or used as boiler-feed water for steam generation. Closed systems are also used, in which cooling water is re-circulated through a cooling tower. 6-5.1.2 Pre-treatment via Oil/Water Separators. Oil/water separators are used to remove NAPL from the groundwater stream prior to physical, chemical, or biological treatment of dissolved constituents. Gravity separation is typically used, where separation is achieved by the difference in liquid densities. 6-5.1.3 Pre-treatment via Dissolved Air Flotation. Dissolved air flotation (DAF) devices may be used to remove NAPL or suspended solids in the groundwater stream by the introduction of gas bubbles, usually air. Solids and NAPL adhere to the bubbles, float to the water surface, and are removed by a skimming mechanism. Solids that settle out are conveyed out of the tank by a screw auger on the bottom of the tank. 6-5.1.4 Pre-treatment via Carbon Adsorption. Carbon adsorption is widely used and is applicable to a broad range of soluble organic compounds. Dissolved organic compounds adsorb onto the carbon particles. Typically, configurations are of the fixed-bed type where units are operated in parallel or series. Operation in series typically uses a secondary unit, which acts as a backup when the primary unit is out of service. Once carbon adsorption capacity is reached, carbon is either regenerated or properly disposed of. Carbon adsorption units may also be used as a polishing step for

UFC 3-280-05 31 July 2006
6-29
other treatment methods, prior to discharge. Other media (e.g., sorptive clays) may also be used. 6-5.1.5 Pre-treatment via Biological Reactors. Biological reactors have typically been used in municipal wastewater applications. However, this technology can be effectively used to treat groundwater contaminated with aerobically degradable hydrocarbons such as BTEX and other fuel components, PCP, and relatively soluble creosote components (e.g., naphthalene). Biological reactors use microorganisms to degrade organic contaminants to carbon dioxide and water. Volatile organics are also removed by volatilization as a competing mechanism. Typical reactor components include an aeration basin, clarifier, and digestion tank where wasted sludge is further concentrated. Final dewatering of waste sludge is usually accomplished with a filter press. A properly maintained biological reactor can provide significant cost savings over other treatments methods, such as carbon adsorption. However, the microorganisms can be sensitive to changes in temperature and contaminant concentrations, and may require long periods of acclimation for operational changes. Bioreactors should be used with caution; as the steam front propagates, or as the subsurface heats up, NAPL, in significant quantities, can be recovered, which can upset the treatment systems. Further, the NAPL recovery can occur rapidly, with little warning from the monitoring data that are typically employed. The microorganisms are also sensitive to changes in the dissolved oxygen concentration within the aeration basin. Rapid increases in contaminant concentrations or a malfunction in aeration system can reduce dissolved oxygen levels in the basin, and result in inadequate removal of contaminants. A functional biological reactor should be appropriately designed for the anticipated flow rates and contaminant concentrations. Owing to the potential for highly variable influent concentrations and the upset of the bioreactor, this treatment technology is not recommended for use during ISTR applications. At least one SEE site has faced difficulties with the application of bioreactors to treat creosote-related contaminants. Any use of this technology must consider mechanisms to address the variability of influent concentrations. 6-5.1.6 Pre-treatment via Air Stripping. Air stripping involves the mass transfer of volatile contaminants from water to air. This process is typically conducted in a packed tower. The typical packed tower air stripper includes a spray nozzle at the top of the tower to distribute contaminated liquid over the packing in the column, a fan to force air countercurrent to the water flow, and a sump at the bottom of the tower to collect treated liquid. Vapors generated from an air stripper may require treatment before discharge. 6-5.1.7 Post-Treatment. Primary treatment methods may not always be able to achieve applicable emissions standards owing to inherent inefficiencies or because of changed influent characteristics. In these situations, additional treatment methods may be used as a polishing step. For example, carbon adsorption is often used as a polishing or backup method for a biological reactor or air stripper. Sand filters may be used to remove suspended solids in the groundwater stream. Solids build up and the unit is typically backwashed. Frequency of backwash depends on the solids concentration of the stream entering the filter.

UFC 3-280-05 31 July 2006
6-30
6-5.2 Vapor Treatment 6-5.2.1 Pretreatment via Heat Exchange. Extracted vapor from ISTR operations must be cooled before it can be treated effectively by other methods. This is typically done using air or water as the coolant through a heat exchanger/condenser. Air-cooling transfers the heat directly to the atmosphere, and generally requires a large flow of air. Water for water-cooling may come from a supply source such as a well, and may be discharged, or used as boiler-feed water for steam generation. Closed systems are also used, in which cooling water is re-circulated through a cooling tower. Condensed vapor is then conveyed to the liquid treatment system. If very high levels of contaminants are present in the condensate, a pre-treatment step may be required before the condensate can be introduced into the liquid treatment system. 6-5.2.2 Pretreatment via Drying/Dehumidification. Primary vapor treatment methods may require the vapor stream to have a low relative humidity for optimal operation. A knockout tank or a mechanical dryer may be used to lower the relative humidity of the vapor prior to primary treatment. 6-5.2.3 Treatment via Carbon Adsorption. Vapor phase carbon adsorption is similar to the liquid treatment application, where compounds adsorb from the vapor stream onto the carbon particles. Operational configuration may be either in parallel or in series. Carbon can be regenerated or disposed of off-site. High relative humidity or temperature in the vapor stream decreases the efficiency of the treatment. 6-5.2.4 Treatment via Thermal/Catalytic Oxidation. Oxidation units are used to destroy contaminants in the vapor stream. Thermal oxidation units are typically single chamber and refractory-lined, equipped with a propane or natural gas-fired burner, and a stack. Burner capacities in the combustion chamber range from 527,000 to 2,100,000 kJ•hr-1 (0.5 to 2 million Btu) per hour. Operating temperatures range from 760 to 927°C (1400 to 1700°F), and gas residence times are typically 1 second or less. Catalytic oxidation units use a catalyst to accelerate the rate of oxidation, which enables the unit to destroy contaminants at a lower temperature than conventional thermal oxidation units. VOCs are thermally destroyed at temperatures typically ranging from 320 to 540°C (600 to 1000°F). Thermal oxidizers can often be converted to catalytic units after initially high influent contaminant concentrations decrease to less than between 1000 and 5000 ppmv. This method may not be appropriate for treatment of halogenated compounds, owing to the formation of hydrochloric acid, which could foul the catalyst. 6-5.2.5 Treatment via Energy Recovery. Energy recovery (i.e., using the extracted vapor as a fuel) is a vapor treatment alternative to common technologies. Energy recovery is used for in situ thermal techniques involving steam injection, where the extracted vapor can be introduced to the fuel stream for a gas or oil-fired boiler. Using extracted contaminant vapors as an energy source for the boiler will likely require additional monitoring of the stack gases to assure compliance with air discharge permit or other requirements.
UFC 3-280-05 31 July 2006
6-31
6-5.3 Process Residuals and Offsite Waste Management. Process residuals generated from the treatment process will need to be managed. Process residuals include spent carbon, filter material, and sludges. Such residuals should be characterized for proper disposal. Disposal options depend on cost. The spent granulated carbon may be taken off-site for disposal (landfill or incineration) or regeneration. Depending on the amount of carbon usage, regeneration on-site may be more cost-effective. NAPL separated in the DAF or other oil-water separator must be stored for proper disposal.
6-6 OTHER SYSTEM CONSIDERATIONS 6-6.1 Enclosures/Buildings. ISTR methods may be housed inside buildings or exposed to the elements. Systems inside buildings should have adequate ventilation to prevent buildup of vapors. Mechanical and electrical components placed outside should be rated as weather proof. 6-6.2 Surface Covers. To control vapor migration, a surface cover or impermeable cap should be constructed at the site. Soil pore spaces can be filled by water infiltrated from the surface, which reduces the airflow. If horizontal extraction wells are installed, infiltration water can fill the trenches. Installation of a surface cover helps minimize infiltration water. In addition, the radius of influence of the vapor recovery wells may be increased using an impermeable cap at the surface. Short-circuiting of the surface air will be prevented if a good surface seal is achieved and forces air to be drawn from a greater distance. 6-6.2.1 Concrete or asphalt is the most common surface cover. If the site has pre-existing pavement, it may act as the surface cover. The pavement should be sealed so that it is water-resistant and relatively impervious to airflow. 6-6.2.2 A temperature- and contaminant-tolerant geomembrane may be used for the ISTR surface cover if no pavement exists at the site. The area should be graded and smoothed to eliminate ponding of rainwater. Follow the installation procedure of the geomembrane provided by the manufacturers. 6-6.2.3 To minimize damage to the geomembrane by personnel, equipment, or the natural elements, an appropriate (15–30 cm) thickness of fill (pulverized soil, sand, or pea gravel) may be placed over it. It is recommended that the geomembrane not be left exposed. However, if exposure is not avoidable, its perimeter should be keyed into a trench and backfilled to prevent short-circuiting of air. In addition, run-off water should be directed to ditches that divert the water away from the treatment area. Surface covers are discussed in detail in EM 1110-1-4001, Paragraph 5-15. 6-6.3 Noise Control. Sound levels are measured in decibels (dB) using a logarithmic scale. The standard measure for environmental sound levels is the A-weighted sound pressure level (dBA). The A-weighting scale was developed to simulate the frequency response of the human ear to sounds at typical environmental levels.

UFC 3-280-05 31 July 2006
6-32
6-6.3.1 The U.S. EPA has identified yearly day-night average sound levels, Ldn, sufficient to protect public health and welfare from the effects of environmental noise. The U.S. EPA emphasizes that since the protective sound levels were derived without concern for technical or economic feasibility, and contain a margin of safety to ensure their protective value, they must not be viewed as standards, criteria, regulations, or goals. The U.S. EPA has no authority to regulate ambient noise levels. The Ldn should be viewed as the level below which there is no reason to suspect that the general population will be at risk from the effects of noise. According to the U.S. EPA, levels are sufficient to protect public health and welfare if they do not exceed a yearly average Ldn of 55 dBA outdoors and 45 dBA indoors in sensitive area such as residences, schools, and hospitals.*
6-6.3.2 OSHA has established maximum permissible worker noise exposure levels to protect against hearing damage. The level is based on a worker’s noise exposure over a specific time period. For example, as stipulated in Title 29 of the Code of Federal Regulations, Part 1910, a worker cannot be exposed to an average sound level in excess of 90 dBA for over an 8-hour period. When noise exposure exceeds the permissible level, noise must be reduced through feasible engineering or administrative controls. When such controls fail to reduce the noise exposure to a permissible level, personal protective equipment must be provided and used to reduce the noise exposure. In addition, when worker noise exposure exceeds 85 dBA over an 8-hour period, the employer must provide hearing protection and establish an annual audiometric testing program to track potential hearing loss. Therefore, OSHA requirements allow areas within facilities to exceed 85 dBA, provided that feasible noise control has been implemented and these areas are designated as high noise areas requiring hearing protection at all times. Compliance with the OSHA noise exposure limits will be achieved by providing equipment noise mitigation and by identifying the high noise areas with warning signs that prescribe hearing protection. 6-6.3.3 The construction phases of the ISTR system consist of site preparation, injection/extraction/heater well or electrode drilling, equipment erection, and startup. Noise emissions vary with each phase of construction, depending on the activity and the associated equipment. Construction activities should be scheduled during daytime periods (0700 to 2000) to the extent possible. Some activities may require extended hours of operation because of scheduling constraints. Nighttime construction should be limited to low-noise-producing activities to the extent possible. 6-6.3.4 The primary noise sources anticipated from the treatment site are the steam generator, the air compressor, the heat exchanger, blowers for vapor recovery and air strippers, and the thermal oxidizer exhaust stack. Noise reduction design features should be included where feasible (e.g., stack silencer for the thermal oxidizer stack, low-noise fans on the heat exchanger, enclosure of the air compressor, blowers, etc.). 6-6.4 Subsurface Barriers. NAPL migration may be contained, and groundwater recharge may be controlled with the use of subsurface barriers. The type of barrier wall
* USEPA. Toward a National Strategy for Noise Control. April 1977.
UFC 3-280-05 31 July 2006
6-33
should be selected based on the specific installation configuration, required installation depth, contaminant type, and installation cost. Typical subsurface barriers are, but not limited to soil-bentonite (S-B) slurry, (steel or plastic) sheet piles, pressure-injected grout curtains, or a synthetic material (e.g., HDPE). Slurry wall barriers are constructed by excavating a relatively narrow vertical trench, typically 0.6 to 1.5 m (2 to 5 feet) wide, through a previous soil stratum to an underlying impervious layer. The trench is filled with bentonite-water slurry during excavation to stabilize the trench walls, allowing excavation to continue through the slurry, to the desired depth. Once the desired depth has been reached, the slurry trench is backfilled with a soil/bentonite/water mixture designed to provide a low-permeability barrier wall (10–7 to 10–8 cm•s–1). Designers should consult guide specification CEGS 02444, Soil-Bentonite Slurry Trench for HTRW Projects, and other USACE reference documents if considering use of an S-B cut-off wall. Subsurface barriers are discussed in more detail in EM 1110-1-4010, Chapter 5-10.
6-7 MODELING 6-7.1 General. Mathematical models have proven to be useful for simulating and predicting physical and chemical processes during thermal treatment. Modeling efforts may utilize a variety of mathematical tools, ranging from simple engineering calculations to sophisticated numerical modeling codes. The level of detail required for thermal modeling depends on a number of factors, including site conditions, cleanup objectives, and budgetary constraints. Always remember that the utility of modeling results depends on the quality of the input data. In general, appropriately selected and properly implemented modeling procedures should result in construction and operations cost savings that are much greater than the cost of the modeling. Previous guidance on modeling for soil vapor extraction systems* is also applicable to ISTR projects Note that ISTR simulations can yield misleading results unless they are very carefully performed. Input parameters such as the anisotropy ratio (horizontal to vertical permeability) and low-permeability lenses can totally control the heating pattern, and should be captured in the models. Models that are intended for uses other than preliminary design analyses should incorporate the following features:
• Geological layering and heterogeneity. • Intrinsic permeability (affects injection rates and radius of influence). • Anisotropy ratio of major layers (influences the degree of vertical steam
rise, and the ability to heat the base of thick aquifers). • Heterogeneity and discontinuities in low-permeability layers (affects
upward steam migration through aquitards).
* USEPA. Review of Mathematical Modeling for Evaluating Soil Vapor Extraction Systems. Publication No. EPA/540/R-95/513, 1995b.
UFC 3-280-05 31 July 2006
6-34
Ideally, predictive modeling should be done using a model that has been calibrated or verified by comparison to actual field steam or heat flow.*
6-7.2 Applicability and Objectives. Modeling is primarily applicable to feasibility studies and design analyses of thermal remediation projects; however, models may also be used during operations and long-term monitoring. The objectives of modeling should be carefully weighed before selecting the modeling strategy. Minimum objectives for modeling would include estimation of the following parameters:
• Injection and recharge rates for wells -These data are necessary for designing fluid conveyance and treatment systems.
• Well or electrode spacing and design -Trials with different well spacings, depths, and screen lengths can help optimize design for energy or steam distribution, and contaminant recovery.
• Heating duration - Simulations can predict the length of time required to achieve treatment temperature throughout the target treatment zone for a given well spacing and energy input.
• Energy requirements - Electrical power or steam injection requirements must be predicted to estimate plant capacities, total energy costs, and project duration. Additional objectives could include evaluations of the following:
• Contaminant removal - Models can be used to evaluate the effectiveness of the removal of dissolved, sorbed, or NAPL contaminants, and to predict the removal rate, including the effects of chemical reactions such as hydrolysis, oxidation, and pyrolysis.
• Site hydraulic control - To prevent spreading of contaminants, it may be necessary to control groundwater flows during treatment.
• Aquitard heating - Predictions of time and energy required to heat low-permeability materials may be useful for system design or selection of the treatment strategy.
• Heat losses - Evaluations of the extent of heat losses to surrounding zones and to the atmosphere, and the need for surface insulation; identification of zones where contaminants may be deposited due to condensation; assessments of the effects of heating on sensitive utility lines and structures, and the need for protective measures such as insulation jacketing.
• Environmental impacts - Thermal effects to biota surrounding the treatment area, or on the ground surface above the treatment zones may be of concern.
• Emissions - Vapor discharges and concentrations at the ground surface may be estimated.
• Operations scenarios (including shutdown of power for sampling events). • Procedures such as pressure cycling, or variations of energy input,
pumping, or vacuum extraction rates may be evaluated before implementing in the field.
* Ochs, S.O., R.A. Hodges, R.W. Falta, T.F. Kmetz, J.J. Supar, N.N. Brown, and D.L. Parkinson, “Predicted heating patterns during steam flooding of coastal plain sediments at the Savannah River Site.” Environmental & Geological Geoscience, Vol IX, No. 1, Feb 2003, pp. 51-60, 2003.

UFC 3-280-05 31 July 2006
6-35
6-7.3 Model Solutions and Codes. Models may be divided into two broad categories: analytical solutions or numerical modeling codes. Available solutions and codes are listed in Tables 6-3 and 6-4, along with the processes that can be modeled. 6-7.3.1 Analytical Solutions. Analytical solutions are relatively easy and inexpensive to use, however the results are subject to uncertainties caused by their inherent assumptions (i.e., homogeneous and isotropic media, domains of infinite horizontal extent, steady-state conditions). The following analytical solutions are applicable to thermal remediation projects. 6-7.3.2 Energy budget calculations. Simple thermodynamic calculations can be made of the total energy or heat input requirement to raise a given volume of soil and groundwater to a required temperature (an example calculation is shown in Paragraph 6-2). 6-7.3.3 Heat flow. A variety of heat-transfer equations are available for estimating the migration of heat through materials by both conduction and convection.* †
6-7.3.4 Liquid flow. Well-hydraulics equations are applicable to all in situ thermal technologies that employ liquid extraction wells. Radial flow solutions such as the Thiem,‡ Theis,§ or Jacob** equations may be used to estimate groundwater pumping rates. If single-phase conditions can be assumed, and if adjustments are made for liquid density and viscosity, the same equations can also be used to estimate NAPL removal rates for known NAPL thicknesses.
* Carslaw, H. S. and Jaeger, C. H. Conduction Of Heat In Solids. New York NY: Oxford University Press, 1959. † Incropera, P. F., and D. P. DeWitt, Introduction To Heat Transfer. New York NY: John Wiley and Sons, Inc. 1996. ‡ Thiem , G. “Hydrologische Methoden.” Leipzig, Gebhardt, as presented in Davis, S.N. and DeWiest, R.J.N. (1966) Hydrogeology. John Wiley & Sons, Inc., New York, NY. 1906. § Theis, C.V. “The Relationship Between The Lowering Of The Piezometric Surface and The Rate and Duration of Discharge of a Well Using Ground-Water Storage.” Transactions of the American Geophysical Union Sixteenth Annual Meeting, Part I. 519-524. 1935. ** Jacob, C. E. “On The Flow Of Water In An Elastic Artesian Aquifer”. Transactions of The American Geophysical Union: Reports and Papers. 21, 574-589, 1940.
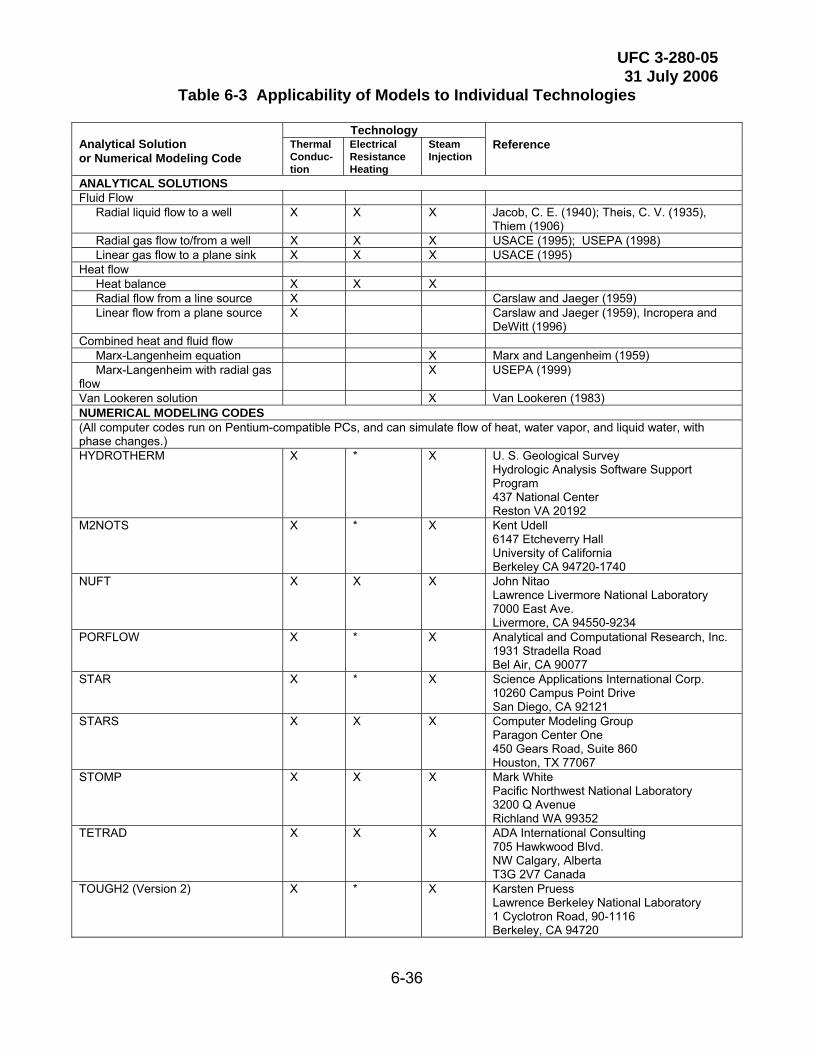
UFC 3-280-05 31 July 2006
6-36
Table 6-3 Applicability of Models to Individual Technologies
Technology Analytical Solution or Numerical Modeling Code
Thermal Conduc-tion
Electrical Resistance Heating
Steam Injection
Reference
ANALYTICAL SOLUTIONS Fluid Flow Radial liquid flow to a well X X X Jacob, C. E. (1940); Theis, C. V. (1935),
Thiem (1906) Radial gas flow to/from a well X X X USACE (1995); USEPA (1998) Linear gas flow to a plane sink X X X USACE (1995) Heat flow Heat balance X X X Radial flow from a line source X Carslaw and Jaeger (1959) Linear flow from a plane source X Carslaw and Jaeger (1959), Incropera and
DeWitt (1996) Combined heat and fluid flow Marx-Langenheim equation X Marx and Langenheim (1959) Marx-Langenheim with radial gas flow
X USEPA (1999)
Van Lookeren solution X Van Lookeren (1983) NUMERICAL MODELING CODES (All computer codes run on Pentium-compatible PCs, and can simulate flow of heat, water vapor, and liquid water, with phase changes.) HYDROTHERM X * X U. S. Geological Survey
Hydrologic Analysis Software Support Program 437 National Center Reston VA 20192
M2NOTS X * X Kent Udell 6147 Etcheverry Hall University of California Berkeley CA 94720-1740
NUFT X X X John Nitao Lawrence Livermore National Laboratory 7000 East Ave. Livermore, CA 94550-9234
PORFLOW X * X Analytical and Computational Research, Inc. 1931 Stradella Road Bel Air, CA 90077
STAR X * X Science Applications International Corp. 10260 Campus Point Drive San Diego, CA 92121
STARS X X X Computer Modeling Group Paragon Center One 450 Gears Road, Suite 860 Houston, TX 77067
STOMP X X X Mark White Pacific Northwest National Laboratory 3200 Q Avenue Richland WA 99352
TETRAD X X X ADA International Consulting 705 Hawkwood Blvd. NW Calgary, Alberta T3G 2V7 Canada
TOUGH2 (Version 2) X * X Karsten Pruess Lawrence Berkeley National Laboratory 1 Cyclotron Road, 90-1116 Berkeley, CA 94720
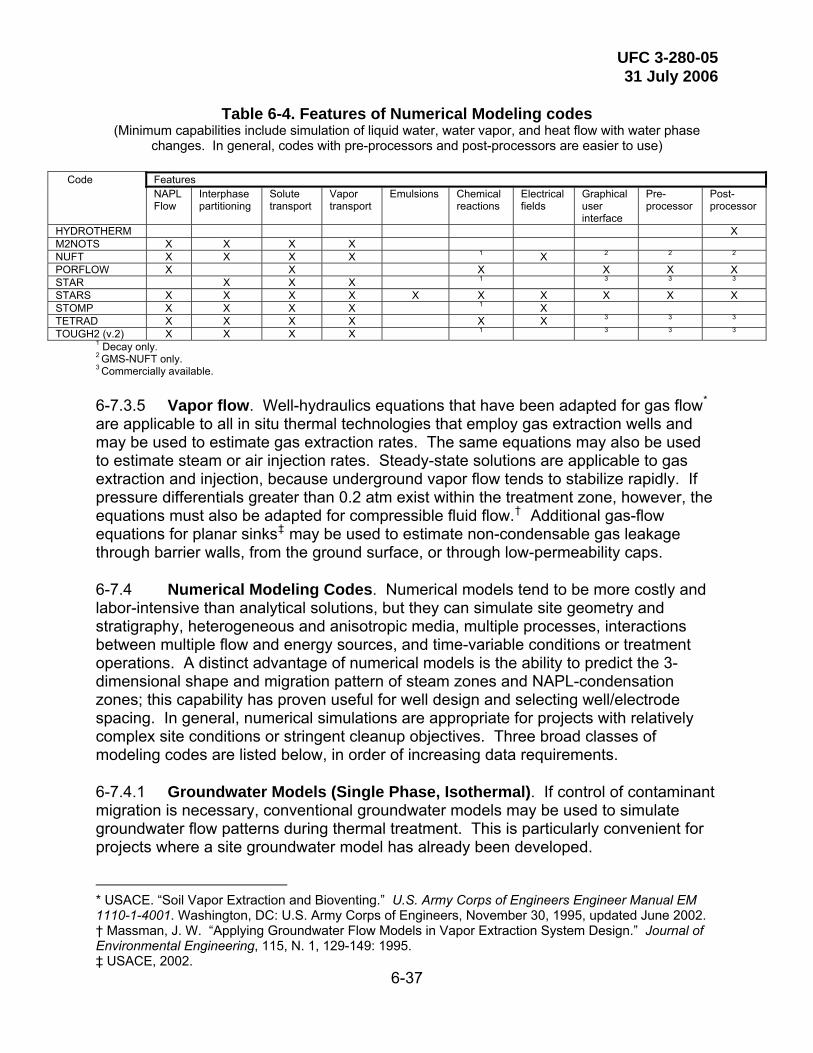
UFC 3-280-05 31 July 2006
6-37
Table 6-4. Features of Numerical Modeling codes
(Minimum capabilities include simulation of liquid water, water vapor, and heat flow with water phase changes. In general, codes with pre-processors and post-processors are easier to use)
Features Code NAPL Flow
Interphase partitioning
Solute transport
Vapor transport
Emulsions Chemical reactions
Electrical fields
Graphical user interface
Pre- processor
Post- processor
HYDROTHERM X M2NOTS X X X X NUFT X X X X 1 X 2 2 2
PORFLOW X X X X X X STAR X X X 1 3 3 3
STARS X X X X X X X X X X STOMP X X X X 1 X TETRAD X X X X X X 3 3 3
TOUGH2 (v.2) X X X X 1 3 3 3
1 Decay only. 2 GMS-NUFT only. 3 Commercially available. 6-7.3.5 Vapor flow. Well-hydraulics equations that have been adapted for gas flow* are applicable to all in situ thermal technologies that employ gas extraction wells and may be used to estimate gas extraction rates. The same equations may also be used to estimate steam or air injection rates. Steady-state solutions are applicable to gas extraction and injection, because underground vapor flow tends to stabilize rapidly. If pressure differentials greater than 0.2 atm exist within the treatment zone, however, the equations must also be adapted for compressible fluid flow.† Additional gas-flow equations for planar sinks‡ may be used to estimate non-condensable gas leakage through barrier walls, from the ground surface, or through low-permeability caps. 6-7.4 Numerical Modeling Codes. Numerical models tend to be more costly and labor-intensive than analytical solutions, but they can simulate site geometry and stratigraphy, heterogeneous and anisotropic media, multiple processes, interactions between multiple flow and energy sources, and time-variable conditions or treatment operations. A distinct advantage of numerical models is the ability to predict the 3-dimensional shape and migration pattern of steam zones and NAPL-condensation zones; this capability has proven useful for well design and selecting well/electrode spacing. In general, numerical simulations are appropriate for projects with relatively complex site conditions or stringent cleanup objectives. Three broad classes of modeling codes are listed below, in order of increasing data requirements. 6-7.4.1 Groundwater Models (Single Phase, Isothermal). If control of contaminant migration is necessary, conventional groundwater models may be used to simulate groundwater flow patterns during thermal treatment. This is particularly convenient for projects where a site groundwater model has already been developed.
* USACE. “Soil Vapor Extraction and Bioventing.” U.S. Army Corps of Engineers Engineer Manual EM 1110-1-4001. Washington, DC: U.S. Army Corps of Engineers, November 30, 1995, updated June 2002. † Massman, J. W. “Applying Groundwater Flow Models in Vapor Extraction System Design.” Journal of Environmental Engineering, 115, N. 1, 129-149: 1995. ‡ USACE, 2002.
UFC 3-280-05 31 July 2006
6-38
6-7.4.2 Combined Heat, Groundwater and Gas Flow with Phase Changes (2-Phase, Thermal). This is the most useful type of model for simulations of steam and heat migration. Most of the required fluid property data are already contained in the computer code, and typical design issues involving wells, soil caps, subsurface barriers, and operations scenarios can be addressed. 6-7.4.3 Combined Heat, Groundwater, Gas, and NAPL Flow with Phase Changes (3-Phase, Thermal). Many multiphase-thermal modeling codes can simulate NAPL flow as well as mass transfer between NAPL, aqueous and gas phase. Some of the codes can simulate separate contaminant compounds in the NAPL, or “pseudocomponents” with averaged properties for combined groups of contaminants. The effectiveness of the thermal treatment can be evaluated, and design parameters such as NAPL recovery rates, contaminant concentrations in recovered fluids, and cleanup times can be estimated. A few numerical codes can also simulate chemical reactions involving contaminant constituents. 6-7.5 Input Data. Media or formation data required for modeling include soil physical properties (density, porosity), thermal properties (heat capacity and conductivity), and hydraulic properties (permeability, pressure-saturation-permeability characteristics). Groundwater and steam properties, such as density, viscosity, and thermal characteristics, are temperature-dependent; this information may be obtained from steam tables, and is generally computed automatically by the numerical modeling codes. If groundwater and soil contamination are simulated, chemical transport properties for each component are required (solid-liquid and liquid-vapor partitioning coefficients, enthalpy, and degradation constants). NAPL flow simulations require additional NAPL properties, including density, viscosity, and pressure-saturation-permeability characteristics. Since NAPL physical and chemical properties are temperature-dependent, care needs to be taken to utilize appropriate data for the required temperature ranges. 6-7.6 Implementation of Model Results. Models may be used at various stages of project development. A model may be useful in the feasibility stage to evaluate potential energy costs or environmental effects for one or several technologies. Models are particularly important during the design stage, when plant and well-field parameters must be developed. The trade-off relationship between cost, performance, and project duration can also be evaluated by modeling. Sensitivity studies, based on known uncertainties in site soil and fluid properties, can be used to develop safety factors for equipment design. Models, providing useful information for planning treatment cycles, treatment zone size, monitoring programs, or project duration, may also simulate operation strategies. Models that are updated and calibrated during testing and operations may be used to evaluate operational problems, and to provide refined designs based on initial or pilot test results. Predictions of cooling rates, contaminant degradation rates, and required duration for long-term monitoring can by made through the continued use of a project model, after completion of active thermal treatment.
UFC 3-280-05 31 July 2006
6-39
The applicability of various solutions or modeling codes to specific technologies is discussed in this paragraph. See Table 6-3 for references and availability. 6-7.7 Modeling Aspects for Thermal Conductive Heating 6-7.7.1 Analytical Solutions 6-7.7.1.1 Energy Budget. The energy input requirement for a known treatment volume can be calculated (example shown in Paragraph 6-2), based on the required treatment temperature, thermal capacities of the soil and groundwater, and the latent heat required to convert the groundwater to steam, as necessary. Additional allowances may be needed for heat lost to the atmosphere or surrounding soil. 6-7.7.1.2 Heat Conduction Equations. Heat flow from heater blankets and heater wells can be simulated with transient solutions for linear heat conduction from a plane source, and radial conduction from a line source, respectively. A summary of analytical equations used to describe phenomena in thermal conduction processes is available*. 6-7.7.1.3 Superposition. Temperatures within an area being treated with multiple heating wells and blankets can be calculated by superimposing planar and line sources (i.e., summing the predicted temperature change at a given point attributable to each source, to predict the total temperature change at the point due to all sources). 6-7.7.1.4 Gas Flow Equations. As discussed, compressible fluid flow equations may be used to estimate gas extraction rates for contaminant recovery. 6-7.7.2 Numerical Modeling Codes. All of the numerical modeling codes listed in Tables 6-3 and 6-4 may be used for simulating conduction heat sources. The sources may be implemented as boundary conditions - for example, the upper model boundary for a heater blanket, or a column of cells for a heater well. Some of the codes have well options that include energy input only with no fluid. Sources may be given a specified temperature, or a specified thermal energy input rate. 6-7.8 Modeling Aspects for Electrical Resistivity Heating 6-7.8.1 Analytical Solutions. The energy budget calculation described in Paragraph 6-7.5 is also applicable to electrical resistivity heating; however the total energy requirement must be converted to electrical energy units (i.e., joules or Btu converted to kilowatt-hours). In current practice, electrode spacings are determined by the ratio of the diameter of the electrode array to the diameter of the electrode† (D:d), modified by
* Stegemeier, G.L. and H.J. Vinegar. “ Thermal conduction Heating for In Situ Desorption of Soils”. Hazardous and Radioactive Waste Treatment Technologies Handbook, Boca Raton, Florida, CRC Press, 2001 † The diameter of the electrode consists of the diameter of the pipe used to construct the electrode plus the added graphite and/or steel shot.
UFC 3-280-05 31 July 2006
6-40
engineering judgment or “rules of thumb” based on past experience, rather than with analytical solutions. 6-7.8.2 Numerical Modeling Codes. All of the numerical codes listed in Tables 6-3 and 6-4 may be used for simulating electrical resistivity heating sources, by using the simplifying assumption that the input electrical energy is applied uniformly within a finite soil volume surrounding or between electrodes. Some of the computer codes can also simulate the electrical field as well as soil heating based on electrical currents and soil resistance. An essential feature in electrical heating codes is the ability to vary soil resistance with temperature and fluid saturation; this capability is particularly important near electrodes, where the flow of electrical current can be impeded by dry soil conditions. 6-7.9 Modeling Aspects for Steam Injection 6-7.9.1 Analytical Solutions 6-7.9.1.1 Radial Gas Flow. As discussed, steady-state radial compressible-fluid flow equations may be used to estimate both steam injection and gas extraction rates. 6-7.9.1.2 Steam-Zone Radius. The Marx-Langenheim equation* is widely used for calculating the growth of a cylindrical steam zone around a single steam injection well, for an assumed injection rate and steam temperature. The optimum well spacing can be selected as the predicted steam-zone radius at a desired steam-breakthrough time (time for steam to reach the extraction wells), typically in the range of 2 to 3 weeks. Users of the Marx-Langenheim equation need to consider the potential for underestimation of the steam radius when the actual steam volume will be non-cylindrical, owing to the effects of steam-override and adjacent injection wells. 6-7.9.1.3 Coupled Gas Flow and Steam-Radius Calculations. A steady-state gas flow equation may be combined with the Marx-Langenheim equation to simulate a variable steam injection rate with time, as the steam radius increases. The calculation is implemented in a spreadsheet, over a series of time steps.†
6-7.9.2 Numerical Modeling Codes. All of the numerical modeling codes listed in Tables 6-1 and 6-2 are capable of simulating steam injection remediation. Most of the codes have well options that include productivity coefficients, well-efficiency corrections, and pressure control versus flow control. An important feature provided by some the modeling codes is the ability to simulate a multiphase well (i.e., pressure-controlled vapor extraction and flow-controlled liquid extraction from the same well). It should be noted that steam simulations can yield misleading results unless they are very carefully done. Input parameters such as the anisotropy ratio (horizontal
* Marx, J. W., and Langenheim, R. H. “Reservoir Heating by Hot Fluid Injection.” AIME Transactions, 216, 312-315: 1959. † Lawrence Livermore National Laboratory. Demonstration of Dynamic Underground Stripping at the: LLNL Gasoline Spill Demonstration Site. Final Report no. UCRL-ID-116964, vol. 1-4, Lawrence Livermore National Laboratory, 1994.
UFC 3-280-05 31 July 2006
6-41
to vertical permeability) and low-permeability lenses can totally control the heating pattern, and should be captured in the models. Models that are intended for uses other than preliminary design analyses should incorporate the following features:
• Geologic layering and heterogeneity. • Intrinsic permeability (affects injection rates and radius of influence). • Anisotropy ratio of major layers (influences the degree of vertical steam
rise, and the ability to heat the base of thick aquifers). • Heterogeneity and discontinuities in low-permeability layers (affects
upward steam migration through aquitards). Ideally, a predictive model that has been calibrated or verified by comparison to actual field steam flow should be used.*
6-7.10 Checklist for Review of Models for In Situ Thermal Remediation. A checklist for review of models for ISTR is located in Appendix C of this document. This list is focused on issues specific to thermal and multiphase modeling. General guidelines for the use of groundwater models are also applicable.† ‡ §
* Ochs, S.O., R.A. Hodges, R.W. Falta, T.F. Kmetz, J.J. Supar, N.N. Brown, and D.L. Parkinson, “Predicted heating patterns during steam flooding of coastal plain sediments at the Savannah River Site.” Environmental & Geological Geoscience, Vol IX, No. 1, Feb 2003, pp. 51-60, 2003. † Anderson, M.P. and Wm. W. Woessner. Applied Groundwater Modeling, Simulation of Flow and Advective Transport, Academic Press, San Diego, CA. 381 pp., 1992 ‡ American Society for Testing and Materials. Standard Guide for Describing the Functionality of a Groundwater Modeling Code. West Conshohocken PA: ASTM D6033, 1996. § American Society for Testing and Materials. Standard Guide for Selecting a Groundwater Modeling Code. West Conshohocken PA: ASTM D6170, 1997b.

UFC 3-280-05 31 July 2006
7-1
CHAPTER 7
COST AND PERFORMANCE RESULTS 7-1 INTRODUCTION. Pilot-studies and full-scale deployments are increasing our understanding of the underlying scientific principles and the practical field engineering aspects of ISTR technologies. 7-1.1 This chapter provides an overview of case study information. Appendix B provides the case study information, which includes the types of sites and site conditions (stratigraphy, permeability, vadose/saturated conditions, depth, etc.) where the technologies are being employed; cleanup goals and the performance of the technologies in meeting those goals; and cost information and trends where available. 7-1.2 Sites identified and described in this chapter and the appendix are intended to illustrate the types and range of deployments rather than give a comprehensive inven-tory of all applications. EPA maintains an on-line database of in situ thermal technology deployments. Projects are organized by technology. The database can be accessed at http://www.cluin.org/thermal. 7-1.3 Upon completion of an ISTR project, a cost and performance remedial action report should be completed. This includes final actual costs shown to the third level of the HTRW Remedial Action Work Breakdown Structure. Refer to USACE EP 1110-1-19 on remedial action reports. “Guide to Preparing Remedial Action Reports of Cost and Performance,” is available at http://www.usace.army.mil/inet/usace-docs/eng-pamphlets/ep1110-1-19/toc.htm 7-2 GENERAL OBSERVATIONS. While the experience base is growing,* there is not an extensive database of projects, thus limiting general insights. It is worthwhile to note that in virtually all applications of ISTR documented herein, much more contamination was recovered than was originally thought to be present. At the Visalia wood treater, a SEE project recovered over 1×10⁶ pounds of contamination where a pump and treat system had been operating for over 20 years recovering as little as 10 pounds/week. Based on groundwater concentration data for the SEE application in Skokie, IL, the site was initially estimated to have in the order of 1000 kg of trichloroethene and 1,1,1-trichloroethane, based on groundwater concentration data. At the completion of the project, an estimated 29 metric tons of solvent had been removed or degraded through biodegradation or hydrolysis using both SEE and ERH. At the most recent application of SEE at a fractured rock site, a pilot-scale demonstration project at Edwards AFB recovered 910 to 1360 kg (2000 to 3000 pounds) of solvents in an area thought to have on the order of 45 kg (100 pounds) of contamination. Thus, as has been noted elsewhere, in anticipation of significant recoveries, it is important that contaminant recovery systems be adequately sized. 7-2.1 Full-scale deployments have occurred in a variety of settings. Many of these applications involve successful subsurface heating and contaminant recovery, despite *EPA TIO’s data base of in situ thermal project currently lists over 60 entries

UFC 3-280-05 31 July 2006
7-2
the presence of underground appurtenances such as sewer lines, phone lines, and optic fiber lines. While engineering adjustments must be made for these features, they are not an insurmountable challenge. TCH applications have been sit up in proximity to residences. As discussed more fully in the ERH section, ERH has been implemented in active commercial settings and within and beneath an operating manufacturing plant. 7-2.2 Standards of practice are emerging about appropriate materials for various contaminant and concentration scenarios. Materials of construction are an important consideration, particularly where corrosive wastes are involved. ERH applications have experienced failures of CPVC piping in monitoring wells. ISTD TCH has experienced severe corrosion of piping while treating highly concentrated pesticide wastes. Similarly, it has become common practice for vendors to identify, locate, and shut in wells whose materials or methods of construction are not compatible with the expected temperature regimes. It is also common practice to identify, locate, and cut-off horizontal conduits that could serve as a lateral preferential pathway for migration of contaminants or steam. 7-2.3 ISTR unit costs are subject to economies of scale and other factors. Subject to adjustments for factors such as contaminant volatility, treatment requirements, etc., as discussed below, unit costs (e.g., $/cubic meter) decrease significantly as quantities to be treated increase. Pilot-scale studies may appear to be disproportionately expensive as many of the mobilization/demobilization and personnel costs are independent of project size. It is also the case that, from a total cost standpoint, “ideal“ applications are those involving smaller volumes of media, with large quantities of waste. 7-2.4 Unit costs for treatment also depend on the depth of the application, the need to treat various waste streams generated during ISTR, the treatment time and temperatures required for adequate removal to achieve goals, the availability of fuel or power, the risk allocation between client and vendor, the level of required monitoring, and the need for engineering controls of ground water flow, utility protection, etc. As the volume of vapor or liquid streams requiring treatment increases, treatment costs may significantly increase, depending on the type of treatment. Sites where vapors may be directly discharged to the atmosphere (rarely the case for ISTR sites) or where condensate or extracted water will not be generated in significant quantities will have lower unit costs for ISTR than those sites where elaborate treatment systems for vapors and liquids must be constructed for the project. Because operating costs, including labor and power or fuel, are related to operating time, the longer heating is required to achieve the objective, the more expensive the job. At sites where contaminants are not easily removed by thermal treatment or where clean-up objectives are stringent, costs may be substantially higher than for sites with easily removed contaminants and less stringent remedial goals. 7-2.5 Other factors may have a significant impact at some sites. If fuel or power is not readily available at the site, such as at the Wyckoff Superfund site, the costs for providing the energy source may significantly increase costs for the project. The more risk the vendor is allocated by contract mechanism at a site, generally the higher the bid cost, though there may be benefits to a risk-averse client for such arrangements. Costs
UFC 3-280-05 31 July 2006
7-3
increase somewhat as the amount of required monitoring increases, both for process control (e.g., stack sampling) or environmental purposes (e.g., assessment of contaminant migration toward nearby water bodies or structures). Lastly, the project costs are occasionally influenced by the need to overcome issues such as protection of utilities, prevention of thermal impacts to water bodies, need for ground water control through measures such as sheet piling or pumping. In all, the costs for ISTR application range widely and the estimated cost for a given application must consider the project-specific conditions and goals. 7-2.6 ISTR technologies have achieved a variety of cleanup goals, ranging from very stringent residential and MCL-type standards, to state and site-specific industrial/non-residential standards. In a fair number of cases, the cleanup levels achieved significantly exceeded the required performance. In at least one case, the Charleston Navy Yard where ERH was implemented as an Interim Remedial Measure (IRM), significant quantities of contamination were recovered but the specific percentage reduction goals were not achieved. 7-2.7 There is considerable interest in combining ISTR as an aggressive source removal/reduction technology with other more cost-effective polishing approaches to achieve ultimate remediation objectives at the lowest total cost. 7-3 TECHNOLOGY-SPECIFIC APPLICATIONS 7-3.1 Thermal Conductive Heating 7-3.1.1 Waste Types. Many of the initial deployments of thermal conduction addressed PCBs in soil. Conductive heating has been selected to address manufactured gas plant coal tars, pesticide residues (hexachloropentadiene), chlorinated solvents, and wood treatment creosote contamination. It is not necessary to operate conductive heating at maximum temperatures. Thus, the technology is potentially suitable to the full-spectrum of VOC and SVOC contaminants as well as the non-volatile contaminants for which it was originally designed. Other soil contaminants, including metals such as mercury and arsenic have not been tested at present, but are theoretically volatile enough to be remediated by thermal conductive heating. 7-3.1.2 Site Conditions/Characteristics Affecting Performance and Cost. Conductive heating in more permeable soils below the water table often requires control of water infiltration across the site. At the Entergy/Lake Charles MGP site, conductive heating was selected to address coal tar and PCB contamination; however, difficulties in dewatering resulted in terminating treatment. At the Rocky Mountain Arsenal (RMA) facility near Denver, Colorado, implementation of ISTD was discontinued following severe corrosion of pipes and equipment. As heat was applied to the hexachloropentadiene pit, extremely low pH waste streams were generated, quickly damaging the vendor’s equipment. This problem was not revealed by the lab scale treatability studies that preceded the deployment. The application was stopped after it was determined that it would not have
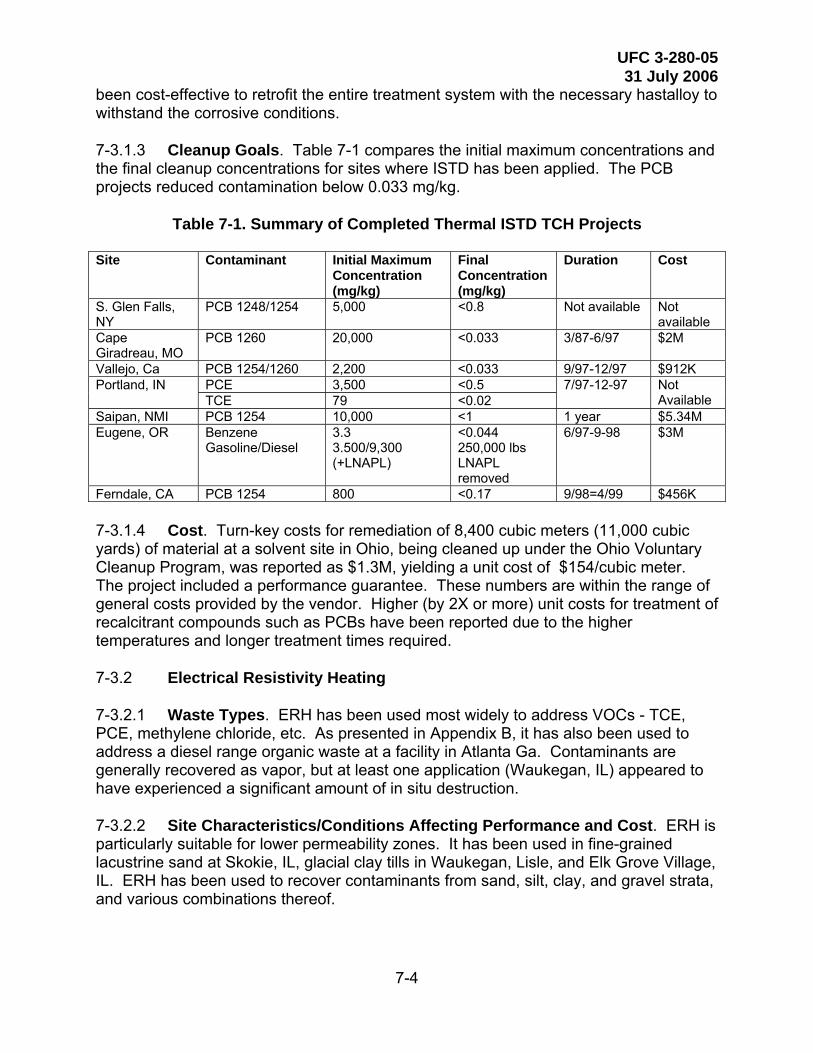
UFC 3-280-05 31 July 2006
7-4
been cost-effective to retrofit the entire treatment system with the necessary hastalloy to withstand the corrosive conditions. 7-3.1.3 Cleanup Goals. Table 7-1 compares the initial maximum concentrations and the final cleanup concentrations for sites where ISTD has been applied. The PCB projects reduced contamination below 0.033 mg/kg.
Table 7-1. Summary of Completed Thermal ISTD TCH Projects Site Contaminant Initial Maximum
Concentration (mg/kg)
Final Concentration (mg/kg)
Duration Cost
S. Glen Falls, NY
PCB 1248/1254 5,000 <0.8 Not available Not available
Cape Giradreau, MO
PCB 1260 20,000 <0.033 3/87-6/97 $2M
Vallejo, Ca PCB 1254/1260 2,200 <0.033 9/97-12/97 $912K PCE 3,500 <0.5 Portland, IN TCE 79 <0.02
7/97-12-97 Not Available
Saipan, NMI PCB 1254 10,000 <1 1 year $5.34M Eugene, OR Benzene
Gasoline/Diesel 3.3 3.500/9,300 (+LNAPL)
<0.044 250,000 lbs LNAPL removed
6/97-9-98 $3M
Ferndale, CA PCB 1254 800 <0.17 9/98=4/99 $456K 7-3.1.4 Cost. Turn-key costs for remediation of 8,400 cubic meters (11,000 cubic yards) of material at a solvent site in Ohio, being cleaned up under the Ohio Voluntary Cleanup Program, was reported as $1.3M, yielding a unit cost of $154/cubic meter. The project included a performance guarantee. These numbers are within the range of general costs provided by the vendor. Higher (by 2X or more) unit costs for treatment of recalcitrant compounds such as PCBs have been reported due to the higher temperatures and longer treatment times required. 7-3.2 Electrical Resistivity Heating 7-3.2.1 Waste Types. ERH has been used most widely to address VOCs - TCE, PCE, methylene chloride, etc. As presented in Appendix B, it has also been used to address a diesel range organic waste at a facility in Atlanta Ga. Contaminants are generally recovered as vapor, but at least one application (Waukegan, IL) appeared to have experienced a significant amount of in situ destruction. 7-3.2.2 Site Characteristics/Conditions Affecting Performance and Cost. ERH is particularly suitable for lower permeability zones. It has been used in fine-grained lacustrine sand at Skokie, IL, glacial clay tills in Waukegan, Lisle, and Elk Grove Village, IL. ERH has been used to recover contaminants from sand, silt, clay, and gravel strata, and various combinations thereof.
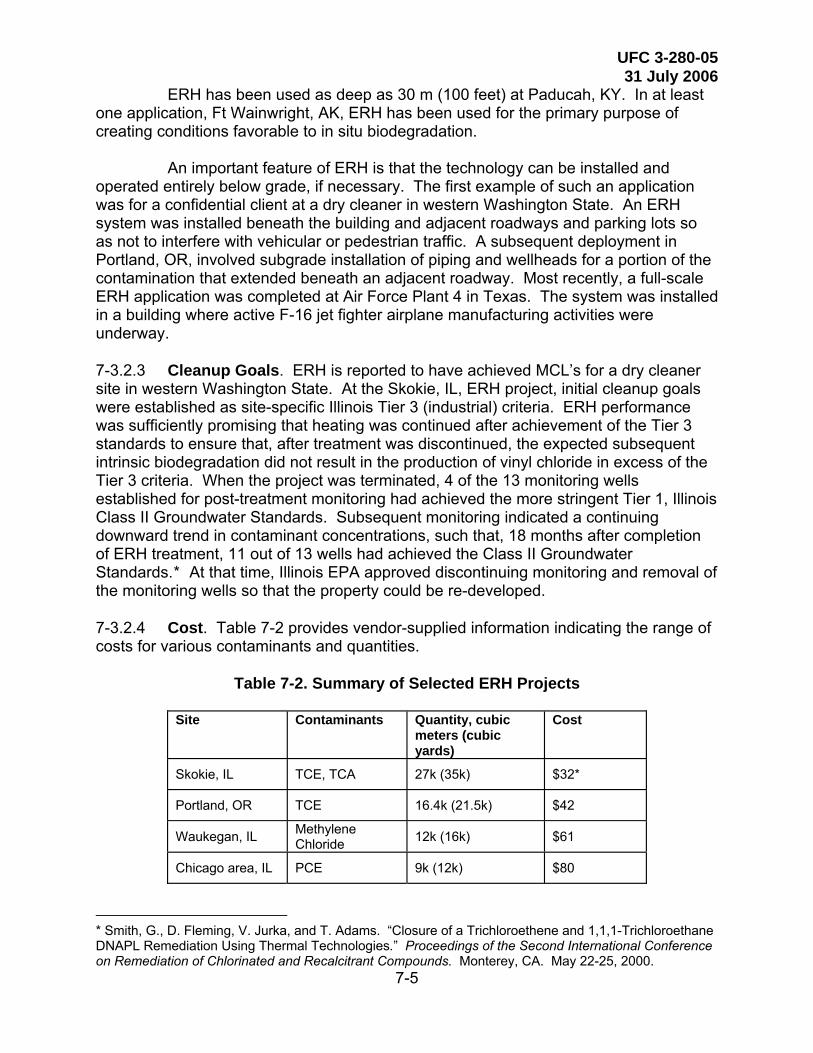
UFC 3-280-05 31 July 2006
7-5
ERH has been used as deep as 30 m (100 feet) at Paducah, KY. In at least one application, Ft Wainwright, AK, ERH has been used for the primary purpose of creating conditions favorable to in situ biodegradation. An important feature of ERH is that the technology can be installed and operated entirely below grade, if necessary. The first example of such an application was for a confidential client at a dry cleaner in western Washington State. An ERH system was installed beneath the building and adjacent roadways and parking lots so as not to interfere with vehicular or pedestrian traffic. A subsequent deployment in Portland, OR, involved subgrade installation of piping and wellheads for a portion of the contamination that extended beneath an adjacent roadway. Most recently, a full-scale ERH application was completed at Air Force Plant 4 in Texas. The system was installed in a building where active F-16 jet fighter airplane manufacturing activities were underway. 7-3.2.3 Cleanup Goals. ERH is reported to have achieved MCL’s for a dry cleaner site in western Washington State. At the Skokie, IL, ERH project, initial cleanup goals were established as site-specific Illinois Tier 3 (industrial) criteria. ERH performance was sufficiently promising that heating was continued after achievement of the Tier 3 standards to ensure that, after treatment was discontinued, the expected subsequent intrinsic biodegradation did not result in the production of vinyl chloride in excess of the Tier 3 criteria. When the project was terminated, 4 of the 13 monitoring wells established for post-treatment monitoring had achieved the more stringent Tier 1, Illinois Class II Groundwater Standards. Subsequent monitoring indicated a continuing downward trend in contaminant concentrations, such that, 18 months after completion of ERH treatment, 11 out of 13 wells had achieved the Class II Groundwater Standards.* At that time, Illinois EPA approved discontinuing monitoring and removal of the monitoring wells so that the property could be re-developed. 7-3.2.4 Cost. Table 7-2 provides vendor-supplied information indicating the range of costs for various contaminants and quantities.
Table 7-2. Summary of Selected ERH Projects
Site Contaminants Quantity, cubic meters (cubic yards)
Cost
Skokie, IL TCE, TCA 27k (35k) $32*
Portland, OR TCE 16.4k (21.5k) $42
Waukegan, IL Methylene Chloride 12k (16k) $61
Chicago area, IL PCE 9k (12k) $80
* Smith, G., D. Fleming, V. Jurka, and T. Adams. “Closure of a Trichloroethene and 1,1,1-Trichloroethane DNAPL Remediation Using Thermal Technologies.” Proceedings of the Second International Conference on Remediation of Chlorinated and Recalcitrant Compounds. Monterey, CA. May 22-25, 2000.
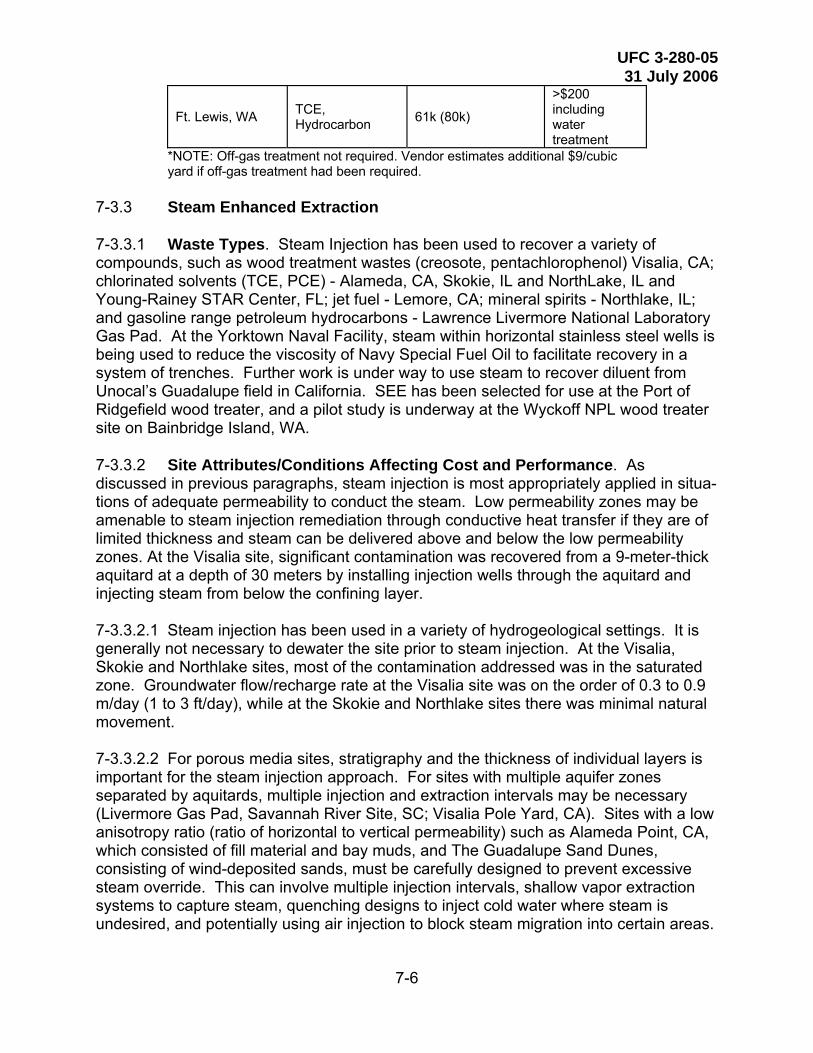
UFC 3-280-05 31 July 2006
7-6
Ft. Lewis, WA TCE, Hydrocarbon 61k (80k)
>$200 including water treatment
*NOTE: Off-gas treatment not required. Vendor estimates additional $9/cubic yard if off-gas treatment had been required.
7-3.3 Steam Enhanced Extraction 7-3.3.1 Waste Types. Steam Injection has been used to recover a variety of compounds, such as wood treatment wastes (creosote, pentachlorophenol) Visalia, CA; chlorinated solvents (TCE, PCE) - Alameda, CA, Skokie, IL and NorthLake, IL and Young-Rainey STAR Center, FL; jet fuel - Lemore, CA; mineral spirits - Northlake, IL; and gasoline range petroleum hydrocarbons - Lawrence Livermore National Laboratory Gas Pad. At the Yorktown Naval Facility, steam within horizontal stainless steel wells is being used to reduce the viscosity of Navy Special Fuel Oil to facilitate recovery in a system of trenches. Further work is under way to use steam to recover diluent from Unocal’s Guadalupe field in California. SEE has been selected for use at the Port of Ridgefield wood treater, and a pilot study is underway at the Wyckoff NPL wood treater site on Bainbridge Island, WA. 7-3.3.2 Site Attributes/Conditions Affecting Cost and Performance. As discussed in previous paragraphs, steam injection is most appropriately applied in situa-tions of adequate permeability to conduct the steam. Low permeability zones may be amenable to steam injection remediation through conductive heat transfer if they are of limited thickness and steam can be delivered above and below the low permeability zones. At the Visalia site, significant contamination was recovered from a 9-meter-thick aquitard at a depth of 30 meters by installing injection wells through the aquitard and injecting steam from below the confining layer. 7-3.3.2.1 Steam injection has been used in a variety of hydrogeological settings. It is generally not necessary to dewater the site prior to steam injection. At the Visalia, Skokie and Northlake sites, most of the contamination addressed was in the saturated zone. Groundwater flow/recharge rate at the Visalia site was on the order of 0.3 to 0.9 m/day (1 to 3 ft/day), while at the Skokie and Northlake sites there was minimal natural movement. 7-3.3.2.2 For porous media sites, stratigraphy and the thickness of individual layers is important for the steam injection approach. For sites with multiple aquifer zones separated by aquitards, multiple injection and extraction intervals may be necessary (Livermore Gas Pad, Savannah River Site, SC; Visalia Pole Yard, CA). Sites with a low anisotropy ratio (ratio of horizontal to vertical permeability) such as Alameda Point, CA, which consisted of fill material and bay muds, and The Guadalupe Sand Dunes, consisting of wind-deposited sands, must be carefully designed to prevent excessive steam override. This can involve multiple injection intervals, shallow vapor extraction systems to capture steam, quenching designs to inject cold water where steam is undesired, and potentially using air injection to block steam migration into certain areas.
UFC 3-280-05 31 July 2006
7-7
7-3.3.2.3 SEE has been used on a site as large as 12,100 square meters (3 acres) (Skokie and Northlake, IL). It has been used as deep as 41 meters (135 feet) at Visalia and as shallow as 3 meters (10 feet) at Alameda where heating occurred beneath a concrete pad in front of a former hangar. 7-3.3.2.4 At a number of sites, SEE was selected owing to the availability of previously existing on-site steam generation capacity. 7-3.3.2.5 SEE has been deployed at fractured bedrock sites at Edwards AFB and former Loring AFB under the auspices of EPA’s Superfund Innovative Technology Evaluation (SITE) program. These rock sites were treated to 18 and 27 meters (60 and 90 feet), respectively. Two additional pilot scale demonstrations are underway in 2003–2004. 7-3.3.2.6 Case study summaries for these projects are provided in Appendix B. 7-3.3.3 Cleanup Goals. Provided below is a listing of the cleanup goals that have been put in place for a variety of SEE applications:
• Demonstrate that heating can be achieved, and that mass removal can be accelerated compared to previously deployed methods (Savannah River Site, Edwards AFB Site 61, Loring Quarry, Beale AFB).
• Achieve pre-determined numeric standards for soil and groundwater concentrations (Alameda Point, Young-Rainey STAR Center).
• Remove mobile NAPL and restore groundwater quality at compliance points (Visalia Pole Yard, Wyckoff-Eagle Harbor, Port of Ridgefield).
• Eliminate source zone input of COCs to down-gradient dissolved plume (Alameda Point).
• Meet MDCA standards for soils or MCL for groundwater (Wyckoff-Eagle Harbor).
• Implement the best available steam technology, operate it until diminishing returns are achieved, and follow-up by sampling and negotiations with regulators for site closure with or without alternative contaminant levels. 7-3.3.4 Cost Information. At the Visalia Pole Yard NPL site, Southern California Edison spent approximately $21.5M to remediate the 8,100 square meter (2-acre) parcel. Cost per pound or gallon of contaminant information is also available. SCE had been conducting pump and treat operations at the facility since 1976, recovering approximately 4.5 kg (10 pounds) per week at a cost of $1M/year. Cost per pound for pump and treat was on the order of $4,400/kg (2,000/pound). In approximately 3 years of steam heating, SCE recovered or destroyed more than 590,000 kg (1.3M pounds) of creosote and pentachlorophenol wastes. The cost for SEE was less than $44/kg ($20/pound) and less than $130/m3. Unit costs at other sites ranged from $20/m3 at another full-scale project to >$500/m3 at another pilot project. Refer to Table B-1 in Appendix B for additional information on costs for steam-enhanced extraction.
UFC 3-280-05 31 July 2006
8-1
CHAPTER 8
PERFORMANCE MONITORING AND OPERATIONS AND MAINTENANCE (O&M) 8-1 SUBSURFACE MONITORING FOR ISTR TECHNOLOGIES. Subsurface monitoring during ISTR operations is essential for regulation of energy input to the treatment zone, and for measuring success in terms of subsurface heating and removal of contaminants. In general, instrument data are reduced and interpreted daily during active thermal treatment to facilitate timely changes in operational strategy. The frequency for evaluations of other information, such as analytical chemistry data, may be dictated by budgets and laboratory turn-around time. Monitoring costs represent a large portion of the ISTR budget; therefore, it is necessary to develop detailed data quality objectives prior to specifying a monitoring program. Although manually read gauges and meters are commonly used on ISTR projects, consideration should be given to the use of electronic transducers, electrical resistance tomography, and data logging equipment, which may reduce labor costs and provide more efficient data management. Monitoring data can be obtained from instruments installed on or in wells, and from instruments that are buried at locations of interest. Wellhead instrumentation can be manual or electronically read devices, while electronic transducers are used for buried instrumentation. Buried instruments generally consist of instrument strings (i.e., assemblies of vertically spaced temperature and pressure transducers) installed in a backfilled or grouted borehole. Instruments that are installed by direct burial should be resistant to both high temperatures and aggressive fluids that will be present in the subsurface. A table of suggested monitoring requirements for ISTR projects are included at the end of this chapter. The table is intended to provide information for planning ISTR projects; actual monitoring will likely vary with site-specific objectives and conditions. In addition, monitoring practices may be varied through different project phases (i.e., startup, initial heating, treatment including pressure cycling, post-treatment extraction and monitoring, etc.), or as the project team gains new insights from the data. 8-1.1 Fluid Pressure. Pressure data has several uses for ISTR:
• Feedback on subsurface pressure conditions may help to prevent blowouts, leakage, or fugitive emissions.
• Pressure data from a sufficient number of measurement points allows interpretation of subsurface flow patterns.
• Monitoring of gas pressures may help to evaluate that volatilized contaminants are being captured.
• Pressure data may help to evaluate the duration and effectiveness of pressure cycles. The gas pressure at each steam injection or groundwater extraction well may be measured by a pressure gauge or transducer on the wellhead or associated piping.

UFC 3-280-05 31 July 2006
8-2
If a surface vapor collector layer is used, gauges or transducers may be installed on the collector pipe risers. One or more additional pressure transducers can be installed in the filter pack adjacent to well screens, allowing direct measurement of pressures in the formation without well losses. Gas pressures away from extraction or injection wells can be measured by installing pressure monitoring points (PMP). PMP may be pressure transducers at the bottom of buried temperature instrument strings or they may be small diameter stainless steel wells fitted with either pressure transducers or magnehelic pressure gauges.* PMP are installed at differing depths and intervals of interest. Capture of volatilized contaminants is indicated by negative pressures (vacuum) at PMPs installed at treatment zone boundaries. If steam is not present in the subsurface, hydraulic head can be measured with a water-level probe in an open well, otherwise the hydraulic head or fluid level can be estimated from pressure readings. 8-1.2 Fluid Flow. Fluid flows are monitored during conductive heating and ERH operations to track removal rates and balance the well field vapor extraction system. During steam injection, measurements of fluid injection and extraction rates are essential for management of energy flow in the treatment area, to estimate contaminant removal rates from each treatment array, and to maintain overall hydraulic control on the project site. Liquid extraction rates are easily measured using conventional flow meters, or by stroke-counters if piston pumps are used. As flow meters do not differentiate between groundwater and NAPL, it may be necessary to estimate the NAPL flow rate at each extraction well as a percentage of the total extraction rate. This may be done by observations in a sight glass, or periodic collection of liquid samples from the wellhead. Gas-flow measurements should be taken at every extraction and injection well. It is also more common to monitor the combined flow rate to track total contaminant removal. Conventional gas-flow measurement, based on the pressure differentials across orifice plates or venturis, can be cost-prohibitive if done at every well. A less expensive alternative is to use a calibrated flow-control valve on each well, with connectors to allow periodic measurements of the pressure differential with a calibrated portable gage. The mass flow rate can then be calculated using an estimated specific gravity for the injected steam, or extracted steam-air mixture. 8-1.3 Temperature. Temperature is the most critical parameter to be monitored on an ISTR project, requiring the best resolution. Temperature data have the following uses:
• Evaluation of heat migration and distribution, and effectiveness of energy delivery to the subsurface.
• Identification of zones where heating has achieved target temperatures, or where thermal destruction is occurring.
• Determination of the presence of groundwater (groundwater will be present at locations where the temperature is below the boiling point).
* USACE. “Soil Vapor Extraction and Bioventing.” U.S. Army Corps of Engineers Engineer Manual EM 1110-1-4001. Washington, DC: U.S. Army Corps of Engineers, November 30, 1995, updated June 2002.

UFC 3-280-05 31 July 2006
8-3
• Estimation of steam pressures and evaluation of steam flow patterns (when the temperature is above the boiling point, saturated-steam pressure can be calculated directly from the temperature).
• Comparison of observed data with predictions from design calculations or modeling. Temperature monitoring at multiple depths and multiple locations is recommended. Temperature measurements should be recorded at least once daily; the rate of temperature change on ISTR projects is typically appropriate for twice-daily readings. Temperature measuring point (TMP) sensors are typically thermocouples installed in vertical strings set in the filter packs of injection or extraction wells, and at one or more locations in backfilled boreholes between each well. A typical vertical spacing for temperature sensors is 1 to 2 m. In general, there are three types of TMP locations:
• Thermal sources - TMPs located in or near electrodes, thermal wells, or steam injection wells will show the maximum temperatures being achieved at the site. For conductive heating projects, these temperatures will indicate the level of thermal destruction of contaminants.
• Between thermal sources - TMPs located between electrodes, thermal wells, or steam injection wells can help determine when target temperatures have been achieved within the treatment zone, and if energy is penetrating adequately to areas away from electrodes and wells. TMPs are generally set at the centroid between electrodes, heater wells, or steam injection wells as this is the location that would be slowest to heat.
• Margins of treatment zone - TMPs at the edges of the treatment zone indicate achievement of target temperatures to the full extent of the material to be treated, and can provide protection for sensitive areas beyond the treatment zone. 8-1.3.1 Thermocouples. Thermocouples are the most common temperature-measuring device. The temperature readings are obtained electronically, and are based on the voltage difference across a bimetallic sensor element. Many different types of thermocouples are available for different uses. Types E and K thermocouples, with stainless steel sheaths and Teflon insulation, are the best suited for high temperatures and potentially corrosive groundwater and NAPL. Consideration must be given to the expected temperatures and the heat tolerance of the cable insulation. Use of some thermocouples at electrodes during ERH or very near heater wells at TCH sites may not be appropriate. Thermocouples can be read by an automatic data logger, or manually by connecting a meter to the thermocouple leads. For large numbers of thermocouples, extension wires are generally run to a single location outside the treatment zone for more efficient data retrieval. 8-1.3.2 Fiber-Optic Distributed-Temperature Sensors (DTS). DTS systems measure temperature by means of laser signals transmitted along an optical fiber. The optical fiber is created by placing double loops of thin (¼-inch) tubing in wells and backfilled borings, and pumping the tubing full of an optical fluid. A single, continuous fiber can cover a large area with many wells and instrument borings, using vertical loops
UFC 3-280-05 31 July 2006
8-4
in each well or instrument string. DTS systems can provide vertically continuous temperature data, but are typically designed to record temperatures at 1-m vertical intervals. Because the electronic controller is the most expensive item in the system, DTS is most economical for larger sites. 8-1.3.3 Electrical Resistance Tomography (ERT). ERT is a geophysical technique whereby electrical energy is passed through the region of interest by multiple paths, allowing creation of a high-resolution 2 or 3 dimensional image of subsurface resistivity. The multiple transmission paths are the result of progressive activation of vertically spaced electrodes, which are installed in boreholes surrounding the region of interest. Surface electrodes may also be used along with the buried electrodes. Relatively few boreholes are required to provide good ERT coverage, and few if any electrodes are required within the treatment area itself. Interpretation of ERT imagery is not straightforward, however, because resistivity is affected by several factors, including soil and fluid temperature, soil mineralogy, fluid saturation and chemistry, salinity, and presence of NAPL or gas. A baseline ERT image must be generated before the start of the thermal treatment, and subsurface fluid and energy flow are evaluated from images of resistivity. Some of the ambiguity of ERT interpretations can be reduced by the concurrent use of directly measured temperature data from thermocouples or DTS. 8-1.4 Chemistry. Chemical testing of extracted fluids provides data for estimating mass-removal rates, contaminant destruction rates, and the proportion of contaminants recovered in each operational phase. The analytical data can also be used to evaluate the overall effectiveness and potential duration of the treatment. 8-1.4.1 Liquid. Liquids may be sampled directly from monitoring points, or extraction wells, via sampling taps on each wellhead. Many useful parameters, such as pH, conductivity/TDS, dissolved oxygen, carbon dioxide, and turbidity can be measured daily with portable instruments and field kits. The frequency of sampling for site COCs, such as PAHs, PCPs, and VOCs, will depend on treatment progress and laboratory turn-around; typical sampling intervals vary from 72 hours to 2 weeks. Sampling should follow standard operating procedures for handling hot liquids, including using proper PPE (full-face shield over safety glasses, chemical-protective and insulating gloves, waterproof suit or rain gear). Ideally, low flow purging and sampling procedures should be followed. Groundwater being pumped from the well should run through a cooling coil in an ice bath before reaching the pump, flow through cell, or sampling point. Immediately capping the jars and immersing them in ice should prevent loss of volatile components. A submerged screen monitoring well also poses a significant risk to samplers. If the well is opened while the subsurface is hot, this provides the conditions analogous to a natural geyser and steam may flash and blow hot water out of the well. Submerged screen wells must not be opened when the subsurface is hot. Figure 8-1 depicts a modified monitoring well that allows safe and accurate sampling of groundwater (provided that the depth to water is less than 25 feet) using a peristaltic pump. The Teflon sample line is connected to a stainless steel cooling coil that is immersed in ice water. The coiling coil is connected to a peristaltic pump for sampling. This cools the
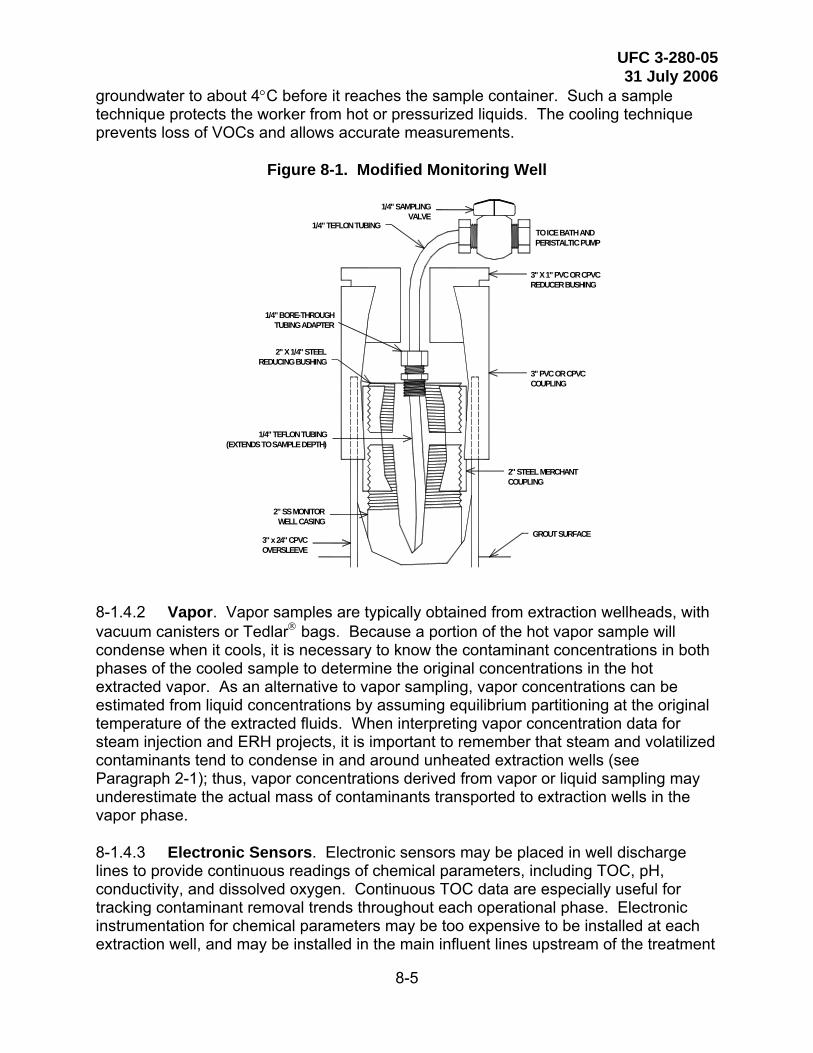
UFC 3-280-05 31 July 2006
8-5
groundwater to about 4°C before it reaches the sample container. Such a sample technique protects the worker from hot or pressurized liquids. The cooling technique prevents loss of VOCs and allows accurate measurements.
Figure 8-1. Modified Monitoring Well
2" SS MONITOR WELL CASING
2" STEEL MERCHANT COUPLING
1/4" TEFLON TUBING(EXTENDS TO SAMPLE DEPTH)
1/4" BORE-THROUGH TUBING ADAPTER
2" X 1/4" STEEL REDUCING BUSHING
1/4" SAMPLING VALVE
1/4" TEFLON TUBINGTO ICE BATH AND PERISTALTIC PUMP
3" x 24" CPVC OVERSLEEVE
GROUT SURFACE
3" PVC OR CPVC COUPLING
3" X 1" PVC OR CPVC REDUCER BUSHING
8-1.4.2 Vapor. Vapor samples are typically obtained from extraction wellheads, with vacuum canisters or Tedlar® bags. Because a portion of the hot vapor sample will condense when it cools, it is necessary to know the contaminant concentrations in both phases of the cooled sample to determine the original concentrations in the hot extracted vapor. As an alternative to vapor sampling, vapor concentrations can be estimated from liquid concentrations by assuming equilibrium partitioning at the original temperature of the extracted fluids. When interpreting vapor concentration data for steam injection and ERH projects, it is important to remember that steam and volatilized contaminants tend to condense in and around unheated extraction wells (see Paragraph 2-1); thus, vapor concentrations derived from vapor or liquid sampling may underestimate the actual mass of contaminants transported to extraction wells in the vapor phase. 8-1.4.3 Electronic Sensors. Electronic sensors may be placed in well discharge lines to provide continuous readings of chemical parameters, including TOC, pH, conductivity, and dissolved oxygen. Continuous TOC data are especially useful for tracking contaminant removal trends throughout each operational phase. Electronic instrumentation for chemical parameters may be too expensive to be installed at each extraction well, and may be installed in the main influent lines upstream of the treatment

UFC 3-280-05 31 July 2006
8-6
plant. Electronic sensors require periodic calibration and maintenance, and TOC sensors need to be periodically verified with laboratory testing. Thermocouples are typically of the K type, installed in a metallic sheath, and read with a digital reader. Where large numbers of thermocouples are installed, TC extension wire is often run to an indicator board located at the edge of the exclusion zone, allowing operational staff to scan through and record the entire set of temperature readings quickly at designated intervals. In ISTD remediation, subsurface temperatures and pressures typically change at a rate that is appropriate for periodic (i.e., twice daily) manual measurement. 8-1.5 Saturation. At sites that must undergo dewatering prior to application of conductive heating (e.g., sites where the soil must be superheated to enable treatment of high-boiling SVOCs), monitoring of saturation during dewatering can aid in minimizing the volume of water that must be boiled off during heating. For example, heating may best be initiated when, following drainage, saturation values have diminished and approached asymptotic levels. Saturation levels can be monitored non-destructively by various methods, including use of a neutron moisture meter lowered into an access tube, and time-domain reflectometry (TDR) waveguides pushed into the soil. These methods penetrate deeply into the formation while less costly methods tend to be biased by density or moisture artifacts immediately adjacent to the access tube or probe. 8-2 OPERATIONS AND MAINTENANCE FOR ISTR TECHNOLOGIES 8-2.1 Thermal Conductive Heating. Operation and maintenance (O&M) of TCH systems is multifaceted and varies from project to project. Most projects have relatively short operationally periods, with heating ranging from 1 to 3 months. General categories of O&M activities include:
• Pre-commissioning and start-up. • Normal day-to-day operations. • Normal maintenance. • Data collection and management/record keeping to ensure compliance
with health and safety requirements, emission limits and equipment operational ranges. • Response to identified problems requiring troubleshooting and
contingencies. • Emergency or end-of-heating shutdown.
8-2.1.1 O&M of subsurface equipment (e.g., thermal wells) is mostly straightforward, and involves daily monitoring of amperage being delivered to heater circuits, monitoring of subsurface temperatures and pressures (Section 8-1.1), and occasional repair/replacement of faulty components, if necessary. Adjustment and balancing of vacuums and flows among heater-vacuum wells and manifolds is described in the SVE EM*, except that with thermal conduction systems, only ~50 cm (~20 inches) water
* EM 1110-1-4001
UFC 3-280-05 31 July 2006
8-7
vacuum is typically applied at the wellhead, which is usually sufficient to ensure capture of vapors at the treatment boundaries. Toward the end of the heating process, it may be desirable to temporarily convert scattered heater-vacuum wells into passive air injection wells and thereby introduce air into zones that may otherwise be anoxic. Another optional late-term adjustment is to slightly unbalance the flows at individual wellheads to vary the position of subsurface airflow stagnation zones. 8-2.1.2 O&M of aboveground equipment (e.g., of collection piping and process components) may, depending on the nature of the project, range from simple to complex. Relatively simple systems are those involving components typical of SVE off-gas treatment equipment, such as a granular activated carbon (GAC) canister, blower and discharge stack, which often enable passive (i.e., primarily unmanned) O&M. 8-2.1.3 More complex systems would include those addressing harder-to-treat contaminants, such as chlorinated SVOCs (including PCBs), pesticides, and dioxins. Such systems may include the use of insertion heaters within insulated piping manifolds, a cyclone separator, thermal oxidizer, heat exchanger, condensate trap, acid-gas scrubber, GAC vessels, blowers, and discharge stack. Depending on emission limits and other requirements, such systems may include a computer Programmable Logic Controller (PLC); flow, temperature and pressure measuring instrumentation; a continuous emissions monitoring system (CEMS); several rounds of source testing; and may, depending on site requirements, need to be manned around the clock. Typically with complex systems, a minimum of two operators should be available at all times for safety reasons. Occasionally, collection and treatment of liquid condensate at various points within the piping system is also required, and may be integrated into the ISTD off-gas collection and treatment equipment. Ancillary equipment may include fuel (e.g., propane) storage tanks for the oxidizer. It is beyond the scope of this document to discuss all the various O&M and monitoring activities that such systems can entail. 8-2.1.4 Electrical distribution equipment for thermal conductive heating systems typically includes transformers, distribution panels, and circuit breakers. A backup generator and automatic or manual transfer switch is often provided to power the off-gas treatment equipment (although not the thermal wells) in the event of a power outage. Ancillary equipment includes fuel (e.g., diesel) storage tanks for the generator. The O&M requirements of the electrical distribution equipment tend to be minimal. 8-2.2 Electrical Resistivity Heating. During a typical VOC remediation, about 20% of the operating time is spent in heating the site to steady temperatures near 100°C - somewhat less than 100°C in the vadose zone where the action of the vapor recovery system pulls air through the site and retards temperatures through evaporative cooling, and somewhat more in the saturated zone where the hydrostatic pressure and boiling point increase with depth. Note that the rate of heating varies by vendor. During heat-up, the ERH energy that exceeds the heat loss rate will result in an increase in subsurface temperatures.
UFC 3-280-05 31 July 2006
8-8
8-2.2.1 When steady-state temperatures have been reached, the ERH power is not reduced. The ERH energy in excess of the heat loss rate will directly result in the evaporation of soil moisture and target contaminants. 8-2.2.2 The most energy and time efficient remediation results from the application of the greatest practical ERH power. The ERH power can be limited by several factors:
• The ERH electrodes have a practical power limit that usually is in the range of 0.25 to 1 kW per square foot of electrode borehole surface area. Electrode designs with low electrical resistance generally allow higher power application rates. Attempts to exceed the electrode limit will dry (vadose) or steam blanket (saturated zone) the soil adjacent to the electrode and reduce their electrical conductivity, which results in uneven heating.
• For planning, assume that the PCU will be operated 80% of the time and that the PCU will be operated at about 80% of its capacity during periods of operation. This limits the average ERH power input rate to about 65% of the PCU capacity.
• The vapor treatment capacity may limit the VOC evaporation rate, especially if an oxidation technology is used. However, varying the ERH power can control the VOC evaporation rate. Within the saturated zone, a reduction of ERH power will be reflected in a reduction of vapor treatment system loading in a few minutes. Within the vadose zone, the coupling is not as strong because the vapor recovery airflow through the soils will cool the soils while maintaining a near-constant evaporation rate. Within the vadose zone, ERH power and vapor recovery flow rates are adjusted to reduce treatment system loading. 8-2.2.3 If the vapor treatment system fails completely, the ERH system is shut down and the subsurface enters a quiescent state. Steam and VOC vapors will begin to diffuse outward from the heated zone, condensing as they encounter the surrounding cooler soils. The rate of outward steam and heat spread is quite slow, usually much less than a foot per day. When vapor recovery is restored, air is pulled through the expanded warm region and, through evaporation, cools the newly warmed soils while returning the moisture and VOCs to the treatment region. If temperature monitoring indicates areas are not reaching the target temperatures, modifications to the power distribution or the installation of additional electrodes in the cooler areas may be necessary and should be undertaken by the operator. Various maintenance activities for ERH include those routine activities required for the power control unit, blowers, and treatment system. Also, there will be maintenance of the moisture addition system at the electrodes, and regular inspection of the electrical connections for corrosion and of the piping systems for potential piping failure. The consistent production of fine materials from the vapor extraction system may be a sign that in-situ moisture content is low and that significant mobilization and removal of fine materials from the vadose zone may be occurring. This has happened at least one ERH site. 8-2.3 Steam Enhanced Extraction. This section presents an overview of a general O&M strategy for steam injection, including operational guidelines, monitoring
UFC 3-280-05 31 July 2006
8-9
parameters, and system modification considerations. The typical field work and O&M procedures will include the following:
• Collection of background data (water levels, contaminant concentrations, temperature, and other parameters expected to be affected).
• Maintenance and analysis of water softening and steam generation system (including monitoring of incoming water quality, water softening efficiency, steam production rate, pressure and temperature).
• Maintenance of the vacuum extraction system. • Maintenance of the vapor treatment system (including condenser). • Liquid treatment system (cooling, gravity separation, water treatment
efficacy, discharge concentrations). • Subsurface monitoring and wellhead measurements as described above. • Maintenance of the hydraulic control system (including verification of
capture or containment). • Computation of mass balance (injected steam, water, and air, extracted
water and vapor). • Computation of energy balance (injected as steam, extracted as steam
and heated fluids, heat losses, and calculated average temperatures of treatment zone). 8-2.3.1 Information on subsurface conditions should be updated just prior to the implementation of steam injection to provide a baseline against which the impact of steam injection can be compared and evaluated. An efficient way to ensure that the necessary baseline data are collected is to produce a checklist of parameters to be measured, including measurement locations and methodology. A good estimate of total mass of contaminants and distribution among all phases and subsurface treatment zones is critical for measuring the effectiveness of the steam injection project. 8-2.3.2 The major components of a steam injection system consist of a steam generation and distribution unit, injection/extraction wells, process controls, and an effluent treatment unit. Thermal modeling is usually used to determine steam injection parameters. The goal is to optimize the injection rate and pressure so that maximum heating efficiency, maximum volume of heated area, and optimized steam front shape can be achieved. The variables that can be modified to optimize the remediation system include steam pressure, steam flow rate, and locations of injection and extraction wells. As physical parameters of the steam are interdependent, setting injection rate, pressure, and steam quality should be enough for the system operation. 8-2.3.4 Prior to the start-up of the entire ISTR system, equipment and piping should be inspected and tested. A pre-commissioning/shakedown checklist should be developed and followed. The site Health and Safety officer should also ensure all safety devices are operable and that site personnel have all the necessary training and the appropriate personal protective equipment are available. 8-2.3.5 During operation, particular attention should be paid to the vapor and liquid recovery systems owing to unanticipated consequences of contaminant removal, including unwanted condensation or crystallization of contaminants or inorganic
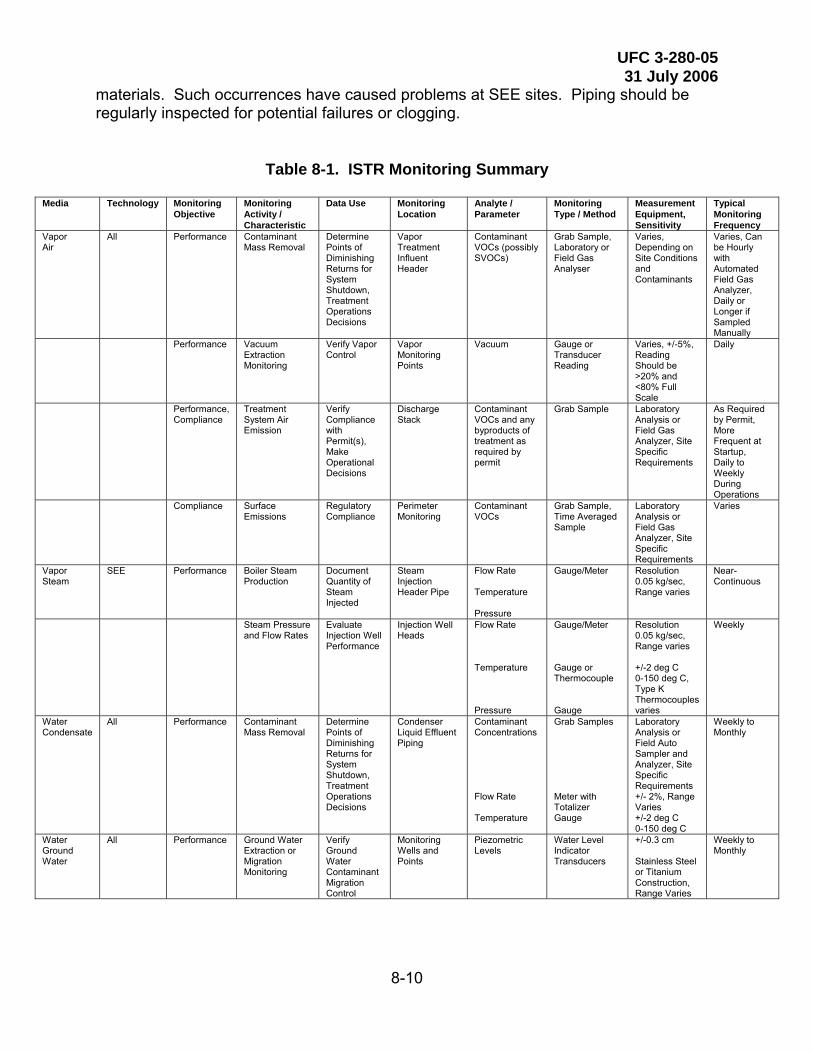
UFC 3-280-05 31 July 2006
8-10
materials. Such occurrences have caused problems at SEE sites. Piping should be regularly inspected for potential failures or clogging.
Table 8-1. ISTR Monitoring Summary
Media Technology Monitoring Objective
Monitoring Activity / Characteristic
Data Use Monitoring Location
Analyte / Parameter
Monitoring Type / Method
Measurement Equipment, Sensitivity
Typical Monitoring Frequency
Vapor Air
All Performance Contaminant Mass Removal
Determine Points of Diminishing Returns for System Shutdown, Treatment Operations Decisions
Vapor Treatment Influent Header
Contaminant VOCs (possibly SVOCs)
Grab Sample, Laboratory or Field Gas Analyser
Varies, Depending on Site Conditions and Contaminants
Varies, Can be Hourly with Automated Field Gas Analyzer, Daily or Longer if Sampled Manually
Performance Vacuum Extraction Monitoring
Verify Vapor Control
Vapor Monitoring Points
Vacuum Gauge or Transducer Reading
Varies, +/-5%, Reading Should be >20% and <80% Full Scale
Daily
Performance, Compliance
Treatment System Air Emission
Verify Compliance with Permit(s), Make Operational Decisions
Discharge Stack
Contaminant VOCs and any byproducts of treatment as required by permit
Grab Sample Laboratory Analysis or Field Gas Analyzer, Site Specific Requirements
As Required by Permit, More Frequent at Startup, Daily to Weekly During Operations
Compliance Surface Emissions
Regulatory Compliance
Perimeter Monitoring
Contaminant VOCs
Grab Sample, Time Averaged Sample
Laboratory Analysis or Field Gas Analyzer, Site Specific Requirements
Varies
Vapor Steam
SEE Performance Boiler Steam Production
Document Quantity of Steam Injected
Steam Injection Header Pipe
Flow Rate Temperature Pressure
Gauge/Meter Resolution 0.05 kg/sec, Range varies
Near-Continuous
Steam Pressure and Flow Rates
Evaluate Injection Well Performance
Injection Well Heads
Flow Rate Temperature Pressure
Gauge/Meter Gauge or Thermocouple Gauge
Resolution 0.05 kg/sec, Range varies +/-2 deg C 0-150 deg C, Type K Thermocouples varies
Weekly
Water Condensate
All Performance Contaminant Mass Removal
Determine Points of Diminishing Returns for System Shutdown, Treatment Operations Decisions
Condenser Liquid Effluent Piping
Contaminant Concentrations Flow Rate Temperature
Grab Samples Meter with Totalizer Gauge
Laboratory Analysis or Field Auto Sampler and Analyzer, Site Specific Requirements +/- 2%, Range Varies +/-2 deg C 0-150 deg C
Weekly to Monthly
Water Ground Water
All Performance Ground Water Extraction or Migration Monitoring
Verify Ground Water Contaminant Migration Control
Monitoring Wells and Points
Piezometric Levels
Water Level Indicator Transducers
+/-0.3 cm Stainless Steel or Titanium Construction, Range Varies
Weekly to Monthly
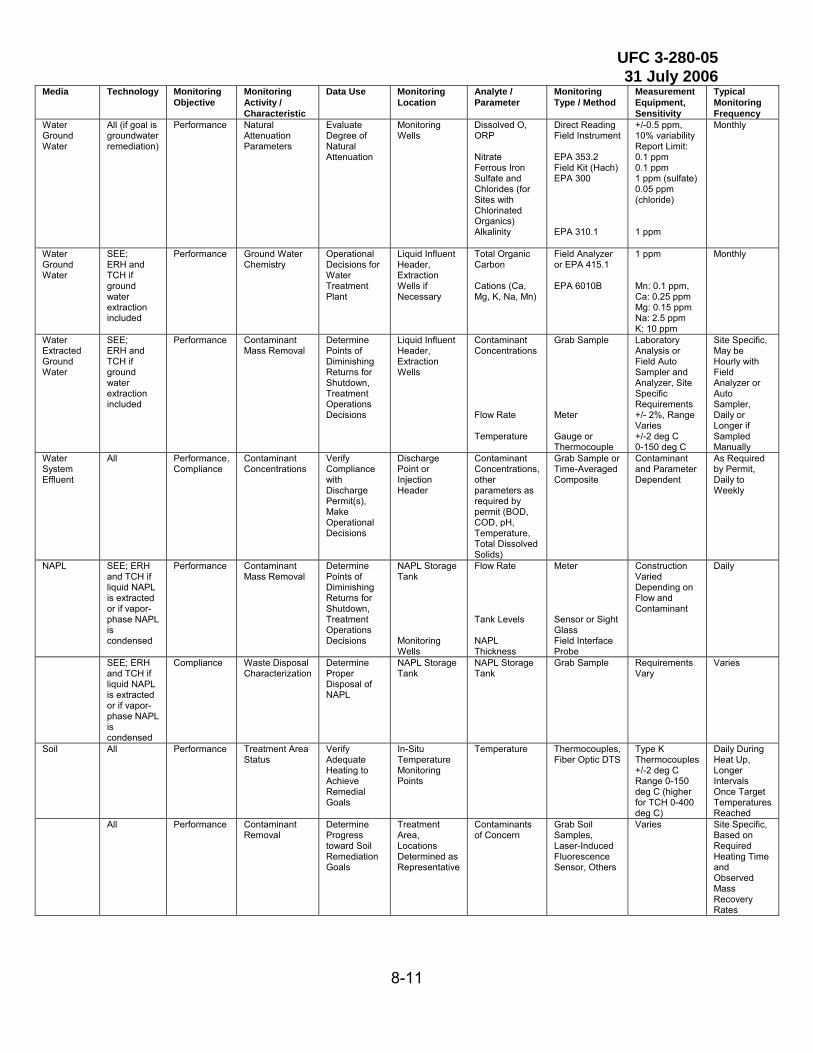
UFC 3-280-05 31 July 2006
8-11
Technology Monitoring Objective
Monitoring Activity / Characteristic
Data Use Monitoring Location
Analyte / Parameter
Monitoring Type / Method
Measurement Equipment, Sensitivity
Typical Monitoring Frequency
Media
Water Ground Water
All (if goal is groundwater remediation)
Performance Natural Attenuation Parameters
Evaluate Degree of Natural Attenuation
Monitoring Wells
Dissolved O, ORP Nitrate Ferrous Iron Sulfate and Chlorides (for Sites with Chlorinated Organics) Alkalinity
Direct Reading Field Instrument EPA 353.2 Field Kit (Hach) EPA 300 EPA 310.1
+/-0.5 ppm, 10% variability Report Limit: 0.1 ppm 0.1 ppm 1 ppm (sulfate) 0.05 ppm (chloride) 1 ppm
Monthly
Water Ground Water
SEE; ERH and TCH if ground water extraction included
Performance Ground Water Chemistry
Operational Decisions for Water Treatment Plant
Liquid Influent Header, Extraction Wells if Necessary
Total Organic Carbon Cations (Ca, Mg, K, Na, Mn)
Field Analyzer or EPA 415.1 EPA 6010B
1 ppm Mn: 0.1 ppm, Ca: 0.25 ppm Mg: 0.15 ppm Na: 2.5 ppm K: 10 ppm
Monthly
Water Extracted Ground Water
SEE; ERH and TCH if ground water extraction included
Performance Contaminant Mass Removal
Determine Points of Diminishing Returns for Shutdown, Treatment Operations Decisions
Liquid Influent Header, Extraction Wells
Contaminant Concentrations Flow Rate Temperature
Grab Sample Meter Gauge or Thermocouple
Laboratory Analysis or Field Auto Sampler and Analyzer, Site Specific Requirements +/- 2%, Range Varies +/-2 deg C 0-150 deg C
Site Specific, May be Hourly with Field Analyzer or Auto Sampler, Daily or Longer if Sampled Manually
Water System Effluent
All Performance, Compliance
Contaminant Concentrations
Verify Compliance with Discharge Permit(s), Make Operational Decisions
Discharge Point or Injection Header
Contaminant Concentrations, other parameters as required by permit (BOD, COD, pH, Temperature, Total Dissolved Solids)
Grab Sample or Time-Averaged Composite
Contaminant and Parameter Dependent
As Required by Permit, Daily to Weekly
NAPL SEE; ERH and TCH if liquid NAPL is extracted or if vapor-phase NAPL is condensed
Performance Contaminant Mass Removal
Determine Points of Diminishing Returns for Shutdown, Treatment Operations Decisions
NAPL Storage Tank Monitoring Wells
Flow Rate Tank Levels NAPL Thickness
Meter Sensor or Sight Glass Field Interface Probe
Construction Varied Depending on Flow and Contaminant
Daily
SEE; ERH and TCH if liquid NAPL is extracted or if vapor-phase NAPL is condensed
Compliance Waste Disposal Characterization
Determine Proper Disposal of NAPL
NAPL Storage Tank
NAPL Storage Tank
Grab Sample Requirements Vary
Varies
Soil All Performance Treatment Area Status
Verify Adequate Heating to Achieve Remedial Goals
In-Situ Temperature Monitoring Points
Temperature Thermocouples, Fiber Optic DTS
Type K Thermocouples +/-2 deg C Range 0-150 deg C (higher for TCH 0-400 deg C)
Daily During Heat Up, Longer Intervals Once Target Temperatures Reached
All Performance Contaminant Removal
Determine Progress toward Soil Remediation Goals
Treatment Area, Locations Determined as Representative
Contaminants of Concern
Grab Soil Samples, Laser-Induced Fluorescence Sensor, Others
Varies Site Specific, Based on Required Heating Time and Observed Mass Recovery Rates
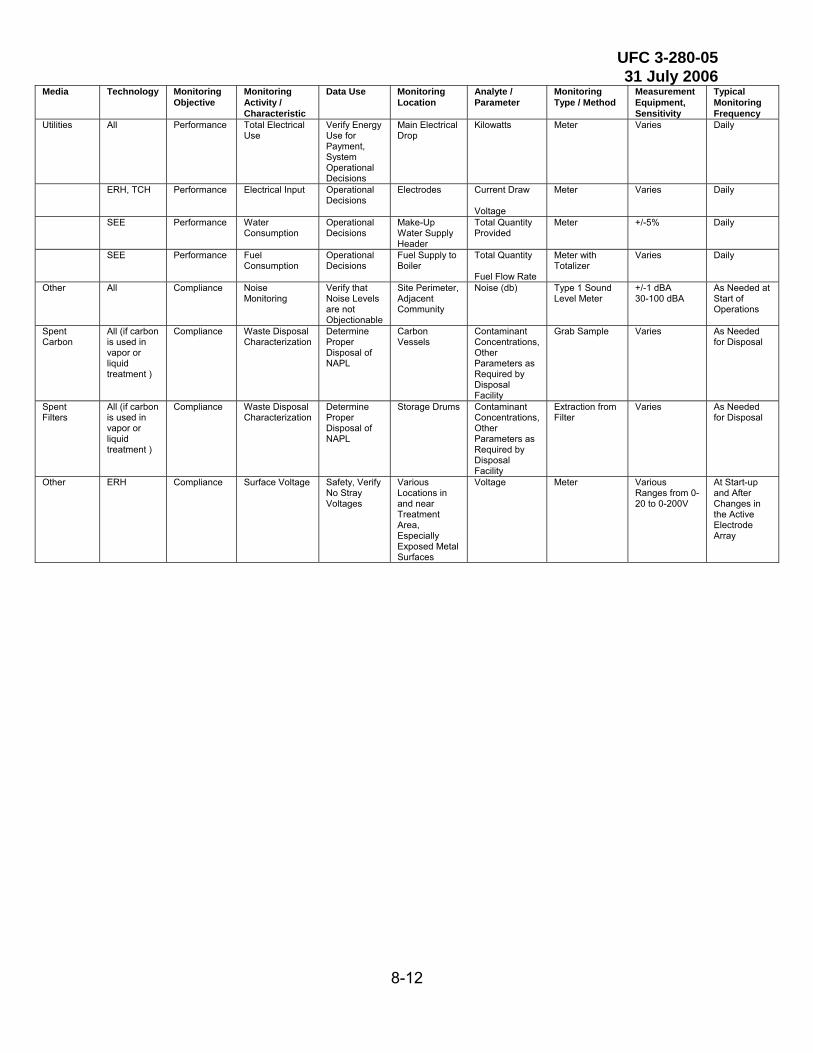
UFC 3-280-05 31 July 2006
8-12
Technology Monitoring Objective
Monitoring Activity / Characteristic
Data Use Monitoring Location
Analyte / Parameter
Monitoring Type / Method
Measurement Equipment, Sensitivity
Typical Monitoring Frequency
Media
Utilities All Performance Total Electrical Use
Verify Energy Use for Payment, System Operational Decisions
Main Electrical Drop
Kilowatts Meter Varies Daily
ERH, TCH Performance Electrical Input Operational Decisions
Electrodes Current Draw Voltage
Meter
Varies Daily
SEE Performance Water Consumption
Operational Decisions
Make-Up Water Supply Header
Total Quantity Provided
Meter +/-5% Daily
SEE Performance Fuel Consumption
Operational Decisions
Fuel Supply to Boiler
Total Quantity Fuel Flow Rate
Meter with Totalizer
Varies Daily
Other All Compliance Noise Monitoring
Verify that Noise Levels are not Objectionable
Site Perimeter, Adjacent Community
Noise (db) Type 1 Sound Level Meter
+/-1 dBA 30-100 dBA
As Needed at Start of Operations
Spent Carbon
All (if carbon is used in vapor or liquid treatment )
Compliance Waste Disposal Characterization
Determine Proper Disposal of NAPL
Carbon Vessels
Contaminant Concentrations, Other Parameters as Required by Disposal Facility
Grab Sample Varies As Needed for Disposal
Spent Filters
All (if carbon is used in vapor or liquid treatment )
Compliance Waste Disposal Characterization
Determine Proper Disposal of NAPL
Storage Drums Contaminant Concentrations, Other Parameters as Required by Disposal Facility
Extraction from Filter
Varies As Needed for Disposal
Other ERH Compliance Surface Voltage Safety, Verify No Stray Voltages
Various Locations in and near Treatment Area, Especially Exposed Metal Surfaces
Voltage Meter Various Ranges from 0-20 to 0-200V
At Start-up and After Changes in the Active Electrode Array
UFC 3-280-05 31 July 2006
9-1
CHAPTER 9
SYSTEM SHUTDOWN AND CONFIRMATION OF CLEANUP 9-1 INTRODUCTION. Robust remediation systems like ISTR are expensive to operate for extended periods. Therefore, to ensure efficient remediation operations, it is important to monitor for and understand the data that are gathered in the context of achieving the remediation goals. Decisions about the continued operation and eventual shutdown of an ISTR system typically hinge on whether or not the system has reached a point of diminishing returns with respect to the anticipated performance. While performing ISTR, the project manager or engineer is typically monitoring a number of parameters: subsurface temperature (distribution and trends), concentrations of organic compounds in the recovered vapor, vapor flow rates, groundwater flow rates, condensate recovery, steam injection rates, electricity (or fuel) consumption, groundwater concentrations, and, potentially, periodic soil sampling results. These parameters are used to monitor the system operations, track treatment progress, and determine when the system should be shutdown. Operation of an ISTR system should cease when remediation objectives, as specified for the treatment area, have been met. As described in Paragraph 4-2, remediation objectives for ISTR can be based on numerical targets (e.g., soil cleanup levels) or other measurable end-points or narrative goals established prior to treatment (e.g., mass removal percentage). This paragraph discusses various strategies and protocols used by the industry, many of which have been accepted by regulators, to confirm and document cleanup using ISTR. Multiple indicators of ISTR performance (lines of evidence) are used to determine when to terminate the thermal treatment phase and transition to a more passive polishing stage or to site closeout. 9-2 SHUTDOWN STRATEGY. Before starting an ISTR system, it is important to not only establish technology-specific objectives for the response action (e.g., numerical cleanup levels or narrative goals), but to have in hand an overall exit strategy for the site that will guide the project manager or engineer through subsequent phases of the remediation, including transition and termination. According to recent DOE guidance on groundwater response strategies,* an exit strategy consists of four essential elements:
• A description of the objective of the activity, i.e., the objective associated with a technology application or phase of a response.
• A performance “model” that describes the expected course of the remediation process, i.e., how conditions are expected to change over time from the current state until the response objective is attained.
• A set of the performance metrics, decision criteria, and endpoints that will be used to assess how the response is progressing, demonstrate when the objective has been reached or an unacceptable condition or deviation occurs.
* U.S. Department of Energy. Guidance for Optimizing Ground Water Response Actions at Department of Energy Sites. Office of Environmental Management, 2002.
UFC 3-280-05 31 July 2006
9-2
• A contingency plan that will be implemented if data indicate an objective will not be met. 9-2.1 With a clear understanding of the expected performance and endpoints established, decisions about shutdown can be made. It can be difficult, however, to predict the performance of ISTR systems and come up with reproducible end-points and shutdown criteria because there are limited performance data from full-scale ISTR deployments. Therefore, expert field judgment must be relied upon to determine when to shut a system down and a certain amount of flexibility must be incorporated into the exit strategy. 9-2.2 Shutdown of an ISTR system requires ongoing assimilation of data from the various lines of evidence, which include subsurface temperature profiles and contaminant removal or destruction rates, to decide whether remediation objectives have been met. When an assessment of these lines of evidence tells the project manager or engineer that performance objectives are not being met, efforts to optimize or enhance the ISTR system in some way should be made. If the assessment indicates that the system will not likely succeed within the constraints of the existing design, then it may be necessary to implement a contingency plan. 9-2.3 Routine system monitoring data are collected and used by operators to assess system performance and make operational adjustments during operation. Details on monitoring for ISTR were discussed in Paragraph 8-1. System monitoring data, when viewed collectively, are used to evaluate and optimize system performance, as well as make critical judgments as to the effectiveness of treatment and help determine if continued operation is warranted. 9-3 SHUTDOWN CRITERIA. Shutdown criteria are measurable, technology-specific parameters used by the project manager or engineer to gauge whether or not the current remedial phase is complete and the system is ready to be shutdown or transitioned to the next phase. Shutdown criteria for ISTR methods are typically based on numerical targets or endpoints against which process monitoring data are compared. Establishing shutdown criteria, like RAOs, requires an understanding of the potential performance capabilities of the selected ISTR technology and the expected or theoretical behavior, as well as the overall remediation goals. But it also must take into consideration the practical limitations of verifying the performance of ISTR in the field. System performance and optimization may focus on optimizing mass removal from the subsurface, yet remediation goals are typically (soil or groundwater) concentration based. It is difficult to directly monitor subsurface conditions and the real-time effects of thermal treatment on the source zone. Piping, cables, and wiring for monitoring systems make access to interior treatment areas difficult. Further, drilling into and handling of hot soils and groundwater present health and safety concerns. If shutdown criteria are unreasonable or impossible to quantify using readily available instruments, then the decision to cease operation of the system is typically made on the basis of temperature data and trends in mass removal. In certain instances, shut down

UFC 3-280-05 31 July 2006
9-3
decisions may be made based on non-technical criteria, such as operating costs or remedial timeframe, which may appear as arbitrary endpoints. Unlike RAOs, which are broader and tend to focus on reducing source area volumes (or mass) or contaminant mass flux to groundwater to attain a certain level of risk reduction or protectiveness, shutdown criteria are inherently process or technology-specific. Shutdown criteria should be based on parameters that are easy and inexpensive to measure, most of which are already collected as part of the system’s process monitoring program (e.g., temperature profiles, vapor concentration). Direct measures of contaminant mass remaining in the subsurface, based on collection of soil samples, for instance, have not been typically used as shutdown criteria owing to the difficulty in sampling hot media and the need to make quick, cost-effective decisions regarding continued operation of a remedial system. The following section discusses some of the parameters that can be considered for use as shutdown criteria at ISTR projects. 9-3.1 Mass Removal. A goal of source zone remediation may be to reduce the mass of NAPL in the subsurface. By charting the amount of NAPL recovered from the subsurface over time, the technology’s performance can be assessed and used as a basis for system shutdown. The mass of NAPL brought to the surface by the extraction system can be estimated by measuring the concentrations of contaminants in the extracted fluids (liquids and vapors) before these streams enter aboveground treatment units. NAPL content and the concentrations of site contaminants in extracted water and vapor are typically measured as part of the process monitoring scheme and can be used as shutdown criteria, forming two or three lines of evidence. 9-3.1.1 There are two ways in which mass removal information can be utilized as a shutdown criterion: mass removal percentage and mass removal rate. Of the two, determining the percentage of mass removed is the more difficult and uncertain calculation to make because of the difficulties inherent in quantifying or measuring contaminant mass either before or after treatment. 9-3.1.2 If a fairly accurate estimate of the mass is available before the start of ISTR, then it may be useful to track the cumulative mass recovered in the extracted fluids and shut down the system after a certain percentage of the mass believed to be present initially is recovered. The level of confidence of initial estimates of NAPL mass is often low, and based on inaccuracies inherent with sampling. Some initial estimate is usually made to define the potential mass to be removed for permitting purposes and estimates of loading on surface treatment systems. There have been cases where greater than 200% of the mass originally present in the treatment area was removed, which does not reflect well on the accuracy of the pre-treatment characterization or the use of mass removal percentage as a criterion for shutdown. 9-3.1.3 A better strategy is to operate the ISTR system until the rate of mass removal, based on observations of vapor or aqueous-phase concentrations in the extracted fluids, reaches a point of diminishing returns or until no NAPL product is recovered. Similar to SVE systems, vapor concentrations often approach an asymptote at some level where increases in the rate of energy input (in the form of heat for ISTR) fails to
UFC 3-280-05 31 July 2006
9-4
result in a higher mass removal rate. Asymptotic conditions alone may not be reason to shut down an ISTR system, particularly if there is still significant mass being removed from the ground. A criterion suggested for SVE system shutdown is “specific energy consumption,” defined as the amount of energy needed to remove 1 kg of chlorinated hydrocarbons from the unsaturated subsoil using SVE. However, in taking this approach, a well designed and constructed vapor recovery system is required that one is confident is being effective. To evaluate that treatment is complete, the rate of removal should be the result of limited vapor recovery rather than the result of leaks diluting the concentrations. 9-3.2 Temperature Distribution. A measure of performance often used as the initial basis for shutdown of ISTR systems is temperature distribution and duration. Temperature monitoring is integral to any ISTR project, providing a measure of heat distribution and a way to evaluate the effectiveness of energy delivery to the treatment zone (methods of temperature monitoring are discussed in Paragraph 8-1.3). Temperature distribution is typically used as a shutdown criterion in conjunction with other lines of evidence, such as concentrations of VOCs in the vapor recovery system. If the desired temperature is attained throughout the treatment area, and concentrations in the vapor recovery system are declining or trending towards an asymptote, then the system is at or near the end of its useful period of operation. Depending on the particular ISTR technology and the contaminants to be treated, a target temperature and residence time required to mobilize or destroy the contaminants would have been established during the design. Attaining and maintaining this temperature throughout the treatment zone for a specified period would therefore likely be a performance objective for the ISTR system and a decision criteria operation. 9-3.3 Groundwater Concentration. Restoring groundwater quality in the vicinity of a NAPL source area being treated by ISTR is one of the most commonly stated remediation objectives. This is because of the presence of residual NAPL in the saturated zone and the slow release and dissolution of these contaminants from the NAPL phase into the groundwater phase. During ISTR treatment, it is common for concentrations in groundwater to increase in response to heating. This is attributable to the temperature-sensitive nature of aqueous solubility and also to disturbance of the subsurface during treatment. The concentrations in groundwater increase until the boiling point of the mixture of VOCs in groundwater is achieved, and then concentrations in groundwater decline. It is also important to monitor groundwater quality outside the source area during ISTR to ensure that containment is being achieved. It is not recommended that groundwater chemistry data alone be used to determine when to shut down an ISTR system. 9-3.4 Plume Load. Another indicator of performance based on measurements of groundwater quality is to track decreases in plume load or the mass release rate at steady state from the NAPL source to the groundwater plume. Plume load is the “rate at which solute mass in the groundwater plume crosses a spatial plane oriented at a
UFC 3-280-05 31 July 2006
9-5
right angle to the direction of groundwater flow.”* Using plume load as a criterion, shutdown of the ISTR system would be considered when the mass release rate from the source to the groundwater falls below the natural assimilative capacity of the aquifer. This obviously requires an understanding of the natural assimilative capacity of the aquifer (see Paragraph 4-2). Perhaps the simplest and most direct way of calculating plume load entails capturing the entire plume using one or more extraction wells pumping at a continuous rate and collecting steady-state concentration data. Based on the measured flow rate and concentration data, plume load can be calculated. This could be a cost-effective approach to system shutdown, especially for ISTR systems that completely control the plume using hydraulic containment. Another way to measure plume load is to collect groundwater data from numerous, closely spaced sampling points along a transect of wells oriented perpendicular to the direction of groundwater flow using direct-push, multi-level sampling tools. The plume load is then calculated by multiplying the estimated groundwater flow velocity by the average groundwater contaminant concentration. This method requires relatively more sampling costs but allows for more rapid decision-making and analysis. 9-3.5 Emerging Methods to Track Remediation Progress. Isotopic techniques provide a possible method to track progress of ISTR remediation and may be factored into decision making to shut down the systems. Stable isotopes of carbon and chlorine have been used to track the progress of an ISTR groundwater remediation site in the greater Chicago Area.† Researchers there determined that isotopes of 13C and 37Cl in groundwater contaminated with chlorinated compounds show increases in both 13C and 37Cl when the chlorinated compounds were being biodegraded. Where volatilization of chlorinated compounds from groundwater systems was occurring, the groundwater was enriched in 37Cl, but 13C concentrations decreased. Heat enhanced dissolution into groundwater was reflected in a reduction of both 13C and 37C. This relationship is presented in Figure 9-1. Plotting concentrations of δ13C and δ37Cl over time provides insight into the fate of the compounds, and hence the active fate mechanism.‡ For instance, Figure 9-2 presents data from well F3 from the site over various sampling events. The single data point located on the left portion of the graph is a reference standard for the site from a sample of DNAPL in water recovered earlier in the ISTR remediation process. Samples from January 1998 and April 1998 showed a trend toward this reference standard, and this was interpreted as heat-enhanced dissolution into groundwater, consistent with the pattern depicted in Figure 9-1.§ From April to December 1998, the trend was relatively flat, such that there may have been a combination of biodegradation and volatilization. The data trend from December 1998
* North Atlantic Treaty organization/committee on the Challenges of Modern society. NATO/CCMS Pilot Study, Evaluation of Demonstrated and Emerging Technologies for the Treatment of Contaminated Land and Groundwater (Phase III). EPA 542-R-02-002. † Sturchio, N. C., L. Heraty, B. D. Holt, L. Huang, T. Abrajano, and G. Smith. “Stable Isotope Diagnostics of Chlorinated Solvent Behavior in Contaminated Aquifers.” Proceedings of the Second International Conference on Remediation of Chlorinated and Recalcitrant Compounds, Monterey, CA, May 2000. ‡ Isotopic data are expressed in conventional δ notation, where δ = [(Rsample/Rreference) – 1] × 1000, R= 13C/12C or 37Cl/35Cl, and δ values are reported in units of o/oo (per mil) § Sturchio, et al., 2000
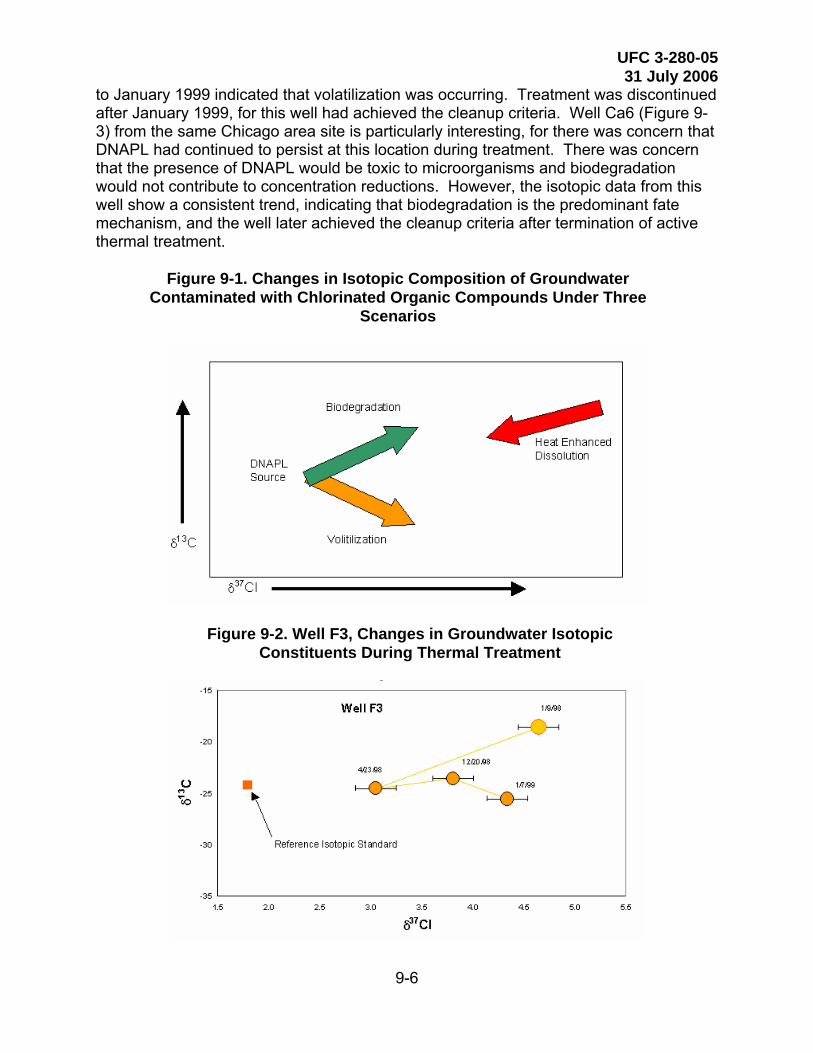
UFC 3-280-05 31 July 2006
9-6
to January 1999 indicated that volatilization was occurring. Treatment was discontinued after January 1999, for this well had achieved the cleanup criteria. Well Ca6 (Figure 9-3) from the same Chicago area site is particularly interesting, for there was concern that DNAPL had continued to persist at this location during treatment. There was concern that the presence of DNAPL would be toxic to microorganisms and biodegradation would not contribute to concentration reductions. However, the isotopic data from this well show a consistent trend, indicating that biodegradation is the predominant fate mechanism, and the well later achieved the cleanup criteria after termination of active thermal treatment.
Figure 9-1. Changes in Isotopic Composition of Groundwater Contaminated with Chlorinated Organic Compounds Under Three
Scenarios
Figure 9-2. Well F3, Changes in Groundwater Isotopic Constituents During Thermal Treatment
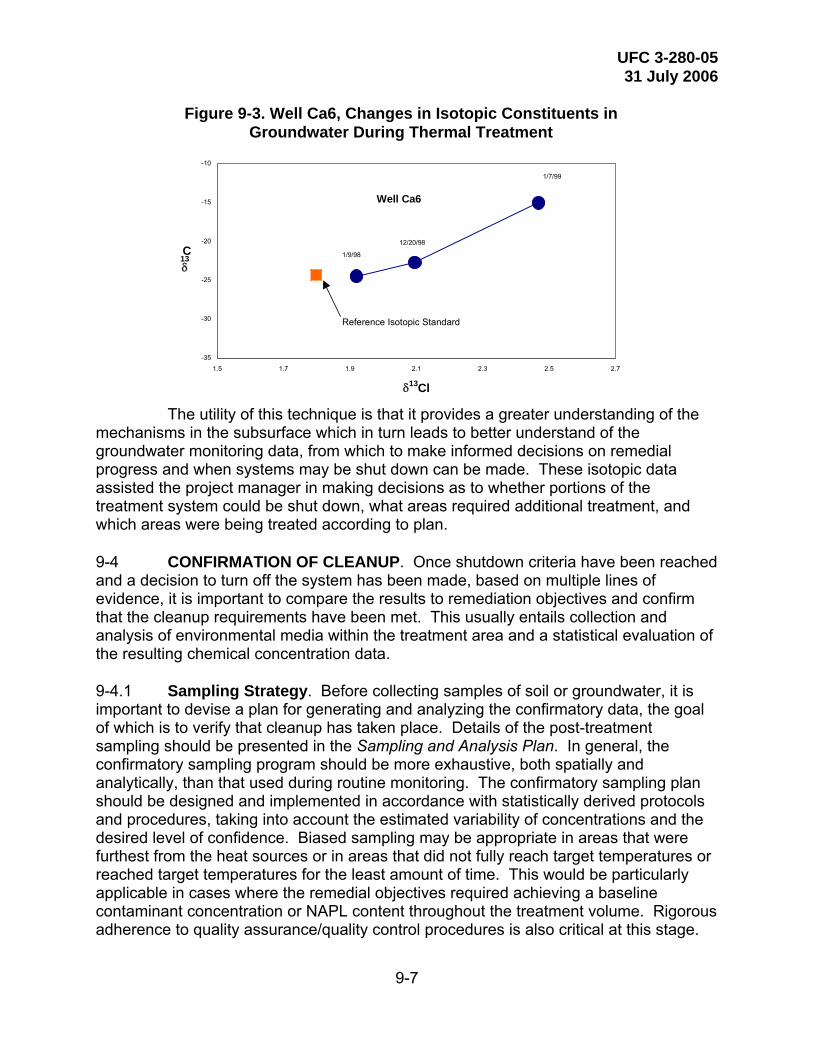
UFC 3-280-05 31 July 2006
9-7
Figure 9-3. Well Ca6, Changes in Isotopic Constituents in
Groundwater During Thermal Treatment
-35
-30
-25
-20
-15
-10
1.5 1.7 1.9 2.1 2.3 2.5 2.7 δ13Cl
δ 13 C
Well Ca6
1/9/98
12/20/98
1/7/99
Reference Isotopic Standard
The utility of this technique is that it provides a greater understanding of the mechanisms in the subsurface which in turn leads to better understand of the groundwater monitoring data, from which to make informed decisions on remedial progress and when systems may be shut down can be made. These isotopic data assisted the project manager in making decisions as to whether portions of the treatment system could be shut down, what areas required additional treatment, and which areas were being treated according to plan. 9-4 CONFIRMATION OF CLEANUP. Once shutdown criteria have been reached and a decision to turn off the system has been made, based on multiple lines of evidence, it is important to compare the results to remediation objectives and confirm that the cleanup requirements have been met. This usually entails collection and analysis of environmental media within the treatment area and a statistical evaluation of the resulting chemical concentration data. 9-4.1 Sampling Strategy. Before collecting samples of soil or groundwater, it is important to devise a plan for generating and analyzing the confirmatory data, the goal of which is to verify that cleanup has taken place. Details of the post-treatment sampling should be presented in the Sampling and Analysis Plan. In general, the confirmatory sampling program should be more exhaustive, both spatially and analytically, than that used during routine monitoring. The confirmatory sampling plan should be designed and implemented in accordance with statistically derived protocols and procedures, taking into account the estimated variability of concentrations and the desired level of confidence. Biased sampling may be appropriate in areas that were furthest from the heat sources or in areas that did not fully reach target temperatures or reached target temperatures for the least amount of time. This would be particularly applicable in cases where the remedial objectives required achieving a baseline contaminant concentration or NAPL content throughout the treatment volume. Rigorous adherence to quality assurance/quality control procedures is also critical at this stage.

UFC 3-280-05 31 July 2006
9-8
The sample collection approach specified in the plan will also depend on the media-specific remediation objectives. If the RAO was to meet numeric cleanup criteria for soil, then a soil sampling program must be designed and implemented to demonstrate cleanup. If the RAO was to reduce the plume load, then measurements of groundwater concentrations at points along a transect or some other method of measuring mass release rate must be incorporated into the sampling design. When verifying groundwater cleanup, sampling should be spaced temporally over at least two sampling rounds to check for rebound effects following cessation of heating. For example, at the Pinellas STAR Center in Largo, FL, the work plan called for sampling groundwater from select wells every 2 weeks during the operational phase. After shutdown, three more rounds of sampling were to be conducted after remediation was completed (at 4 weeks, 12 weeks, and 24 weeks). 9-4.2 Sampling Hot Media. One of the problems encountered when attempting to confirm cleanup at ISTR projects is collecting samples of groundwater or soil that have not yet cooled to ambient temperatures. Characterizing soil and groundwater contaminated with volatile organic compounds (VOCs) is challenging because of the difficulties associated with minimizing VOC loss at ambient temperatures. At elevated temperatures, this problem is exacerbated as heat enhances volatilization and the potential for VOC loss increases. Sampling hot media also presents a safety hazard and extreme care should be taken to avoid burns from the unexpected formation and release of steam (steam flashing). The ISTR treatment needs to be shut down in advance of sampling to allow pressures in the subsurface to dissipate. Temperature monitoring as part of the remediation system operations will indicate when sampling may be done. Extreme caution should still be exercised, especially when sampling wells screened below the water table. At an ERH project in Portland, OR, a sampling technician was seriously burned when he tried to collect a groundwater sample with a bailer and steam flashed out of the well onto his neck and face. The process of collecting and handling samples of hot media can be avoided by delaying the sampling effort until the subsurface cools to near ambient temperatures. However, this may not be possible, as it may require waiting up to 12 months for the subsurface to cool before verifying cleanup. At the DUS/HPO demonstration project conducted at the Savannah River Site in Aiken, SC, steam injection ceased in September 2001, however, more than 11 months of cooling were required before confirmation sampling could be done using conventional methods. 9-4.2.1 Collecting Soil Samples. A simple method of minimizing VOC losses during soil sampling was developed and tested at Launch Complex 34, Cape Canaveral Air Station, FL, during confirmatory drill-back sampling at the ERH demonstration site.* The method involved the collection of soil cores in metal or acetate sleeves and placement of the sleeves in an ice bath, after capping both ends, to cool the heated
* Gaberell, M., A., Gavaskar, E. Drescher, J. Sminchak, L. Cummings, W.S. Yoon, and S. De Silva. “Soil Core Characterization Strategy at DNAPL Sites Subjected Strong Thermal or Chemical Remediation.” Proceedings of the Third International Conference on Remediation of Chlorinated and Recalcitrant Compounds, Monterey, CA, May 2002.

UFC 3-280-05 31 July 2006
9-9
cores to ambient temperatures. The temperature of each core was monitored using a thermometer; once they reached ambient groundwater temperature (around 20°C), small aliquots of soil from each core sample were transferred to jars containing methanol (EPA Method 5030). 9-4.2.2 Collecting Groundwater Samples. Sampling groundwater while it is still hot can be dangerous, but can provide another way of monitoring progress. Care must be taken to avoid getting burned by flashing vapors emanating from monitoring wells. Groundwater samples should be obtained in a manner consistent with the discussion in Paragraphs 8-1.4.1 and 10-2, and not be collected from subsurface zones that are not vented to prevent steam from building up and being released when a well cap is removed. Technicians should wear protective clothing and goggles whenever working in areas undergoing ISTR. To avoid contact with hot liquids, and to minimize the loss of volatile contaminants from the water samples, samples should be collected using low flow sampling methods. Permanent, dedicated tubing, accessible without opening the well cap, should be installed in each well and run through an ice bath before collecting the sample.
UFC 3-280-05 31 July 2006
10-1
CHAPTER 10
OTHER ISSUES 10-1 PATENT ISSUES. ISTR techniques are covered under a variety of patents, with subsequent patented improvements to the initial intellectual property. Presented below is a listing of patents for the various ISTR technologies. Included in the listing are abstracts providing a brief description of the patent. This list is not considered exhaus-tive, but is presented to provide the project manager with background to select qualified vendors with valid licenses to perform the work. 10-1.1 Conductive Heating. Shell Oil Company developed the ISTD TCH process in the late 1980s and early 1990s. In January 2001, the rights to the 21 U.S. patents protecting the process and related processes, plus patents pending, were transferred to the University of Texas (UT). UT then granted TerraTherm, Inc., the exclusive license to commercialize the ISTD technology. The following lists the applicable U.S. patents. 10-1.1.1 4,984,594; 5,114,497; 5,209,604; 5,244,310; 5,553,189. These outline different methods for soil remediation that utilize a surface heater topped by insulation and an impermeable barrier, with or without vertical metal extensions, the combination of which is often termed a “thermal blanket,” and/or by applying thermal energy via shallow vertical heaters. Vapors are then drawn from the subsurface to off-gas treatment equipment. 10-1.1.2 5,076,727. A method of using microwave/radio frequency heating within the subsurface while injection wells set outside the contaminated zone inject vapor that passes through the contaminated zone to extraction wells, which draw the vapor out of the subsurface. 10-1.1.3 5,169,263. A method of applying heat to the subsurface from a surface heater, with a vapor recovery system consisting of perforated pipes parallel to the surface, under reduced pressure. 10-1.1.4 5,190,405; 5,318,116. Heater/vacuum wells installed in patterns, extending vertically into the subsurface. Electrically powered heating elements within the wells heat the soil by thermal conduction. The method includes a number of possible variations that optimize remediation of the soil. 10-1.1.5 5,193,934. Perforated pipes buried below and parallel to the surface, with heated gases and airflow applied through the pipes, and vapors collected at the surface through openings in impermeable barrier. 10-1.1.6 5,221,827; 5,229,583; 5,233,164; 5,674,424. Outline various enhanced design features of the near-surface heater/vacuum system mentioned in previous patents.
UFC 3-280-05 31 July 2006
10-2
10-1.1.7 5,271,693. Extends the ISTD technology to contaminants that are in the satu-rated zone by drawing down the level of the water table to expose the contaminated soil and allow recovery of contaminated vapors. 10-1.1.8 5,656,239. Specifies the use of electrical resistivity heating via electrodes driven into the soil, accompanied by application of high vacuum, to accomplish remediation. 10-1.1.9 5,660,500. Uses one or more heated sheet metal sheet piling to apply heat to contaminated soil, with an accompanying vapor recovery system. 10-1.1.10 5,997,214; 6,102,622. Describes the ‘hot floor’ or ‘heated barrier’ method used to treat contaminated soil using well bores that penetrate into, and beneath, the contaminated zone. These well bores can be used to apply heat, withdraw vapor from the subsurface, or both. Heating of the non-contaminated layer beneath the contaminated layer to at least the boiling point of the contaminated liquids is carried out prior to heating the contaminated layer, so as to ensure that the vaporized contaminants move upward to the collection system rather than downward into the non-contaminated zone. Heat may be applied by any means. A wide range of contaminants can be remediated using this method. Treatment of pooled DNAPL may also be by means of horizontal well bores containing heating apparatus and vapor extraction conduits. 10-1.1.11 Selected Patents Pending 09/549,899, 09/836,477. A low cost method of applying heat to and remediating the subsurface through vertical or horizontal thermal wells, using a second-generation electrical heater design. This decreases the cost of the heaters by 10 times. 10-1.2 Steam Enhanced Extraction*
10-1.2.1 5,018,576 - Process for in situ Decontamination of Subsurface Soil and Groundwater. A method proving for in situ decontamination of contaminated subsurface area by injection of steam into injection wells and withdrawing liquids and vapors from extraction wells under sub-atmospheric pressure, whereby steam is passed through the contaminated area in an essentially horizontal direction. After a substantial portion of the contamination has been removed in this manner, the injection of steam is ceased, but the extraction at sub-atmospheric pressure is continued, to volatilize and remove the residual water and contaminants trapped in the pores of the soil. The steam injection may be periodically resumed to reheat the area and to replenish the water in the pores. Assignee: Regents of the University of California. 10-1.2.2 5,279,740 - Process for Simultaneous Steam Injection and Enhanced Biodegradation. A process for improved removal of contaminants, including oily wastes and other organic hydrocarbonaceous materials from groundwaters and areas adjacent to or in the vicinity of groundwater locations. The process includes the use of at least two injection wells and at least one extraction well. One of the injection wells is
* It should be noted also that major oil product companies hold patents on steam injection for enhanced oil production. Patents covering enhanced oil recovery do not necessarily apply to remediation
UFC 3-280-05 31 July 2006
10-3
used for introduction of steam into a subsurface saturated zone. The other of the injection wells is used for introduction, simultaneously with introduction of steam, of nutrients effective to enhance the growth of naturally occurring hydrocarbon degrading biota present in the subsurface area and/or of non-naturally occurring hydrocarbon degrading biota and nutrients effective to enhance the growth thereof. Upon application of a withdrawing force to the extraction well(s), at least a portion of the contaminants in the subsurface saturated zone is caused to be displaced toward the extraction well, in liquid or vaporized form or in combination thereof. These contaminants are then withdrawn through and removed from the contaminated area by the extraction well(s). Asignee: Lucent Technologies, Bell Laboratories, Morristown, NJ. 10-1.2.3 5,986,159 - Chemical Tailoring of Steam to Remediate Underground Mixed Waste Contaminants. A method to simultaneously remediate mixed-waste underground contamination, such as organic liquids, metals, and radionuclides, involving chemical tailoring of steam for underground injection. Gases or chemicals are injected into a high-pressure steam flow via one or more injection wells to contaminated soil located beyond a depth where excavation is possible. The injection of the steam with gases or chemicals mobilizes contaminants, such as metals and organics, as the steam pushes the waste through the ground toward an extraction well having sub-atmospheric pressure (vacuum). The steam and mobilized contaminants are drawn in a substantially horizontal direction to the extraction well and withdrawn to a treatment point above ground. The heat and boiling action of the front of the steam flow enhance the mobilizing effects of the chemical or gas additives. The method may also be utilized for immobilization of metals by using an additive in the steam, which causes precipitation of the metals into clusters large enough to limit their future migration, while removing organic contaminants. Assignee: Regents of the University of California. 10-1.3 Electrical Heating 10-1.3.1 5,330,291 - Heating of Solid Earthen Material, Measuring Moisture and Resistivity. This includes a method of treating solid earthen materials having volatile, semi-volatile, and non-volatile contaminants. Six electrodes are inserted into a region of earthen material to be treated in a substantially equilateral hexagonal arrangement. Six phases of voltages are applied to corresponding electrodes. The voltages are adjusted within a first range of voltages to create multiple current paths between pairs of the electrodes. The current paths are evenly distributed throughout the region defined by the electrodes and, therefore, uniformly heat the region. The region of earthen material is heated to a temperature sufficient to substantially remove volatile and semi-volatile contaminants through vaporization and by promoting microbial action. This temperature is less than a melting temperature of the earthen material. Assignee: Battelle Memorial Institute. 10-1.3.2 5,347,070 - Heating of Solid Earthen Material and a Method of Measuring Moisture Content and Resistivity of Solid Earthen Material. This includes a method of treating solid earthen material having volatile, semi-volatile, and non-volatile contaminants. Six electrodes are inserted into a region of earthen material to be treated in a substantially equilateral hexagonal arrangement. Six phases of voltages are
UFC 3-280-05 31 July 2006
10-4
applied to corresponding electrodes. The voltages are adjusted within a first range of voltages to create multiple current paths between pairs of the electrodes. The current paths are evenly distributed throughout the region defined by the electrodes and therefore uniformly heat the region. The region of earthen material is heated to a temperature sufficient to substantially remove volatile and semi-volatile contaminants. This temperature is less than a melting temperature of the earthen material. The voltages are then increased to a second range of voltages effective to create dry regions around the electrodes. The dry regions have a perimeter, which defines the boundary between the dry regions and the earthen material exterior to the dry regions. Corona discharge occurs at the boundaries of the dry regions. As voltages are increased further, the dry regions move radially outward from the electrodes through the entire region. The corona boundaries decompose the non-volatilized contaminants remaining in the region. The hexagonal arrangement of electrodes is also preferable for measuring resistivity and moisture content of the earthen material. The electric field created between the electrodes is readily discernable and therefore facilitates accurate measurements. Assignee: Battelle Memorial Institute. 10-1.3.3 5,545,803 - Heating of Solid Earthen Material, Measuring Moisture and Resistivity. This is a method of treating solid earthen material having volatile, semi-volatile, and non-volatile contaminants that utilizes electrical energy. A plurality of electrodes are inserted into a region of earthen material to be treated in a selected geometric pattern. Varying phase and voltages configurations are applied to corresponding electrodes to achieve heating, physical phase changes, and the placement of substances within the treatment region. Additionally, treatment mediums can be added to either treat the contamination within the soil or to restrict their mobility. Assignee: Battelle Memorial Institute. 10-1.4 Steam Injection and Electrical Heating 10-1.4.1 5,449,251 - Dynamic Underground Stripping: Steam and Electrical Heating for in situ Decontamination of Soils and Groundwater. A dynamic underground stripping process removes localized underground volatile organic compounds from heterogeneous soils and rock in a relatively short time. This method uses steam injection and electrical resistivity to heat the contaminated underground area to increase the vapor pressure of the contaminants, thus speeding the process of contaminant removal and making the removal more complete. The injected steam passes through the more permeable sediments, distilling the organic contaminants, which are pumped to the surface. Large electrical currents are also applied to the contaminated area, which heat the impermeable subsurface layers that the steam has not penetrated. The condensed and vaporized contaminants are withdrawn by liquid pumping and vacuum extraction. The steam injection and electrical heating steps are repeated as necessary. Geophysical imaging methods can be used to map the boundary between the hot, dry, contamination-free underground zone and the cool, damp surrounding areas to help monitor the dynamic stripping process. Assignee: Regents of the University of California.
UFC 3-280-05 31 July 2006
10-5
10-1.4.2 5,994,670 - Electrical Heating of soils Using High Efficiency Electrode Patterns and Power Phases. Power line-frequency electrical (joule) heating of soils uses a high efficiency electrode configuration and power phase arrangement. The electrode configuration consists of several heating or current injection electrodes around the periphery of a volume of soil to be heated, all electrodes being connected to one phase of a multi-phase or a single-phase power system, and a return or extraction electrode or electrodes located inside the volume to be heated being connected to the remaining phases of the multi-phase power system or to the neutral side of the single-phase power source. This electrode configuration and power phase arrangement can be utilized anywhere where power line frequency soil heating is applicable and thus has many potential uses including removal of volatile organic compounds, such as gasoline and trichloroethylene (TCE), from contaminated areas. Assignee: Regents of the University of California. 10-1.4.3 5,907,662 - Electrode Wells for Power Line-Frequency Electrical Heating of Soils. This is an electrode well for use in power line-frequency heating of soils for decontamination of soil. Heating of soils enables the removal of volatile organic compounds from soil when utilized in combination with vacuum extraction. A preferred embodiment of the electrode well utilizes a mild steel pipe as the current-carrying conductor to at least one stainless steel electrode surrounded by a conductive backfill material, preferably graphite or steel shot. A covering is also provided for electrically insulating the current-carrying pipe. One of the electrode wells is utilized with an extraction well, which is under sub-atmospheric pressure to withdraw the volatile material, such as gasoline and trichloroethylene (TCE), as it is heated. Assignee: Regents of the University of California. 10-2 SAFETY 10-2.1 Thermal Conductive Heating. Two specific areas of potential concern are exposures to high voltages and temperatures. These are addressed separately in the following paragraphs. Electrical work is performed in accordance with the National Electrical Code.* Electrical wiring, including connection to the high voltage (primary) power supply, wiring from the high voltage supply to the transformer, and from the transformer to the electrical distribution panels, connecting power wiring to the off-gas treatment equipment, and wiring of the heaters is performed by a licensed electrician. To protect against worker injury in the event of an electrical fault with the heater elements, the heater cans, well screens, and metallic process piping are bonded together with an appropriately sized copper conductor, which is connected to an earth ground (i.e., ground rod). In addition, metallic instrumentation ports installed within the soil (e.g., temperature and pressure monitoring ports) are bonded to an earth ground. The main transformer and electrical distribution gear are connected to an earth ground as required by the NEC. To minimize the potential for worker exposure to energized electrical sources, access to the electrical distribution panel and the heater element electrical junction boxes is restricted to authorized personnel only. Electrical
* NEC, NFPA 70
UFC 3-280-05 31 July 2006
10-6
components are equipped with appropriate warning labels (e.g., high voltage, etc.) as required by the NEC. Appropriate measures are taken to protect on-site workers from incidental contact with exposed hot surfaces. Exposed hot surfaces may include the process piping and certain components of the off-gas treatment equipment. Surfaces that are expected to exceed 60°C (140°F) are covered with insulation or otherwise protected with a guard where insulation is not practical. In addition, personnel working in areas where incidental contact with hot surfaces 60°C (140°F) may be possible, wear leather gloves. In some instances, exposure to hot material or components is unavoidable. Such circumstances may include, but are not limited to, collection of soil or groundwater samples during the ISTD heating process (if required), and replacement of ISTD heater elements (if required) during heating. In these instances, only trained personnel are allowed in the work area. Worker protective measures are selected in accordance with the potential heat exposure. At sites having buried ordnance or sealed vessels, that might generate explosive pressures when exposed to high temperatures, special precautions are needed to exclude personnel from the vicinity during heating. 10-2.2 Electrical Resistance Heating. Safety precautions for working in an area undergoing treatment using ERH are similar to that involving TCH. All applications of ERH follow OSHA requirements that surface voltages be less than 15 V. This makes it possible for workers to enter the area undergoing treatment without the need for special protection. Lock-out tag-out procedures are followed should there be any need to access or touch wells, electrodes, work with equipment, or perform any intrusive work. The surfaces are hot, but can be safely accessed using work boots and leather gloves. Because of the presence of cables and piping to the various electrodes and recovery wells, slip, trip, and fall hazards are of particular concern, which may result in burns or scalds if unprotected parts of the body come in contact with hot surfaces. Subsurface intrusive activity can be safely performed during ERH treatment. Procedures followed involve coordinating with the technology vendor for shutting down the power 24 hours in advance of the intrusive activity. Electrical current quickly dissipates, but time should be allotted to dissipate pressures that may have built up in the soil as a result of heating. Vapor recovery operations are typically maintained to promote dissipation of pressures in the soil. Vendor lock-out tag-out procedures are followed to ensure no startup of operations occurs during intrusive activities. Soil sampling equipment and soil cores are handled using leather gloves. 10-2.3 Steam Enhanced Extraction. Safety concerns in working in and around areas being treated using SEE methods are similar to TCH and ERH. The major difference is steam is being distributed to wells rather than electricity being distributed to heater wells or electrodes. The steam distribution piping represents additional hot surfaces that are under pressure, which in turn provides greater opportunity for burns and scalds to workers in the area. Further, steam injection typically involves the use of steam traps in the distribution lines, and blow down points on the generators and piping to ensure distribution of high quality steam to the subsurface. This requires workers to interact more with the equipment than is typically required for either TCH or ERH
UFC 3-280-05 31 July 2006
10-7
operations. Site workers need to follow local boiler code requirements, which may require 24-hour oversight of activity. All piping should be labeled. Steam piping is typically insulated and jacketed. 10-3 COMMUNITY ACCEPTANCE AND EDUCATION. Implementation of ISTR at a site raises specific community concerns that are important to address as part of community outreach efforts. 10-3.1 Specific concerns commonly expressed by local communities in relation to ISTR are:
• Noise during construction and operation. • Odor during construction and operation. • Increased traffic in the vicinity of the site. • Dust during construction and operation. • Emissions from treatment units. • Concerns about dioxin creation. • Incomplete capture of contaminants. • Uncontrolled mobilization of NAPL into previously clean areas (i.e.,
“making it worse”) during thermal treatment. • Uncertainties associated with the definition of DNAPL areas for treatment. • On-site and off-site management of process wastes.
10-3.2 Under regulatory programs such as Superfund, a proposed plan or other decision document is typically released for public comment prior to selection of a thermal remedy. As a result, many community concerns related to implementation of the remedy may be known ahead of time. However, additional community outreach may be conducted during the design phase to address specific issues raised by the local community before the start of remedial action. Prevention and mitigation measures can then be targeted toward these concerns. 10-3.3 It is important to determine the most appropriate communication methods for the local community (e.g., if translation of ISTR technical information for non-English speaking residents is necessary). It is useful to prepare a community relations plan, or update an existing one, that outlines a communication strategy specifically applicable for thermal technologies. 10-3.4 Standard community outreach tools that can be used before and during the remedial action include community interviews, community meetings, workshops, and fact sheets. Updates to explain air monitoring results are especially important during ISTR implementation. 10-3.5 When appropriate, promptly distribute monitoring results to the community for ISTR applications. Site-specific websites are valuable in providing the community with timely updates and monitoring data.

UFC 3-280-05 31 July 2006
10-8
10-3.6 A useful EPA resource provides a brief explanation of how thermal treatment methods work and defines terms associated with the process.*
10-4 CONTRACTING. An ISTR can be acquired in a number of different ways. The appropriate means depends on the site conditions, nature of funding, goals and constraints, technical capabilities of the organization seeking the service, and the wishes of the facility at which the remediation is done. Site conditions and goals for remediation affect the number of applicable technologies, which in turn affects the strategy for seeking potential contractors (e.g., sole source selections vs. multiple proposers). The knowledge of site conditions greatly affects the approach and cost. Depth, volume, and required temperature drive ISTR costs. The nature of the funding, such as the amount of available funds at different points in the remediation, can result in a complete construction and operation contract or individual contracts for pieces of the remediation. The more technically capable the staff of the organization seeking the ISTR service, the more detailed or specific the contract can (though not necessarily has to) be. The needs of the facility at which the remediation is to occur may alter the schedule or sequence of the remediation to accommodate other industrial activities, property transfer, etc. Additional considerations are discussed below. 10-4.1 Planning for Contracting. Once it becomes clear that ISTR is at least a possibility, the planning for the acquisition of these services should begin. The project manager should include contracting specialists on the project delivery team (PDT). The PDT must develop an acquisition plan (as part of the project management plan that reflects the specifics of the project).† The technical staff for the project should participate in this planning to assure that the contracting approach accounts for the complexities inherent in the application of these innovative technologies and to help identify the realistic goals, schedules, and level of technical detail of the contracting package. A representative of the installation should also be a member of the PDT and the contract planning team to assure their needs are addressed and to assess impacts of funding availability. The planning should identify the appropriate contracting approach, schedule, potential bidder lists, identification of funding constraints (including necessary contingencies given funding uncertainties and potential cost growth), and need for sequencing of remediation or the use of pilot testing. 10-4.2 Contracting Approaches 10-4.2.1 Invitation for Bid vs. Request for Proposal and Performance: Specifications. There are many contracting tools available to obtain remediation services. The contract documents may include highly detailed plans and specifications geared to one specific technology or may be general, with detail only on the site conditions and goals. A detailed and specific package would be expected with an invitation for bid (IFB) contract approach and requires a technical staff with a high degree of familiarity with the engineering of ISTR. A more general performance specification contract would be issued as a request for proposal (RFP). The use of a performance specification allows the proposers to use their skills and creativity to
* USEPA. A Citizen’s Guide to In Situ Thermal Treatment Methods. EPA 542-F-01-012. May 2001. † US Army Corps of Engineers, Engineer Regulation, ER 5-1-11.
UFC 3-280-05 31 July 2006
10-9
develop an approach to reach the specific goals using their technology or a combination of technologies. Such a performance specification is more widely applicable for such innovative technologies such as ISTR, but requires a carefully developed statement of expected performance. Such a statement would clearly indicate the required depth, volume, temperature, duration, and residual concentrations, with clear means to measure and verify achievement of these requirements. If performance-based contracting for such innovative services fails, it is often because of the unclear requirements and a lack of quantifiable performance metrics. 10-4.2.2 Contracting Tools. The services can be obtained through a pre-existing indefinite-delivery type (IDT) contract or can be advertised specifically for the site. If done through an existing IDT contract, the prime contract would access the specific ISTR vendor or vendors. Such an arrangement often speeds the process, though it adds the oversight costs from the prime contractor. If a site-specific contract is sought for the ISTR, the contracting team must determine if more than one ISTR technique may work. If only one technique would be appropriate, the number of potential vendors would have to be identified. If only one vendor is available, the contract could be sent to the sole source with adequate justification for the exclusive contract. Without adequate justification, a protest from other vendors may occur and may delay the entire project. The contracting approach should encourage competition to the extent possible. The contracts can be issued as firm-fixed-price, cost-plus award fee, fixed-price plus incentive fee, or other under other terms. The USACE does not typically use time and materials-type contracting. Fixed-price contracts would only be appropriate for extremely well defined problems, and are often plagued by contract claims for changed site conditions or other changes that alter the requirement or schedule. Cost-plus-award fee contracts may be best for sites that are subject to significant quantity uncertainties, as is typically the case for hazardous waste site remediation, but are subject to increases in necessary funding during remediation depending on the actual conditions encountered. The trade-off is often higher characterization costs vs. higher uncertainty in necessary funding. Fixed-price plus incentive fee may be an alternative where the site conditions are moderately well known. In this case, the contractor bids/proposes a fixed-price, but if the costs incurred end up being less (because of innovative work by the contractor or better than expected site conditions), the cost savings are shared between the contractor and the Government. In most cases, options for additional volumes, depths, or duration of heating can be included in the contract and can set a cost basis for any additional effort required by site conditions. Such options provide a great deal of flexibility in reducing cost uncertainty with imperfectly known site conditions. 10-4.2.3 Construction vs. Service Contracts. Given the fact that in many cases the costs for operations of ISTR exceed the costs for constructing the relatively fixed features of the remediation (e.g., piping, wells), the contract may be considered a service contract rather than a construction contract. The net result of issuing the contract as a service contract is that lower service labor rates can be used on Federal contracts. Federal construction contracts must use Davis-Bacon wage rates. Service contracts can only be used where the “preponderance” of the work is in the operations rather than construction of fixed or permanent features.
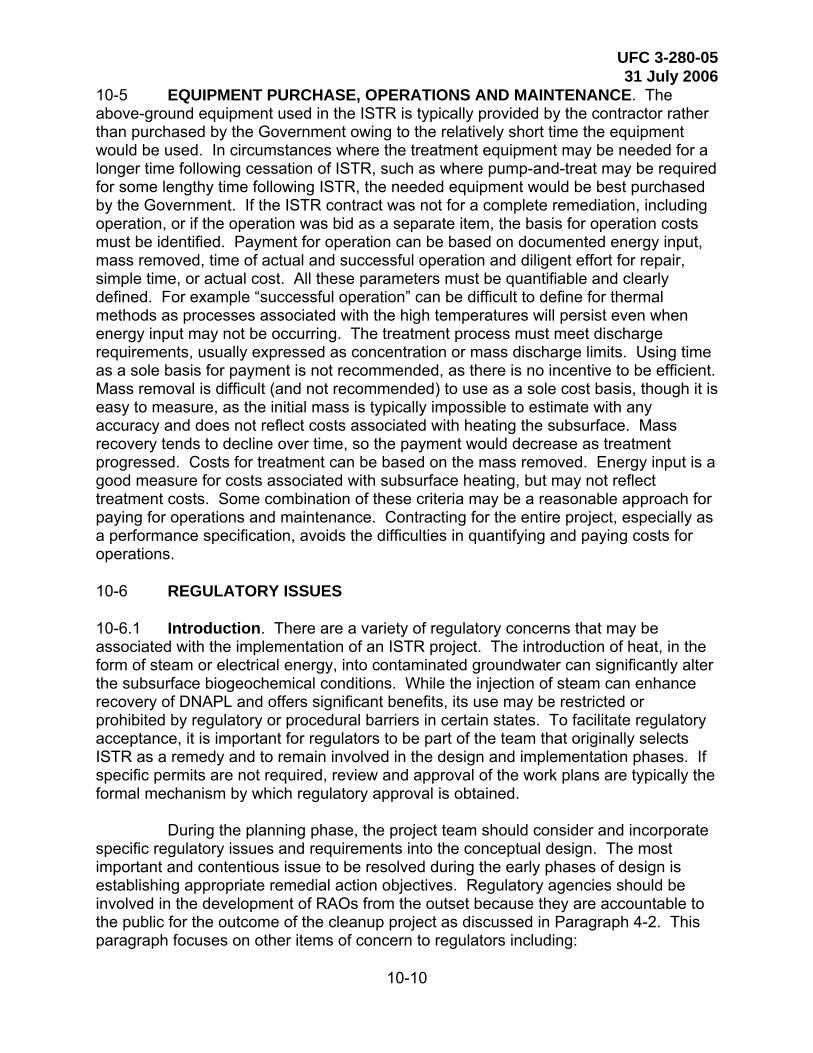
UFC 3-280-05 31 July 2006
10-10
10-5 EQUIPMENT PURCHASE, OPERATIONS AND MAINTENANCE. The above-ground equipment used in the ISTR is typically provided by the contractor rather than purchased by the Government owing to the relatively short time the equipment would be used. In circumstances where the treatment equipment may be needed for a longer time following cessation of ISTR, such as where pump-and-treat may be required for some lengthy time following ISTR, the needed equipment would be best purchased by the Government. If the ISTR contract was not for a complete remediation, including operation, or if the operation was bid as a separate item, the basis for operation costs must be identified. Payment for operation can be based on documented energy input, mass removed, time of actual and successful operation and diligent effort for repair, simple time, or actual cost. All these parameters must be quantifiable and clearly defined. For example “successful operation” can be difficult to define for thermal methods as processes associated with the high temperatures will persist even when energy input may not be occurring. The treatment process must meet discharge requirements, usually expressed as concentration or mass discharge limits. Using time as a sole basis for payment is not recommended, as there is no incentive to be efficient. Mass removal is difficult (and not recommended) to use as a sole cost basis, though it is easy to measure, as the initial mass is typically impossible to estimate with any accuracy and does not reflect costs associated with heating the subsurface. Mass recovery tends to decline over time, so the payment would decrease as treatment progressed. Costs for treatment can be based on the mass removed. Energy input is a good measure for costs associated with subsurface heating, but may not reflect treatment costs. Some combination of these criteria may be a reasonable approach for paying for operations and maintenance. Contracting for the entire project, especially as a performance specification, avoids the difficulties in quantifying and paying costs for operations. 10-6 REGULATORY ISSUES 10-6.1 Introduction. There are a variety of regulatory concerns that may be associated with the implementation of an ISTR project. The introduction of heat, in the form of steam or electrical energy, into contaminated groundwater can significantly alter the subsurface biogeochemical conditions. While the injection of steam can enhance recovery of DNAPL and offers significant benefits, its use may be restricted or prohibited by regulatory or procedural barriers in certain states. To facilitate regulatory acceptance, it is important for regulators to be part of the team that originally selects ISTR as a remedy and to remain involved in the design and implementation phases. If specific permits are not required, review and approval of the work plans are typically the formal mechanism by which regulatory approval is obtained. During the planning phase, the project team should consider and incorporate specific regulatory issues and requirements into the conceptual design. The most important and contentious issue to be resolved during the early phases of design is establishing appropriate remedial action objectives. Regulatory agencies should be involved in the development of RAOs from the outset because they are accountable to the public for the outcome of the cleanup project as discussed in Paragraph 4-2. This paragraph focuses on other items of concern to regulators including:

UFC 3-280-05 31 July 2006
10-11
• Permits needed for discharges to the environment. • Establishing air emissions limits. • Permits needed for treated water disposal. • Preventing uncontrolled migration of contaminated groundwater and
vapors. 10-6.2 Permitting of Discharges to the Environment. There are differences in regulatory requirements based on whether the site is regulated under state or Federal law, the regulatory program (e.g., RCRA or CERCLA), and the type of site (a Federal facility, a Superfund site, state lands, or private property). While permit requirements are not a direct barrier to the deployment of thermal treatment technologies, it is important that the technology user be aware of state-specific permits and requirements. For remedial projects involving discharges to the environment, the regulatory authority will likely specify limitations on the amount of contamination discharged to the air, water, or sewers. Permitting varies, as each project site is different. Under CERCLA, permit requirements are typically waived for remedial activities; however, the substantive technical requirements as specified by the regulatory authority for that action must be met. Likewise, permits may not be required for most sites under state oversight, although projects would still have to meet the substantive technical requirements of state regulations. For ISTR projects, contaminated waste streams and processes that would typically require some form of discharge limitation include air emissions, surface water discharges, sewer discharges, and discharges to groundwater for any subsurface injection or activity that raises groundwater contamination above standards or background concentrations (if higher than standards). Depending on the regulatory situation, a RCRA permit may be required for treatment operations that involve managing hazardous waste. 10-6.3 Underground Injection Control (UIC). For CERCLA sites, the remedial alternatives must satisfy applicable or relevant and appropriate requirements (ARARs). Non-CERCLA sites (RCRA sites, privates sites, state Superfund sites, Federal facilities, etc.) may also have potentially applicable regulations at the state and Federal level. In particular, Underground Injection Control (UIC) regulations may be applicable for both CERCLA and non-CERCLA sites. The UIC program, under the Federal Safe Drinking Water Act, regulates injec-tion wells. Under the UIC program, injection of any fluid into a well is prohibited, except as authorized by permit or rule. The purpose of the UIC program is to protect underground sources of drinking water by prohibiting injection that may affect water quality. State UIC programs may be delegated complete or partial enforcement responsibility (or primacy) by USEPA.* As of June 2001, USEPA had delegated primacy for all well classes to 33 states, Guam, the Commonwealth of the Marianas Islands, and Puerto Rico. Seven states share primacy with USEPA, which administers
* USEPA. State Policies Concerning the Use of Injectants for In-Situ Ground Water Remediation. Technology Innovation Office, EPA 542-R-96-001, 1996b.
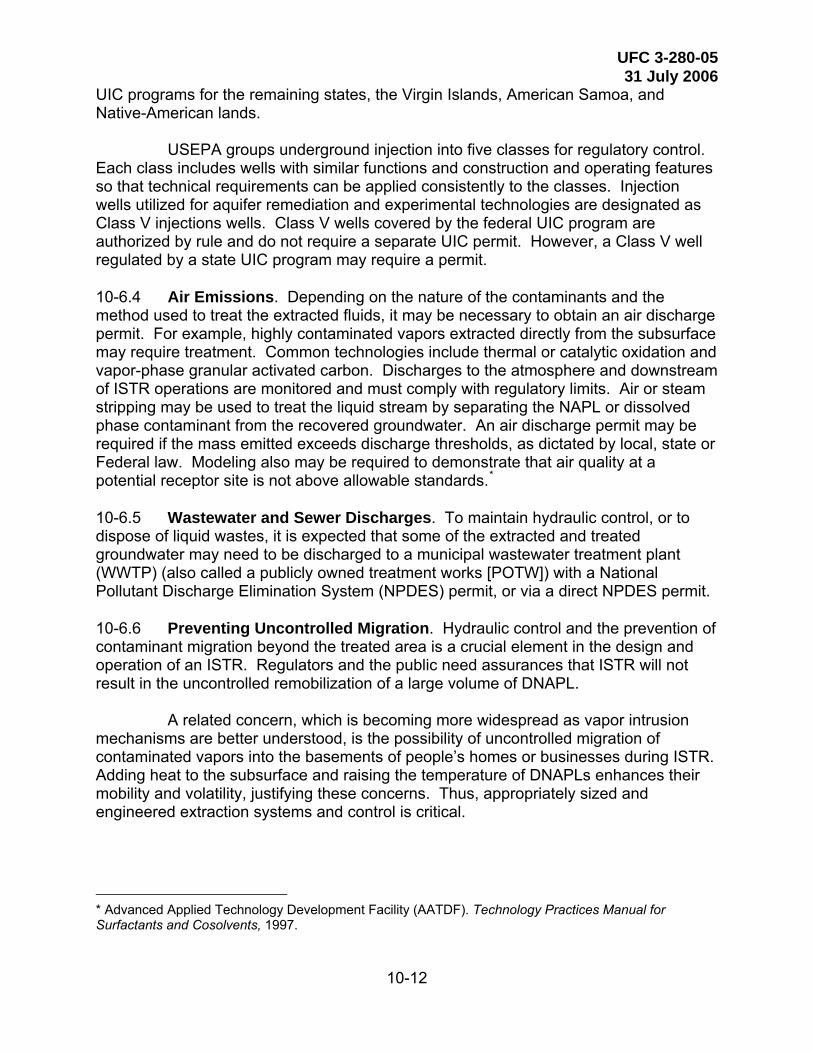
UFC 3-280-05 31 July 2006
10-12
UIC programs for the remaining states, the Virgin Islands, American Samoa, and Native-American lands. USEPA groups underground injection into five classes for regulatory control. Each class includes wells with similar functions and construction and operating features so that technical requirements can be applied consistently to the classes. Injection wells utilized for aquifer remediation and experimental technologies are designated as Class V injections wells. Class V wells covered by the federal UIC program are authorized by rule and do not require a separate UIC permit. However, a Class V well regulated by a state UIC program may require a permit. 10-6.4 Air Emissions. Depending on the nature of the contaminants and the method used to treat the extracted fluids, it may be necessary to obtain an air discharge permit. For example, highly contaminated vapors extracted directly from the subsurface may require treatment. Common technologies include thermal or catalytic oxidation and vapor-phase granular activated carbon. Discharges to the atmosphere and downstream of ISTR operations are monitored and must comply with regulatory limits. Air or steam stripping may be used to treat the liquid stream by separating the NAPL or dissolved phase contaminant from the recovered groundwater. An air discharge permit may be required if the mass emitted exceeds discharge thresholds, as dictated by local, state or Federal law. Modeling also may be required to demonstrate that air quality at a potential receptor site is not above allowable standards.*
10-6.5 Wastewater and Sewer Discharges. To maintain hydraulic control, or to dispose of liquid wastes, it is expected that some of the extracted and treated groundwater may need to be discharged to a municipal wastewater treatment plant (WWTP) (also called a publicly owned treatment works [POTW]) with a National Pollutant Discharge Elimination System (NPDES) permit, or via a direct NPDES permit. 10-6.6 Preventing Uncontrolled Migration. Hydraulic control and the prevention of contaminant migration beyond the treated area is a crucial element in the design and operation of an ISTR. Regulators and the public need assurances that ISTR will not result in the uncontrolled remobilization of a large volume of DNAPL. A related concern, which is becoming more widespread as vapor intrusion mechanisms are better understood, is the possibility of uncontrolled migration of contaminated vapors into the basements of people’s homes or businesses during ISTR. Adding heat to the subsurface and raising the temperature of DNAPLs enhances their mobility and volatility, justifying these concerns. Thus, appropriately sized and engineered extraction systems and control is critical.
* Advanced Applied Technology Development Facility (AATDF). Technology Practices Manual for Surfactants and Cosolvents, 1997.

UFC 3-280-05 31 July 2006
10-13
Groundwater and vapor concentrations must also be monitored down-gradient from the treatment zone to ensure that the ISTR system is not causing migration of contaminants out of the targeted treatment areas.
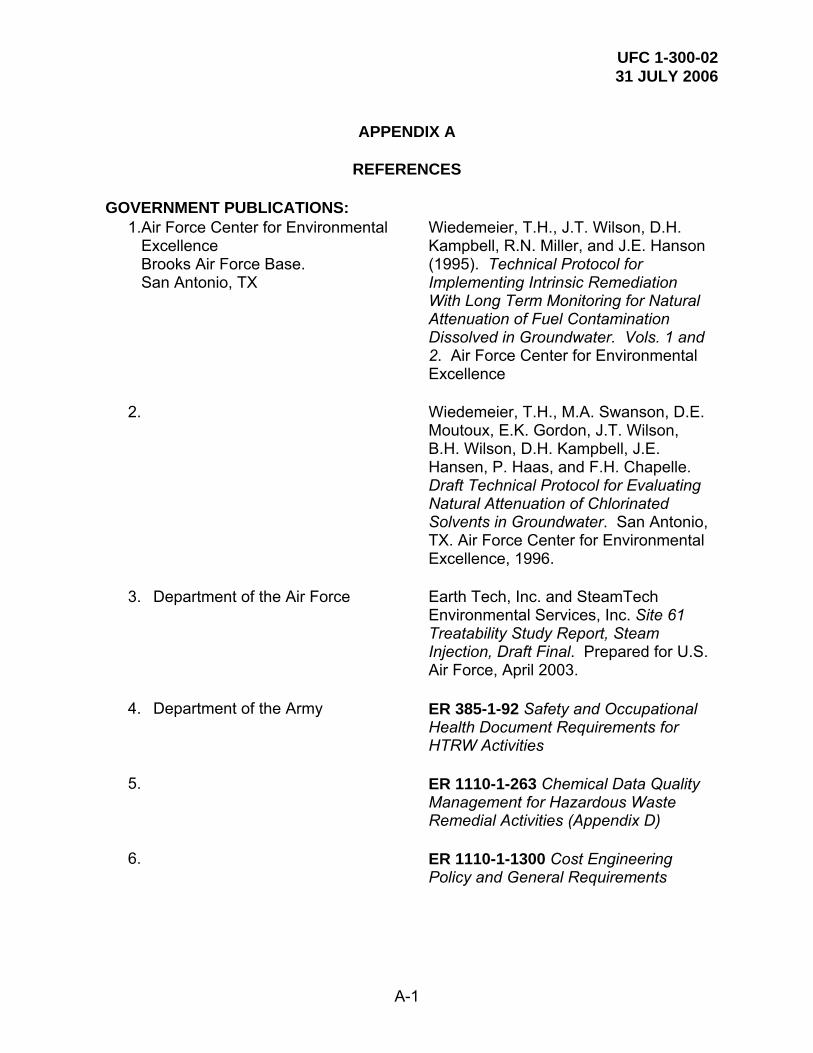
UFC 1-300-02 31 JULY 2006
A-1
APPENDIX A
REFERENCES
GOVERNMENT PUBLICATIONS:
1.Air Force Center for Environmental Excellence Brooks Air Force Base. San Antonio, TX
Wiedemeier, T.H., J.T. Wilson, D.H. Kampbell, R.N. Miller, and J.E. Hanson (1995). Technical Protocol for Implementing Intrinsic Remediation With Long Term Monitoring for Natural Attenuation of Fuel Contamination Dissolved in Groundwater. Vols. 1 and 2. Air Force Center for Environmental Excellence
2. Wiedemeier, T.H., M.A. Swanson, D.E. Moutoux, E.K. Gordon, J.T. Wilson, B.H. Wilson, D.H. Kampbell, J.E. Hansen, P. Haas, and F.H. Chapelle. Draft Technical Protocol for Evaluating Natural Attenuation of Chlorinated Solvents in Groundwater. San Antonio, TX. Air Force Center for Environmental Excellence, 1996.
3. Department of the Air Force Earth Tech, Inc. and SteamTech Environmental Services, Inc. Site 61 Treatability Study Report, Steam Injection, Draft Final. Prepared for U.S. Air Force, April 2003.
4. Department of the Army ER 385-1-92 Safety and Occupational Health Document Requirements for HTRW Activities
5. ER 1110-1-263 Chemical Data Quality Management for Hazardous Waste Remedial Activities (Appendix D)
6. ER 1110-1-1300 Cost Engineering Policy and General Requirements
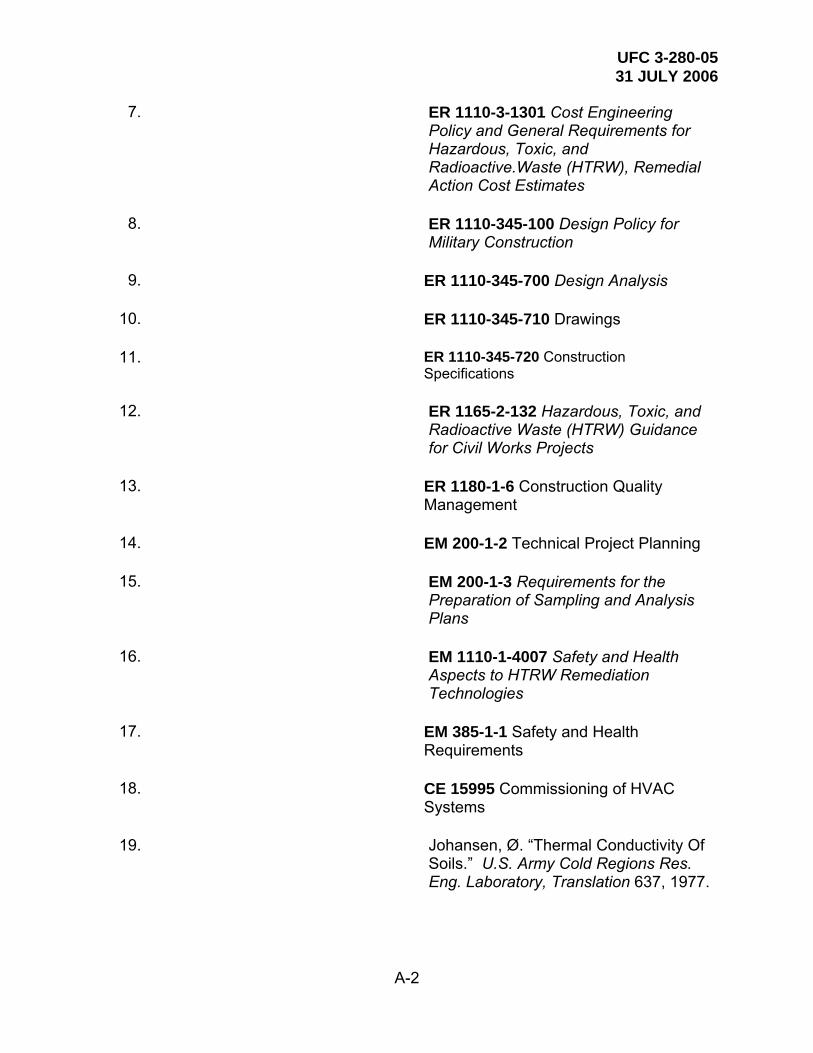
UFC 3-280-05 31 JULY 2006
A-2
7. ER 1110-3-1301 Cost Engineering Policy and General Requirements for Hazardous, Toxic, and Radioactive.Waste (HTRW), Remedial Action Cost Estimates
8. ER 1110-345-100 Design Policy for Military Construction
9. ER 1110-345-700 Design Analysis
10. ER 1110-345-710 Drawings
11. ER 1110-345-720 Construction Specifications
12. ER 1165-2-132 Hazardous, Toxic, and Radioactive Waste (HTRW) Guidance for Civil Works Projects
13. ER 1180-1-6 Construction Quality Management
14. EM 200-1-2 Technical Project Planning
15. EM 200-1-3 Requirements for the Preparation of Sampling and Analysis Plans
16. EM 1110-1-4007 Safety and Health Aspects to HTRW Remediation Technologies
17. EM 385-1-1 Safety and Health Requirements
18. CE 15995 Commissioning of HVAC Systems
19. Johansen, Ø. “Thermal Conductivity Of Soils.” U.S. Army Cold Regions Res. Eng. Laboratory, Translation 637, 1977.
UFC 3-280-05 31 JULY 2006
A-3
20. US. Army Corps of Engineers USACE. “Soil Vapor Extraction and Bioventing”. Engineer Manual November 30, 1995, updated June 2002.
21. USACE. “In Situ Air Sparging.” U.S. Army Corps of Engineers Engineer Manual EM 1110-1-4005. 1997.
22. USACE. 5-1-11 US Army Corps of Engineers Engineering Regulation 5-1-11.
23. Department of Energy U.S. Department of Energy. Hydrous Pyrolysis Oxidation/Dynamic Stripping: Subsurface Focus Area Report to Department of Energy, DOE/EM-0504, 2000.
24. U.S. Department of Energy. Guidance for Optimizing Ground Water Response Actions at Department of Energy Sites. Office of Environmental Management, 2002.
25. SteamTech Environmental Services. “Steam Stripping and Hydrous Pyrolysis Pilot Project for the Portsmouth Gaseous Diffusion Plant, Portsmouth, Ohio.” Final Report for DoE #DOE/OR/11-3032&D1. 1999.
26. Department of the Navy U.S. Department of the Navy. Technical Guidelines for Evaluation Monitored Natural Attenuation of Petroleum Hydrocarbons and Chlorinated Solvents in Ground Water at Naval and Marine Corps Facilities. Prepared by: T.H Wiedemeier and F.H. Chapelle for the Naval Facilities Engineering Command, 1998.
UFC 3-280-05 31 JULY 2006
A-4
27. Itamura, M.T. and K.S. Udell, “Pilot Demonstration of Steam Enhanced Extraction to Remediate Soils Containing JP-5 Jet Fuel“. NAS Lemoore Final Technical Report, Submitted to Department of NAVY, Port Hueneme, CA. 1995.
28. U. S. Environmental Protection Agency Washington DC 20460
Davis, E.L. How Heat Can Enhance In Situ Soil and Aquifer Remediation: Important Chemical Properties and Guidance On Choosing The Appropriate Technique. EPA/540/S-97/502. April 1997.
29. Davis, E.L. Steam Injection For Soil and Aquifer Remediation. EPA/540/S-97/505. January 1998.
30. Davis, E.L. Steam Injection Treatability Study, Wyckoff/Eagle Harbor Superfund Site. Robert S. Kerr Research Laboratory, Ada, OK. 2002.
31. Davis, E.L. Steam Injection Treatability Study, McCormick and Baxter Superfund Site, Stockton California. Robert S. Kerr Research Laboratory, Ada, OK. 2003.
32. Dev, H. “Radio Frequency Enhanced In Situ Decontamination of Soils Contaminated with Halogenated Hydrocarbons”. In Land Disposal, Remedial Action, Incineration and Treatment of Hazardous Waste. Proceedings of the Twelfth Annual Research Symposium, EPA/600/9-86/022, pp. 402-412. April 1986.

UFC 3-280-05 31 JULY 2006
A-5
33. USEPA. Conceptual Design, Soil and Groundwater Operable Units: Wyckoff/Eagle Harbor Superfund Site. Bainbridge Island, Washington. Report to EPA by U.S. Army Corps of Engineers.
34. USEPA. Focused Feasibility Study For Thermal Remediation Technologies For the Wyckoff Soil and Groundwater Operable Units: Wyckoff/ Eagle Harbor Superfund Site. Bainbridge Island, Washington. Report to EPA by CH2M Hill Inc.
35. USEPA. Toward A National Strategy for Noise Control. April 1977.
36. USEPA, Process Design Manual, 600/2/84/139,1984
37. USEPA. Test Methods for Evaluating Solid Waste, Physical/Chemical Methods. EPA/SW-846. 1986.
38. USEAPA. Data Quality Objectives for Remedial Response Activities. EPA/540/G-87/003. (NTIS No. PB88-131370). . 1987a
39. USEPA. Guide for Conducting Treatability Studies Under CERCLA, Soil Vapor Extraction. EPA/540/2-91/019A. 1991c
40. USEPA. A Technology Assessment of Soil Vapor Extraction and Air Sparging EPA/600/R—92/173. Risk Reduction Engineering Laboratory, Office of Research and Development, Cincinnati, OH. 63pp. 1992.

UFC 3-280-05 31 JULY 2006
A-6
41. USEPA. Presumptive Remedies, Site Characterization and Technology Selection for CERCLA Sites with VOCs in Soils. EPA/540/F-93/048. 1993d
42. USEPA. Guide to Documenting Cost and Performance for Remediation Projects, EPA-542-B95-002, Member Agencies of the Federal Remediation Technologies Roundtable, March 1995a. 55pp.
43. USEPA. Review of Mathematical Modeling for Evaluating Soil Vapor Extraction Systems. Publication No. EPA/540/R-95/513, 1995b.
44. USEPA. Guide to Documenting Cost and Performance for Remediation Projects. Member Agencies of the Federal Remediation Technologies Roundtable. EPA-542-B95-002. March 1995c.
45. USEPA. Presumptive Response Strategy and Ex-Situ Treatment Technologies For Contaminated Groundwater at CERCLA Sites. 1996.
46. USEPA. State Policies Concerning the Use of Injectants for In-Situ Ground Water Remediation. Technology Innovation Office, EPA 542-R-96-001, 1996b
47. USEPA. Analysis of Selected Enhancements for Soil Vapor Extraction. EPA/542/R-97/007, Sept. 1997.

UFC 3-280-05 31 JULY 2006
A-7
48. USEPA. Microbial Processes Affecting Monitored Natural Attenuation of Contaminants in the Subsurface. Office of Solid Waste and Emergency Response, National Risk Management Research Laboratory, Subsurface Protection and Remediation Division, Robert S. Kerr Environmental Research Center, Ada, Oklahoma. EPA/540/S-99/001, 1999a.
49. USEPA. Use of Monitored Natural Attenuation at Superfund, RCRA Corrective Action, and Underground Storage Tank Sites. NTIS PB97-963312, 1999b.
50. USEPA. Guide to Preparing Superfund Proposed Plans, Records of Decision and Other Remedy Selection Documents. EPA 540-R-98-031. July 1999c
51. USEPA, Cost and Performance Report, Six Phase™ Heating (SPH) at a Former Manufacturing Facility, Skokie Illinois. Office of Solid Waste and Emergency Response, Technical Innovation Office. October, 1999d.
52. USEPA. Comprehensive Report, Wyckoff NAPL Field Exploration, Soil and Groundwater Operable Units, Wyckoff/ Eagle Harbor Superfund Site, Bainbridge Island WA. Report to EPA by U.S. Army Corps of Engineers. 2000.
53. USEPA. A Citizen’s Guide to In Situ Thermal Treatment Methods. EPA 542-F-01-012. May 2001
UFC 3-280-05 31 JULY 2006
A-8
54. USEPA, 2001. Recommendations and Methods to Support Assessment of Soil Venting Performance and Closure, EPA/600/R-01/070. September 2001.
55. USEPA. Final Design Analysis, Thermal Remediation Pilot Study, PN C1871, Soil and Groundwater Operable Units, Wyckoff/ Eagle Harbor Superfund Site, Bainbridge Island WA: Report to EPA by U.S. Army Corps of Engineers. 2002a.
56. USEPA. A Discussion of the Thermal Remediation Treatments on Microbial Degradation Processes. Office of Solid Waste and Emergency Response, Technology Innovation Office, Washington DC. 2002b, www.clu-in.org.
57. North Atlantic Treaty Organization/ Committee on the Challenges of Modern society. NATO/CCMS Pilot Study, Evaluation of Demonstrated and Emerging Technologies for the Treatment of Contaminated Land and Groundwater (Phase III). EPA 542-R-02-002.
58. Remediation Technologies Screening Matrix Reference Guide, http://www.frtr.gov/matrix2/
59. Vinegar, H.J., E.P. deRouffignac, R.L. Rosen, G.L. Stegemeier, M.M. Bonn, D.M. Conley, S.H. Philips, J.M. Hirsch, F.G. Carl, J.R. Steed, D.H. Arrington, P.T. Brunnette, W.M. Mueller and T.E. Siedhoff. “In Situ Thermal Desorption (ISTD) of PCBs”. Proceedings of the HazWaste/World Superfund XVIII Conference, Washington, DC, December 2, 1997.
UFC 3-280-05 31 JULY 2006
A-9
60. Wiedemeier, T. H., M. A. Swanson, D. E. Moutoux, E. K. Gordon, J. T. Wilson, B. H. Wilson, D. H. Kampbell, P. E. Haas, R. N. Miller, J. E. Hansen, and F. G. Chapelle. Technical Protocol for Evaluating Natural Attenuation of Chlorinated Solvents in Groundwater. EPA/600/R—98/128. 1998.
61. Wilson, J.L., S.H. Conrad, W.R. Mason, W. Peplinski, and E. Hagan. “Laboratory Investigation of Residual Liquid Organics.” Spills, Leaks, and the Disposal of Hazardous Wastes in Groundwater, Report EPA/600/6-90/004. Robert S. Kerr Environmental Research Laboratory, Ada, OK 1990.
62. U.S. Government Printing Office Superintendent of Documents U.S. Government Printing Office Washington, DC 20402
29 CFR 1910.29
63. 29 CFR 1919.120 (b)
64. 29 CFR 1926.65 (b)
65. 40 CFR Part 60
66. U.S. Patent and Trademark Office USPTO Contact Center (UCC) Crystal Plaza 3, Room 2C02 P.O. Box 1450 Arlington, VA
Basile, A.J., G.J. Smith and J.W. Aiken. Ground Contamination Remediation Process. US Patent No. 5,279,740. 1994.
67. Udell, K.S., N. Sitar, J.R. Hunt, and L.D. Stewart. Process for In Situ Decontamination of Subsurface Soil and Groundwater. US Patent # 5,018,576. 1991.
NON-GOVERNMENT PUBLICATIONS: 1. Advanced Applied Technology
Development Facility (AATDF) Technology Practices, Manual for Suffactants and Cosolvents. 1997.

UFC 3-280-05 31 JULY 2006
A-10
2. Academic Press (now Elsevier) The Curtis Center 625 Walnut Street Philadelphia, PA 19106-3399
Anderson, M.P., and W.W. Woessner, Applied Groundwater Modeling. Academic Press. 1992.
3. Dullien, F.A.L. Porous Media, Fluid Transport and Pore Structure. Academic Press, 1992.
4. Air and Waste Management Association One Gateway Center 3rd Floor 420 Fort Duquesne Blvd. Pittsburgh, PA 15222-1435
Vinegar, H.J., G.L. Stegemeier, F.G. Carl, J.D. Stevenson, and R.J. Dudley. “In Situ Thermal Desorption of Soils Impacted with Chlorinated Solvents”. Proceedings of the Annual Meeting of the Air and Waste Management Association, Paper No. 99-450. 1999.
5. American Chemical Society 1155 16th Street, N.W. Washington, DC 20036
Weintraub, R.A. G.W. Jex, and H.A. Moye “Chemical and Microbial Degradation of 1, 2-Dibroethane (EDB) in Florida Ground Water, Soil, and Sludge”. American Chemical Society 0097-6156/86/0315-0294. 1986.
6. American Geophysical Society Grant, S.A. and J. Bachmann. “Effect Of Temperature On Capillary Pressure”. Environmental Mechanics, Water, Mass and Energy Transfer in the Biosphere. American Geophysical Society, Geophysical Monograph Series Volume 129, Washington, DC, 199-212. 2002.
7. American Geophysical Union 2000 Florida Avenue., N.W. Washington, DC 20009
Jacob, C. E. “On The Flow Of Water In An Elastic Artesian Aquifer” Transactions of The American Geophysical Union: Reports and Papers. 21, 574-589, 1940.
UFC 3-280-05 31 JULY 2006
A-11
8. Theis, C.V. “The Relationship Between The Lowering Of The Piezometric Surface and The Rate and Duration of Discharge of a Well Using Ground-Water Storage”. Transactions of the American Geophysical Union Sixteenth Annual Meeting, Part I, 519-524. 1935.
9. American Institute of Mining, Metallurgical, and Petroleum Engineers Transactions 8397 Shaffer Parkway Littleton, CO 80127-4012
Marx, J. W. and Langenheim, R. H. “Reservoir Heating by Hot Fluid Injection.” AIME Transactions, 216, 312-315. 1959.
10. American National Standards Institute1819 L Street, NW 6th Floor Washington, DC 20036
A58.1 Minimum Design Loads for Buildings and Other Structures
11. B31.1 Power Piping
12. B31-3
13. C80.1 Rigid Steel Conduit, Zinc Coated
14. C80.5 Rigid Aluminum Conduit
15. ISA-S5.1 Test Code for the Measurement of Sound from Pneumatic Equipment
16. MSS SP-58, -69, -89, -90 17. American Petroleum Institute
12200 L Street, NW Washington, DC 20006-4070
API-650 Field Erected Tanks
18. RP500A Recommended Practice for Classifications of Areas for Electrical Installations in Petroleum Refineries
19. RP500B Recommended Practice for Classifications of Areas for Electrical Installation at Drilling Rigs and Production Facilities on Land and on Fixed Marine Platforms
20. RP500C Electrical Installation at Petroleum and Gas Pipeline Transportation Facilities

UFC 3-280-05 31 JULY 2006
A-12
21. American Society for Testing and Materials 100 Barr Harbor Drive P.O. Box C700 West Conshohocken, PA 19428-2959
C150 Specifications for Portland Cement
22. Standard Guide for Remediation of Ground Water by Natural Attenuation at Petroleum Release Sites. 1997a
23. D6170 Standard Guide for Selecting a Groundwater Modeling Code. 1997b.
24. D422 Methods for Particle-Size Analysis of Soils
25. D698 Test Method for Laboratory Compaction Characteristics of Soils Using Standard Effort
26. D971-99a American Society for Testing and Materials. Standard Test Method for Interfacial Tension of Oil Against Water by the Ring Method.
27. D1219-93 American Society for Testing and Materials. Standards Methods for Density and Relative Density (Specific gravity) of Liquids by Bingham Pycnometer. 1998.
28. D1296-01 American Society for Testing and Materials. Standard Test Methods for Odor of Volatile solvents and Diluents.
29. D1586w Standard Method for Penetration Test and Split-Barrel Sampling of Soils
30. D1587 Thin-Walled Tube Sampling of Soils
31. D1785 Specifications for Poly Vinyl Chloride (PVC) Plastic Pipe, Schedules 40, 80, and 120
UFC 3-280-05 31 JULY 2006
A-13
32. D2216 Test Methods for Laboratory Determination of Water (Moisture) Content of Soil and Rock
33. D2241 Specifications for Poly Vinyl Chloride (PVC) Pressure Rated Pipe (SDR-Series)
34. D2321 Standard Practice for Underground Installation of Flexible Thermoplastic Sewer Pipe
35. D2325 Test Method for Capillary-Moisture Relationships for Coarse- and Medium-Textured Soils by Porous-Plate Apparatus
36. D2487 Classification of Soils for Engineering Purposes
37. D2488 Practice for Description and Identification of Soils (Visual Manual Procedure)
38. D2850 Test Method for Unconsolidated, Undrained Strength of Cohesive Soils in Triaxial Compression
39. D3350 Standard Specifications for Polyethylene Plastics Pipe and Fitting Materials
40. D3416 Standard Test Method for Total Hydrocarbons, Methane, and Carbon Monoxide in the Atmosphere (Gas Chromatographic Method)
41. D5092 Practice for Design and Installation of Ground Water Monitoring Wells in Aquifers
42. D5126 Guide for Comparison of Field Methods for Determining Hydraulic Conductivity in the Vadose Zone

UFC 3-280-05 31 JULY 2006
A-14
43. D6033 Standard Guide for Describing the Functionality of a Groundwater Modeling Code. 1996
44. F480 Thermoplastic Well Casing Pipe/ Couplings Made in Standard Dimension Ratios (SDR) Schedule 40/ 80, specifications
45. American Water Works Association 6666 W. Quincy Avenue Denver, CO 80235
A100 Water Wells
46. Annual Review of Heat Transfer Begell House, Inc. 145 Madison, Avenue New York, NY 10016
Udell, K.S. “Heat and Mass Transfer In Clean-Up of Underground Toxic Wastes”. Annual Review of Heat Transfer, 7, 333–405. 1996.
47. Applied Geochemistry
Elsevier The Curtis Center 625 Walnut Street Philadelphia, PA 19106-3399
Knaus, K.G., M.J. Dibley, R.N. Leif, D.A. Mew, and R.D. Aines. “Aqueous Oxidation Of Trichloroethylene: A Kinetic Analysis”. Appl. Geochem., 14, 531-541. 1999.
48. Knauss, K.G., M.J. Dibley, R.N. Leif, D.A. Mew, and R.D. Aines. “The Aqueous Solubility Of Trichloroethylene (TCE) and Tetrachloroethylene (PCE) As a Function Of Temperature.” Appl. Geochem., 15, 501-512. 2000.
49. Archives of Environmental Contaminant Toxicology Springer-Verlag 175 Fifth Avenue New York, NY 10010
Divincezon, J.P., and D.L. Sparks. “Sorption Of The Neutral and Charged Forms Of Pentachlorophenol On Soil, Evidence For Different Mechanisms.” Arch. Environ. Contam. Toxicol., 40, 445-450. 2001.
50. Battelle Memorial Institute 505 King Avenue Columbus, OH 43201-2693 USA
Rafai, H.R., Borden, J. Wilson, and C.H. Ward. “Intrinsic Bioattenuation for Subsurface Restoration.” pp 1-30 in Hinchee, R.E., J. Wilson, and D. Downey (eds.) Intrinsic Bioremediation, Battelle Memorial Institute, Columbus, Ohio. 1995.
UFC 3-280-05 31 JULY 2006
A-15
51. Adams, T.V. and G.J. Smith. “LNAPL/DNAPL Removal in Clay Till Using Steam-Enhanced Extraction.” Proceedings of the First International Conference on Remediation of Chlorinated and Recalcitrant Compounds. Monterey, CA. May 1998
52. Beyke, G., G. Smith, and V. Jurka. “DNAPL Remediation Closure with Six-Phase Heating”. Proceedings of the Second International Conference on Remediation of Chlorinated and Recalcitrant Compounds, Monterey, CA. May 2000
53. Gaberell, M., A., Gavaskar, E. Drescher, J. Sminchak, L. Cummings, W.S. Yoon, and S. De Silva. “Soil Core Characterization Strategy at DNAPL Sites Subjected Strong Thermal or Chemical Remediation.” Proceedings of the Third International Conference on Remediation of Chlorinated and Recalcitrant Compounds, Monterey, CA. May 2002.
54. Gerdes, K.S., S. Kaslusky, and K.S. Udell. “Containment of Downward Migration of DNAPLs During Steam Enhanced Extraction.” Proceedings of the First International Conference on Remediation of Chlorinated and Recalcitrant Compounds. Monterey, CA. 1998.
UFC 3-280-05 31 JULY 2006
A-16
55. Heron, G., T.H. Christensen, T. Heron, and T. Larsen. “Thermally Enhanced Remediation at DNAPL Sites: The Competition Between Downward Mobilization and Upward Volatilization.” Proceedings of the First International Conference on Remediation of Chlorinated and Recalcitrant Compounds, Monterey, CA, 193-198, 1998b.
56. Heron, G., D. LaBreque, and H. Sowers. “Steam Stripping/Hydrous Pyrolysis Oxidation for In-situ Remediation of a TCE DNAPL Spill.” Proceedings of the Second International Conference on Remediation of Chlorinated and Recalcitrant Compounds, Monterey, California. Volume C2-5, pp. 149-156. 2002.
57. Huesemann, M.H., T.S. Hausmann, T.J. Fortman and M.J. Truex. “Evidence of Thermophilic Biodegradation for PAHs and Diesel In Soil”. Proceedings of the Third International Conference on Remediation of Chlorinated and Recalcitrant Compounds, Monterey, CA. May 2002.
58. Jayaweera, I.S., M. Marti-Perez and J. Diaz-Ferrero. “Solubility of Polycyclic Aromatic Hydrocarbons Under Hydrothermal Conditions”. Proceedings of the Third International Conference on Remediation of Chlorinated and Recalcitrant Compounds, Monterey, CA. May, 2002.
UFC 3-280-05 31 JULY 2006
A-17
59. Rafai, H.R., Borden, J. Wilson, and C.H. Ward. “Intrinsic Bioattenuation for Subsurface Restoration.” pp 1-30 in Hinchee, R.E., J. Wilson, and D. Downey (eds.) Intrinsic Bioremediation, Battelle Memorial Institute, Columbus, Ohio, 1995.
60. Smith, G.J., T.V. Adams and V. Jurka. “Closing a DNAPL Site Through Source Removal and Natural Attenuation.” Proceedings of the First International Conference on Remediation of Chlorinated and Recalcitrant Compounds Monterey, CA. 1998.
61. Smith, G., D. Fleming, V. Jurka, and T. Adams. “Closure of a Trichloroethene and 1,1,1-Trichloroethane DNAPL Remediation Using Thermal Technologies.” Proceedings of the Second International Conference on Remediation of Chlorinated and Recalcitrant Compounds. Monterey, CA. May 22-25, 2000.
62. Sturchio, N.C., L. Heraty, B.D. Holt, L. Huang, T. Abrajano, and G. Smith. “Stable Isotope Diagnostics of Chlorinated Solvent Behavior in Contaminated Aquifers”. Proceedings of the Second International Conference on Remediation of Chlorinated and Recalcitrant Compounds, Monterey, CA. May 2000.
63. Benjamin/Cummings Publishing Co. Redwood City, CA
Atlas, R.M and R. Bartha. Microbial Ecology, Fundamentals and Applications, Third Edition. 1993.
64. Biodegradation Kluwer Academic Publishers Van Godewijckstraat 30 P.O.Box 17 3300 AA Dordrecht The Netherlands
Dolfing, J. and D.B. Janssen. “Estimates of Gibbs Free Energies Of Formation 0f Chlorinated Aliphatic Hydrocarbons.” Biodegradation, 5, 21-28, 1994.
UFC 3-280-05 31 JULY 2006
A-18
65. Blackwell Scientific Publishers Oxford, England
Majer, V., and V. Svoboda. Enthalpies of Vaporization of Organic Compounds. 1985.
66. Chapman and Hall 733 Third Avenue, New York, NY 10017
Andersland and Ladanyi. An Introduction To Frozen Ground Engineering. 1994
67. Chemosphere Elsevier The Curtis Center 625 Walnut Street Philadelphia, PA 19106-3399
Bontoen, L.T.C., T.C. Grotenhuis and W.H. Rulkens. “Enhancement of PAH biodegradation in soil by physiochemical pretreatment.” Chemosphere, 38:3627-3636. 1999.
68. Hulscher, E.M. and G. Cornelissen. “Effect of temperature on sorption equilibrium and sorption kinetics of organic micropollutants – a review.” Chemosphere, 32:609-626. 1996.
69. Uzgiris, E.E., W.A. Edelstein, H.R. Philipp, and I.E.T. lben. “Complex Thermal Desorption of PCBs from Soil.” Chemosphere, 30(2): 377-387. 1995.
70. CRC Press, 2000 Corporate Blvd., N.W. Boca Raton, FL 33431
Lide, D.R. CRC Handbook of Chemistry and Physics. 1999.
71. Stegemeier, G.L. and H.J. Vinegar. “Thermal Conduction Heating For In Situ Desorption of Soils.” Hazardous & Radioactive Waste Treatment Technologies Handbook. 2001.
72. Elsevier The Curtis Center 625 Walnut Street Philadelphia, PA 19106-3399
Majer, V., V. Svoboda, and J. Pick. Heats of Vaporization of Fluids. Elsevier, 1989.
73. Lupis, C.H.P. Chemical Thermodynamics of Materials. Elsevier, 1983.
UFC 3-280-05 31 JULY 2006
A-19
74. Environmental and Geological Geosciences
Ochs, S.O., R.A. Hodges, R.W. Falta, T.F. Kmetz, J.J. Supar, N.N. Brown, and D.L. Parkinson, “Predicted heating patterns during steam flooding of coastal plain sediments at the Savannah River Site.” Environmental & Geological Geoscience, Vol IX, No. 1, pp. 51-60. 2003.
75. Environmental Science and Technology American Chemical Society 1155 16th Street, N.W. Washington, DC 20036
Barbash, J.E. and M. Reinhard. “ Abiotic “Dehalogenation of 1,2-dichloroethane and 1,2-dibromoethane in Aqueous Solutions Containing Hydrogen Sulfide.” Environmental Science and Technology, Volume 23, 1989, pp 1349-1358, 1989.
76. Heron, G., T.H. Christensen, and C.G. Enfield. “Henry’s Law Constant for Trichloroethylene between 10 and 95oC. Environmental Science and Technology, 32 (10), 1433-1437, 1998a.
77. Imhoff, P.T., A. Frizzel, and C.T. Miller. “Evaluation of thermal effects on the dissolution of a nonaqueous phase liquid in porous media”. Environmental Science and Technology, 31(6), 1615-1622. 1997.
78. Jeffers, P.M., L.M. Ward, L.M. Woytowitch, and N.L. Wolfe “Homogeneous Hydrolysis Rate Constants for Selected Chlorinated Methanes, Ethanes, Ethenes, and Propanes.” Environmental Science Technology, Volume 23, No.8, pp 965-969, 1989.
UFC 3-280-05 31 JULY 2006
A-20
79. Piatt, J.J., D.A. Backus, P.D. Capel, and S.J. Eisenreich. “Temperature-Dependent Sorption of Naphthalene, Phenanthrene, and Pyrene to Low Organic Carbon Aquifer Sediments.“ Environ. Sci Technol., 30, 751-760, 1996.
80. Severtson, S.J. and S. Banerjee. “Sorption of Chlorophenols To Wood Pulp.” Environ. Sci Technol. 30, 1961-1969. 1996.
80. Freeman New York, NY
Atkins, P.W. Physical Chemistry, 4th ed. 1990.
81. Industrial Engineers Chemical Research
Cao, W., K. Knudsen, A. Fredenslund, and P. Rasmussen. “Group-Contribution Viscosity Predictions Of Liquid Mixtures Using UNIFAC-VLE Parameters”. Ind. Eng. Chem. Res., 32, 2088-2092, 1993.
82. Cao, W., K. Knudsen, A. Fredenslud, and P. Rasmussen. “Simultaneous Correlation Of Viscosity And Vapor-Liquid Equilibrium Data”. Ind. Eng. Chem. Res., 32, 2077-2087. 1993.
83. Institute of Electrical and Electronics Engineers (IEEE) 445 Hoes Lane, P.O. Box 1331 Piscataway, NJ 08855-1331
141 Recommended Practices for Electrical Power Distribution for Industrial Plants
84. 518 The Installation of Electrical Equipment to Minimize Electrical Noise Inputs to Controllers from External Sources
UFC 3-280-05 31 JULY 2006
A-21
85. Institute of Gas Technology/Gas Research Institute 1700 S. Mount Prospect Road Des Plaines, IL 60018
Hansen, K.S., D.M. Conley, H.J. Vinegar, J.M. Coles, J.L. Menotti, and G.L. Stegemeier. “In Situ Thermal Desorption of Coal Tar.” Proceedings of the Institute of Gas Technology/Gas Research Institute International Symposium on Environmental Biotechnologies and Site Remediation Technologies. Orlando, FL, December 7-9. 1998.
86. Integrated Water Resources Integrated Water Resources. Deployment of a Dynamic Underground Stripping-Hydrous Pyrolysis/Oxidation System at the Savannah River Site 321-M Solvent Storage Tank Area, Final Report. Prepared for Westinghouse Savannah River Company. September 2002.
87. Integrated Water Resources. Deployment of a Steam Injection/Extraction System at LC34, Cape Canaveral Air Station, as part of the Interagency DNAPL Consortium Demonstration, Final Report. Prepared for MSE-Technology Applications Inc. March 2003.
88. Interstate Technology Regulatory Cooperation
ITRC. Natural Attenuation of Chlorinated Solvents in Groundwater: Principles and Practices. 1999.
89. ITRC. Regulatory Overview: DNAPL Source Reduction: Facing the Challenge. April 2002.
90. John Wiley and Sons 111 River Street Hoboken, NJ 07030-5774
Cengel, Y. A., and Boles, M. A. Thermodynamics, An Engineering Approach. John Wiley and Sons, Inc. 1998.
91. Domenico, P.A., and F.W. Schwartz. Physical and Chemical Hydrogeology. John Wiley and Sons, Inc. 1997.
UFC 3-280-05 31 JULY 2006
A-22
92. Incopera, P. F., and D. P. DeWitt, Introduction To Heat Transfer. John Wiley and Sons, Inc. 1996.
93. Thiem, G. “Hydrologische Methoden.” Leipzig, Gebhardt, as presented in Davis S.N. and Dewiest, R.J.N. (1966) Hydrogeology. John Wiley & Sons, Inc. 1906.
94. Schwarzenbach, R., P.M. Gschwend, and D.M. Imboden. Environmental Organic Chemistry. John Wiley and Sons, Inc. 1993.
95. Journal of Chemistry and Physics Evans, R., U.M.B. Marconi, and P. Tarazona. “Fluids In Narrow Pores, Adsorption, Capillary Condensation and Critical Points.” J. Chem. Phys., 84, 2376-2399. 1986.
96. Journal of Contaminant Hydrology Elsevier The Curtis Center 625 Walnut Street Philadelphia, PA 19106-3399
Davis, E.L. “Effect of Temperature and Pore Size On The Hydraulic Properties and Flow Of A Hydrocarbon Oil In The Subsurface.” J. Contam. Hydrol., 16, 55-86. 1994.
97. Lenhard, R.J. and J.C. Parker. “Measurement and Prediction of Saturation-Pressure Relationships in Three Phase Porous Media Systems.” J. Contam. Hydrol., 1 407-424. 1987.
98. Kaslusky, S.F., and K.S. Udell, “A Theoretical Model of Air and Steam Co-Injection to Prevent the Downward Migration of DNAPLs During Steam-Enhanced Extraction.” J. Contaminant Hydrol., 55,213-232, 2002 .
UFC 3-280-05 31 JULY 2006
A-23
99. Schmidt, R., J. Gudbjerg. T.O. Sonnenborg, and K.H. Jensen. “Removal of NAPLs from The Unsaturated Zone Using Steam: Prevention of Downward Migration By Injecting Mixtures of Steam and Air.“ J. Contaminant Hydrol., 55, 233-260. 2002.
100. Journal of Environmental Engineering
American Society of Civil EngineeringPublications Marketing Department 1801 Alexander Bell Drive Reston, VA 20191-4400
Massman, J. W. “Applying Groundwater Flow Models in Vapor Extraction System Design. “ Journal of Environmental Engineering, 115, N. 1, 129-149. 1995.
101. Journal of Environmental Quality Soil Science Society of America Highwire Press Stanford University 1454 Page Mill Road, Palo Alta, CA 94304
Brücher, J., and L. Bergström. “Temperature Dependence of Linuron Sorption to Three Different Agricultural Soils.” J. Environ. Qual., 26, 1327-1335. 1996.
102. Journal of Physical Chemistry Reference Data American Institute of Physics Suite 1N01 2 Huntington Quadrangle Melville, NY 1747-4502
Horvath, A, F.W. Getzen, and Z. Maczynska. “Halogenated Ethanes and Ethenes With Water.” J. Phys. Chem. Ref. Data, 28, 395-627. 1999.
103. Sengers, J.V., and J.T.R. Watson. “Improved International Formulations for the Viscosity and Thermal Conductivity of Water Substance.” J. Phys. Chem. Ref. Data. 15, 1291. 1986.
104. Journal of Soil Contamination CRC Press, 2000 Corporate Blvd., N.W. Boca Raton, FL 33431
Hadim, AF, H. Shah, and G.P. Korfiatis. “Laboratory Studies of Steam Stripping
of LNAPL-Contaminated Soils.” J. Soil Contamination. 2(1):37-58. 1993.
UFC 3-280-05 31 JULY 2006
A-24
105. Kluwer Academic Publishers Van Godewijckstraat 30 P.O.Box 17 3300 AA Dordrecht The Netherlands
Wattiau, P. “Microbial Aspects in Bioremediation of Soils Polluted by Polyaromatic Hydrocarbons.” Biotechnology for the Environment, Strategy and Fundamentals, S.N. Agathos and W. Reineke, Editors, pp. 69-89. 2002.
106. Lawrence Livermore National Laboratory 7000 East Avenue Livermore, California 94550-9234
Demonstration of Dynamic Underground Stripping at the: LLNL Gasoline Spill Demonstration Site. Final Report no. UCRL-ID-116964, vol. 1-4. 1994.
107. Newmark, R.L. and R.D. Aines. Summary of the LLNL Gasoline Spill Demonstration—Dynamic Underground Stripping Project, UCRL-ID-120416. Berkeley Environmental Restoration Center. April 3, 1995.
108. Lewis Publishers CRC Press, 2000 Corporate Blvd., N.W. Boca Raton, FL 33431
Montgomery, J.H., and L.M. Welkom. Groundwater Chemicals Desk Reference. 1990.
109. MacMillan 175 Fifth Avenue New York, NY 10010
Bossert, I. And R. Bartha. “The Fate of Petroleum in Soil Ecosystems”. Petroleum Microbiology, R. Atlas, ed., pp. 435-473. 1984.
110. McGraw-Hill 122 Avenue of the Americas New York, NY 10020-1095
LaGrega, Buckingham, Evans, and The Environmental Resources Management Group. Hazardous Waste Management. McGraw-Hill, 1994.
111. Poling, B.E., J.M. Prausnitz, and J.P. O’Connell. The Properties of Gases and Liquids. McGraw-Hill, 2001.
112 Reid, R. C., Prausnitz, J. M., Poling, B. E. The Properties Of Liquids And Gases. New York NY: McGraw-Hill Inc., 1987.

UFC 3-280-05 31 JULY 2006
A-25
113. National Academies Press 500 Fifth Street, NW Washington, DC, 20055.
Committee on Intrinsic Remediation. Natural Attenuation for Groundwater Remediation.
114. National Fire Protection Association (NFPA) 1 Battermarch Park Quincy, MA 02169-7471
30 Flammable and Combustible Liquids Code
115. 70 National Electrical Code
116. 496 Purged and Pressurized Enclosures for Electrical Equipment in Hazardous Locations
117. 497 Class I Hazardous Locations for Electrical Installations in Chemical Plants
118. National Sanitary Foundation (NSF) 789 Dixboro Road P.O. Box 130140 Ann Arbor, MI 48913-0140
Standard 14 Plastics, Piping Components and Related Materials
119. Oxford University Press 198 Madison Avenue New York, NY 10016
Carslaw, H. S. and Jaeger, C. H. Conduction Of Heat In Solids. Oxford University Press, 1959.
120. Personal Communication Vinegar and Stegemeier, Personal Communication, 1999.
121. Adams, T.V., Personal communication on post-treatment monitoring after active remediation at the Skokie, IL site. 2000.
122. Beyke, G. personal communication on observations on ERH applications at Waukegan and Skokie Illinois. 2002.
123. Craig Eaker, Personal communication. Southern California Edison, full-scale steam enhanced extraction at Visalia Pole Yard, California. 2000.
UFC 3-280-05 31 JULY 2006
A-26
124. Heron, G. Personal Communication on range of spacing for steam injection wells. 2002.
125. Heron, G. Personal communication. 2003.
126. Mary K. LeProwse, personal communication. Observations during pilot-scale steam remediation at Wyckott-Eagle Harbor, Bainbridge Island, Washington.
127. Peyton, B.M. Assistant Professor, Chemical Engineering, Washington State University, Pullman, Washington. Personal communication. , 2003.
128. Smith, G.J. Former project manager for the Skokie Illinois Site remediation. Personal communication, 2003.
129. Vinegar and Stegemeier, Personal Communication, 1999.
130. Physics of Plant Environment Amsterdam, North Holland
De Vries, D.A. “Thermal Properties Of Soils.” W.R. van Wijk, Physics of Plant Environment. 1963.
131. Pochvovedenie International Academic Publishing Company
Faybishenko, B. “Effect of Temperature on Moisture Content, Entropy, and Water Pressure in Loam Soils.” Pochvovedenie, 12. 1983 [In Russian].
132. Proceedings of the Waste Management Symposium, Tucson AZ, March 1992
Aines, R., R. Newmark, W. McConachie, K. Udell, D. Rice, A. Ramirez, W. Siegel, M. Buettner, W. Daily, P. Krauter, E. Folsom, A. Boegel, and D. Bishop. “Dynamic Underground Stripping Project, UCRL-JC-109902”, Proceedings of the Waste Management Symposium, Tucson, AZ. March, 1992.
UFC 3-280-05 31 JULY 2006
A-27
133. Proceedings of 2nd International Conference on Oxidation and Reduction Technologies for Soil and Groundwater
Baker, R. S., and M. Kuhlman. “A Description of the Mechanisms of In-Situ Thermal Destruction (ISTD) Reactions”. Current Practices in Oxidation and Reduction Technologies for Soil and Groundwater: 2nd International Conference on Oxidation and Reduction and Technologies for Soil and Groundwater, Toronto Canada. Nov. 2002.
134. Proceedings of the First International TNO Conference on Contaminated Soil
Hilberts, B. “In-situ steam stripping”. In Proceedings of the First International TNO Conference on Contaminated Soil, pp.680-686, Assink and van den Brink, Mortin Nuhoff, Dordrecht, N.L., Eds. 1986.
135. Proceedings, Seventh World Petroleum Congress
Ramey Jr., H.J. “A Current Review of Oil Recovery By Steam Injection,” Proceedings, Seventh World Petroleum Congress. 3, 471-476, 1966.
136. Proceedings of the HazWaste/World Superfund XVIII Conference
Vinegar, H.J., E.P. deRouffignac, R.L. Rosen, G.L. Stegemeier, M.M. Bonn, D.M. Conley, S.H. Philips, J.M. Hirsch, F.G. Carl, J.R. Steed, D.H. Arrington, P.T. Brunnette, W.M. Mueller and T.E. Siedhoff. “In Situ Thermal Desorption (ISTD) of PCBs.” Proceedings of the HazWaste/World Superfund XVIII Conference, Washington, DC, December 2, 1997.
137. Prentice-Hall Englewood Cliffs, NJ 07632
Freeze and Cherry. Groundwater. Prentice Hall, 1979.
138. SAPC E245
139. E245a
140. E418
141. E1243
142. Z501 Design Guide
UFC 3-280-05 31 JULY 2006
A-28
143. Society of Petroleum Engineers
P.O. Box 833836 Richardson, TX 75083-3836
Pickell, J.J., B.F. Swanson, and W.B. Hickman. Soc. Pet. Eng. J. 6, 55, 1966.
144. Van Lookeren, J. Calculation Methods for “Linear and Radial Steam Flow in Oil Reservoirs”. Journal of the Society of Petroleum Engineers, pp 427-439. June 1983.
145. Stegemeier, G.L., and H.J. Vinegar. “Soil Remediation By Surface Heating And Vacuum Extraction.” Proceedings, 1995 SPE/EPA Exploration & Production Environmental Conference. Houston, Texas. March 27-29, 1995.
146. Stewart, L.D. and K.S. Udell. “Mechanisms of Residual Oil Displacement By Steam Injection.” SPE Res. Eng. 1233-1424: November 1988.
147. Wu, C.H. “A Critical review of Steam flood Mechanisms”. Society of Petroleum Engineers Paper SPE 6550. 1997.
148. Soil Science Society of America Bigger, J.W. and M.W. Cheung. “Adsorption of Picloram (4-amino-3, 4, 6-trichloropicolinic acid) on Panoche, Ephrata, and Palouse Soils, A Thermodynamic Approach to the Adsorption Mechanism”. Soil Sci. Soc. Am. Proc., 37, 863-868. 1973.
149. McCloskey, W. B., and D. E. Bayer. “Thermodynamics of Fluridone Adsorption and Desorption On Three California Soils.” Soil Sci. Soc. Am. J., 51, 650-612, 1987.
UFC 3-280-05 31 JULY 2006
A-29
150. Moreale, A., and R. van Bladel. “Soil Interactions Of Herbicide-Derived Aniline Residues, A Thermodynamic Approach. “ Soil Sci., 127, 1-9. 1979.
151. Van Genuchten, M. Th. “A Closed-Form Equation for Predicting the Hydraulic Conductivity of Unsaturated Soils.” Soil Sci. Soc. Am. J. 44, 892-898. 1980 .
152. Stanford University Stanford, CA 94305
Sageev, A., B.D. Gobran, W.E. Birgham, and H.J. Ramey, Jr. “The Effect of Temperature on Absolute Permeability to Distilled Water of Unconsolidated Sand Cores.” Proceedings, 6th Workshop on Geothermal Reservoir Engineering, SGP-TR-50, Stanford University, Stanford, California, 297-300. 1980.
153. Sanyal, S.K. The Effect of Temperature on Electrical Resistivity and Capillary Pressure Behavior of Porous Media, Ph.D. Diss. Stanford Univ. DA No. 32/12-B:7079. 1972 .
154. Sinnokrot, A.A. The Effect of Temperature on Oil-Water Capillary Pressure Curves of Limestones and Sandstones. Ph.D. dissertation, Stanford Univ. DA No. 30/12-B:5529, 1969.
155. Swedish Geotechnical Institute Olaus Magnus väg 355E-584 93 Linköping, Sweden
Sundberg, J. “Thermal Properties of Soils and Rocks.” Swedish Geotechnical Institute Report Number 35, Linköping: SGI. 1988.
156. Taylor and Francis 11 New Fetter Lane London, EC4P 4EE
Daubert, T.E. and R.P. Danner. Physical and Thermodynamic Properties Of Pure Chemicals: Data Compilation. Taylor and Francis, 1997.
UFC 3-280-05 31 JULY 2006
A-30
157. Technical Resources International, Inc. 6500 Rock Spring Drive, Suite 650 Bethesda, MD 20817
Baker, R.S., and, J.M. Bierschenk, “In Situ Thermal Destruction Makes Stringent Soil And Sediment Cleanup Goals Attainable.” Proceedings of the Fourth Tri-Service Environmental Technology Symposium. San Diego, CA. June 2001.
158. Baker, R.S., J.P. Galligan, H. McLaughlin, R. Semenak, M.P. Pologruto, and K.R. Weeks. “In-Situ Thermal Destruction Treatability Study of Explosives-Contaminated Soil from Massachusetts Military Reservation”. Proceedings of the Fourth Tri-Service Technology Symposium. San Diego, CA. June 2001
159. TerraTherm 356 Broad Street Fitchburg, MA 01420
TerraTherm and Weston. “Final RCRA Closure Plan, Basis for Design/Final Report.” TherraTherm Environmental Services, Inc., The Woodlands, TX and Roy F Weston Inc., Vernon Hills, IL. December 1997.
160. Thomas Telford 1 Heron Quay London E14 4JD
Betz, C., A. Farber, C.M. Green, H.P. Koschitzky, and R. Schmidt. Removing Volatile and Semivolatile Contaminants From The Unsaturated Zone By Injection of Steam/Air Mixture in Contaminated Soil. Thomas Telford, 1998.
161. Transactions of American Mineralogical and Metallurgical Engineers
Hubbert, M.K. “Darcy’s Law and The Field Equations Of The Flow Of Underground Fluids.” Trans. Am. Min. Met. Engrs. 207, 222-239. 1956.
162. Underwriters Laboratory (UL) 333 Pfingston Road Northbrook, IL 60062-2096
UL-58 Underground Tanks
163. UL-80 Oil Burner Fuel Tanks
164. UL-142 Shop Fabricated Aboveground Tanks
UFC 3-280-05 31 JULY 2006
A-31
165. Universitat Stuttgart Postfach 10 60 37 70049 Stuttgart, Germany:
Schmidt, R., C. Betz, and A. Farber. Behaviour During Steam Injection into the Unsaturated Zone. Institut Fur Wasserbau Universitat Stuttgurt, Pfaffenwaldring Stuttgart, Germany: LNAPL and DNAPL, 61, D-70569. 1998.
166. University of California
Udell, K.S. and R. McCarter, Treatablility Tests of Steam Enhanced Extraction for the Removal of Wood Treatment Chemicals from Visalia Pole Yard Soils. Final Report, Berkeley Environmental Restoration Center. February 19, 1996.
167. Udell, K.S., and L.D. Stewart, Jr. Field Study of In Situ Steam Injection and Vacuum Extraction for Recovery of Volatile Organic Solvents. Department of Mechanical Engineering. June, 1989.
168. Rice, D.W., B.P. Dooher, S.J. Cullen, L.G. Everett, W.E. Kastenberg, R.D. Grose, and M.A. Marino. Recommendations to Improve the Cleanup Process for California’s Leaking Underground Fuel Tanks. Submitted to the California State Water Resources Control Board Underground Storage Tank Program and the Senate Bill 1764 Leaking Underground Fuel Tank Advisory Committee. UCRL-AR-121762. 1994
169. Richardson, R. E. Final Report on Post-Steam Microbial Experiments Performed at U.C. Berkeley for the Wyckoff/Eagle Harbor Superfund Site. Submitted for publication, 2000.

UFC 3-280-05 31 JULY 2006
A-32
170. University of Minnesota Kersten, M.S. “Thermal Properties of Soils”. Bulletin of the University of Minnesota, Inst. Tech. Eng. Exp. Sta., 28. 1949.
171. Waterloo Press Waterloo, ON Canada
McWhorter, D.B., and B.H. Kueper. “Mechanics and Mathematics Of The Movement Of Dense Non-Aqueous Phase Liquids (DNAPLs) In Porous Media.” Dense Chlorinated Solvents and Other DNAPLs In Groundwater: History, Behavior, and Remediation. Portland, Oregon: Waterloo Press, 89-128. 1996.
172. Water Resources Research American Geophysical Union 2000 Florida Avenue. N.W. Washington, DC 20009
Falta, R.W., K. Pruess, I. Javandel, and P.W. Witherspoon. “Numerical Modeling of Steam Injection For The Removal of Nonaqueous Phase Liquids from the Subsurface.” Water Resour. Res., 28, 433–449. 1992.
173. Grant, S.A., and A. Salehzadeh. “Calculation of Temperature Effects on Wetting Coefficients of Porous Solids and their Capillary Pressure Functions.” Water Resour. Res. 32, 261–270. 1996.
174. Grant, S.A., “Extension of a temperature-effects model for capillary-pressure saturation relations.” Water Resources. Research 39, 1003. 2003.
175. Hunt, J.R., N. Sitar, and K.S. Udell. “Nonaqueous Phase Liquid Transport and Cleanup, Experimental Studies.” Water Resour. Res., 24(8): 1259-1267. 1988.
UFC 3-280-05 31 JULY 2006
A-33
176. Parker, J. C., R.J. Lenhard, and T. Kuppusamy, “A Parametric, Model for Constitutive Properties Governing Multiphase Flow in Porous Media.” Water Resources Research, v. 23, no. 4, pp 618-624. 1987.
177. She, H.Y. and B. Sleep. “The Effect of Temperature On Capillary Pressure-Saturation Relationships For Air-Water and Perchloroethylene-Water Systems.” Water Resour. Res., 34, 2587–2597: 1998.
178. World Petroleum Congress Fourth Floor, Suite 1 1 Duchess St. London, W1N 3DE
Ramey Jr., H.J. “A Current Review of Oil Recovery By Steam Injection,” Proceedings, Seventh World Petroleum Congress. 3, 471-476. 1966.
179. World Wide Web ETC8. Data obtained from world wide web, with the source identified as ETC8 (1993).

UFC 3-280-05 31 JULY 2006
B-1
APPENDIX B
CASE STUDIES Presented herein are case studies, organized by the ISTR technology applied at each location. Some applications are better documented than others due to a lack of available information at the time this Appendix was compiled. Dynamic underground stripping case studies are included with SEE case studies. Case studies for Skokie, Illinois are presented under both SEE and ERH, since both technologies were applied sequentially at this site. The case studies do not cover every application of ISTR, but are provided to illustrate the variety of applications that have been undertaken.
B-1. Thermal Conductive Heating
Project Name: Former Mare Island Naval Shipyard Bay Area Defense Conversion Action Team (BADCAT)
Location: Vallejo, CA
Contaminants: PCB – Aroclor 1254 and 1260 – maximum concentration of 2200 mg/kg
Regulatory Program: Navy Environmental Quality R&D Requirement
Remediation Scale: Demonstration Pilot Test
Site Owner: U.S. Navy
Consultant: Tetra Tech EM, Inc.
Project Duration: September – December 1997
Site Information: A 46.5 m2 (500 ft2) area adjacent to a former electric shop located within the Mare Island Naval Complex. Hydrogeology: Fill and clay units overlying a siltstone/fine-grained sandstone. The Remedial Investigation report suggested that groundwater fluctuated seasonally from 4.57 to 7.62 m (15 to 25 ft) below ground surface (bgs), well below the target treatment zone (i.e., the fill unit). Remediation Objectives: Demonstration of In Situ Thermal Desorption (ISTD) to remove and destroy PCBs from soils in situ. The cleanup goal was 2 ppm as prescribed by USEPA regulations at 40 CFR Part 761. Site-specific objectives were set by the Remediation Advisory Board (RAB) at less than 1.0 ppm. Target soil treatment temperatures were established of 316°C (600°F) at the centroids between the thermal wells (i.e., at the coldest regions). The particulate emissions rate could not exceed 2.83 grains/dry standard cubic meter (0.08 grains/dry standard cubic foot), corrected to 7% oxygen, using the procedure given in 40 CFR 264.343 (c). The HCl emissions could not exceed the greater quantity of 1.81 kg/hr (4.0 lb/hr).
UFC 3-280-05 31 JULY 2006
B-2
Approach: The Thermal Well demonstration was conducted using a network of 12 heater-vacuum wells drilled to a depth of 4.27 m (14 ft). The Thermal Blanket test was conducted using two adjacent 2.44 by 6.1 m (8 by 20 ft) heating units, and treated soils to a depth of 30.48 cm (12 in.) over a period of 7 days. Operation: Mobilization to the site in July 1997. Site construction was performed from July 1997 through September 1997. Thermal treatment was started in September 1997 and was completed in November 1997. Demobilization was completed by mid-December 1997. Results: After reaching an in-situ soil temperature of at least 316°C (600°F) over a treatment period of 37 days, all post-treatment soil samples collected exhibited non-detectable Total PCB concentrations (less than 0.033 mg/kg). Prior to de-energizing the heater elements, the average soil temperature at the centroid of each thermal well pattern and at the base of each thermal blanket treatment cell exceeded 316°C (600°F). The emission rate limit of 1.81 kg/hr (4.0 lb/hr) was not exceeded during the demonstrations. Cost: The total demonstration cost for design, permitting, operation, demobilization, and reporting was $912,500. Unit costs were not available. References: Conley, D.M., and K. Jenkins. 1998. “Application of ISTD to Remediate PCBs from Soil at the Former Mare Island Naval Shipyard, Vallejo, CA.” Presented at the 3rd Annual Tri-Service Conference, San Diego, CA., August 15-17, 1998. Naval Facilities Engineering Service Center. 1998. Tech Data Sheet: A Demonstration of In-Situ Thermal Desorption. TDS-2051-ENV, March 1998. Port Hueneme, CA. TerraTherm Environmental Services Inc. and RT Environmental Services, Inc. 1998. Final Report for Environmental Technology Partnership (ETP) Demonstrations IN-SITU THERMAL DESORPTION. Prepared for U.S. Navy and Bay Area Defense Conversion Action Team (BADCAT). October.
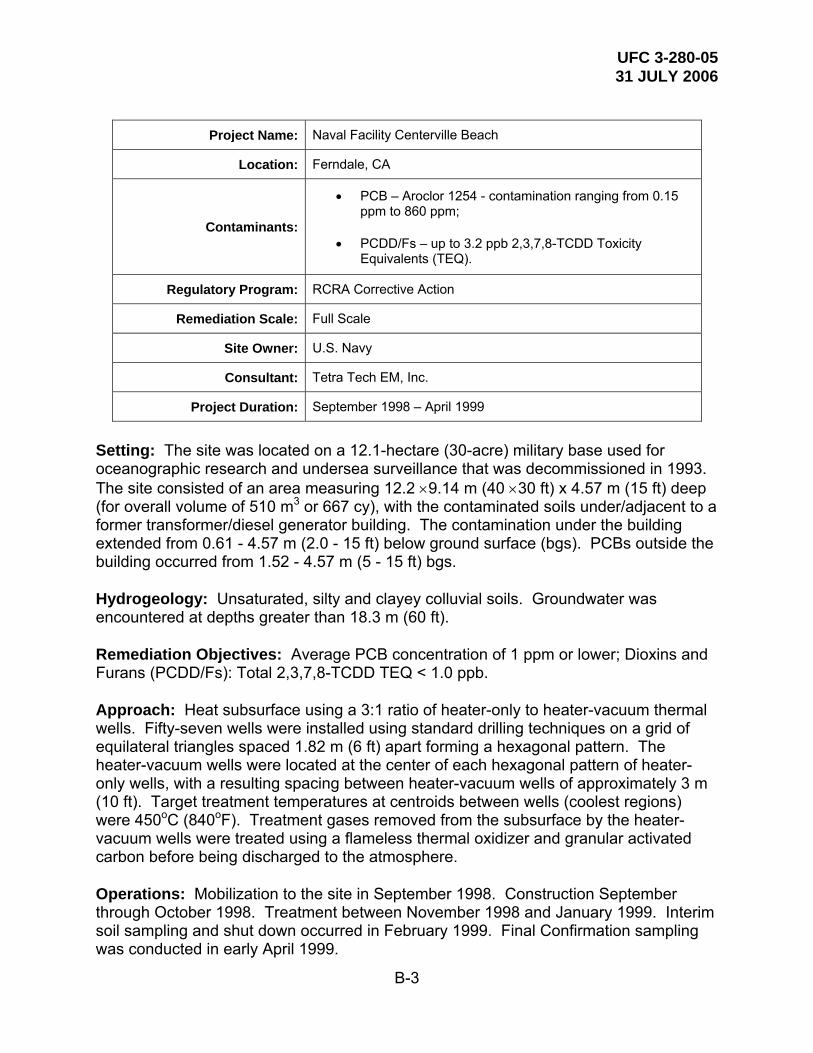
UFC 3-280-05 31 JULY 2006
B-3
Project Name: Naval Facility Centerville Beach
Location: Ferndale, CA
Contaminants:
• PCB – Aroclor 1254 - contamination ranging from 0.15 ppm to 860 ppm;
• PCDD/Fs – up to 3.2 ppb 2,3,7,8-TCDD Toxicity Equivalents (TEQ).
Regulatory Program: RCRA Corrective Action
Remediation Scale: Full Scale
Site Owner: U.S. Navy
Consultant: Tetra Tech EM, Inc.
Project Duration: September 1998 – April 1999
Setting: The site was located on a 12.1-hectare (30-acre) military base used for oceanographic research and undersea surveillance that was decommissioned in 1993. The site consisted of an area measuring 12.2 ×9.14 m (40 ×30 ft) x 4.57 m (15 ft) deep (for overall volume of 510 m3 or 667 cy), with the contaminated soils under/adjacent to a former transformer/diesel generator building. The contamination under the building extended from 0.61 - 4.57 m (2.0 - 15 ft) below ground surface (bgs). PCBs outside the building occurred from 1.52 - 4.57 m (5 - 15 ft) bgs. Hydrogeology: Unsaturated, silty and clayey colluvial soils. Groundwater was encountered at depths greater than 18.3 m (60 ft). Remediation Objectives: Average PCB concentration of 1 ppm or lower; Dioxins and Furans (PCDD/Fs): Total 2,3,7,8-TCDD TEQ < 1.0 ppb. Approach: Heat subsurface using a 3:1 ratio of heater-only to heater-vacuum thermal wells. Fifty-seven wells were installed using standard drilling techniques on a grid of equilateral triangles spaced 1.82 m (6 ft) apart forming a hexagonal pattern. The heater-vacuum wells were located at the center of each hexagonal pattern of heater-only wells, with a resulting spacing between heater-vacuum wells of approximately 3 m (10 ft). Target treatment temperatures at centroids between wells (coolest regions) were 450oC (840oF). Treatment gases removed from the subsurface by the heater-vacuum wells were treated using a flameless thermal oxidizer and granular activated carbon before being discharged to the atmosphere. Operations: Mobilization to the site in September 1998. Construction September through October 1998. Treatment between November 1998 and January 1999. Interim soil sampling and shut down occurred in February 1999. Final Confirmation sampling was conducted in early April 1999.
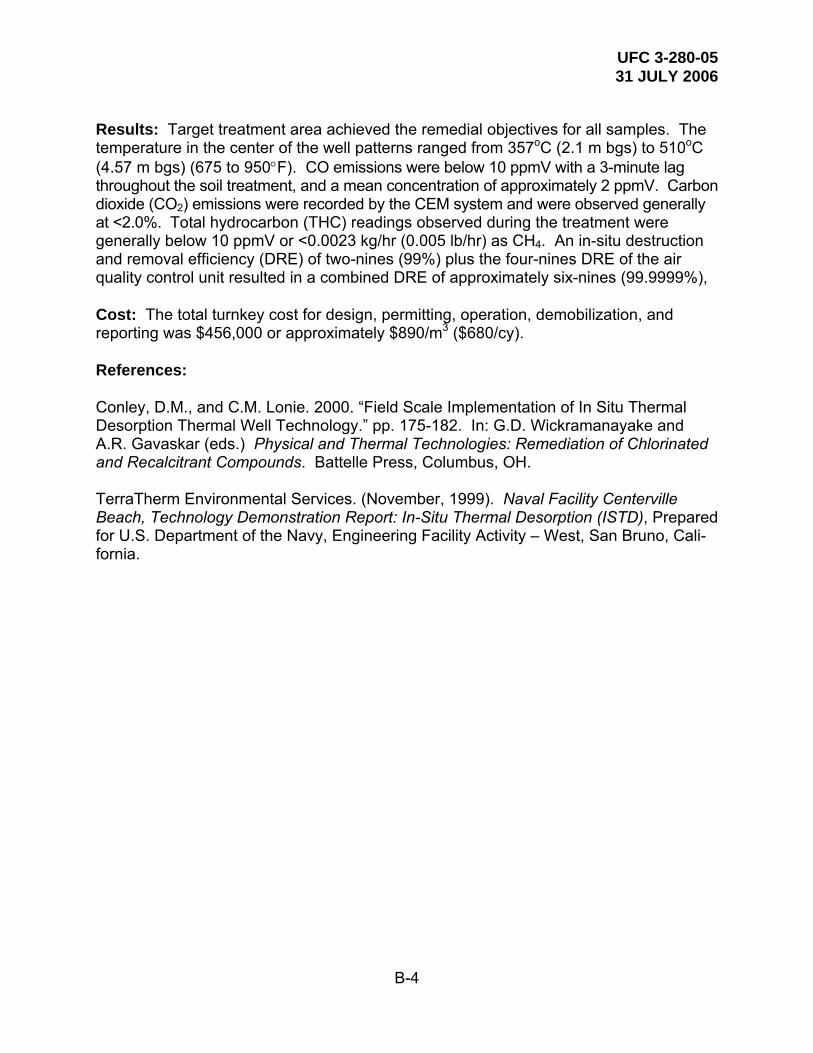
UFC 3-280-05 31 JULY 2006
B-4
Results: Target treatment area achieved the remedial objectives for all samples. The temperature in the center of the well patterns ranged from 357oC (2.1 m bgs) to 510oC (4.57 m bgs) (675 to 950°F). CO emissions were below 10 ppmV with a 3-minute lag throughout the soil treatment, and a mean concentration of approximately 2 ppmV. Carbon dioxide (CO2) emissions were recorded by the CEM system and were observed generally at <2.0%. Total hydrocarbon (THC) readings observed during the treatment were generally below 10 ppmV or <0.0023 kg/hr (0.005 lb/hr) as CH4. An in-situ destruction and removal efficiency (DRE) of two-nines (99%) plus the four-nines DRE of the air quality control unit resulted in a combined DRE of approximately six-nines (99.9999%), Cost: The total turnkey cost for design, permitting, operation, demobilization, and reporting was $456,000 or approximately $890/m3 ($680/cy). References: Conley, D.M., and C.M. Lonie. 2000. “Field Scale Implementation of In Situ Thermal Desorption Thermal Well Technology.” pp. 175-182. In: G.D. Wickramanayake and A.R. Gavaskar (eds.) Physical and Thermal Technologies: Remediation of Chlorinated and Recalcitrant Compounds. Battelle Press, Columbus, OH. TerraTherm Environmental Services. (November, 1999). Naval Facility Centerville Beach, Technology Demonstration Report: In-Situ Thermal Desorption (ISTD), Prepared for U.S. Department of the Navy, Engineering Facility Activity – West, San Bruno, Cali-fornia.
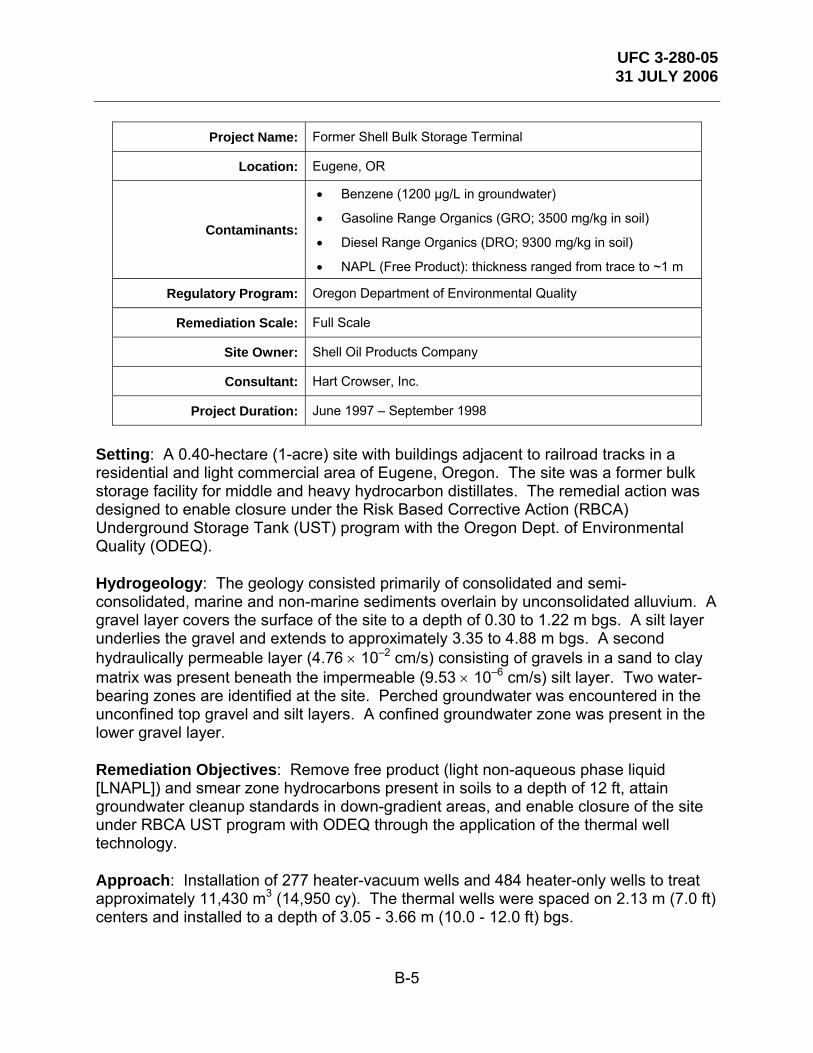
UFC 3-280-05 31 JULY 2006
B-5
Project Name: Former Shell Bulk Storage Terminal
Location: Eugene, OR
Contaminants:
• Benzene (1200 μg/L in groundwater)
• Gasoline Range Organics (GRO; 3500 mg/kg in soil)
• Diesel Range Organics (DRO; 9300 mg/kg in soil)
• NAPL (Free Product): thickness ranged from trace to ~1 m
Regulatory Program: Oregon Department of Environmental Quality
Remediation Scale: Full Scale
Site Owner: Shell Oil Products Company
Consultant: Hart Crowser, Inc.
Project Duration: June 1997 – September 1998
Setting: A 0.40-hectare (1-acre) site with buildings adjacent to railroad tracks in a residential and light commercial area of Eugene, Oregon. The site was a former bulk storage facility for middle and heavy hydrocarbon distillates. The remedial action was designed to enable closure under the Risk Based Corrective Action (RBCA) Underground Storage Tank (UST) program with the Oregon Dept. of Environmental Quality (ODEQ). Hydrogeology: The geology consisted primarily of consolidated and semi-consolidated, marine and non-marine sediments overlain by unconsolidated alluvium. A gravel layer covers the surface of the site to a depth of 0.30 to 1.22 m bgs. A silt layer underlies the gravel and extends to approximately 3.35 to 4.88 m bgs. A second hydraulically permeable layer (4.76 × 10⁻² cm/s) consisting of gravels in a sand to clay matrix was present beneath the impermeable (9.53 × 10⁻⁶ cm/s) silt layer. Two water-bearing zones are identified at the site. Perched groundwater was encountered in the unconfined top gravel and silt layers. A confined groundwater zone was present in the lower gravel layer. Remediation Objectives: Remove free product (light non-aqueous phase liquid [LNAPL]) and smear zone hydrocarbons present in soils to a depth of 12 ft, attain groundwater cleanup standards in down-gradient areas, and enable closure of the site under RBCA UST program with ODEQ through the application of the thermal well technology. Approach: Installation of 277 heater-vacuum wells and 484 heater-only wells to treat approximately 11,430 m3 (14,950 cy). The thermal wells were spaced on 2.13 m (7.0 ft) centers and installed to a depth of 3.05 - 3.66 m (10.0 - 12.0 ft) bgs.
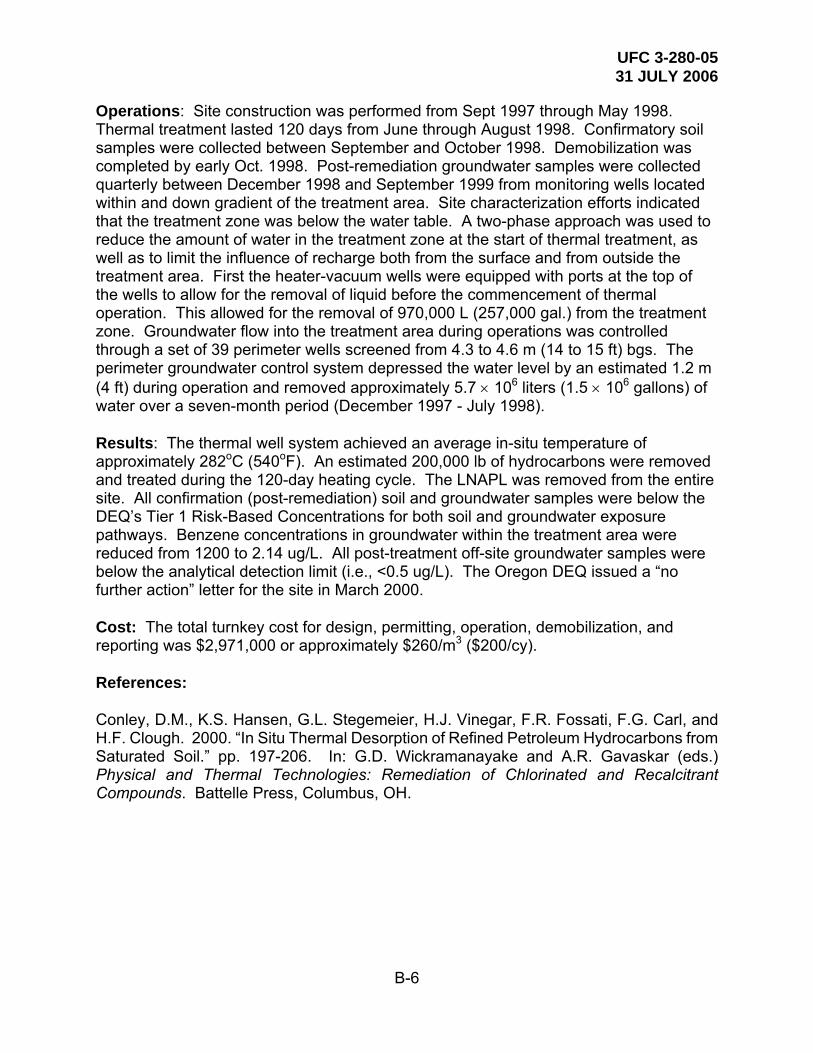
UFC 3-280-05 31 JULY 2006
B-6
Operations: Site construction was performed from Sept 1997 through May 1998. Thermal treatment lasted 120 days from June through August 1998. Confirmatory soil samples were collected between September and October 1998. Demobilization was completed by early Oct. 1998. Post-remediation groundwater samples were collected quarterly between December 1998 and September 1999 from monitoring wells located within and down gradient of the treatment area. Site characterization efforts indicated that the treatment zone was below the water table. A two-phase approach was used to reduce the amount of water in the treatment zone at the start of thermal treatment, as well as to limit the influence of recharge both from the surface and from outside the treatment area. First the heater-vacuum wells were equipped with ports at the top of the wells to allow for the removal of liquid before the commencement of thermal operation. This allowed for the removal of 970,000 L (257,000 gal.) from the treatment zone. Groundwater flow into the treatment area during operations was controlled through a set of 39 perimeter wells screened from 4.3 to 4.6 m (14 to 15 ft) bgs. The perimeter groundwater control system depressed the water level by an estimated 1.2 m (4 ft) during operation and removed approximately 5.7 × 10⁶ liters (1.5 × 10⁶ gallons) of water over a seven-month period (December 1997 - July 1998). Results: The thermal well system achieved an average in-situ temperature of approximately 282oC (540oF). An estimated 200,000 lb of hydrocarbons were removed and treated during the 120-day heating cycle. The LNAPL was removed from the entire site. All confirmation (post-remediation) soil and groundwater samples were below the DEQ’s Tier 1 Risk-Based Concentrations for both soil and groundwater exposure pathways. Benzene concentrations in groundwater within the treatment area were reduced from 1200 to 2.14 ug/L. All post-treatment off-site groundwater samples were below the analytical detection limit (i.e., <0.5 ug/L). The Oregon DEQ issued a “no further action” letter for the site in March 2000. Cost: The total turnkey cost for design, permitting, operation, demobilization, and reporting was $2,971,000 or approximately $260/m3 ($200/cy). References: Conley, D.M., K.S. Hansen, G.L. Stegemeier, H.J. Vinegar, F.R. Fossati, F.G. Carl, and H.F. Clough. 2000. “In Situ Thermal Desorption of Refined Petroleum Hydrocarbons from Saturated Soil.” pp. 197-206. In: G.D. Wickramanayake and A.R. Gavaskar (eds.) Physical and Thermal Technologies: Remediation of Chlorinated and Recalcitrant Compounds. Battelle Press, Columbus, OH.
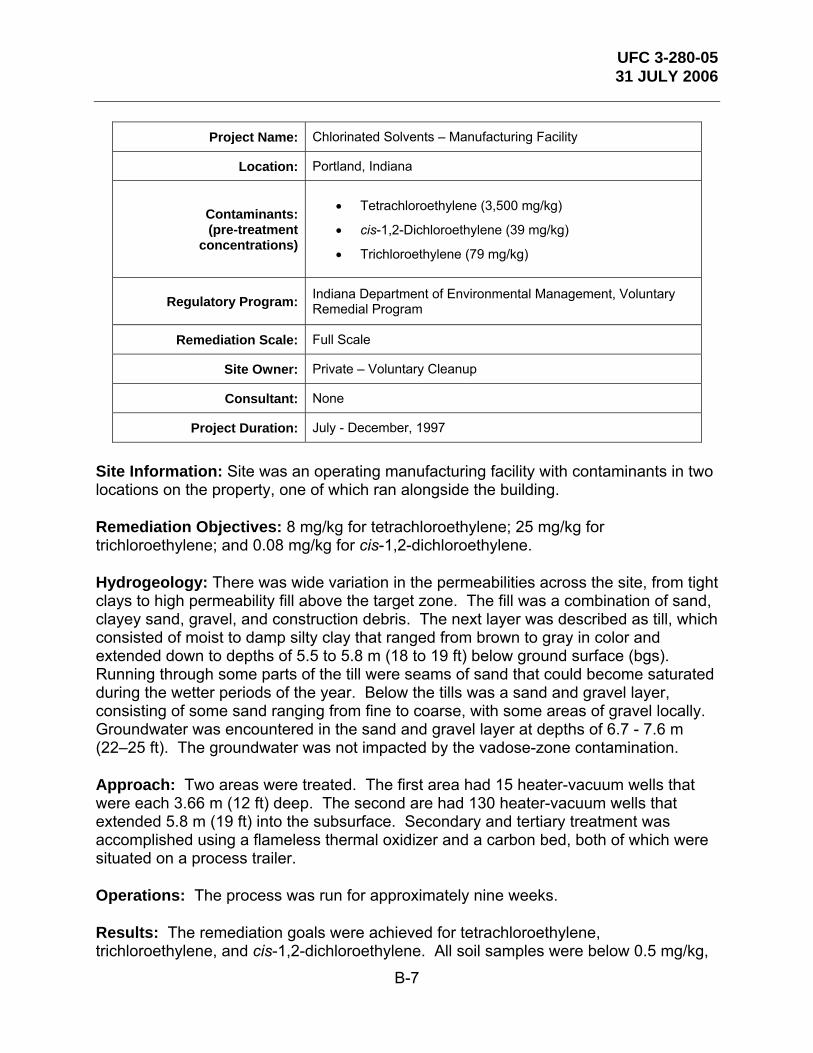
UFC 3-280-05 31 JULY 2006
B-7
Project Name: Chlorinated Solvents – Manufacturing Facility
Location: Portland, Indiana
Contaminants: (pre-treatment
concentrations)
• Tetrachloroethylene (3,500 mg/kg)
• cis-1,2-Dichloroethylene (39 mg/kg)
• Trichloroethylene (79 mg/kg)
Regulatory Program: Indiana Department of Environmental Management, Voluntary Remedial Program
Remediation Scale: Full Scale
Site Owner: Private – Voluntary Cleanup
Consultant: None
Project Duration: July - December, 1997
Site Information: Site was an operating manufacturing facility with contaminants in two locations on the property, one of which ran alongside the building. Remediation Objectives: 8 mg/kg for tetrachloroethylene; 25 mg/kg for trichloroethylene; and 0.08 mg/kg for cis-1,2-dichloroethylene. Hydrogeology: There was wide variation in the permeabilities across the site, from tight clays to high permeability fill above the target zone. The fill was a combination of sand, clayey sand, gravel, and construction debris. The next layer was described as till, which consisted of moist to damp silty clay that ranged from brown to gray in color and extended down to depths of 5.5 to 5.8 m (18 to 19 ft) below ground surface (bgs). Running through some parts of the till were seams of sand that could become saturated during the wetter periods of the year. Below the tills was a sand and gravel layer, consisting of some sand ranging from fine to coarse, with some areas of gravel locally. Groundwater was encountered in the sand and gravel layer at depths of 6.7 - 7.6 m (22–25 ft). The groundwater was not impacted by the vadose-zone contamination. Approach: Two areas were treated. The first area had 15 heater-vacuum wells that were each 3.66 m (12 ft) deep. The second are had 130 heater-vacuum wells that extended 5.8 m (19 ft) into the subsurface. Secondary and tertiary treatment was accomplished using a flameless thermal oxidizer and a carbon bed, both of which were situated on a process trailer. Operations: The process was run for approximately nine weeks. Results: The remediation goals were achieved for tetrachloroethylene, trichloroethylene, and cis-1,2-dichloroethylene. All soil samples were below 0.5 mg/kg,
UFC 3-280-05 31 JULY 2006
B-8
0.057 mg/kg, and 0.2 mg/kg for PCE, cis-1,2-DCE, and TCE, respectively. The southern part of the well field reached 260oC (500oF), but influx of water in the northern part of the field limited the temperature to 100oC (212oF). Steam stripping, however, caused the removal of the contaminants in the northern end and the remediation goals were met in spite of not superheating the soil in that area. Cost: Not available. Reference: Vinegar, H.J., G.L. Stegemeier, F.G. Carl, J.D. Stevenson, and R.J. Dudley. 1999. “In Situ Thermal Desorption of Soils Impacted with Chlorinated Solvents.” Proceedings of the Annual Meetings of the Air and Waste Management Association, Paper No. 99-450.

UFC 3-280-05 31 JULY 2006
B-9
Project Name: Missouri Electric Works Site (MEW)
Location: Cape Girardeau, MO
Contaminants: PCB Aroclor 1260 – NAPL
Regulatory Program: CERCLA
Remediation Scale: Demonstration Pilot Scale
Site Owner: MEW Site Trust Fund Donors
Consultant: Sverdrup, Inc.
Project Duration: March – June, 1997
Site Information: Missouri Electric Works previously sold, serviced, and remanufactured transformers, electric motors, and electrical equipment. The MEW site included all areas on and off the MEW property that had been impacted with PCBs above the action limits of 10 ppm from 0 to 1.22 m (0 to 4 ft) deep and 100 ppm below 1.22 m (4 ft) deep. It was located on a 2.59-hectare (6.4-acre) tract adjacent to Highway 61 in a commercial/light industrial area. Additional soil was contaminated in adjacent off site areas. Hydrogeology: The MEW site is underlain by a weathered and unweathered loess that sits on Ordovician-aged sedimentary formations. The surficial loess deposits are typically brown, firm, silty clays. The shallow water-bearing zone occurs between 9.14 and 18.29 m (30 and 60 ft) below ground surface (bgs). Remediation Objectives: Demonstration of TerraTherm’s ISTD process through the application of thermal wells and blankets to achieve a clean-up goal for PCBs of 2 ppm. Approach: Installation of 12 heater-vacuum wells in a triangular pattern spaced on 1.52-m (5-ft) centers. Wells were installed to a depth of 12 ft. To account for heat losses out of the top and the bottom of the system the bottom 0.61 m (2 ft) and top 0.3048 m (1 ft) of the heaters were run with a 57% higher power input. Application of two thermal blankets was used to treat contaminated soil to a depth of 45.7 cm (18 in.), and the demonstration of an ex-situ blanket application for stockpiled soil. Operations: Mobilization to the site took place in March '97, with site construction beginning during the same month. Thermal treatment lasted from 10 - 45 days, depending on the thermal configuration for the three different processes, and was completed in June '97. Demobilization from the site was in July '97. Results: All clean-up goals were met for the thermal well and thermal blanket applications and pertinent information was produced for the continued development of the ISTD ex-situ operations. PCBs were reduced from a maximum concentration of
UFC 3-280-05 31 JULY 2006
B-10
about 20,000 ppm and a mean concentration of 782 ppm (n = 88) to less than 2 mg/kg in all 90 post-treatment samples within the treatment zone. PCB concentrations were non-detect (<0.033 ppm) in 84 of the post-treatment soil samples and less than 0.302 mg/kg in the 6 soil samples with detectable levels. Stack testing showed 99.9999998% Destruction and Removal Efficiency (DRE). Continuous emission monitoring (CEM) showed the average stack composition contained about 20,000 ppm CO2, 2 ppm CO, and 1 ppm THC. The peak HCl concentration in the stack was 60 ppm from the decomposition of the PCBs. All emissions standards were met during the project. There was no evidence of horizontal or vertical contaminant migration. Dioxins in treated soil were below background level for North American soil (< 6 ppt). A soil temperature of 482oC (900oF) was reached in the center of all of the triangular patterns, with the very center of the entire pattern reaching a temperature of 593oC (1100oF). A comparison of pre- and post-treatment soil hydraulic characteristics indicated that the soil porosity increased from 30 to 40% and the horizontal and vertical hydraulic conductivities increased by over 4 orders of magnitude (e.g., 1 × 10⁻³ to 30 m/d) following treatment. Cost: The total demonstration cost for design, permitting, operation, demobilization, and reporting was reported to be $2,038,000. Unit costs were not available. References: Vinegar, H.J., E.P. deRouffignac, R.L. Rosen, G.L Stegemeier, M.M. Bonn, D.M. Conley, S.H. Phillips, J.M Hirsch, F.G. Carl, J.R. Steed, D.H. Arrington, P.T. Brunette, W.M. Mueller, and T.E. Siedhoff. 1997. “In Situ Thermal Desorption (ISTD) of PCBs”, Proceedings of the HazWaste/World Superfund XVIII Conference, Washington, DC, December 2, 1997. Haley & Aldrich (Nov., 1997). Demonstration Test Report-Thermal Wells, Missouri Electric Works Site, Cape Girardeau, Missouri. Submitted to Mr. Hiroshi Dodohara, Permit Officer, USEPA Office of Pollution Prevention & Toxics (OPPT), Washington, D.C. Haley & Aldrich of New York, Inc. Haley & Aldrich, Inc. (October, 1997). Demonstration Test Report – Thermal Blanket. In-Situ Thermal Desorption Technology, Missouri Electric Works Site, Cape Girardeau, Missouri, Prepared for TerraTherm Environmental Services, Inc. France–Isetts, P. 1998. “In Situ Thermal Blankets and Wells for PCB Removal in Tight Clay Soils,” Tech Trends, EPA Region 7. (February, 1998). Available at: http://clu-in.org/products/newsltrs/TTREND/tt0298.htm
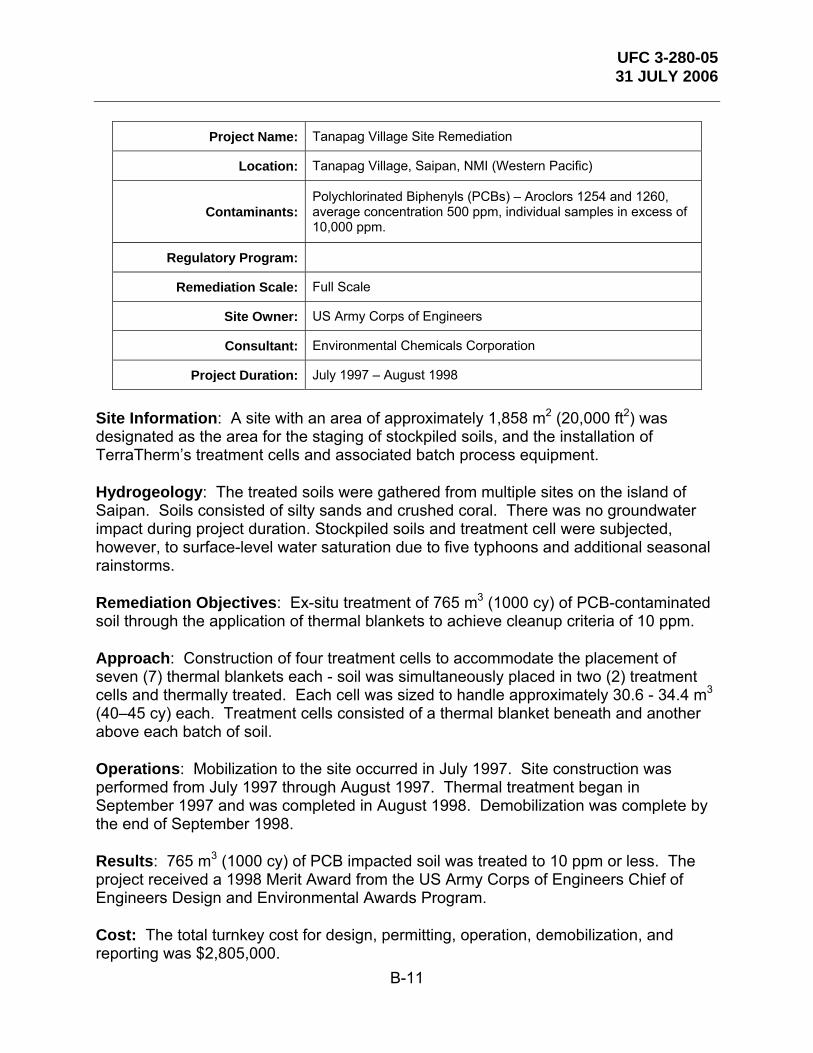
UFC 3-280-05 31 JULY 2006
B-11
Project Name: Tanapag Village Site Remediation
Location: Tanapag Village, Saipan, NMI (Western Pacific)
Contaminants: Polychlorinated Biphenyls (PCBs) – Aroclors 1254 and 1260, average concentration 500 ppm, individual samples in excess of 10,000 ppm.
Regulatory Program:
Remediation Scale: Full Scale
Site Owner: US Army Corps of Engineers
Consultant: Environmental Chemicals Corporation
Project Duration: July 1997 – August 1998
Site Information: A site with an area of approximately 1,858 m2 (20,000 ft2) was designated as the area for the staging of stockpiled soils, and the installation of TerraTherm’s treatment cells and associated batch process equipment. Hydrogeology: The treated soils were gathered from multiple sites on the island of Saipan. Soils consisted of silty sands and crushed coral. There was no groundwater impact during project duration. Stockpiled soils and treatment cell were subjected, however, to surface-level water saturation due to five typhoons and additional seasonal rainstorms. Remediation Objectives: Ex-situ treatment of 765 m3 (1000 cy) of PCB-contaminated soil through the application of thermal blankets to achieve cleanup criteria of 10 ppm. Approach: Construction of four treatment cells to accommodate the placement of seven (7) thermal blankets each - soil was simultaneously placed in two (2) treatment cells and thermally treated. Each cell was sized to handle approximately 30.6 - 34.4 m3 (40–45 cy) each. Treatment cells consisted of a thermal blanket beneath and another above each batch of soil. Operations: Mobilization to the site occurred in July 1997. Site construction was performed from July 1997 through August 1997. Thermal treatment began in September 1997 and was completed in August 1998. Demobilization was complete by the end of September 1998. Results: 765 m3 (1000 cy) of PCB impacted soil was treated to 10 ppm or less. The project received a 1998 Merit Award from the US Army Corps of Engineers Chief of Engineers Design and Environmental Awards Program. Cost: The total turnkey cost for design, permitting, operation, demobilization, and reporting was $2,805,000.
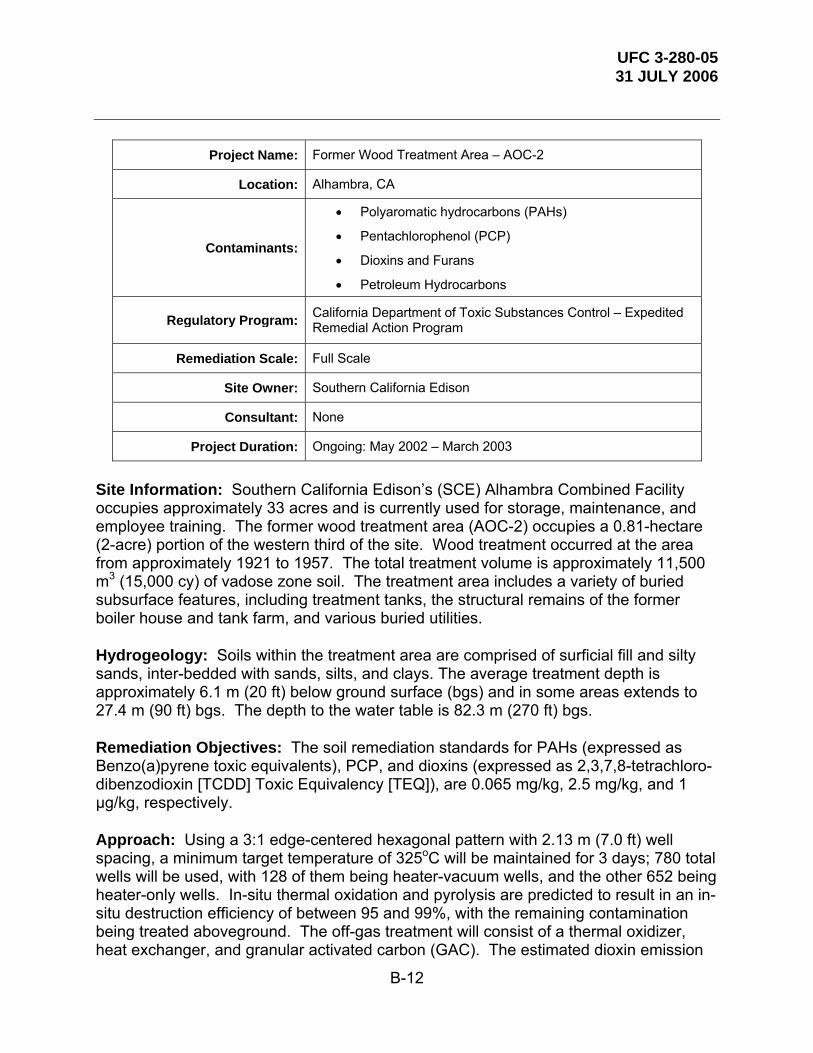
UFC 3-280-05 31 JULY 2006
B-12
Project Name: Former Wood Treatment Area – AOC-2
Location: Alhambra, CA
Contaminants:
• Polyaromatic hydrocarbons (PAHs)
• Pentachlorophenol (PCP)
• Dioxins and Furans
• Petroleum Hydrocarbons
Regulatory Program: California Department of Toxic Substances Control – Expedited Remedial Action Program
Remediation Scale: Full Scale
Site Owner: Southern California Edison
Consultant: None
Project Duration: Ongoing: May 2002 – March 2003
Site Information: Southern California Edison’s (SCE) Alhambra Combined Facility occupies approximately 33 acres and is currently used for storage, maintenance, and employee training. The former wood treatment area (AOC-2) occupies a 0.81-hectare (2-acre) portion of the western third of the site. Wood treatment occurred at the area from approximately 1921 to 1957. The total treatment volume is approximately 11,500 m3 (15,000 cy) of vadose zone soil. The treatment area includes a variety of buried subsurface features, including treatment tanks, the structural remains of the former boiler house and tank farm, and various buried utilities. Hydrogeology: Soils within the treatment area are comprised of surficial fill and silty sands, inter-bedded with sands, silts, and clays. The average treatment depth is approximately 6.1 m (20 ft) below ground surface (bgs) and in some areas extends to 27.4 m (90 ft) bgs. The depth to the water table is 82.3 m (270 ft) bgs. Remediation Objectives: The soil remediation standards for PAHs (expressed as Benzo(a)pyrene toxic equivalents), PCP, and dioxins (expressed as 2,3,7,8-tetrachloro-dibenzodioxin [TCDD] Toxic Equivalency [TEQ]), are 0.065 mg/kg, 2.5 mg/kg, and 1 μg/kg, respectively. Approach: Using a 3:1 edge-centered hexagonal pattern with 2.13 m (7.0 ft) well spacing, a minimum target temperature of 325oC will be maintained for 3 days; 780 total wells will be used, with 128 of them being heater-vacuum wells, and the other 652 being heater-only wells. In-situ thermal oxidation and pyrolysis are predicted to result in an in-situ destruction efficiency of between 95 and 99%, with the remaining contamination being treated aboveground. The off-gas treatment will consist of a thermal oxidizer, heat exchanger, and granular activated carbon (GAC). The estimated dioxin emission

UFC 3-280-05 31 JULY 2006
B-13
rate calculated for the air discharge permit is 0.311 billionths of a kg (0.685 billionths of a lb) TCDD TEQ/hr. This is equal to 0.896 millionths of a kg (1.97 millionths of a lb) TCDD TEQ over the 120-day life of this project. This is a very low amount and less than one-thousandth of the annual TCDD TEQ emission from a typical hazardous waste incinerator. California’s Department of Toxic Substances Control is overseeing the project, which is being conducted under California’s Expedited Remedial Action Pro-gram (ERAP). Operations: Two phases of operation. Simulation predicted 60 to 70-day heating time per phase; 90 days per phase allotted. Cost: The total turnkey cost for design, permitting, operation, demobilization, and reporting is projected to be $5,343,500 or approximately $480/m3 ($370/cy).
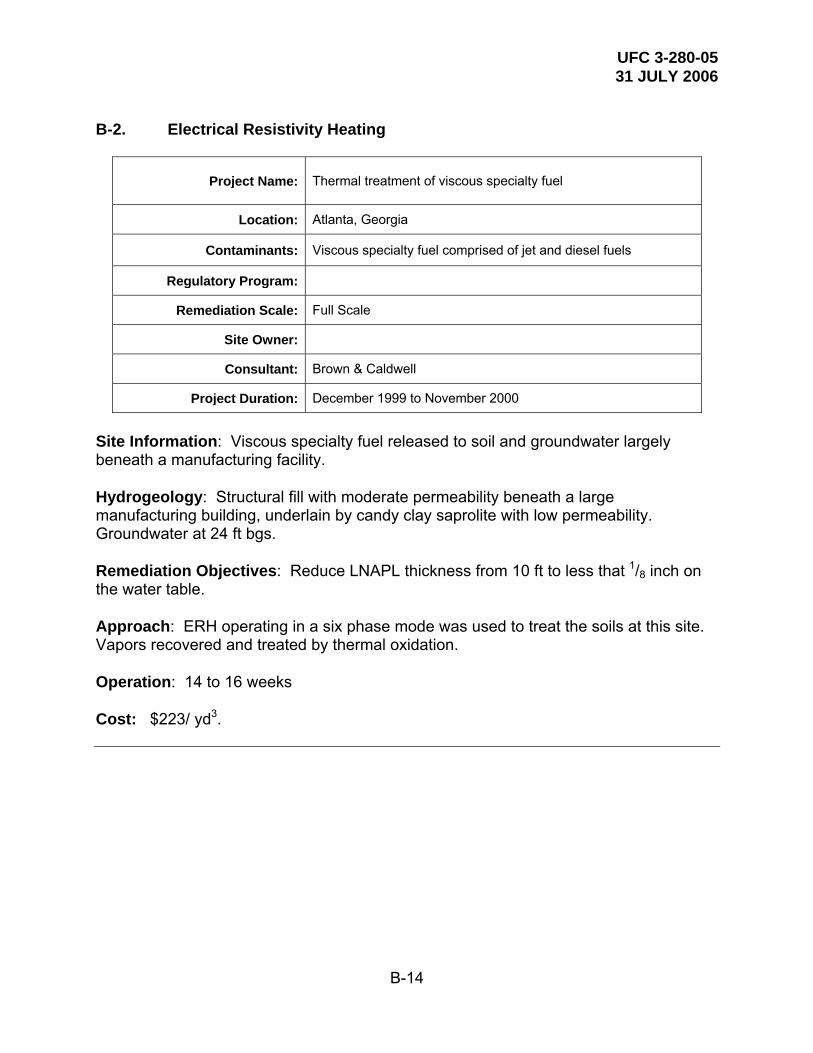
UFC 3-280-05 31 JULY 2006
B-14
B-2. Electrical Resistivity Heating
Project Name: Thermal treatment of viscous specialty fuel
Location: Atlanta, Georgia
Contaminants: Viscous specialty fuel comprised of jet and diesel fuels
Regulatory Program:
Remediation Scale: Full Scale
Site Owner:
Consultant: Brown & Caldwell
Project Duration: December 1999 to November 2000
Site Information: Viscous specialty fuel released to soil and groundwater largely beneath a manufacturing facility. Hydrogeology: Structural fill with moderate permeability beneath a large manufacturing building, underlain by candy clay saprolite with low permeability. Groundwater at 24 ft bgs. Remediation Objectives: Reduce LNAPL thickness from 10 ft to less that 1/8 inch on the water table. Approach: ERH operating in a six phase mode was used to treat the soils at this site. Vapors recovered and treated by thermal oxidation. Operation: 14 to 16 weeks Cost: $223/ yd3.
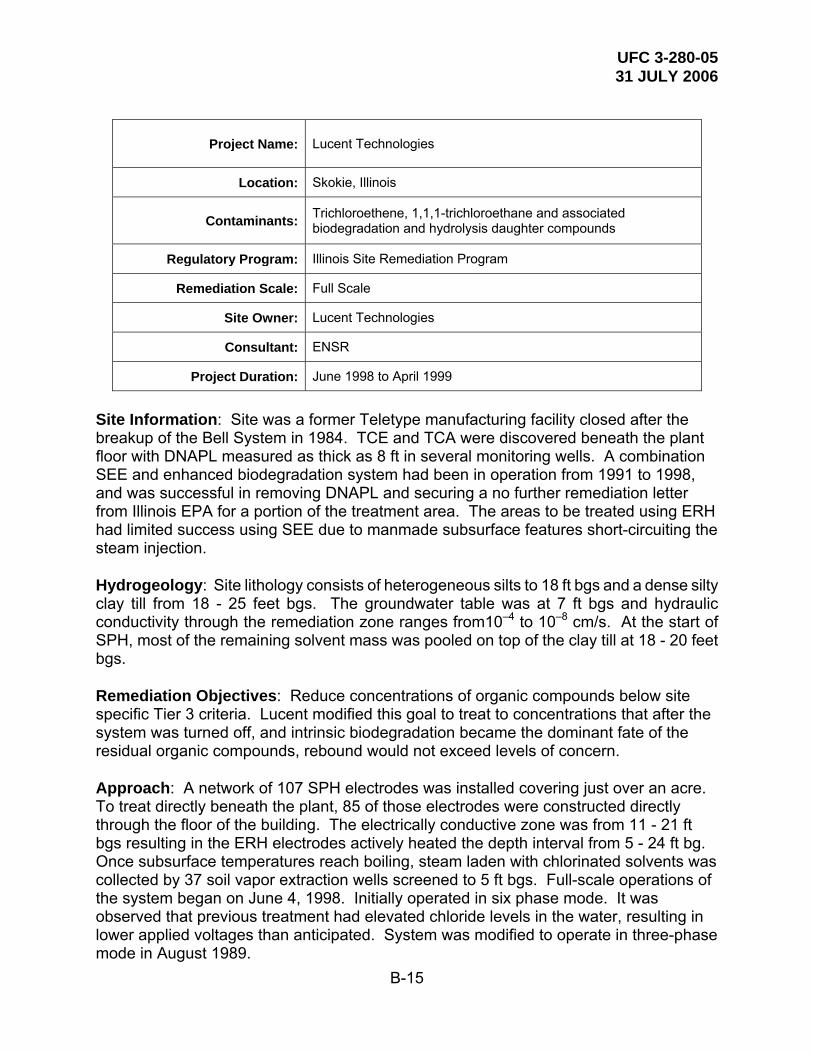
UFC 3-280-05 31 JULY 2006
B-15
Project Name: Lucent Technologies
Location: Skokie, Illinois
Contaminants: Trichloroethene, 1,1,1-trichloroethane and associated biodegradation and hydrolysis daughter compounds
Regulatory Program: Illinois Site Remediation Program
Remediation Scale: Full Scale
Site Owner: Lucent Technologies
Consultant: ENSR
Project Duration: June 1998 to April 1999
Site Information: Site was a former Teletype manufacturing facility closed after the breakup of the Bell System in 1984. TCE and TCA were discovered beneath the plant floor with DNAPL measured as thick as 8 ft in several monitoring wells. A combination SEE and enhanced biodegradation system had been in operation from 1991 to 1998, and was successful in removing DNAPL and securing a no further remediation letter from Illinois EPA for a portion of the treatment area. The areas to be treated using ERH had limited success using SEE due to manmade subsurface features short-circuiting the steam injection. Hydrogeology: Site lithology consists of heterogeneous silts to 18 ft bgs and a dense silty clay till from 18 - 25 feet bgs. The groundwater table was at 7 ft bgs and hydraulic conductivity through the remediation zone ranges from10–4 to 10–8 cm/s. At the start of SPH, most of the remaining solvent mass was pooled on top of the clay till at 18 - 20 feet bgs. Remediation Objectives: Reduce concentrations of organic compounds below site specific Tier 3 criteria. Lucent modified this goal to treat to concentrations that after the system was turned off, and intrinsic biodegradation became the dominant fate of the residual organic compounds, rebound would not exceed levels of concern. Approach: A network of 107 SPH electrodes was installed covering just over an acre. To treat directly beneath the plant, 85 of those electrodes were constructed directly through the floor of the building. The electrically conductive zone was from 11 - 21 ft bgs resulting in the ERH electrodes actively heated the depth interval from 5 - 24 ft bg. Once subsurface temperatures reach boiling, steam laden with chlorinated solvents was collected by 37 soil vapor extraction wells screened to 5 ft bgs. Full-scale operations of the system began on June 4, 1998. Initially operated in six phase mode. It was observed that previous treatment had elevated chloride levels in the water, resulting in lower applied voltages than anticipated. System was modified to operate in three-phase mode in August 1989.
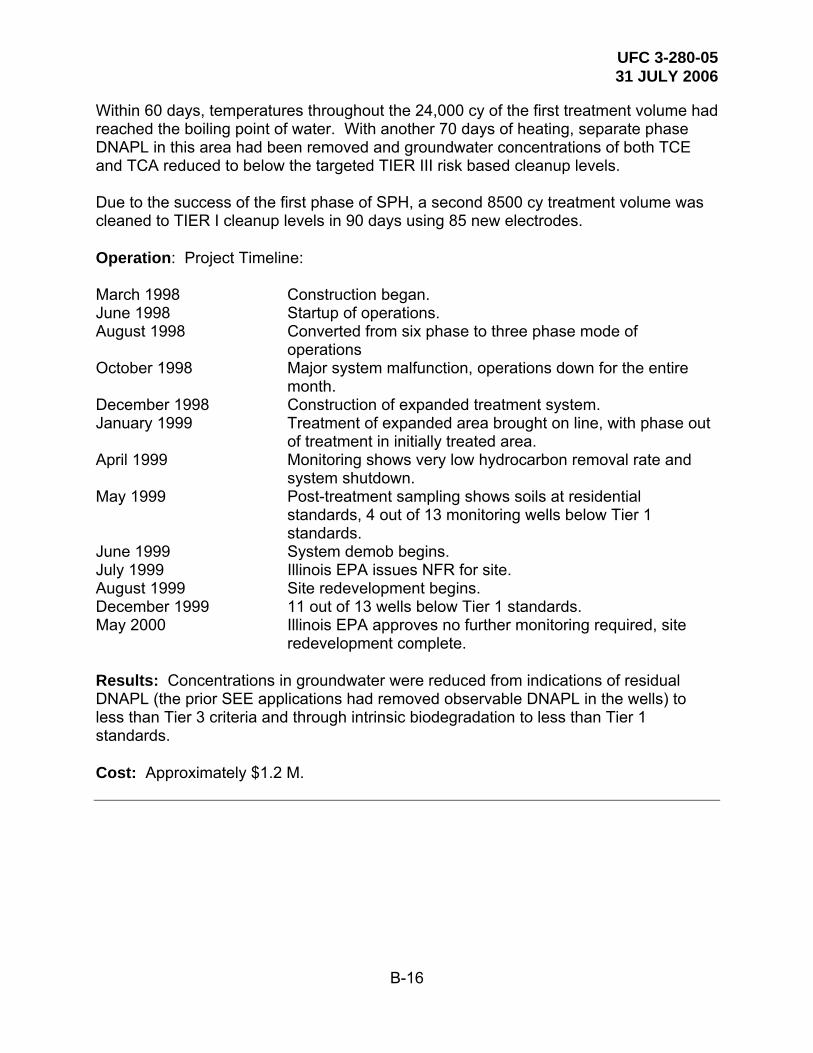
UFC 3-280-05 31 JULY 2006
B-16
Within 60 days, temperatures throughout the 24,000 cy of the first treatment volume had reached the boiling point of water. With another 70 days of heating, separate phase DNAPL in this area had been removed and groundwater concentrations of both TCE and TCA reduced to below the targeted TIER III risk based cleanup levels. Due to the success of the first phase of SPH, a second 8500 cy treatment volume was cleaned to TIER I cleanup levels in 90 days using 85 new electrodes. Operation: Project Timeline: March 1998 Construction began. June 1998 Startup of operations. August 1998 Converted from six phase to three phase mode of operations October 1998 Major system malfunction, operations down for the entire month. December 1998 Construction of expanded treatment system. January 1999 Treatment of expanded area brought on line, with phase out
of treatment in initially treated area. April 1999 Monitoring shows very low hydrocarbon removal rate and
system shutdown. May 1999 Post-treatment sampling shows soils at residential
standards, 4 out of 13 monitoring wells below Tier 1 standards.
June 1999 System demob begins. July 1999 Illinois EPA issues NFR for site. August 1999 Site redevelopment begins. December 1999 11 out of 13 wells below Tier 1 standards. May 2000 Illinois EPA approves no further monitoring required, site
redevelopment complete. Results: Concentrations in groundwater were reduced from indications of residual DNAPL (the prior SEE applications had removed observable DNAPL in the wells) to less than Tier 3 criteria and through intrinsic biodegradation to less than Tier 1 standards. Cost: Approximately $1.2 M.

UFC 3-280-05 31 JULY 2006
B-17
Project Name: Avery-Dennison
Location: Waukegan, Illinois
Contaminants: Methylene Chloride
Regulatory Program: Illinois Site Remediation Program
Remediation Scale: Full Scale
Site Owner: Avery-Dennison
Consultant: Clayton Environmental
Project Duration: December 1999 to November 2000
Site Information: Methylene chloride was used in film coating operations from 1975 to 1992. In 1985, an inventory check indicated that 1585 gal. of methylene chloride were released from and underground pipe. Hydrogeology: Silty clay glacial till to a depth of approximately 180 ft bgs. Discontinuous silty sand stringers also present. Water encountered at depths of 6 to 25 ft bgs. Remediation Objectives: Reduce methylene chloride concentrations to less than 24 mg/kg. Approach: ERH operating in a six phase mode was used to treat the soils at this site. An area of 17,000 ft2 was treated to a depth of 25 ft. A total of 95 copper electrodes were installed with 34 wells for vapor and steam recovery. The goal of the remediation was to heat the sols to 75oF. Operation: Project Timeline: December 1999 ERH treatment began November 2000 ERH treatment complete Results: Methylene chloride concentrations reduced from a maximum of 40,000 mg/kg and a mean of 1,400 mg/kg to a mean of 2.51 mg/kg. Cost: Not Available.
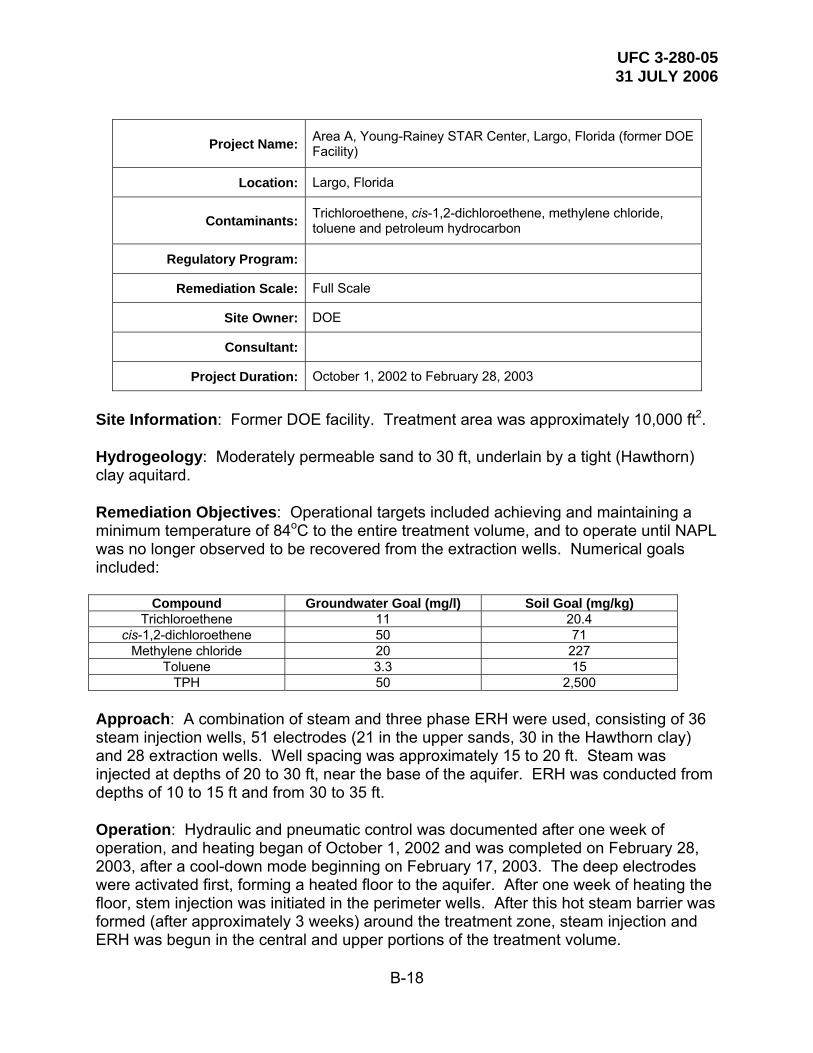
UFC 3-280-05 31 JULY 2006
B-18
Project Name: Area A, Young-Rainey STAR Center, Largo, Florida (former DOE Facility)
Location: Largo, Florida
Contaminants: Trichloroethene, cis-1,2-dichloroethene, methylene chloride, toluene and petroleum hydrocarbon
Regulatory Program:
Remediation Scale: Full Scale
Site Owner: DOE
Consultant:
Project Duration: October 1, 2002 to February 28, 2003
Site Information: Former DOE facility. Treatment area was approximately 10,000 ft2. Hydrogeology: Moderately permeable sand to 30 ft, underlain by a tight (Hawthorn) clay aquitard. Remediation Objectives: Operational targets included achieving and maintaining a minimum temperature of 84oC to the entire treatment volume, and to operate until NAPL was no longer observed to be recovered from the extraction wells. Numerical goals included:
Compound Groundwater Goal (mg/l) Soil Goal (mg/kg) Trichloroethene 11 20.4
cis-1,2-dichloroethene 50 71 Methylene chloride 20 227
Toluene 3.3 15 TPH 50 2,500
Approach: A combination of steam and three phase ERH were used, consisting of 36 steam injection wells, 51 electrodes (21 in the upper sands, 30 in the Hawthorn clay) and 28 extraction wells. Well spacing was approximately 15 to 20 ft. Steam was injected at depths of 20 to 30 ft, near the base of the aquifer. ERH was conducted from depths of 10 to 15 ft and from 30 to 35 ft. Operation: Hydraulic and pneumatic control was documented after one week of operation, and heating began of October 1, 2002 and was completed on February 28, 2003, after a cool-down mode beginning on February 17, 2003. The deep electrodes were activated first, forming a heated floor to the aquifer. After one week of heating the floor, stem injection was initiated in the perimeter wells. After this hot steam barrier was formed (after approximately 3 weeks) around the treatment zone, steam injection and ERH was begun in the central and upper portions of the treatment volume.
UFC 3-280-05 31 JULY 2006
B-19
Once the desired temperature was reached, pressure cycling was induced for a period of approximately one month. On January 13, 2003, an area containing sap-like resin was discovered, requiring a modification in the treatment involving additional injection and extraction wells. Results: Screening and analytical sampling shows that after recovery of 5000 to 9000 lb of VOCs, an asymptotic level of 5 lb per day removal of VOCs was observed. Approximately 200 gal. of DNAPL were recovered. Groundwater concentrations were reduced by 3 to 4 orders of magnitude in most wells. Effluent vapor and water concentrations had been reduced to less than 0.5% of their peak values during treatment. Cost: Turnkey remediation costs, including power were $1.3M or $118/cy. Contract includes a performance guarantee.
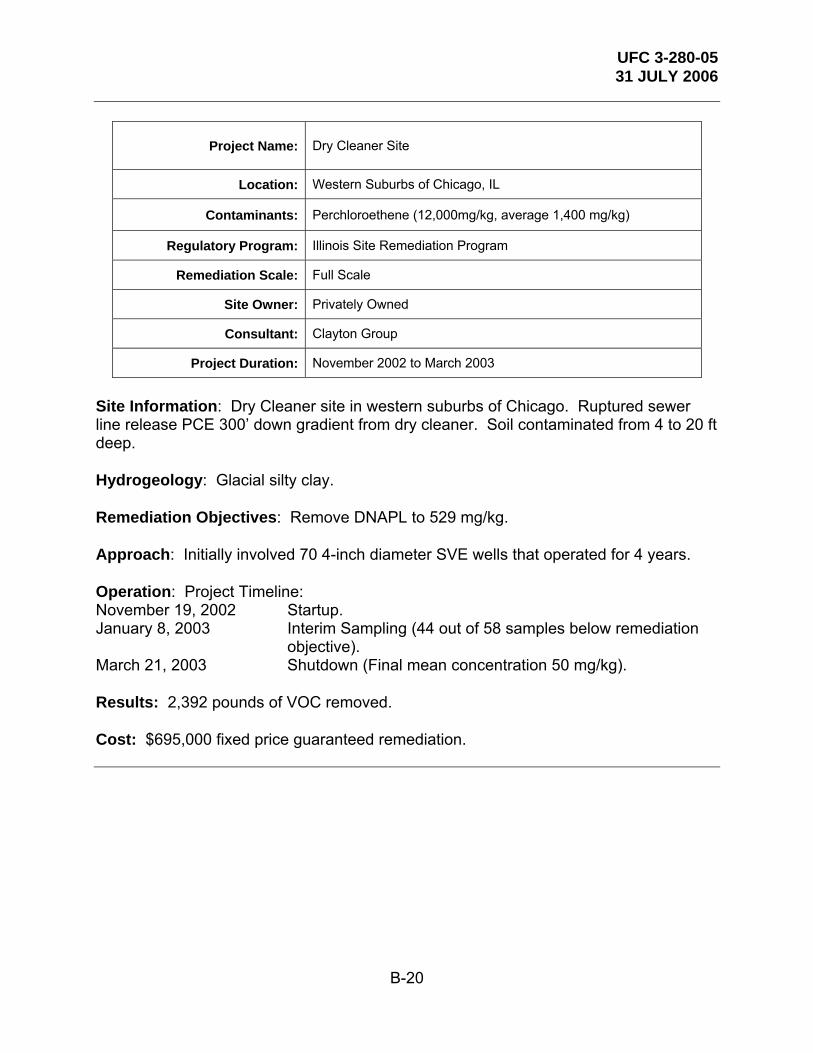
UFC 3-280-05 31 JULY 2006
B-20
Project Name: Dry Cleaner Site
Location: Western Suburbs of Chicago, IL
Contaminants: Perchloroethene (12,000mg/kg, average 1,400 mg/kg)
Regulatory Program: Illinois Site Remediation Program
Remediation Scale: Full Scale
Site Owner: Privately Owned
Consultant: Clayton Group
Project Duration: November 2002 to March 2003
Site Information: Dry Cleaner site in western suburbs of Chicago. Ruptured sewer line release PCE 300’ down gradient from dry cleaner. Soil contaminated from 4 to 20 ft deep. Hydrogeology: Glacial silty clay. Remediation Objectives: Remove DNAPL to 529 mg/kg. Approach: Initially involved 70 4-inch diameter SVE wells that operated for 4 years. Operation: Project Timeline: November 19, 2002 Startup. January 8, 2003 Interim Sampling (44 out of 58 samples below remediation objective). March 21, 2003 Shutdown (Final mean concentration 50 mg/kg). Results: 2,392 pounds of VOC removed. Cost: $695,000 fixed price guaranteed remediation.

UFC 3-280-05 31 JULY 2006
B-21
Project Name: Manufacturing Site
Location: Northwest Suburbs of Chicago, IL
Contaminants: TCE (2,400mg/kg)
Regulatory Program: Illinois Site Remediation Program
Remediation Scale: Full Scale
Site Owner: Privately Owned (confidential)
Consultant: URS Corporation
Project Duration: Two Phases: July 2002 to September 2002, and January 2003 to April 2003
Site Information: Manufacturer of computer-related equipment in northwest suburbs of Chicago, IL. Site had experienced releases of TCE from degreasing operations that were performed in a loading dock. Hydrogeology: Glacial silty clay. Remediation Objectives: Minimum Goal: remove TCE to less than Csat concentration of 1200 mg/kg; revised goal (achieve IEPA Tier 1 residential soil ingestion criteria) of 5 mg/kg. Approach: Initially involved 7 electrodes with horizontal vapor recovery system. Operated from 15 July to 21 September 2002. Confirmation sampling indicated that groundwater contaminated from previously undiscovered source north of treatment area was seeping into area already treated through granular sub-base. Second phase involved adding seven additional electrodes with integrated vapor recovery to treat previously undiscovered source and to re-treat the initial treatment area. TCE volatilized from soils beneath a catch basin re-condensed in soils immediately beneath catch basin as a result of catch basin receiving seepage through treatment; 7 cy of soil excavated from beneath the catch basin and disposed offsite to complete remediation. Operation: Project Timeline: Startup 7/15/02 Interim Shutdown 9/21/02 Expand System 11/2002 Re-start 1/10/03 Shutdown 4/8/03 Results: 292 pounds of VOC removed. Cost: $919,000 (including electricity).
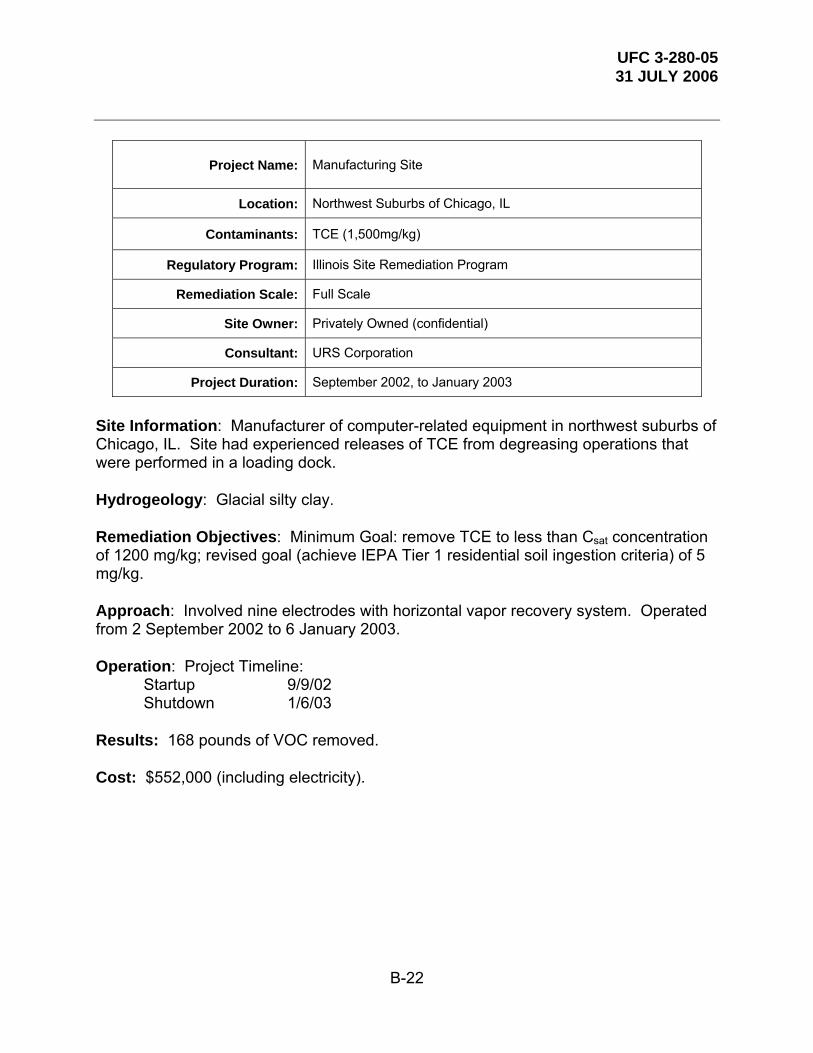
UFC 3-280-05 31 JULY 2006
B-22
Project Name: Manufacturing Site
Location: Northwest Suburbs of Chicago, IL
Contaminants: TCE (1,500mg/kg)
Regulatory Program: Illinois Site Remediation Program
Remediation Scale: Full Scale
Site Owner: Privately Owned (confidential)
Consultant: URS Corporation
Project Duration: September 2002, to January 2003
Site Information: Manufacturer of computer-related equipment in northwest suburbs of Chicago, IL. Site had experienced releases of TCE from degreasing operations that were performed in a loading dock. Hydrogeology: Glacial silty clay. Remediation Objectives: Minimum Goal: remove TCE to less than Csat concentration of 1200 mg/kg; revised goal (achieve IEPA Tier 1 residential soil ingestion criteria) of 5 mg/kg. Approach: Involved nine electrodes with horizontal vapor recovery system. Operated from 2 September 2002 to 6 January 2003. Operation: Project Timeline: Startup 9/9/02 Shutdown 1/6/03 Results: 168 pounds of VOC removed. Cost: $552,000 (including electricity).

UFC 3-280-05 31 JULY 2006
B-23
Project Name: Ft Richardson,
Location: Anchorage, Alaska
Contaminants: TCE, PCE, 1,1,22-tetrachloroethane
Regulatory Program:
Remediation Scale: Full Scale
Site Owner: U.S. Army Corps of Engineers
Consultant: URS Corporation
Project Duration: December 1999 to November 2000
Site Information: Disposal pit for wastes from practice decontamination of chemical munition-exposed equipment. Hydrogeology: Dense, relatively impermeable poorly sorted silty sandy gravel with some dense sand, silt or silty sand. Groundwater located at 8 ft bgs. Remediation Objectives: Reduce LNAPL thickness from 10 ft to less that 1/8-inch on the water table. Approach: ERH operating in a six phase mode was used to treat the soils at this site. Heating extended from 8 to 40 ft bgs. Operation: Three six phase arrays. Time to install and reach desired temperature was 3 weeks per array. Treatment time per array was 6 weeks, 18 weeks total. Results: Initial and final concentrations (mg/kg): Compound Initial Final TCE 21.53 1.6 PCE 2.0 0.08 1,1,2,2-tetrchloroethane 82.34 1.17 Cost: $185/ yd3.
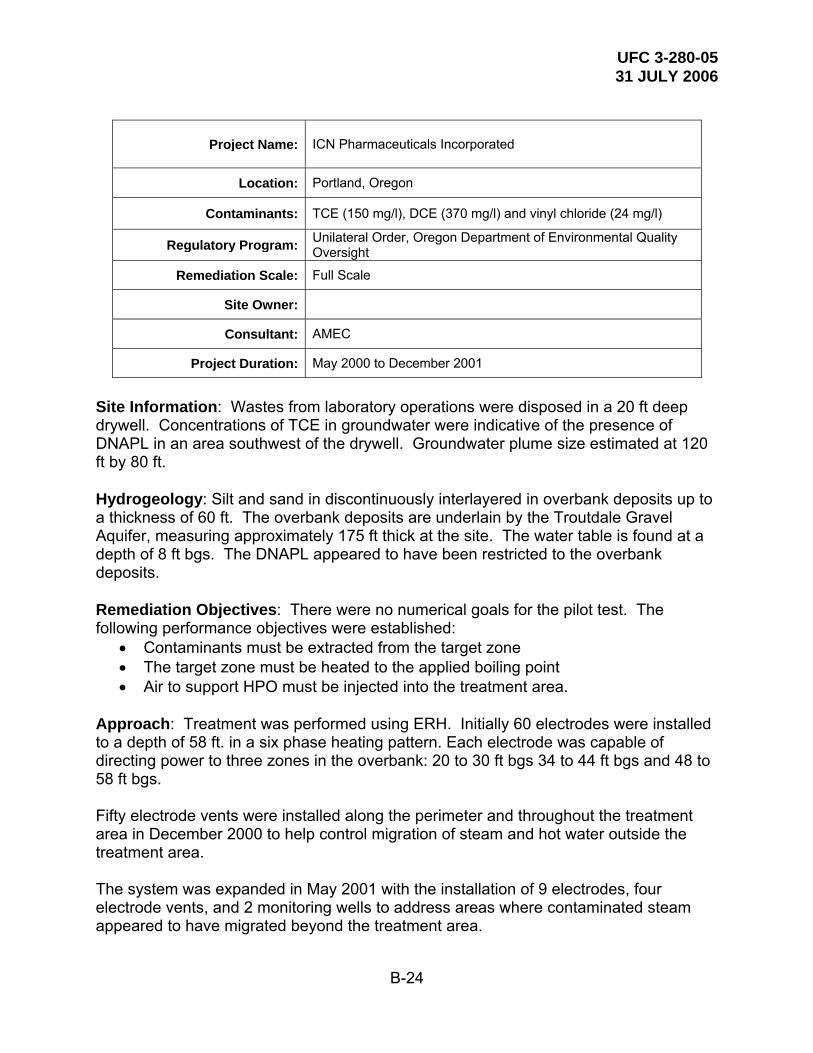
UFC 3-280-05 31 JULY 2006
B-24
Project Name: ICN Pharmaceuticals Incorporated
Location: Portland, Oregon
Contaminants: TCE (150 mg/l), DCE (370 mg/l) and vinyl chloride (24 mg/l)
Regulatory Program: Unilateral Order, Oregon Department of Environmental Quality Oversight
Remediation Scale: Full Scale
Site Owner:
Consultant: AMEC
Project Duration: May 2000 to December 2001
Site Information: Wastes from laboratory operations were disposed in a 20 ft deep drywell. Concentrations of TCE in groundwater were indicative of the presence of DNAPL in an area southwest of the drywell. Groundwater plume size estimated at 120 ft by 80 ft. Hydrogeology: Silt and sand in discontinuously interlayered in overbank deposits up to a thickness of 60 ft. The overbank deposits are underlain by the Troutdale Gravel Aquifer, measuring approximately 175 ft thick at the site. The water table is found at a depth of 8 ft bgs. The DNAPL appeared to have been restricted to the overbank deposits. Remediation Objectives: There were no numerical goals for the pilot test. The following performance objectives were established:
• Contaminants must be extracted from the target zone • The target zone must be heated to the applied boiling point • Air to support HPO must be injected into the treatment area.
Approach: Treatment was performed using ERH. Initially 60 electrodes were installed to a depth of 58 ft. in a six phase heating pattern. Each electrode was capable of directing power to three zones in the overbank: 20 to 30 ft bgs 34 to 44 ft bgs and 48 to 58 ft bgs. Fifty electrode vents were installed along the perimeter and throughout the treatment area in December 2000 to help control migration of steam and hot water outside the treatment area. The system was expanded in May 2001 with the installation of 9 electrodes, four electrode vents, and 2 monitoring wells to address areas where contaminated steam appeared to have migrated beyond the treatment area.

UFC 3-280-05 31 JULY 2006
B-25
Operation: Project Timeline: May 2000 Startup December 2000 System expanded with addition of 50 electrode vents May 2001 System expanded with 13 electrodes and 19 electrode vents December 2001 Shutdown Results: As of June 2002, TCE concentrations reduced from 150 mg/l to 0.008 mg/l; DCE reduced from 370 mg/l to 1.3 mg/l; and vinyl chloride from 24 mg/l to 0.050 mg/l. Cost: Not Available.
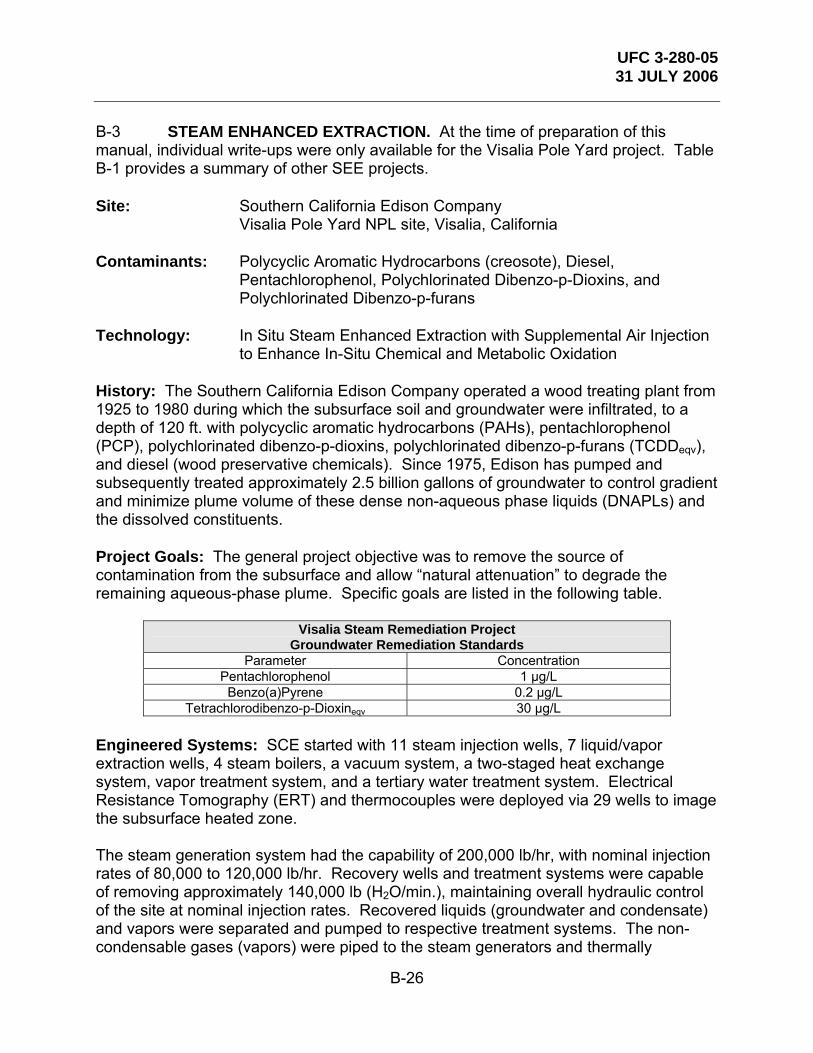
UFC 3-280-05 31 JULY 2006
B-26
B-3 STEAM ENHANCED EXTRACTION. At the time of preparation of this manual, individual write-ups were only available for the Visalia Pole Yard project. Table B-1 provides a summary of other SEE projects. Site: Southern California Edison Company
Visalia Pole Yard NPL site, Visalia, California Contaminants: Polycyclic Aromatic Hydrocarbons (creosote), Diesel,
Pentachlorophenol, Polychlorinated Dibenzo-p-Dioxins, and Polychlorinated Dibenzo-p-furans
Technology: In Situ Steam Enhanced Extraction with Supplemental Air Injection
to Enhance In-Situ Chemical and Metabolic Oxidation History: The Southern California Edison Company operated a wood treating plant from 1925 to 1980 during which the subsurface soil and groundwater were infiltrated, to a depth of 120 ft. with polycyclic aromatic hydrocarbons (PAHs), pentachlorophenol (PCP), polychlorinated dibenzo-p-dioxins, polychlorinated dibenzo-p-furans (TCDDeqv), and diesel (wood preservative chemicals). Since 1975, Edison has pumped and subsequently treated approximately 2.5 billion gallons of groundwater to control gradient and minimize plume volume of these dense non-aqueous phase liquids (DNAPLs) and the dissolved constituents. Project Goals: The general project objective was to remove the source of contamination from the subsurface and allow “natural attenuation” to degrade the remaining aqueous-phase plume. Specific goals are listed in the following table.
Visalia Steam Remediation Project Groundwater Remediation Standards
Parameter Concentration Pentachlorophenol 1 µg/L
Benzo(a)Pyrene 0.2 µg/L Tetrachlorodibenzo-p-Dioxineqv 30 µg/L
Engineered Systems: SCE started with 11 steam injection wells, 7 liquid/vapor extraction wells, 4 steam boilers, a vacuum system, a two-staged heat exchange system, vapor treatment system, and a tertiary water treatment system. Electrical Resistance Tomography (ERT) and thermocouples were deployed via 29 wells to image the subsurface heated zone. The steam generation system had the capability of 200,000 lb/hr, with nominal injection rates of 80,000 to 120,000 lb/hr. Recovery wells and treatment systems were capable of removing approximately 140,000 lb (H2O/min.), maintaining overall hydraulic control of the site at nominal injection rates. Recovered liquids (groundwater and condensate) and vapors were separated and pumped to respective treatment systems. The non-condensable gases (vapors) were piped to the steam generators and thermally

UFC 3-280-05 31 JULY 2006
B-27
destroyed in the fire-box of the boiler. Groundwater and condensate were pumped to head-works of the tertiary water treatment system. This system consisted of serial separation (gravity and air-flotation), parallel dual media and polish filtration, and serial treatment by granular activated carbon. The treated effluent was discharge to the local sewer under an industrial waste discharge permit.
Major Design Parameters and Specifications
Well Field Dimensions 145 ft. by 2 acres Contaminated Material Volume 375,000 yd3
Heated Material Volume >1,000,000 yd3
Water Treatment Plant Capacity 400 gpm Vapor Extraction System Capacity 2500 scfm Steam Injection System 120,000 lb/hr (+ 80% Reserve)
Preliminary Results: During May 1997 to June 2000, approximately 660 million pounds of steam were injected into the subsurface formation. Approximately 1.33 million pounds of wood preservative chemicals in the formation were mobilized and removed/destroyed. The following table depicts the wood treating chemical mass removed by free, aqueous, or vapor phase, and by chemical oxidation.
Removed Mass by Phase Category
Phase Mass Removed (lb) % Removed of Total Free 678,300 51 Vapor 239,400 18 In-situ Oxidation 212,800 16 Aqueous 199,500 15
Total 1,330,000 100 Southern California Edison designed and built a “carbon tracking” system, which on a real-time basis accounted for the mass removed in the aqueous and vapor phases. Oxidation in place was determined from the increase in CO2 and dissolved carbonate over the native groundwater and injected steam, taking temperature/solubility relationships into account. Free-phase wood treating chemicals were measured daily from the skimmed volumes emanating from the gravity separators. Operational Considerations: The system components must be robust and have inherent flexibility to maintain operational integrity. Strength and material compatibility if not addressed properly will result in many unforeseen events ranging from significant project delays to catastrophic failures. The Visalia design was robustly designed, constructed and maintained 96% operational capacity factor during 36 months of steaming operations. The initial target of steam injection focused on the intermediate aquitard, which is a heterogeneous saturated zone typified by inter-bedded coarse sand and cobble sized material. This aquitard is about 80 to 100 ft below the ground level (bgl). The steam
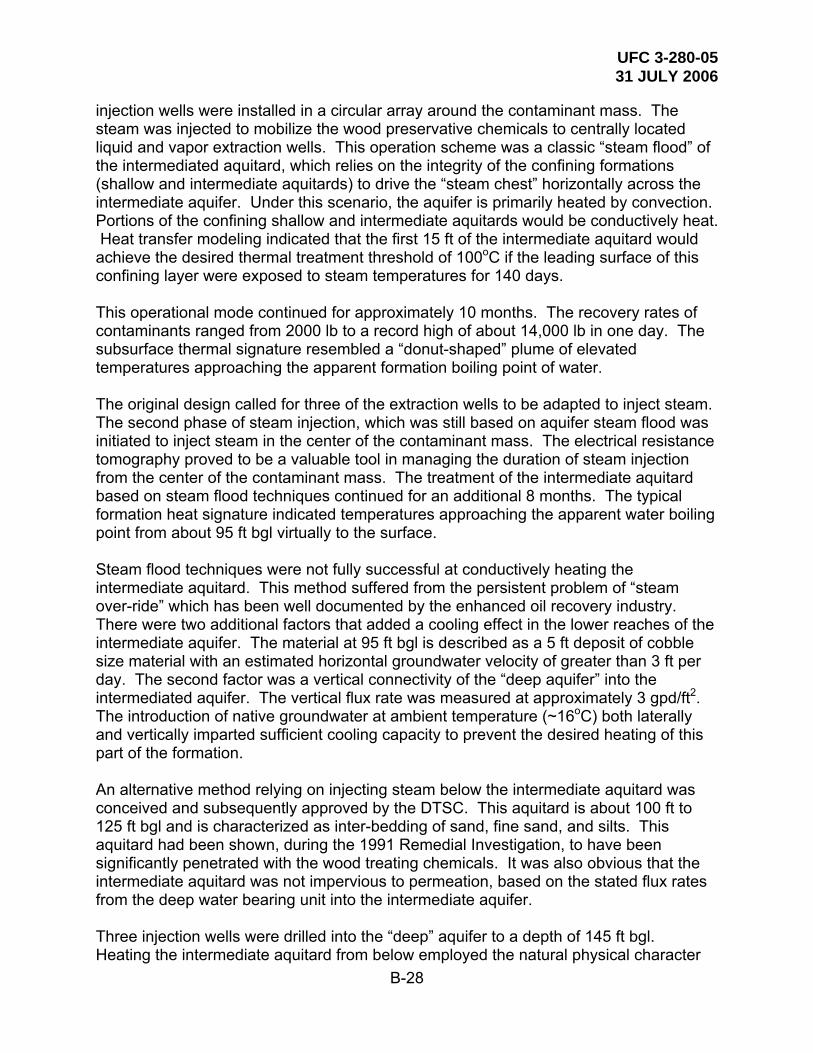
UFC 3-280-05 31 JULY 2006
B-28
injection wells were installed in a circular array around the contaminant mass. The steam was injected to mobilize the wood preservative chemicals to centrally located liquid and vapor extraction wells. This operation scheme was a classic “steam flood” of the intermediated aquitard, which relies on the integrity of the confining formations (shallow and intermediate aquitards) to drive the “steam chest” horizontally across the intermediate aquifer. Under this scenario, the aquifer is primarily heated by convection. Portions of the confining shallow and intermediate aquitards would be conductively heat. Heat transfer modeling indicated that the first 15 ft of the intermediate aquitard would achieve the desired thermal treatment threshold of 100oC if the leading surface of this confining layer were exposed to steam temperatures for 140 days. This operational mode continued for approximately 10 months. The recovery rates of contaminants ranged from 2000 lb to a record high of about 14,000 lb in one day. The subsurface thermal signature resembled a “donut-shaped” plume of elevated temperatures approaching the apparent formation boiling point of water. The original design called for three of the extraction wells to be adapted to inject steam. The second phase of steam injection, which was still based on aquifer steam flood was initiated to inject steam in the center of the contaminant mass. The electrical resistance tomography proved to be a valuable tool in managing the duration of steam injection from the center of the contaminant mass. The treatment of the intermediate aquitard based on steam flood techniques continued for an additional 8 months. The typical formation heat signature indicated temperatures approaching the apparent water boiling point from about 95 ft bgl virtually to the surface. Steam flood techniques were not fully successful at conductively heating the intermediate aquitard. This method suffered from the persistent problem of “steam over-ride” which has been well documented by the enhanced oil recovery industry. There were two additional factors that added a cooling effect in the lower reaches of the intermediate aquifer. The material at 95 ft bgl is described as a 5 ft deposit of cobble size material with an estimated horizontal groundwater velocity of greater than 3 ft per day. The second factor was a vertical connectivity of the “deep aquifer” into the intermediated aquifer. The vertical flux rate was measured at approximately 3 gpd/ft2. The introduction of native groundwater at ambient temperature (~16oC) both laterally and vertically imparted sufficient cooling capacity to prevent the desired heating of this part of the formation. An alternative method relying on injecting steam below the intermediate aquitard was conceived and subsequently approved by the DTSC. This aquitard is about 100 ft to 125 ft bgl and is characterized as inter-bedding of sand, fine sand, and silts. This aquitard had been shown, during the 1991 Remedial Investigation, to have been significantly penetrated with the wood treating chemicals. It was also obvious that the intermediate aquitard was not impervious to permeation, based on the stated flux rates from the deep water bearing unit into the intermediate aquifer. Three injection wells were drilled into the “deep” aquifer to a depth of 145 ft bgl. Heating the intermediate aquitard from below employed the natural physical character
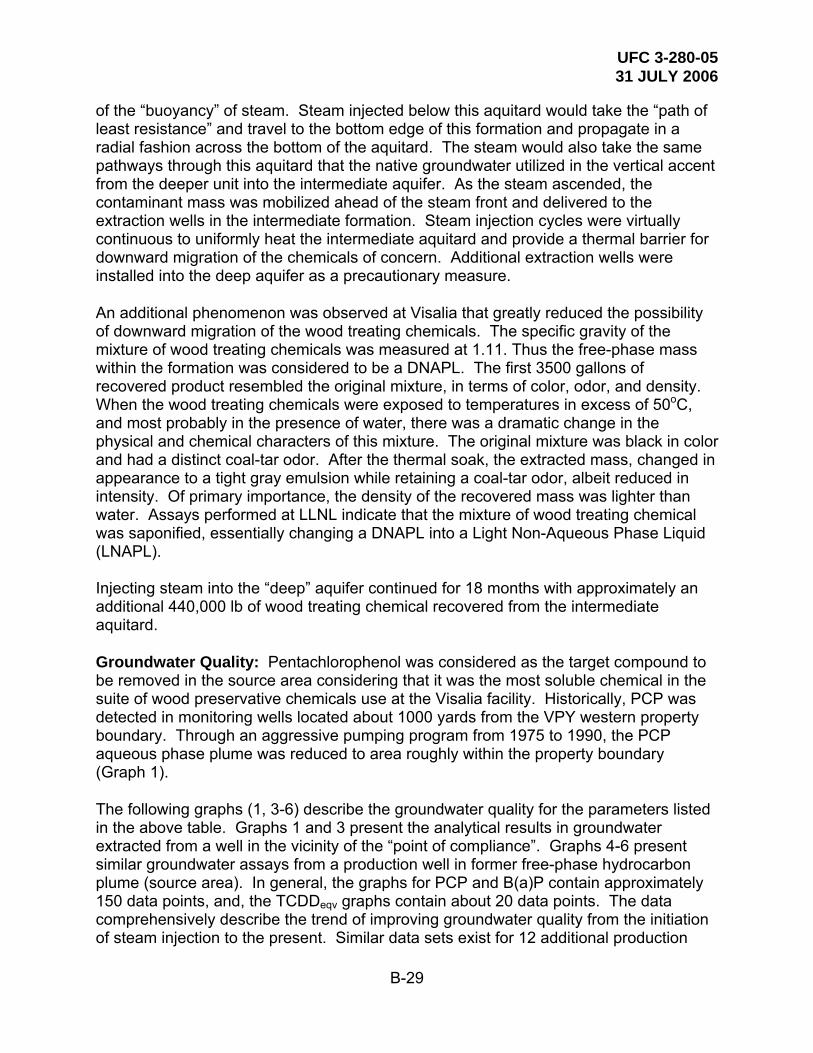
UFC 3-280-05 31 JULY 2006
B-29
of the “buoyancy” of steam. Steam injected below this aquitard would take the “path of least resistance” and travel to the bottom edge of this formation and propagate in a radial fashion across the bottom of the aquitard. The steam would also take the same pathways through this aquitard that the native groundwater utilized in the vertical accent from the deeper unit into the intermediate aquifer. As the steam ascended, the contaminant mass was mobilized ahead of the steam front and delivered to the extraction wells in the intermediate formation. Steam injection cycles were virtually continuous to uniformly heat the intermediate aquitard and provide a thermal barrier for downward migration of the chemicals of concern. Additional extraction wells were installed into the deep aquifer as a precautionary measure. An additional phenomenon was observed at Visalia that greatly reduced the possibility of downward migration of the wood treating chemicals. The specific gravity of the mixture of wood treating chemicals was measured at 1.11. Thus the free-phase mass within the formation was considered to be a DNAPL. The first 3500 gallons of recovered product resembled the original mixture, in terms of color, odor, and density. When the wood treating chemicals were exposed to temperatures in excess of 50oC, and most probably in the presence of water, there was a dramatic change in the physical and chemical characters of this mixture. The original mixture was black in color and had a distinct coal-tar odor. After the thermal soak, the extracted mass, changed in appearance to a tight gray emulsion while retaining a coal-tar odor, albeit reduced in intensity. Of primary importance, the density of the recovered mass was lighter than water. Assays performed at LLNL indicate that the mixture of wood treating chemical was saponified, essentially changing a DNAPL into a Light Non-Aqueous Phase Liquid (LNAPL). Injecting steam into the “deep” aquifer continued for 18 months with approximately an additional 440,000 lb of wood treating chemical recovered from the intermediate aquitard. Groundwater Quality: Pentachlorophenol was considered as the target compound to be removed in the source area considering that it was the most soluble chemical in the suite of wood preservative chemicals use at the Visalia facility. Historically, PCP was detected in monitoring wells located about 1000 yards from the VPY western property boundary. Through an aggressive pumping program from 1975 to 1990, the PCP aqueous phase plume was reduced to area roughly within the property boundary (Graph 1). The following graphs (1, 3-6) describe the groundwater quality for the parameters listed in the above table. Graphs 1 and 3 present the analytical results in groundwater extracted from a well in the vicinity of the “point of compliance”. Graphs 4-6 present similar groundwater assays from a production well in former free-phase hydrocarbon plume (source area). In general, the graphs for PCP and B(a)P contain approximately 150 data points, and, the TCDDeqv graphs contain about 20 data points. The data comprehensively describe the trend of improving groundwater quality from the initiation of steam injection to the present. Similar data sets exist for 12 additional production

UFC 3-280-05 31 JULY 2006
B-30
wells, all of which exhibit similar trends. The data selected for this appendix are representative of the improving groundwater quality at the Visalia Pole Yard. The groundwater extracted from EW-4 has shown two orders of PCP mass reduction since May 1997 which was the on-set of steam injection activities. The May 2003 PCP assay is lower than the Remediation Standard of 1 µg/L. This trend is encouraging; however, the data may not be entirely representative in light of that these results are from an extraction well.
EW-4 PCP in Groundwater
-100
0
100
200
300
400
500
[PC
P] S
team
Inj.
(ug/
L)
1 ug/L
Dec-97 Dec-98 Dec-99 Dec-00 Dec-01 Dec-02 Dec-03-20
0
20
40
60
80
100
[PC
P] P
ost S
team
Inj.
(ug/
L)
Remediation Standard =
6/2000 - End of Steam Injection
Graph 1Highest ConcentratrionDuring Steam Injection2/99, [PCP] =
Highest ConcentratrionPost Steam Injection2/99, [PCP] =
371 ug/L
120 ug/L
4/2003 Concentration[PCP] = 0.6 ug/L
SteamInjection
Post SteamInjection
EW-4 TCDD(eqv) in Groundwater
-5
0
5
10
15
20
25
30
[TC
DD
(eqv
)] S
team
Inj.
(pg/
L)
30 pg/L
Dec-97 Dec-98 Dec-99 Dec-00 Dec-01 Dec-02 Dec-03-5
0
5
10
15
20
25
30
[TC
DD
(eqv
)] Po
st S
team
Inj.
(pg/
L)
Remediation Standard =Graph 3
Current Concentration4/03, [TCDD(eqv)] = ND
Highest ConcentrationPost Steam Injection6/02, [TCDD(eqv)] =
Highest ConcentrationPost Steam Injection1/99, [TCDD(eqv)] =
16 10
SteamInjection
Post SteamInjection
6/2000 - End of Steam Injection
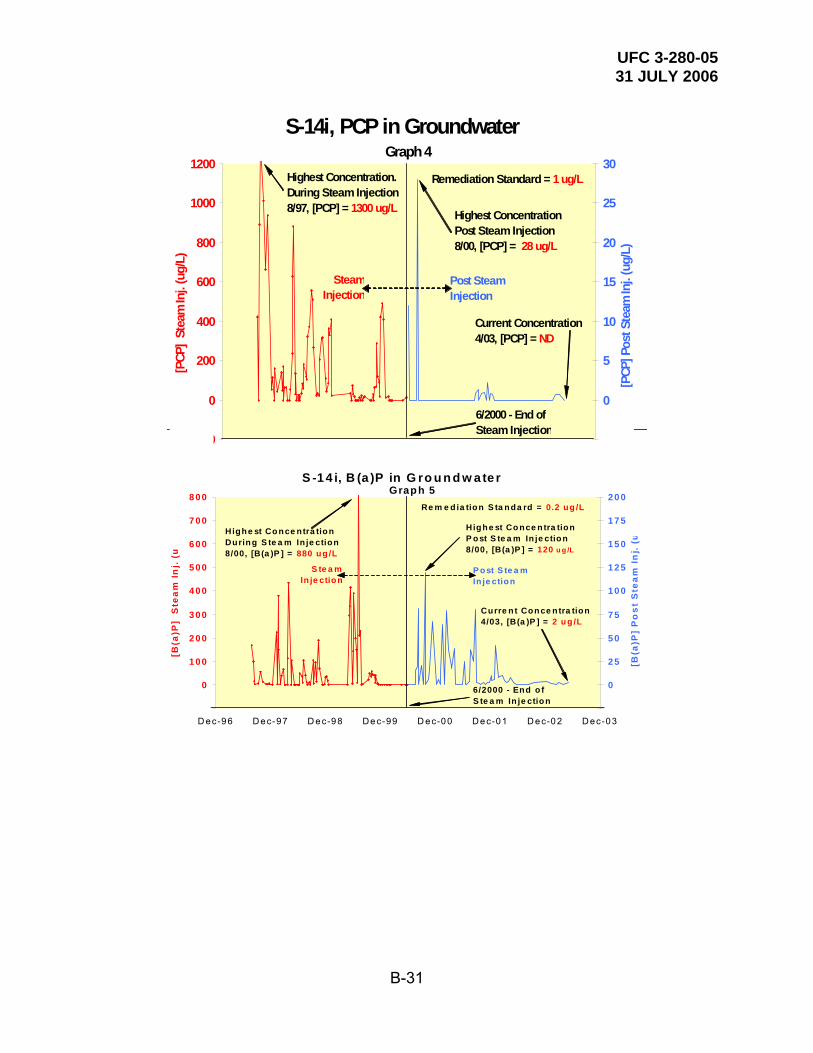
UFC 3-280-05 31 JULY 2006
B-31
S-14i, PCP in GroundwaterGraph 4
-200
0
200
400
600
800
1000
1200[P
CP]
Stea
m In
j. (u
g/L)
-5
0
5
10
15
20
25
30
[PCP
] Pos
t Ste
am In
j. (u
g/L)
6/2000 - End of Steam Injection
Remediation Standard =Highest Concentration. During Steam Injection 8/97, [PCP] =
1 ug/L
1300 ug/L Highest Concentration Post Steam Injection 8/00, [PCP] = 28 ug/L
SteamInjection
Post SteamInjection
Current Concentration4/03, [PCP] = ND
S -1 4 i, B (a )P in G ro u n d w a te r
-100
0
100
200
300
400
500
600
700
800
[B(a
)P]
Ste
am
In
j. (
u
D ec-96 D ec-97 D ec-98 Dec-99 D ec-00 D ec-01 D ec-02 D ec-03-25
0
25
50
75
100
125
150
175
200
[B(a
)P]
Po
st S
team
In
j. (u
Re m e d ia tion S ta nda rd =
6/2000 - End o f S te a m In je ction
0.2 ug /L
Grap h 5
Highe st Co nce ntra tionP ost S te a m In je ction8/00, [B(a )P ] = 120 u g /L
Curre n t Conce ntra tion4/03, [B(a )P ] = 2 ug /L
S te a mIn je ction
Highe st Co nce ntra tionDuring S te a m In je ction8/00, [B(a )P ] = 880 ug /L
P ost S te a mIn je ction
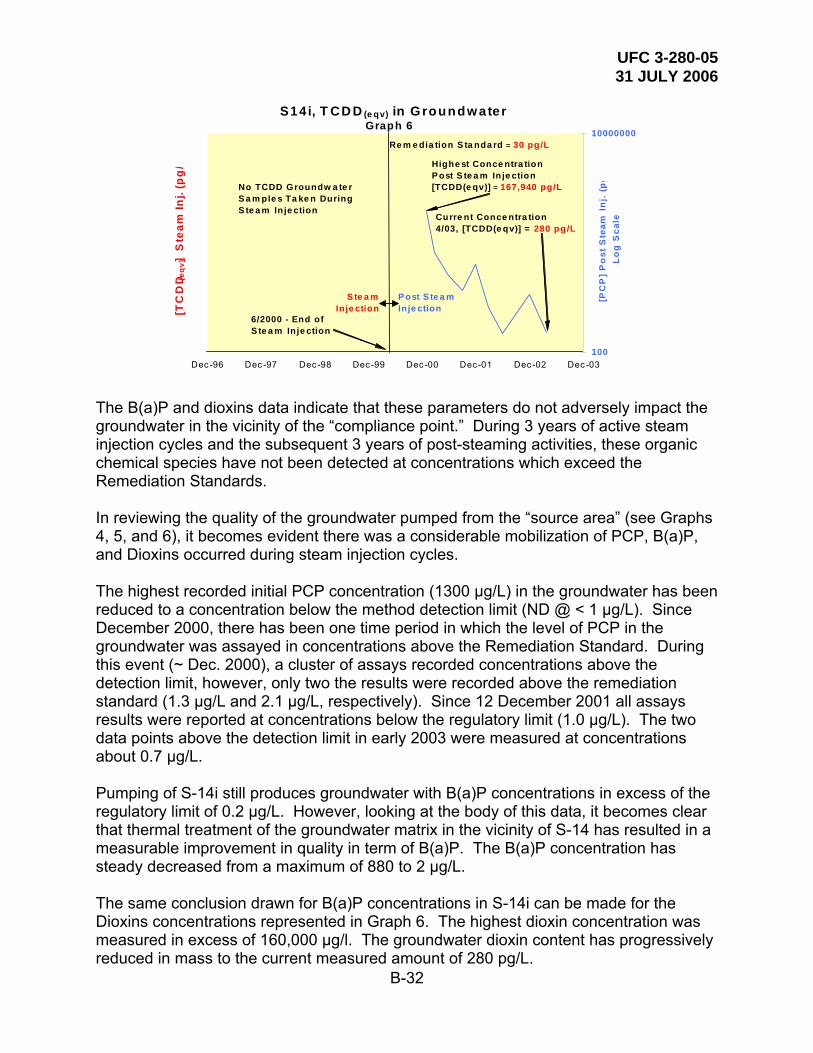
UFC 3-280-05 31 JULY 2006
B-32
S14i, T C D D (e qv) in G roundw ater
Dec -96 Dec -97 Dec-98 Dec-99 Dec-00 Dec-01 Dec-02 Dec-03
[TC
DD (e
qv)]
Ste
am In
j. (p
g/
100
10000000
[PC
P]
Po
st S
team
In
j. (
pg
Lo
g S
cale
6/2000 - End of S te a m Inje ction
Re m e dia tion S ta nda rd = 30 pg/L
S te a mInje ction
P ost S te a mInje ction
Graph 6
No TCDD Groundw a te r S a m ple s Ta ke n During S te a m In je ction
Highe st Conce ntra tionP ost S te a m In je ction[TCDD(e qv)] = 167,940 pg/L
Curre nt Conce ntra tion4/03, [TCDD(e qv)] = 280 pg/L
The B(a)P and dioxins data indicate that these parameters do not adversely impact the groundwater in the vicinity of the “compliance point.” During 3 years of active steam injection cycles and the subsequent 3 years of post-steaming activities, these organic chemical species have not been detected at concentrations which exceed the Remediation Standards. In reviewing the quality of the groundwater pumped from the “source area” (see Graphs 4, 5, and 6), it becomes evident there was a considerable mobilization of PCP, B(a)P, and Dioxins occurred during steam injection cycles. The highest recorded initial PCP concentration (1300 µg/L) in the groundwater has been reduced to a concentration below the method detection limit (ND @ < 1 µg/L). Since December 2000, there has been one time period in which the level of PCP in the groundwater was assayed in concentrations above the Remediation Standard. During this event (~ Dec. 2000), a cluster of assays recorded concentrations above the detection limit, however, only two the results were recorded above the remediation standard (1.3 µg/L and 2.1 µg/L, respectively). Since 12 December 2001 all assays results were reported at concentrations below the regulatory limit (1.0 µg/L). The two data points above the detection limit in early 2003 were measured at concentrations about 0.7 µg/L. Pumping of S-14i still produces groundwater with B(a)P concentrations in excess of the regulatory limit of 0.2 µg/L. However, looking at the body of this data, it becomes clear that thermal treatment of the groundwater matrix in the vicinity of S-14 has resulted in a measurable improvement in quality in term of B(a)P. The B(a)P concentration has steady decreased from a maximum of 880 to 2 µg/L. The same conclusion drawn for B(a)P concentrations in S-14i can be made for the Dioxins concentrations represented in Graph 6. The highest dioxin concentration was measured in excess of 160,000 µg/l. The groundwater dioxin content has progressively reduced in mass to the current measured amount of 280 pg/L.

UFC 3-280-05 31 JULY 2006
B-33
Observations over the past 60 months of the groundwater quality in other wells located at the site suggests B(a)P and Dioxins have not been mobilized to any degree beyond the original source area. The observations may not be entirely representative, however, the in the ensuing time period since the project initiation, the empirical observations of the groundwater quality have produced encouraging results and achieving the stated goals appears to be certain. Future Objectives: The compliance plan negotiated with the California EPA -Department of Toxic Substances Control calls for the demonstration of compliance at a point along the western boundary of the Visalia Pole Yard property. The “compliance point” will be three dedicated monitoring wells, which are scheduled for completion by 3rd quarter of 2003. Upon completion of these wells, SCE will enter into a regulatory demonstration phase to show compliance with the remediation standards as listed above. The details of the monitoring program and data reduction methods have yet to be determined and subsequently approved by DTSC. The EW-4 groundwater quality continues to improve, and as of May 2003, meets all of the regulatory objectives. Upon completion of the monitoring wells, SCE will continue with monthly assays of each of the wells. A representative data-base will be collected and a final decision will be made to discontinue the operation of the Visalia Water Treatment Plant. The water treatment plant will held in a “wet” standby status to insure a “back-up” remedy is available. The duration of the standby status of the water treatment plant has yet to be determined.

UFC 3-280-05 31 JULY 2006
Table B-1 Summary of Steam Injection Projects
Site � LLNL Gas Pad
Visalia Pole Yard
Lemoore NAS, CA
Alameda NAS, CA
DOE, Portsmouth, Ohio
Solvent Services, San Jose, CA
Lucent Technologies, Skokie, IL
AG Communication Systems, Northlake, IL
Amoco Minneapolis, MN
Status complete on-going full scale
full-scale cleanup completed
pilot project completed
pilot project completed
pilot project completed
Full scale cleanup completed
Full scale cleanup completed
Full scale cleanup completed
Target Chemicals gasoline creosote, PCP JP-5 TCE, diesel, motor oil TCE chlorinated
solvents TCE, TCA TCE, Mineral spirits Fuel Oil
Geology
sand, gravel, silt and clay (K=2E-4 to 5E-2 cm/sec)
sand, silt and sand/silt mixture (high pumping rates suggest K approx. 1E-1 cm/sec
silt and clay (shallow); sand (deeper, K=4E-3 to 1E-2 cm/sec)
fill, silty sand and clay
sand, gravel (K=5E-3 cm/sec), and shale
silt and clay (K10-5 to 10-
5 cm/s)
Fine sand, silt and clay (Clay Till – 10-9 cm/s; sand and Gravel 10-3 cm/s)
Clay till with sand and gravel seams Sand
Treated Depth Interval (ft, BGS) 70 to 155 80 to 100 10 to 20 3 to 10 <20 0 to 5 (est.) 5 to 21 ft 5 to 80 ft 5 to 18 ft
Water Table Depth (ft, BGS) 100 to 120 35 16 5.5 12 to 15 7ft 12 ft 14 ft
Saturated Zone? partial yes partial yes yes no Yes Yes Both vadose and saturated
Treated Area (acres) 0.3 3.6 0.2 0.08 0.5 0.002 3 acres 3 acres 3 acres
Treated Volume (cy) 45,333 115,000 6,296 933 <16,000 15 80,000 200,000 66,700
Duration Nov. 1992-Dec. 1993
June 1997-June 2000
July 5-Sept 23, 1994 20 days in 1999 4 months in
1999 140 hours in Aug. 1988 7 years 5 years 1 year
Containment Mechanism SVE SVE, Pumping
Wells SVE SVE SVE SVE Well point system, SVE
vacuum-enhanced GW pumping/SVE
GW pumping/SVE
Pumping Rate (water/vapor steam)
350 to 400 gpm groundwater, 2500 scfm vapor
260 scfm for vapor, 9 gpm for liquid
8-15 gpm water, 100-500 scfm vapors
3-5 gpm/250cfm/300lb/hr
8-10gpm/350cfm/450lb/hr
B-34

UFC 3-280-05 31 JULY 2006
Table B-1 Summary of Steam Injection Projects
Site � LLNL Gas Pad
Visalia Pole Yard
Lemoore NAS, CA
Alameda NAS, CA
DOE, Portsmouth, Ohio
Solvent Services, San Jose, CA
Lucent Technologies, Skokie, IL
AG Communication Systems, Northlake, IL
Amoco Minneapolis, MN
Number of Wells
23 (incl. 6 steam injection wells, 3 electrical heating wells, 3 extraction wells, 1 SVE well, and 10 MWs)
48 (11 injection, 8 extraction, 29 ERT and thermocouple )
31 (incl. 11 injection/extraction wells, 16 temperature monitoring wells, and 4 sample boreholes)
7 injection/extraction well clusters, 11 thermocouple wells, 11 sampling wells
24 wells + 23 sample boleholes
7
~115 well points, 15 thermistor, 96 steam inj., 115 vapor, 15 sampling wells
~120 gcombined vapor and GW recovery) 90 steam injection, 120 vapor, 8 thermocouple, gw extraction doubled as sampling
Well Spacing (ft) 25 57 17 <11 22 3.4 22 22
# Wells per Acre 70 14 155 >362 94 3,860 70 70
Mass Removed 115,000 lbs
1.3 million lb total -- 1 million lb in first 1.5 yr; 0.3 million lb in next 1.5 yr
>600 gals est. as approx. 80% of initial mass; 828 lb.
>146 kg >38,000 lbs >33,000 lbs
Volume Removed 7,600 gals gasoline
78,500 - 98,000 gal? (conflicting reports)
6.5 million liters of water extracted
Groundwater Concentration (Initial)
several thousands ppb benzene
>20,000 ppm <= 970 ppm TCE up to 8 ft of DNAPL
measured in wells Up to 3 ft of DNAPL measured in wells
Groundwater Concentration (Remediation Target)
CA MCLS: 1 ppb benzene; 680 ppb ethyl benzene; 1,750 total xylenes
IL Class II IL Class II
Groundwater Concentration (Final)
200-300 ppb benzene
<=2,300 ppb total creosote compounds
>20,000 ppm IL Class II IL Class II, one area exceeded
Soil Concentration 5,100 ppm 89,200 mg/kg
max. 1,600 approx. max. >1,000 ppm
B-35

UFC 3-280-05 31 JULY 2006
Table B-1 Summary of Steam Injection Projects
Site � LLNL Gas Pad
Visalia Pole Yard
Lemoore NAS, CA
Alameda NAS, CA
DOE, Portsmouth, Ohio
Solvent Services, San Jose, CA
Lucent Technologies, Skokie, IL
AG Communication Systems, Northlake, IL
Amoco Minneapolis, MN
(Initial) Soil Concentration (Remediation Target)
Soil Concentration (Final)
20,000 mg/kg max. 450 mg/kg
approx. max. IL Residential Criteria
Concentration In Extracted Vapor 1,100 ppm
total organics
50-600 lbs/hr vapor per well giving a total average 2,500 lbs/hr
Concentration In Extracted Condensate
10% of solubility
>7.8% JP5 (based on 0.76 gpm JP5 and 8.95 gpm water)
Temperature Achieved > 200 oF 280 o F max
(avg. 140oF)
100-140 oF in most extraction wells
max. approx. 107 oC 80 - 105o C
Soil - 84 to 104oF, Groundwater - 68 to 165oF
Electrical Power Requirement
Additional Findings
Dynamic Underground Stripping (DUS) =steam flushing+electric heating+electric resistance tomography (ERT)
Some soil still contaminated below treatment zone. Continuing to pump and treat and sparge without SVE.
No reduction in JP-5 conc. in sat'd. zone; vapor condensation incr. conc. in previously clean areas of unsat. zone.
4 co-located, pre- and post-treatment soil samples in "most contam. zone." results: 1 decr. by 60%, 2 incr., 1 NC.
Downward mobilization observed, post-treatment conc. in underlying low permeability zone higher than pre-treatment
Enhanced bioactivity achieved
Enhanced bioactivity achieved
B-36

UFC 3-280-05 31 JULY 2006
Table B-1 Summary of Steam Injection Projects
Site � LLNL Gas Pad
Visalia Pole Yard
Lemoore NAS, CA
Alameda NAS, CA
DOE, Portsmouth, Ohio
Solvent Services, San Jose, CA
Lucent Technologies, Skokie, IL
AG Communication Systems, Northlake, IL
Amoco Minneapolis, MN
conc.
Total Cost (U.S. dollar, Demonstrated)
$10.4 million $22.5 million $6.2 million $8M $4.9M
Cost/Unit Volume (U.S. dollar/cubic yard, Demonstrated)
$230/cy $197/cy >$390/cy $100/cy $15/cy
Total Cost (U.S. dollar, Vendor Estimate)
Est. future cost $6.4 million for "same site"
Cost/Unit Volume (U.S. dollar/cubic yard, Vendor Estimate)
$140/cy
Vendor LLNL/UCB Steam Tech Environmental Services
UCB/OHM Steam Tech Environmental Services
Steam Tech Environmental Services
SIVE Services ENSR ENSR SIVE
Vendor Comments/Status
Lucent Technologies/Bell Laboratories Patent
Lucent Technologies/Bell Laboratories Patent
Owner LLNL Southern California Edison
U.S. Navy U.S. Navy DOE Lucent Technologies AG Communication Systems
B-37
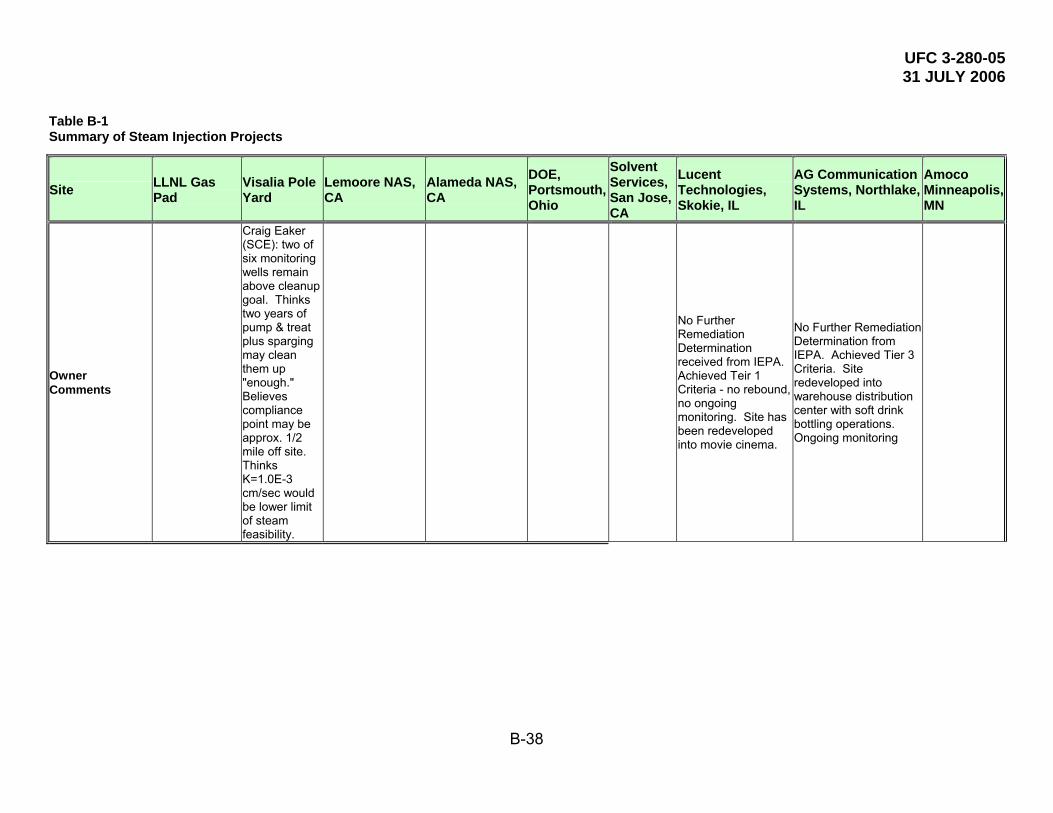
UFC 3-280-05 31 JULY 2006
B-38
Table B-1 Summary of Steam Injection Projects
Site � LLNL Gas Pad
Visalia Pole Yard
Lemoore NAS, CA
Alameda NAS, CA
DOE, Portsmouth, Ohio
Solvent Services, San Jose, CA
Lucent Technologies, Skokie, IL
AG Communication Systems, Northlake, IL
Amoco Minneapolis, MN
Owner Comments
Craig Eaker (SCE): two of six monitoring wells remain above cleanup goal. Thinks two years of pump & treat plus sparging may clean them up "enough." Believes compliance point may be approx. 1/2 mile off site. Thinks K=1.0E-3 cm/sec would be lower limit of steam feasibility.
No Further Remediation Determination received from IEPA. Achieved Teir 1 Criteria - no rebound, no ongoing monitoring. Site has been redeveloped into movie cinema.
No Further Remediation Determination from IEPA. Achieved Tier 3 Criteria. Site redeveloped into warehouse distribution center with soft drink bottling operations. Ongoing monitoring
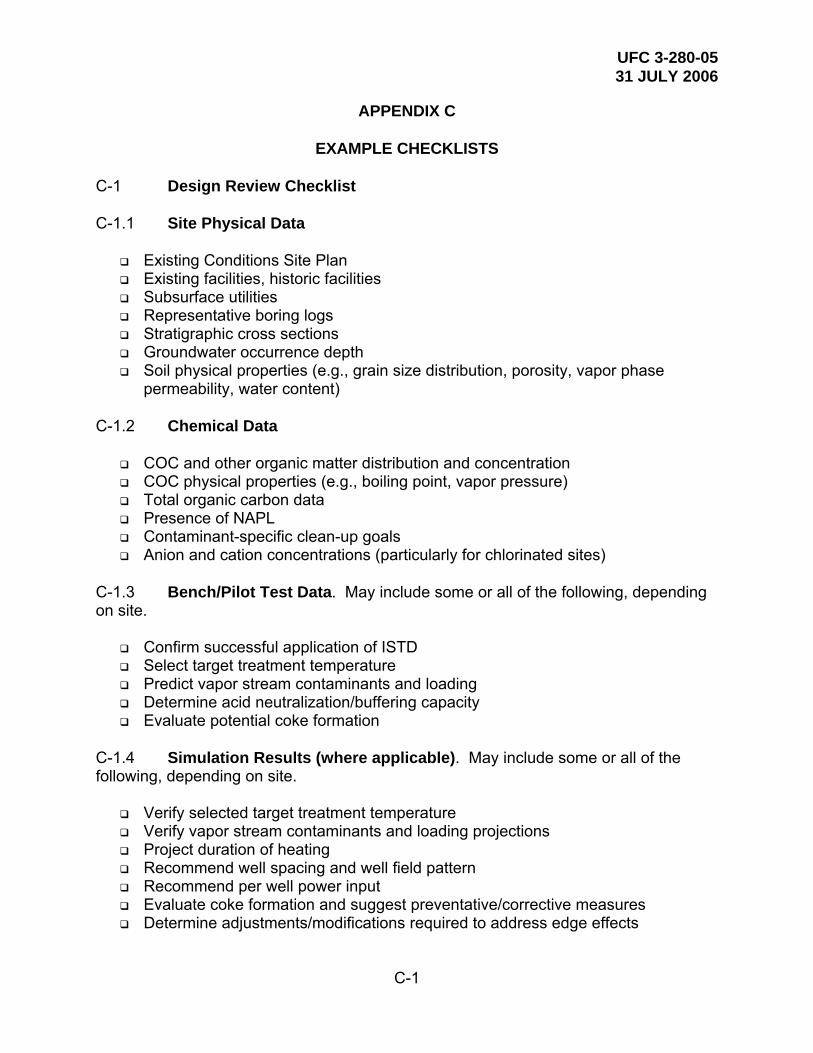
UFC 3-280-05 31 JULY 2006
C-1
APPENDIX C
EXAMPLE CHECKLISTS C-1 Design Review Checklist C-1.1 Site Physical Data
Existing Conditions Site Plan Existing facilities, historic facilities Subsurface utilities Representative boring logs Stratigraphic cross sections Groundwater occurrence depth Soil physical properties (e.g., grain size distribution, porosity, vapor phase
permeability, water content) C-1.2 Chemical Data
COC and other organic matter distribution and concentration COC physical properties (e.g., boiling point, vapor pressure) Total organic carbon data Presence of NAPL Contaminant-specific clean-up goals Anion and cation concentrations (particularly for chlorinated sites)
C-1.3 Bench/Pilot Test Data. May include some or all of the following, depending on site.
Confirm successful application of ISTD Select target treatment temperature Predict vapor stream contaminants and loading Determine acid neutralization/buffering capacity Evaluate potential coke formation
C-1.4 Simulation Results (where applicable). May include some or all of the following, depending on site.
Verify selected target treatment temperature Verify vapor stream contaminants and loading projections Project duration of heating Recommend well spacing and well field pattern Recommend per well power input Evaluate coke formation and suggest preventative/corrective measures Determine adjustments/modifications required to address edge effects

UFC 3-280-05 31 JULY 2006
C-2
C-1.5 Subsurface Design
Layout well field pattern over contaminated area(s) Design heater(s) to deliver required power Select controlled or controllerless heater elements Identify subsurface obstructions/conduits to be removed or plugged Detail heater elements Detail heater-only and heater-vacuum wells (coordinate with heater design) Calculate thermal expansion (heaters and wells) – cross check vs. details, revise
as needed Specify materials of construction and fabrication methods for thermal wells and
heaters Specify thermal well installation methods based on site data Specify location and configuration of well field temperature and pressure
monitoring points Evaluate need for groundwater control measures – design if required
C-1.6 Civil/Site Design
Evaluate/modify site grading to control runoff/run-on into treatment area Layout sediment and erosion control measures Layout site operations area (well field, off-gas treatment components, material
laydown area, decontamination area, job trailer/temporary facilities, water supply, etc.)
Design and detail surface seal/insulation – coordinate with simulation results and well details
Design and detail surface seal penetrations – coordinate with well and monitoring point details
C-1.7 Process Design
Estimate vapor production from thermal well field Develop Process Flow Diagram (PFD) Perform heat and material balance on process equipment Size and select off-gas treatment components Develop Piping and Instrumentation Diagram (P&ID) Develop control loops and interlocks Specify requirements for PLC program (where applicable) Select monitoring instrumentation Water or condensate treatment
C-1.8 Mechanical Design
Thermal design (total and rate of consumption) Layout vapor collection pipe manifold, incl. valves, expansion joints, etc. Calculate vapor conveyance piping sizes (head loss) Calculate pipe manifold thermal expansion, adjust layout as required

UFC 3-280-05 31 JULY 2006
C-3
Detail vapor conveyance piping manifold and supports Specify pipe materials of construction, incl. valves, expansion joints, etc. Calculate manifold pipe supplemental heat and insulation requirements Specify pipe heating measures and insulation requirements Design condensate collection and conveyance system (where applicable) Detail off-gas treatment system interconnecting piping
C-1.9 Electrical Design
Potential for presence of explosive vapors and fire hazards Consult with utility supplier regarding power availability Calculate well field circuits based on individual heater design Develop field wiring strategy to balance circuits Calculate manifold pipe heater electrical load, select heaters Calculate additional system loads (manifold pipe heating, motors, etc.) Specify main transformer size and power requirements Develop wiring strategy for off-gas treatment components (MCC or remote) Select variable frequency drives (VFDs) and/or soft-starts when appropriate Develop electrical one-line distribution diagram Select distribution panels/switchboards and breakers to accommodate design Specify over-current protection requirements, trip settings, etc. (include
allowances for continuous duty) Select well field and system component conductor and ground wire sizes
(account for voltage drop) Calculate emergency generator load, select generator and transfer switch Specify site lighting (night-time) requirements and select lights
C-1.10 Cost
Estimate material costs Estimate construction costs Estimate operating costs, including supplemental fuel for oxidizer and electricity Estimate decontamination and decommissioning costs Compare projected costs with budget allowance
C-2 CHECKLIST FOR REVIEW OF MODELS FOR IN SITU THERMAL DESTRUCTION/DESORBTION C-2.1 DOMAIN
Is the horizontal domain large enough to simulate stable background temperature and pressure conditions outside the treatment area?
Does the vertical domain extend far enough to include relevant influences such as soil caps, leaky lower aquifers, etc.
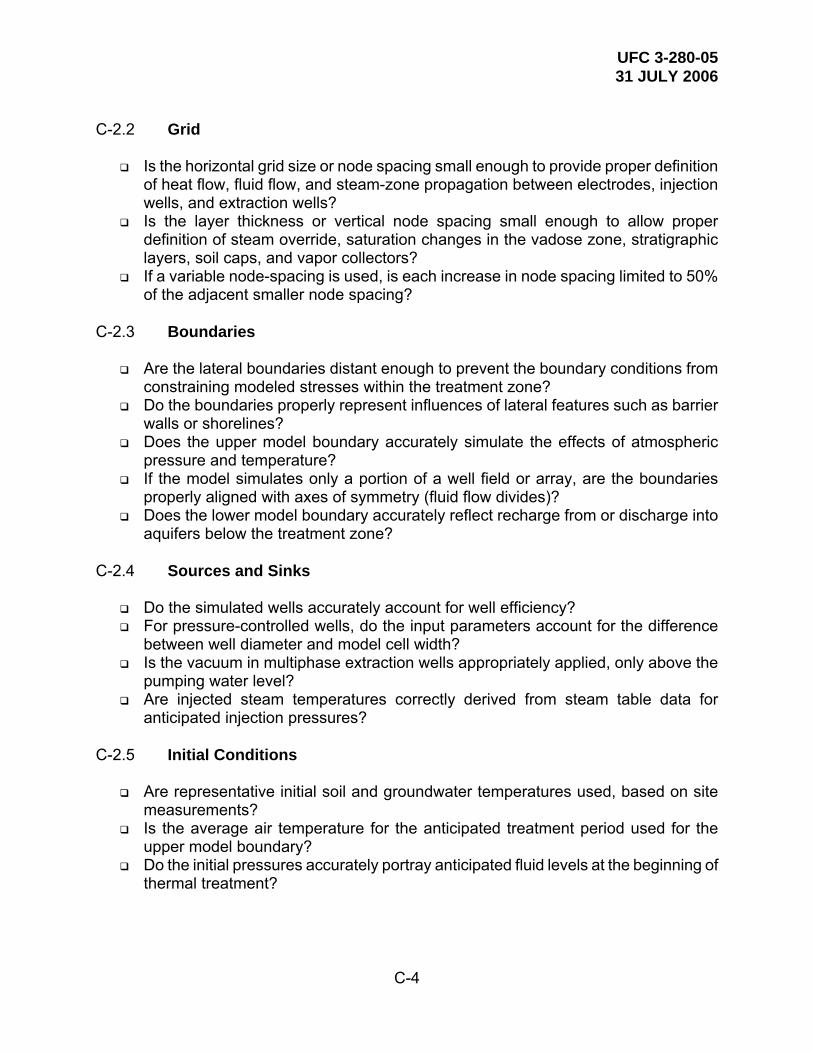
UFC 3-280-05 31 JULY 2006
C-4
C-2.2 Grid
Is the horizontal grid size or node spacing small enough to provide proper definition of heat flow, fluid flow, and steam-zone propagation between electrodes, injection wells, and extraction wells?
Is the layer thickness or vertical node spacing small enough to allow proper definition of steam override, saturation changes in the vadose zone, stratigraphic layers, soil caps, and vapor collectors?
If a variable node-spacing is used, is each increase in node spacing limited to 50% of the adjacent smaller node spacing?
C-2.3 Boundaries
Are the lateral boundaries distant enough to prevent the boundary conditions from constraining modeled stresses within the treatment zone?
Do the boundaries properly represent influences of lateral features such as barrier walls or shorelines?
Does the upper model boundary accurately simulate the effects of atmospheric pressure and temperature?
If the model simulates only a portion of a well field or array, are the boundaries properly aligned with axes of symmetry (fluid flow divides)?
Does the lower model boundary accurately reflect recharge from or discharge into aquifers below the treatment zone?
C-2.4 Sources and Sinks
Do the simulated wells accurately account for well efficiency? For pressure-controlled wells, do the input parameters account for the difference
between well diameter and model cell width? Is the vacuum in multiphase extraction wells appropriately applied, only above the
pumping water level? Are injected steam temperatures correctly derived from steam table data for
anticipated injection pressures? C-2.5 Initial Conditions
Are representative initial soil and groundwater temperatures used, based on site measurements?
Is the average air temperature for the anticipated treatment period used for the upper model boundary?
Do the initial pressures accurately portray anticipated fluid levels at the beginning of thermal treatment?

UFC 3-280-05 31 JULY 2006
C-5
C-2.6 Media Properties
If permeability data is obtained from hydraulic conductivity testing, have the proper conversions been made to obtain intrinsic permeability values for model input?
Has the vertical anisotropy of the soil materials been carefully evaluated and properly simulated? Steam propagation and override is sensitive to this parameter.
Is the proper conversion being made between wet versus dry thermal coefficients (heat capacity and conductivity), prior to model input, or in the model computations?
Does the model utilize appropriate thermal coefficients for the anticipated temperature range? Heat capacity and conductivity can both vary as much as 50% between ambient and operating temperatures.
Are representative pressure-saturation-permeability relationships used for the site soils.
C-2.7 Fluid Properties
Is the temperature-dependency of density and viscosity properly simulated for water liquid and vapor? Steam tables should be used for data input, or should be included in the numerical modeling code.
Is the temperature-dependency of density and viscosity properly simulated for NAPL? Input values for analytical solutions, or temperature-dependent coefficients for model input, need to be derived from available test data.
C-2.8 Contaminant Properties
Is the temperature-dependency of solubility and other partitioning coefficients accurately portrayed?
Are the effects of non-equilibrium partitioning adequately considered? Most modeling codes assume equilibrium, and the resulting uncertainty should be recognized during interpretation of the results.
Is the selection of pseudocomponents suitable for existing site contamination? Have the contaminants been grouped appropriately for combining into pseudocomponents (i.e. aliphatic compounds, halogenated hydrocarbons, high molecular weight PAH, low molecular weight PAH, etc.)?
C-2.9 System Operations
Is the anticipated operations strategy based on a consensus within the project team, and is it properly portrayed in the model?
Are the modeled well and electrode flows, pressures, and energy inputs within the capabilities of the existing or proposed energy conveyance and treatment systems?
Are allowances being made for potential system malfunctions, maintenance, and downtime?

UFC 3-280-05 31 JULY 2006
C-6
C-2.10 Uncertainties and Sensitivity
Are uncertainties in the model input values properly addressed? Sensitivity runs can be performed to test the effect of input values on model results.
Can the treatment strategy be altered to accommodate uncertainties in underground conditions? Reasonable maximum and minimum input values can be used in the model, to evaluate operational changes that might be required.
Can the energy conveyance and treatment systems be designed to allow for uncertainties in underground conditions? Model input values can be varied to establish ranges of flow rates, energy requirements, temperatures, or contaminant loads that the systems may need to accommodate.
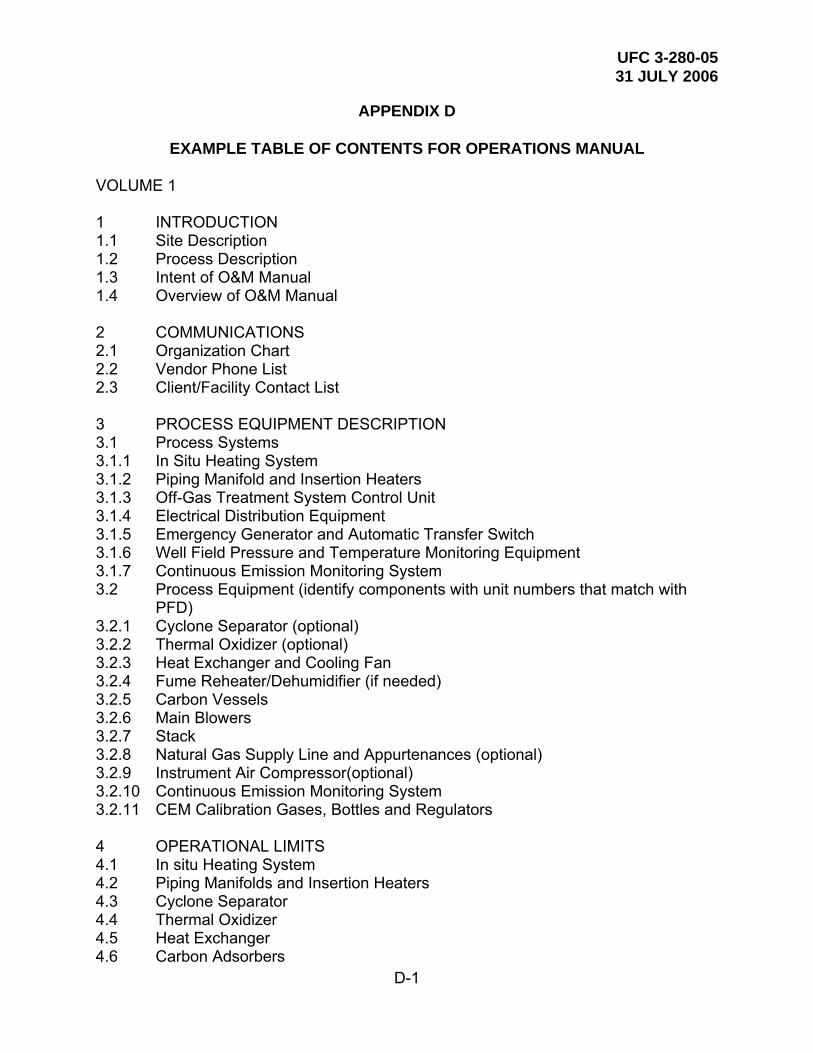
UFC 3-280-05 31 JULY 2006
D-1
APPENDIX D
EXAMPLE TABLE OF CONTENTS FOR OPERATIONS MANUAL VOLUME 1 1 INTRODUCTION 1.1 Site Description 1.2 Process Description 1.3 Intent of O&M Manual 1.4 Overview of O&M Manual 2 COMMUNICATIONS 2.1 Organization Chart 2.2 Vendor Phone List 2.3 Client/Facility Contact List 3 PROCESS EQUIPMENT DESCRIPTION 3.1 Process Systems 3.1.1 In Situ Heating System 3.1.2 Piping Manifold and Insertion Heaters 3.1.3 Off-Gas Treatment System Control Unit 3.1.4 Electrical Distribution Equipment 3.1.5 Emergency Generator and Automatic Transfer Switch 3.1.6 Well Field Pressure and Temperature Monitoring Equipment 3.1.7 Continuous Emission Monitoring System 3.2 Process Equipment (identify components with unit numbers that match with
PFD) 3.2.1 Cyclone Separator (optional) 3.2.2 Thermal Oxidizer (optional) 3.2.3 Heat Exchanger and Cooling Fan 3.2.4 Fume Reheater/Dehumidifier (if needed) 3.2.5 Carbon Vessels 3.2.6 Main Blowers 3.2.7 Stack 3.2.8 Natural Gas Supply Line and Appurtenances (optional) 3.2.9 Instrument Air Compressor(optional) 3.2.10 Continuous Emission Monitoring System 3.2.11 CEM Calibration Gases, Bottles and Regulators 4 OPERATIONAL LIMITS 4.1 In situ Heating System 4.2 Piping Manifolds and Insertion Heaters 4.3 Cyclone Separator 4.4 Thermal Oxidizer 4.5 Heat Exchanger 4.6 Carbon Adsorbers
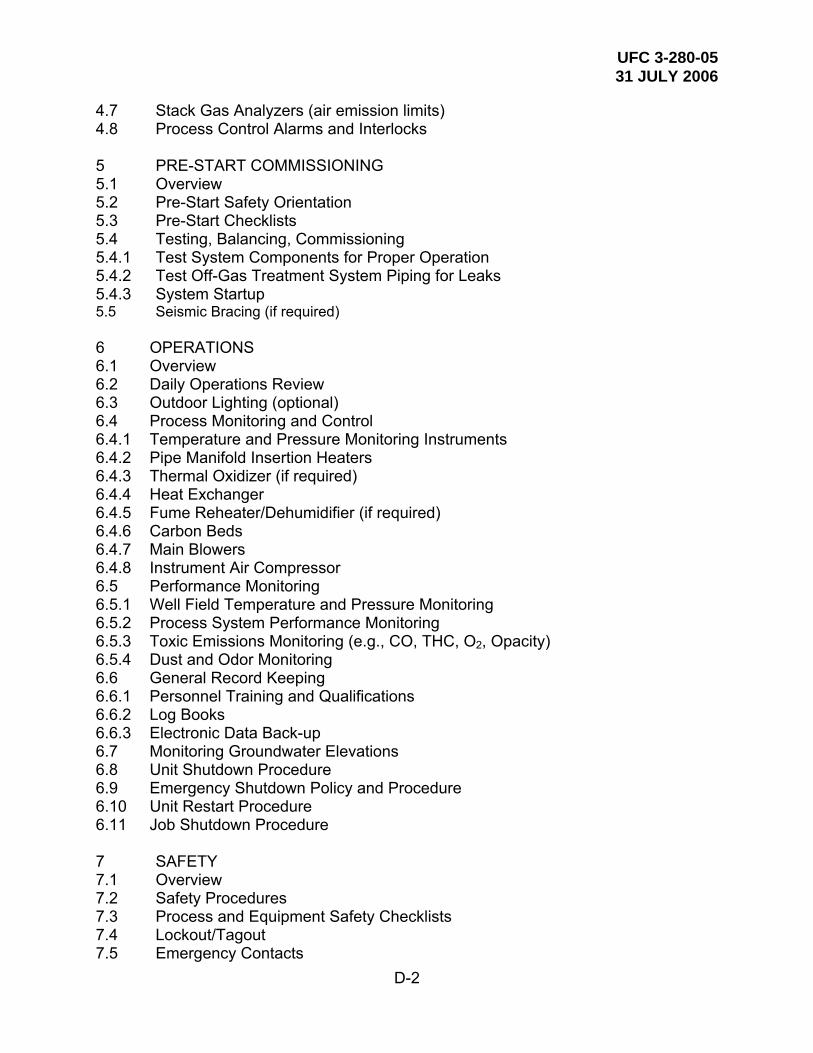
UFC 3-280-05 31 JULY 2006
D-2
4.7 Stack Gas Analyzers (air emission limits) 4.8 Process Control Alarms and Interlocks 5 PRE-START COMMISSIONING 5.1 Overview 5.2 Pre-Start Safety Orientation 5.3 Pre-Start Checklists 5.4 Testing, Balancing, Commissioning 5.4.1 Test System Components for Proper Operation 5.4.2 Test Off-Gas Treatment System Piping for Leaks 5.4.3 System Startup 5.5 Seismic Bracing (if required) 6 OPERATIONS 6.1 Overview 6.2 Daily Operations Review 6.3 Outdoor Lighting (optional) 6.4 Process Monitoring and Control 6.4.1 Temperature and Pressure Monitoring Instruments 6.4.2 Pipe Manifold Insertion Heaters 6.4.3 Thermal Oxidizer (if required) 6.4.4 Heat Exchanger 6.4.5 Fume Reheater/Dehumidifier (if required) 6.4.6 Carbon Beds 6.4.7 Main Blowers 6.4.8 Instrument Air Compressor 6.5 Performance Monitoring 6.5.1 Well Field Temperature and Pressure Monitoring 6.5.2 Process System Performance Monitoring 6.5.3 Toxic Emissions Monitoring (e.g., CO, THC, O2, Opacity) 6.5.4 Dust and Odor Monitoring 6.6 General Record Keeping 6.6.1 Personnel Training and Qualifications 6.6.2 Log Books 6.6.3 Electronic Data Back-up 6.7 Monitoring Groundwater Elevations 6.8 Unit Shutdown Procedure 6.9 Emergency Shutdown Policy and Procedure 6.10 Unit Restart Procedure 6.11 Job Shutdown Procedure 7 SAFETY 7.1 Overview 7.2 Safety Procedures 7.3 Process and Equipment Safety Checklists 7.4 Lockout/Tagout 7.5 Emergency Contacts
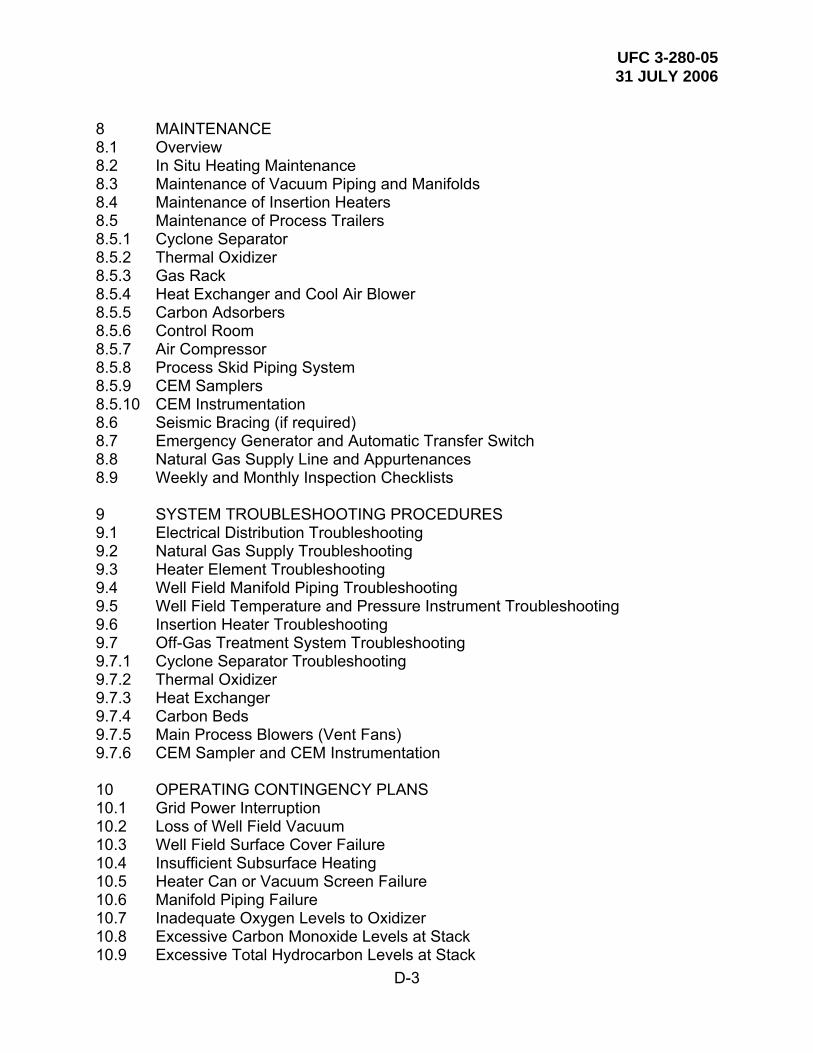
UFC 3-280-05 31 JULY 2006
D-3
8 MAINTENANCE 8.1 Overview 8.2 In Situ Heating Maintenance 8.3 Maintenance of Vacuum Piping and Manifolds 8.4 Maintenance of Insertion Heaters 8.5 Maintenance of Process Trailers 8.5.1 Cyclone Separator 8.5.2 Thermal Oxidizer 8.5.3 Gas Rack 8.5.4 Heat Exchanger and Cool Air Blower 8.5.5 Carbon Adsorbers 8.5.6 Control Room 8.5.7 Air Compressor 8.5.8 Process Skid Piping System 8.5.9 CEM Samplers 8.5.10 CEM Instrumentation 8.6 Seismic Bracing (if required) 8.7 Emergency Generator and Automatic Transfer Switch 8.8 Natural Gas Supply Line and Appurtenances 8.9 Weekly and Monthly Inspection Checklists 9 SYSTEM TROUBLESHOOTING PROCEDURES 9.1 Electrical Distribution Troubleshooting 9.2 Natural Gas Supply Troubleshooting 9.3 Heater Element Troubleshooting 9.4 Well Field Manifold Piping Troubleshooting 9.5 Well Field Temperature and Pressure Instrument Troubleshooting 9.6 Insertion Heater Troubleshooting 9.7 Off-Gas Treatment System Troubleshooting 9.7.1 Cyclone Separator Troubleshooting 9.7.2 Thermal Oxidizer 9.7.3 Heat Exchanger 9.7.4 Carbon Beds 9.7.5 Main Process Blowers (Vent Fans) 9.7.6 CEM Sampler and CEM Instrumentation 10 OPERATING CONTINGENCY PLANS 10.1 Grid Power Interruption 10.2 Loss of Well Field Vacuum 10.3 Well Field Surface Cover Failure 10.4 Insufficient Subsurface Heating 10.5 Heater Can or Vacuum Screen Failure 10.6 Manifold Piping Failure 10.7 Inadequate Oxygen Levels to Oxidizer 10.8 Excessive Carbon Monoxide Levels at Stack 10.9 Excessive Total Hydrocarbon Levels at Stack
UFC 3-280-05 31 JULY 2006
D-4
10.10 Excessive Toxic Emissions (if source testing is required) 10.11 Heater Element Failure 10.12 Heat Exchanger Failure 10.13 Main Blower (Vent Fan) Failure 10.14 Thermal Oxidizer Overheat 10.15 Thermal Oxidizer Shutdown APPENDICES Appendix A: Checklists VOLUME 2 Vendor Manuals and Product Data Sheets

UFC 3-280-05 31 JULY 2006
Glossary-1
GLOSSARY AND LIST OF ACRONYMS
AC alternating current AIME American Institute of Mining Engineers AQC Air Quality Control ARAR Applicable or Relevant and Appropriate Requirements ASIL ambient source impact level BACT best available control technology bgs below ground surface BTU British Thermal Unit CEGS Corps of Engineers Guide Specification (now superseded by
UFGS) CEM Continuous Emission Monitoring CERCLA Comprehensive Environmental Response Compensation
Liability Act cfm cubic feet per minute CFR Code of Federal Regulations COC compound (contaminant or constituent) of concern cy cubic yard DAF dissolved air flotation dB decibels dBA time weighted average decibel reading DCE (cis or trans)-1,2-dichloroethene DNAPL dense non-aqueous phase liquid DNT 2,4 and 2,6-dinitrotoluene DO dissolved oxygen DOE Department of Energy DTS Distributed Temperature Sensors DTW depth to water DUS Dynamic Underground Stripping EM Engineer Manual EPA Environmental Protection Agency ERH electrical resistivity heating (three or six phase) ERT Electrical Resistance Tomography FID flame Ionization detector FOA Field Operating Activities GAC granular activated carbon GC gas chromatograph GC/MS gas chromatograph/mass spectrometer gpm gallons per minute GW groundwater
UFC 3-280-05 31 JULY 2006
Glossary-2
HDPE high density polyurethane HMX octahydro-1,3,5,7-tetranitro-1,3,5,7-tetrazocine HPO hydrous pyrolysis oxidation HQUSACE Headquarters, US Army Corps of Engineers HTRW Hazardous, Toxic, and Radioactive Waste IDT Indefinite Delivery Type IFB Invitation for Bid IP interface probe IPTD in-pile thermal destruction ISTD In Situ Thermal Desorption, or In Situ Thermal Destruction ISTR In Situ Thermal Remediation ISV In Situ Vitrification IUPAC International Union of Pure and Applied Chemistry KW-hr kilowatt-hours Ldn Day-night level LNAPL light non-aqueous phase liquid mA milliamps MCC Motor Control Center MCL Maximum Contaminant Limit mg/l milligrams per liter MSC Major Subordinate Commands NA not applicable NAPL non-aqueous phase liquid NCP National Contingency Plan NEC National Electrical Code NFESC Naval Facilities Engineering Center NFPA National Fire Prevention Association NIST National Institute of Standards and Technology O&M Operations and Maintenance OSHA Occupational Safety and Health Administration P&ID process and instrumentation diagram PAH polynuclear aromatic hydrocarbon PCB polychlorinated biphenyl PCDD polychlorinated dibenzodioxin PCE perchloroethene PCP pentachlorophenol PCU power control unit PFD process flow diagram PID photoionization detector PLC programmable logic controller PMP pressure monitoring point

UFC 3-280-05 31 JULY 2006
Glossary-3
PSCAA Puget Sound Clean Air Agency QA/QC quality assurance/quality control RAO remedial action objectives RDX hexahydro-1,3,5,7-trinitro-1,3,5,7-triazine RF Radio Frequency RFP Request for Proposal ROD Record of Decision ROST® Rapid Optical Screening Tool* SAC spent activated carbon SCAPS Site Characterization Analysis Penetrometer System SCR silicon controlled rectifier SEE Steam Enhanced Extraction SOP Standard Operating Procedure SSHP Site Safety and Health Plan SVE soil vapor extraction SVOC semi-volatile organic compounds TBD to be determined TC thermocouple TCA 1,1,1-trichloroethane TCE trichloroethene TCH thermal conductive heating TCLP Toxicity Characteristic Leaching Procedure TDS total dissolved solids TDR Time Domain Reflectometry THC total halogenated compounds TMP temperature monitoring point TMS temperature monitoring sensor TNT 2,4,6-trinitrotoluene TOC total organic carbon TPH total petroleum hydrocarbon TSS total suspended solids TTZ treatment target zone UFC Unified Facilities Criteria UFGS Unified Facilities Guide Specifications USACE US Army Corps of Engineers VAC Volts, alternating current VFD variable frequency drive VOC volatile organic compound VR vapor recovery
* Registered trademark of Loral Corporation

UFC 3-280-05 31 JULY 2006
Glossary-4
VTF Vogel-Tammer-Fulcher equation WLI water level indicator