Embed Size (px)
Citation preview

Technical Report Documentation Page 1. Report No.
FHWA/TX-02/4064-1
2. Government Accession No.
3. Recipient's Catalog No.
5. Report Date
September 2001
4. Title and Subtitle
DESIGN GUIDELINES FOR PASSING LANES ON TWO-LANE ROADWAYS (SUPER 2)
6. Performing Organization Code
7. Author(s)
Mark D. Wooldridge, Carroll J. Messer, Barry D. Heard, Selvam Raghupathy, Angelia H. Parham, Marcus A. Brewer, and Sangsoo Lee
8. Performing Organization Report No.
Report 4064-1
10. Work Unit No. (TRAIS)
9. Performing Organization Name and Address
Texas Transportation Institute The Texas A&M University System College Station, Texas 77843-3135
11. Contract or Grant No.
Project No. 0-4064 13. Type of Report and Period Covered
Research: September 2000-August 2001
12. Sponsoring Agency Name and Address
Texas Department of Transportation Research and Technology Implementation Office P. O. Box 5080 Austin, Texas 78763-5080
14. Sponsoring Agency Code
15. Supplementary Notes
Research performed in cooperation with the Texas Department of Transportation, and the U.S. Department of Transportation, Federal Highway Administration. Research Project Title: Design Criteria for Improved Two-Lane Section (Super 2) 16. Abstract
The use of periodic, short-term passing lanes is known in Texas as a “Super 2” design. The passing lanes may be alternating or side-by-side, but they are placed at regular intervals. Passing lanes are often constructed on two-lane roadways to improve overall traffic operations by breaking up traffic platoons and by reducing delays caused by inadequate passing opportunities over substantial lengths of roadway. During the recent design of several “Super 2” projects, questions arose in three areas:
1) optimum passing lane length and spacing, 2) shoulder width requirements, and 3) optimum signing and driver information (pavement marking, etc.) strategies.
The objective of this project was to develop Super 2 design criteria in a format suitable for inclusion in the TxDOT Roadway Design Manual. Site evaluations were conducted in Texas, Kansas, and Minnesota, including before-and-after studies of driver behavior for variations in pavement markings. A hypothetical two-lane, two-way rural highway with varying length and spacing of passing lanes was simulated under a variety of traffic mixes and two-way traffic volumes. Additionally, laptop-based surveys were conducted to determine driver reaction to various passing lane spacings, wording on related signs, shoulder widths, and pavement markings entering a passing lane section. Recommendations for the TxDOT Roadway Design Manual were developed based upon these activities. 17. Key Words
Two-lane Highway, Passing Lane, Signs, Taper Length, Shoulder Widths, Super 2, Pavement Markings
18. Distribution Statement
No restrictions. This document is available to the public through NTIS: National Technical Information Service 5285 Port Royal Road Springfield, Virginia 22161
19. Security Classif.(of this report)
Unclassified
20. Security Classif.(of this page)
Unclassified
21. No. of Pages
106
22. Price
Form DOT F 1700.7 (8-72) Reproduction of completed page authorized


DESIGN GUIDELINES FOR PASSING LANES ON TWO-LANE ROADWAYS (SUPER 2)
by
Mark D. Wooldridge, P.E. Associate Research Engineer Texas Transportation Institute
Carroll J. Messer, Ph.D., P.E.
Research Engineer Texas Transportation Institute
Barry D. Heard, P.E. Graduate Research Assistant
Texas Transportation Institute
Selvam Raghupathy, E.I.T. Former Graduate Research Assistant
Texas Transportation Institute
Angelia H. Parham, P.E. Assistant Research Engineer
Texas Transportation Institute
Marcus A. Brewer, E.I.T. Assistant Transportation Researcher
Texas Transportation Institute
Sangsoo Lee, Ph.D. Formerly Post Doctoral Research Associate
Texas Transportation Institute
Report 4064-1 Project Number 0-4064
Research Project Title: Design Criteria for Improved Two-Lane Section (Super 2)
Sponsored by the Texas Department of Transportation
In Cooperation with the U.S. Department of Transportation Federal Highway Administration
September 2001
TEXAS TRANSPORTATION INSTITUTE
The Texas A&M University System College Station, Texas 77843-3135


v
DISCLAIMER
The contents of this report reflect the views of the authors, who are responsible for the opinions, findings, and conclusions presented herein. This project was conducted in cooperation with the U.S. Department of Transportation, Federal Highway Administration (FHWA). The contents do not necessarily reflect the official views or policies of the Federal Highway Administration or the Texas Department of Transportation (TxDOT). This report does not constitute a standard, specification, or regulation and is not intended for construction, bidding, or permit purposes. The engineer in charge of the project was Mark D. Wooldridge (TX-65791).

vi
ACKNOWLEDGMENTS The authors would like to thank the project director, Marty Smith, and the project coordinators, David Casteel and Walter McCollough, for providing valuable insight to the research team throughout the project. The authors would also like to thank the project monitoring committee members: Michael Chacon, Doug Eichorst, George Gold, Bobby Littlefield, Gary Mizer, and Randy Redmond. This study was performed in cooperation with the Texas Department of Transportation and the Federal Highway Administration. The authors would also like to thank the Texas Department of Transportation, the Minnesota Department of Transportation, and the Kansas Department of Transportation for their cooperation and assistance in data collection and in providing copies of plans for the design of passing lane sections.

vii
TABLE OF CONTENTS CHAPTER 1 Background .................................................................................................................1 Project Goal and Issues......................................................................................2 2 Site Visits and Data Collection ...................................................................................5 Site Selection .....................................................................................................5 Data Collection ..................................................................................................5 Data Reduction...................................................................................................7
3 Driver Surveys...........................................................................................................11 Previous Surveys..............................................................................................11 Objectives ........................................................................................................12 Survey Development and Administration........................................................12 Summary of Survey Questions and Responses................................................13 Summary..........................................................................................................32
4 Length and Spacing of Passing Lanes ......................................................................35 Background ......................................................................................................35 Measures of Operational Performance.............................................................38 Design Guidelines............................................................................................39 Microscopic Simulation ...................................................................................42 Measure of Operational Performance Selected................................................44 Experimental Setup..........................................................................................44 Results..............................................................................................................45 Recommendations............................................................................................48
5 Lane and Shoulder Widths........................................................................................51 Introduction and Safety Issues .........................................................................51 Driver Surveys .................................................................................................52 Existing Recommendations for Lane and Shoulder Widths ............................52 Project Recommendations ...............................................................................55 6 Signing and Marking.................................................................................................57 Signs.................................................................................................................57 Survey Findings ...............................................................................................66 Markings ..........................................................................................................67 Recommendations............................................................................................84 7 Recommendations.....................................................................................................85 Length and Spacing of Passing Lanes .............................................................85 Lane and Shoulder Widths...............................................................................86 Signs and Pavement Markings.........................................................................86 References.................................................................................................................91

viii
Appendix: Data Worksheets .................................................................................. A-1

1
CHAPTER 1
BACKGROUND
Many of Texas’ highways are two-lane roadways and will remain so for the foreseeable
future. As volumes increase, motorist satisfaction and traffic performance on those roadways
will decrease. The traditional answer to these problems, provision of a four-lane roadway,
appears to be out of reach for many of these facilities due to fiscal constraints.
An alternative approach is to provide lower-cost improvements on existing two-lane rural
roads, thereby upgrading a larger number of roadways. Both United States and international
research and experience have shown that the provision of passing lanes, turning lanes, localized
alignment improvements, and other relatively low-cost measures can be highly cost effective in
improving both traffic operations and safety on existing two-lane rural roads. These options are
also most appropriate for roads with lower traffic volumes that may not warrant major
improvement projects and on recreational or other routes with high seasonal demand (1). Passing
lanes are one of the most effective methods of improving the level of service on a two-lane
roadway because they increase passing opportunities and provide smoother traffic operations
with fewer vehicle-vehicle conflicts (2). Passing lanes allow motorists the opportunity to safely
and easily pass slower vehicles, improving traffic flow at a much lower cost than a traditional
expansion to four lanes. Additionally, safety evaluations have shown that passing lanes and
short four-lane sections reduce accident rates below the levels found on conventional two-lane
highways (3).
The distinction should be made between passing lanes and climbing lanes. Although the
purpose of each is to reduce platooning of traffic behind slower moving vehicles, the design
principles employed are inherently different from one another. The design objectives used in the
construction of a climbing lane are different because there is a desire to eliminate platooning due
to a significant change in grade: the size and length of the grade change directs the design. The
design objectives for a passing lane are to disperse platoons and improve traffic operations
through the provision of enhanced passing opportunities along a roadway corridor.
The location of an added lane should appear logical to the driver. The value of passing
lanes is more obvious in locations where passing sight distance is short than in areas that may

2
provide passing opportunities without passing lanes. When locating a passing lane, designers
should recognize the need for adequate sight distance at the lane addition and lane drop tapers.
The selection of an appropriate location also needs to consider the presence of intersections and
high-volume driveways in order to minimize the volume of turning movements on a road section
where passing is encouraged. Also, physical constraints such as bridges and culverts should be
avoided if they restrict provision of a continuous shoulder (4).
PROJECT GOAL AND ISSUES
The use of periodic, short-term passing lanes is known in Texas as a “Super 2” design.
The passing lanes may be alternating or side by side but they occur at regular intervals. They are
often constructed on two-lane roadways to improve overall traffic operations by breaking up
traffic platoons and reducing delays caused by inadequate passing opportunities over substantial
lengths of roadway. Passing lanes on a two-lane roadway are often much more cost effective for
providing passing opportunities than continuous four-lane sections because locations with high
construction costs (e.g., major earthwork, expensive structures) can be avoided (1).
The goal of TxDOT Project 0-4064 was to develop reliable, appropriate, and defensible
design guidelines that can be used to design Super 2 roadways, addressing the following design
issues:
• optimum passing lane length and spacing,
• shoulder width requirements, and
• optimum signing and driver information (pavement marking, etc.) strategies.
Traffic characteristics such as volume, truck percentage, headway, and operating speed
are important variables in addressing the preceding issues. However, it is also necessary to
evaluate the driver’s perception of and reaction to the potential changes in design. This is
especially important when determining the proper signing and markings both at and in advance
of the passing lane and at the entry and exit tapers.
Previous research and other trial projects have indicated that there are some general
guidelines that can be used to establish an effective passing lane design. Researchers built upon

3
those general guidelines to develop guidelines specific to Texas traffic patterns, laws, and
driving behavior. Researchers used site visits, field studies, driver surveys, and literature
reviews to develop these guidelines.


5
CHAPTER 2
SITE VISITS AND DATA COLLECTION SITE SELECTION
Researchers visited existing passing lane sites in order to gain first-hand knowledge of
how “Super 2” sections operate, to personally view installed designs with signing and marking
details, and to collect data on operating speeds, distribution of trucks, lane splits, and headways.
Researchers chose sites in two states: Kansas and Minnesota. These states were chosen
for several reasons. First, both states have done significant research on “Super 2 designs,” and
they had addressed some of the questions posed in this project. Second, department of
transportation (DOT) personnel in these states provided extensive information and support for
the project and were interested in cooperating with the researchers on their visits. Third, the
DOT personnel were able to help identify the necessary number of appropriate sites to visit in a
timely manner.
Researchers looked for several characteristics in selecting the study sites. There were a
number of similarities between the sites: for example, sites in both states had a side-by-side
design with a predominantly straight alignment over level terrain. However, there were some
differences between the sites as well. Sites in Kansas tended to be more rural than sites in
Minnesota, and the Kansas sites had a higher percentage of trucks in the traffic stream. Sites in
both states were selected with a minimal number of driveways and intersections within the
passing lane section, but sites in Minnesota had more access points than those in Kansas. The
Kansas sites were relatively new, having been installed in the last few years, while the Minnesota
sites had been in existence for much longer. Also, passing lane sections in Minnesota tended to
be longer than those in Kansas.
DATA COLLECTION After selecting the sites for field visits, researchers gathered as much information as
possible about the layout and alignment of the site from maps and through contact with local
DOT officials. At each site, researchers drove through the site several times to become
acquainted with the terrain, roadside development, entry and exit taper configurations, signing,

6
and striping. They chose positions beyond the edge of the roadway to observe traffic and record
passing data. Researchers also obtained permission from landowners to be positioned at those
locations where necessary.
At the beginning of each study day, researchers set out road tubes and traffic counters at
four locations along a passing lane section: 500 ft upstream of the entry taper for the passing
lane, 500 ft downstream of the entry taper for the passing lane, 500 ft downstream of the exit
taper for the passing lane, and 1 mile downstream of the passing lane. These counters and tubes
were used for a continuous six-hour period each day. A measuring wheel was used to measure
necessary distances for sensor placement, section lengths, and lane and shoulder widths. The
sensor tubes were fixed in place using fastener plates that were nailed into the pavement and
reinforced by tape if necessary. The counters were then initialized and activated to record speed
and headway data.
Two researchers positioned themselves off of the roadway to count the number of passes
that occurred during the six-hour period while the counters were recording data. For the duration
of the study period, these observers were sitting inside their respective vehicles, which were
parked on a side road, a driveway, or a turnaround area. The vehicles were standard rental fleet
vehicles, chosen to blend in with the local traffic stream and to avoid being mistaken for law
enforcement vehicles. The vehicles were also parked as to appear to be either unoccupied or
vehicles that were waiting to turn out onto the road being studied. The researchers were
positioned so that the entire length of the passing lane section was within their view.
The researchers observed vehicles traveling through the passing lane section and
recorded the number and type of passes that occurred within each 15-minute period of the six-
hour study period. The type of pass was classified as follows: car passing car, car passing truck,
truck passing car, and truck passing truck. A “car” was defined as a passenger vehicle, which
included pickup trucks, sport utility vehicles, and minivans. A “truck” was generally defined as
a cargo/freight vehicle, which included semi-trailer combinations, bread trucks, and shipping
trucks. A “pass” was defined as a vehicle that begins the passing lane section behind another
vehicle but concludes the section completely in front of the other vehicle.
At Minnesota sites, one researcher also set up a video camera to record the movements of
vehicles entering the passing lane section. The video was also recorded for six hours, and tapes

7
were viewed during data reduction to count the number of vehicles that entered each lane at the
beginning of the passing lane section.
While two researchers observed traffic and recorded passing data, a third researcher
completed the site characteristics data worksheet developed for this project. A sample worksheet
is shown in Appendix A. Completion of the worksheet involved measuring length of entry and
exit tapers, length of passing lanes, and width of lanes and shoulders; determining positions of
signs and striping treatments within the section; counting access points (driveways and
intersections) within the section; determining the roadside environment; and taking pictures of
the site, signing, and striping. Researchers also made a drive-through video of each site,
videotaping the driver’s view of the site through the front windshield in each direction. The
video also includes narration of mile-points, observation sites, and other significant features of
the site.
At the end of the six-hour study period, the researchers stopped the counters and
disconnected them from the sensor tubes. At sites where data collection occurred for two
consecutive days, the sensor tubes were left attached to the pavement overnight, while the
counters were stored and then reconnected the following day. When data collection was
completed at a site, the sensor tubes were also removed from the pavement. The exposure time
of personnel on the roadway was primarily limited to the installation and removal of road tubes
and counters with some brief periods for taking measurements and pictures.
DATA REDUCTION
The data from the counters were stored in text files which were converted to spreadsheets
for further reduction and analysis. The counters collected the following information on each
vehicle: speed, headway, number of axles, direction, and time stamp. The counter also collected
15-minute vehicle counts. In raw format, headway was recorded in units of thousandths of a
second, so headways were multiplied by 1000 to obtain whole seconds. Table 1 is a sample of
counter data, converted to spreadsheet format.

8
Table 1. Sample of Formatted Counter Data. DD/MM/YY HH:MM:SS Array Flow Veh No Hdwy Spd Axles
28/11/00 10:14:33 1 + 44 4.985 68 2 28/11/00 10:14:48 1 + 45 15.000 68 2 28/11/00 10:15:12 1 + 1 24.011 63 5
After each set of data was formatted, a total vehicle count was made, and the minimum,
maximum, average, and standard deviation of headway, speed, and axles was calculated for the
entire set.
For the counters placed inside the passing lane section to collect data for two lanes,
another step was necessary to format the data. In order to make calculations and analysis easier,
the data from the two lanes had to be split into separate sets of columns within the spreadsheet.
In the unformatted data, Lane 2 data were offset by one column, with a flow value of 2. All such
data were then shifted within the spreadsheet to create two sets of data columns. Thus, the lane
split format had the same columns as in Table 1, containing the data for Lane 1, but the last four
columns were repeated to provide space for data from Lane 2. A sample of lane split data is
shown in Table 2.
Table 2. Sample of Formatted Lane Split Data.
Lane 1 Lane 2 DD/MM/YY HH:MM:SS Array Flow Veh No Hdwy Spd Axles Veh No Hdwy Spd Axles
28/11/00 10:13:04 1 + 40 7.988 64 5 28/11/00 10:13:06 1 2 + 41 11.619 68 5 28/11/00 10:13:09 1 + 42 4.992 67 2
As with the single lane data, a total vehicle count for each lane was made, and the
minimum, maximum, average, and standard deviations of headway, speed, and axles in each lane
were calculated.
The data were then reduced into platoons by comparing the headway values between
vehicles. A vehicle was defined as being in a platoon if the headway between it and a preceding
or succeeding vehicle in the same lane was 5 seconds or less. Blank rows were inserted into the
spreadsheet between platoons to separate them visually. Then, for each platoon, the following
values were calculated: average headway, speed, and number of axles for all trailing vehicles in
the platoon; the number of trailing vehicles; the speed and number of axles for the lead vehicle;
and the total headway, speed, and number of axles for all trailing vehicles. Based upon these
values, it was possible to calculate the minimum, maximum, average, and standard deviation for

9
the headway, speed, and number of axles of trailing vehicles; the number of vehicles in a
platoon; and the speed and number of axles on the lead vehicles. Other calculations included:
the count, average headway, average speed, and average axles for leading and isolated vehicles;
the distribution of the number of trailing vehicles in each platoon; and the distribution of the
number of axles for each trailing vehicle, and each vehicle in each lane.
The final step in data reduction was accounting for erroneous readings. Occasionally, the
data files contained a reading for a single-axle vehicle or a headway of less than 0.01 second.
These readings were primarily attributed to trailers that were recorded separately by the counter
or vehicles that crossed only one sensor. These readings were either deleted or combined into
the adjacent vehicle, depending on which was appropriate. After these corrections, the platoon
data were re-checked for accuracy and updated if needed.


11
CHAPTER 3
DRIVER SURVEYS
One of the key tenets of transportation is that it should meet the needs of the user.
To ensure that these needs are met, public meetings or hearings are held during the
planning and design stages of major improvement projects to gather information
regarding driver and community needs. In a similar spirit, researchers conducted a
survey of Texas drivers to gather their input regarding the design of passing lanes on two-
lane rural highways.
PREVIOUS SURVEYS
Researchers found two previous studies concerning views of the highway user
regarding passing lanes. The first study was conducted in Canada for the Trans-Canada
Highway in Banff National Park (5). The research performed in the study was limited to
drivers of trucking companies and bus lines, Parks Canada employees, and Royal
Canadian Mounted Police. The Canadian survey disseminated postcards to drivers on the
potential passing lane routes between Banff and Lake Louise. The surveys, to be returned
by mail, focused on delay, length, spacing, signing, and marking of passing lanes.
Comments associated with the length and location of the passing lanes were positive,
while negative responses were associated with reports of drivers disregarding the sign
“KEEP RIGHT EXCEPT TO PASS.”
In the second study, research was performed in Kansas for the Kansas Department
of Transportation (6). This study focused on the specific locations where two passing
lane sections were in the planning stage. These passing lanes were constructed along
US 50 and US 54; a portion of the research included in this report was conducted at two
US 50 sites.
The earlier Kansas survey consisted of five multiple choice questions and one
open-ended question. While the researchers stated the desire to ask more open-ended
questions, Mutabazi et al. felt that a survey of this type would maximize the response
rate (6). Questions were associated with driver behavior, type of vehicle driven,
12
characteristics and the need for passing lanes, the driver’s state of residence, and a space
for additional comments.
The overall response rate in the Kansas survey was approximately 40 percent, for
a total of 406 out of 1000 possible responses. The results showed that approximately 85
percent of respondents said there was a need for more passing lane sections (6).
OBJECTIVES
The purpose of the survey for Project 0-4064 was to evaluate driver
comprehension of the possible signing, marking, and design practices associated with the
development of design criteria for Texas Super 2 roadways. The survey presented
different signing and marking strategies to the survey participants to determine their
understanding and acceptance of different signing, marking, and related geometric
features associated with passing lanes.
SURVEY DEVELOPMENT AND ADMINISTRATION
TTI researchers conducted a laptop computer-based survey in the cities of
Amarillo, Childress, San Antonio, San Angelo, and Odessa, Texas. Initially, a pilot study
was conducted in College Station to fine-tune the design of the survey. The principal
location for the administration of the survey was at Texas Department of Public Safety
driver’s license renewal offices. Each participant was presented with 18 questions related
to signing and marking strategies associated with passing lanes.
The survey consisted of video clips, still photographs, text, and illustrations of
different signs, providing a venue where the participants could visualize the aspects of the
signing, marking, and geometric features of the roadway. This type of survey allowed
the participant to easily understand the question being asked. The survey administrator
recorded each participant’s survey answer, ensuring that the participant fully understood
each question and that the answer was correctly documented.
The use of this type of survey also facilitated the use of open-ended questions,
permitting a better overall understanding of each participant’s answers than could have

13
been obtained with a traditional pencil and paper survey. The survey averaged
approximately 11 minutes to complete, and no form of compensation was offered to the
participants. A total of 134 participants were surveyed.
SUMMARY OF SURVEY QUESTIONS AND RESPONSES
The survey questions focused specifically on signing, markings, and geometric
features associated with passing lanes on Super 2 roadways. Video clips and photographs
used in the survey were taken on US 83 north of Eden, Texas, a site where further data
were collected later during the field study.
This chapter contains the actual survey questions shown in bold face type. An
explanation of why the questions were asked is included along with the results.
Questions 1-3. What does this sign mean to you? Questions 1-3 included three signs that are currently in use in different areas of
Texas and around the country where climbing or passing lanes presently exist.
The respondent’s interpretation of the meaning of each sign was determined based
upon their answer. This type of open-ended question provided a beneficial means of
evaluating each participant’s point of view without prompting. To eliminate any
potential bias, their presentation order was randomized.
Currently, Texas law requires that the inside lane along four-lane rural highways
is used exclusively for passing. The same interpretation of this law is made for two-lane
rural highways with climbing or passing lanes. Survey participants were asked to explain
what each sign shown in Figure 1 meant to them. The answers were then evaluated based
on common responses.
Keep Right Except to Pass Survey respondents typically responded to this sign as meaning “stay or keep to
the right unless passing.”

14
Slower Traffic Keep Right Approximately 40 percent of the respondents associated this sign with vehicle
speeds, and many even gave specific values for these speeds. A typical response in these
instances was: “If you are driving 55 or less, stay in the right lane.”
Figure 1. Signs for Questions 1-3.
Left Lane for Passing Only Typically, many survey respondents said that this sign meant to “use the left lane
only for passing” or “the left lane is to remain open for passing.” Some participants in
the survey were asked which of these signs they felt provided the strongest meaning
associated with keeping the inside lane open for passing. Sixty-two of the 134
participants were asked which of the three signs had the strongest meaning. Seventy-one
percent of these respondents felt that Left Lane for Passing Only carried the stronger
meaning versus 29 percent for Keep Right Except to Pass.
Before question 4 was asked, respondents saw a video clip with the beginning as
shown in Figure 2. The clip illustrates a vehicle just ahead, and was followed by this
statement: “You are driving along this Texas two-lane highway. As shown in the video
clip, you are following a slower vehicle.” (The 10-second video clip shows the slower
vehicle traveling just ahead.) Figure 3 depicts the sign shown to the survey participant for
question 4.

15
Figure 2. Beginning of Video Clip for Question 4.
Figure 3. Sign for Question 4.
Question 4. While driving behind the slower vehicle, you see this sign. If the sign means that you will have a special lane to use for passing 2 miles ahead, would you wait until the passing lane to pass? a. Yes b. I would pass sooner if I had an opportunity As shown in Figure 4, 61 percent of the respondents indicated that they would
wait until the passing lane to pass the slower moving vehicle, while 39 percent said they
would pass before the passing lane became available. Many respondents also indicated
that this type of sign would be valuable to them in their decision on whether to initiate a
passing maneuver. Answers to question 4 provided a basis on which to determine if the
concept of passing lanes is seen as being beneficial from the driver’s standpoint. It also
offered an opportunity to evaluate response to the sign indicating advance notice of the
passing lane.

16
Figure 4. Results for Question 4.
Questions 5 and 6 were associated with the passing behavior of the driver when
faced with current climbing and passing lane entrance markings versus a proposed new
marking. The proposed new marking is a broken marking pattern delineating the passing
lane from the right-hand, or outside, lane.
Positive results from the pilot survey indicated that further study was justified
regarding the use of the broken marking pattern. The additional research involved a field
study conducted at three Texas locations as described in Chapter 4.
Again, a scenario was created before questions 5 and 6 were asked. In this
scenario, photographs and video clips, seen in Figures 5 and 6, were used in addition to
text to illustrate a vehicle traveling just ahead and moving to the right-hand lane. In
question 5, the participant is shown the entrance to the passing lane as typically
constructed, while question 6 illustrates the closely spaced skip stripe pattern separating
the passing lane from the right-hand lane.
Question 5. When you arrive at this point, which lane would you choose? a. Lane A: pass the slower moving vehicle b. Lane B: follow the slower moving vehicle c. I don’t know
61% 39%
Wait Pass Sooner
17
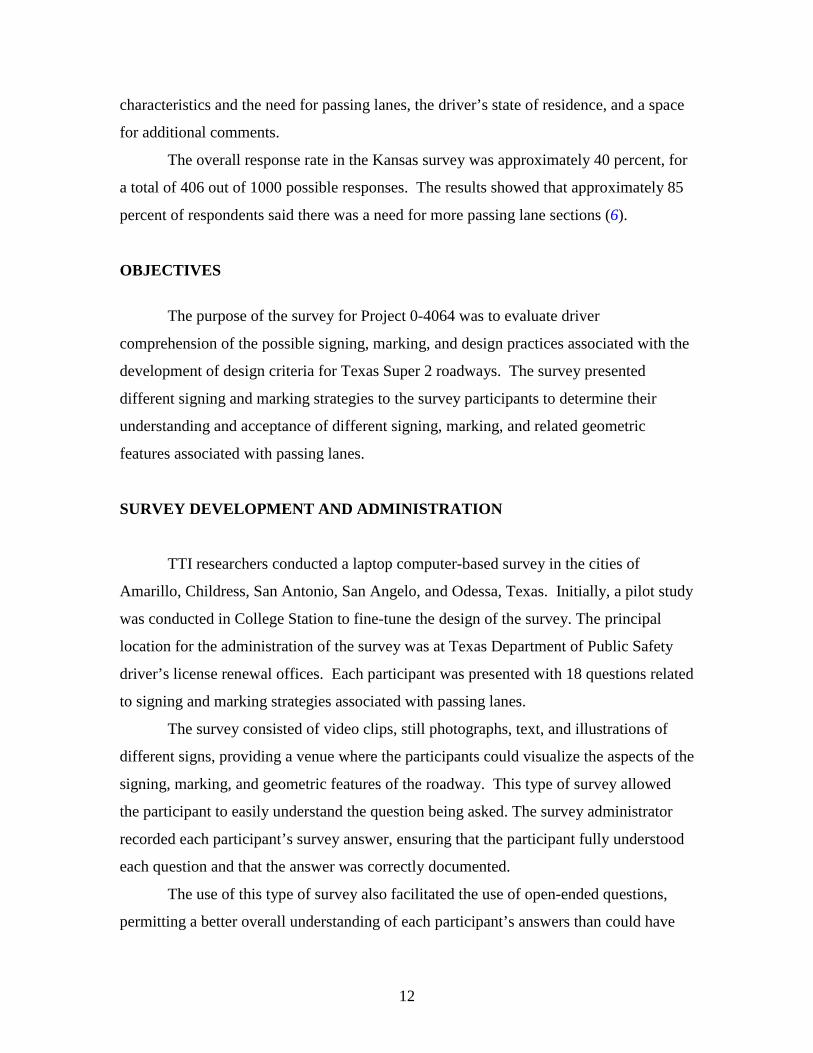
Figure 5. Typical Passing Lane Entrance for Question 5.
Question 6. When you arrive at this point, which lane would you choose? a. Lane A: pass the slower moving vehicle b. Lane B: follow the slower moving vehicle c. I don’t know
Figure 6. Broken Marking Pattern for Question 6.
As shown in Figure 7, 96 percent of the respondents for question 5 indicated they
would pass the slower vehicle using lane A. The remaining 4 percent were split equally,
saying they would either follow the slower moving vehicle into lane B or that they didn’t
know.

18
Figure 7. Results for Question 5.
As shown in Figure 8, 68 percent of the respondents for question 6 indicated that
they would pass the slower vehicle using lane A, while 30 percent said they would follow
the slower moving vehicle using lane B. The remaining 2 percent indicated that they did
not know. A large number of the respondents who chose lane B also stated they would
pass the slower vehicle after the transition to the passing lane.
Figure 8. Results for Question 6.
Questions 7, 8, and 9 were related to which lane (A or B) the respondent would
choose when approaching a passing lane with no other vehicles present. These questions
were structured to indicate which lane the driver prefers when not in a platoon. They also
provided a basis for comparison in later field studies on this issue.
Question 7. When you arrive at the point near the end of the video clip and you are not following or being followed by anyone, which would you choose?
����������������������������
96%
2%
2%
Pass
���������� Follow Don't Know
������������������������������������������������������������
68%
30%
2%
Lane A�����
Lane B Don't Know

19
a. Drive in Lane A b. Drive in Lane B c. I don’t know Figure 9 illustrates the end of the video clip associated with this question. (The
10-second video clip shows the vehicle approaching the passing lane section typically
marked in Texas and other areas around the country.)
Figure 9. End of Video Clip for Question 7.
Figure 10 shows the results for question 7. As illustrated, 87 percent of the
respondents indicated that when approaching a passing lane and not in the proximity of
any other vehicles, they would choose lane B. The remaining 13 percent chose lane A.
(These values are somewhat different than those produced by the field study conducted as
part of this project. In that study, the number of vehicles choosing lane A was almost
twice that indicated in the survey, with approximately 25 percent of drivers choosing lane
A when not in the proximity of any other vehicles and not engaged in a passing
maneuver. This is discussed in Chapter 6.)
Figure 10. Results for Question 7.
13%
87%
Lane A Lane B

20
In question 8, the participant was shown the photograph of an open section of a
passing lane with no vehicles ahead, as shown in Figure 11. This question was asked to
determine the lane preference of the driver in this situation.
Question 8. If no other vehicles are in Lane A or Lane B, would you: a. Drive in Lane A b. Drive in Lane B c. I don’t know
Figure 11. Photograph for Question 8.
As shown in Figure 12, 92 percent of the respondents stated that they would travel
in lane B if no other vehicles were around them, while 7 percent said they would travel in
lane A, and 1 percent did not know. (Again, while the field study was principally
associated with the lane choice of the driver at the passing lane entrance, it can be
concluded that the results of question 8 are different than driver performance in the field.
The 7 percent of participants choosing lane A is well below the approximately 35 percent
measured in the field 500 feet downstream of the end of the passing lane diverge taper, as
discussed in Chapter 6.)

21
Figure 12. Results for Question 8.
In question 9, a video clip illustrated a vehicle traveling along the path to the
right-hand lane, lane B, delineated by the broken marking pattern. A portion of this clip
is shown in Figure 13. (The 15-second video clip shows a vehicle following the path of
the broken marking pattern.) This question was asked to determine the effectiveness of
the marking pattern in moving the driver to the outer lane. The placement of the driver in
this location can result in increased safety by providing some degree of separation
between vehicles traveling in opposing directions. It can also improve operational
characteristics by moving drivers to the right-hand lane unless they are involved in a
passing maneuver.
Question 9. Would you follow the path of this vehicle in this situation or would you cross the broken white stripes? a. Drive in Lane A b. Drive in Lane B c. I don’t know
Figure 13. Portion of Video Clip for Question 9.
������������������������
7%
92%
1%
���������� Lane A Lane B Don't Know

22
As shown in Figure 14, 80 percent of the respondents indicated that they would
move to the right-hand lane while 20 percent stated that they would cross the broken
marking pattern. As shown in Figure 10 (the results for question 7), it appears that the
broken marking pattern less effectively moves drivers to the outside lane with no marking
across the entrance to the passing lane as typically found in Texas. (However, field study
results indicate that the opposite is true; the marking is more effective in moving drivers
to lane B when they are not engaged in passing and have headways greater than five
seconds. This is discussed in Chapter 6.)
Figure 14. Results for Question 9.
Question 10 was included to determine driver understanding of no-passing zones
associated with passing lanes. The still photograph presented in question 10 and shown
in Figure 15 illustrates a no-passing zone along a passing lane section. The survey
participant was asked to state if passing is legally permitted for traffic approaching in the
oncoming direction.
Question 10. Are vehicles traveling in Lane X permitted to go into Lane A to pass provided there is no oncoming traffic? a. Yes b. No c. I don’t know
80%
20%
Follow Cross Stripes

23
Figure 15. Photograph for Question 10.
Figure 16 illustrates the results for question 10. As seen in the figure, 94 percent
of respondents recognized that they could not legally pass in this situation, while 6
percent indicated that they could legally pass provided there was no oncoming traffic.
Figure 16. Results for Question 10.
Questions 11-13 relate to shoulder widths in passing lane sections and to the
comfort level of the driver if stopping on the shoulder. These questions were asked to
gain a better understanding of the width of shoulder that respondents recognized as
acceptable for stopping on the shoulder in an emergency.
These questions were also randomized at survey locations to eliminate bias.
However, for the purpose of this report, questions 11-13 are ordered to illustrate a vehicle
parked along 10-ft, 6-ft, and 4-ft shoulders, respectively. The respondents did not know
the widths of the shoulders; they saw only the photographs. Two still photographs were
presented for each question in addition to the text.
6%
94%
Yes No

24
Questions 11-13. Would you feel comfortable stopping on this shoulder if you had a flat tire? a. Yes b. No c. I don’t know
Figure 17 illustrates a vehicle parked on a 10-ft shoulder. This shoulder width is
currently the maximum width of shoulders constructed in Texas.
Figure 17. Photograph for Question 11, 10-Ft Shoulder.
Figure 18 illustrates the results for question 11. As seen in Figure 18, 70 percent
of the respondents indicated that they would feel comfortable stopping on the 10-ft
shoulder, while the remaining 30 percent said they would not.
Figure 18. Results for Question 11.
70%30%
Yes No

25
Figure 19 illustrates the 6-ft shoulder presented to the survey participant in
question 12. The roadway is similar to that used for the 10-ft shoulder except that it is in
a passing lane section.
Figure 19. Photograph for Question 12, 6-Ft Shoulder.
Figure 20 shows the results for question 12. Approximately one half, or 49
percent, of the respondents stated that they would not feel comfortable stopping on the 6-
ft shoulder when having a flat tire, and 6 percent said they were unsure. The remaining
45 percent indicated that they would feel comfortable stopping on the 6-ft shoulder
illustrated in the photographs.
Figure 20. Results for Question 12.
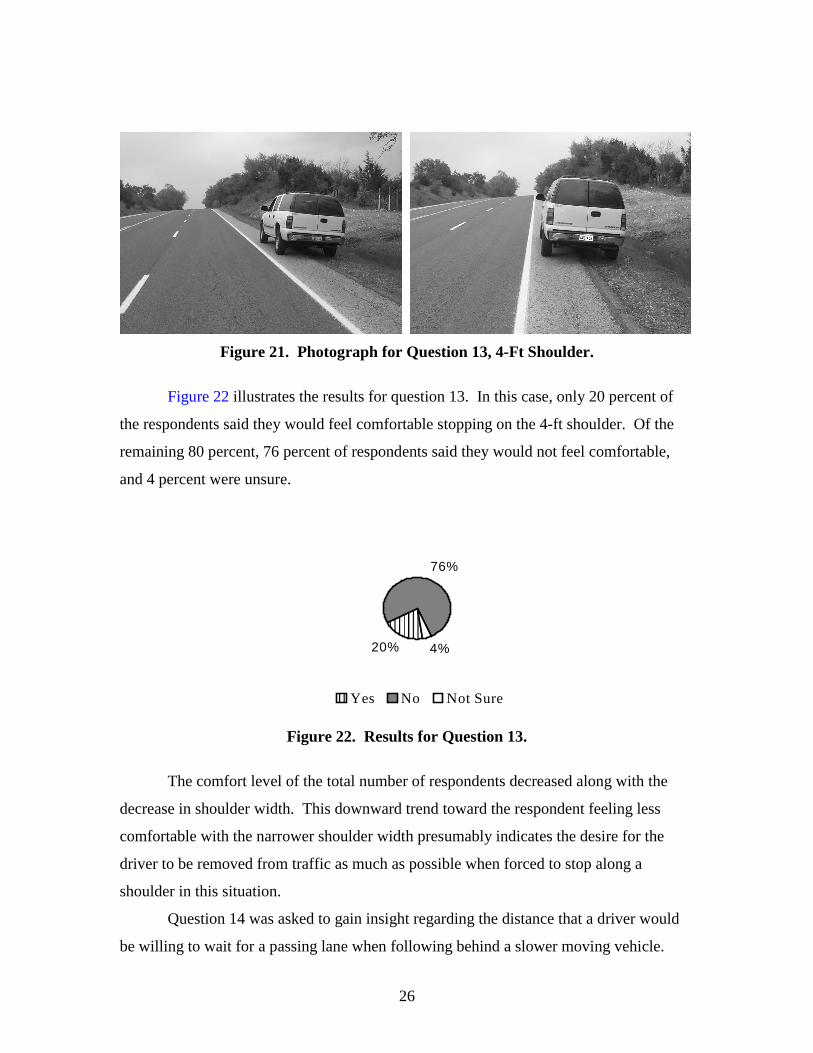
As noted previously, question 13 was associated with the comfort level of the
participant regarding stopping on a 4-ft shoulder due to a flat tire. Figure 21 illustrates
the photographs shown to the participant. This shoulder is also in a passing lane section.
������������������������������������������������������������������������������������
45% 49%
6%
Yes���������� No Not Sure
26
Figure 21. Photograph for Question 13, 4-Ft Shoulder.
Figure 22 illustrates the results for question 13. In this case, only 20 percent of
the respondents said they would feel comfortable stopping on the 4-ft shoulder. Of the
remaining 80 percent, 76 percent of respondents said they would not feel comfortable,
and 4 percent were unsure.
Figure 22. Results for Question 13.
The comfort level of the total number of respondents decreased along with the
decrease in shoulder width. This downward trend toward the respondent feeling less
comfortable with the narrower shoulder width presumably indicates the desire for the
driver to be removed from traffic as much as possible when forced to stop along a
shoulder in this situation.
Question 14 was asked to gain insight regarding the distance that a driver would
be willing to wait for a passing lane when following behind a slower moving vehicle.
���������������������������������������������
20%
76%
4%
���������� Yes No Not Sure

27
Question 14. Passing lanes can be used on long sections of two-lane rural roadways. The lanes are used to provide safer opportunities to pass when you are following a slower vehicle. If you know that a passing lane is going to be provided ahead, what distance would you be willing to wait for the passing zone if you are behind a slower vehicle? a. 2 miles or less b. 3 miles c. 4 miles d. 5 miles e. 6 miles or more f. Other_____
The results for question 14, shown in Figure 23, illustrate that 55 percent of the
respondents, were willing to wait 2 miles or less for a passing lane when following a
slower vehicle. Nineteen percent of respondents were willing to wait 3 miles to pass,
seven percent indicated that they would wait up to 4 miles, and 4 percent said they would
wait up to 5 miles. The remaining 15 percent of respondents stated they would be willing
to wait 6 miles or more to pass, and many of these respondents indicated that they simply
did not pass or feel safe passing on two-lane rural highways.
The results of this question illustrate that the majority of respondents (55 percent)
fall into the 2 miles or less category. The information gained from question 14 is helpful
in determining the appropriate distance for the advance notice of the upcoming passing
lane.
Question 15 was included in the survey to determine the willingness to move to
the shoulder to allow a faster vehicle to pass. Although uncommon (and generally
illegal) in other states, this practice is customary along rural two-lane Texas highways.
The same 10-second video clip shown in question 4 is used for question 15. However, in
this scenario, the survey respondent is “driving” the vehicle in front. A still image from
the video clip is shown in Figure 24.

28
Figure 23. Results for Question 14. Question 15. You are driving the vehicle shown in front. Another vehicle is following closely behind you. You see a sign that says a passing lane will be provided in 2 miles. Would you: a. Move to the shoulder to allow the vehicle to pass b. Wait for the passing lane to allow the vehicle to pass
Figure 24. Portion of Video Clip for Question 15.
Figure 25 illustrates the results for question 15. Fifty-three percent of the
respondents indicated that they would move to the shoulder and allow the faster moving
vehicle to pass. This result is important because, while it is apparent that approximately
one half of vehicles will attempt to facilitate the passing of the faster vehicle, a significant
number will maintain their lane position, leading to decreased operational benefits and
increased safety.
���������������������������������������������
������������������������������������������
55%
19%7%
4%
15%
2 miles or less���������� 3 miles 4 miles
5 miles���������� 6 miles or more

29
Figure 25. Results for Question 15.
Questions 16 and 17 were asked to further determine driver understanding of
pavement markings in passing lane sections. While similar in nature to question 10, these
questions were designed based on the assumption that passing lane sections, as opposed
to climbing lane sections, will encompass a larger area where passing will be permitted in
opposing directions due to available sight distance. They were also included to determine
driver understanding of pavement markings.
Figure 26 illustrates a portion of the video clip presented with question 16. (The
10-second video clip illustrates a slower moving vehicle just ahead with the passing lane
in the opposing direction. There is a broken yellow line shown inside of a solid yellow in
the direction of travel, permitting a legal pass.)
Question 16. You are following the slower vehicle shown ahead. Can you legally pass this vehicle if desired? a. Yes b. No c. I don’t know As shown in Figure 27, 79 percent stated correctly that passing the slower moving
vehicle was legally permitted while 18 percent of the respondents indicated that a legal
pass was not permitted, and 3 percent did not know. The results for question 16 indicate
that approximately one out of five respondents incorrectly stated that passing the slower
moving vehicle in this situation was not legally permitted. These results illustrate the
level of misunderstanding presented by allowing passing in the opposing passing lane.
53%47%
Yes No

30
Figure 26. Portion of Video Clip for Question 16.
Figure 27. Results for Question 16.
Question 17 is the same as question 16 from the opposing direction, or traveling
adjacent to the passing lane. Figure 28 shows a portion of the video clip presented with
question 17. (The 10-second video clip illustrates the slower moving vehicle just ahead,
adjacent to the passing lane which is separated by a broken white marking.)
Question 17. You are following the slower vehicle. Can you legally pass this vehicle if desired? a. Yes b. No c. I don’t know
������������������������������������������
79%
18%
3%
Yes
�������� No Don't Know

31
Figure 28. Portion of Video Clip for Question 17.
The results for question 17 are illustrated in Figure 29. As seen in this figure, 95 percent
of the respondents correctly recognized that passing was legally permitted in this
situation. This result is in contrast to question 16, where only 79 percent of respondents
indicated a legal passing maneuver could be made. The fact that the vast majority of
respondents recognized that a passing maneuver is legal in this situation further
underscores the recognition that a white broken marking is acceptable to cross during a
passing maneuver or otherwise.
Figure 29. Results for Question 17. Question 18 was asked to obtain relevant information on the subject of passing
lanes. This open-ended question allowed respondents to communicate any ideas they had
regarding the design and construction of passing lanes.
Question 18. Do you have any suggestions about passing lanes (signs, pavement markings, or distance between passing lane sections)? Approximately 70 percent of the total number of participants made comments or
suggestions. As shown in Figure 30, the results were centered around four key points: the
95%
5%
Yes No

32
length and frequency of passing lanes, better signing and markings, wider shoulders, and
better education regarding passing lanes. For example, participants suggesting better
education stated that some slower drivers do not readily move to the right-hand lane
unless passing, forcing a passing maneuver to be made by the faster vehicle in that lane.
Figure 30. Results for Question 18. As noted previously, some surveys were conducted in Childress, Texas, where
several passing lane sections have recently been constructed. Almost all of the survey
participants in Childress were familiar with these passing lanes. Their responses
typically focused on the need for more passing lanes on other roadways in the area.
SUMMARY
This survey was associated with the critical design components and other passing
lane issues including passing lane length and spacing, signing and marking strategies,
lane and shoulder width, opinions and viewpoints from the user’s perspective, and human
factors issues. A comprehensive literature review and site visits where passing lane
sections have been constructed were useful in providing information to develop the
survey questions.
A considerable number of survey participants stated that they would be willing to
wait 3 miles or less for a passing lane section. This type of information is not only
helpful from the standpoint of driver expectancy between passing lane sections, but it
also provides information on the satisfactory advance notice of upcoming passing lanes.
Advance notice of upcoming or the end of passing lane sections is provided through
���������������������������������������������������������������������������
48%31%
13%8%
Longer and More Frequent����
Better Signs/Markings
Wider Shoulder Better Education
33
appropriate signing. Information gathered in the survey was helpful in this area as well,
providing insight about the user’s perspective on signing associated with lane use in
conformance with current Texas laws.
The survey was also constructive in providing information on signing and
marking issues. Survey data indicated that one in five survey participants was unclear
about whether it was legally permitted to pass in the opposing passing lane, even though
markings clearly indicated it was legal to do so provided there was no oncoming traffic.
This situation was in contrast to the large number of survey participants that readily
responded to whether passing was permitted in a passing lane section and in a no-passing
zone in a passing lane section.
Previous studies have indicated that a broken marking pattern delineating the
passing lane is beneficial in channelizing traffic to the right-hand lane (7). This finding
led to the formulation of questions regarding a version of this broken marking pattern for
the survey. (A field study was also performed; see Chapter 6 for further information.)
Results from the survey and later field study confirmed that this marking was useful in
directing traffic to the appropriate lane position, allowing the passing lane section to be
used more efficiently from an operational perspective.
The user’s viewpoint was also helpful in recommending shoulder widths within
passing lane sections. The comfort level associated with 4-, 6-, and 10-ft shoulders by
the respondents yielded the driver’s perspective regarding appropriate shoulder widths in
passing lane sections. Again, the survey participants were only shown photographs
depicting a vehicle stopped on a shoulder and were not informed of the actual shoulder
width. This information was coupled with that gathered from the literature review and
engineering judgment to develop shoulder width recommendations.
Suggestions from the survey participants provided key information about design
components and related information that would be constructive to passing lane
development in Texas. Many participants relayed the desire to see more frequent passing
lane sections. They also recognized that many climbing lane sections in existence around
the state are of insufficient length when passing more than one vehicle. Others noted the
need for improved signing and marking associated with passing lanes. As previously
noted, the advance notice of upcoming passing lane sections, as well as signage and

34
markings designed to give the optimum amount of information to the user, provides an
improved operational efficiency of passing lanes.
Some suggestions were associated with the need for better education, specifically
regarding appropriate lane position in passing lane sections. The point was made that
many times, passing of slower moving vehicles occurs in the right-hand lane due to the
slower vehicles not moving over to clear the passing lane. In this case, even though the
vast majority of survey respondents indicated the preference of lane B, the right-hand
lane, even when other vehicles were not in close proximity, the field study provided
results that showed the opposite was true in many instances. During the administration of
the survey, it was concluded that a number of the younger participants were better
educated regarding the laws, signing, markings, etc., than many older participants. This
finding demonstrates the need for some form of educational materials to be made
available to the public, perhaps by having brochures made available at driver’s license
renewal offices, distributed at public meetings or public hearings, or through radio and
television advertisements.
The provision of the appropriate information regarding passing lanes was the
primary goal in the development of the survey questions as well as the format and
administration of the survey. The video clips and photographs provided a basis to ask
questions that could be easily understood by the survey participants. The format was
well received, and a number of participants commented that the nature of the survey was
conducive to efficient two-way communication between the administrator and the
participant.
Overall, the survey provided results that greatly increased the knowledge base
used by the researchers to make the recommendations for passing lane design criteria.

35
CHAPTER 4
LENGTH AND SPACING OF PASSING LANES
Passing lanes on two-lane, two-way rural highways can improve the level of service
(LOS) by providing passing opportunities to motorists traveling behind slower moving vehicles
and dispersing platoons that may have formed behind the slower moving vehicle. Research
indicates that passing lanes may be warranted for highways having average daily traffic (ADT)
values between 1000 and 6200 in both directions, depending upon terrain, cost, and desired
level-of-service (8,9).
The functional effectiveness of passing lanes on two-lane, two-way rural highways
depends on the length of the passing section and the spacing between the passing sections. It is
desirable to have a passing lane section that is able to convert platoon flow at its upstream end to
free-flowing single vehicles at its downstream end.
Also, the spacing between the passing lanes should be such that passing lanes function as
a coordinated system and are able to disperse large platoons to decrease the percent travel time
delay in the system (9). The length and spacing of passing lanes are functionally dependent on
the following factors: ADT, percent trucks, topography, and local needs. Therefore, a
relationship between the ADT and the percent of trucks using the highway with the optimum
length and spacing of the passing lanes needs to be established.
BACKGROUND
Three related research efforts have provided background on the length and spacing of
passing lanes. These include research conducted by Texas Tech University, Kansas State
University, and by Harwood and Hoban (8,9,10).
Capacity and Shoulder Use
It has been observed that the passing capacity of a two-lane rural highway decreases with
increasing volume, which leads to an increase in platoon size (11). Passing capacity approaches
zero at an opposing volume of 700 passenger cars per hour per lane (pcphpl) on a two-lane, two-

36
way rural highway having 100 percent passing zones (12). Improving the roadway’s geometry
improves passing opportunities on a two-lane roadway. This could be achieved by either
increasing the number of sections with adequate sight distance or by providing auxiliary lanes for
passing.
Many research studies conducted in the past have recognized the ability of passing lanes
to improve traffic opportunities by providing dependable passing opportunities in all volume
conditions (9). The following model developed by Harwood and St. John predicts the passing
rate at a given passing lane section using a set of input values which are explained below (1):
( )83.0
40050;35.164.9127.0 2 =
≤≤+−=
R
vphFLOWvphforUPLLENFLOWPR (1)
where
PR = passing rate in passes per mile per hour,
FLOW = flow in one direction in vph,
LEN = length of passing lane in miles,
UPL = percentage of vehicles platooned upstream, and
vph = vehicles per hour.
A regression analysis was conducted by Staba et al. to predict the number of passes in a
passing lane as a function of the five-minute vehicle count. For the three climbing lanes and one
passing lane section studied, the results indicated that the number of passes increased with
addition of passing lanes as compared to a standard two-lane section (7).
Romana and May (12) studied the effects of passing lanes by counting the number of
passes that a test vehicle made in the passing lane sections by using a floating car technique. The
test section in question was 9.3 miles (15 kilometers) long and had two passing lane sections in
each direction. They observed that a larger number of passes occurred in the first of two passing
lanes. However, they found that this was not true when the number of passes per unit length of
passing lane was analyzed. They determined that the results of the experiment were inconclusive,
but they believed that the number of passes depended on the following factors:
• length of the passing lane,
• speed of the vehicles,

37
• magnitude of the traffic volume,
• length of the platoon preceding the passing lane section, and
• position of the test vehicle in the queue as it enters the passing lane.
Gattis et al. studied the passing activity at both short passing lanes, less than 1400 feet
and at long passing lanes, greater than 2500 feet (13). The number of vehicles that attempted to
pass and the number of vehicles that successfully completed a pass were recorded. Results
indicated that a slightly smaller proportion of vehicles attempted to pass on the short passing
lanes than on the long passing lanes.
It has been observed that roadway sections with wide, paved shoulders are sometimes
used as informal passing lanes where slower drivers pull to the shoulder to allow the faster
vehicles to pass them (9). In a study conducted by Morrall and Plight in Alberta, Canada, it was
observed that some slower drivers pulled to a 10-foot paved shoulder to allow faster vehicles to
pass. However, they observed that this good gesture was usually limited to low-volume
conditions. At higher volumes, drivers were reluctant to pull to the shoulder due to the problem
of reentering the mainstream (5).
In another study, Harwood and St. John (1) observed that for highway sections having
shoulders designated for slower moving vehicles, up to 8 percent of the total traffic and 40
percent of the platoon leaders used the shoulders. However, they concluded that shoulder use
provides only minimal operational benefits at flow rates below 100 vph. They also observed that
at flow rates above 100 vph, benefits from shoulder use are only 20 percent of that of a passing
lane.
Shoulder usage for improving passing opportunities appears to be increasing in the
United States. In 1985, the Transportation Research Board (TRB) quoted five states that allowed
the use of shoulders for passing and 10 other states that allowed the use of shoulders under
special conditions (14).
It can be concluded that passing lanes provide operational benefits on two-lane, two-way
rural highways and the construction of the same should be carried out in a phased and methodical
manner as explained in the latter part of this chapter.
38
MEASURES OF OPERATIONAL PERFORMANCE
Previous research studies have used various operational performance measures to
evaluate the effectiveness of passing lanes. The most important factors used are percent time
delay, speed, lane utilization, platoon structures, and time headway distribution (9).
Percent Time Delay and Percent of Vehicles in Platoon
The Highway Capacity Manual (HCM) defines percent travel time delay as the average
percent of overall travel time that all vehicles traveling in platoons are delayed due to their
inability to pass the slower moving vehicle at the head of the platoon (14). The HCM uses
percent time delay as the primary measure of effectiveness in determining the LOS of a two-lane
highway because it is reflective of both functions of a highway, namely mobility and
accessibility (9).
Speed
The HCM defines the use of speed and capacity as secondary measures of LOS on a two-
lane highway (14). The speed used in the above case is the average travel speed or the space
mean speed, which is obtained by taking a length of highway and dividing it by the travel time of
all vehicles traversing the segment in both directions of the highway segment under
consideration.
Lane Utilization
In a highway section with a passing lane, the outer lane or shoulder is designated to be
used by slower-moving vehicles, leaving the inner lane available for passing vehicles. A measure
of the vehicles in the inner lane may reflect passing activities within that section. Therefore, lane
utilization could be considered to be an indirect measure of passing rates subject to the
assumption that motorists understand and follow the concept of lane assignment (9).

39
Platoon Structure
The platoon structures existing at the entrance and exit locations of a passing lane could
be an indirect measure of the passing activities within a passing lane section (9). An ideal
passing lane section would be one which is able to fully convert a platoon at the upstream
location of the passing lane to free-flowing single vehicles at the downstream location of the
passing lane.
Time Headway Distribution
Time headway is another measure of effectiveness of the operational efficiency of a
passing lane. The time headways for a specific group of vehicles at the entrance and exit of a
passing lane are compared to determine the effect of the passing lane on the group of vehicles.
DESIGN GUIDELINES
Guidelines published regarding the location and design of passing lane sections on two-
way, two-lane rural highways are discussed in the following sections.
Guidelines
Research conducted by the Kansas Department of Transportation suggests that
improvements to two-lane rural highways in the form of adding passing lanes should be
accomplished in a two-level process: i.e., network and project levels (9).
The study recommends that, at the network level, two-lane rural highway segments
operating below a predefined level-of-service should be identified for improvements. At the
project level, highway segments identified at the network level should be ranked for the purpose
of prioritization (9). The study also recommended minimum average annual daily traffic
(AADT) values that warrant the addition of passing lanes at the network level, based on the
HCM level-of-service procedures for rural two-lane highways (9). Table 3 presents these
warrants.

40
Table 3. Suggested Minimum AADT Values for Rural Two-Lane Highways for Levels-of-Service B and C in Level Terrain–Justification for Passing Lanes.
Projected Design Year AADT % Trucks 10 15 20 30 40
LOS B C B C B C B C B C 0 % 3900 6200 3700 5890 3520 5600 3210 5110 2950 4690
20 % 3460 5630 3290 5340 3130 5080 2850 4630 2620 4260 40 % 3030 5190 2880 4930 2740 4690 2500 4280 2290 3930 60 % 2740 4900 2600 4660 2480 4430 2260 4040 2080 3710 80 % 2450 4760 2330 4520 2220 4300 2020 3920 1860 3600
% N
o P
assi
ng
Zon
es
100 % 2310 4620 2190 4380 2090 4180 1900 3800 1750 3490 Assumptions: K=0.15, directional split = 60/40, peak hour factor = 0.92, lane width ≥ 12 ft, shoulder width ≥ 6 ft.
Length
The literature does not provide a specific definition for the length of a passing lane. Some
studies consider the passing lane length to include tapers, while others exclude tapers from the
definition of passing lane length. In this report, the length of a passing lane refers to the length of
the two-lane passing section excluding the transition tapers.
Earlier research conducted by Harwood and Hoban suggested the optimal passing lane
lengths for respective two-way volumes as shown in Table 4 (10). Subsequent research generally
supported these recommendations (8,9). However, these studies were conducted during the
period (1974-1996) when the national maximum speed limit was 55 mph.
Table 4. Optimum Lengths for Passing Lanes.
Two-Way Flow Rate (veh/hr) Optimal Passing Lane Length (mi)
200 0.5 400 0.5-0.75
800 0.75-1.0
1400 1.0-2.0
Spacing
Spacing of passing lanes refers to the distance between successive passing lanes in the
same direction of travel. The optimal spacing between passing lanes depends on a number of
factors including traffic volumes, operational improvement desired, and cost constraints.

41
Harwood and Hoban (10) suggest that the Australian approach of long initial spacing of
10-15 miles should be followed for passing lane installations. If volumes continue to grow such
that additional improvements are warranted, the spacing may be reduced to 3-5 miles by adding
intermediate passing lanes.
A comparison of recommended design guidelines regarding length and spacing of
passing lanes in Canada, Australia, and the United States is listed in Table 5 (9).
Table 5. Comparison of Design Guidelines for Passing Lanes Among Canada, Australia and the United States (2).
Taper Length Jurisdiction Spacing (mi)
Length (mi) Diverge Merge
British Columbia -
Minimum 0.5; desirable 0.65
20:1 25:1
Alberta - 1.3 25:1 50:1
Canadian Parks Service
Determined from warrants
Trans-Canada 1.3; other highways minimum 0.3
100 m 200 m
Ontario 6.2-15.5 0.9-1.3 6.1
WV ×
6.1
WV ×
Federal Highway Administration
(USA) 3.1-8.0
Minimum 0.2; 0.5-1.0 optimal
3
2 WV ×× WV ×
Australia 2.2-3.1 to 6.2-9.3 Depends on design speed; normal maximum length 0.75
3
WV ×
2
WV ×
V = 85th Percentile Speed. W = Lane Width. Length does not include transition tapers. Configuration of Passing Lanes
Figure 31 shows nine different configurations of passing lanes (9). The isolated passing
lane shown in Figure 31a is used to reduce delays occurring at a specific isolated bottleneck. The
other configurations allow some interaction between consecutive passing lanes in opposite
directions, and they are used when traffic improvements are needed in both directions of travel.
As per Harwood and Hoban (10), when two passing lanes are located in opposite
directions at the same place on a high-volume highway, a tail-to-tail configuration is more
effective. They claim that the tail-to-tail configuration is more effective than the head-to-head

42
configuration because it creates a process of platoon break-up so that the vehicles are not in
platoon as they leave the passing lane. They contend that for the head-to-head configuration, the
breakup of the platoon takes place in the passing lane, but the vehicles may become re-
platooned. The vehicles may leave the passing lane sections in platoons, thus reducing the
efficiency of the passing lanes.
The alternating type passing lanes shown in Figures 31f and 31g can be used when
sufficient width for passing lanes is available. Overlapping type passing lanes, shown in Figures
31h and 31i, can be used when a passing lane is located on a crest or sag vertical curve,
respectively. Side-by-side passing lanes, shown in Figure 31j, could be used where the location
of a passing lane is constrained by non-flexible factors. Those factors include (but are not
limited to) obtaining right-of-way, when heavy traffic is the cause of platooning rather than no
passing zones, and where the need for passing lanes exists in both directions (9).
MICROSCOPIC SIMULATION
One objective of this research was to develop design guidelines for obtaining the optimal
length and spacing of passing lanes for a given input value of two-way volumes. The simulation
runs for this research were performed using TWOPAS. TWOPAS is a microscopic simulation
software that simulates two-lane rural highways under a wide variety of conditions. TWOPAS
has recently been developed for the Federal Highway Administration for Windows®-based
personal computers.
The main advantages of performing simulations are that they can be performed in a short
period of time and that the data can be easily reduced to obtain the desired results. TWOPAS has
the ability to model two-lane, two-way rural highways with passing lanes. A user interface called
UCBRURAL was recently added to TWOPAS, making it more user-friendly. TWOPAS is based
on car-following logic, which assumes that a vehicle following another vehicle will always
maintain a space headway relative to its lead vehicle that is linearly proportional to its speed.
A study conducted by Morales and Paniati showed that TWOPAS’s simulation results
compared favorably with those observed in the field with regards to measures of effectiveness
(MOEs) (15). This study validated TWOPAS under a specific geometric and traffic condition
and exposed the potential of the software to the transportation engineering community.

43
Subsequent evaluation of the software under a wide variety of traffic and geometric conditions in
California has further validated the use of the software to replicate field conditions.
Figure 31. Passing Lane Configurations.
Isolated Passing Lane
Separated Passing Lane
Adjoining Passing Lane
a
b
c
d
e
Alternating Passing Lane
Overlapping Passing Lane
Side-by-side Passing Lane
f
g
h
i
j

44
MEASURE OF OPERATIONAL PERFORMANCE SELECTED
Percent time delay was chosen as the measure of operational performance in this project,
as the HCM uses percent time delay as the primary measure of effectiveness in determining the
LOS of a two-lane highway. The level-of-service for a two-lane highway is related to the average
percent time delay as shown in Table 6 (14).
Table 6. Level of Service and Corresponding Percent Time Delay (11).
Level of Service Percent Time Delay A 30
B 45
C 60
D 75
E > 75
EXPERIMENTAL SETUP
The following sections describe the various input parameters with regards to the
experimental setup.
Highway Test Bed
A hypothetical two-lane, two-way rural highway with varying length and spacing of
passing lanes was simulated under a variety of traffic mixes and two-way traffic volumes,
equally proportioned in both directions. The spacing between the passing lanes was varied
between 1.0 mile and 8.0 miles with a step size of 1.0 mile, and the length of the passing lanes
was varied between 0.25 mile and 2.0 miles with a step size of 0.25 mile. The passing lane
sections selected were side-by-side sections. The section upstream and downstream of the
passing lane system was fixed at 1.0 mile in order to maintain uniformity in the setup and to
obtain consistency with regard to the results of the simulation. The road was assumed to be on a
level grade with opposed passing permitted in all sections except within the passing lanes.
Figure 32 shows a sketch of the highway test bed used in this research.

45
Figure 32. Section Used for TWOPAS Simulation Runs.
Traffic Volume
The range of two-way traffic volume used in this research was between 400 and 1000
vph, equally proportioned in both directions, with a step size of 200 vph. Keeping the volume
equally proportioned in both directions leads to uniformity in the output. It also gives an average
value of the operational performance measures simultaneously while taking into account the
traffic movement in both directions of travel.
Percent Traffic by Vehicle Type
The percentage of trucks was varied from 0 to 40 percent, with a step size of 2 percent.
The corresponding percentage of cars varied from 100 to 60 percent, respectively.
RESULTS
Variation of Percent Time Delay (PTD) with Two-Way Volume and AADT
The results of the TWOPAS simulation runs are discussed in the following sections. The
variation of percent time delay with two-way volume and AADT, varying length and spacing of
passing lanes, and percent trucks is shown in Figure 33. A level, straight two-lane highway with
passing permitted was assumed as the base condition.
0.25-2.0 mi
Length
1.0 mi Spacing
1.0-8.0 mi
Length
1.0 mi

46
The plots indicate that the value of percent time delay for any given two-way volume
decreases as the percentage of four-laned roadway increases. Thus, the higher the length of
passing lanes for a given stretch of highway, the lower is the percent time delay value. When
passing lanes are added, quality of flow is noted to improve by two levels of service for the
higher volume cases. As a rule of thumb, increasing the percentage of four-laned roadway
increases the design life by the same number of years. For example, a 20 percent increase in a
four-laned section increases the design life by 20 years, assuming a nominal traffic growth of
2 percent per annum.
Variation of Percent Time Delay with Truck Percentage
The variation of the percent time delay with truck percentage for a two-way volume of
600 vph is shown in Figure 34. The figure indicates the percent time delay generally is
insensitive to the percentage of trucks for two-lane highways having passing lanes. Percent time
delay remains nearly a constant for increasing truck percentage, suggesting that the addition of
passing lanes greatly improves the operational characteristics on these highways by increasing
convenient passing opportunities and reducing traffic delays. This finding could be attributed to
the fact that slow-moving vehicles are much easier to pass in the multi-lane passing section than
on a conventional high-volume two-lane, two-way highway.

47
Figure 33. Variation of Percent Time Delay with Two-Way Volume and AADT for 10 Percent Trucks.
0
10
20
30
40
50
60
70
80
0 1000 2000 3000 4000 5000 6000 7000 AADT
Per
cen
t T
ime
Del
ay
Standard Two-Lane Section Without Passing Lanes Length = 2.0 mi, Spacing = 8.0 mi; Percentage Four-Laned = 20% Length = 1.0 mi, Spacing = 1.0 mi; Percentage Four-Laned = 50%
0
10
20
30
40
50
60
70
80
0 200 400 600 800 1000 1200 Two-Way Volume (vph)
Per
cen
t T
ime
Del
ay
Standard Two-Lane Section Without Passing Lanes Length = 2.0 mi, Spacing = 8.0 mi; Percentage Four-Laned = 20% Length = 1.0 mi, Spacing = 1.0 mi; Percentage Four-Laned = 50%
LOS A
LOS B
LOS C
LOS D

48
Figure 34. Variation of Percent Time Delay with Percent Trucks for a Two-Way Volume of 600 vph.
RECOMMENDATIONS
Recommended passing lane length and spacing values are shown in Table 7. The values
were determined based on the premise of minimizing cost and percent time delay. These values
are generally longer than those recommended by Harwood and Hoban (10), reflecting current
higher speed limits for rural roads than the speed limits present during their research.
Conversion of Super 2 roadways to four-lane highways should be considered when traffic
volumes exceed 6000 ADT for level terrain and 5000 ADT in rolling terrain.
Passing lanes should be located to best fit existing terrain and field conditions. Uphill
grades are preferred sites over downhill grades. Passing lanes on significant uphill grades should
extend beyond the crest of the hill. Passing lane sections should be placed to avoid major
intersections. If present, minor intersections that do not require deceleration lanes should be
located near the midpoint of passing lane sections, avoiding transition areas.
��������������������������������������������������������������������������������������������������������������������������������
��������������������������������������������������������������������������������������������������������������������������������
��������������������������������������������������������������������������������������������������������������������������������
��������������������������������������������������������������������������������������������������������������������������������
��������������������������������������������������������������������������������������������������������������������������������
����������������������������������������������������������������������������������������������������������������������������������������������������������������������������������������������������������������������������������������������������������������
��������������������������������������������������������������������������������������������������������������������������������
��������������������������������������������������������������������������������������������������������������������������������
��������������������������������������������������������������������������������������������������������������������������������
��������������������������������������������������������������������������������������������������������������������������������
0
5
10
15
20
25
30
35
40
45
50
0 5 10 15 20 25 30 35 40 45
Percent Trucks
Per
cen
t T
ime
Del
ay
Standard Two-Lane Section Without PassingLanes
Length = 2.0 mi, Spacing = 8.0 mi;Percentage Four-Laned = 25%
Length = 1.0 mi, Spacing = 1.0 mi;Percentage Four- Laned = 50%

49
Table 7. Recommended Values of Length and Spacing by ADT and Terrain.
ADT (vpd)
Level Terrain Rolling Terrain Recommended Passing
Lane Length (mi)
Recommended Distance Between
Passing Lanes (mi)
�1950 �1650 0.8-1.1 9.0-11.0
2800 2350 0.8-1.1 4.0-5.0
3150 2650 1.2-1.5 3.8-4.5
3550 3000 1.5-2.0 3.5-4.0
Traffic signals on highways in incorporated areas tend to build platoons. These platoons
of through traffic leaving the last traffic signal in an incorporated area should be broken up
before entering subsequent rural two-lane highway sections, if practical. The last signal should
desirably feed into a continuation of the urban four-lane cross-section (if present in the city) or,
alternatively, into a passing lane section. A one-half mile multi-lane section located immediately
outbound of the last traffic signal is preferred; however, an outbound passing lane starting near
the outskirts of the developed area is an alternative in more restrictive conditions.


51
CHAPTER 5
LANE AND SHOULDER WIDTHS
INTRODUCTION AND SAFETY ISSUES
Total roadway width is among the most important cross-section considerations in the
safety performance of a two-lane highway. Generally, wider lanes or shoulders, or both, will
result in fewer accidents. Additionally, safety evaluations have shown that passing lanes and
short four-lane sections reduce accident rates below the levels found on conventional two-lane
highways. Comparisons of the results of two before-and-after evaluations of passing lane
installations are shown in Table 8. A California study at 23 sites in level, rolling, and
mountainous terrain found accident rate reductions of 11 to 27 percent due to passing lane
installation, depending on the road width (3). Accident rate reduction effectiveness at the 13
sites in level or rolling terrain was 42 percent. Another study of 22 sites in four states indicated a
9 percent accident rate reduction effectiveness for all accidents and a 17 percent accident rate
reduction effectiveness for fatal and injury accidents. The combined data from both studies
indicates that passing lane installation reduces accident rate effectiveness by 25 percent (3).
Table 8. Accident Reduction Effectiveness of Passing Lanes (adapted from 3). Percent Reduction Terrain Type Total
Roadway Width*
Number of Passing Lane
Sites All Accidents
Fatal and Injury
Accidents 36 4 11 -- 40 14 25 --
Level, rolling, and mountainous
42-44 5 27 --
Study 1 (Rinde)
Level and rolling sites only
36-44 13 42 --
Study 2 (Harwood and St. John)
Level and rolling 40-48 22 9 17
Combined Totals for Level and Rolling Terrain 35 25 -- * Total roadway width includes both lane and shoulder widths.
Many Texans use the shoulder of the roadway to allow faster vehicles to pass. As
reported by Fambro et al., the use of the shoulder as a turnout lane to facilitate passing was
thought to improve safety and operations on the roadway (16). Since the shoulder is often used

52
to allow vehicles to pass, providing a lane for passing seems to be a natural transition for Texas
drivers. However, the answer to the question of what shoulder width should be provided in
addition to the passing lane is unclear.
DRIVER SURVEYS
As described in Chapter 2, survey respondents were asked whether they would feel
comfortable stopping to change a tire on various width shoulders (presented pictorially). Of the
134 drivers surveyed, 70 percent reported they would be comfortable stopping on 10-ft
shoulders, 49 percent reported they would be comfortable stopping on 6-ft shoulders, and 20
percent reported they would feel comfortable about stopping on 4-ft shoulders.
EXISTING RECOMMENDATIONS FOR LANE AND SHOULDER WIDTHS
Researchers reviewed state design guidelines; national design guidelines; current
literature; widths on existing passing lane sections in Kansas, Minnesota, and Texas; and
available international design guidelines regarding lane and shoulder widths in passing lane
sections. Several agencies have current recommendations for passing lane sections. These
agencies include the American Association of State Highway and Transportation Officials
(AASHTO); the states where field studies were conducted for this project—Kansas, Minnesota,
and Texas; and other countries as noted in the literature.
AASHTO’s recently updated version of the Green Book (4) includes a new section on
passing lanes. The Green Book states that the width of an added lane should normally be the
same as the lane widths of the two-lane highway. It also states that it is desirable for the
adjoining shoulder to be at least 4 feet wide and that, whenever practical, the shoulder width in
the added section should match that of the adjoining two-lane highway. However, the Green
Book also states that a full shoulder width is not as needed on a passing lane section as on a
conventional two-lane highway because: (1) the vehicles likely to stop are few, and (2) there is
little difficulty passing a vehicle with only two wheels on the shoulder. Thus, if the normal
shoulder width on the two-lane highway is 10 ft, a 6 to 8 ft widening of the roadbed on each side
is all that may be needed. These recommendations are based upon the FHWA informational

53
guide Low Cost Methods for Improving Traffic Operations on Two-Lane Roads by Harwood and
Hoban (10).
Kansas State University completed a study entitled “Review of the Effectiveness,
Location, Design, and Safety of Passing Lanes in Kansas” (9). This study recommends that
passing lane widths should not be less than the width of the lanes in the adjoining sections but
that reduced shoulder widths with a minimum of 4 feet may be used in the passing lane section.
The study also recommends that the cross slope should stay the same as the adjacent lane.
The Minnesota Department of Transportation (Mn/DOT) specifies a desirable passing
lane shoulder width of 8 feet with a 6-foot minimum, while the basic shoulder width of the
adjoining lanes is 10 feet. MnDOT also specifies a passing lane width of 12 feet (17).
TxDOT does not currently have recommendations for passing lane sections. However,
the current recommendations for climbing lane sections refer the designer to Table 3-8 of
TxDOT’s Roadway Design Manual (18). Based upon this table, required lane widths are 10 to
12 feet, and shoulder widths vary from 4 to 10 feet, depending upon the roadway classification
(arterial or collector) and upon the roadway’s ADT. Table 9 lists the information included in
TxDOT’s Table 3-8 with the information also converted to English units.
Other Recommendations
Recommendations for lane and shoulder widths in Australia, Ontario, British Columbia,
Alberta, and Parks Canada are summarized in Table 10 along with the recommendations
previously described (19). As shown in Table 10, the lane widths typically recommended were
either 12 feet or widths that matched adjacent roadway sections. Shoulder width
recommendations ranged from “minimum” values of 3 to 6 feet to “desirable” values that
matched adjacent roadway sections.

54
Table 9. Portion of TxDOT’s Table 3-8 for Lane and Shoulder Width Values (adapted from 18).
Functional Class Design Speed (mi/h) Minimum Width 1,2 for future ADT of:
< 400 400-1500 1500-2000 > 2000
Arterial LANES (m)
- All 3.6 (12 ft)
- SHOULDERS (m)
- All 1.23
(4 ft) 1.23 or 2.43
(4 – 8 ft) 2.43
(8 ft) 2.4 - 3.03
(8 – 10 ft) Collector LANES (m)
- 50 (30 mph)
3.0 (10 ft)
3.0 (10 ft)
3.3 (11 ft)
3.6 (12 ft)
- 60 (40 mph)
3.0 (10 ft)
3.0 (10 ft)
3.3 (11 ft)
3.6 (12 ft)
- 70 (45 mph)
3.0 (10 ft)
3.0 (10 ft)
3.3 (11 ft)
3.6 (12 ft)
- 80 (50 mph)
3.0 (10 ft)
3.0 (10 ft)
3.6 (12 ft)
3.6 (12 ft)
- 90 (55 mph)
3.0 (10 ft)
3.0 (10 ft)
3.6 (12 ft)
3.6 (12 ft)
- 100 (60 mph)
3.3 (11 ft)
3.3 (11 ft)
3.6 (12 ft)
3.6 (12 ft)
- 110 (70 mph)
3.3 (11 ft)
3.3 (11 ft)
3.6 (12 ft)
3.6 (12 ft)
- SHOULDERS (m)
- All 0.64,5
(2 ft) 1.25
(4 ft) 2.45
(8 ft) 2.4 - 3.05
(8 – 10 ft) 1 Minimum surfacing width is 7.2 m for all on-system state highway routes. 2 On high riprapped fills through reservoirs, a minimum of two 3.6 m lanes with 2.4 m shoulders should be provided for roadway sections. For arterials with 2000 or more ADT in reservoir areas, two 3.6 m lanes with 3.0 m shoulders should be used. 3 On arterials, shoulders fully surfaced. 4 On collectors, use minimum 1.2 m shoulder width at locations where roadside barrier is utilized. 5 For collectors, shoulders fully surfaced for 1500 or more ADT. Shoulder surfacing not required but desirable even if partial width for collectors with lower volumes and all local roads. Minimum width of new or widened structures should accommodate the approach roadway including shoulders.

55
Table 10. Summary of Existing Recommendations for Lane and Shoulder Widths on Passing Lanes.
AA
SHT
O
(bas
ed o
n H
arw
ood)
KD
OT
Mn/
DO
T
TxD
OT
(fo
r C
limbi
ng
Lan
es)
Ont
ario
Bri
tish
C
olum
bia
Alb
erta
Par
ks
Can
ada
Aus
tral
ia
Lane Width
Same as adjoining road or 12 ft
Not less than adjoining road
12 ft 10-12 ft 10.5 ft min; 11 ft desirable
12 ft 11.5 ft 12 ft Normally 11.5 ft; not less than other lane width provided
Shoulder Width
4 ft min; match other shoulder when possible
4 ft min 6 ft min; 8 ft
desirable
4-10 ft 3 ft min; equal to approach shoulder desirable
6 ft 5 ft 4 ft 3 ft
PROJECT RECOMMENDATIONS Current lane width recommendations for passing sections range from 10 feet to 12 feet, a
desirable width of 12 feet, or a minimum width to match that of the existing lanes on the two-
lane roadway.
Recommendations for shoulder lane width are not as straightforward. Several items
should be considered in determining the shoulder width for a passing lane section. Studies have
indicated that the addition or widening of a shoulder greatly improves safety—shoulder widening
can reduce related accidents by up to 49 percent with the addition of an 8-foot shoulder (20).
Therefore, it follows that the presence of a shoulder in a passing lane section increases the
overall safety of the passing lane. The presence of a shoulder also increases the driver’s comfort
level. Additionally, driver expectancy may be violated when traveling from a two-lane section
with a wide shoulder to a three-lane section with no shoulder or with a very narrow shoulder.
However, as noted by Harwood (2), passing lane sections are short, and few vehicles are likely to
stop in these sections. If vehicles do have to stop for an emergency, extra width for going around
the vehicle is provided by the width of the additional lane.
Other user groups should also be considered in the provision of shoulders in passing lane
sections. Pedestrians and bicyclists may also use the roadways with passing lane sections; if so,

56
they may travel on the shoulder. Rumble strip installation also affects these users; if a rumble
strip is placed in the center of the shoulder, usable space for pedestrians and bicyclists is limited.
The Federal Highway Administration (FHWA) has developed a Draft Technical Advisory for
rumble strip installation on non-freeways (21). These guidelines are summarized as follows:
1. Standard milled rumble strips, installed as close to the edgeline as practical, should be
used when an 8-foot clear shoulder width remains available after installation of the
rumble strip.
2. A modified design should be used when the remaining available clear shoulder width is
less than 6 feet wide and the road is used by cyclists. The most recent studies indicate a
milled depth of approximately 3/8 inch provides reasonable warning to motorists while
not being unduly dangerous to cross on a bicycle when necessary. Some states have also
used narrower strips (less than 16 inches) perpendicular to the direction of traffic
successfully. Others have adopted a gap spacing to allow a cyclist to cross into the travel
lane and back without having to cross directly over the rumble strips.
3. Rumble strips should not normally be used when their installation would leave a clear
shoulder pathway less than 4 feet wide for bicycle use (21).
As shown in Table 10, current recommendations for minimum shoulder widths range
from 3 to 6 feet. Other recommendations include making the shoulder as wide as the adjoining
roadway section when possible. Based upon existing recommendations from other states and
other countries, upon the considerations previously noted, and upon the survey results,
researchers recommend the values in Table 11 for lane and shoulder widths in passing lane
sections.
Table 11. Project Recommendations for Lane and Shoulder Widths.
Lane Width 12 ft or Values in Table 3-8 of TxDOT’s Roadway Design Manual
Shoulder Width* Minimum (allowable only where traffic volumes
are below 2000 ADT): 6 ft if rumble strips are used
4 ft if rumble strips are not used Desirable: Values in Table 3-8 of TxDOT’s Roadway Design
Manual *Shoulders used in passing lane sections should be paved.

57
CHAPTER 6
SIGNING AND MARKING
The primary means of communicating the designer’s intentions for the use of a roadway
is through its signs and pavement markings. Signs and markings explicitly inform the driver of
permitted and required behavior such as passing or lane positioning. If drivers do not understand
or agree with the intent of the designer, however, drivers may exhibit unpredictable or
undesirable behavior.
The research team sought to develop a clear understanding of recommended signing and
marking schemes and plans, seeking supporting research findings where available. As discussed
in Chapter 3, a number of questions were examined through use of a survey of Texas drivers. In
addition, a field study of a pavement marking pattern at the introduction of the passing lane was
conducted.
SIGNS
Signing is intended to enhance the driver’s understanding of the intended use of the
roadway. Choosing a signing system that accomplishes this goal will enhance the operation of a
passing lane by informing the driver of the intended use of the passing lane and the upcoming
opportunities to pass. Signing associated with passing lanes is usually provided in six distinct
areas along the passing lane section, as shown in Figure 35. These areas are:
1. in advance of the passing lane;
2. the transition area of the lane addition of the passing lane;
3. in advance of the termination of the passing lane;
4. the transition of the lane reduction of the passing lane;
5. the downstream area adjacent to the passing lane; and
6. in the opposing direction of the passing lane.

58
Figure 35. Passing Lane Signing Areas.
Advance Notice of the Passing Lane
Advance notice of passing lanes can reduce the likelihood of unsafe passes by informing
the driver of the upcoming passing opportunity. The Kansas Department of Transportation
(KDOT) uses a guide sign that gives advance notice of the upcoming passing lane 2 miles ahead,
as shown in Figure 36. The Minnesota Department of Transportation uses a regulatory sign
placed 2 miles upstream of the passing lane to provide advance notice of passing lanes, also
shown in Figure 36.
Little guidance is available to determine whether the advance notice sign should be a guide
or regulatory sign, although a case can be made for either. In the case of the guide sign, notice is
given of a facility (in this case a passing lane) designed to assist travelers with information. In
the case of the regulatory sign, the viewpoint is that the passing lane is a facility that has certain
laws or regulations associated with its operation.
Figure 36. Advance Notice Signing in Kansas (left) and Minnesota (right).

59
The signing practice in Alberta, Canada is to provide advance notice of the upcoming passing
lane in a similar manner to Mn/DOT, although the placement is 1.2 miles (2 km) upstream.
Figure 37 illustrates the advance signing used in Canada’s Ontario province (9). An
interpretation of the symbolic sign’s meaning is that the shorter arrow terminating at a point
lower than the longer arrow represents slower moving vehicles. The meaning is then reinforced
with another sign upon reaching the passing lane.
Figure 37. Advance Notice Signing in Ontario, Canada.
Transition Area of the Passing Lane Addition
The literature and current practice of signing associated with the addition of the passing
lane focuses on three signs. These regulatory signs are KEEP RIGHT EXCEPT TO PASS,
SLOWER TRAFFIC KEEP RIGHT, and LEFT LANE FOR PASSING ONLY as illustrated in
Figure 38.
Figure 38. Typical Signing at the Passing Lane Addition.

60
Each of the signs in Figure 38 intends to convey the message that passing is to be carried
out in the left lane. There is disagreement regarding which sign is more appropriate, although
Hoban and Morral (19) report that SLOWER TRAFFIC KEEP RIGHT is being used in some
areas of Canada in lieu of KEEP RIGHT EXCEPT TO PASS, with the belief that the sign
conveyed a stronger meaning to drivers. These researchers also made the same observation in
areas of Australia, with the exception of RIGHT being replaced by LEFT.
State law within Texas currently asserts that it is not legal to drive in the left lane unless
passing another vehicle. In light of this fact, the sign conveying the strongest, clearest meaning
would seem to be the most beneficial in instructing drivers to seek the outside lane unless
involved in a passing maneuver along passing lane sections.
Advance Notice of Passing Lane Termination and Lane Reduction
Advance notice of the termination of the passing lane and subsequent lane reduction is
required as per the Manual on Uniform Traffic Control Devices (MUTCD) (22). There are some
agencies that use one sign in advance of the passing lane termination, while others use two. The
sign in advance typically provides a distance to the termination of the passing lane, while the
additional sign is placed at the point of termination or corresponding beginning of merge taper.
The spacing in advance of the merge taper to one lane is determined based upon the 85th
percentile speed of the roadway. The typical sign previously used in Texas and found in the
literature has been the symbolic lane reduction sign shown in Figure 39. However, with the
recent elimination of this sign in the MUTCD (22), a different sign must be utilized to merge
traffic from the lane being dropped.
In order to provide advance notice of the upcoming merge, a RIGHT LANE ENDS sign
with a plaque similar to the one shown in Figure 40 is used. As previously noted, the distance
shown on the plaque varies according to the 85th percentile speed of the roadway (22).
At or within close proximity of the beginning of the merge taper, a LANE ENDS
MERGE LEFT SIGN as shown in Figure 41 is used. This sign provides the information that at
this point, the roadway transitions from two lanes to one (22).

61
Figure 39. Obsolete Lane Reduction Sign.
Figure 40. Advance Notice of Passing Lane Termination.
Downstream Area
The downstream area adjacent to the passing lane section is an area where notification
can be provided to drivers about upcoming passing lane sections, or that there are no upcoming
passing lanes. This information is important because it allows drivers to have a better
expectancy regarding forthcoming passing opportunities, thus enhancing the operation of the
roadway.

62
Figure 41. Merge Transition Area Signing.
Opposing Traffic
Traffic flowing in the opposite direction of the passing lane must be provided information
regarding whether they may cross into the lane to their left (i.e., the oncoming passing lane).
This information can be provided through longitudinal pavement markings or a combination of
both signs and pavement markings.
A no passing zone is typically provided at the merge transition area of the passing lane to
reduce possible conflicts as drivers complete the merge maneuver. The addition of a NO
PASSING ZONE sign similar to the one shown in Figure 42 can be used in addition to double
yellow markings in order to provide more information to the driver if desired (22).
Figure 42. No Passing Sign.
For opposing traffic traveling adjacent to the passing lane, passing may or may not be
permitted. Canada’s Alberta Transportation and Ontario Ministry of Transportation use AADT
as criteria for the restriction of passing. If the AADT is less than 4000 vpd, passing is permitted
provided there is adequate sight distance (19). In these instances, Alberta uses the sign DO NOT
PASS WHEN TRAFFIC ONCOMING spaced at approximately 1640 ft (500 m), while Ontario

63
uses PASS ONLY WHEN CENTER LANE IS CLEAR spaced at approximately 2625 ft (800 m)
(9).
While Australia has no criteria for determining a cutoff point for passing by the opposing
traffic, they do use a sign with three arrows representing each lane’s direction of travel. This
sign is similar to the optional sign shown in Harwood and Hoban’s recommended passing lane
signing and marking configuration for passing lanes shown in Figure 43 (9, 19).
One solution to alleviate passing by opposing traffic is simply to construct side-by-side
passing lanes as illustrated in Figure 44. With the construction of passing lanes on either side of
the centerline, the need for passing by opposing traffic in the passing lane is eliminated. The
construction of side-by-side passing lanes may cause a decrease in operational efficiency but at a
slightly increased level of safety. However, further study is necessary to fully confirm these
speculations.
To review, a number of alternative signing layouts have been reported in the literature.
Table 12 provides an overview of the signing schemes that have been used or recommended,
along with their source. In examining the signing strategies shown in Table 12, it is clear that a
majority of sources report use of the following signs as a part of a signing strategy for passing
lanes: an advance sign notifying drivers of the presence of an upcoming passing lane and a sign
stating that drivers should keep right except to pass.
Two signing elements form the basis for the defining characteristics of a passing lane:
drivers should be notified that the passing lane is upcoming so that they are more willing to delay
passes until the passing lane is reached, and they should be notified about the purpose of the
additional lane so they move to the right lane unless they are passing a vehicle. Because Texas
has a legal requirement that drivers use the outside lane unless they are passing, the second sign
also informs them of their legal obligation.

64
Figure 43. Harwood, Hoban, and Warren Passing Lane Signing and Marking (23).
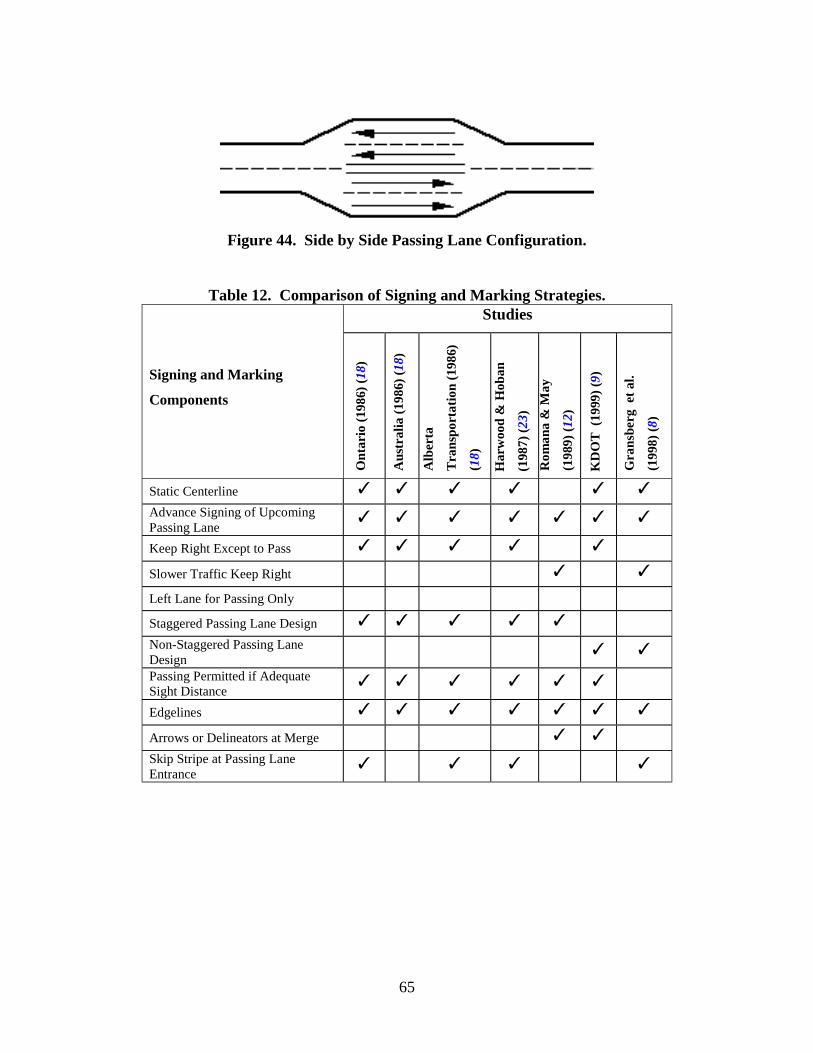
65
Figure 44. Side by Side Passing Lane Configuration.
Table 12. Comparison of Signing and Marking Strategies. Studies
Signing and Marking
Components
Ont
ario
(19
86)
( 18)
Aus
tral
ia (
1986
) ( 1
8)
Alb
erta
Tra
nspo
rtat
ion
(198
6)
(18)
Har
woo
d &
Hob
an
(19
87)
( 23)
Rom
ana
& M
ay
(198
9) (
12)
KD
OT
(19
99)
(9)
Gra
nsbe
rg e
t al
.
(199
8) (
8)
Static Centerline � � � � � �
Advance Signing of Upcoming Passing Lane
� � � � � � �
Keep Right Except to Pass � � � � �
Slower Traffic Keep Right � �
Left Lane for Passing Only
Staggered Passing Lane Design � � � � �
Non-Staggered Passing Lane Design
� �
Passing Permitted if Adequate Sight Distance
� � � � � �
Edgelines � �� �� �� � � �
Arrows or Delineators at Merge � �
Skip Stripe at Passing Lane Entrance
� � � �

66
SURVEY FINDINGS
Several of the questions from the survey reported in Chapter 3 revolve around signing
practices. Figure 1 provided three alternative wordings to inform drivers that they should stay in
the right lane unless engaged in a passing maneuver. The wording of “KEEP RIGHT EXCEPT
TO PASS,” “SLOWER TRAFFIC KEEP RIGHT,” AND “LEFT LANE FOR PASSING
ONLY” was provided to drivers in the survey in open-ended questions requesting their
interpretation of the signs’ meanings.
Almost all of the survey respondents correctly interpreted that they should use the right
lane unless passing another vehicle for the two signs stating “KEEP RIGHT EXCEPT TO
PASS” and “LEFT LANE FOR PASSING ONLY,” with “SLOWER TRAFFIC KEEP RIGHT”
having a greatly reduced level of understanding. Based on the response to a follow-up question,
most drivers felt that “LEFT LANE FOR PASSING ONLY” conveyed a stronger meaning (71
percent).
Sign Color
The Texas MUTCD provides the basis for signing in Texas, and was developed to ensure
consistency and uniformity. A number of principles have been identified to determine
appropriate sign characteristics (24):
• “Regulatory signs give notice of traffic laws or regulations.” The signs are generally
black legend on white background; an example is SPEED LIMIT 70 MPH.
• “Guide signs show route designations, destinations, directions, distances, services,
points of interest, and other geographical, recreational, or cultural information.” The
signs are generally white legend on green background; examples include WEIGH
STATION 1 MILE and PARK AND RIDE.
• “Warning signs call attention to conditions on, or adjacent to, a highway or street that
are potentially hazardous to traffic operations.” The signs are generally black legend
on yellow background; an example is DIVIDED HIGHWAY ENDS.

67
Based on these principles, the signs recommended for the Texas Super 2 passing lane layout
should have the following colors:
• PASSING LANE 2 MILES: white on green,
• LEFT LANE FOR PASSING ONLY: black on white,
• RIGHT LANE ENDS: black on yellow,
• LANE ENDS MERGE LEFT: black on yellow, and
• NEXT PASSING LANE X MILES: white on green.
MARKINGS
According to the Texas MUTCD, pavement markings may be used in conjunction with or
independent of other devices such as traffic signs (24). Their independent use is hampered under
certain conditions such as snow or wetness because of reduced visibility, although their use can
still be very effective in communicating with the driver without diverting the driver’s attention
from the roadway.
Although other markings may be present (i.e., edgelines, centerlines, etc.), this review of
pavement markings will focus specifically on those types and characteristics of markings
associated with passing lanes. The two specific areas investigated include the provision and
delineation of passing zone markings in the passing lane area and the use of markings at the
entrance to the introduced passing lane. Table 12 provides an overview of various reported
marking patterns, together with their source.
Passing Zone Markings
Passing zone demarcation has been treated in a number of different ways, depending on
whether the markings are in the lane transition area, in the area of the fully developed passing
lane, or in a location with specific traffic volume ranges.

68
Fully Developed Passing Lane
A variety of strategies have been used in setting passing zone markings in passing or
climbing lane sections. Practices vary depending upon prior operational experience and with
regard to tort liability concerns. The passing zone markings referred to are the markings that
separate the directions of travel. In all of the cases discussed in the literature, crossing from the
side of the roadway with a passing lane into the opposing direction of traffic is prohibited; the
passing zone markings discussed either permit or prohibit traffic in the opposing lane from
crossing into the passing lane (see Figure 45).
Figure 45. Passing Zone Markings.
Canadian practices vary considerably, depending upon the province or operating agency
(19). In Ontario, passing is permitted across the centerline (from the opposing lane into the
passing lane) unless sight distance restrictions are present. British Columbia has had a more
varied practice. Prior to 1981, centerline striping practices were similar to Ontario, with passing
permitted if adequate passing sight distance was available. A court decision in late 1980
regarding an accident led to a revised policy, however, with centerline no passing zones being
marked on all passing lane roadway sections. This policy was revised in the mid-1980s, and
passing permitted designations could be considered if traffic volumes were under 4000 vehicles
per day. Centerline marking practices were also reported for Alberta. Similar to Ontario’s
revised practice, Alberta was reported as providing permitted passing for roadways with less than
4000 vehicles per day if sufficient sight distance was present. Hoban and Morrall also reported
on Australian passing marking practices (19). In the designs reviewed, passing was permitted in
areas that provided sufficient sight distance.
In a 1989 study of passing lanes, Romana and May provided an illustration of an example
passing lane from the California Traffic Manual (12). The example permits passing in a similar
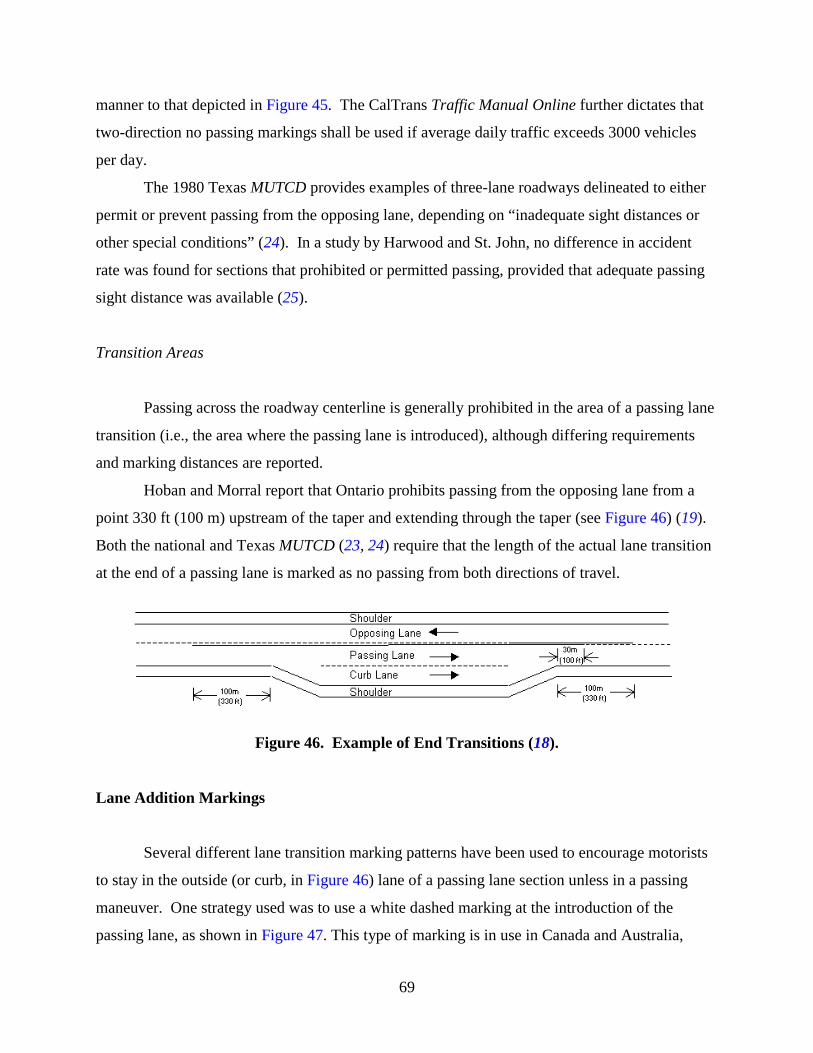
69
manner to that depicted in Figure 45. The CalTrans Traffic Manual Online further dictates that
two-direction no passing markings shall be used if average daily traffic exceeds 3000 vehicles
per day.
The 1980 Texas MUTCD provides examples of three-lane roadways delineated to either
permit or prevent passing from the opposing lane, depending on “inadequate sight distances or
other special conditions” (24). In a study by Harwood and St. John, no difference in accident
rate was found for sections that prohibited or permitted passing, provided that adequate passing
sight distance was available (25).
Transition Areas
Passing across the roadway centerline is generally prohibited in the area of a passing lane
transition (i.e., the area where the passing lane is introduced), although differing requirements
and marking distances are reported.
Hoban and Morral report that Ontario prohibits passing from the opposing lane from a
point 330 ft (100 m) upstream of the taper and extending through the taper (see Figure 46) (19).
Both the national and Texas MUTCD (23, 24) require that the length of the actual lane transition
at the end of a passing lane is marked as no passing from both directions of travel.
Figure 46. Example of End Transitions (18).
Lane Addition Markings
Several different lane transition marking patterns have been used to encourage motorists
to stay in the outside (or curb, in Figure 46) lane of a passing lane section unless in a passing
maneuver. One strategy used was to use a white dashed marking at the introduction of the
passing lane, as shown in Figure 47. This type of marking is in use in Canada and Australia,

70
although there is some variation among the various provinces and states (19). A similar pattern
is recommended by Harwood and Hoban (10) for the United States.
Figure 47. White Dashed Marking at Transition.
As noted by Harwood et al. the MUTCD does not provide a marking recommendation for
the area of a lane addition (22, 23). Harwood et al. recommend the use of white dashed line
tapering across the opening to the passing lane (see Figure 47) to encourage drivers to go to the
right or curb lane. Drivers engaged in a passing maneuver are permitted to cross the dashed
marking. It is noted that several state agencies use this marking, although specifics are not
provided by the authors.
Survey Findings
In the survey described in Chapter 3, motorists were asked questions regarding their
behavior if they encountered the entrance to a passing lane with and without the supplementary
marking. Of the surveyed drivers, 68 percent stated that they would cross the dashed markings
to immediately enter the passing lane to pass a slower vehicle, while 96 percent said they would
enter the passing lane in a similar situation if no supplementary markings were present. This
difference of almost 30 percent indicated a substantial change in behavior that could produce a
less efficient passing maneuver (i.e., the driver waits until further into the passing lane section
before initiating a pass, thus requiring a longer passing lane).
Survey respondents who were asked which lane they would select if they were not close
to another vehicle stated that they would enter the outside lane 87 percent of the time if markings
were not present and 80 percent of the time if the markings were present. Because the additional

71
transition markings were intended to encourage drivers to move to the outside lane, these
findings were somewhat disconcerting. Further examinations of driver behavior were pursued in
a field study.
Field Study
A field study of driver behavior was completed to examine lane selection for various
entrance treatments for passing lane sections in Minnesota, Kansas, and Texas. Researchers
analyzed the effect of different lane marking treatments on drivers’ passing behavior. The time
headway data were collected from several study sites in three states: Kansas, Minnesota, and
Texas. All sites within each state had identical lane marking treatments: Kansas (Type A) no
entrance skip striping (see Figure 48); Minnesota (Type B) gore channelizing all vehicles into the
outside lane (see Figure 49); Texas (Type A for “before study,”) similar to Figure 48; and Texas
(Type C, entrance skip striping for “after study”), shown in Figure 50.
Data regarding lane selection were collected using classifiers that were connected to
pneumatic tubes extending across the outside and inside lanes of the roadway. Data were
collected at a point located 500 ft past the upstream transition from a single lane to the two-lane
passing section. Researchers determined platoons and lane assignment by collecting vehicle
headways, speeds, and volumes. Video data were also recorded in this section, allowing
researchers to verify vehicle movements and check for erratic behavior.

72
Figure 48. Kansas and Texas “Before” Passing Lane Entrance Markings.
Figure 49. Minnesota Passing Lane Entrance Markings.

73
Figure 50. Texas “After” Passing Lane Entrance Markings.
Analysis
The data analysis was designed for two different data sets: (1) paired vehicles with
headways less than 3 seconds, and (2) a single vehicle with a headway five or more seconds. For
a pair of vehicles approaching a passing lane, four combinations of lane selection were possible:
• L-right, T-right: leading vehicle in right lane and trailing vehicle in right lane,
• L-right, T-left: leading vehicle in right lane and trailing vehicle in left lane,
• L-left, T-right: leading vehicle in left lane and trailing vehicle in right lane, and
• L-left, T-left: leading vehicle in left lane and trailing vehicle in left lane.
For a single vehicle, either the left or right lane is selected. The analysis was performed to
investigate whether the three lane treatments have a significant effect on the driver’s passing
behavior.
Table 13 summarizes the headway data collected over a six-hour period at each study
site. Although the data collection periods were the same duration in each state, Texas had a
smaller number of data points: roughly 20 percent of data from the other states.

74
Table 13. Summary of Data Collected.
State Set Name Date Hours Type
1
2
US 50 EB West of Emporia
US 50 EB West of Emporia
11/28/00
11/29/00
6
6
Kansas
3 US 50 EB West of Strong City 11/30/00 6
A
1
2
US 12 EB East of Cokato
US 12 EB East of Cokato
04/24/01
04/25/01
6
6
Minnesota
3 TH 371 NB North of Little Falls 04/26/01 6
B
1 US 83 SB Childress 06/12/01 6
2 US 83 SB Leakey 06/21/01 6
Texas Before
3 US 83 NB Eden 06/21/01 6
A
1 US 83 SB Childress 06/19/01 6
2 US 83 SB Leakey 06/28/01 6
Texas After
3 US 83 NB Eden 06/28/01 6
C
The proportion of lane selection was calculated for pairs of vehicles entering the passing
lane at each site, and the results are shown in Figures 51-54. In Kansas (Type A), nearly 70
percent of drivers followed the “L-right, T-left” pattern, and approximately 25 percent of drivers
chose the “L-right, T-right” selection. In Minnesota, (Type B), the percentage of “L-right, T-
right” was the highest, with a slightly higher percentage than “L-right, T-left.” This is because
the Type B treatment (double-yellow striped gore) explicitly encouraged vehicles to move to the
right lane. Both Kansas (Type A) and Minnesota (Type B) showed little daily (or site)
variability in percentages among the three data sets.
The proportions in Type C were similar to Kansas (Type A) in terms of overall trend.
However, the data showed some site variability with different proportions at the Leakey study
site. Within the Texas data, slightly different proportions were identified
when comparing between Type A and Type C; Type A had a higher percentage of “L-left, T-
right” and “L-left, T-left” vehicle pairs.

75
Figure 51. Proportion of Lane Selection for Kansas, Type A (Headway <3 sec).
Figure 52. Proportion of Lane Selection for Minnesota, Type B (Headway <3 sec).
0
10
20
30
40
50
60
70
80
90
100
L-rt, T-rt L-rt, T-lt L-lt, T-rt L-lt, T-lt
Lane Selection
Percentage of Vehicles
MN set1
MN set2
MN set3
0
10
20
30
40
50
60
70
80
90
100
L-rt, T-rt L-rt, T-lt L-lt, T-rt L-lt, T-lt Lane Selection
Percentage of Vehicles
KS set1 KS set2 KS set3

76
Figure 53. Proportion of Lane Selection for Texas “Before,” Type A (Headway <3 sec).
Figure 54. Proportion of Lane Selection for Texas “After,” Type C (Headway <3 sec).
Looking at single vehicles, the percentage lane selection was calculated for vehicles
having a headway greater than 5 seconds, and the results are illustrated in Figures 55-58. The
0
10
20
30
40
50
60
70
80
90
100
Lane Selection
Percentage of Vehicles
TX Childress: before
TX Leakey: before
TX Eden: before
L-rt, T-rt L-rt, T-lt L-lt, T-rt L-lt, T-lt
0
10
20
30
40
50
60
70
80
90
100
Lane Selection
Percentage of Vehicles
TX Childress: after
TX Leakey: after
TX Eden: after
L-rt, T-rt L-rt, T-lt L-lt, T-rt L-lt, T-lt

77
percentage of vehicles in the right lane was higher than the percentage of vehicles in the left lane
for all study sites. In particular, most vehicles (98 percent) selected the right lane in Type B. For
Type A, both Kansas and Texas indicated a similar pattern, but the magnitude was different by
10 percent. However, the lane selection distributions indicated that the three treatment types
might have three different types of performance effects on single vehicles.
Next, researchers performed a statistical analysis to investigate whether the differences in
the proportion of each lane selection for the three treatments were statistically significant. The
Chi-square test was selected for comparison of several binomial population proportions.
The test was performed with four different experimental designs. They are classified
in terms of magnitude of the following headway and types of lane treatments:
1. Test the proportion difference of lane selections for three lane treatments when
headway is less than 3 seconds for the four possible lane selection cases.
2. Perform a “before-and-after” study using Texas data only when headway is less than
3 seconds for the four possible lane selection cases.
3. Test the proportion difference of lane selection for three lane treatments when
headway is greater than 5 seconds: two possible lane selection cases (left or right).
4. Perform a “before-and-after” study using Texas data only when headway is greater
than 5 seconds: two possible lane selection cases (left or right).
The Chi-square test for differences in probabilities is described using an r×c contingency
table: r = 3 (i.e., i = 3 treatments), c = 4 (i.e., j = 4-lane selection behaviors) (26). The expected
number of observations in cell (i, j), Eij, is defined as follows:
N
CnE ji
ij = (2)

78
Figure 55. Proportion of Lane Selection for Kansas, Type A (Headway >5 sec).
Figure 56. Proportion of Lane Selection for Minnesota, Type B (Headway >5 sec).
0
10
20
30
40
50
60
70
80
90
100
Lane 1 Lane 2
Lane Selection
Percentage of Vehicles
KS set1 KS set2 KS set3
0
10
20
30
40
50
60
70
80
90
100
Lane 1 Lane 2
Lane Selection
Percentage of Vehicles
MN set1 MN set2 MN set3

79
Figure 57. Proportion of Lane Selection for Texas, Type A (Headway >5 sec).
Figure 58. Proportion of Lane Selection for Texas, Type C (Headway >5 sec).
0
10
20
30
40
50
60
70
80
90
100
Right Lane Left Lane Lane Selection
Percentage of Vehicles
TX Childress: before TX Leakey: before TX Eden: before
0
10
20
30
40
50
60
70
80
90
100
Right Lane Left Lane Lane Selection
Percentage of Vehicles
TX Childress: after TX Leakey: after TX Eden: after
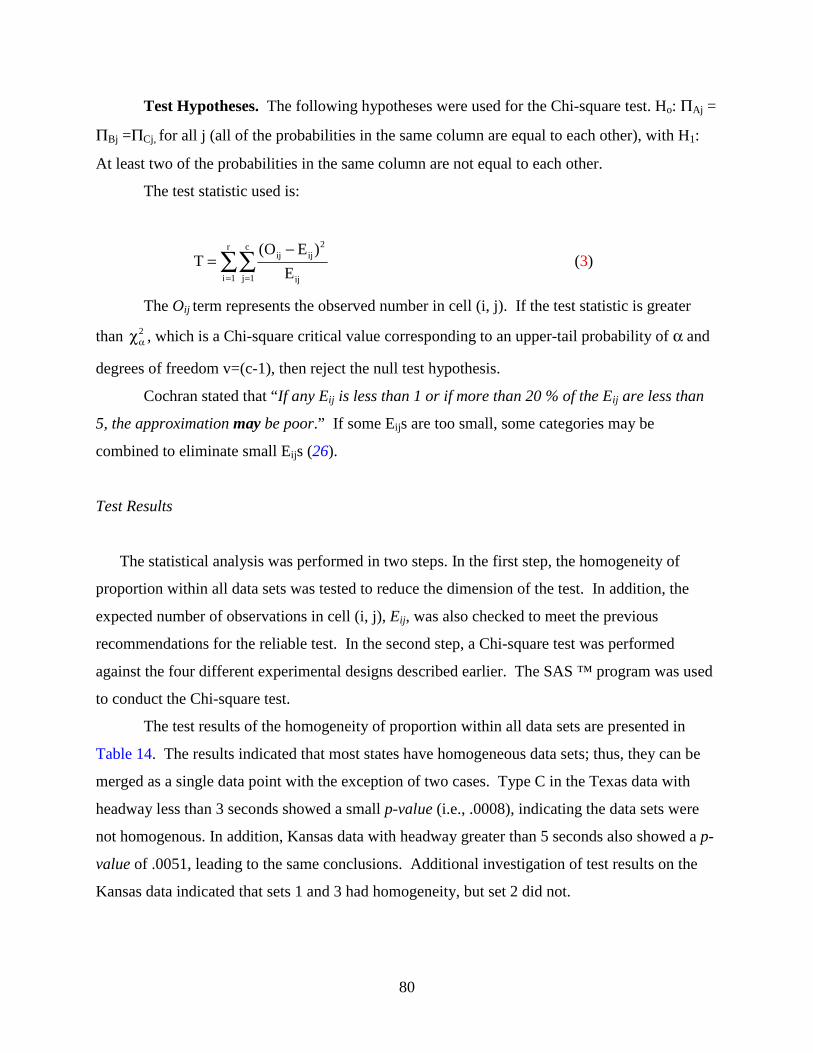
80
Test Hypotheses. The following hypotheses were used for the Chi-square test. Ho: ΠAj =
ΠBj =ΠCj, for all j (all of the probabilities in the same column are equal to each other), with H1:
At least two of the probabilities in the same column are not equal to each other.
The test statistic used is:
∑∑= =
−=
r
1i
c
1j ij
2ijij
E
)EO(T (3)
The Oij term represents the observed number in cell (i, j). If the test statistic is greater
than 2αχ , which is a Chi-square critical value corresponding to an upper-tail probability of α and
degrees of freedom v=(c-1), then reject the null test hypothesis.
Cochran stated that “If any Eij is less than 1 or if more than 20 % of the Eij are less than
5, the approximation may be poor.” If some Eijs are too small, some categories may be
combined to eliminate small Eijs (26).
Test Results
The statistical analysis was performed in two steps. In the first step, the homogeneity of
proportion within all data sets was tested to reduce the dimension of the test. In addition, the
expected number of observations in cell (i, j), Eij, was also checked to meet the previous
recommendations for the reliable test. In the second step, a Chi-square test was performed
against the four different experimental designs described earlier. The SAS ™ program was used
to conduct the Chi-square test.
The test results of the homogeneity of proportion within all data sets are presented in
Table 14. The results indicated that most states have homogeneous data sets; thus, they can be
merged as a single data point with the exception of two cases. Type C in the Texas data with
headway less than 3 seconds showed a small p-value (i.e., .0008), indicating the data sets were
not homogenous. In addition, Kansas data with headway greater than 5 seconds also showed a p-
value of .0051, leading to the same conclusions. Additional investigation of test results on the
Kansas data indicated that sets 1 and 3 had homogeneity, but set 2 did not.

81
Table 14. Chi-Square Test Results for Homogeneity of Proportion. p-value
State
Type Headway < 3 seconds Headway > 5 seconds Kansas A .6654 .0051
Minnesota B .3795 .2975
Texas A .1649 .0886
Texas C .0008 .1554
The expected number of observations in cell (i, j), Eij, was also calculated. It was found
that the Eij of “L-left, T-right” classification (with headway less than 3 seconds) was less than 5
for all study sites. Therefore, two lane selection types were combined into a single data point.
That is, the counts of “L-left, T-right” and “L-left, T-left” were combined into a new value to
meet the recommendations for the Chi-square test. In addition, the data of Type C in Texas data
with headway less than 3 seconds were also combined due to a small expected number of cell
observations. However, the Kansas data (with headway greater than five seconds) had a
sufficient expected number of cell observations. Therefore, the Kansas data were divided into
two different data sets (i.e., A1 = set1 + set3, A2 = set2), and they were used for the Chi-square
test. The final test data are illustrated in Table 15.
The Chi-square test results are summarized in Table 16. Four tests were performed for
the experimental design described. Test results showed that the differences in proportion from
all experimental designs were statistically significant at the 5 percent significance level.
Conclusions
Researchers performed additional tests to identify the differences in proportion for each
treatment type. The tests included several test hypotheses, and these results are also included in
Table 16.

82
Table 15. Vehicle Count for Statistical Test. Test Type L-right, T-right
(Lane 1*) L-right, T-left
(Lane 2*) L-left, T-right and
L-left, T-left
A 120 348 34
B 371 312 6
I
C 28 85 10
A 21 66 26 II C 28 85 10
A1 616 205 n/a
A2 211 105 n/a
B 1582 22 n/a
III
C 532 62 n/a
A 351 186 n/a IV C 532 62 n/a
Note: * Notation for test III and IV.
From the Test I result, the difference in proportion was significant between Type A and
Type B as well as between Type B and Type C. However, no significant difference in
proportion was observed between Type A and Type C (i.e., p-value = .8550). The experimental
design of Test II is similar to Test I, except Test II included only Texas data. Results of Test II
indicated that Types A and C could have different proportions. This conclusion is the opposite
of the conclusion reached in Test I. This inconsistency might come from the variability within
the Texas data sets and the small number of data points. It should be noted that the size of the
data set of Type C in Texas was only about 20 percent of the sets in Kansas or Minnesota.
The results of Tests III and IV indicated that the difference in proportion was significant
within each treatment at the significance level of 5 percent. Therefore, it could be concluded that
when the vehicle’s headway is less than 3 seconds (i.e., platooned vehicle), there is a significant
difference between treatment Type B and the other two treatments. Whether the difference
between Type A and Type C is significant is unclear from the tests performed on this data set.
Testing using only the Texas “Before” and “After” data appears to indicate that the proposed
marking treatment is effective in changing driver behavior in platoons, but the addition of data
collected in Kansas resulted in a finding of no significant difference. Regional differences in
driver behavior could account for this variation in response, but the results are uncertain.
However, the marking treatment did have significant effects on lane selection when the vehicle
headways are greater than 5 seconds (i.e., single vehicle).

83
Table 16. Chi-Square Test Results for Proportion Difference. Test Ho p-value Reject Ho
ΠA = ΠB = ΠC .0001 Yes
ΠA = ΠB .0001 Yes
ΠA = ΠC .8550 No
I
ΠB = ΠC .0001 Yes
II Πbefore = Πafter .0064 Yes
ΠA1 = ΠA2 = ΠB = ΠC .0001 Yes
ΠA1 = ΠB = ΠC .0001 Yes
ΠA2 = ΠB = ΠC .0001 Yes
ΠA1 = ΠB .0001 Yes
ΠA1 = ΠC .0001 Yes
ΠA2 = ΠB .0001 Yes
ΠA2 = ΠC .0001 Yes
III
ΠB = ΠC .0001 Yes
IV Πbefore = Πafter .0001 Yes
RECOMMENDATIONS
Based on available research and the studies performed by the research team, the
following recommendations are made:
• Advance signing should be provided regarding the upcoming passing lane so that
drivers are aware of its presence. The preferred sign (and associated sign placement)
is that the passing lane is upcoming in 2 miles: PASSING LANE 2 MILES. This
sign will permit drivers to delay passing maneuvers until they can be made more
comfortably, although passing may still be permitted prior to the passing lane section.
• A sign should be provided just after the lane addition transition stating: LEFT LANE
FOR PASSING ONLY. This wording is required because of current Texas State law
(§ 544.011) rather than the more common KEEP RIGHT EXCEPT TO PASS.
• Standard RIGHT LANE ENDS and LANE ENDS MERGE LEFT signs should be
used to indicate the end of the additional lane.

84
• A sign should be provided near the end of each passing lane section stating that in
“X” distance another passing lane will be provided: NEXT PASSING LANE X
MILES. This advance signing will inform the driver of the repetitive nature of the
passing lane design, allowing the driver to understand the purpose and nature of the
roadway’s characteristics. This sign should be used if the distance to the next passing
lane is less than or equal to 12 miles.
• A dashed white line in the transition area extending from near the highway centerline
to the beginning of the white dashed line separating the passing lane from the right
lane should be provided. Drivers were observed to be more likely to comply with
state laws regarding driving in the right lane unless passing when this marking was
used. Testing of Texas drivers also indicated better compliance in lane selection
when driving in platoons, without unnecessarily delaying the initiation of passing
maneuvers.
• Standard taper rates as defined in the Texas MUTCD should be used to add and drop
lanes for the passing lane section.

85
CHAPTER 7
RECOMMENDATIONS
The design of a two-lane roadway that efficiently and effectively places passing lane
sections is dependent upon the successful use of a number of defining characteristics. The two
most basic criteria, length and spacing of the passing lanes, ensure that the roadway is neither
over- nor under-designed to suit the projected traffic volumes. The next criteria, concerning the
selection of appropriate lane and shoulder widths, ensure that safety is not compromised in the
design of the roadway. Finally, the signing and roadway marking designs ensure that the
designer’s intent is adequately conveyed to the driver. The best design possible will perform
poorly if drivers do not understand its purpose and drive accordingly.
LENGTH AND SPACING OF PASSING LANES
Based on the research conducted, recommendations for the following values of length
and spacing of passing lanes are shown in Table 17. The values in the table were developed
based on the premise of minimizing cost and percent time delay. These values are generally
longer than those values of Harwood and Hoban, reflecting current higher speed limits for rural
roads than the speed limits present during their research (10). Conversion of Super 2 roadways
to four-lane highways should be considered when traffic volumes exceed 6000 ADT for level
terrain and 5000 ADT in rolling terrain.
Table 17. Recommended Values of Length and Spacing by ADT and Terrain. ADT (vpd)
Level Terrain Rolling Terrain Recommended Passing
Lane Length (mi)
Recommended Distance Between
Passing Lanes (mi) �1950 �1650 0.8-1.1 9.0-11.0
2800 2350 0.8-1.1 4.0-5.0
3150 2650 1.2-1.5 3.8-4.5
3550 3000 1.5-2.0 3.5-4.0
Passing lanes should be located to best fit existing terrain and field conditions. Uphill
grades are preferred sites over downhill grades, and passing lanes on significant uphill grades
should extend beyond the crest of the hill. Passing lane sections should be placed to avoid major
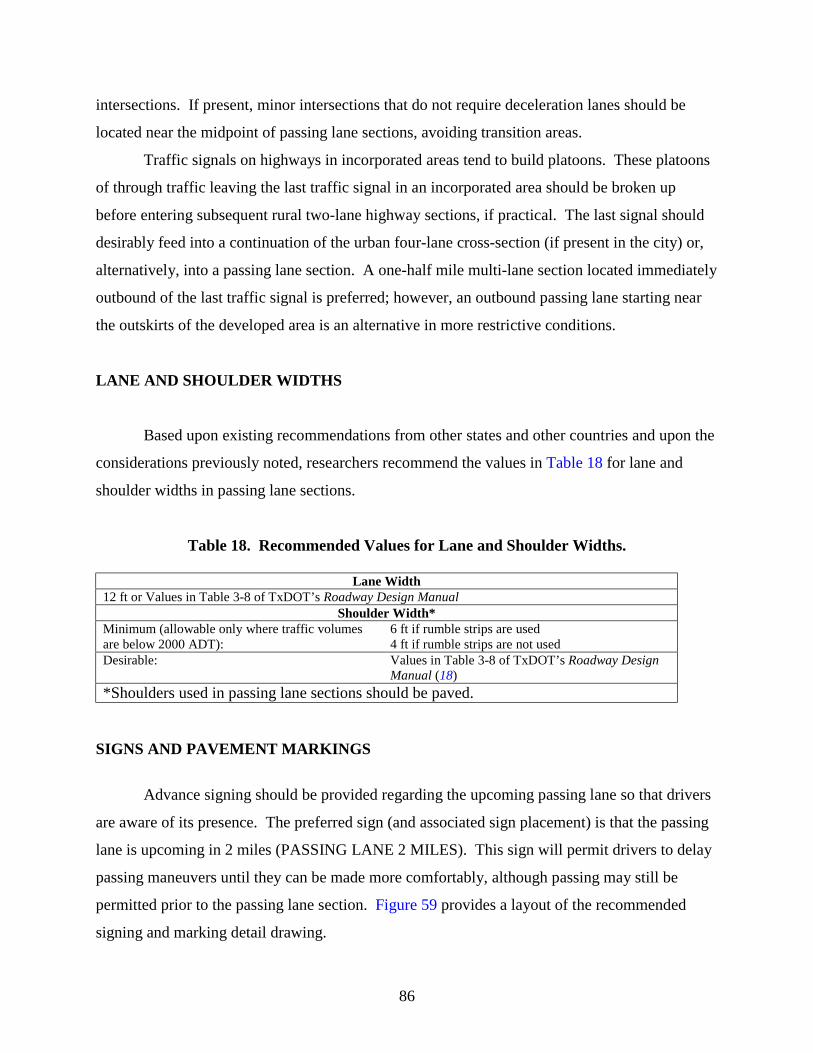
86
intersections. If present, minor intersections that do not require deceleration lanes should be
located near the midpoint of passing lane sections, avoiding transition areas.
Traffic signals on highways in incorporated areas tend to build platoons. These platoons
of through traffic leaving the last traffic signal in an incorporated area should be broken up
before entering subsequent rural two-lane highway sections, if practical. The last signal should
desirably feed into a continuation of the urban four-lane cross-section (if present in the city) or,
alternatively, into a passing lane section. A one-half mile multi-lane section located immediately
outbound of the last traffic signal is preferred; however, an outbound passing lane starting near
the outskirts of the developed area is an alternative in more restrictive conditions.
LANE AND SHOULDER WIDTHS
Based upon existing recommendations from other states and other countries and upon the
considerations previously noted, researchers recommend the values in Table 18 for lane and
shoulder widths in passing lane sections.
Table 18. Recommended Values for Lane and Shoulder Widths.
Lane Width 12 ft or Values in Table 3-8 of TxDOT’s Roadway Design Manual
Shoulder Width* Minimum (allowable only where traffic volumes are below 2000 ADT):
6 ft if rumble strips are used 4 ft if rumble strips are not used
Desirable: Values in Table 3-8 of TxDOT’s Roadway Design Manual (18)
*Shoulders used in passing lane sections should be paved. SIGNS AND PAVEMENT MARKINGS
Advance signing should be provided regarding the upcoming passing lane so that drivers
are aware of its presence. The preferred sign (and associated sign placement) is that the passing
lane is upcoming in 2 miles (PASSING LANE 2 MILES). This sign will permit drivers to delay
passing maneuvers until they can be made more comfortably, although passing may still be
permitted prior to the passing lane section. Figure 59 provides a layout of the recommended
signing and marking detail drawing.

87
A sign should be provided near the end of each passing lane section stating that in “X”
distance another passing lane will be provided (NEXT PASSING LANE X MILES). This
advance signing will inform the driver of the repetitive nature of the passing lane design,
allowing the driver to understand the purpose and nature of the roadway’s characteristics. This
sign should be used if the distance to the next passing lane is 12 miles or less.
A dashed white line in the transition area extending from near the highway centerline to
the beginning of the white dashed line separating the passing lane from the right lane should be
provided. Drivers complied with state laws regarding driving in the right lane unless passing
more often if this marking was used. Testing of Texas drivers also indicated better compliance
in lane selection when driving in platoons, without unnecessarily delaying the initiation of
passing maneuvers.
Based on general recommendations in the Texas MUTCD (24), the signs recommended
for the Texas Super 2 passing lane layout should have the following colors:
• PASSING LANE 2 MILES: white on green,
• LEFT LANE FOR PASSING ONLY: black on white,
• RIGHT LANE ENDS: black on yellow,
• LANE ENDS MERGE LEFT: black on yellow, and
• NEXT PASSING LANE X MILES: white on green.
Standard taper rates as defined in the Texas MUTCD (24) should be used to add and drop
lanes for the passing lane section (see Figure 59).


Figure 59. Signing and Marking Layout.
89


91
REFERENCES
1. Harwood, D. W. and St. John, A. D. “Operational Effectiveness of Passing Lanes on
Two-Lane Highways.” Report No. FHWA/RD-86/195. U. S. Department of
Transportation, Federal Highway Administration. Technical Report, June 1986.
2. Harwood, D. W. “Relationships Between Operational and Safety Considerations in
Geometric Design Improvements.” Transportation Research Record No. 1512.
National Research Council, Washington, D.C., 1995.
3. Harwood, D. W. “Operational and Safety Experience with Passing Lanes.” ITE 1988
Compendium of Technical Papers, September 25-29, 1988, pp. 321-325.
4. American Association of State Highway and Transportation Officials. A Policy on
Geometric Design of Highways and Streets 2001, Fourth Edition.
5. Morrall, J. F., and Plight, L. “Evaluation of Test Passing Lanes on the Trans-Canada
Highway in Banff National Park.” Proc., International Transport Congress, Roads
and Transportation Association of Canada, Vol. 5, 1984.
6. Mutabazi, M. I., Russell, E. R., and Stokes, R. W. “Drivers’ Attitudes,
Understanding, and Acceptance of Passing Lanes in Kansas,” Transportation
Research Record Vol. 1628. National Research Council, Washington, D.C., 1986.
7. Staba, G. R., May, A. D., and Phung, H.O. Development of Comprehensive Passing
Lane Guidelines, Vol. I, Final Report, University of California at Berkley Institute of
Transportation Studies, UCB-ITS-RR-91-1.
8. Gransberg, D. D., Senadheera, S., Silay, E., Rahman, S. M. Z., and Karaca, I.
Proposed Geometric Design for Two-Lane, Two-Way Highway Intermittent Passing
Section, Report No. TX-98/7-3951S, Texas Tech University, Lubbock, Texas,
October 1998.
9. Mutabazi, M. I., Russell, E. R., and Stokes, R. W. Review of the Effectiveness,
Location, Design, and Safety of Passing Lanes in Kansas, Report No. K-TRAN:
KSU-97-1, Kansas State University, Manhattan, Kansas, October 1999.
10. Harwood, D. W. and Hoban, C. J. Low Cost Methods for Improving Traffic
Operations on Two-Lane Roads, Report No. FHWA-IP-87-2, McLean, Virginia:
Federal Highway Administration, December 1985.

92
11. Messer C. J. Two-Lane, Two-Way Rural Highway Capacity, NCHRP Report 3-28 A,
Texas Transportation Institute, February 1983.
12. Romana, M. G. and May, A. D. Development of Comprehensive Passing Lane
Guidelines (Phase I): Field Studies and Data Analysis, Working Paper UCB-ITS-
WP-89-3, Institute of Transportation Studies, University of California at Berkeley,
May 1989.
13. Gattis, J. L., Alguire, M. S., Townsend, K., and Rao, S. Rural Two-Lane Passing
Headway and Platooning. Paper presented during 76th annual meeting of
Transportation Research Board, January 12-16, 1997, Washington, D.C.
14. Highway Capacity Manual, Transportation Research Board, Special Report 209,
Washington, D.C., 1985.
15. Morales, J. M., and Paniati, J. F. “Two-Lane Traffic Simulation: A Field Evaluation
of Roadsim,” Transportation Research Record No. 1100. National Research Council,
Washington, D.C., 1986.
16. Fambro, D. B., Turner, D. S., and Rogness, R. O. Operational and Safety Effects of
Driving on Paved Shoulders in Texas. Texas A&M University, Texas Transportation
Institute, Research Report 265-2F, 1981.
17. Design Guidelines, Technical Memorandum No. 98-08-ES-01. Minnesota
Department of Transportation, Engineering Services Division, May 18, 1998.
18. Roadway Design Manual, Texas Department of Transportation. July 2001. (Values
were converted from metric to English units.)
19. Hoban, C. J. and Morrall, J. F. Overtaking Lane Practice in Canada and Australia,
Research Report ARR 144. Australian Road Research Board, Victoria, Australia,
October 1986.
20. Zegeer, C. V. and Council, F. M. “Safety Relationships Associated Cross-Sectional
Roadway Elements.” Transportation Research Record No. 1512. National Research
Council, Washington, D.C., 1995.
21. Draft Technical Advisory: Roadway Shoulder Rumble Strips. U. S. Department of
Transportation, Federal Highway Administration, 2001.
22. Manual on Uniform Traffic Control Devices 2000, Millennium Edition including
Errata No. 1, Federal Highway Administration, Washington, D.C., June 14, 2001.

93
23. Harwood, D. W., Hoban, C. J., and Warren, D. L. “Effective Use of Passing Lanes on
Two-Lane Highways,” Transportation Research Record No. 1195. National Research
Council, Washington, D.C., 1988.
24. Texas Manual on Uniform Traffic Control Devices for Streets and Highways, Texas
Department of Transportation, Austin, Texas, 1980.
25. Harwood, D. W. and St. John, A. D. Passing Lanes and Other Operational
Improvements on Two-Lane Highways. Report No. FHWA/RD-85/028, Federal
Highway Administration, Washington, D.C., July 1984.
26. Cochran, W. G. The χ2 Test of Goodness of Fit. Annals of Mathematical Statistics,
23, pp. 315-345, 1952.


A-1
APPENDIX
DATA WORKSHEETS


A-3

A-4