Embed Size (px)
Citation preview

1 © 2011 Cengage Learning. All Rights Reserved. This edition is intended for use outside of the U.S. only, with content that may be different from
the U.S. Edition. May not be scanned, copied, duplicated, or posted to a publicly accessible website, in whole or in part.
CHAPTER 12
Design for Quality and Product Excellence
Teaching Notes
The precise manner in which a person or team approaches product design, solving problems to
achieve product excellence, or developing product reliability is not as critical as doing it in a
systematic fashion. Students have been exposed to process management and improvement in
Chapter 7, but they may still have some difficulty in understanding how measurement
(metrology) and Six Sigma projects can be used at the design stage to make frequent, but gradual
changes as an approach to process improvement.
Key objectives for this chapter should include:
To explore the typical structured product development process consisting of idea
generation, preliminary concept development, product/process development, full-scale
production, product introduction, and market evaluation.
To learn that concurrent, or simultaneous, engineering is an effective approach for
managing the product development process by using multi-functional teams to help
remove organizational barriers between departments and therefore reduce product
development time. Design reviews help to facility product development by stimulating
discussion, raising questions, and generating new ideas
To introduce the concept of Design for Six Sigma (DFSS) consisting of a set of tools and
methodologies used in the product development process to ensure that goods and services
meet customer needs and achieve performance objectives, and that the processes used to
make and deliver them achieve Six Sigma capability. DFSS consists of four principal
activities of: Concept development, Design development, Design optimization, and
Design verification. These activities are often incorporated into a variation of the
Design for Quality and Product Excellence 2
© 2011 Cengage Learning. All Rights Reserved. This edition is intended for use outside of the U.S. only, with content that may be different from
the U.S. Edition. May not be scanned, copied, duplicated, or posted to a publicly accessible website, in whole or in part.
DMAIC process, known as DMADV, which stands for Define, Measure, Analyze,
Design, and Verify.
To define concept development as the process of applying scientific, engineering, and
business knowledge to produce a basic functional design that meets both customer needs
and manufacturing or service delivery requirements. This involves developing creative
ideas, evaluating them, and selecting the best concept.
To explore Quality Function Deployment (QFD) -- a planning process to guide the
design, manufacturing, and marketing of goods by integrating the voice of the customer
throughout the organization. A set of matrices, often called the House of Quality, is used
to relate the voice of the customer to a product’s technical requirements, component
requirements, process control plans, and manufacturing operations.
To investigate good product design, which anticipates issues related to cost,
manufacturability, and quality. Improvements in cost and quality often result from
simplifying designs, and employing techniques such as design for manufacturability
(DFM) – the process of designing a product for efficient production at the highest level of
quality.
To study social responsibilities in the design process including product safety and
environmental concerns, which have made Design for Environment (DfE) and design
for disassembly important features of products, because they permit easy removal of
components for recycling or repair, eliminate other environmental hazards, and makes
repair more affordable.
To explore Design for Excellence (DFX), an emerging concept that includes many
design-related initiatives such as concurrent engineering, design for manufacturability
design for assembly, design for environment and other ―design for‖ approaches. DFX
objectives include higher functional performance, physical performance, user
friendliness, reliability and durability, maintainability and serviceability, safety,
compatibility and upgradeability, environmental friendliness, and psychological
characteristics.
To introduce concept engineering (CE) -- a focused process for discovering customer
requirements and using them to select superior product or service concepts that meet those
requirements.
To investigate manufacturing specifications, consisting of nominal dimensions and
tolerances. Nominal refers to the ideal dimension or the target value that manufacturing
seeks to meet; tolerance is the permissible variation, recognizing the difficulty of meeting

Design for Quality and Product Excellence 3
© 2011 Cengage Learning. All Rights Reserved. This edition is intended for use outside of the U.S. only, with content that may be different from
the U.S. Edition. May not be scanned, copied, duplicated, or posted to a publicly accessible website, in whole or in part.
a target consistently. Tolerance design involves determining the permissible variation in
a dimension.
Design optimization includes setting proper tolerances to ensure maximum product
performance and making designs robust; that is, insensitive to variations in
manufacturing or the use environment.
A scientific approach to tolerance design uses the Taguchi loss function. Taguchi
assumes that losses can be approximated by a quadratic function so that larger deviations
from target correspond to increasingly larger losses. For the case in which a specific
target value, T, is determined to produce the optimum performance, and in which quality
deteriorates as the actual value moves away from the target on either side (called
―nominal is best‖), the loss function is represented by L(x) = k(x - T)2.
To examine the characteristics of Design Failure Mode And Effects Analysis (DFMEA)
-- a methodology to identify all the ways in which a failure can occur, to estimate the
effect and seriousness of the failure, and to recommend corrective design actions.
To study the dimensions of reliability—the ability of a product to perform as expected
over time. Formally, reliability is defined as the probability that a product, piece of
equipment, or system performs its intended function for a stated period of time under
specified operating conditions. In practice, the number of failures per unit time determines
reliability during the duration under consideration (called the failure rate), look at
functional failure at the start of product life (The early failure period is sometimes called
the infant mortality period), reliability failure after some period of use.
To understand why reliability is often modeled using an exponential probability
distribution and use the reliability function, specifying the probability of survival, which
is: R(T) = 1 – e- T
.
To explore systems composed of individual components with known reliabilities,
configured in series, in parallel, or in some mixed combination, and how it ties into
various aspects of design, including optimization, tolerance design, and design
verification.
To learn that design optimization includes setting proper tolerances to ensure maximum
product performance and making designs robust; a scientific approach to tolerance design
uses the Taguchi loss function. Techniques for design verification include formal
reliability evaluation, using techniques such as accelerated life testing and burn-in.

Design for Quality and Product Excellence 4
© 2011 Cengage Learning. All Rights Reserved. This edition is intended for use outside of the U.S. only, with content that may be different from
the U.S. Edition. May not be scanned, copied, duplicated, or posted to a publicly accessible website, in whole or in part.
To appreciate that the purpose of a design review is to stimulate discussion, raise
questions, and generate new ideas and solutions to help designers anticipate problems
before they occur.
To understand techniques for design verification including formal reliability evaluation.
These include accelerated life testing, which involves overstressing components to
reduce the time to failure and find weaknesses; and burn-in, or component stress testing,
which involves exposing integrated circuits to elevated temperatures in order to force
latent defects to occur.
To appreciate that Six Sigma performance depends on reliable measurement systems.
Common types of measuring instruments used in manufacturing today fall into two
categories: ―low-technology‖ and ―high-technology.‖ Low-technology instruments are
primarily manual devices that have been available for many years; high-technology
describes those that depend on modern electronics, microprocessors, lasers, or advanced
optics.
To define metrology--the science of measurement – broadly as the collection of people,
equipment, facilities, methods, and procedures used to assure the correctness or adequacy
of measurements, and is a vital part of global competitiveness, including characteristics
such as: accuracy, precision, repeatability or equipment variation, reproducibility or
operator variation, calibration and traceability.
To appreciate that process capability is the range over which the natural variation of a
process occurs as determined by the system of common causes; that is, what the process
can achieve under stable conditions. The relationship between the natural variation and
specifications is often quantified by a measure known as the process capability index, Cp.
To learn that a process capability study is a carefully planned study designed to yield
specific information about the performance of a process under specified operating
conditions. Three types of studies are a peak performance study, process characterization
study, and component variability study.
ANSWERS TO QUALITY IN PRACTICE KEY ISSUES
Testing Audio Components at Shure, Inc.
1. The general definition of reliability as: the probability that a product, piece of
equipment, or system performs its intended function for a stated period of time under
specified operating conditions, is thoroughly tested by Shure. Tests are tailored to

Design for Quality and Product Excellence 5
© 2011 Cengage Learning. All Rights Reserved. This edition is intended for use outside of the U.S. only, with content that may be different from
the U.S. Edition. May not be scanned, copied, duplicated, or posted to a publicly accessible website, in whole or in part.
various market segments, according to the type of use (or abuse) the equipment is likely
to incur. For the consumer market, Shure uses the cartridge drop and scrape test, which
is particularly important to test for, in the light of how ―scratch‖ DJ’s use the equipment.
For presentation and installation audio systems, they use the microphone drop test and
perspiration test. For mobile communications, the two above tests, temperature, and
cable and cable assembly flex tests are applicable. For the performance audio, the
microphone drop test, perspiration test, sequential shipping, cable and cable assembly
flex, and temperature storage would all be appropriate. The purpose of the tests is to
simulate actual operating conditions so that the products can sustain accidents and rough
handling and perform effectively over a useful life. Quality characteristics that are
studied are achieved reliability and performance.
2. For the microphone drop test, the measures are probably variable measures of sound and
response levels, within an acceptable range. Thus, standard variables control charts may
be used. For the perspiration test, it may be that a p-chart or u-chart is used for attribute
measures. The cable and cable assembly flex test might use a p-chart to measure the
percentage of cables tested that failed due to rocking motions or twisting motions. The
sequential shipping tests would probably show varying proportions of failures due to
dropping, vibration, and rough handling. These might be sorted out using a Pareto chart.
Then efforts could be made to improve the most frequently occurring causes. The
cartridge drop and scrape test could also use p- or np-charts (see Chapter 13) to show
results per sample of 100 repetitions of the test. The temperature tests would most likely
use standard variables charts to measure whether test performance was within control
limits, or not.
Applying QFD in a Managed Care Organization
1. Although this example of QFD involved the design of a tangible items, it is more difficult
to implement in a service context, as opposed to a pure manufacturing context, because
both customer requirements and technical requirements are harder to quantify and assess
that with tangible products.
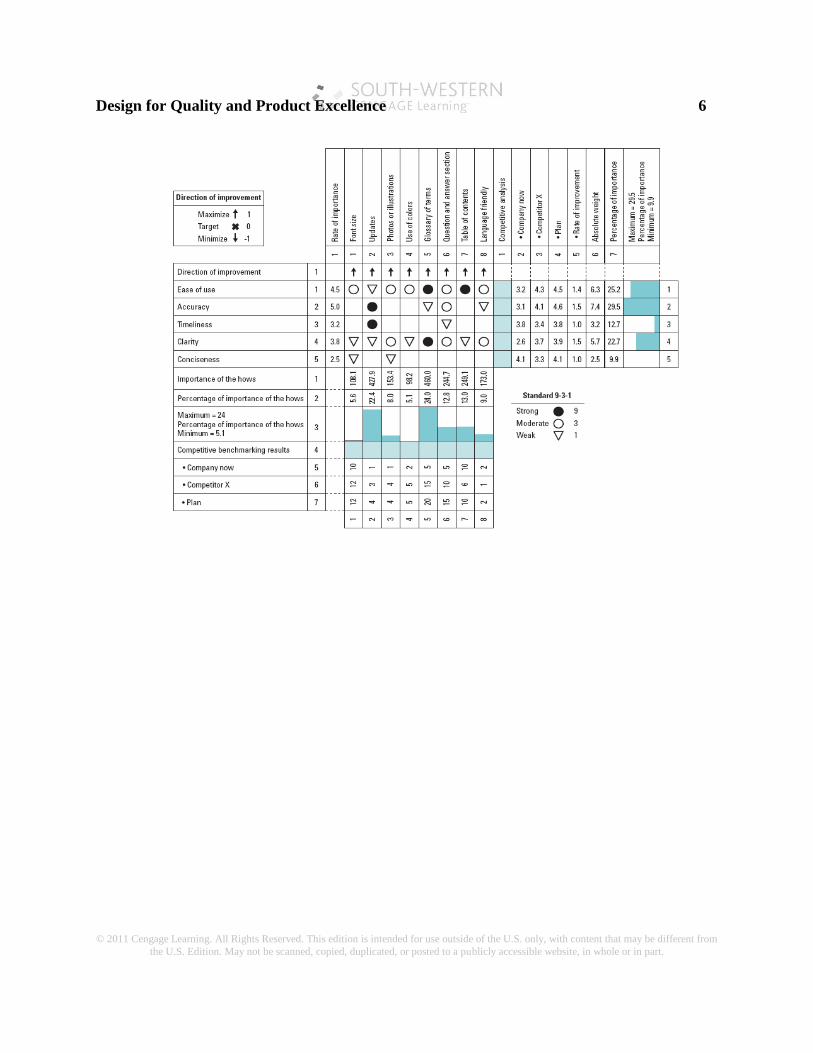
2. The detailed calculations in the Importance of the hows row and Percentage of
importance of the hows row used to arrive at these figures can be shown and verified on a
spreadsheet. Note that some discrepancies involving incorrect multiplication, were found
in part of the QFD ―House of Quality.‖
Design for Quality and Product Excellence 6
© 2011 Cengage Learning. All Rights Reserved. This edition is intended for use outside of the U.S. only, with content that may be different from
the U.S. Edition. May not be scanned, copied, duplicated, or posted to a publicly accessible website, in whole or in part.

Design for Qualtiy and Product Excellence 7
© 2011 Cengage Learning. All Rights Reserved. This edition is intended for use outside of the U.S. only, with content that may be different from the U.S. Edition. May not be scanned, copied,
duplicated, or posted to a publicly accessible website, in whole or in part.
Direction of Rate of Co.
Rate of Absol. % Font
Use of Gloss. Q&A Tbl. of Lang.
Improvement Import. Now Plan Improv. Wgt. Improve size Update Photos colors Terms Sect. Contnt. Frindly.
Ease-use 4.5 3.2 4.5 1.4 6.3 25.2% 3 1 3 3 9 3 9 3
Accuracy 5.0 3.1 4.6 1.5 7.4 29.5% 9 1 3 1
Timeliness 3.2 3.8 3.8 1.0 3.2 12.7% 9 1
Clarity 3.8 2.6 3.9 1.5 5.7 22.7% 1 1 3 1 9 3 1 3
Conciseness 2.5 4.1 4.1 1.0 2.5 9.9% 1 1
Import. of hows
108.1 427.9 153.4 98.2 460.0 244.7 249.1 173.0
% of Import. of hows
5.65% 22.35% 8.01% 5.13% 24.03% 12.78% 13.01% 9.04%
The numbers in the original table were verified by the calculations shown above (some columns of the original table were rearranged
for convenience of calculation). The rates of improvement, absolute weights, and percent improvements, based on the given values for
―rate of importance‖ and ―company now‖ and ―plan‖ were validated. As in the original table, the ―importance of hows‖ and ―percent
of importance of hows‖ turned out to be accurately calculated. Specific factors shown as the most important were ―glossary terms‖ and
―updates.‖

Design for Quality and Product Excellence 8
© 2011 Cengage Learning. All Rights Reserved. This edition is intended for use outside of the U.S. only, with content that may be different from
the U.S. Edition. May not be scanned, copied, duplicated, or posted to a publicly accessible website, in whole or in part.
3. The lessons that can be learned and applied to other service organizations that seek to
design or redesign their products and services include the facts that QFD provides for a
systematic approach to linking the ―voice of the customer‖ to operational requirements.
By doing so, operating efficiencies can be realized and customer satisfaction can be
enhanced. In addition, employee satisfaction often can be improved, as well, as found in
the case. It must be recognized that time and effort is involved in gathering, sorting, and
analyzing the characteristics and factors. Also, there is subjectivity in applying ratings and
weights to variables. Hence, the results are not easy to predict and guarantees are limited.
ANSWERS TO REVIEW QUESTIONS
1. Product design and development consists of six steps:
Idea Generation. New or redesigned product ideas should incorporate customer
needs and expectations.
Preliminary Concept Development. In this phase, new ideas are studied for
feasibility.
Product/Process Development. If an idea survives the concept stage, the actual
design process begins by evaluating design alternatives and determining
engineering specifications for all materials, components, and parts. This phase
usually includes prototype testing, design reviews, and development, testing, and
standardization of the manufacturing processes
Full-Scale Production. If no serious problems are found, the company releases the
product to manufacturing or service delivery teams.
Market Introduction. The product is distributed to customers.
Market Evaluation. An ongoing product development process that relies on
market evaluation and customer feedback to initiate continuous improvements.
2. Competitive pressures are forcing companies to reduce time to market, which means that
the time for product development is also squeezed. The problems incurred in speeding up
the process are well known. If done too hastily, the result will be the need to revise or
scrap the design, cost increases or project over-runs, difficulty in manufacturing the
product, early product failure in the field, customer dissatisfaction, and/or lawsuits due to
product liability. One of them most significant impediments to rapid design is poor intra-
organizational coordination. Reducing time to market can only be accomplished by
process simplification, eliminating design changes, and improving product
manufacturability. This requires involvement and cooperation of many functional groups

Design for Quality and Product Excellence 9
© 2011 Cengage Learning. All Rights Reserved. This edition is intended for use outside of the U.S. only, with content that may be different from
the U.S. Edition. May not be scanned, copied, duplicated, or posted to a publicly accessible website, in whole or in part.
to identify and solve design problems in order to reduce product development and
introduction time.
3. Design for Six Sigma (DFSS) uses a set of tools and methodologies in the product
development process to ensure that goods and services will meet customer needs and
achieve performance objectives, and that the processes used to make and deliver them
achieve Six Sigma capability. DFSS consists of four principal activities:
Concept development, in which product functionality is determined based upon
customer requirements, technological capabilities, and economic realities;
Design development, which focuses on product and process performance issues
necessary to fulfill the product and service requirements in manufacturing or delivery;
Design optimization, which seeks to minimize the impact of variation in production
and use, creating a ―robust‖ design; and
Design verification, which ensures that the capability of the production system meets
the appropriate sigma level
4. Concept engineering (CE) emerged from a consortium of companies that included
Polaroid and Bose along with researchers at MIT. CE is a focused process for
discovering customer requirements and using them to select superior product or service
concepts that meet those requirements, and it puts the voice of the customer into a
broader context and employees numerous other techniques to ensure effective processing
of qualitative data. Five major steps comprise the process:
Understanding the customer’s environment. This step involves first project planning
activities such as team selection, identifying fit with business strategy, and gaining
team consensus on the project focus. It also includes collecting the voice of the
customer to understand the customer’s environment – physical, psychological,
competitive, and so on.
Converting understanding into requirements. In this step, teams analyze the customer
transcripts to translate the voice of the customer into more specific requirements using
the KJ method. This step focuses on identifying the technical requirements we
discussed in the context of QFD, selecting the most significant requirements, and
―scrubbing‖ the requirements to refine them into clear and insightful statements.
Operationalizing what has been learned. Involves determining how to measure how
well a customer requirement is met. The principal requirement is to focus on
throughput time, so the concept of ―quickly‖ needs to be operationalized and
measured. Once potential metrics are defined, they are evaluated to reduce the
number of metrics that need to be used while ensuring that they cover all key
requirements. This usually requires some sort of customer questionnaire to identify
the importance of the requirements and prioritized them.
Concept generation. This step generates ideas for solutions that will potentially meet
customers’ needs. The approach requires brainstorming ideas that might resolve each

Design for Quality and Product Excellence 10
© 2011 Cengage Learning. All Rights Reserved. This edition is intended for use outside of the U.S. only, with content that may be different from
the U.S. Edition. May not be scanned, copied, duplicated, or posted to a publicly accessible website, in whole or in part.
individual customer requirement, selecting the best ones, and then classifying them
under the traditional functional product characteristics. This helps to develop a
―market in‖ rather than a ―product out‖ orientation. Creative thinking techniques are
applied here to increase the number and diversity of potential ideas.
Concept selection. The potential ideas are evaluated for their capability to meet
requirements, tradeoffs are assessed, and prototyping may begin. The process ends
with reflection on the final concept to test whether the decision ―feels right‖ based on
all the knowledge that has been acquired.
Concept engineering is an important tool for assuring quality because it provides a
systematic process that leaves a strong audit trail back to the voice of the customer. This
makes it difficult to challenge the results of skeptics and convert them. The process also
helps to build consensus and gives design teams confidence in selling their concept to
management. However, it takes a lot of discipline and patience.
5. QFD benefits companies through improved communication and teamwork between all
constituencies in the production process, such as between marketing and design, between
design and manufacturing, and between purchasing and suppliers. Product objectives are
better understood and interpreted during the production process. Use of QFD determines
the causes of customer dissatisfaction, making it a useful tool for competitive analysis of
product quality by top management. Productivity as well as quality improvements
generally follow QFD. QFD reduces the time for new product development. QFD allows
companies to simulate the effects of new design ideas and concepts. Companies can
reduce product development time and bring new products into the market sooner, thus
gaining competitive advantage.
6. In the QFD development process, a set of matrices is used to relate the voice of the
customer to a product’s technical requirements, component requirements, process control
plans, and manufacturing operations. The first matrix, called the House of Quality,
provides the basis for the QFD concept.
Building the House of Quality consists of six basic steps:
* Identify customer requirements.
* Identify technical requirements.
* Relate the customer requirements to the technical requirements.
* Conduct an evaluation of competing products or services

Design for Quality and Product Excellence 11
© 2011 Cengage Learning. All Rights Reserved. This edition is intended for use outside of the U.S. only, with content that may be different from
the U.S. Edition. May not be scanned, copied, duplicated, or posted to a publicly accessible website, in whole or in part.
* Evaluate technical requirements and develop targets.
* Determine which technical requirements to deploy in the remainder of the
production/delivery process.
The first House of Quality in the QFD process provides marketing with an important tool
to understand customer needs and gives top management strategic direction. Three other
―houses of quality‖ are used to deploy the voice of the customer to (in a manufacturing
setting) component parts characteristics, process plans, and quality control. The second
house applies to subsystems and components. At this stage, target values representing the
best values for fit, function, and appearance are determined. In manufacturing, most of
the QFD activities represented by the first two houses of quality are performed by product
development and engineering functions.
In the last two stages, the planning activities involve supervisors and production line
operators. In the third house, the process plan relates the component characteristics to key
process operations, the transition from planning to execution. Key process operations are
the basis for a control point. A control point forms the basis for a quality control plan
delivering those critical characteristics that are crucial to achieving customer satisfaction.
This is specified in the last house of quality. These are the things that must be measured
and evaluated on a continuous basis to ensure that processes continue to meet the
important customer requirements defined in the first House of Quality.
7. Product design can have a major impact on manufacturability. If careful thought and
planning is not done by the designer (or design team), the end product can end up being
difficult or impossible to build due to placement of components, methods for
attachments, ―impossible‖ tolerances, difficulties in attaching or fastening components
and/or difficulties in getting the whole assembled ―system‖ to work smoothly, even with
the highest quality components. In addition time, materials, and other resources may be
wasted unnecessarily due to a poor manufacturing design.
The concept of Design for Manufacturability (DFM) is the process of designing a product
so that it can be produced efficiently at the highest level of quality. Its goal is to improve
quality, increase productivity, reduce lead time (time to market, as well as manufacturing
time) and maintain flexibility to adapt to future market conditions.
8. Key design practices for high quality in manufacturing and assembly include: 1) analyze all
design requirements to assess proper dimensions and tolerances, 2) determine process
capability, 3) identify and evaluate possible manufacturing quality problems, 4) select
manufacturing processes that minimize technical risks, and 5) evaluate processes under
actual manufacturing conditions.

Design for Quality and Product Excellence 12
© 2011 Cengage Learning. All Rights Reserved. This edition is intended for use outside of the U.S. only, with content that may be different from
the U.S. Edition. May not be scanned, copied, duplicated, or posted to a publicly accessible website, in whole or in part.
9. Social responsibilities in the design process include safety and environmental concerns,
which have made Design for Environment (DFE) and Design for Disassembly important
features of products. Legal and environmental issues are becoming critical in designing
products and services, today. Product safety and its consequences, product liability, should
be of primary concern because of the damage that hazardous designs can do to consumers of
the product. Also, liability lawsuits can do major damage to the financial health of an
organization, as well as its image and reputation in the marketplace. Records and
documentation relating to the design process are the best defense against liability lawsuits.
These would include records on prototype development, testing, and inspection results.
Environmental issues involve questions of whether ―environmentally friendly‖ designs
(those that minimize damage to the environment in manufacture and product use) are being
developed, what impacts will the design of the product have on the environment when it is
scrapped, and how can consumers be given the most value for their money, while balancing
the other two issues? The above questions can often be addressed by considering it as a
―design for environment‖ concept (often combined with and ―design for disassembly‖).
What is the best design for repairability/recylability?
10. Design for Excellence (DFX) is an emerging concept that includes many design-related
initiatives such as concurrent engineering, design for manufacturability design for
assembly, design for environment and other ―design for‖ approaches. DFX objectives
include higher functional performance, physical performance, user friendliness, reliability
and durability, maintainability and serviceability, safety, compatibility and upgradeability,
environmental friendliness, and psychological characteristics. DFX represents a total
approach to product development and design involves the following activities:
Constantly thinking in terms of how one can design or manufacture products better,
not just solving or preventing problems
Focusing on ―things done right‖ rather than ―things gone wrong‖
Defining customer expectations and going beyond them, not just barely meeting them
or just matching the competition
Optimizing desirable features or results, not just incorporating them
Minimizing the overall cost without compromising quality of function
11. Manufacturing specifications consist of nominal dimensions and tolerances. Nominal
refers to the ideal dimension or the target value that manufacturing seeks to meet;
tolerance is the permissible variation, recognizing the difficulty of meeting a target
consistently. Traditionally, tolerances are set by convention rather than scientifically. A
designer might use the tolerances specified on previous designs or base a design decision
on judgment from past experience. Setting inappropriate tolerances can be costly, since
tolerance settings often fail to account for the impact of variation on product
functionality, manufacturability, or economic consequences. The Taguchi loss function is

Design for Quality and Product Excellence 13
© 2011 Cengage Learning. All Rights Reserved. This edition is intended for use outside of the U.S. only, with content that may be different from
the U.S. Edition. May not be scanned, copied, duplicated, or posted to a publicly accessible website, in whole or in part.
a scientific approach to tolerance design. Taguchi assumed that losses can be
approximated by a quadratic function so that larger deviations from target cause
increasingly larger losses.
12. The Taguchi loss function is a useful concept for process design. Taguchi suggests that
there is not strict cut-off point that divides good quality from poor quality. Rather, he
assumed that losses can be approximated by a quadratic function so that larger deviations
from target correspond to increasingly larger losses. For the case in which a specific
target value, T, is determined to produce the optimum performance, and in which quality
deteriorates as the actual value moves away from the target on either side (called
―nominal is best‖), the loss function is represented by L(x) = k(x - T)2
where x is any
actual value of the quality characteristic and k is some constant. Thus, (x – T) represents
the deviation from the target, and the loss increases by the square of the deviation.
13. The purpose of Design Failure Mode and Effects Analysis (DFMEA) is to identify all the
ways in which a failure can occur, to estimate the effect and seriousness of the failure,
and to recommend corrective design actions. A DFMEA usually consists of specifying the
following information for each design element or function: Failure modes; effect of the
failure on the customer; severity, likelihood of occurrence, and detection rating; potential
causes of failure, and corrective actions or controls. A simple example of a DFMEA for
an ordinary household light socket is provided in the chapter.
14. Reliability has grown increasingly important among the quality disciplines due to safety
needs of consumers, the search for competitive advantage by companies, growing consumer
awareness, and rising expectations and the difficulty of achieving high reliability in more
sophisticated and complex modern products.
15. Reliability is the probability that a product, piece of equipment, or system performs its
intended function for a stated period of time under specified operating conditions. There are
four key components of this definition, including probability, time, performance, and
operating conditions. All of these have to be considered in a comprehensive definition of
reliability. Probability allows comparison of different products and systems, time allows us
to measure the length of life of the product, performance relates to the ability of the product
to do what it was designed to do, and operating conditions specify to amount of usage and
the environment in which the product is used.
16. A functional failure is one incurred at the start of the product's life due to defective
materials, components, or work on the product. A reliability failure is one that is incurred
after some period of use. For example, if a new TV set suffers a blown picture tube during
the first week, it's a functional failure. There was obviously a defect in the manufacture of
the tube. If the vertical hold feature of the set goes out (perhaps 3 days after the 1 year

Design for Quality and Product Excellence 14
© 2011 Cengage Learning. All Rights Reserved. This edition is intended for use outside of the U.S. only, with content that may be different from
the U.S. Edition. May not be scanned, copied, duplicated, or posted to a publicly accessible website, in whole or in part.
warranty is up), that is a reliability failure. It should reasonably be expected to last much
longer than one year, but it didn't.
17. Failure rate is defined as the number of failures per unit of time during a specified time
period being considered. For example, if 15 MP-3 players were tested for 500 hours and
there were two failures of the units, the failure rate would be: 2 / (15 x 500) = 1 / 3750 or
0.000267.
18. The cumulative failure rate curve plots the cumulative percent of failures against time on
the horizontal axis. The failure rate curve is obtained by determining the slope of the failure
rate curve at a number of points to obtain the instantaneous failure rate (failures per unit
time) at that point. A plot of these values yields the failure rate curve.
19. The average failure rate over any interval of time is the slope of the line between the two
endpoints of the interval on the failure rate curve.
20. The product life characteristics curve, is the so-called "bath-tub curve" because of its shape.
It is actually the failure rate curve, described above. Such curves can be used to understand
the distinctive failure rate patterns of various designs and products, over time.
21. The reliability function represents the probability that an item will not fail within a certain
period of time, T. It is directly related to the cumulative distribution function: F(T) =
1 - e- T
, that yields the probability of failures. Since F(T) is the probability of failure, the
reliability function, R(T) can be defined as the complement, e.g. probability of not failing:
R(T) = 1 - (1 - e- T
) = e- T
It can also be expressed using the mean time to failure (MTTF) value as: R(T) = e-T/
22. The reliability of series, parallel, and series parallel is relatively easy to compute, given the
reliability of components in each system. For the series system, RS = R1R2R3. Thus
reliabilities are multiplicative.
For a parallel system, the relationships are a little more complex, since the units are
designed to use redundant components, so that if one unit fails the system can continue to
operate. The system reliability is computed as:
RS = 1 - [(1 - R1)(1 - R2)(1 - Rn)]
For series-parallel systems, the equivalent reliabilities of each parallel sub-system are
calculated, successively, until there are no more parallel sub-systems. The system is then

Design for Quality and Product Excellence 15
© 2011 Cengage Learning. All Rights Reserved. This edition is intended for use outside of the U.S. only, with content that may be different from
the U.S. Edition. May not be scanned, copied, duplicated, or posted to a publicly accessible website, in whole or in part.
reduced to a serially equivalent system in which all component reliabilities can be
multiplied to get the final reliability value.
23. The purpose of a design review is to stimulate discussion, raise questions, and generate
new ideas and solutions to help designers anticipate problems before they occur. To
facilitate product development, a design review is generally conducted in three major
stages of the product development process: preliminary, intermediate, and final. The
preliminary design review establishes early communication between marketing,
engineering, manufacturing, and purchasing personnel and provides better coordination of
their activities. It usually involves higher levels of management and concentrates on
strategic issues in design that relate to customer requirements and thus the ultimate
quality of the product. The preliminary design review evaluates such issues as the
function of the product, conformance to customer’s needs, completeness of
specifications, manufacturing costs, and liability issues.
After the design is well established, an intermediate review takes place to study the
design in greater detail to identify potential problems and suggest corrective action.
Personnel at lower levels of the organization are more heavily involved at this stage.
Finally, just before release to production, a final review is held. Materials lists, drawings,
and other detailed design information are studied with the purpose of preventing costly
changes after production setup.
24. Methods of product testing for reliability include: life testing, accelerated life testing,
environmental testing and vibration and shock testing. In life and accelerated life testing the
product is tested until it fails. The latter speeds up the process by overstressing the item to
hasten its eventual failure. Environmental and shock tests are performed to determine the
product's ability to survive and operate under adverse conditions of heat, cold, or shock.
25. Latent defects are frequently found in electronic devices, such as semi-conductors. The term
refers to the fact that a certain small proportion of the units will have defects which show up
during the early life of the product, perhaps the first 1,000 hours of operation. Then the
remaining components, after the "infant mortality" period has passed, the remaining
components may operate for years without many failures.
26. Robust designs are those that are insensitive to variations in manufacturing or in the use
environment.
27. Common types of measuring instruments (see Bonus Materials folder on the Premier
website) used in manufacturing today fall into two categories: ―low-technology‖ and
―high-technology.‖ Low-technology instruments are primarily manual devices that have
been available for many years and include rulers, calipers, mechanical micrometers, go-no

Design for Quality and Product Excellence 16
© 2011 Cengage Learning. All Rights Reserved. This edition is intended for use outside of the U.S. only, with content that may be different from
the U.S. Edition. May not be scanned, copied, duplicated, or posted to a publicly accessible website, in whole or in part.
go gauges, etc.; high-technology describes those that depend on modern electronics,
microprocessors, lasers, or advanced optics, such as micrometers with digital readouts,
electronic optical comparators, and computerized coordinate measuring machines.
28. Metrology is the science of measurement. It formerly included only the measurement
processes involved in gauging the physical attributes of objects. Today, metrology is
much more broadly defined as: the collection of people, equipment, facilities, methods,
and procedures used to assure correctness or adequacy of measurements. It is vital to
quality control because of the increasing complexity of modern manufacturing and
service operations. In particular, the increasing emphasis and oversight of government
agencies, the implications of measurement errors on safety and product liability, and the
need for reliance on improved quality control methods, such as SPC, make metrology an
important branch of science.
29. Accuracy is defined as the closeness of agreement between an observed value and an
accepted reference value or standard. Accuracy is measured as the amount of error in a
measurement in proportion to the total size of the measurement. One measurement is
more accurate than another if it has a smaller relative error.
Precision is defined as the closeness of agreement between randomly selected individual
measurements or results. Precision, therefore, relates to the variance of repeated
measurements. A measuring instrument having a low variance is said to be more precise
than another having a higher variance.
Reproducibility is the variation in the same measuring instrument when it is used by
different individuals to measure the same parts. Causes of poor reproducibility include
poor training of the operators in the use of the instrument or unclear calibrations on the
gauge dial.
30. Calibration is the comparison of a measurement device or system having a known
relationship to national standards to another device or system whose relationship to
national standards is unknown. Calibration is necessary to ensure the accuracy of
measurement and hence to have confidence in the ability to distinguish between
conforming and nonconforming production. Measurements made with uncalibrated or
inadequately calibrated equipment can lead to erroneous and costly decisions.
31. Repeatability and reproducibility (R&R) require a study of variation and can be addressed
through statistical analysis. R&R studies must be done systematically, and require quite a
number of steps. A repeatability and reproducibility study is conducted in the following
manner (Note: formulas are omitted for the sake of brevity).

Design for Quality and Product Excellence 17
© 2011 Cengage Learning. All Rights Reserved. This edition is intended for use outside of the U.S. only, with content that may be different from
the U.S. Edition. May not be scanned, copied, duplicated, or posted to a publicly accessible website, in whole or in part.
1. Select m operators and n parts. Typically at least 2 operators and 10 parts are
chosen. Number the parts so that the numbers are not visible to the operators.
2. Calibrate the measuring instrument.
3. Let each operator measure each part in a random order and record the results.
Repeat this for a total of r trials. At least two trials must be used. Let Mijk
represent the kth measurement of operator i on part j.
4. Compute the average measurement for each operator and the difference between
the largest and smallest average.
5. Compute the range for each part and each operator (these values show the
variability of repeated measurements of the same part by the same operator);
compute the average range for each operator; compute the overall average range.
6. Calculate ―control limits‖ on the individual ranges Rij , using a constant (D4) that
depends on the sample size (number of trials, r) and can be found in a table for
control charts. Any range value beyond the control limits might result from some
assignable cause, not random error. Possible causes should be investigated and, if
found, corrected. The operator should repeat these measurements using the same
part. If no assignable cause is found, these values should be discarded and all
statistics in step 5 as well as the control limit should be recalculated.
Once these basic calculations are made, an analysis of repeatability and
reproducibility can be performed, equipment variation (EV) is computed as
reproducibility, and operator variation as appraisal variation (AV).
Constants K1 and K2 are chosen and depend on the number of trials and number of
operators, respectively. These constants provide a 99 percent confidence interval
on these statistics. An overall measure of repeatability and reproducibility (R&R)
is given by:
Repeatability and reproducibility are often expressed as a percentage of the
tolerance of the quality characteristic being measured. The American Society for
Quality suggests the following guidelines for evaluating these measures of
repeatability and reproducibility:
Under 10% error: This rate is acceptable.
10 to 30% error: This rate may be acceptable based on the importance of the
application, cost of the instrument, cost of repair, and so on.
Over 30% error: Generally, this rate is not acceptable. Every effort should be
made to identify the problem and correct it.
32. Process capability is the range over which the natural variation of a process occurs as
determined by the system of common causes. It is the ability of the combination of

Design for Quality and Product Excellence 18
© 2011 Cengage Learning. All Rights Reserved. This edition is intended for use outside of the U.S. only, with content that may be different from
the U.S. Edition. May not be scanned, copied, duplicated, or posted to a publicly accessible website, in whole or in part.
people, machines, methods, materials, and measurements to produce a product or service
that will consistently meet design specifications. Process capability is measured by the
proportion of output that can be produced within design specifications; in other words, it
is a measurement of the uniformity of the product.
33. A process capability study is a carefully planned study designed to yield specific
information about the performance of a process under specified operating conditions.
Three types of studies are often conducted. A peak performance study is focused on
determining how a process performs under actual operating conditions. A process
characterization study is designed to determine how a process performs under actual
operating conditions. A component variability study has the goal of determining the
relative contribution of different sources of total variation. The six steps involved in
making a process capability study are listed in the chapter.
34. The following are brief definitions of the various process capability indexes:
Cp is the ratio of the specification width to the natural tolerance of the process
Cpl is the lower one-sided index that relates the distance from the process mean to the
lower tolerance limit to its 3 natural spread
Cpu is the upper one-sided index that relates the distance from the process mean to the
upper tolerance limit to its 3 natural spread
These indexes are calculated to determine the ability of a process to meet or exceed
design specifications and are only meaningful when a process is known to be under
control. General a process is considered to be capable if its index is 1.0 or above. These
indexes may be used to establish quality policy in operating areas or with a supplier by
stating an acceptable standard, such as: all capability indexes must be at 2.0 (called 6
quality) or above if the process is to be considered acceptable for elimination of
inspection processes by customers.
SOLUTIONS TO PROBLEMS
Note: Data sets for several problems in this chapter are available in the Excel workbook
C12Data on the Premium website for this chapter accompanying this text. Click on the
appropriate worksheet tab as noted in the problem (e.g., Prob. 12-5) to access the data.
1. Tonia’s Tasty Tacos conducted consumer surveys and focus groups and identified the
most important customer expectations as

Design for Quality and Product Excellence 19
© 2011 Cengage Learning. All Rights Reserved. This edition is intended for use outside of the U.S. only, with content that may be different from
the U.S. Edition. May not be scanned, copied, duplicated, or posted to a publicly accessible website, in whole or in part.
• Tasty, moderately healthy food
• Speedy service
• An easy-to-read menu board
• Accurate order filling
• Perceived value
Develop a set of technical requirements to incorporate into the design of a new facility
and a House of Quality relationship matrix to assess how well your requirements address
these expectations. Refine your design as necessary, based upon the initial assessment.
Answer
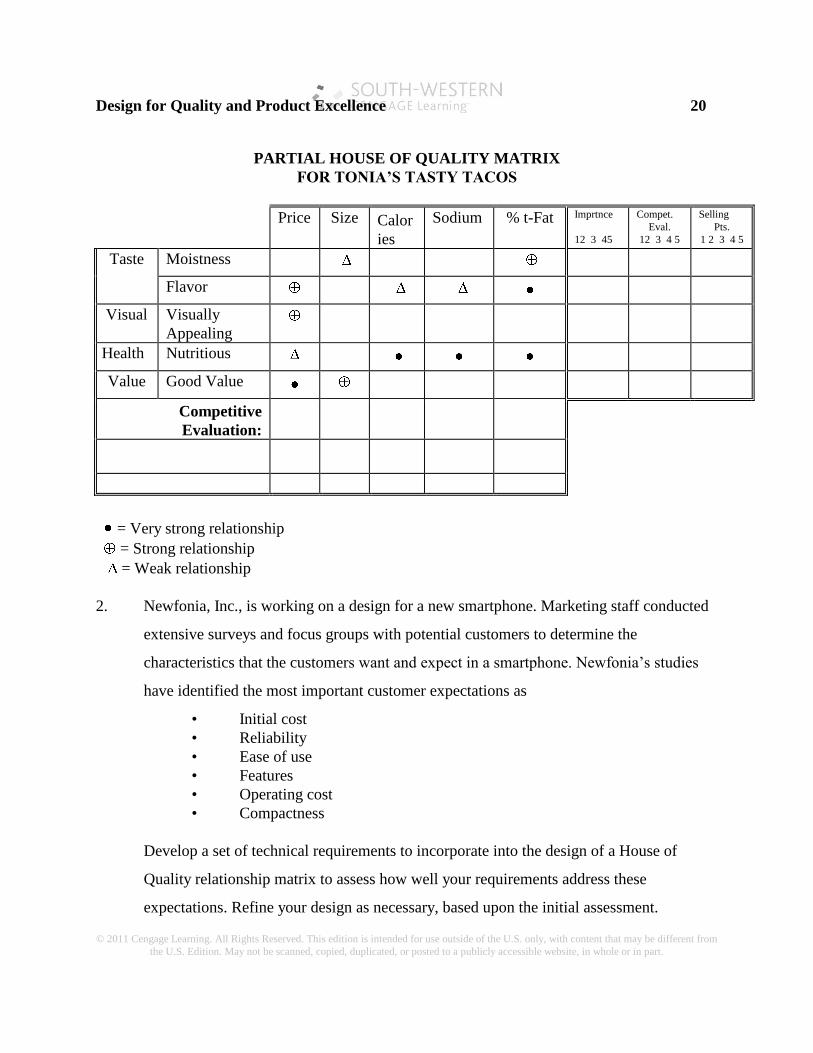
1. Analysis of customer responses for Tonia’s Tasty Tacos indicates that there are likely to be
several strong relationships between customer requirements and associated technical
requirements of the product that Tonia designs (for example. a burrito), such as value vs.
price; nutrition vs. calories (and other nutritional content values, such as sodium, and
percent trans-fat).
Note the three customer response categories that are unrelated to the design of the burritos --
order accuracy, speedy service, and menu board. These factors would require a separate
analysis as part of a facility and process design.
Design for Quality and Product Excellence 20
© 2011 Cengage Learning. All Rights Reserved. This edition is intended for use outside of the U.S. only, with content that may be different from
the U.S. Edition. May not be scanned, copied, duplicated, or posted to a publicly accessible website, in whole or in part.
PARTIAL HOUSE OF QUALITY MATRIX
FOR TONIA’S TASTY TACOS
Price Size Calor
ies
Sodium % t-Fat Imprtnce
12 3 45
Compet.
Eval. 12 3 4 5
Selling
Pts. 1 2 3 4 5
Taste Moistness
Flavor
Visual Visually
Appealing
Health Nutritious
Value Good Value
Competitive
Evaluation:
= Very strong relationship
= Strong relationship
= Weak relationship
2. Newfonia, Inc., is working on a design for a new smartphone. Marketing staff conducted
extensive surveys and focus groups with potential customers to determine the
characteristics that the customers want and expect in a smartphone. Newfonia’s studies
have identified the most important customer expectations as
• Initial cost
• Reliability
• Ease of use
• Features
• Operating cost
• Compactness
Develop a set of technical requirements to incorporate into the design of a House of
Quality relationship matrix to assess how well your requirements address these
expectations. Refine your design as necessary, based upon the initial assessment.

Design for Quality and Product Excellence 21
© 2011 Cengage Learning. All Rights Reserved. This edition is intended for use outside of the U.S. only, with content that may be different from
the U.S. Edition. May not be scanned, copied, duplicated, or posted to a publicly accessible website, in whole or in part.
Answer
2. Analysis of customer responses for Newfonia’s proposed smartphone indicates the
likelihood of several strong relationships between customer requirements and associated
technical requirements of the design, such as value vs. price; features vs. compactness; and
ease of use vs. features. Operating costs may possibly be distantly related to initial cost and
features. Technical characteristics required to translate the ―voice of the customer‖ into
operational or engineering terms might be measures of purchase cost, operating programs
(e.g., BranchOS, or other similar systems), number and type of features, weight,
dimensions, battery life, cost of replacement batteries, and peripherals.
3. Tonia’s Tasty Tacos (Problem 1) acquired some additional information. It found that
consumers placed the highest importance on healthy food, followed by value, followed by
order accuracy and service. The menu board was only casually noted as an important
attribute in the surveys. Tonia faces three major competitors in this market: Grabby’s,
Tacoking, and Sandy’s. Studies of their products yielded the information shown in the
table in C12Data file for Prob.12-3 on the Premium website for this chapter. Results of
the consumer panel ratings for each of these competitors can also be found there (a 1–5
scale, with 5 being the best). Using this information, modify and extend your House of
Quality from Problem 1 and develop a deployment plan for a new burrito. On what
attributes should the company focus its marketing efforts?
Answer
3. With the new data given for Tonia's customers, a partial House of Quality for the design
of the burritos can be built, as shown below. Note that the relationships between customer
requirements (flavor, health, value) and associated technical requirements (% fat,
calories, sodium, price) of the burrito design are strong.
The inter-relationships of the roof are not shown (limitations of MSWord software), these
may be sketched in. For example, they would show a strong inter-relationship between fat
and calories.

Design for Quality and Product Excellence 22
© 2011 Cengage Learning. All Rights Reserved. This edition is intended for use outside of the U.S. only, with content that may be different from
the U.S. Edition. May not be scanned, copied, duplicated, or posted to a publicly accessible website, in whole or in part.
PARTIAL HOUSE OF QUALITY MATRIX
FOR TONIA’S TASTY TACOS
Price Size Calor
ies
Sodium % t-Fat Imprtnce
12 3 45
Compet.
Eval. 12 3 4 5
Selling
Pts. 1 2 3 4 5
Taste Moistness x G Q S
Flavor x S G Q *
Visual Visually
Appealing x G S Q
Health Nutritious x QS G *
Value Good Value x Q SG *
Competitive
Evaluation: Grabby’s
5
3
5
5
5
Tacoking 3 5 2 2 2
Sandy's 4 4 3 3 4
Targets $0.2
6/
oz.
7.0/
oz.
80/
oz.
85 mg. 13%
Deployment * * *
= Very strong relationship
= Strong relationship
= Weak relationship
Tonia’s Tasty Tacos technical requirements must be placed on a more equal basis, which
would best be shown as units/ounce, except for the percent fat value. These are shown
below.
Company Price/oz. Calories/oz. Sodium/oz. % Fat
Grabby's $ 0.282 80 13.63 13
Tacoking $ 0.300 85 12.67 23
Sandy's $ 0.292 90 13.33 16
Although Tonia’s is low in price per ounce, as well as calories, and percent fat, this analysis
suggests that Tonia’s should try to increase its size and visual appeal, while continuing to
reduce the cost per ounce. At the same time, it should build on the strength of the nutrition
trend by keeping the sodium and percent fat low, as did Grabby's, and slightly reducing the

Design for Quality and Product Excellence 23
© 2011 Cengage Learning. All Rights Reserved. This edition is intended for use outside of the U.S. only, with content that may be different from
the U.S. Edition. May not be scanned, copied, duplicated, or posted to a publicly accessible website, in whole or in part.
number of calories per ounce to be even more competitive. If Tonia’s can design a
flavorful, healthy, 7 oz. taco and sell it at an attractive price (say, $1.85 or less), it should
be a very profitable undertaking.
4. Newfonia, Inc. (Problem 2), faces three major competitors in this market: Oldphonia,
Simphonia, and Colliefonia. It found that potential consumers placed the highest
importance on reliability (measured by such things as freedom from operating system
crashes and battery life), followed by compactness (weight/bulkiness), followed by
flexibility (features, ease of use, and types of program modules available). The operating
cost was only occasionally noted as an important attribute in the surveys. Studies of their
products yielded the information shown in the table in C12Data file for Prob.12-4 on the
Premium website for this chapter. Results of the consumer panel ratings for these
competitors are also shown in that spreadsheet. Using this information, modify and
extend your House of Quality from Problem 2 and develop a deployment plan for the new
smartphone. On what attributes should the company focus its marketing efforts?
Answer
4. With the new data given for Newfonia’s potential customers, a partial House of Quality
for the design of the smartphone can be built, as shown below. Note the strong
relationships between customer requirements and associated technical requirements of the
smartphone design.
The inter-relationships of the roof are not shown (limitations of MSWord software), but
these may be sketched in. For example, they would show a strong inter-relationship between
size and weight.

Design for Quality and Product Excellence 24
© 2011 Cengage Learning. All Rights Reserved. This edition is intended for use outside of the U.S. only, with content that may be different from
the U.S. Edition. May not be scanned, copied, duplicated, or posted to a publicly accessible website, in whole or in part.
PARTIAL HOUSE OF QUALITY MATRIX
FOR NEWPHONIA’S SMARTPHONE CASE
Cost Size
(in.)
Wt.
(oz.)
Featr.
(num.)
Opr.P
rog.
Bat.
Life
Opr.
Cost
Importan
ce
12 3 45
Compet
Eval.
12 3 45
Selling
Pts.
1 2 3 4
5
Reliable Keeps
operating x G S H *
Compact Fits
x GSH
Not heavy x S G Q
Features Calendar,
contact
mgt., etc.
x G S H *
Ease of
use
Intuitive
operations x QS G *
Value Good
value x Q SG *
Competitive
Evaluation:
Oldphonia
3
4
5
4
5
5
5
Simfonia 5 4 3 2 2 2 3 = Very strong relationship
Colliefonia 4 4 3 3 4 3 4 = Strong relationship
Targets $250 5 x
3.2
6 oz. 10 Win.
CE
35 Mod
. = Weak relationship
Deployment * * *
This analysis suggests that Newfonia should try to position itself between Simfonia and
Colliefonia in price and features. It should build on the strength of the customer’s reliability
concern, keeping battery life near 35 hours and use a proven operating program, such as
BranchOS. Enough features (10) should be offered to be competitive. If Newfonia can
design a high-value smartphone and sell it at an attractive price (say, $250 or less), it
should be a very profitable undertaking.
5. A genetic researcher at GenLab, Ltd. is trying to test two laboratory thermometers (that
can be read to 1/100,000th of a degree Celsius) for accuracy and precision. She measured
25 samples with each and obtained the results found in the C12Data file for Prob.12-5 on
the Premium website for this chapter. The true temperature being measured is 0 degrees

Design for Quality and Product Excellence 25
© 2011 Cengage Learning. All Rights Reserved. This edition is intended for use outside of the U.S. only, with content that may be different from
the U.S. Edition. May not be scanned, copied, duplicated, or posted to a publicly accessible website, in whole or in part.
C. Which instrument is more accurate? Which is more precise? Which is the better
instrument?
Answer
5. Accuracy of: Thermometer A Thermometer B
Abs [0.00031- 0] Abs [-.00005 - 0]
100 x ------------------------ = 0.031 % 100 x ----------------------- = 0.005%
1 deg. 1 deg.
Thermometer B is more accurate.
The Excel-calculated (see spreadsheets Prob12-5a.xls and Prob12-5b.xls on the Premium
website for details) statistics and frequency distribution, shows that Thermometer B is
also more precise than Thermometer A, as indicated by a smaller standard deviation.
Thermometer B is a better instrument, because it is likely that it can be adjusted to center
on the nominal value of 0.
Frequency Table - Problem 12-5a
Upper Cell
Boundaries Frequencies
Cell 1 -0.00251 1
Cell 2 -0.00169 1
Cell 3 -0.00086 3
Cell 4 -0.00003 5
Cell 5 0.00080 5
Cell 6 0.00163 6
Cell 7 0.00246 4

Design for Quality and Product Excellence 26
© 2011 Cengage Learning. All Rights Reserved. This edition is intended for use outside of the U.S. only, with content that may be different from
the U.S. Edition. May not be scanned, copied, duplicated, or posted to a publicly accessible website, in whole or in part.
Standard Statistical Measures
Mean 0.000312
Median 0.000246
Mode #N/A
Standard deviation 0.001343
Variance 0.000002
Max 0.002456
Min -0.002514
Range 0.004970

Design for Quality and Product Excellence 27
© 2011 Cengage Learning. All Rights Reserved. This edition is intended for use outside of the U.S. only, with content that may be different from
the U.S. Edition. May not be scanned, copied, duplicated, or posted to a publicly accessible website, in whole or in part.
Frequency Table Problem 12-5b
Upper Cell
Boundaries Frequencies
Cell 1 -0.00221 1
Cell 2 -0.00070 7
Cell 3 0.00005 7
Cell 4 0.00156 7
Cell 5 0.00232 3
Standard Statistical Measures
Mean -0.000046
Median -0.000123
Mode #N/A
Standard deviation 0.001204
Variance 0.000001
Max 0.002316
Min -0.002209
Range 0.004525

Design for Quality and Product Excellence 28
© 2011 Cengage Learning. All Rights Reserved. This edition is intended for use outside of the U.S. only, with content that may be different from
the U.S. Edition. May not be scanned, copied, duplicated, or posted to a publicly accessible website, in whole or in part.
6. Two scales were at Aussieburgers, Ltd. used to weigh the same 25 samples of hamburger
patties for a fast-food restaurant in Australia. Results are shown in C12Data file for
Prob.12-6 on the Premium website for this chapter. The samples were weighed in grams,
and the supplier has ensured that each patty weighs 114 grams. Which scale is more
accurate? Which is more precise? Which is the better scale?
Answer
6. See spreadsheets Prob12-6a.xls and Prob12-6b.xls for details.
Accuracy of: Scale A Scale B
Abs[113.96 -114] Abs[115.92 - 114]
100 x ------------------------ = 0.035 % 100 x ----------------------- = 1.685%
114 114
Scale A is more accurate.

Design for Quality and Product Excellence 29
© 2011 Cengage Learning. All Rights Reserved. This edition is intended for use outside of the U.S. only, with content that may be different from
the U.S. Edition. May not be scanned, copied, duplicated, or posted to a publicly accessible website, in whole or in part.
The frequency distribution, taken from the Excel printout, shows that Scale B is more
precise than Scale A.
Scale B is a better instrument, because it is likely that it can be adjusted to center on the
nominal value of 0.
Scale A
Frequency Table - Problem 12-6a
Upper Cell
Boundaries Frequencies
Cell 1 112.00 3
Cell 2 112.67 0
Cell 3 113.33 5
Cell 4 114.00 9
Cell 5 114.67 0
Cell 6 115.33 6
Cell 7 116.00 2
Standard Statistical Measures
Mean 113.96
Median 114.00
Mode 114.00
Standard deviation 1.14
Variance 1.29
Max 116.00
Min 112.00
Range 4.00

Design for Quality and Product Excellence 30
© 2011 Cengage Learning. All Rights Reserved. This edition is intended for use outside of the U.S. only, with content that may be different from
the U.S. Edition. May not be scanned, copied, duplicated, or posted to a publicly accessible website, in whole or in part.
Scale B
Frequency Table Problem 12-6b
Upper Cell
Boundaries Frequencies
Cell 1 114.00 3
Cell 2 115.33 5
Cell 3 116.00 10
Cell 4 117.33 5
Cell 5 118.00 2
Standard Statistical Measures
Mean 115.92
Median 116.00
Mode 116.00
Standard deviation 1.12
Variance 1.24
Max 118
Min 114
Range 4.00
Design for Quality and Product Excellence 31
© 2011 Cengage Learning. All Rights Reserved. This edition is intended for use outside of the U.S. only, with content that may be different from
the U.S. Edition. May not be scanned, copied, duplicated, or posted to a publicly accessible website, in whole or in part.
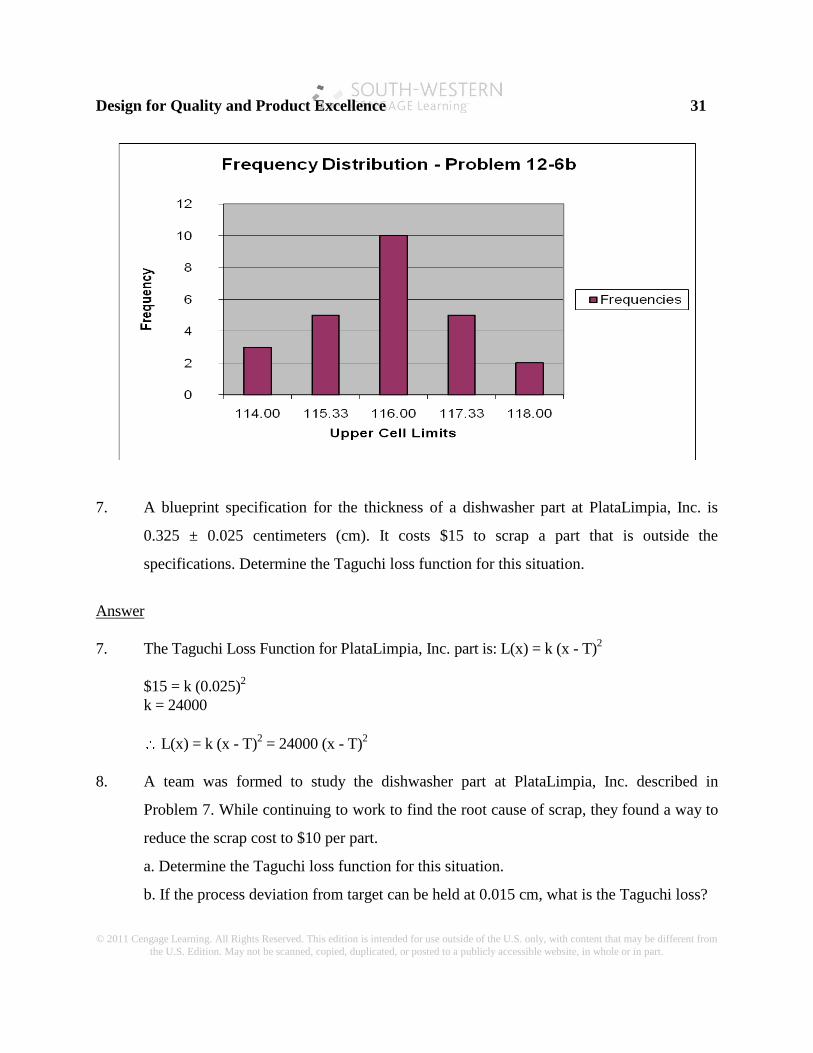
7. A blueprint specification for the thickness of a dishwasher part at PlataLimpia, Inc. is
0.325 ± 0.025 centimeters (cm). It costs $15 to scrap a part that is outside the
specifications. Determine the Taguchi loss function for this situation.
Answer
7. The Taguchi Loss Function for PlataLimpia, Inc. part is: L(x) = k (x - T)2
$15 = k (0.025)2
k = 24000
L(x) = k (x - T)2 = 24000 (x - T)
2
8. A team was formed to study the dishwasher part at PlataLimpia, Inc. described in
Problem 7. While continuing to work to find the root cause of scrap, they found a way to
reduce the scrap cost to $10 per part.
a. Determine the Taguchi loss function for this situation.
b. If the process deviation from target can be held at 0.015 cm, what is the Taguchi loss?

Design for Quality and Product Excellence 32
© 2011 Cengage Learning. All Rights Reserved. This edition is intended for use outside of the U.S. only, with content that may be different from
the U.S. Edition. May not be scanned, copied, duplicated, or posted to a publicly accessible website, in whole or in part.
Answer
8. The Taguchi Loss Function is: L(x) = k (x - T)2
a) $10 = k (0.025)2
k = 16000
L(x) = k (x - T)2 = 16000 (x - T)
2
b) L(x) = 16000 (x - T)2
L(0.015) = 16000 (0.015)
2 = $3.60
9. A specification for the length of an auto part at PartsDimensions, Inc. is 5.0 ± 0.10
centimeters (cm). It costs $50 to scrap a part that is outside the specifications. Determine
the Taguchi loss function for this situation.
Answer
9. The Taguchi Loss Function is: L(x) = k (x - T)2
$50 = k (0.10)2
k = 5000
L(x) = k (x - T)2 = 5000 (x - T)
2
10. A team was formed to study the auto part at PartsDimensions described in Problem 9.
While continuing to work to find the root cause of scrap, the team found a way to reduce
the scrap cost to $30 per part.
a. Determine the Taguchi loss function for this situation.
b. If the process deviation from target can be held at 0.020 cm, what is the Taguchi loss?

Design for Quality and Product Excellence 33
© 2011 Cengage Learning. All Rights Reserved. This edition is intended for use outside of the U.S. only, with content that may be different from
the U.S. Edition. May not be scanned, copied, duplicated, or posted to a publicly accessible website, in whole or in part.
Answer
10. The Taguchi Loss Function is: L(x) = k (x - T)2
a) $30 = k (0.10)2
k = 3000
L(x) = k (x - T)2 = 3000 (x - T)
2
b) L(x) = 3000 (x - T)2
L(0.020) = 3000 (0.020)
2 = $ 1.20
11. Ruido Unlimited makes electronic soundboards for car stereos. Output voltage to a
certain component on the board must be 12 ± 0.2 volts. Exceeding the limits results in an
estimated loss of $50. Determine the Taguchi loss function.
Answer
11. The Taguchi Loss Function is: L(x) = k (x - T)2
$50 = k (0.2)2
k = 1250
L(x) = k (x - T)2 = 1250 (x - T)
2
12. An electronic component has a specification of 100 ± 3 ohms. Scrapping the component
results in a $81 loss.
a. What is the value of k in the Taguchi loss function?
b. If the process is centered on the target specification with a standard deviation of 1
ohm, what is the expected loss per unit?

Design for Quality and Product Excellence 34
© 2011 Cengage Learning. All Rights Reserved. This edition is intended for use outside of the U.S. only, with content that may be different from
the U.S. Edition. May not be scanned, copied, duplicated, or posted to a publicly accessible website, in whole or in part.
Answer
12. For a specification of 100 ± 3 ohms:
a) L(x) = k (x - T)2
$81 = k ( 3 )2
k = 9
b) EL(x) = k ( 2 + D
2) = 9 ( 1
2 + 0
2 ) = $9
13. An automatic cookie machine must deposit a specified amount of 25 ± 0.2 grams (g) of
dough for each cookie on a conveyor belt. If the machine either over- or underdeposits the
mixture, it costs $0.02 to scrap the defective cookie.
a. What is the value of k in the Taguchi loss function?
b. If the process is centered on the target specification with a standard deviation of 0.06 g,
what is the expected loss per unit?
Answer
13. For a specification of 25 ± 0.2 grams
a) L(x) = k (x - T)2
$0.02 = k ( 0.2 )2
k = 0.5
b) For = 0.06
EL(x) = k ( 2 + D
2) = 0.5 ( 0.06
2 + 0
2 ) = $0.0018
14. A computer chip is designed so that the distance between two adjacent pins has a
specification of 2.000 ± 0.002 millimeters (mm). The loss due to a defective chip is $2. A
sample of 25 chips was drawn from the production process and the results, in mm, can be
found in the C12Data file for Prob.12-14 on the Premium website for this chapter.
a. Compute the value of k in the Taguchi loss function.
b. What is the expected loss from this process based on the sample data?

Design for Quality and Product Excellence 35
© 2011 Cengage Learning. All Rights Reserved. This edition is intended for use outside of the U.S. only, with content that may be different from
the U.S. Edition. May not be scanned, copied, duplicated, or posted to a publicly accessible website, in whole or in part.
Answer
14. For a specification of 2.000 ± .002 mm and a $2 scrap cost:
Analysis of the dataset for problem 12-14 provides the following statistics:
x = 2.00008; D = 2.00008 - 2.00 = 0.00008
= 0.00104
a) L(x) = k (x - T)2
$2 = k (0.002)2 k = 500,000
b) EL(x) = k ( 2 + D
2) = 500,000 ( 0.00104
2 + 0.00008
2 ) = $0.544
15. In the production of transformers, any output voltage that exceeds 120 ± 15 volts is
unacceptable to the customer. Exceeding these limits results in an estimated loss of $450.
However, the manufacturer can adjust the voltage in the plant by changing a resistor that
costs $2.25.
a. Determine the Taguchi loss function.
b. Suppose the nominal specification is 120 volts. At what tolerance should the
transformer be manufactured, assuming that the amount of loss is represented by the cost
of the resistor?
Answer
15. a) The Taguchi Loss function is: L(x) = k (x - T)2
450 = k (15)2
k = 0.5
So, L(x) = 0.5 (x-T)2

Design for Quality and Product Excellence 36
© 2011 Cengage Learning. All Rights Reserved. This edition is intended for use outside of the U.S. only, with content that may be different from
the U.S. Edition. May not be scanned, copied, duplicated, or posted to a publicly accessible website, in whole or in part.
b) $2.25 = 0.5 (x-120)2
4.50 = (x - 120)2
(x - T)Tolerance = 50.4 = 2.12 volts
2.12 = x - 120
x = 122.12
16. At Elektroparts Manufacturers’ integrated circuit business, managers gathered data from a
customer focus group and found that any output voltage that exceeds 120 ± 5 volts was
unacceptable to the customer. Exceeding these limits results in an estimated loss of $200.
However, the manufacturer can still adjust the voltage in the plant by changing a resistor
that costs $2.00.
a. Determine the Taguchi loss function.
b. Suppose the nominal specification remains at 120 volts. At what tolerance should the
integrated circuit be manufactured, assuming that the amount of loss is represented by the
cost of the resistor?
Answer
16. a) The Taguchi Loss function is: L(x) = k (x - T) 2
200 = k (5)2
k = 8
So, L(x) = 8 (x-T)2

Design for Quality and Product Excellence 37
© 2011 Cengage Learning. All Rights Reserved. This edition is intended for use outside of the U.S. only, with content that may be different from
the U.S. Edition. May not be scanned, copied, duplicated, or posted to a publicly accessible website, in whole or in part.
b) The Taguchi Loss function is: L(x) = k (x - T) 2
$2.00 = 8 (x-120)2
0.25 = (x - 120)2
(x - T)Tolerance = 25.0 = 0.5 volts
0.5 = x - 120
x = 120.5
17. Two processes, P and Q, are used by a supplier to produce the same component, Z, which
is a critical part in the engine of the Air2Port 778 airplane. The specification for Z calls
for a dimension of 0.24 mm ± 0.03. The probabilities of achieving the dimensions for
each process based on their inherent variability are shown in the table found in the
C12Data file for Prob.12-17 on the Premium website for this chapter. If k = 60,000, what
is the expected loss for each process? Which would be the best process to use, based on
minimizing the expected loss?
Answer
17. For the Air2Port 778 plane parts (see spreadsheets Prob12-17.xls for detailed
calculations):
Specifications are 24 +/- 3 mm
L(x) = 60000 (x - T)2
For a typical calculation:
L(0.21) = 60000 (0.21 - 0.24)2 = $ 54.00
Weighted loss = 0.12 X $54.00 = $ 6.48

Design for Quality and Product Excellence 38
© 2011 Cengage Learning. All Rights Reserved. This edition is intended for use outside of the U.S. only, with content that may be different from
the U.S. Edition. May not be scanned, copied, duplicated, or posted to a publicly accessible website, in whole or in part.
Air2Port Airplane Co.
Calculation of Taguchi Loss Values
Value
Loss ($)
Process P
Probability
Weighted
Loss ($)
Process Q
Probability
Weighted
Loss ($)
0.20 96.00 0 0.00 0.02 1.92
0.21 54.00 0.12 6.48 0.03 1.62
0.22 24.00 0.12 2.88 0.15 3.60
0.23 6.00 0.12 0.72 0.15 0.90
0.24 0.00 0.28 0.00 0.30 0.00
0.25 6.00 0.12 0.72 0.15 0.90
0.26 24.00 0.12 2.88 0.15 3.60
0.27 54.00 0.12 6.48 0.03 1.62
0.28 96.00 0 0.00 0.02 1.92
Expected Loss 20.16 16.08
Therefore, Process Q incurs a smaller loss than Process P, even though some output of Q
falls outside specifications.
18. The average time to handle a call in a the Call-Nowait call processing center has a
specification of 6 ±1.25 minutes. The loss due to a mishandled call is $16. A sample of
25 calls was drawn from the process and the results, in minutes, can be found in the
C12Data file for Prob.12-18 on the Premium website for this chapter.
a. Compute the value of k in the Taguchi loss function.
b. What is the expected loss from this process based on the sample data?
Answer
18. For a specification of 6 1.25 minutes and a $16 call mishandling cost:
x = 6.016; D = 6.016 - 6.00 = 0.016
= 0.8957
a) L(x) = k (x - T)2
$16 = k (1.25 )2 ; k = 10.24

Design for Quality and Product Excellence 39
© 2011 Cengage Learning. All Rights Reserved. This edition is intended for use outside of the U.S. only, with content that may be different from
the U.S. Edition. May not be scanned, copied, duplicated, or posted to a publicly accessible website, in whole or in part.
b) E [L(x) = k ( 2 + D
2)] = 10.24 ( 0.8957
2 + 0.016
2 ) = $8.218
19. Compute the average failure rate during the intervals 0 to 40, 40 to 70, and 70 to 100, and
0 to 100, based on the information in Figure 12.28.
Answer
19. Based on the Cumulative Failure Rate curve:
From 0 - 40, slope = 29.5 / 40 = 0.738
From 40 - 70, slope = (40 – 29.5) / (70 - 40) = 0.350
From 70 - 100, slope = (90 - 40) / (100 - 70) = 1.678
From 0 - 100, slope = 90 / 100 = 0.9
See the spreadsheet Prob12-19 for more details, including a diagram showing the failure
rate curve.
20. The life of a cell phone battery is normally distributed with a mean of 900 days and
standard deviation of 50 days.
a. What fraction of batteries is expected to survive beyond 975 days?
b. What fraction will survive fewer than 800 days?
c. Sketch the reliability function.
d. What length of warranty is needed so that no more than 10 percent of the batteries will
be expected to fail during the warranty period?

Design for Quality and Product Excellence 40
© 2011 Cengage Learning. All Rights Reserved. This edition is intended for use outside of the U.S. only, with content that may be different from
the U.S. Edition. May not be scanned, copied, duplicated, or posted to a publicly accessible website, in whole or in part.
Answer
20. a) P(x > 975) = 0.5 - P(900 < x < 975)
975-900
P(900 < x < 975)= P (z < ----------------) = P (0 < z < 1.5) = 0.4332
50
Therefore, P(x > 875) = 0.5 - 0.4332 = 0.0668 or 6.68% should survive beyond 975 days.
800 -900
b) P (x < 800) = P (z < -------------) = P (z < -2.0 )
50
Therefore, P (x < 880) = 0.5 - 0.4772 = 0.0228 or 2.28% should survive less than 800 days.
c) The reliability function looks approximately as follows (see spreadsheet Prb12-20.xls for
details):
d) Let xw be the limit of the warranty period.
P (x < xw) = 0.10; z = -1.28, for z = x-900 = -1.28 , xw = 836 hours for the
50 warranty limit.

Design for Quality and Product Excellence 41
© 2011 Cengage Learning. All Rights Reserved. This edition is intended for use outside of the U.S. only, with content that may be different from
the U.S. Edition. May not be scanned, copied, duplicated, or posted to a publicly accessible website, in whole or in part.
21. Lifetred, Inc., makes automobile tires that have a mean life of 75,000 miles with a
standard deviation of 2,500 miles.
a. What fraction of tires is expected to survive beyond 77,250 miles?
b. What fraction will survive fewer than 68,750 miles?
c. Sketch the reliability function.
d. What length of warranty is needed so that no more than 10 percent of the tires
will be expected to fail during the warranty period?
Answer
21. a) P(x > 77250) = 0.5 - P(75000 < x < 77250)
77250 - 75000
P(75000 < x < 77250)= P(z < -------------------) = P (0 < z < 0.9) = 0.3159
2500
Therefore, P(x > 77250) = 0.5 - 0.3159 = 0.1841 or 18.41% should survive beyond 77250
miles.
68750- 75000 - 6250
b) P (x < 68750) = P(z < -------------------- ) = P(z < ---------- ) = P (z < -2.50) =
2500 2500
0.5 - P(68750 < x < 75000) = 0.5 - 0.4938 = 0.0062
Therefore, P (x < 68750) = 0.0062 or 0.62% should survive less than 68750 miles.
c) The reliability function looks approximately as follows:

Design for Quality and Product Excellence 42
© 2011 Cengage Learning. All Rights Reserved. This edition is intended for use outside of the U.S. only, with content that may be different from
the U.S. Edition. May not be scanned, copied, duplicated, or posted to a publicly accessible website, in whole or in part.
d) Let xw be the limit of the warranty period.
P (x < xw) = 0.10; z = -1.28, for z = x-75000 = -1.28 , xw = 71,800 miles for the
2500 warranty limit.
22. Massive Corporation’s tested five motors in an 800-hour test. Compute the failure rate if,
three failed after 200, 375, and 450 hours and the other two ran for the full 800 hours
each.
Answer
22. Massive Corporation’s motors have a failure rate of:
= 3 = 3 = 0.001143 failures / hour
[(2 x 800) + 200 +375 + 450] 2625
23. Livelong, Inc.’s computer monitors have a failure rate of 0.00005 units per hour.
Assuming an exponential distribution, what is the probability of failure within 10,000
hours? What is the reliability function?

Design for Quality and Product Excellence 43
© 2011 Cengage Learning. All Rights Reserved. This edition is intended for use outside of the U.S. only, with content that may be different from
the U.S. Edition. May not be scanned, copied, duplicated, or posted to a publicly accessible website, in whole or in part.
Answer
23. The reliability function for Livelong’s monitors is R(T) = 1 - F(T) = e- T
= 0.00005; Use F(T) = P(x < 10000)
F(T) = P(x < 10000) = 1 - e-0.00005 (10000)
= 1- 0.607 = 0.393 or 39.3% probability that a
monitor will survive less than 10,000 hours.
24. An electronic component in a satellite radio has failure rate of = .000015. Find the mean
time to failure (MTTF). What is the probability that the component will not have failed after
12,000 hours of operation?
Answer
24. The MTTF is = 1 ; so, = 66666.67
R (T) = e- T/
= e- 12000 / 66666.67
= e -0.18
= 0.835 or 83.5% probability of surviving for at
least 12,000 hours
25. The MTBF of an integrated circuit made by IceeU, Inc. is 18,000 hours. Calculate the
failure rate.
Answer
25. The failure rate ( ) for IceeU, Inc.’s integrated circuits is:
= 1 = 0.000056 failures / hr.
18000
26. A manufacturer of MP3 players purchases major electronic components as modules. The
reliabilities of components differ by supplier (see diagram, below). Suppose that the
configuration of the major components is given by:

Design for Quality and Product Excellence 44
© 2011 Cengage Learning. All Rights Reserved. This edition is intended for use outside of the U.S. only, with content that may be different from
the U.S. Edition. May not be scanned, copied, duplicated, or posted to a publicly accessible website, in whole or in part.
The components that can be purchased from three different suppliers. The reliabilities of
the components are as follows:
Component Supplier 1 Supplier 2 Supplier 3
A .97 .92 .95 B .85 .90 .90 C .95 .93 .88
Transportation and purchasing considerations require that only one supplier be chosen.
Which one should be selected if the radio is to have the highest possible reliability?
Answer
26. Supplier 1: RaRbc = (0.97) [1 - (1 - 0.85)(1 - 0.95)] = 0.963
Supplier 2: RaRbc = (0.92) [1 - (1 - 0.90)(1 - 0.93)] = 0.914
Supplier 3: RaRbc = (0.95) [1 - (1 - 0.90)(1 - 0.88)] = 0.939
Therefore, choose Supplier 1.
27. An electronic missile guidance system consists of the following components:
Components A, B, C, and D have reliabilities of 0.98, 0.95, 0.85, and 0.99, respectively
(see the following diagram). What is the reliability of the entire system?
Answer
27. The reliability of the parallel Rcc shown in the diagram above the problem, is calculated as:
Rcc = 1 - (1 - 0.85) 2 = 0.98
RaRbRccRd = (0.98)(0.95) (0.98)(0.99) = 0.903

Design for Quality and Product Excellence 45
© 2011 Cengage Learning. All Rights Reserved. This edition is intended for use outside of the U.S. only, with content that may be different from
the U.S. Edition. May not be scanned, copied, duplicated, or posted to a publicly accessible website, in whole or in part.
28. A Bestronics store processes customers through 3 work stations when they wish to buy a
certain popular product. Modular components for the product must be checked
electronically at two work stations before final checkout, where the cashier collects cash or
credit cards for the sale. a) If workstation 1 has reliability of testing equipment of 0.98,
workstation 2 has reliability of testing equipment of 0.92 and the final checkout register has
a reliability of 0.90, what is the overall checkout system reliability? b) If the store manager
wants to ensure at least a 90% system reliability can she do so by dedicating two final
checkout registers to the process, in parallel, each having a 0.90 reliability, with the same
reliability at workstations 1 and 2?
Answer
28. a) RaRbRc = (0.98)(0.92)(0.90) = 0.811
b) RaRbc = (0.98) (0.92) [1 - (1 - 0.90)(1 - 0.90)] = 0.893
No, this will not provide the minimum required system reliability. The manager must find a
way to improve reliability of one or more workstations or checkout registers.
29. Manuplex, Inc. has a complex manufacturing process, with three operations that are
performed in series. Because of the nature of the process, machines frequently fall out of
adjustment and must be repaired. To keep the system going, two identical machines are
used at each stage; thus, if one fails, the other can be used while the first is repaired (see
accompanying figure).

Design for Quality and Product Excellence 46
© 2011 Cengage Learning. All Rights Reserved. This edition is intended for use outside of the U.S. only, with content that may be different from
the U.S. Edition. May not be scanned, copied, duplicated, or posted to a publicly accessible website, in whole or in part.
The reliabilities of the machines are as follows: Machine Reliability
A .70 B .80 C .95
a. Analyze the system reliability, assuming only one machine at each stage (all the
backup machines are out of operation).
b. How much is the reliability improved by having two machines at each stage?
Answer
29. a) RaRbRc = (0.70)(0.80)(0.95) = 0.532
b) RaaRbbRcc = [1 - (1 - 0.70)2] [1 - (1 - 0.80)
2] [1 - (1 - 0.95)
2] =
(0.91) (0.96) (0.9975) = 0.871
The improvement is significant, rising 0.339 from 0.532 to 0.871
30. An automated production system at Autoprod, Inc. consists of three operations: turning,
milling, and grinding. Individual parts are transferred from one operation to the next by a
robot. Hence, if one machine or the robot fails, the process stops.
a. If the reliabilities of the robot, turning center, milling machine, and grinder are 0.98,
0.90, 0.93, and 0.85, respectively, what is the reliability of the system?
b. Suppose that two grinders are available and the system does not stop if one fails. What
is the reliability of the system?
Answer
30. a) RtRmRg = (0.98)(0.90)(0.93)(0.85) = 0.697
b) RtRmReg = (0.98)(0.90)(0.93)[1 - (1 - 0.85)2] = 0.802

Design for Quality and Product Excellence 47
© 2011 Cengage Learning. All Rights Reserved. This edition is intended for use outside of the U.S. only, with content that may be different from
the U.S. Edition. May not be scanned, copied, duplicated, or posted to a publicly accessible website, in whole or in part.
GAGE R&R PROBLEMS
31. A gauge repeatability and reproducibility study at Frankford Brake Systems collected the
data found in the C12Data file for Prob.12-31 on the Premium website for this chapter.
Analyze these data. The part specification is 1.0 ± 0.06 mm.
Answer
31. Detailed calculations for the first operator are as follows:
x 1 = ( Mijk) /nr = 29.720 / 30 = 0.9907
R 1 = ( Rij) / n = 0.280 / 10 = 0.028
Use this method to calculate values for the second operator:
x 2 = 29.901 / 30 = 0.9967; R 2 = 0.380/ 10 = 0.038
x D = max { x i} - min { x i} = 0.9967 - 0.9907 = 0.006
R = ( R i) / m = (0.028 + 0.038) / 2 = 0.033
D4 = 2.574 ; UCLR = D4 R = (2.574) (0.033) = 0.0849, all ranges below
K1 = 3.05 ; K2 = 3.65 (from Table 12.3)
EV = K1 R = (3.05) (0.033) = 0.10065
AV = (K x ) - (EV / nr) 2 D2 2 = 0.0119
RR = (AV) + (EV) 22 = 0.1014
Equipment variation = 100 (0.10065 / 0.12) = 83.88%
Operator variation = 100 (0.0119 / 0.12) = 9.92%
R & R variation = 100 (0.1014 / 0.12) = 84.50%

Design for Quality and Product Excellence 48
© 2011 Cengage Learning. All Rights Reserved. This edition is intended for use outside of the U.S. only, with content that may be different from
the U.S. Edition. May not be scanned, copied, duplicated, or posted to a publicly accessible website, in whole or in part.
For detailed spreadsheet data, see Prob12-31RR.xls. Spreadsheet results confirm prior
calculations, as follows:
Tolerance analysis
Average range 0.033 Repeatability (EV) 0.101 83.88%
X-bar range ( x D) 0.006 Reproducibility (AV) 0.012 9.93%
Repeatability and Reproducibility (R&R) 0.101 84.46%
Control limit for individual ranges 0.085
Note: any ranges beyond this limit may be the result of assignable causes. Identify and correct. Discard values and recompute statistics.
Concentrate on reducing equipment variation
Note that the calculator values, shown in the detailed calculations above, and computer
values do not match precisely, because a greater number of decimal places are used by the
computer to carry out calculations. All formulas are identical, however.
32. A gauge repeatability and reproducibility study was made at Precision Parts, Inc., using
three operators, taking three trials each on identical parts. The data that can be found in
the C12Data file for Prob.12-32 on the Premium website for this chapter were collected.
Do you see any problems after analyzing these data? What should be done? The part
specification for the collar that was measured was 1.6 ± 0.2 inches.
Answer
32. Detailed calculations for the first operator are as follows:
x 1 = ( Mijk) /nr = 48.48 / 30 = 1.616
R 1 = ( Rij) / n = 1.33 / 10 = 0.133
Use this method to calculate values for the second operator:
x 2 = 46.74 / 30 = 1.558; R 2 = 1.58/ 10 = 0.158

Design for Quality and Product Excellence 49
© 2011 Cengage Learning. All Rights Reserved. This edition is intended for use outside of the U.S. only, with content that may be different from
the U.S. Edition. May not be scanned, copied, duplicated, or posted to a publicly accessible website, in whole or in part.
Also, use this method to calculate values for the third operator:
x 3 = 47.05 / 30 = 1.568; R 3 = 0.610/ 10 = 0.061
x D = max { x i} - min { x i} = 1.616 – 1.558 = 0.058
R = ( R i) / m = (0.133 + 0.158 + 0.061) / 3 = 0.117
D4 = 2.574 ; UCLR = D4 R = (2.574) (0.117) = 0.3012, all ranges below
K1 = 3.05 ; K2 = 3.65 (from Table 12.3)
EV = K1 R = (3.05) (0.117) = 0.3569
AV = (K x ) - (EV / nr) 2 D2 2 = 0.1424
RR = (AV) + (EV) 22 = 0.3843
Equipment variation = 100 (0.3569 / 0.40) = 89.23%
Operator variation = 100 (0.1424 / 0.40) = 35.60%
R & R variation = 100 (0.3843 / 0.40) = 96.08%
Note that the range in sample 7 exceeded the control limit of 0.301 by for the first
operator. This point could have been due to a misreading of the gauge. If so, this sample
should be thrown out, another one taken, and the values recomputed.
For detailed spreadsheet data, see Prob12-32RR.xls. Spreadsheet results confirm prior
calculations, as follows: Tolerance analysis
Average range 0.117 Repeatability (EV) 0.358 89.47%
X-bar range ( x D) 0.058 Reproducibility (AV) 0.142 35.58%
Repeatability and Reproducibility (R&R) 0.385 96.28%
Control limit for individual ranges 0.302
Note: any ranges beyond this limit may be the result
of assignable causes. Identify and correct. Discard
values and recompute statistics.
Concentrate on reducing equipment variation

Design for Quality and Product Excellence 50
© 2011 Cengage Learning. All Rights Reserved. This edition is intended for use outside of the U.S. only, with content that may be different from
the U.S. Edition. May not be scanned, copied, duplicated, or posted to a publicly accessible website, in whole or in part.
Note also that the calculator values, shown in the detailed calculations above, and
computer values do not match precisely, because a greater number of decimal places are
used by the computer to carry out calculations. All formulas are identical, however.
33. A machining process at Mach3 Tool Co. has a required dimension on a part of 0.575
± 0.007 inch. Twenty-five parts each were measured as found in the C12Data file for
Prob.12-33 on the Premium website for this chapter. What is its capability for
producing within acceptable limits?
Answer
33. For sample statistics at Mach3 Tool Co. of: x = 0.5750; = 0.0065 and a tolerance of
0.575 ± 0.007
Cp = UTL - LTL = 0.582 - 0.568 = 0.359; not capable - unsatisfactory
6 6 (0.0065)
See spreadsheet Prob12-33.xls for more descriptive analysis.
Note: There is some rounding error in the above calculations. See spreadsheet for more
descriptive analysis.
Nominal specification 0.5750 Average 0.5750 Cp 0.3567
Upper tolerance limit 0.5820 Std. deviation 0.0065 Cpl 0.3547
Lower tolerance limit 0.5680 Cpu 0.3587
Cpk 0.3547
34. Adjustments were made in the process at Mach3 Tool Co., discussed in Problem 33 and
25 more samples were taken. The results are given in the C12Data file for Prob.12-34 on
the Premium website for this chapter. What can you observe about the process? Is it now
capable of producing within acceptable limits?
Answer
34. For sample statistics of: x = 0.5755; = 0.0017 and a tolerance of 0.575 ± 0.007
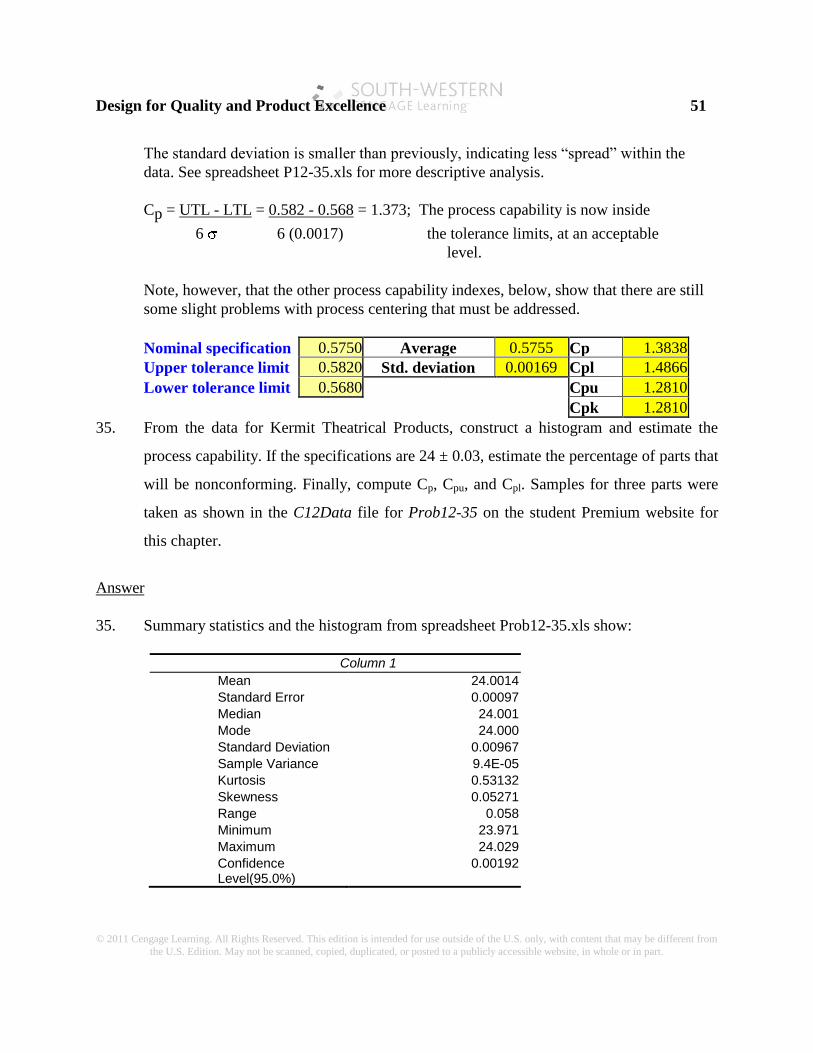
Design for Quality and Product Excellence 51
© 2011 Cengage Learning. All Rights Reserved. This edition is intended for use outside of the U.S. only, with content that may be different from
the U.S. Edition. May not be scanned, copied, duplicated, or posted to a publicly accessible website, in whole or in part.
The standard deviation is smaller than previously, indicating less ―spread‖ within the
data. See spreadsheet P12-35.xls for more descriptive analysis.
Cp = UTL - LTL = 0.582 - 0.568 = 1.373; The process capability is now inside
6 6 (0.0017) the tolerance limits, at an acceptable
level.
Note, however, that the other process capability indexes, below, show that there are still
some slight problems with process centering that must be addressed.
Nominal specification 0.5750 Average 0.5755 Cp 1.3838
Upper tolerance limit 0.5820 Std. deviation 0.00169 Cpl 1.4866
Lower tolerance limit 0.5680 Cpu 1.2810
Cpk 1.2810
35. From the data for Kermit Theatrical Products, construct a histogram and estimate the
process capability. If the specifications are 24 ± 0.03, estimate the percentage of parts that
will be nonconforming. Finally, compute Cp, Cpu, and Cpl. Samples for three parts were
taken as shown in the C12Data file for Prob12-35 on the student Premium website for
this chapter.
Answer
35. Summary statistics and the histogram from spreadsheet Prob12-35.xls show:
Column 1
Mean 24.0014
Standard Error 0.00097
Median 24.001
Mode 24.000
Standard Deviation 0.00967
Sample Variance 9.4E-05
Kurtosis 0.53132
Skewness 0.05271
Range 0.058
Minimum 23.971
Maximum 24.029
Confidence Level(95.0%)
0.00192

Design for Quality and Product Excellence 52
© 2011 Cengage Learning. All Rights Reserved. This edition is intended for use outside of the U.S. only, with content that may be different from
the U.S. Edition. May not be scanned, copied, duplicated, or posted to a publicly accessible website, in whole or in part.
Bin Frequency
23.971 1
23.977 0
23.983 0
23.988 7
23.994 14
24.000 26
24.006 20
24.012 19
24.017 7
24.023 5
More 1
Histogram
0
5
10
15
20
25
30
23.9
71
23.9
77
23.9
83
23.9
88
23.9
94
24.0
00
24.0
06
24.0
12
24.0
17
24.0
23
More
Bin
Fre
qu
en
cy
Frequency
For sample statistics of: x = 24.0014; = 0.0097
Specification limits for the process are: 23.97 < < 24.03
z = 24.0300 - 24.0014 = 2.95 P( z > 2.94) = (0.5 - 0.4984) = 0.0016 that
0.0097 items will exceed upper limit
z = 23.9700 - 24.0014 = -3.24 P( z < -3.24) = 0.00 that items
0.0097 will exceed lower limit
Therefore, the percent outside is: 0.0016, or 0.16 %

Design for Quality and Product Excellence 53
© 2011 Cengage Learning. All Rights Reserved. This edition is intended for use outside of the U.S. only, with content that may be different from
the U.S. Edition. May not be scanned, copied, duplicated, or posted to a publicly accessible website, in whole or in part.
Cp = UTL - LTL = 24.030 - 23.970 = 1.031
6 6 (0.0097)
Cpu = UTL - x = 24.030 - 24.0014 = 0.983
3 3 (0.0097)
Cpl = x - LTL = 24.0014 - 23.970 = 1.079
3 3 (0.0097)
The process capability indexes are slightly out of tolerance for the upper index, and within
minimum limits for the lower and overall index. These results indicate that the process may
be minimally adequate if it can be centered on the nominal dimension of 24. However, the
ideal situation would be to launch process improvement studies so that the capability
indexes could be at least doubled.
36. Samples for three parts made at River City Parts Co. were taken as shown in the C12Data
file for Prob.12-36 on the Premium website for this chapter. Data set 1 is for part 1, data
set 2 is for part 2, and data set 3 is for part 3.
a. Calculate the mean and standard deviations for each part and compare them to the
following specification limits:
Part Nominal Tolerance
1 1.750 ± 0.045 2 2.000 ± 0.060 3 1.250 ± 0.030
b. Will the production process permit an acceptable fit of all parts into a slot with a
specification of 5 ± 0.081 at least 99.73 percent of the time?
Answer
36. a) Sample statistics as shown in spreadsheet Prob.12-36.xls are:
Data set 1: x = 1.7446; s = 0.0163; 3s = 0.0489
Data set 2: x = 1.9999; s = 0.0078; 3s = 0.0234

Design for Quality and Product Excellence 54
© 2011 Cengage Learning. All Rights Reserved. This edition is intended for use outside of the U.S. only, with content that may be different from
the U.S. Edition. May not be scanned, copied, duplicated, or posted to a publicly accessible website, in whole or in part.
Data set 3: x = 1.2485; s = 0.0052; 3s = 0.0156
Part 1 will not consistently meet the tolerance limit since its ± 3s value is greater than the
tolerance limit. Parts 2 and 3 are well within their tolerance limits, since their ± 3s values
are smaller than the stated tolerances.
b) x T = 4.9930 ; Estimated Process = s +s +s12
22
3 2 =
0.0163 +0.0078 + 0.00522 2 2 = 0.0188
Process limits: 4.9930 ± 3(0.0188) or
4.9366 to 5.0494 vs. specification limits of
4.919 to 5.081 for a confidence level of 0.9973.
The parts will fit within their combined specification limit with a 0.9973 confidence
level.
37. Omega Tecnology Ltd. (OTL) is a small manufacturing company that produces various
parts for tool manufacturers. One of OTL’s production processes involves producing a
Teflon® spacer plate that has a tolerance of 0.05 to 0.100 cm in thickness. On the
recommendation of the quality assurance (QA) department and over objections of the
plant manager, OTL just purchased some new equipment to make these parts. Recently,
the production manager was receiving complaints from customers about high levels of
nonconforming parts. He suspected the new equipment, but neither QA nor plant
management would listen.
The manager discussed the issue with one of his production supervisors who mentioned
that she had just collected some process data for a study that the quality assurance
department was undertaking. The manager decided that he would prove his point by
showing that the new equipment was not capable of meeting the specifications. The data
provided by the supervisor are shown in the C12Data file for Problem 12-37 on the
Premium website for this chapter. Perform a process capability study on these data and
interpret your results.

Design for Quality and Product Excellence 55
© 2011 Cengage Learning. All Rights Reserved. This edition is intended for use outside of the U.S. only, with content that may be different from
the U.S. Edition. May not be scanned, copied, duplicated, or posted to a publicly accessible website, in whole or in part.
Answer
37. Omega Technology Ltd.’s process capability results from the Excel spreadsheet software
are shown below. (See spreadsheet Prob12-37.xls for details.)
Average 0.0764 Cp 0.8019
Standard deviation 0.0104 Cpl 0.8468
Cpu 0.7569
Cpk 0.7569
These data show that the process has a rather low overall capability, with Cp = 0.8019
and a total of 1.71% of the values falling outside of the specification limits of 0.05 - 0.10
Process statistics: x = 0.0764, = 0.0104
z = 0.10 - 0.0764 = 2.27 P( z > 2.27) = (.5- 0.4884) = 0.0116 that the part
0.0104 will exceed upper limit
z = 0.05 - 0.0764 = -2.54 P( z < -2.54) = (.5- 0.4945) = 0.0055 that the part
0.0104 will exceed lower limit
Therefore, the percent outside is: 0.0171, or 1.71 %
38. Suppose that a refrigeration process at Coolfoods, Ltd. Has a normally distributed output
with a mean of 25.0 and a variance of 1.44.
a. If the specifications are 25.0 ± 3.25, compute Cp, Cpk, and Cpm. Is the process capable and
centered?
b. Suppose the mean shifts to 23.0 but the variance remains unchanged. Recompute and
interpret these process capability indexes.
c. If the variance can be reduced to 40 percent of its original value, how do the process
capability indices change (using the original mean of 25.0)?
Answer
38. (a) x = 25.0; = 1.2
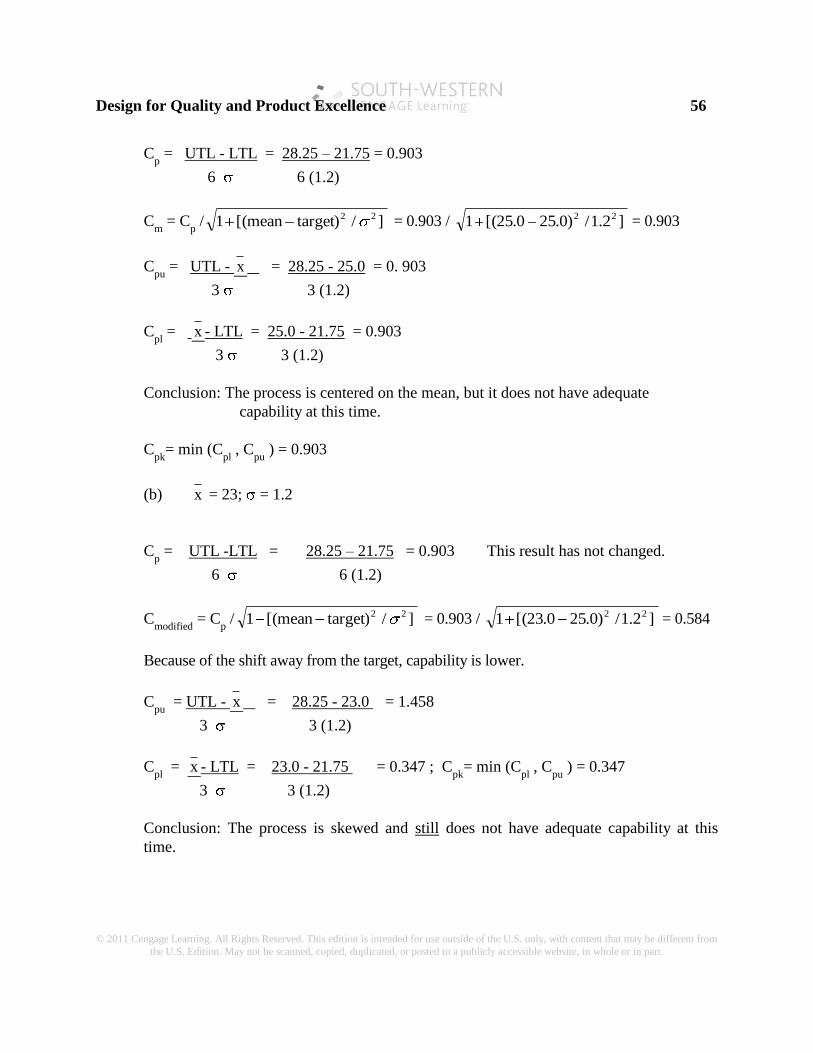
Design for Quality and Product Excellence 56
© 2011 Cengage Learning. All Rights Reserved. This edition is intended for use outside of the U.S. only, with content that may be different from
the U.S. Edition. May not be scanned, copied, duplicated, or posted to a publicly accessible website, in whole or in part.
Cp = UTL - LTL = 28.25 – 21.75 = 0.903
6 6 (1.2)
Cm
= Cp / ] / )targetmean[(1 22 = 0.903 / ]2.1 / )0.250.25[(1 22 = 0.903
Cpu
= UTL - x = 28.25 - 25.0 = 0. 903
3 3 (1.2)
Cpl
= x - LTL = 25.0 - 21.75 = 0.903
3 3 (1.2)
Conclusion: The process is centered on the mean, but it does not have adequate
capability at this time.
Cpk
= min (Cpl
, Cpu
) = 0.903
(b) x = 23; = 1.2
Cp = UTL -LTL = 28.25 – 21.75 = 0.903 This result has not changed.
6 6 (1.2)
Cmodified
= Cp / ] / )targetmean[(1 22 = 0.903 / ]2.1 / )0.250.23[(1 22 = 0.584
Because of the shift away from the target, capability is lower.
Cpu = UTL - x = 28.25 - 23.0 = 1.458
3 3 (1.2)
Cpl
= x - LTL = 23.0 - 21.75 = 0.347 ; Cpk
= min (Cpl
, Cpu
) = 0.347
3 3 (1.2)
Conclusion: The process is skewed and still does not have adequate capability at this
time.

Design for Quality and Product Excellence 57
© 2011 Cengage Learning. All Rights Reserved. This edition is intended for use outside of the U.S. only, with content that may be different from
the U.S. Edition. May not be scanned, copied, duplicated, or posted to a publicly accessible website, in whole or in part.
(c) 2
new = 0.4 (1.44) = 0.576 new = 0.759
Cp = UTL -LTL = 28.25 – 21.75 = 1.427
6 6 (0.759)
Cmodified
= Cp / ] / )targetmean[(1 22 = 1.427/ ]0.759 / )0.250.25[(1 22 = 1.427
If there is no shift away from the target, capability is equal to Cp.
Cpu
= 28.25 - 25.0 = 1.427
3 (0.759)
Cpl
= 25.0 - 21.75 = 1.427
3 (0.759)
Cpk
= min (Cpl
, Cpu
) = 1.427
Reducing the variance brings the Cpl
and Cpu
to the point of adequacy, provided the
process can remain centered.
39. A process has upper and lower tolerance limits of 5.80 and 5.00, respectively. If the
customer requires a demonstrated Cp of 2.0, what must the standard deviation be? If both
Cpu and Cpl must also be 2.0, determine the process mean, using that calculated standard
deviation, assuming a normal distribution of output.
Answer
39. Cp = UTL -LTL = 2.0 = 5.80 - 5.00 = 0.8 ; Therefore, = 0.0667
6 6 6
Cpu
= UTL - x = 5.80 - x = 2.0; Therefore, we get: x = 5.4
3 3
Cpl
= x - LTL = x - 5.00 = 2.0; Therefore, we get: x = 5.4
3 3

Design for Quality and Product Excellence 58
© 2011 Cengage Learning. All Rights Reserved. This edition is intended for use outside of the U.S. only, with content that may be different from
the U.S. Edition. May not be scanned, copied, duplicated, or posted to a publicly accessible website, in whole or in part.
40. Clearly demonstrate that Six Sigma requires Cp = 2.0 and Cpk = 1.5.
Answer
40.
As explained in Ch. 11:
The easiest way to understand this is to think of the distance from the target to the upper
or lower specification (half the tolerance), measured in terms of standard deviations of the
inherent variation, as the sigma level. A k-sigma quality level satisfies the equation:
k * process standard deviation = tolerance / 2
Note that in Figure 11.1, if the design specification limits were only 4 standard deviations
away from the target, the tails of the shifted distributions begin to exceed the
specification limits by a significant amount.
Table 11.1 shows the number of defects per million for different sigma quality levels and
different amounts of off-centering. Note that a quality level of 3.4 defects per million can
be achieved in several ways, for instance;
with 0.5-sigma off-centering and 5-sigma quality
with 1.0-sigma off-centering and 5.5-sigma quality
with 1.5-sigma off-centering and 6-sigma quality

Design for Quality and Product Excellence 59
© 2011 Cengage Learning. All Rights Reserved. This edition is intended for use outside of the U.S. only, with content that may be different from
the U.S. Edition. May not be scanned, copied, duplicated, or posted to a publicly accessible website, in whole or in part.
In many cases, controlling the process to the target is less expensive than reducing the
process variability. This table can help assess these trade-offs.
The sigma level can easily be calculated on an Excel spreadsheet using the formula:
=NORMSINV(1-Number of Defects/Number of Opportunities) + SHIFT
or equivalently,
=NORMSINV(1-dpmo/1,000,000) + SHIFT
SHIFT refers to the off-centering as used in Table 11.1. Using the airline example
discussed earlier, if we had 3 lost bags for 8000(1.6) = 12,800 opportunities, we would
find =NORMSINV(1-3/12800) + 1.5 = 4.99828 or about a 5-sigma level.
Using data from problem 40, above, we can show that
Cp = UTL -LTL = 2.0 = 5.80 - 5.00 = 0.8 ; Therefore, = 0.0667
6 6 6
Cpu
= UTL - x = 5.80 - x = 2.0; Therefore, we get: x = 5.4
3 3
Cpl
= x - LTL = x - 5.00 = 2.0; Therefore, we get: x = 5.4
3 3
This meets the requirement that:
k * process standard deviation = tolerance / 2
6 * .0667 = 5.80 - 5.00 = 0.400
2
With a mean shift of 1.5
Cmodified
= Cp / ] / )targetmean[(1 22 = 2.0 / ]0667. / )4667.54.5[(1 22 = 1.414
Because of the shift away from the target, capability is lower

Design for Quality and Product Excellence 60
© 2011 Cengage Learning. All Rights Reserved. This edition is intended for use outside of the U.S. only, with content that may be different from
the U.S. Edition. May not be scanned, copied, duplicated, or posted to a publicly accessible website, in whole or in part.
SUGGESTIONS FOR PROJECTS, ETC.
1. Customer attributes and technical requirements might be:
Attributes Technical Requirements
a. Book purchase:
Hours Schedule of open hours
Organization By dept./course/professor
Pre-processing availability Reservations on Internet
Ease of payment Cash, check, credit card
Time Speed of checkout
Value Lowest available price
Empathy Understanding/willingness of
personnel to solve problems
b. Registration:
Convenience Time, dates, Internet, phone
Speed Process standards
Costs Fees
Accuracy Error prevention
Empathy Understanding/willingness of
personnel to solve problems
c. Hotel room - business:
Convenience Business location , dates, methods
Speed - check in/out Process standards, system knowledge
Technology FAX, Internet connection
Amenities Restaurant, in-room work areas,
Internet connections, exercise facilities
Costs Fees - related to services
Accuracy Error prevention
d. Hotel room - family:
Convenience Location near recreation, moderate
dining facilities, dates, methods
Speed - check-in Process standards, system knowledge
Amenities Play, family-related facilities
Costs Fees - related to family budget
Accuracy Error prevention
CCoonnssttrruuccttiioonn ooff tthhee mmaattrriixx iiss lleefftt ttoo tthhee ssttuuddeenntt..

Design for Quality and Product Excellence 61
© 2011 Cengage Learning. All Rights Reserved. This edition is intended for use outside of the U.S. only, with content that may be different from
the U.S. Edition. May not be scanned, copied, duplicated, or posted to a publicly accessible website, in whole or in part.
2. Customer requirements would likely include freshness, taste, consistency, appearance of the
product; knowledge, attentiveness, friendliness of customer service personnel; speed and
accuracy of the cooks and order fillers; accuracy and friendliness of the counter personnel.
Technical requirements might be explored to determine what would be required to deliver
the product to in-house versus delivery customers. The former would require wait staff
training in customer service techniques, while the latter would require knowledgeable
drivers substituting (in some ways) for wait staff. Technology for deliver orders would
involve equipment to receive orders via FAX machines or over the Internet. Regarding
cooks and order fillers (common to both in-house and external product delivery), how much
of the assembly of the pizza should be done by hand (versus machine-made or machine
assisted)? This is merely suggestive of the types of questions concerning customer and
technical requirements that students should consider. Construction of the House of Quality
is left to the student.
3. For a glider the following customer attributes and technical requirements might be:
Attributes Technical Requirements
Ease of assembly "Design for assembly"; Simple instructions
Easy to fly "Launch" mechanism
Flight characteristics Wing, tail, body design
Durability Quality of wood
Value Price/durability ratio
4. The best way to prioritize the voice of the customer would be to have a focus group of
typical customers, such as craftspeople, "do-it-yourselfer's", hobbyists to provide input on
how they used the screwdriver and their priorities. Below is a possible configuration of the
matrix, with priorities for a ―serious‖ craftsperson. Such a person would look for quality and
functionality over price or ―extra‖ features, such as ratchets or interchangeable bits.

Design for Quality and Product Excellence 62
© 2011 Cengage Learning. All Rights Reserved. This edition is intended for use outside of the U.S. only, with content that may be different from
the U.S. Edition. May not be scanned, copied, duplicated, or posted to a publicly accessible website, in whole or in part.
HOUSE OF QUALITY MATRIX
FOR A SIMPLE SCREWDRIVER
Price
Interchg
Bits
Steel
Shaft
Rubber
Grip
Ratchet
Capabil.
Plastic
Handle
Easy to use
Does not rust
Durable
Comfortable
Versatile
Inexpensive
Priority 3 1 6 5 2 4
= Very strong relationship
= Strong relationship
= Weak relationship
5. Answers will vary, depending on the service processes chosen by the students. The case on
―applying QFD to a University Support System‖ might be used as a starting point to
determine what types of information to look for to complete this project.
6. This exercise will give students an appreciation of the challenges of designing and
calibrating measurement systems.
7. Answers will vary, depending on the individual websites and topics chosen by the students.
8. This exercise is designed to further students' awareness of the breadth of the "quality
movement" and help them confirm how and whether the theory of quality is being applied
in practical settings in business and industry. Measurement is commonly used in
manufacturing and services, but it varies widely in precision and accuracy concepts,
depending on the size of the firm and the industry.

Design for Quality and Product Excellence 63
© 2011 Cengage Learning. All Rights Reserved. This edition is intended for use outside of the U.S. only, with content that may be different from
the U.S. Edition. May not be scanned, copied, duplicated, or posted to a publicly accessible website, in whole or in part.
ANSWERS TO CASE QUESTIONS
Case - Applying Quality Function Deployment to a University Support Service
1. The answer to the question of whether students agree or disagree with the relative
importance rankings obtained from the study of the RRC at Tennessee Tech ultimately
depends on students’ opinions. However, a strong case might be made that the relative
importance score would depend on the situation. For small, rush, duplicating jobs, prompt
service would seem to be of greatest importance. For research jobs where specific
information has to be found, knowledge and courtesy of the employees would be highly
desirable, as well as accuracy, which might be a close second in importance. For the
inexperienced user, such as a freshman student, empathy and willingness to help would
possibly be ranked as the two highest criteria.
2. Concentrating on the top four characteristics, the following weighted scores can be
calculated:
Resources (personnel) 135
Customer handling 68
Information handling 87
Attitudes and morale 68
The three areas on which the analysts focused were document handling, training, and
layout. The above weighted scores would seem to lend little support to the need to deploy
a new document handling process (45 point score), nor to improve the layout (6 point
score), which have very little impact on customer quality criteria. Training may be
required, but the focus on document handling would seem to be unnecessary.
3. Given the high ranking of resources (personnel), it appears that more attention should be
paid to selection and retention issues. Information handling, in second place, also has a
major impact, with customer handling, and attitudes and morale tied for third place.
These categories could be improved by training and by process analysis to determine if
the best processes were being used. As a result, it could be predicted that morale and
customer satisfaction would likely increase.
Case - Black Elk Medical Center
1. The next steps would include gathering data using the checklist form that the committee
designed. The committee might also want to develop process flow charts, while waiting
for the fall data to be gathered and analyzed.

Design for Quality and Product Excellence 64
© 2011 Cengage Learning. All Rights Reserved. This edition is intended for use outside of the U.S. only, with content that may be different from
the U.S. Edition. May not be scanned, copied, duplicated, or posted to a publicly accessible website, in whole or in part.
2. The data from the checklist should be put into a format, perhaps in a spreadsheet, where it
could be analyzed. Analysis tools might include Pareto analysis and histograms.
Segmentation should also be used to find out the incidence of falls in likely locations.
3. Improved processes and systems should be developed based on analysis of the checklist
and process charting. The ―significant few‖ causes, based on the Pareto analysis, should
be addressed first, in order to achieve the greatest immediate impact. Analysis of the
process flow chart could reveal places where processes could be simplified, and might
also identify conditions that would contribute to patient falls, so they could be eliminated.
Bonus Materials
Case - Hydraulic Lift Company
1. The key to the calculation of an estimated process capability for this case is to calculate an
estimated standard deviation for each condition. Using the simplifying assumption that the
sample standard deviation is a good approximation of the population standard deviation will
allow us to make a reasonable estimate, even though for the cases of the small sample sizes
of 30 or 35 that assumption would be open to argument by statisticians.
We will concentrate on the calculation of Cp for only case (a) and (e), since it is obvious that
the capability became drastically worse during the experimental stages from (b) to (d).
Reading the data from the histograms, we can use the calculation of the sample standard
deviation with grouped data from the chapter. The frequency histogram for condition (a)
shows:

Design for Quality and Product Excellence 65
© 2011 Cengage Learning. All Rights Reserved. This edition is intended for use outside of the U.S. only, with content that may be different from
the U.S. Edition. May not be scanned, copied, duplicated, or posted to a publicly accessible website, in whole or in part.
mp,
Group x Frequency fx fx2
_________________________________________________
1 45 3 135 6075
2 50 6 300 15000
3 55 0 0 0
4 60 16 960 57600
5 65 4 260 16900
6 70 22 1540 107800
7 75 6 450 33750
8 80 23 1840 147200
9 85 5 425 36125
10 90 10 900 81000
11 95 0 0 0
12 100 5 500 50000
7310 551450
fx 7310
x = n = 100 = 73.1
s = [ / ( ) [( ( /fx n fx) n) / (n -1)]2 21 =
[ / ] [( ) / / ]551450 99 7310 100 992 = 13.138
cp = UTL LTL = 100 - 50 = 0.63; not acceptable
6 6(13.138)

Design for Quality and Product Excellence 66
© 2011 Cengage Learning. All Rights Reserved. This edition is intended for use outside of the U.S. only, with content that may be different from
the U.S. Edition. May not be scanned, copied, duplicated, or posted to a publicly accessible website, in whole or in part.
The frequency histogram for condition (e) shows:
mp,
Group x Frequency fx fx2
_______________________________________
1 60 2 120 7200
2 65 0 0 0
3 70 12 840 58800
4 75 7 525 39375
5 80 11 880 70400
6 85 3 255 21675
2620 197450
fx 2620
x = n = 35 = 74.857
s = [ / ( ) [( ( /fx n fx) n) / (n -1)]2 21 =
[ / ] [( / / ]197450 34 35 342620)2 = 6.241
cp = UTL LTL = 100 - 50 = 1.34; not outstanding, but much better
6 6 (6.241)
2. The process used here was obviously a systematic process of problem solving similar to the
one suggested in this chapter. The first step was a) to understand the "mess." A Pareto-like
approach found that 50% of the defective items were due to dimensional problems on one
diameter of the valve stem. Next, b) find facts on the process capability; c) specific
problems were identified: over adjustment by the operator, and lack of ability of the
machine to hold tolerances; d) ideas on machine adjustments and improvements were
generated; e) solutions were implemented, with the machine being adjusted and later
overhauled; f) as Deming said, "Do it over, again and again." [Step 7, added to the process,
is continuous improvement].
Case - Bloomfield Tool Co.
1. See spreadsheet 12blomrrcase.xls for details. Note that there are some rounding errors
below that make answers on the spreadsheet appear slightly different.
Calculations for the repeatability and reproducibility (R&R) study are as follows:

Design for Quality and Product Excellence 67
© 2011 Cengage Learning. All Rights Reserved. This edition is intended for use outside of the U.S. only, with content that may be different from
the U.S. Edition. May not be scanned, copied, duplicated, or posted to a publicly accessible website, in whole or in part.
x 1 = ( Mijk) /nr = 2.3378 / 30 = 0.0779
R 1 = ( Rij) / n = 0.1030/ 15 = 0.0069
Use this method to calculate values for operator 2
x 2 = 2.2974 / 30 = 0.0766; R 2 = 0.0945/ 15 = 0.0063
x D = max { x i} - min { x i} = 0.0779 - 0.0765 = 0.0014
R = ( R i ) / m = (0.0069 + 0.0063) / 2 = 0.0066
D4 = 3.267; UCLR = D4 R = (3.267) (0.0066) = 0.0215, all ranges below
K1 = 4.56 ; K
2 = 3.65 (from Table 11.2 in the text)
EV = K1 R = (4.56) (0.0066) = 0.0301
OV = (K x ) - (EV / nr) 2 D2 2 = [(3.65)(0.0013)] - [( 0.0301) / 30] 2 2 =
- 0.0000077
NOTE: According to the Measurement Systems Analysis Reference Manual published by
the Automotive Industry Action Group (AIAG), Troy MI, 1990, p. 44:
"... if a negative value is calculated under the square root sign, the [OV]
defaults to zero (0)."
RR = (EV) + (OV) 2 2 = (0.0301) + (0) 2 2 = 0.0301
Therefore, in this case, RR = EV
% Equipment variation (related to tolerance) = 100 (0.0301 / 0.05) = 60.2%
Operator variation (related to tolerance) = 0%
R & R variation (related to tolerance) = 60.2%
Concentrate on reducing equipment variation, not operator variation.

Design for Quality and Product Excellence 68
© 2011 Cengage Learning. All Rights Reserved. This edition is intended for use outside of the U.S. only, with content that may be different from
the U.S. Edition. May not be scanned, copied, duplicated, or posted to a publicly accessible website, in whole or in part.
Total Variation: TV= (RR) + (PV) 2 2 , where PV is Part Variation
PV = Rp K
3
Rp = Range of part averages for the entire sample: 0.1013 to 0.0516 = 0.0497
K3 = 1.45 from Table 11.5
PV = (0.0497) (1.45) = 0.0721
Thus TV = (RR) + (PV) 2 2 = (0.0301) + (0.0721) 2 2 = 0.0781
%OV = 0
%EV = % RR, related to TV = 100 (0.0301 / 0.0781) = 38.5
%PV, related to TV = 100 (0.0721 / 0.0781) = 92.3
NOTE: The sum of the above percentages will not add to 100.
Based on the "rules" for process capability given in the text, it can be assumed that the
equipment and the process need to be improved, since none of the percentages fall below
the 30% or 10% minimums. The operators are consistent in their measurements, so their
methods are not in question at this point.
Worn or faulty gauges should be discarded and the rest should be calibrated.
CCaassee -- TThhee PPIIVVOOTT IInniittiiaattiivvee –– PPaarrtt IIII
The MAIC Process
1. It appeared fairly difficult to find the true ―root causes‖ of the problem. This was
illustrated by the fact that manual strapping errors were not initially found to be a
significant problem. Also, it was necessary to prepare over 100 different graphical
analyses before patterns could begin to be found. It is likely that the ―tribal knowledge‖
that everyone believed to be true, had flaws which temporarily sidetracked the
investigation.
2. Data gathering and analysis should have been (and probably was) used to prove the
feasibility of each of the solutions selected for implementation. The most expensive
solution was, no doubt, the purchase of the strapping machine. Cost-benefit and/or return

Design for Quality and Product Excellence 69
© 2011 Cengage Learning. All Rights Reserved. This edition is intended for use outside of the U.S. only, with content that may be different from
the U.S. Edition. May not be scanned, copied, duplicated, or posted to a publicly accessible website, in whole or in part.
on investment analysis should be made. The customer charge for incorrect deposits was
also one that required analysis of error patterns and possibly a customer survey to
determine the impact of implementing the charge. Eliminating double keying should be
reasonably easy to test, since a pilot operation could be set up in parallel with the current
operations. The vacation scheduling policy change could be tested using both an
employee survey and a pilot test. The dollar loss corrective action should also be
subjected to cost-benefit analysis.
3. The two most difficult areas in which to ―hold the gains‖ would probably be in the
personnel areas. Thus the dollar loss corrective action would be difficult to administer
and could cost both supervisors and employees a great deal of discomfort and uncertainty.
Also, while not as uncomfortable, the vacation policy schedule change could be irritating
to employees and provide temptations for supervisors to make numerous exceptions.