Embed Size (px)
Citation preview
NASA/CR--2001-210353 R2000AE114
Design, Fabrication, and Testing of an
Auxiliary Cooling System for Jet Engines
Kevin Leamy and Jim Griffiths
GE Aircraft Engines, Cincinnati, Ohio
Paul Andersen, Fidel Joco, and Mark Laski
Honeywell, Inc., Torrance, California
Prepared under Contract NAS3-27395
National Aeronautics and
Space Administration
Glenn Research Center
January 2001
https://ntrs.nasa.gov/search.jsp?R=20010047293 2018-08-31T13:10:50+00:00Z

Available from
NASA Center for Aerospace Information7121 Standard Drive
Hanover, MD 21076
Price Code: A09
National Technical Information Service
5285 Port Royal Road
Springfield, VA 22100Price Code: A09
Available electronically at http://gltrs.grc.nasa.gov/GLTRS

Preface
In 1994, NASA began to investigate high-risk, high-payoff activities under the Advanced Concepts
program. This report details the technical efforts of the GE Aircraft Engines and AlliedSignal (now
Honeywell) team to design, fabricate, and test a jet engine auxiliary cooling system that expands the
use of ordinary jet fuel as a heat sink. This activity was funded by the NASA Lewis Research Center
(now NASA Glenn) under Contract NAS3-27395. Mr. Jeffrey Balser is the NASA Contracting
Officer Technical Representative.
This report has been prepared in Limited Rights and Industry versions: Data and information deemed
subject to Limited Exclusive Rights restrictions are omitted from the Industry Version.
111

1.0
2.0
3.0
Table of Contents
Summary ........................................................
Introduction .....................................................
Component Design and Fabrication .................................
3.1 Turbocooler System Design ....................................
3.1.1 Turbocooler System Description ..........................
3.1.2 Turbocooler System Design Criteria .......................
3.1.3 High Flow Turbocooler System Impact .....................
3.1.4 Turbocooler System Model Development ...................
3.1.5 Summary of the Integrated Turbocooler Cycle Study Results ...
3.1.5.1 Key Design Decisions for the Turbocooler Test Rig ...........
3.1.5.2 Nozzle Cooling Mode (NCM) ............................
3.1.5.3 Engine Cooling Mode ...................................
3.2 Air Cycle Machine Design .....................................
3.2.1 ACM Description ......................................
3.2.1.1 ACM Performance .....................................
3.2.1.2 Bearing Power Loss and Cooling ..........................
3.2.2 Thermal Analysis ......................................
3.2.2.1 Thermal Network Model ................................
3.2.2.2 Thermal Analysis Results ................................
3.2.3 Rotor Dynamics .......................................
3.2.3.1 Description of Structure .................................
3.2.3.2 Material Data .........................................
3.2.3.3 Analysis Methods ......................................
3.2.3.4 Analysis Results .......................................
3.2.4 Stress Analysis ........................................
3.2.4.1 Compressor Wheel .....................................
3.2.4.2 Turbine Wheel ........................................
3.2.5 ACM Design Modifications ..............................
3.2.5.1 Start-Related Modification ...............................
3.2.5.2 Compressor-Journal Bearing Airflow-Related Modification .....
Page
2
3
3
3
3
5
5
6
7
7
8
9
11
12
13
18
18
19
19
24
24
24
27
27
32
32
36
40
40
46
3.3
3.4
Table of Contents (Continued)
3.2.6 ACM Acceptance Test ..................................
3.2.6.1 Test Setup ............................................
3.2.6.2 ACM Modification-Related Setup .........................
3.2.6.3 Test Setup Instrumentation ...............................
3.2.6.4 Data Acquisition .......................................
3.2.6.5 Test Conditions ........................................
3.2.6.6 ACM Acceptance Test Results ............................
3.2.7 ACM Engine Cooling Mode Test .........................
3.2.7.1 Test Setup ............................................
3.2.7.2 Test Conditions ........................................
3.2.7.3 Test Results ...........................................
3.2.8 ACM Acceptance Test Performance Summary ...............
Fuel/Air Heat Exchanger ......................................
3.3.1 Heat Exchanger Trade Studies ............................
3.3.2 Design Description .....................................
3.3.3 Thermal Performance ..................................
3.3.3.1 Fluid Properties ........................................
3.3.3.2 Heat-Transfer and Pressure-Drop Analyses ..................
3.3.3.3 Design-Point Performance Prediction ......................
3.3.3.4 Effect of Coating on Heat Exchanger Performance ............
3.3.4 Structural Analysis .....................................
3.3.4.1 Start-Up Transient Structural Analysis ......................
3.3.4.2 Low-Cycle Fatigue Structural Analysis .....................
3.3.5 Manufacturing ........................................
3.3.5.1 Brazing Issues .........................................
3.3.6 Acceptance test .......................................
High-Temperature Fuel Injection System .........................
3.4.1 Design Description .....................................
3.4.1.1
3.4.1.2
3.4.1.3
3.4.1.4
Vaporization and Fuel System Pressure .....................
Suspended Fuel Particulates ..............................
Deposition ............................................
Thermal Stresses .......................................
Page
47
47
48
50
50
52
52
53
55
57
57
57
59
59
62
62
63
63
63
68
68
69
73
73
76
79
80
80
80
83
84
84
vi

Table of Contents (Concluded)
3.4.2 Fuel Nozzle Manufacturing ..............................
3.4.2. I Application of CBC to the Flow-Divider Valve ...............
Fuel Nozzle Acceptance Test .............................
Hot Fuel Connectors ...................................
4.0 Turbocooler System Rig Test .......................................
4.1 Test Setup and Procedures .....................................
4.1.1 Test Approach ........................................
4.1.2 Test Point Conditions and Operating Procedures .............
4.1.3 General Safety Considerations ............................
4.2 Turbocooler Performance and Test Results ........................
4.2.1 Turbocooler Performance ...............................
4.2.2 Combustor and Fuel Injector Performance ..................
4.3 ACEP Test Rig System Description .............................
4.3.1 Description of Key Components ..........................
4.3.1.1
4.3.1.2
4.3.1.3
4.3.1.4
4.3.1.5
F404 Full-Annular Combustor Rig .........................
ACM Start Bypass and Bearing Cooling Restoration ..........
Air Bleed Valves .......................................
Filters ...............................................
Connectors ...........................................
4.3.2 Test Instrumentation ....................................
4.3.3 Data Acquisition ......................................
Appendix A - Heat Exchanger Analysis ....................................
Temperature Distributions: Start-Up Transient Analysis .............
Transient Temperature Distributions: LCF Analysis .................
Stesses and Temperature Plots: LCF Analysis ......................
Acceptance Test Procedure ....................................
Appendix B - Instrumentation List ........................................
Appendix C - Phase I Performance Calculations .............................
Page
84
85
87
89
92
92
92
93
95
96
96
105
111
111
lll
111
117
117
120
120
124
126
126
130
134
146
156
162
vii
List of Illustrations
Figure Title Page
1. Turbocooler System Configured in a Nozzle-Cooling Mode (NCM) ..........
2. Turbocooler System Configured in a Engine-Cooling Mode (ECM) ..........
3. Exhaust Nozzle Cooling Circuit Flow Characteristic ......................
4. Turbocooler Predicted Performance at Sea Level Static, IRP ................
5. Turbocooler Predicted Performance at 30,000-ft, Mach 0.8, IRP .............
6. Turbocooler Predicted Performance in the Engine Cooling Mode at SLS/IRP ..
7. ACEP Air Cycle Machine Cross Section (Modified ACM Bearing Configuration)
8. ACM Cooling Flow Connections (Original ACM Bearing Configuration) .....
9. ACEP ACM, Exhaust Cooling Mode (Original ACM Bearing Configuration) ..
10. F-15 ECS ACM Compressor Performance ..............................
11. F-15 ECS ACM Turbine Performance .................................
12. F-15 ECS ACM Turbine Nozzle Calibration ............................
13. Thermal Network Model, ACEP Turbocooler ACM ......................
14. Steady-State Temperature Distribution (Degrees F), Sizing Point Mode .......
15. Steady-State Temperature Distribution (Degrees F), Altitude Flight Mode .....
16. Steady-State Temperature Distribution (Degrees F), Engine Cooling Mode
(E or F) ..........................................................
17. Temperature Gradient Histories of Compressor Hub in Radial Direction, Test
Condition - Initial Temperature = 125°F ...............................
18. Temperature Gradient Histories of Turbine Wheel Hub in Radial Direction,
Engine Cooling Mode - Initial Temperature = 125°F ......................
19. Temperature Histories of Gas Bearings During Soakback Shutoff at
Steady-State Operation, Sizing Point - Ambient =125°F ...................
20. Temperature Histories of Gas Beatings During Soakback Shutoff at
Steady-State Operation, Altitude Flight - Ambient = 125°F ................
21. Temperature Histories of Gas Bearings During Soakback Shutoff at
Steady-State Operation, Engine Cooling- Ambient = 125°F ................
22. Rotor Dynamic Model of ACEP ACM .................................
23. Undamped Natural Frequency ........................................
24. First Mode Shape (4,929 cpm) .......................................
25. Second Mode Shape (10,989 cpm) ....................................
4
4
7
10
10
11
12
14
14
15
16
17
20
21
22
23
25
25
26
26
26
28
28
29
29
viii
Figure
List of Illustrations (Continued)
Title Page
26. Third Mode Shape (104,840 cpm) .....................................
27. Bearing Reaction Load Versus Spin Speed ..............................
28. Amplitude Versus Spin Speed (e=0.0001-inch) ...........................
29. ACEP Compressor Wheel Linear Stress Analysis, Worst-Case Transient Thermal
30. ACEP Compressor Wheel Linear Stress Analysis, Steady-State Thermal ......
31. ACEP Compressor Goodman Diagram .................................
32. ACEP Compressor Residual Stress Caused by 102,000 RPM Overspeed ......
33. ACEP Compressor Three-Dimensional Solid-Element Finite-Element Model ..
34. ACEP Compressor Blade Stress Contour Plot at 74,460 RPM ...............
35. ACEP Turbine Wheel Linear Stress Analysis, Worst-Case Thermal ..........
36. ACEP Turbine Wheel Linear Stress Analysis, Steady-State Thermal .........
37. ACEP Turbine Goodman Diagram ....................................
38. ACEP Turbine Residual Stress Caused by 105,000 RPM Overspeed ..........
39. ACEP Turbine Three-Dimensional Shell Element Finite-Element Model:
Thickness Contour at 74,460 RPM ....................................
40. ACEP Turbine Blade Stress Contour Plot at 74,460 RPM ..................
41. Exhaust Cooling Mode Test Setup (Actual) .............................
42. Deflector Ring ....................................................
43. ACEP ACM Bearing Cooling Modification .............................
4.4. Compressor Labyrinth Seal Outlet Flow Tube Assembly Mounted on the
Compressor Journal Bearing Housing ..................................
45. ACEP ACM Exhaust Cooling Mode Test Setup Schematic .................
46. ACEP ACM Test Unit Parameters Instantaneously Displayed and Monitored...
47. Test Unit Instrumentation ...........................................
48. Engine Cooling Mode Test Setup .....................................
49. ACEP ACM Engine Cooling Mode Test (FM00856.ps) ....................
50. Calculated Heat Transfer Performance .................................
51. Fuel-Side Pressure Drop ............................................
52. Air-Side Pressure Drop .............................................
53. Fuel/Air Heat Exchanger Components .................................
30
30
31
33
34
35
35
37
37
38
39
41
41
42
42
43
44
45
47
49
50
51
55
56
64
65
66
69
ix
Figure
List of Illustrations (Continued)
Title Page
54. Finite-Element Model of Heat Exchanger ...............................
55. ACEP Fuel/Air Cooler Steady-State Boundary Conditions .................
56. ACEP Fuel/Air Cooler Equivalent-Stress Plot at Steady-State Conditions .....
57. Finite-Element Model ..............................................
58. Inconel 625 Material Properites .......................................
59. Cyclic Life Prediction (Manson-Halford Universal-Slope Method) ..........
60. Two-Step Braze Process ............................................
61. Failure of Heat Exchanger During Second Braze Step .....................
62. JP-5 Vapor Pressure as a Function of Temperature ........................
63. Fuel Density as a Function of Temperature ..............................
64. F404 Fuel Nozzle (Baseline) Flow Characteristic Versus Fuel Temperature ....
65. F404 Fuel Nozzle Flow Characteristic Over a Sea-Level Static Throttle Hook ..
66. F404 Fuel Nozzle Flow Charateristic over a 30,000-ft/Mach 0.9 Mach Throttle
Hook ............................................................
67. High-Temperature Fuel Nozzle Drawing ...............................
68. Modified Flow Divider Valve ........................................
69. Modified Flow Divider Valve: Additional Slot ...........................
70. Single-Cup Venturi Instrumented with Thermocouples ....................
71. Fuel-Side Fitting with C-Seal ........................................
72. Local Braze Joints Used on Fuel Injection System
(Diassembled Pigtail-to-Fuel-Nozzle Connector) .........................
73. Assembled Connector Used on the Fuel Injection System ..................
74. NASA ACEP Test Flow Chart ........................................
75. NASA ACEP Rig Test ACM Start-Up Transient .........................
76. F404 Full-Annular Combustor Rig: Reading 48, Test Point 200 .............
77. F404 Full-Annular Combustor Rig: Reading 54, Test Point 203
(Maximum Heat Sink Test Point) .....................................
78. F404 Full-Annular Combustor Rig: Reading 121, Test Point 202 ............
79. F404 Full-Annular Combustor Rig: Reading 131, Test Point 202 ............
80. Comparison of ACM Compressor Performance with Pretest Predictions .......
71
72
72
74
75
76
77
78
81
82
82
83
84
86
87
87
89
90
90
91
93
98
99
100
101
102
104

List of Illustrations (Concluded)
Figure Title Page
81. Comparison of ACM Turbine Performance with Pretest Predictions .......... 104
82. Heat Exchanger Air-Side Pressure Drop Performance Matches PretestPredictions ....................................................... 105
83. Fuel Side Pressure Drop ............................................ 106
84. Fuel-Side Surfaces of the Heat Exchangers .............................. 107
85. Combustor Temperature Profile With Hot- and Cold-Fuel Operation ......... 108
86. Combustor Liner Metal Temperatures With Hot and Cold Fuel .............. 109
87. Combustor Emissions With Hot and Cold Fuel ........................... 109
88. NOx Emissions for Hot and Cold Fuel as a Function of Combustor Discharge
Temperature ...................................................... 110
89. One-Way Analysis of Fuel Nozzle Flow VariancePre- and posttest fuel nozzle flow check
92.
93.
94.
95.
96.
97.
98.
99.
100.
101.
102.
103.
104.
105.
indicated that fuel nozzle performance did not deteriorate with hot fuel operation 110
GEAE Cell 19A ................................................... 114
Turbocooler Installation ............................................. 114
Turbocooler Skid Layout ............................................ 115
Fuel Manifold .................................................... 116
Combustor Discharge Bleed Port ...................................... 116
Test Rig and Closeup ............................................... 118
Turbocooler Bleed Air Control Valve .................................. 119
High-Temperature Fuel Filter Installed Downstream of the Fuel Heat Exchangers 119
Barrier Filter Used to Protect the ACM Air Bearings from Potential EntrainedDebris ........................................................... 120
Turbocooler Instrumentation ......................................... 121
Air Cycle Machine Rotor Speed Sensor ................................ 122
Heat Exchanger No. 2 Surface-Mounted Thermocouples ................... 123
Combustor Liner Thermocouples ..................................... 123
Combustor Exit Rotating Rake Assembly with Temperature and Emission Probes 124
xi

Table
List of Tables
Title Page
l°
2.
3.
4.
5.
6.
7.
8.
9.
10.
11.
12.
13.
14.
15.
16.
17.
18.
19.
20.
21.
22.
23.
24.
25.
ACEP ACM Predicted Performance ...................................
ACEP Bearing and Bearing Cooling Data ...............................
Rotor Material Data (MIL-HDBD--5, Except as Noted) ....................
Natural Frequencies ................................................
Dynamic Analysis of the ACEP ACM .................................
Nozzle-Cooling Mode Acceptance Test Data ............................
Engine Cooling Mode ACM Test Data .................................
Heat Exchanger Thermal Performance Requirements .....................
Preliminary Heat Exchanger Sizing ....................................
Normalized Heat Exchange Sizing ....................................
Qualitative Heat Exchanger Assessment ................................
Heat Exchanger Material and Weight Estimate ...........................
Heat Exchanger Thermal Performance Requirements .....................
JP-5 Fluid Properties at 1200 Psia ....................................
Inconel 625 Properties (Annealed), from MIL HDBK-5G ..................
Steady-State Condition Requirements ..................................
Margin of Safety for Steady-State Conditions ............................
Predicted Minimum Life for Transient Conditions (Includes Scatter Factor of 10)
Estimated Life Based on ANSYS Analysis (Includes Scatter Factor of 10) .....
Braze Assembly Components ........................................
Fuel Nozzle Acceptance Test Flow Rates (lbrn/hr) ........................
Planned Test Point Conditions ........................................
Summary of Key Turbocooler Test Points ..............................
Turbocooler Rig Control Parameters ...................................
Turbocooler Rig Alarm and Trip Parameters ............................
13
18
27
27
31
54
58
59
60
61
61
62
63
67
70
71
71
72
73
76
88
94
103
125
125
xii

Acronyms and Abbreviations
ACEP
ACM
CBC
CDP
ECM
ECS
HPT
HX
IRP
NCM
SCF
SLS
Tc
Active cooling for enhanced performance
Air cycle machine
Coke-barrier coating
Compressor-discharge pressure (or plane)
Engine-cooling mode
Environmental control system
High-pressure turbine
Heat exchanger
Intermediate-rated power
Nozzle-cooling mode
Specific fuel consumption (lbm/hr/lbf)
Sea-level static
Critical temperature
xiii


1.0 Summary
The ability to provide engine cooling air at temperatures well below conventional levels offers the
opportunity to enhance aircraft and engine performance. Aircraft survivability can be improved by
using the subcooled cooling air to reduce exhaust nozzle surface temperatures. Improved hot-section
cooling offers the potential to increase engine specific thrust, enhance component life, mitigate
combustor emissions, and reduce the need for advanced materials.
A turbocooler was designed, fabricated, and tested to provide cooled cooling air in either the exhaust
nozzle or engine hot-section cooling modes. The turbocooler produces cooled cooling air by com-
pressing main engine bleed air in an air cycle machine (ACM), cooling the ACM compressor
discharge air in a fuel/air heat exchanger, and then further cooling the air as it expands across the
ACM turbine. After functioning as coolant, the hot fuel is burned in the main engine combustor.
Coke-barrier coating is used in the fuel system to allow the coolant-fuel to be heated beyond
conventional temperatures in order to increase the useable heat-sink capacity of ordinary jet fuel.
The turbocooler system performance was successfully demonstrated in an integrated rig test and a
separate ACM component test. The integrated rig test produced exhaust nozzle cooling air from
200" to-7°E The fuel injection and combustion system provided stable operation with conventional
liquid fuel and with high-temperature fuel up to 732°F -- a maximum heat sink capacity of 360
Btu/s. There was no observed change in combustor dynamics or exit temperature profile and no
evidence of flashback or autoignition due to hot fuel. Unburned hydrocarbons and carbon monoxide
emissions were reduced 50% with hot fuel. The heat exchanger and fuel nozzles operated as
predicted and were visually clean after the test.
The engine-cooling mode (ECM) configuration was successfully demonstrated during the ACM
component test. The ECM test produced subcooled engine hot-section-cooling air at 524°F at
simulated takeoff conditions. -- approximately 400°F below conventional levels. In addition, the
modified ACM air bearing thermal-protection configuration was successfully validated.

2.0 Introduction
The ability to provide engine cooling air at temperatures well below conventional cooling air sources
offers opportunities to enhance aircraft and engine performance in a variety of ways. Cooling air,
at temperatures well below fan discharge, can be used more effectively for engine exhaust nozzle
system cooling to improve survivability. Improved engine hot-section cooling (a) permits higher
core gas temperatures to increase engine specific thrust (at constant material temperatures), (b)
enhances component life due to improved cooling, (c) reduces the need for advanced materials, and
(d) improves combustor emissions by incorporating prevaporized fuel and/or reducing liner cooling/
dilution air. The key to improvements in these areas is enabling a significant increase in available
heat sink capacity to produce sufficient quantities of cold air at the right pressures. The increased
heat-sink capability with conventional jet fuels, typically limited to 300°E is enabled by GE devel-
opment of coke-barrier coating (CBC). CBC eliminates the deleterious effects of coke buildup andreduces gum adhesion in fuel systems.
The objective of this research program was to design, fabricate, and rig test an engine auxiliary
cooling system that uses standard jet fuel as the primary heat sink. The first task defined the auxiliary
cooling system (or turbocooler) and component requirements. A turbocooler consists of three
primary., components: (1) a high-temperature air cycle machine (ACM) driven by engine compressor
discharge air, (2) a fuel/air heat exchanger that transfer energy from the hot air to the fuel, and (3)
a high-temperature fuel injection system. The turbocooler cycle was integrated with an F404 engine
cycle and designed for dual-mode capability. Dual-mode capability refers to the ability of the
turbocooler component to operate in a nozzle-cooling mode (NCM) configuration or an engine
cooling mode (ECM) configuration. The second task of the program completed the detailed design
and fabrication of the turbocooler hardware. Integration and rig testing of the turbocooler system
configured in the NCM, with the F404 full-annular combustor, was completed during task 3.
The full-scale integrated rig test demonstrated the ability of the turbocooler to generate pressurized,
cooled cooling air; effectively transfer energy from the hot air to the jet fuel; and efficiently burn
the hot fuel in a full-annular combustor. This project increased technical credibility in four areas:
(1) high-temperature ACM, (2) direct fuel/air heat exchange (with CBC application in the heat
exchanger), (3) high-temperature fuel injection system, and (4) combustion of high-temperaturefuel in a full-annular combustor.
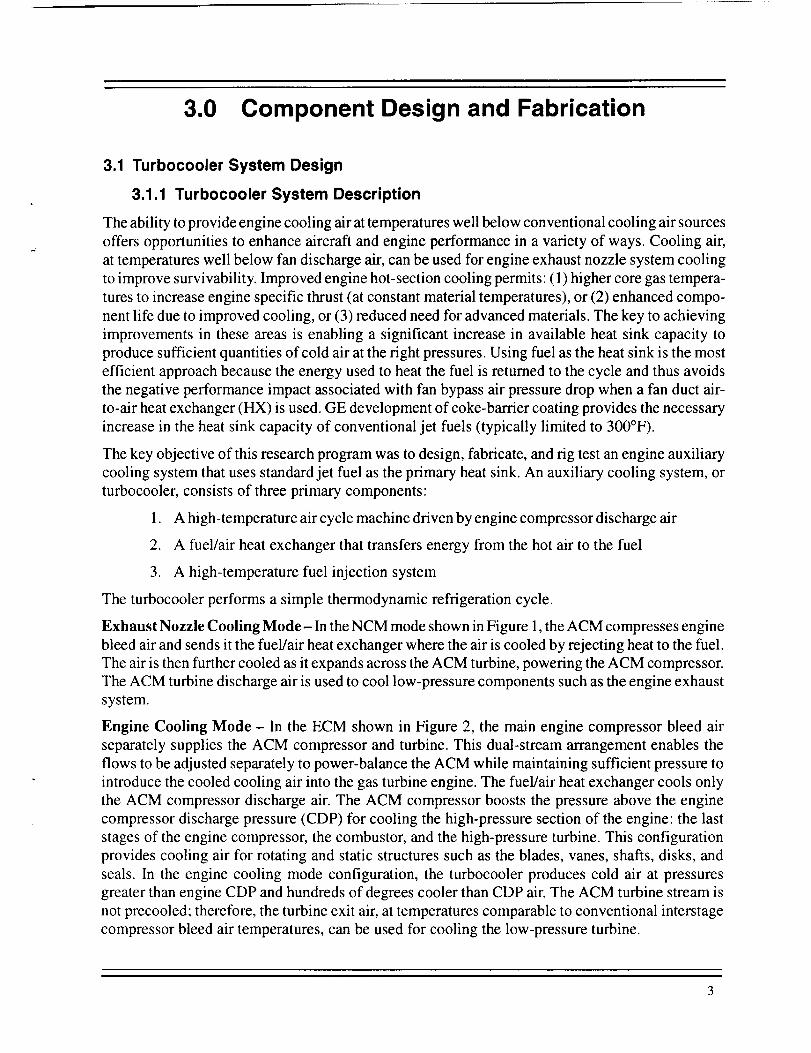
3.0 Component Design and Fabrication
3.1 Turbocooler System Design
3.1.1 Turbocooler System Description
The ability to provide engine cooling air at temperatures well below conventional cooling air sources
offers opportunities to enhance aircraft and engine performance in a variety of ways. Cooling air,
at temperatures well below fan discharge air, can be used for engine exhaust nozzle system cooling
to improve survivability. Improved engine hot-section cooling permits: (1) higher core gas tempera-
tures to increase engine specific thrust (at constant material temperatures), or (2) enhanced compo-
nent life due to improved cooling, or (3) reduced need for advanced materials. The key to achieving
improvements in these areas is enabling a significant increase in available heat sink capacity to
produce sufficient quantities of cold air at the right pressures. Using fuel as the heat sink is the most
efficient approach because the energy used to heat the fuel is returned to the cycle and thus avoids
the negative performance impact associated with fan bypass air pressure drop when a fan duct air-
to-air heat exchanger (HX) is used. GE development of coke-barrier coating provides the necessary
increase in the heat sink capacity of conventional jet fuels (typically limited to 300°F).
The key objective of this research program was to design, fabricate, and rig test an engine auxiliary
cooling system that uses standard jet fuel as the primary heat sink. An auxiliary cooling system, or
turbocooler, consists of three primary components:
1. A high-temperature air cycle machine driven by engine compressor discharge air
2. A fuel/air heat exchanger that transfers energy from the hot air to the fuel
3. A high-temperature fuel injection system
The turbocooler performs a simple thermodynamic refrigeration cycle.
Exhaust Nozzle Cooling Mode- In the NCM mode shown in Figure 1, the ACM compresses engine
bleed air and sends it the fuel/air heat exchanger where the air is cooled by rejecting heat to the fuel.
The air is then further cooled as it expands across the ACM turbine, powering the ACM compressor.
The ACM turbine discharge air is used to cool low-pressure components such as the engine exhaust
system.
Engine Cooling Mode - In the ECM shown in Figure 2, the main engine compressor bleed air
separately supplies the ACM compressor and turbine. This dual-stream arrangement enables the
flows to be adjusted separately to power-balance the ACM while maintaining sufficient pressure to
introduce the cooled cooling air into the gas turbine engine. The fuel/air heat exchanger cools only
the ACM compressor discharge air. The ACM compressor boosts the pressure above the engine
compressor discharge pressure (CDP) for cooling the high-pressure section of the engine: the last
stages of the engine compressor, the combustor, and the high-pressure turbine. This configuration
provides cooling air for rotating and static structures such as the blades, vanes, shafts, disks, and
seals. In the engine cooling mode configuration, the turbocooler produces cold air at pressures
greater than engine CDP and hundreds of degrees cooler than CDP air. The ACM turbine stream is
not precooled; therefore, the turbine exit air, at temperatures comparable to conventional interstage
compressor bleed air temperatures, can be used for cooling the low-pressure turbine.

Engine BleedAir
Air Cycle Machine
Cold,Low-Pressure
Air
Pressure RegulatingShutoff Valve
High-PressureHeat Exchanger Fuel Supply
Modified FuelNozzle and * Metered fuel
Manifold • Downstream ofF/O Cooler
Combustor
Figure 1. Turbocooler System Configured in a Nozzle-Cooling Mode (NCM)
Pressure RegulatingShutoff Valve
Engine BleedAir
• Ai Cy• r cle Machinet
s
i
e
. - "I:teat Exchanger
Cold,Low-Pressure Air
LPT or Nozzle
Combustor
High-PressureFuel Supply
Cool, High-PressureEngine Cooling Air
Modified FuelNozzle and
Manifold
Figure 2. Turbocooler System Configured in a Engine-Cooling Mode (ECM)

3.1.2 Turbocooler System Design Criteria
The turbocooler system technical requirements are established on the basis of the following criteria:
• The turbocooler system must be capable of dual-mode operation. Dual-mode
capability refers to the ability of the turbocooler components to operate in either
an NCM configuration or an ECM configuration. This primarily dictates the
air-side pressure drop through the heat exchanger.
• The ACM air bearing coolant supply is limited to 300°F (current production air
bearing limitations). This is accomplished by extracting heat exchanger
discharge air for bearing cooling and modulating turbocooler inlet pressure to
limit flow to levels consistent with the required coolant temperature.
• The cooled cooling air must be returned to the engine at acceptable pressure in
order to overcome any system air-side pressure losses and avoid icing conditions
at the ACM turbine discharge.
• Fuel temperature was initially limited to approximately 650°F in order to
minimize the changes to the F404 fuel system. However, early in the design phaseit was decided to use the full fuel heat sink in order to maximize the amount of
available cooling air. The maximum fuel temperature is driven beyond
supercritical (> 772°F). The implications of this "high flow" design decision arediscussed in Subsection 3.1.3.
• ACM power level is limited to 500 horsepower by the decision to employ an
existing ACM aerodynamic and journal bearing designs for the demonstration.
• The system is sized at the design point to use available engine bleed air pressure
(avoid pressure regulation) in order to minimize the ACM turbomachinery size
and provide the maximum possible pressure drop for the heat exchanger air-side
(typically the controlling factor in sizing the core) and for distribution of cooling
air to the nozzle and expansion in the turbine.
3.1.3 High Flow Turbocooler System Impact
Increasing the fuel heat sink to include supercritical fuel provides additional nozzle cooling air.
Exhaust nozzle heat transfer analysis indicated that increasing the turbocooler airflow rate would
have a more significant effect than decreasing the air temperature. A greater portion of the divergent
flap surface temperature was reduced below the target Tsbase of 300°E Therefore, it was decided
to significantly increase the turbocooler delivery airflow rate. The implications of increasing theairflow rate are:
• Maximum fuel temperature is increased beyond critical temperature ('re = 772°F)
and may approach 900 ° to 1000°E
• A larger air cycle machine is needed to accommodate the increased airflow (an
F-15 class ACM versus F-16 class).
• Increased ACM horsepower is needed.
• ACM bearing cooling temperature must be increased to control heat exchanger
growth.

• Larger fuel/air heat exchanger and structural complications are required due tothe high fuel system pressures.
• Higher system pressure losses are induced in the exhaust nozzle cooling circuit.
• The operating envelope is more restricted due to the increased fuel temperatureand the desire to maintain the basic F404 fuel nozzle features.
The high-flow turbocooler NCM configuration was ultimately tested on the F404 combustor rig.
3.1.4 Turbocooler System Model Development
Numerical representations of the turbocooler components were developed from existing componentlibraries and integrated into a steady-state, stand-alone, turbocooler model. The model featuresincluded:
• F-15 ACM performance maps, rotor dynamics, and recirculating air bearingcooling circuit and heat loads
• Heat exchanger performance characteristics and first-order transient lag
• High-temperature fuel system characteristics
• Exhaust nozzle cooling circuit pressure loss representation
• Engine bleed port losses and necessary pressure regulation
• Complete JP fuel thermodynamic properties
The model can be run in either exhaust nozzle or turbomachinery cooling mode. The turbocooler
power balance is established in the following manner (exhaust cooling mode):
1. Once the fuel temperature limit is set, turbocooler airflow is initially established
for a specific flight condition. Since the turbocooler uses fuel as the heat sink, the
fuel flow delivered to the engine can be used to cool only a specific amount of
air before the fuel temperature limit is reached. Turbocooler component
requirements are defined from the engine cycle/interface conditions, air- and
fuel-side pressure losses, and the design constraints previously noted.
2. The ACM turbine back pressure is defined by the exhaust nozzle cooling circuit.
The exhaust nozzle cooling circuit, developed under a complementary program,
is numerically represented by the flow curve presented in Figure 3. The exhaust
nozzle cooling circuit pressure loss is plotted against the inlet flow function.
3. The ACM turbine inlet temperature is limited to 300°F -- the maximum air
bearing cooling supply temperature. The air bearing cooling flow is approxi-
mately 5% of the turbine inlet air. Roughly 50% of the bearing cooling air is
restored at the ACM compressor inlet; the remaining portion is returned at the
ACM turbine. The first two items, along with ACM mechanical efficiency and
ACM turbine discharge temperature, set the power across the ACM turbine.
4. The heat exchanger air-side pressure drop must be acceptable for both exhaust
nozzle cooling and engine cooling mode. A detailed engine cooling circuit is not
being designed under the turbocooler program, but the cooling air must be

¢-_
tdtOO
.-I
tO
o
11
10
9
8
7
6
0.1
Low Flow
High Flow
0.2 0.3
,ow uoc,,oo_0.4
Figure 3. Exhaust Nozzle Cooling Circuit Flow Characteristic
returned to the engine at least 7.5% greater than the compressor discharge
pressure. This pressure level is consistent with previous engine cooling studies.
5. The ACM compressor discharge pressure is established from the turbine and heat
exchanger pressures. The compressor inlet conditions are set based on available
horsepower (across the turbine). An engine compressor discharge bleed valve is
incorporated to regulate the ACM supply pressure.
6. The engine power level angle (PLA) determines the engine fuel flow rate. At high
fuel flow rates, the fuel delivery pressure is raised to accommodate the increased
AP across the fuel nozzle due to the fuel density shift and to avoid two-phase flow
during low-power applications.
The stand-alone turbocooler model was integrated into the F4IM transient cycle model featuring:
• Combined engine and turbocooler power balancing across the flight envelope
• Existing ACM compressor and turbine maps
• Preliminary control algorithm to adjust engine bleed pressure
• ACM rotor dynamics and heat exchanger thermal lag
• Detailed modified F404 fuel nozzle characteristics
3.1.5 Summary of the Integrated Turbocooler Cycle Study Results
The combined F404 engine and turbocooler cycle model was run in the exhaust nozzle cooling mode
configuration over the flight points of interest. The model iterations were set to maximize the
turbocooler air delivered to the exhaust nozzle cooling system within the design constraints
previously described.
3.1.5.1 Key Design Decisions for the Turbocooler Test Rig
A number of key design decisions were made regarding turbocooler system test configuration.
7
1. The full fuel heat sink capacity was used. The resulting system changes include:
• Increasing the maximum fuel temperature beyond the fuel critical
temperature (772°F).
• Maximizing the amount of air available for exhaust nozzle cooling or engine
cooling modes. For exhaust cooling, this translated into an additional 50 ° to
200°F surface-temperature reduction.
• Increasing the air cycle machine from an F-16 class to an F-15 class (larger
flow, diameter, and horsepower).
• Enlarging the fuel/air heat exchanger.
2. The turbocooler heat exchanger was a conventional tube-and-shell design in
order to minimize manufacturing and schedule risks.
3. Fuel flowed over the tubes and air flowed through the tubes. This provides the
added benefit of being able to more readily verify the coating process and
enhance safety. Potential fuel leaks can be detected.
4. The turbocooler rig test employed a slow start-up transient to minimize thermaldifferentials.
5. The F-15 air cycle machine aerodynamic design was used without any trimming
or scaling. This minimized any ACM performance risk and schedule.
6. The modifications to the F404 fuel injectors was minimized to maintain
compatibility with the test rig and reduce technical and schedule risk.
7. A high-temperature barrier filter was incorporated downstream of the turbo-
cooler heat exchanger to protect the fuel nozzle flow divider valve.
8. The turbocooler test envelope was restricted due fuel nozzle operability limits.
Again the primary concerns was to avoid vaporization in the secondary circuit
and reduce the maximum fuel pressure required at high power.
3.1.5.2 Nozzle Cooling Mode (NCM)
Key aspects of the NCM configuration include:
• Cold air (5-6% of the main engine compressor flow rate) was supplied to the
exhaust nozzle at all flight conditions studied.
• Exhaust nozzle heat transfer analysis indicated that 1/3 of the divergent metal
surface temperatures were 300°F or more below baseline surface temperatures.
• At military power (maximum nonafterburning) steady-state fuel temperatures
approached 950°E
• Transient analyses indicate that sufficient control over fuel temperature and
manifold pressure was effected by the control system using fuel temperature and
pressure measurements to adjust the turbocooler air supply. However, due to the
increased fuel temperature (lower density), the available operating envelope wasmore restrictive with the modified F404 fuel nozzle.

• Nochangesweremadeto theF404controlsystemto optimize performance with
the turbocooler operating. The model did not account for any thrust benefit for
introducing the cooling air upstream of the exhaust nozzle throat. Consequently,
the cycle incurs a performance penalty (specific fuel consumption and thrust) due
to the increased engine bleed flow.
The turbocooler cycle performance prediction at sea level static (SLS)/military intermediate-rated
power (IRP) is presented in Figure 4 -- which illustrates component performance characteristics,
bleed air modulation, and ACM bearing cooling-flow distribution.
The effects of the amount of engine bleed air modulation (or pressure regulation) on the turbocooler
power balance were also evaluated. At SLS the engine bleed (Figure 4) air is modulated approxi-
mately 25% in order to limit ACM power to approximately 500 hp. Decreasing bleed air modulation
to 21.6% increases the available cooling air by about 6% but also raises the ACM power require-
ments to 576 hp -- exceeding the design limit.
The turbocooler cycle performance for a typical altitude condition (30,000-ft, Mach 0.9, IRP) is
presented in Figure 5. At altitude, ACM horsepower is not an issue. In this case, the quantity of
available cooling air to the exhaust nozzle is increased 29% by setting the bleed valve full open. Allof the fuel heat sink is used.
3.1.5.3 Engine Cooling Mode
The combined F404 engine and turbocooler cycle model was run in the ECM configuration over the
flight points of interest. The model iterations were set to maximize the turbocooler air delivered to
the engine hot-section cooling system but within the design constraints previously described. This
analysis was limited to aerothermal study only; no additional detailed heat transfer or mechanical
analyses were conducted.
Two approaches to engine hot-section cooling were explored. The first approach evaluated potential
life enhancements by reducing high-pressure turbine (HPT) blade metal temperature while holding
thrust constant. In this study the conventional turbine blade cooling air was replaced with subcooled
turbocooler air. This approach is the basis of the A ctive Cooling for Enhanced Performance (ACEP)
dual-mode design criteria. The results from the ECM (life enhancement) analysis indicate that a
250°F reduction in HPT blade metal temperature is achievable at comparable engine thrust levels,
with a 2.5% specific fuel consumption (SFC) penalty associated with the separate ACM turbine airstream.
The second approach was to push the engine power level (thrust) while maintaining a constant HPT
blade metal temperature. Again the HPT blade cooling air is replaced with the subcooled turbocooler
air. The results of this ECM study (throttle push) indicate:
• 6% to 8% takeoff thrust increase without major engine changes.
• 4% increase in SFC.
It should be noted that this was strictly an analytical aerothermal study. Evaluation of the throttle
push cases at constant HPT blade temperatures resulted in excessive engine shaft torque, reduced
stability margins, and higher temperatures downstream of the HPT. The key message from the
engine cooling mode study is that turbocooler air can be used to either significantly enhance engine
hot-section life or throttle-push the engine.
Air Cycle Machine
P81 (psia) = 231 XN (rpm) = 67712
T81 (°F) = 892 HP = 493 Pg4 (psia) = 59
w_(,_,1=570 ._ _ _ _ io_l:,3
2_ wi.b,sl=570I_j Po,/es,al=3Pc2 (psia) = 368/] i p/Tgl (F) = 300\T82 (F) = 1099 ' _ \
_----_"L___J",_... \ P_,(psia)=1071Throttle Valve 6 _ _ \ TF2!.. °F-) = 100 (Facility)
" PF2 (oP'_c.ia) = 1051 \ WF _lD/rlr) = 8064TF2 (F) = 903
F404-GE-400
Figure 4. Turbocooler Predicted Performance at Sea Level Static, IRP
Air Cycle Machine
P81 (psia) = 140.2 XN (rpm) = 67712
Tel (°F) = 854 HP = 493 P94 (psia) = 38.2
WB3 (Ib/s) = 3.39 ., ,_ T94 (°F) = 58.5
PIP = 1.57 /I I_ _ P/P =
= 0.79 __ r-_ j_l_ _,_ _ \ w (Ib/s) = 3.39
L.--f Pgl (psia)= 1
PS2 (opsia) = 221 _ t_ _r'/T91 (°F) = 300\T82 (F) = 1052 ' _ \
....... t _ _ " '_ TF2 (°F) = 100 (Facility)I nrome valve _ , , "_ _' W 'lb/hr' - 4435
PF2 (psia) = 714 \ F t ) -TF2 (°F) = 906
F404-GE-400
Figure 5. Turbocooler Predicted Performance at 30,000-ft, Mach 0.8, IRP
]0
P81 (psia) = 232Tel (°F) = 925WB3 (Ib/s) = 4,66XN (rpm) = 67270XNR (rpm) = 41160P/P = 1.63rl = 0.83WR (ItYm) = 29
P82 (psia) = 378TB2 (°F) = 1154 -
PF2 (psia) = 1012TF2 (°F) = 849Eft = 0.92NTU = 5.26Crnin/Cmax = 0.717
Throttle Valve
i HPt = 413P91 (psia) = 56.9T91 (°F) = 517
1 r_ P/P : 4.08
_/_ _ T_ q=0.804
r _. PFI (psla)- I03,_,__,..__[ CBC L TF2(°F)=250| HX J - W F (Ib/s) = 2.404 \
[ _ I I \ Psgs(psia) = 56.9P (psia) = 356.1 _ Tee (F) = 517
/ T (°F) = 319W (Ibis) = 4.43 _ ,_..,,...__
F404-GE-400
Figure 6. Turbocooler Predicted Performance in the Engine Cooling Mode at SLS/IRP
The turbocooler performance prediction in the engine cooling mode at SLS/IRP is presented in
Figure 6. For engine cooling, the bleed air is divided into two streams: one for the compressor and
the other for the turbine, The compressor discharge air is cooled by the fuel/air heat exchanger before
it is returned to the high-pressure section of the engine. The turbine air is used to power-balance the
turbocompressor and is returned to the engine cycle through the exhaust nozzle cooling circuit.
Figure 6 shows the impact of modulating both the compressor inlet air and the turbine inlet air in
order to maintain the ACM neat 500 hp. Note that the engine bleed air is modulated to limit the ACM
horsepower to less than 500-hp.
The next sections describe the detail design of the key turbocooler components.
3.2 Air Cycle Machine Design
The F-15 environmental control system (ECS) ACM aerodynamic design was suitable for use as
the ACEP air cycle machine due to similar airflow and performance requirements. This reduced the
technical risk associated with ACM development since the performance was well understood. Two
ACM's were manufactured for the ACEP program -- one fully instrumented with internal sensorsand the other without internal sensors.
During the course of the ACEP program, several ACM failures occurred at AlliedSignal and at
GEAE, These failures prompted two design modifications. The first enhanced start capability and
the second addressed compressor journal bearing cooling flow. Only the original compressor journal
bearing cooling flow configuration was tested at GEAE. The modified bearing cooling flow config-
uration was successfully tested at AlliedSignal in both cooling modes (nozzle and engine).
This section describes the detailed design analyses associated with the original bearing cooling
configuration and, later, the design modifications.
11

3.2.1 ACM Description
The ACEP ACM is a turbocompressor that functions as a cooling turbine in the ACEP turbocooler
system. In conjunction with an advanced air-to-fuel heat exchanger and a high-temperature fuel
system, this ACM supplies cold pressurized air for cooling exhaust nozzle or engine hot-section
components. The ACM will be integrated into the complete turbocooler assembly and tested withthe full-annular F404 combustor.
The single-stage ACEP ACM turbocompressor rotor is supported by air-cooled foil bearings in the
radial as well as the axial direction. The design consists of existing geometry (F-15 ECS ACM)
radial wheels such as a centrifugal compressor impeller and a radial inflow turbine. The compressor
relies on a vaned diffuser for dynamic pressure recovery and the turbine (a 50% reaction machine)
uses a drilled conical nozzle ring. The stationary diffuser and nozzle ring are designed to contain
wheel tri-hub bursts at overspeed conditions. A cross section of the machine is shown in Figure 7.
Limited Rights information has been omitted from this Industry-Version report.
Figure 7. ACEP Air Cycle Machine Cross Section (Modified ACM Bearing Configuration)
12
Limited Rights information has been omitted from this Industry-Version report.
3.2.1.1 ACM Performance
The ACEP ACM uses the F-15 ECS ACM aero design "as is" with the exception of reducing the
number of turbine blades from 20 to 18 to accommodate manufacturing difficulties associated with
machining the turbine wheel. Manufacturing difficulties arose due to the use of stronger, more
temperature-resistant material. It was anticipated that this change would have a negligible impact
on turbine performance, and that assumption was latter verified during the ACM acceptance test.
The F-15 performance characteristics satisfy the specified operating requirements very well, yield-
ing excellent efficiencies and an adequate compressor stall margin. Basic compressor and turbine
performance are shown in Figures 10, 11, and 12. The ACEP ACM specific performance operating
at the three exhaust cooling points, as well as the engine cooling mode point, is given in Table 1.
Table 1. ACEP ACM Predicted Performance
ParameterExhaust System Cooling
Sizing Point
Compressor Inlet Pressure (Plc) psia 215
Compressor Discharge Press (P2c) psia 355
Engine Bleed Air Temperature, °F 923
Compressor Inlet Temperature (Tic), °F 908
Compressor Discharge Temp (T2c), °F 1141
Engine Bleed Flow Required (We), Ib/min 329.8
338.4
Test Point E Test Point C
Engine Cooling
Test Point G
221 149 212
337 266 354
923 872 923
910 859
1122
237.8
1118
332.4
Compressor Inlet Flow (Wc), Ib/min 340.8 244.8
Compressor Efficiency (TIC) 0.786 0.752 0.808
Turbine Inlet Pressure (P1T), psia 333 316 249
Mech. Efficiency (_M)
902
1134
240.1
250.2
0.823
212
54Turbine Discharge Pressure (P2T), psia
Turbine Inlet Temperature (T1T), °F 377
Turbine Discharge Temperature (T2T), °F 81
Turbine Discharge Flow (WT), Ib/min 329.8
Turbine Efficiency (_T) 0.880
Turbine Power (PWT), hp 0518
0.979
Overall Efficiency (TICx tit x _M) 0.677
53.5 38.6 39.4
285 434 923
25 116 496
332.4 237.8 164.3
0.880 0.880 0.822
0456 410 377
0.979 0.975
Turbine Speed (N), rpm 70,950
0.648
67,580
0.693
74,460
Note: Test Point E is the ground demonstration point; C is an altitude (flight) point.
0.972
0.658
67,910
Table 1 shows the machine performance as affected by the internal cooling flow and the thrust
bearing cooling flow return to the compressor inlet. Also taken into account is the mechanical
efficiency associated with this air-beating machine design.
13

Limited Rights information has been omitted from this Industry-Version report.
Figure 8. ACM Cooling Flow Connections (Original ACM Bearing Configuration)
Limited Rights information has been omitted from this Industry-Version report.
Figure 9. ACEP ACM, Exhaust Cooling Mode (Original ACM Bearing Configuration)
]4

I--_3
O_(/)
Q_
h-
(/)ct)
EOo
Nomenclature
N = Compressor Rotational Speed, rpm
P5T = Compressor Inlet Air Total Pressure, in. Hg A
P6T = Compressor Outlet Air Total Pressure, in. Hg A
T5 = Compressor Inlet Air Temperature, °R
T6 = Compressor Outlet Air Temperature, °R
W C = Compressor Inlet Airflow Rate, Ib/min
e5 = T5/l'o(To = 519°F)
65 = PsT/P0 [P0 = 29.92 in Hg (Absolute)]
Tic = Compressor Adiabatic Efficiency, percent
r , , 0.283 "1100 Ts / -1/
83
14 18 22 26 30 34 38 42 46
Compressor Corrected Airflow Rate, _--su
Figure 10. F-15 ECS ACM Compressor Performance
50 54 58
60
50
40
30
-20
]5

100
9O
80
Nomenclatur_
N = Turbine Shaft Speed, rpm
P2T= Turbine Inlet Air Total Pressure, in. Hg A
P3T = Turbine Outlet Air Total Pressure, in. Hg A
T2 = Turbine Inlet Air Temperature, °R
T3 = Turbine Outlet Air Temperature, °R
T2-T 3
11,- T2(_--_._)x 100, percent I • _ 0.283 1Where Y = _P3T]
YWhere AT1= T2 (_---_-_)
Fv -- N --
3760_-T--_1
6
=-.
t-
O
==LU
._=
t--
7O
6O
5O
4O
30
2O
10
00 0.1 0.2 0.3 0.4 0.5 0.6 0.7
Turbine Factor, Fv
0.8 0.9 1.0 1.1 1.2
Figure 11. F-15 ECS ACM Turbine Performance
]6

Nomenclature
AE
FF = A---N
A E = Effective Nozzle Area, in 2 =
Where:
WT V/?";2
15.64 P2T
WT = Turbine Inlet Airflow, Ib per min
P2T = Turbine Inlet Air Total Pressure, in. Hg A
T2 = Turbine Inlet Air Temperature, °R
A N = Nominal Effective Area, in2 = 0.98 PC-
AN = 0.884 in2 for Test Unit
A G = Geometrical Nozzle Area, in2 = 0.902 :L-0.012 in2
P3T = Turbine Outlet Air Total Pressure, in. Hg A
N = Turbine Shaft Speed, rpm
T2e2 - 519
O3LL
oLL
(D
INO
Z
t'-
I--
u__
1.00
0.98
0.96
0.94
0.92
0.90
0.88
0.86
0.84
0.82
0.80
0.781
/I
i ii
t
I i
i
60,000 rpm
I
J9 10
I j
i II
Duct Diameters at Pressure
i Tap Locations:i P2 2.63-in ID
i P3 4.38-in ID
ii
l
4 5 6 7
Turbine Air Total Pressure Ratio, P2-r/P3T
Figure 12. F-15 ECS ACM Turbine Nozzle Calibration
17
II.
3.2.1.2 Bearing Power Loss and Cooling
Limited Rights information has been omitted from this Industry-Version report.
Table 2. ACEP Bearing and Bearing Cooling Data
Limited Rights information has been omitted from this Industry-Version report.
]8

3.2.2 Thermal Analysis
The thermal design of the ACM consists of the following features:
Cooling of the gas bearings- Cooling air is provided for the journal and thrust bearings to maintain
operating temperatures below safety limits dictated by the coating material of the bearing foil
(650°F).
Cooling of the rotor/shaft- Adequate air is provided for cooling the rotor/shaft in the area between
the hot wheel and the journal bearing. This will prevent bearing overheating during the soakback
on shutdown.
Thermal insulation between the manifold and the housing - A high-strength/low-conductivity
material (Mycalex) is applied between the hot manifold and the cold bearing housing to prevent the
bearing housing from being heated during operation and soakback on shutdown.
Heat shield between wheel and housing - A thermal blanket made of extremely low thermal
conductivity material (Min-K) is placed between the wheel and the housing to restrict heat energy
radiating from the hot wheel to the adjacent housing.
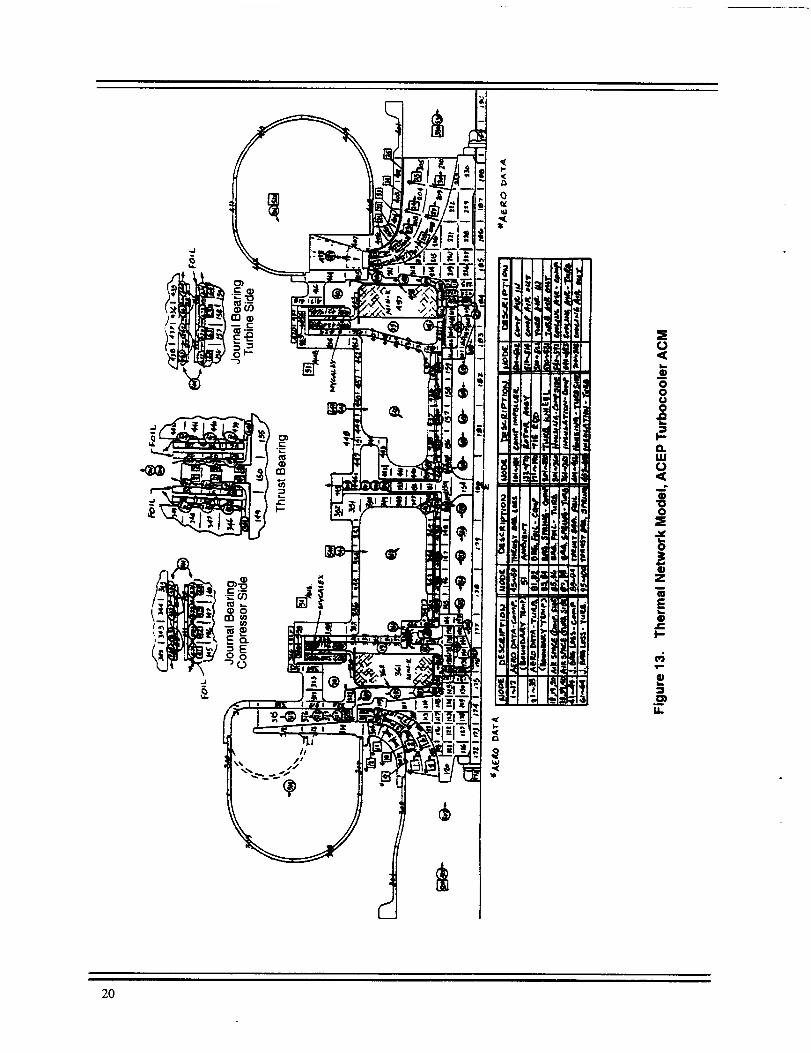
3.2.2.1 Thermal Network Model
Limited Rights information has been omitted from this Industry-Version report.
3.2.2.2 Thermal Analysis Results
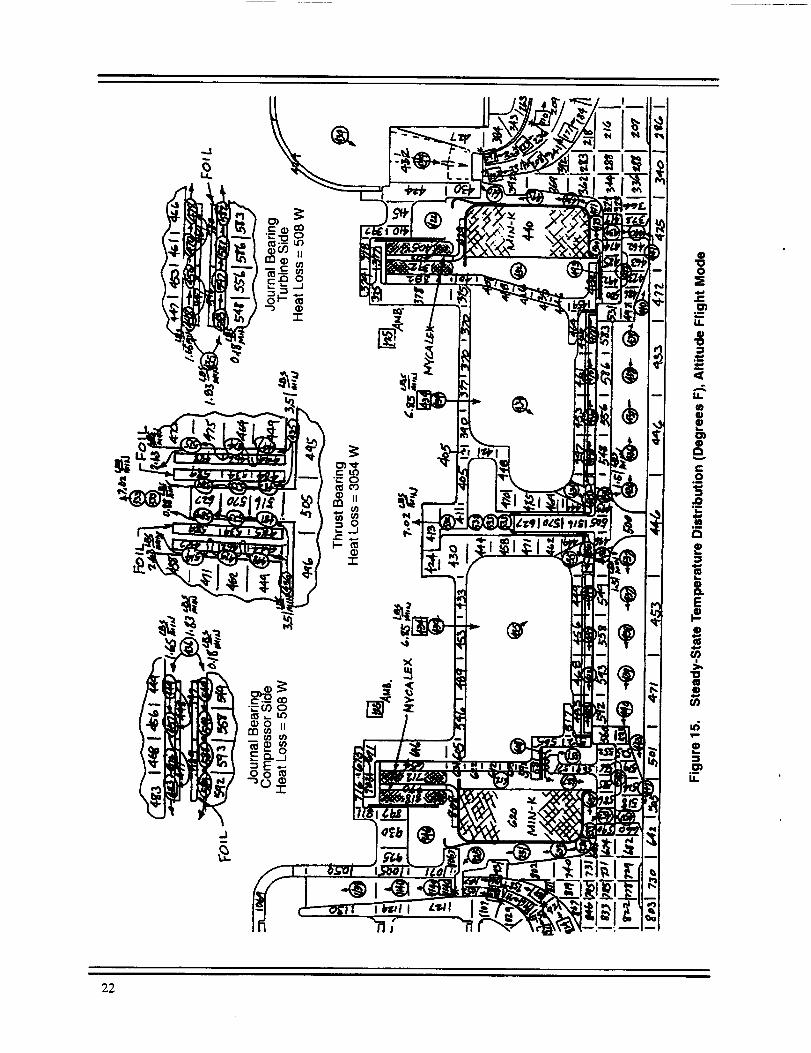
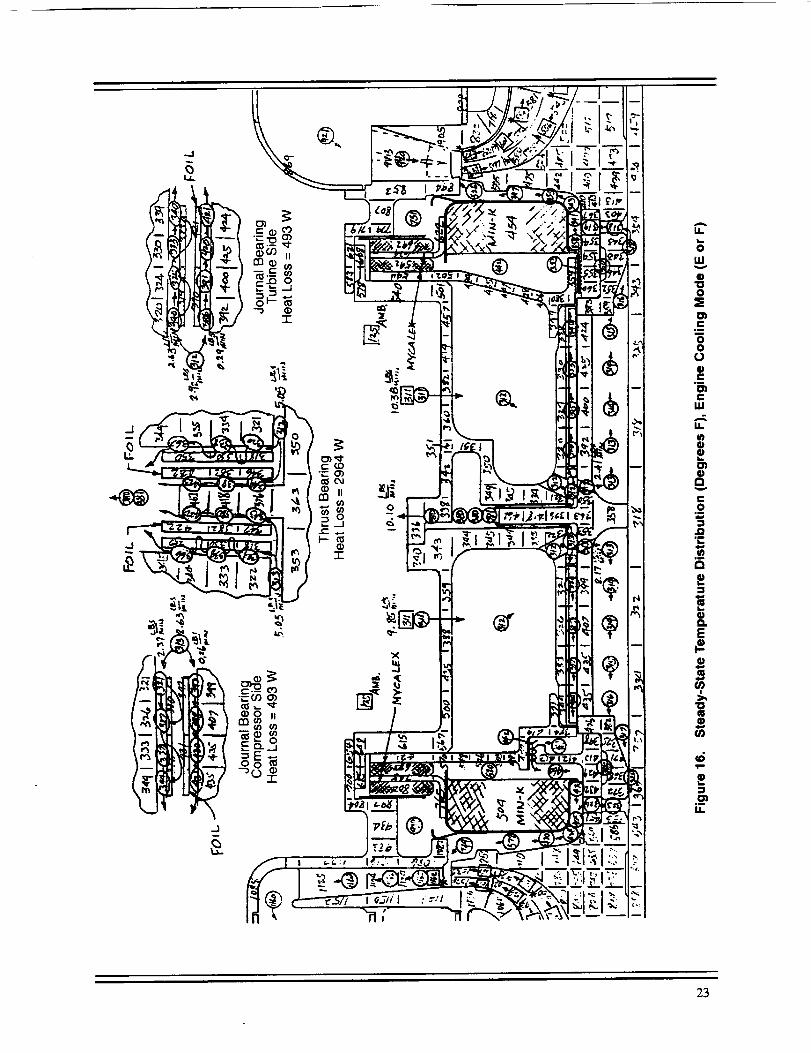
Steady-State Temperature Distributions of ACM- The steady-state temperature distributions of
three operation modes (sizing point, altitude flight, and engine cooling) are presented respectively
in Figures 14 through 16.
• The maximum temperatures of the manifold and the wheel occur in the sizing
point mode on the compressor side, while on the turbine side they occur in the
engine cooling mode. This is because the maximum gas temperatures of the
compressor and the turbine occur at these operating modes.
19
£
|
g
2O

I,I.
_3
l:
(/)
(/)
m
I,I.
21
22
:".='.' /
IDnE
O
_D
U.
23
• The maximum temperature of the bearing foil (538°F) occurs in the thrust
bearing (node 93) at altitude flight mode (test condition C, see Figure 15). This
occurs because, among the three operating modes, the cooling air for the altitude
flight has the lowest flow rate and the highest temperature.
• The Mycalex insulation between the manifold and the housing effectively
prevented the housing from being heated up. A maximum temperature difference
of 265°F occurs across the insulation on the compressor side (Figure 14) and
235°F on the turbine side (Figure 16).
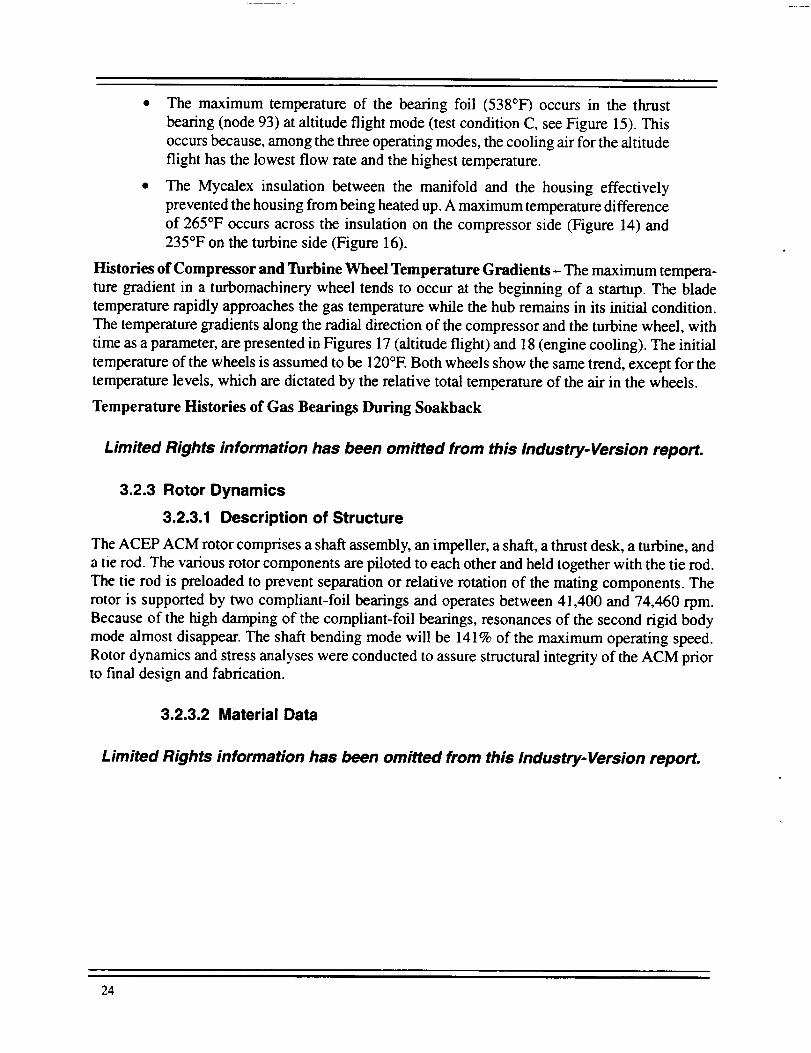
Histories of Compressor and Turbine Wheel Temperature Gradients- The maximum tempera-
ture gradient in a turbomachinery wheel tends to occur at the beginning of a startup. The blade
temperature rapidly approaches the gas temperature while the hub remains in its initial condition.
The temperature gradients along the radial direction of the compressor and the turbine wheel, with
time as a parameter, are presented in Figures 17 (altitude flight) and 18 (engine cooling). The initial
temperature of the wheels is assumed to be 120°E Both wheels show the same trend, except for the
temperature levels, which are dictated by the relative total temperature of the air in the wheels.
Temperature Histories of Gas Bearings During Soakback
Limited Rights information has been omitted from this Industry-Version report.
3.2.3 Rotor Dynamics
3.2.3.1 Description of Structure
The ACEP ACM rotor comprises a shaft assembly, an impeller, a shaft, a thrust desk, a turbine, and
a tie rod. The various rotor components are piloted to each other and held together with the tie rod.
The tie rod is preloaded to prevent separation or relative rotation of the mating components. The
rotor is supported by two compliant-foil bearings and operates between 41,400 and 74,460 rpm.
Because of the high damping of the compliant-foil bearings, resonances of the second rigid body
mode almost disappear. The shaft bending mode will be 141% of the maximum operating speed.
Rotor dynamics and stress analyses were conducted to assure structural integrity of the ACM prior
to final design and fabrication.
3.2.3.2 Material Data
Limited Rights information has been omitted from this Industry-Version report.
24
LLo
Q.
E
100
900
8OO
700
600
5OO
400
300
200
1000 0.5 1.0 1.5 2.0
Radial Distance, inch
2.5
Figure 17. Temperature Gradient Historiesof Compressor Hub in RadialDirection, Test Condition -Initial Temperature = 125°F
LLo
(9Q.E
600
500 --
400
300
200
100
0 Steady State E !
60 Seconds
x 20 Seconds
O 5 Seconds
, jE
I :
0 0.5 1.0 1.5 2.0
RadialDistance, inch
2.5
Figure 18. Temperature Gradient Historiesof Turbine Wheel Hub in Radial
Direction, Engine Cooling Mode- Initial Temperature -- 125°F
25

Figure 19. Temperature Histories of Gas Bearings During Soakback Shutoff atSteady-State Operation, Sizing Point- Ambient =125°F
Limited Rights information has been omitted from this Industry-Version report.
Figure 20. Temperature Histories of Gas Bearings During Soakback Shutoff atSteady-State Operation, Altitude Flight- Ambient -- 125°F
Figure 21. Temperature Histories of Gas Bearings During Soakback Shutoff atSteady-Stste Operation, Engine Cooling - Ambient = 125°F
26
Table 3. Rotor Material Data (MIL-HDBD-5, Except as Noted)
Limited Rights information has been omitted from this Industry-Version report.
3.2.3.3 Analysis Methods
Limited Rights information has been omitted from this Industry-Version report.
3.2.3.4 Analysis Results
Limited Rights information has been omitted from this Industry-Version report.
Table 4. Natural Frequencies
Limited Rights information has been omitted from this Industry-Version report.
27
Figure 22. Rotor Dynamic Model of ACEP ACM
Limited Rights information has been omitted from this Industry-Version report.
Figure 23. Undamped Natural Frequency
28

Figure24. FirstModeShape(4,929cpm)
Limited Rights information has been omitted from this Industry-Version report.
Figure 25. Second Mode Shape (10,989 cpm)
29

Figure26. ThirdModeShape(104,840cpm)
Limited Rights information has been omitted from this industry-Version report.
Figure 27. Bearing Reaction Load Versus Spin Speed
3O

Limited Rights information has been omitted from this Industry-Version report.
Figure 28. Amplitude Versus Spin Speed (e--0.0001-inch)
Table 5. Dynamic Analysis of the ACEP ACM
Limited Rights information has been omitted from this Industry-Version report.
3]

3.2.4 Stress Analysis
3.2.4.1 Compressor Wheel
The compressor wheel is machined from a 3.0-in long, 6.0-in diameter, low-carbon, PM (powder
metal) Astroloy pancake. HIP (hot isostatic pressing) is used to consolidate the powder. This process
results in a more homogeneous structure than that obtained by conventional forging and produces
more uniform metallurgical properties throughout the material. Mechanical properties are:
• Ultimate strength = 190 ksi (70°F), 174 ksi (lll0°F)
• Yield strength = 117 ksi (70°F), 106 ksi (lll0°F)
An ANSYS two-dimensional, finite-element model was constructed to evaluate the hub stress. The
hub was modeled with two-dimensional axisymmetric elements, and the blade was modeled by
two-dimensional plane stress elements with equivalent thickness input. The blade elements were
used to transfer blade centrifugal loading to the hub.
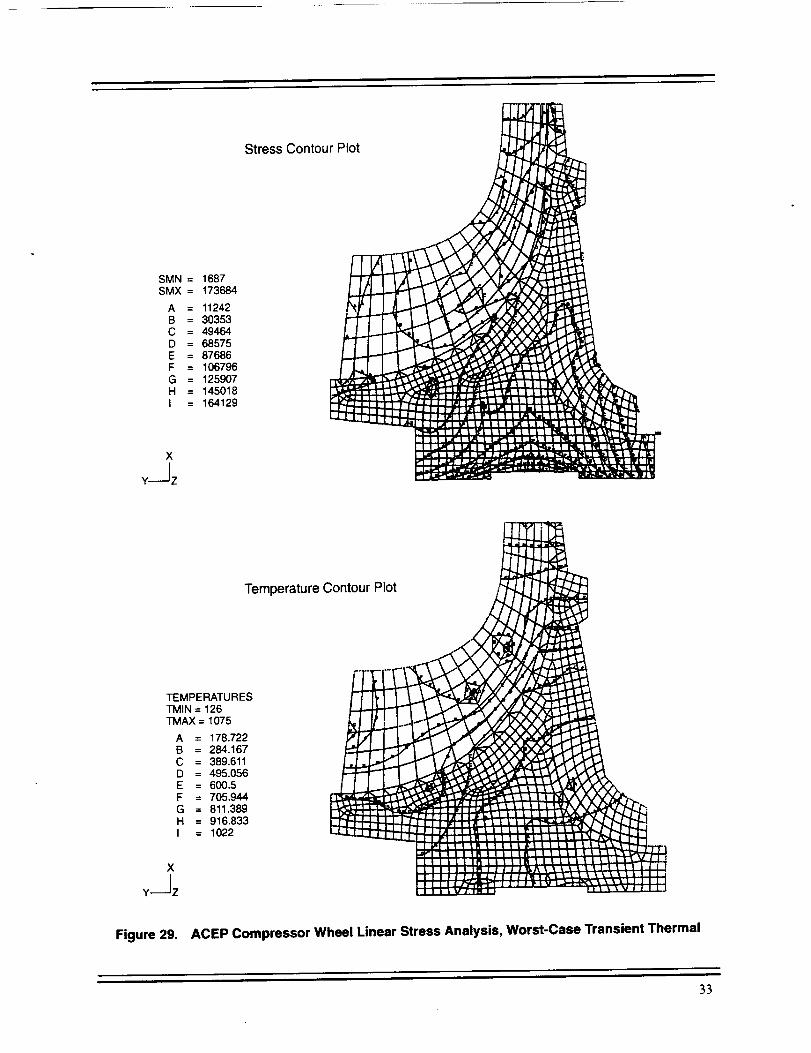
A linear finite-element analysis was first performed by applying maximum rotational speed (74,460
rpm) combined with worst-case transient or steady-state thermal loading. The maximum steady-
state temperature of the wheel is 1100°F at the blade exit area. The results of the linear analysis are
shown in Figures 29 and 30. In this analysis, linear material properties are used; the effect of the
wheel preassembly production overspeed spin (to 102,000 rpm to lock in compressive hoop stress
in the bore area) was not considered.
The maximum bore stress calculated by linear finite-element analysis is 174 ksi, as shown in Figure
29. The apparently high local stress is misleading in assessing the wheel margin of safety caused by
the large radial stress gradient in the hub. Experience indicates that wheel burst speed can be
evaluated by equating the average hub tangential stress to the average material ultimate strength. The
average hub tangential stress is an area-weighted tangential stress of the entire hub section or, inmathematical form:
_ es, A,
S avg .tan eA i
where si and A i are the element tangential stress and element area of the finite-element model,
respectively. The summation is taken over the entire hub. The average tangential hub stress was
calculated to be 69.1 ksi. By the same method, the cross-sectional average temperature correspond-
ing to the worst-case transient thermal loading was calculated to be 288°E At this temperature, the
material ultimate strength is 179 ksi. By applying this method, the estimated wheel burst speed iscalculated as follows:
Nburs t = 74460 × /179 _ 74460 X 1.61 = l19,840rpmV69.1
The burst speed is estimated to be 119,840 rpm, and the corresponding margin-of-safety burst is
+0.61 (61%).
The benefit of the production overspeed spin can be seen in Figure 31 (Goodman diagram). Without
production overspeed spin, the start/stop fatigue life is less than the required 10,000 cycles. With
production overspeed, the wheel fatigue life increased to approximately 110,000 cycles. The differ-
ence is due to the residual compressive hoop stress of 87 ksi in the bore area, as shown in Figure 32.
32
Stress Contour Plot
SMN = 1687SMX = 173684
A = 11242B = 30353C = 49464D = 68575E = 87686F = 106796G = 125907H = 145018I = 164129
Temperature Contour Plot
TEMPERATURESTMIN = 126TMAX = 1075
A = 178.722B = 284.167C = 389.611D = 495.056E = 600.5F = 705.944G = 811.389H = 916.833I = 1022
Figure 29. ACEP Compressor Wheel Linear Stress Analysis, Worst-Case Transient Thermal
33
StressContourPlot
SMN = 1767SMX = 137713
A = 9319B = 24425C = 39530D = 54635E = 69740F = 84845G = 99950H = 115056I = 130161
X
¥---Jz
.-
_" I I I I LPII
| | I
I IJ}'l I |
L_'_l-d,e"l I I I I,El I I I i l L?I
I t IJ II I LO*_b
Temperature Contour Plot
r_
TEMPERATURESTMIN = 572TMAX = 1110
A = 601.889B = 661.667C = 721.444D = 781.222E = 841F = 900.778G = 960.556H = 1020I = 1080
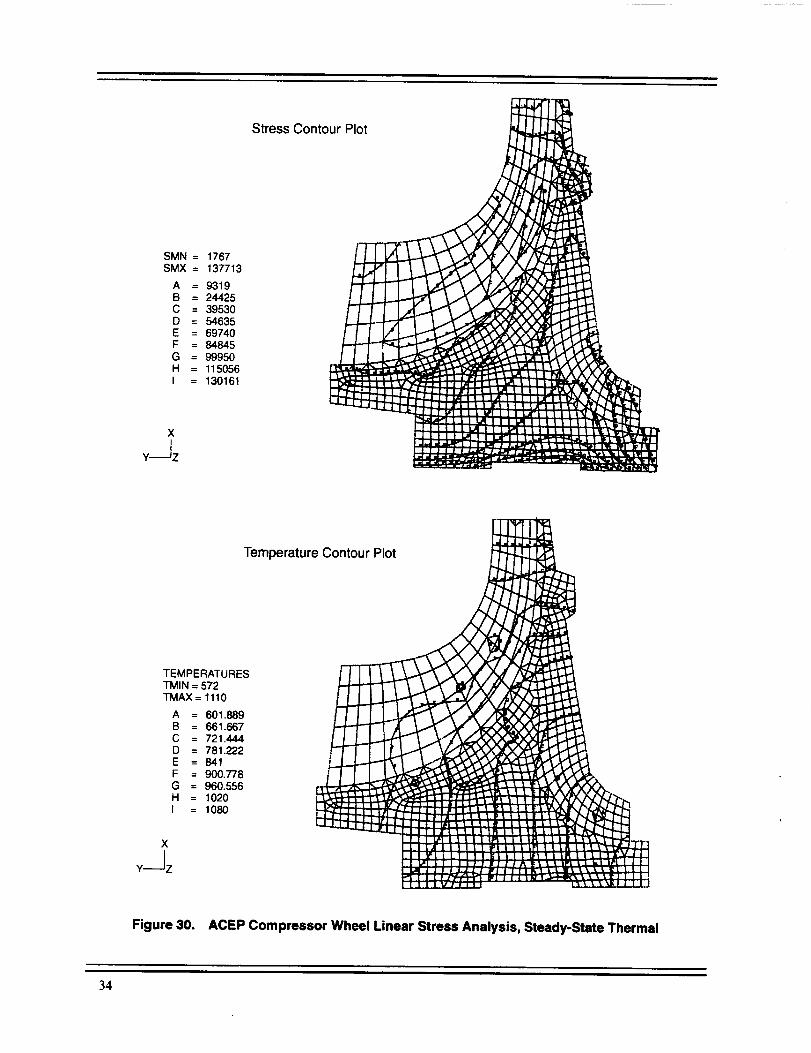
Figure 30. ACEP Compressor Wheel Linear Stress Analysis, Steady-State Thermal
34

120 I
--hal
t"
¢--
<--,cO
LL
6O
4O
, iiii' Without Production
Overspeed
II
I
I i
2O
00
i
2O 4O
Figure 31.
I
60 80 1 O0 120 140
Ultimate Tensile Strength, ksi
ACEP Compressor Goodman Diagram
160 180
ANSYS 5.1APR 22 199614:12:45
PLOT NO. 2NODAL SOLUTIONSTEP=2
SUB =4TIME=2
SZ (AVG)RSYS=0
DMX =0.002085SHN =-86694SMX =17761A =-80891B =-69285C =-57679D =-46073E =-34466F =-22860
G =-11254
H =352.136I =11958
Figure 32. ACEP Compressor Residual Stress Caused by 102,000 RPM Overspeed
35

The compressor blade stress analysis was performed by using a three-dimensional ANSYS solid-
finite-element model, as shown in Figure 33. The compressor wheel has 15 curved blades, equally
spaced in the hub. The solid-element model is a curved sector model containing one-fifteenth of the
wheel. The blade is located in the center of the sector, and symmetry boundary conditions were
applied to the two hub cut boundaries. The maximum calculated blade stress is 97 ksi (Figure 34),which is less than the calculated hub stress.
3.2.4.2 Turbine Wheel
The turbine wheel is machined from wrought Inconel alloy 718. The mechanical properties, as
specified by AMS 5662, are as follows:
• Ultimate strength = 180 ksi (70°F), 165 ksi (640°F)
• Yield strength = 150 ksi (70°F), 132 ksi (640°F)
An ANSYS two-dimensional, finite-element model was constructed to evaluate the hub stress. The
hub was modeled with two-dimensional axisymmetric elements, and the blade was modeled by
two-dimensional plane stress elements with equivalent thickness input. The blade elements were
used to transfer blade centrifugal loading to the hub.
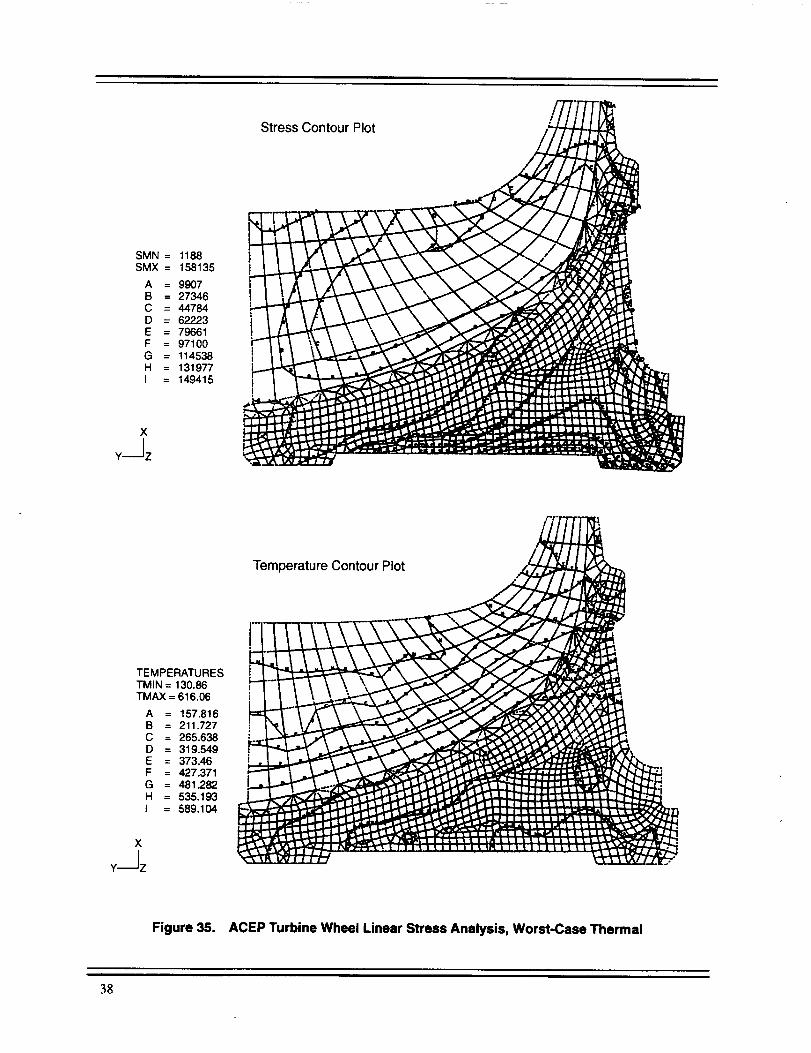
A linear finite-element analysis was first performed by applying the maximum rotational speed of
74,460 rpm combined with worst-case transient or steady-state thermal loading. The maximum
steady-state temperature of the wheel is 637°F at the blade inlet area. The results of the linear
analysis are shown in Figures 35 and 36. In this analysis, linear material properties are used; the
effect of the wheel preassembly production overspeed spin (to 105,000 rpm to lock in compressivehoop stress in the bore area) was not considered.
The maximum bore stress calculated by linear finite-element analysis is 158 ksi, as shown in Figure
35. The apparently high local stress is misleading in assessing the wheel margin of safety caused by
the large radial stress gradient in the hub. From experience, the wheel burst speed can be evaluated
by equating the average hub tangential stress to the average material ultimate strength. The average
hub tangential stress is an area-weighted tangential stress of the entire hub section:
_ esiA,SavgJan &_
where si and Ai are the element tangential stress and element area of the finite-element model,
respectively. The summation is taken over the entire hub. The average tangential hub stress was
calculated to be 64 ksi. By the same method, the cross-sectional average temperature corresponding
to the worst-case transient thermal loading was calculated to be 288°E At this temperature, the
material ultimate strength is 172 ksi. By applying this method, the estimated wheel burst speed iscalculated as follows:
Nb_ t = 74460 x V/-_ = 74460 x 1.64 = 122,110 rpm
The burst speed is estimated to be 122,110 rpm and the corresponding margin-of-safety burst is+0.64 (64%).
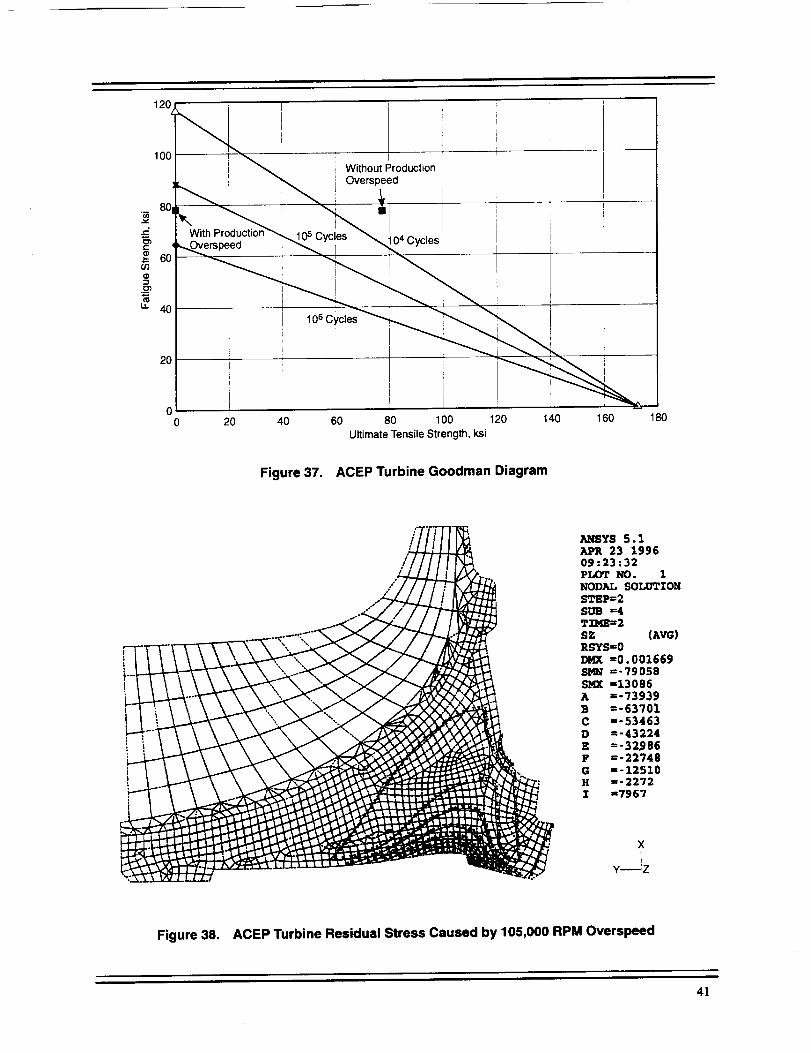
The benefit of the production overspeed spin can be seen in Figure 37 (Goodman diagram). Without
production overspeed spin, the start/stop fatigue life is less than the required 10,000 cycles. With
36
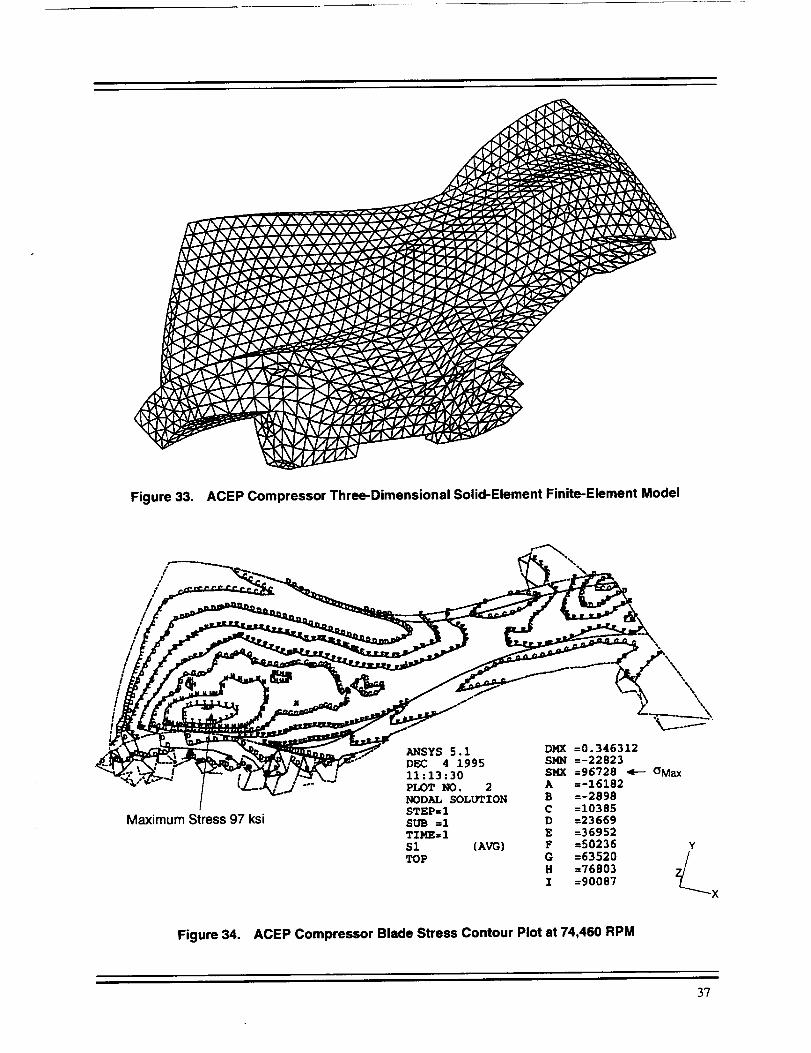
Figure 33. ACEP Compressor Three-Dimensional Solid-Element Finite-Element Model
r-- _'\,,
/__'_mCk_'--__ _'-t .... "_--.
j,
Max
NODAL SOLUTION B =-2898--10385STEP=I C
SUB =1 D =23669TIME=I E =36952
$1 (AVG) F =50236TOP G =63520
H =76803I =90087
Maximum Stress 97 ksi
Figure 34. ACEP Compressor Blade Stress Contour Plot at 74,460 RPM
37
SMN= 1188SMX= 158135
A = 9907B = 27346C = 44784D = 62223E = 79661F = 97100G = 114538H = 131977I = 149415
Stress Contour Plot o,_f.
"/I
I
..i.-e=
4.,4a
TEMPERATURESTMIN = 130.86TMAX = 616.06
A = 157.816B = 211.727C = 265.638D = 319.549E = 373.46F = 427.371G = 481 282H = 535.193I = 589.104
X
¥---Jz
Temperature Contour Plot
Figure 35. ACEP Turbine Wheel Linear Stress Analysis, Worst-Case Thermal
38
Stress Contour Plot
SMN = 6173SMX = 149840
A = 14155B = 30118C = 46081D = 62044E = 78007F = 93970G = 109933H = 125896I = 141859
Temperature Contour Plot
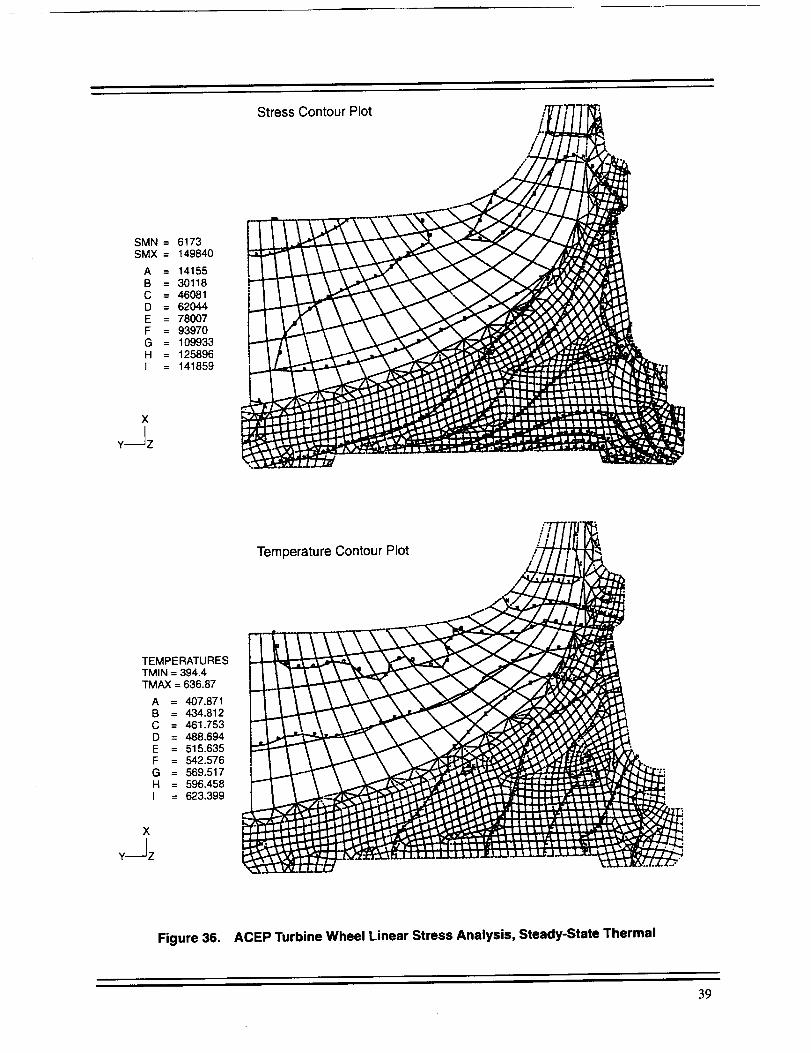
TEMPERATURESTMIN = 394.4TMAX = 636.87
A = 407.871B = 434.812C = 461.753D = 468.694E = 515.635F = 542.576G = 589.517H = 596.458I = 623.399
,Ei,,_.-i_r_ J.J.,U J JJJ.LU_,LIJ J.JJ
Figure 36. ACEP Turbine Wheel Linear Stress Analysis, Steady-State Thermal
39

production overspeed, the wheel fatigue life increased to about 400,000 cycles. The difference is
caused by the residual compressive hoop stress of 79 ksi in the bore area, as shown in Figure 38.
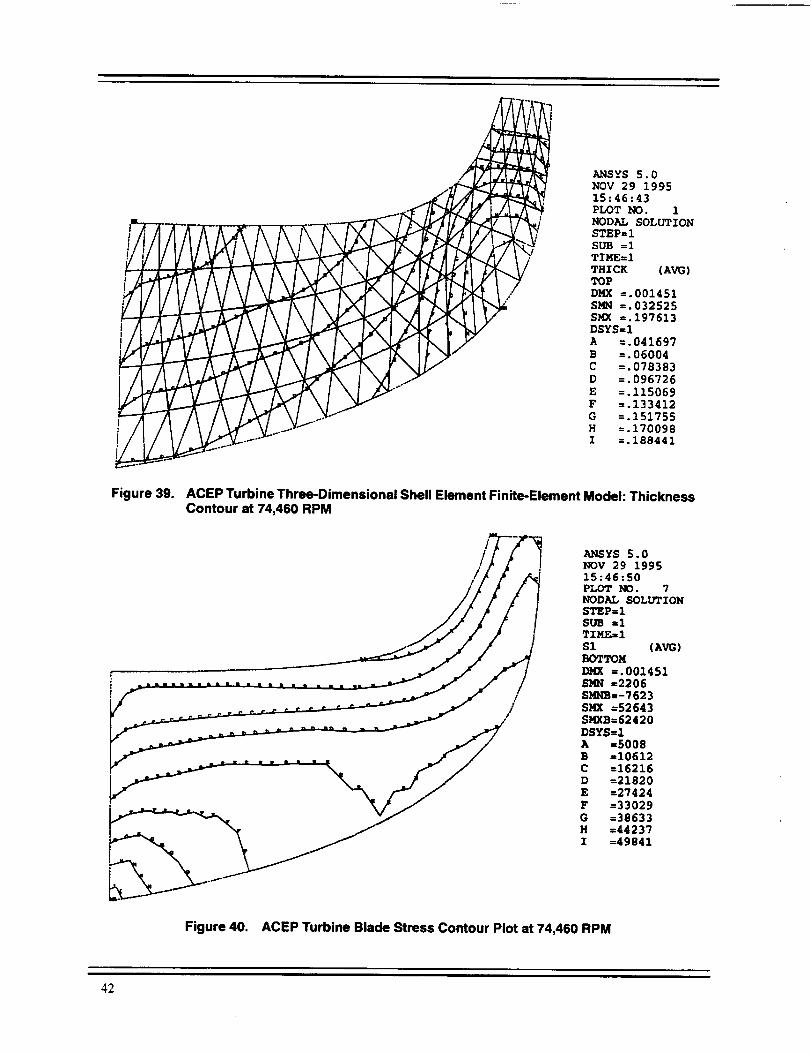
The turbine blade stress was analyzed by using a three-dimensional ANSYS shell-element model.
The blade shell model is shown in Figure 39, along with a shell elements thickness contour plot. The
blade is constrained in all directions at the hub, and loading is at the maximum operating speed of
74,460 rpm. The maximum calculated blade stress is 53 ksi at the blade root near the exit area (Figure40). This calculated maximum blade stress is less than the calculated hub stress.
3.2.5 ACM Design Modifications
The ACEP ACM underwent two phases of modification. It was first modified to improve the start
capability. The second modification relates to improving cooling air flow through the compressorjournal bearing.
3.2.5.1 Start-Related Modification
Limited Rights information has been omitted from this Industry-Version report.
40
.C
r-
u_
Lt.
120_ _
100I _ Without ProductionI _ Overspeed
with 105 Cycles
4O
20
20 40 60 80 1O0 120
Ultimate Tensile Strength, ksi
140 160 180
Figure 37. ACEP Turbine Goodman Diagram
ANSYS 5.1APR 23 199609:23:32PLOT NO. 1NODAL SOLUTIONSTEP=2SUB =4,TIME=2SZ (^VG)RSYS=0IX(. =0 • 001669SM_ =-79058SMX =13086A =-73939
B =-63701C =-53463D =-43224
E =-32.q86F ---22748G =-12510H =-2272
I =7967
Figure 38. ACEP Turbine Residual Stress Caused by 105,000 RPM Overspeed
4]
, I
ANSYS 5.0NOV 29 199515:46:43PLOT NO. 1
lm _ -_-'r--r--7_--_----_----x---."7_ NODAL SOLUTION
_/ STEP=I/VV SUB =1TIME=I
THICK (AVG)
DMX =.001451S)@_ ,=.032525
i SMX ,=.197613
DSYS=IA -.041697
B =. 06004C =.078383
D =.096726E =.115069F =.133412
G =.151755i/ H =.170098
I =.188441
Figure 39. ACEP Turbine Three-Dimensional Shell Element Finite-Element Model: Thickness
Contour at 74,460 RPM
/TP ,-,,,,,/f i 1 _v 29 i99s
/_ _ A_.l 15:46:50
//// / S_pR_==1SOLUTION
/./ ,, / f so. =1// / / I TI.S_l
C =16216
j D =21820/ E --27424
F =33029/ G =38633
H =44237I =49841
Figure 40. ACEP Turbine Blade Stress Contour Plot at 74,460 RPM
42

43
Limited Rights information has been omitted from this Industry-Version report.
Figure 42. Deflector Ring
44

Limited Rights information has been omitted from this Industry-Version report.
Figure 43. ACEP ACM Bearing Cooling Modification
45
3.2.5.2 Compressor-Journal Bearing Airflow-Related Modification
Limited Rights information has been omitted from this Industry-Version report.
46

Limited Rights information has been omitted from this Industry-Version report.
Compressor LabyrinthSeal Outlet Flow Tube
Assembly
Figure 44. Compressor Labyrinth Seal Outlet Flow TubeAssembly Mounted on the CompressorJournal Bearing Housing
3.2.6 ACM Acceptance Test
The ACM development tests included an acceptance test, the exhaust nozzle cooling-mode test, and
the engine cooling-mode test.
3.2.6.1 Test Setup
Two setups were used to facilitate the ACEP ACM tests, one for exhaust nozzle cooling mode and
acceptance tests and the other for engine cooling mode tests.
The exhaust nozzle cooling mode test requires a closed-loop setup where the hot compressor
discharge air is cooled as it passes through the heat exchangers and is further cooled as it expands
through the turbine wheel. This is similar to the boot-strap configuration used on conventional
environmental control systems.
47
The engine cooling mode test requires a two-line setup where the turbine inlet air comes from the
same source as the compressor inlet air. The turbine air is cooled as its expands through the turbine
wheel. The compressor discharge air, which was directed to the turbine inlet during the exhaust
cooling mode test, is now dumped overboard after a small amount is recovered for bearing cooling.
The test facility at AlliedSignal uses dryers to supply air containing less than ten grains of water per
pound of air. If the water is not removed, the effect of condensation at the turbine discharge must
be accounted for when assessing the ACM performance. Figure 41 is a photo of the test setup, and
it is shown schematically in Figure 45.
The ACM acceptance test setup used two heat exchangers (in series) capable of accommodating the
high airflow, pressure, and temperature. The two heat exchangers (commercial aircraft ECS precool-
ers) leaked during the leak test. However, the leak was small, and the heat exchangers were deemed
satisfactory for the development test. The test sequence was arranged to progress from low-power
(pressure) conditions to high-power conditions to minimize further damage to the heat exchangers.
Two ACM's were fabricated for the ACEP program. One unit was fully instrumented with internal
sensors to monitor bearing cooling and thrust load.
Safety precautions were implemented to alleviate hazards during the test. Specific parameters were
instantaneously displayed to provide real-time verification of unit condition (Figure 46). Specific
signals were incorporated to provide audible and visible warnings when the limits of selected
parameters were reached:
• Thrust bearing exit temperature > 500°F
• Compressor journal bearing exit temperature > 500°F
• Turbine journal bearing exit temperature > 500°F
• Turbine inlet temperature > 350°F (irrelevant during engine cooling mode test)
Compressor inlet temperature > 1000°F
3.2.6.2 ACM Modification-Related Setup
Start-Related Modification - A bypass line was added between the compressor inlet and the
turbine inlet to improve the start characteristics of the unit. The bypass line includes a 12-in long
flex line. A flex line was used to accommodate the thermal expansion of the unit during and after
operation. This bypass line also includes a checkvalve to check the high pressure/flow when the unit
is running. During the ACM acceptance test, as a convenience, the bypass line was connected at the
turbine supply line instead of the port added to the turbine torus. Figure 41 shows the unit with the
turbine inlet bypass port (plugged) and the bypass line in the test setup.
Compressor-Journal Bearing Airflow-Related Modification - A tube assembly was fabricated
and attached to the compressor bearing housing flange to direct the air from the compressor low-
pressure cavity to the compressor inlet return line. A gasket also was fabricated and used to prevent
air leaks between the compressor bearing housing and this tube assembly. A provision was made for
the tube assembly to accommodate an orifice plate in the flow restricter for airflow control, and a
tube assembly for the thrust bearing outlet airflow was fabricated only for testing at GEAE. This tube
assembly connects to the compressor tube assembly. It also has a provision to accommodate an
orifice plate in the flow restricter for airflow control (as required).
48

E
o
ex-rU.J
<>
I
o __
_I_
ill
_>,
8o
7
,!8
I
8
o.
0
o_
Ee-
U)
o
e-
o0
0
=_m
xI.I.I
I,I,I
U.
49
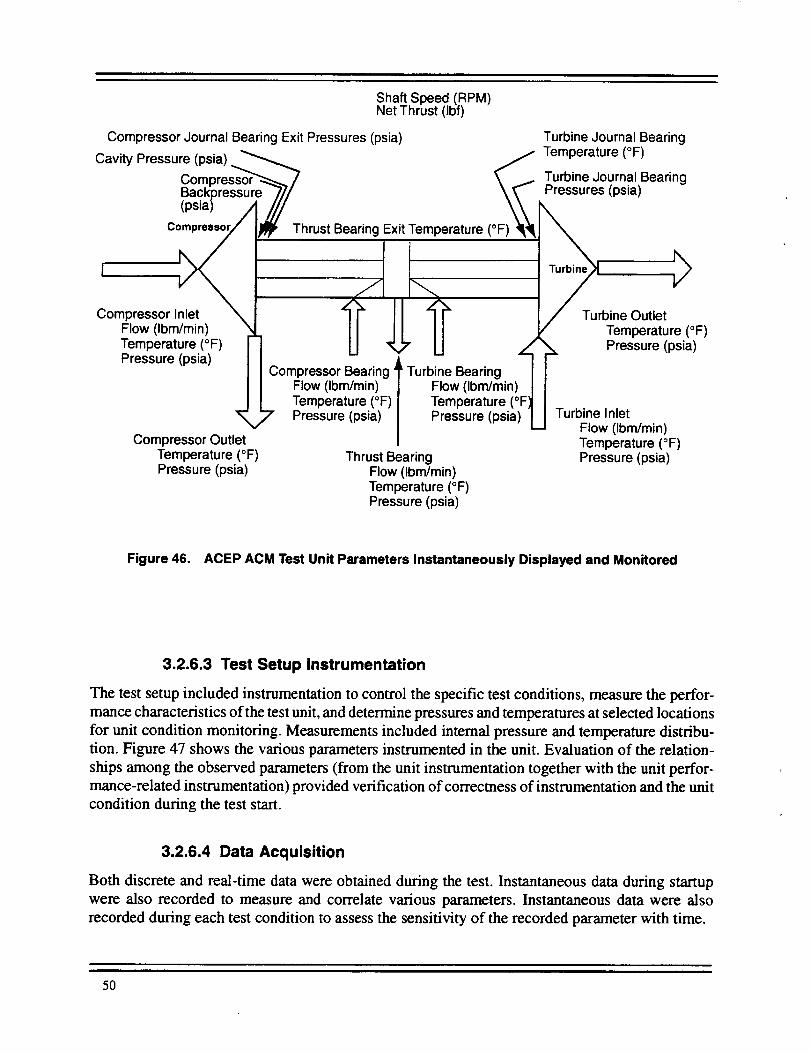
Shaft Speed (RPM)Net Thrust (Ibf)
Compressor Journal Bearing Exit Pressures (psia) Turbine Journal Bearing
Cavity Pressure (psia) _ / Temperature (°F)Compressor_"_r'_? \ _... Turbine Journal BearingBackpressure 7// \_"- Pressures (psia)
0sia,/1/// )
c hrust Bearing Exit Temperature (
,Compressor Inlet I / Turbine OutletFlow (Ibm/min) '" Temperature (°F)Temperature (°F) Pressure (psia)Pressure (psia)
Compressor Bearing 'I'Flow (Ibrrdmin) |Temperature (°F) JPressure (psia) /
Compressor Outlet /
Temperature (°F) Thrust BearingPressure (psia) Flow (Ibm/min)
Temperature (°F)Pressure (psia)
Turbine Bearing o_Flow (Ibm/min)Temperature (Pressure (psia) Turbine Inlet
Flow (Ibm/min)Temperature (°F)Pressure (psia)
Figure 46. ACEP ACM Test Unit Parameters Instantaneously Displayed and Monitored
3.2.6.3 Test Setup Instrumentation
The test setup included instrumentation to control the specific test conditions, measure the perfor-
mance characteristics of the test unit, and determine pressures and temperatures at selected locations
for unit condition monitoring. Measurements included internal pressure and temperature distribu-
tion. Figure 47 shows the various parameters instrumented in the unit. Evaluation of the relation-
ships among the observed parameters (from the unit instrumentation together with the unit perfor-
mance-related instrumentation) provided verification of correctness of instrumentation and the unit
condition during the test start.
3.2.6.4 Data Acquisition
Both discrete and real-time data were obtained during the test. Instantaneous data during startup
were also recorded to measure and correlate various parameters. Instantaneous data were also
recorded during each test condition to assess the sensitivity of the recorded parameter with time.
50

Pressure Sensor Location
P1 Back of Compressor Wheel by the Tip
P2 Back of Compressor Wheel by the Tip
P3 Back of Compressor Wheel by the Midsection,Between Tip and Hub
P4 Back of Compressor Wheel by the Midsection,Between Tip and Hub
P5 Back of Compressor Wheel by the Lower Section,Near Hub
P6 Back of Compressor Wheel by the Lower Section,Near Hub
P7 Back of Turbine Wheel by the Lower Section,Near Hub
Ps Back of Turbine Wheel by the Lower Section,Near Hub
P9 Back of Turbine Wheel by the Tip
Plo Back of Turbine Wheel by the Tip
Pll Back of Turbine Wheel by the Midsection,Between Tip and Hub
P12 Back of Turbine Wheel by the Midsection,Between Tip and Hub
Pls Compressor Journal Bearing Exit
P16 Compressor Labyrinth Low-Pressure Cavit_
P17 Turbine Joumal Bearing Exit
Pie Turbine Journal Bearing Exit
P21 Thrust Bearing Outlet Cavity
P22 Thrust Bearing Outlet Cavity
Temperature Sensor Location
T15 Compressor Journal Bearing Exit
T16 Compressor Labyrinth Low-Pressure Cavity
T17 Turbine Joumal Bearing Exit
Tls Turbine Journal Bearing Exit
T21 Thrust Bearing Outlet Cavity
T22 Thrust Bearing Outlet Cavity
Figure 47. Test Unit Instrumentation
5]

3.2.6.5 Test Conditions
The ACEP ACM exhaust nozzle cooling mode acceptance test was conducted to satisfy the F-15
acceptance test conditions and the ACEP exhaust cooling mode conditions. These test conditionsare as follows:
Test A - Verifies the operation and aerodynamic performance of the ACM (condition derived from
F-15 cooling turbine ATP performance test).
Test B - Simulates the structural integrity test of the F-15 cooling turbine (derived from the F-15
cooling turbine ATP integrity test, later deleted as part of ACM ATP).
Test C - Lower power ACEP ACM exhaust cooling mode condition.
Test D - Reduced Test E condition (intended for extrapolating ACEP ACM performance during
worst engine cooling mode condition, if the condition is not achieved).
Test E - most severe ACEP ACM exhaust cooling mode condition.
3.2.6.6 ACM Acceptance Test Results
A series of ACM acceptance tests were conducted as a result of component failures, design modifi-
cations, and physical reconfiguration of the test setup to support the exhaust cooling mode. Theacceptance test events are summarized as follows.
Baseline ACM Configuration - The instrumented ACM (serial number R1) was assembled and
installed in the exhaust nozzle cooling mode test assembly. The unit failed during start, due to high
start torque. An attempt to start the unit by gradually increasing the compressor inlet pressure
resulted in a start but under excessive thrust load that failed the thrust bearings and destroyed thethrust disk.
Modified Start ACM Configuration- The ACM design was modified to enhance start capability
by incorporating the turbine nozzle flow deflector, turbine inlet bypass, and housing interface
O-rings. The ACM R 1 unit was retested but failed due to instrumentation installation error. Tear-
down of the unit showed that the thrust bearing tip temperature sensor potting interfered with the
movement of the thrust beating, making the bearing rigid (no flexibility), thus causing the thrust
bearings to fail. The ACM R 1 unit was rebuilt without the thrust bearing tip temperature sensor. The
unit was retested at the F-15 ATP conditions, and the ACEP exhaust cooling mode test conditions
were completed.
The second ACM (R2, without internal instrumentation) was assembled, acceptance tested, and sent
to GEAE for installation into the turbocooler assembly. The ACM R2 unit failed during the turbo-
cooler rig test. A plugged thrust bearing outlet port blocked cooling flow; the thrust beatings failed
due to overheat, and the thrust disk was destroyed.
The instrumented ACM (R1) was sent to GEAE to continue the turbocooler test. When the bearing
cavity pressures were found inadequate to ensure sufficient journal cooling, an independent source
of bearing coolant (shop air) was added to the integrated turbocooler rig setup. However, at cavity
pressures sufficient to ensure positive flow over the compressor journal bearing, the thrust bearing
failed either due to a flow disruption (overtemperature) or an axial thrust imbalance. This failure
curtailed the integrated turbocooler rig test at GEAE before supercritical fuel temperatures could be
achieved (see Section 4).
52
Modified Compressor Journal Bearing Cooling Configuration - Only one ACM (R 1) was
modified to improve compressor journal-bearing cooling. The modified unit successfully completed
the acceptance test (F-15 performance test condition and low-power ACEP exhaust cooling mode
test condition) and was shipped to GEAE to be installed for a planned second turbocooler rig test
(funded by a complementary program). The objective of the second turbocooler rig test was to
complete the supercritical fuel test segment. Unfortunately, due to complications with the combustor
test rig, the second turbocooler rig test could not be conducted.
Exhaust Nozzle Cooling Mode ACM Test Data- ACM acceptance test data for the exhaust nozzle
cooling mode configuration test runs are summarized in Table 6. There were five primary test
conditions of interest: cases A, B, C, D, and E. Cases A and B are specific to the baseline F-15 ACM;
cases C through E are specific to the ACEP requirements. For comparative purposes, data from both
ACM units (R 1 and R2) are presented. In addition, data from both the ACM design modifications
(start and compressor labyrinth) are shown.
Case C closely approximates the target test conditions. Section 3.2.6.5 shows minor differences
between results with the original unit and the modified compressor labyrinth seal configuration,
implying that the high-power test condition (Test E) results with the ACM with original compressor
labyrinth configuration are applicable to the modified unit.
Due to facility limitations, test condition E could not be fully assessed. Therefore, based on the
recorded pressure distribution and the required compressor inlet pressure, test condition E was
extrapolated to estimate ACM performance at the high-power exhaust cooling mode condition.
Estimated ACM performance per test condition E closely approximates the target test results.
The ACEP ACM employs recirculation of the bearing parasitic flows. In the original compressor
bearing configuration, the recirculating system restored the thrust bearing coolant at the compressor
inlet, and journal components were restored respectively at the compressor diffuser and turbine rotor
inlets. This places a significant constraint on heat exchanger air-side pressure drop to ensure positive
flow over the compressor journal. The facility heat exchanger employed in the acceptance tests had
lower air-side resistance than the fuel/air units designed for the turbocooler rig tests. Analysis of the
acceptance tests with the original compressor bearing configuration indicated that pressure losses
well in excess of those for the tested unit were consistent with reliable bearing cooling. When the
bearing cavity pressures were found to be inadequate to assure journal cooling (ACM compressor
discharge air flowing over the journal) attempts to provide a cooling source independent of the
machine, but at cavity pressure sufficient to ensure positive flow over the compressor journal,
apparently resulted in a failed thrust bearing. Development of the low-pressure cavity between the
compressor wheel and the journal bearings significantly improved the bearing cooling robustness
and reduced sensitivity to the heat exchanger air-side pressure drop -- as demonstrated on the latter
acceptance tests and the engine cooling mode demonstration.
3.2.7 ACM Engine Cooling Mode Test
An objective of this program was to demonstrate that the turbocooler has dual-mode capability.
"Dual mode" means that the turbocooler can operate in either a nozzle cooling mode or an engine
cooling mode. The engine cooling mode operation is demonstrated by testing only the ACM in the
engine cooling mode configuration since the ACM is the component directly effected by the mode
change. The ACM tested in the engine cooling mode test included compressor labyrinth sealmodification.
53
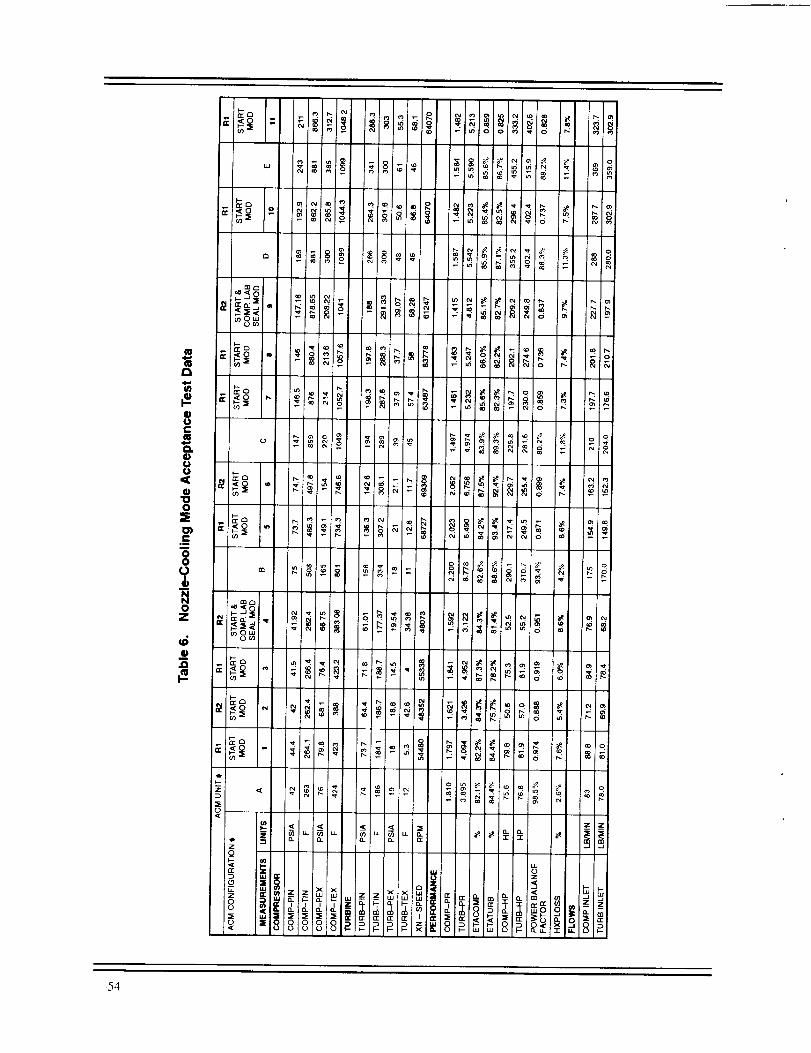
a
ue-
u
0'U0_E
t-
O0
0Z
o¢,,
_ rr e'_
¢e
I=
nre_- o
I--
m _
rrec_ _.
_0 _
0
8
o
_ _ I_ _ ii_
_ _ __| _ _ _!__ _!' _ _:_ _
_54

3.2.7.1 Test Setup
AlliedSignal converted the ACM acceptance test rig from the exhaust nozzle cooling mode configu-
ration to the engine cooling mode test setup. The ACM test setup in the engine cooling mode
configuration is similar to the facility used for the exhaust nozzle cooling mode. However, in this
test setup, although separate lines supply the turbine inlet air and compressor inlet air independently,
the flows are extracted from the same source. Figure 48 is a photo of the setup, and it is schematically
shown in Figure 49.
Because the high-pressure bleed air is fed directly to the turbine inlet, the bypass line (used to boost
start during the exhaust cooling mode test) is no longer required. Bearing cooling is facilitated by
the same bearing cooling inlet and outlet duct assemblies as used during the exhaust cooling mode
test. The same heat exchangers were also used to cool the bearing cooling air (to 300°F or less)
extracted from the compressor discharge air. A valve was added downstream of the heat exchangers
to regulate the pressure into the ACM bearing cooling circuit. The purpose of this valve was to
accurately simulate the air-side pressure drop across the ACEP heat exchangers. The remaining
compressor discharge air, normally cooled and returned to the engine for cooling the hot section, is
dumped during this rig test. Only the instrumented ACM with the compressor labyrinth seal modifi-
cation was tested in the engine cooling mode configuration.
Figure 48. Engine Cooling Mode Test Setup
55
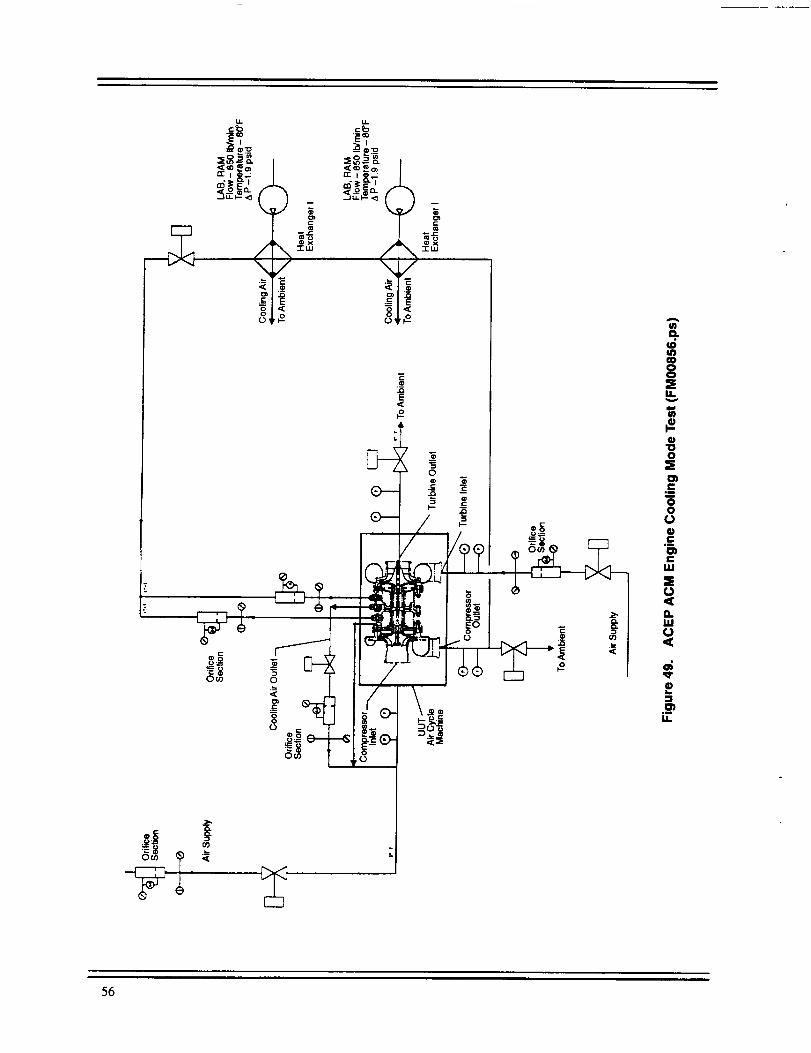
LL
cb
o_
/\
<C
E;=
gOq
)c
i<[
LL_b
--a)'_
o._
_I_
"rw <)! C
< .__
= E
C 9
-2
E
O_
|
2}--
/.f
_o___®D.)
I-- .m
m3
0 L_._ EO
o
A
(DInW00
U.
3
Q"OO
.NOO
4).E
.I
<
<
.__i1
56

The test setup included instrumentation to control the specific test conditions, evaluate performance
characteristics of the test unit, and measure pressures and temperatures at selected locations for unit
condition monitoring (similar to the exhaust nozzle cooling mode setup). Both discrete and real-time
data were obtained during the test.
3.2.7.2 Test Conditions
The ACEP ACM engine cooling mode development test conditions are summarized in Table 7. Test
condition F simulates the high-power engine cooling mode configuration associated with an engine
throttle push and conventional fuel inlet temperatures (about 250°F). Test condition G simulates a
low-power engine cooling mode condition associated with an engine life enhancement cooling
approach and typical test cell fuel inlet temperatures (about 100°F).
3.2.7.3 Test Results
ACM acceptance test data for the engine cooling mode configuration summarized in Table 7
identifies the two primary test conditions of interest (F and G) and compares predicted versus
measured results. Test condition G was adjusted to provide sufficient surge margin. Test condition
F could not be reached because of the facility air limitation. The maximum achievable test condition
commensurate with the same pressure ratios and required test temperatures was evaluated.
The measured test parameters closely approximate the target test conditions. Modification of the
compressor labyrinth seal configuration, creating a low-pressure cavity between the back side of the
compressor wheel and the compressor side journal bearing, provides sufficient cooling flow through
the bearing cavity with air-side pressure drops comparable to those of the ACEP heat exchangers.
3.2.8 ACM Acceptance Test Performance Summary
Results of the ACM exhaust nozzle cooling mode acceptance tests, with the start and compressor
labyrinth seal modifications, demonstrated the capability of the ACM to satisfy the intended applica-
tion. The unit successfully operated at the maximum temperature and maximum achievable pressure
and airflow (within the facility limits). Table 7 compares test results with the predicted performance
of the unit. These results show that the ACEP ACM meets the required performance and is capable
of dual-mode operation. The performance calculations relate to the latest test unit configuration
(ACM modified for improved compressor journal bearing cooling).
Bearing Cooling- The air bearings used for the ACEP ACM can operate up to 500°F satisfactorily
and without distress. The thermal capability of the bearing coating is limited to 650 F. To provide
sufficient thermal margin, the beating condition inlet air temperature is limited to a maximum of
300°E and the bearing cooling flow area is sized to provide ample airflow to absorb the heat
generated by the bearings. Instrumentation in the unit enabled verification of ample bearing cooling.
Internal unit pressures and temperatures provided deductions of the adequacy of bearing cooling
which was later improved by providing a low-pressure cavity between the compressor wheel and
the compressor journal bearing exit.
57

Table 7. Engine Cooling Mode ACM Test Data
MEASUREMENTS UNITS
COMPRESSOR
COMP-PIN PSIA
COMP-TIN F
COMP-PEX PSIA
COMP-TEX F
TURS_E
TURB-PIN PSIA
TURB-TIN F
TURB-PEX PSIA
TURB-TEX F
SPEED RPM
PERFORMANCE
COMP-PR
TURB-PR
COMP-TR
TURB-TR
XNR RPM
WAR LB/M
ETACOMP %
YFAC
DR
ETATURB %
I Fv
COMP-HP HP
TURB-HP HP
POWER BALANCE FACTOR
HXPLOSS %
EST. BRG. FLOW PRES P
FLOWS
COMP INLET LB/MIN
TURSINLET LB/MIN
BEARING LOADS, ACTUAL PF_E_URE
COMP IN THRST LBF
COMP BK THRST LBF
COMP LAB THRST LBF
R1 R1 R1
CASE F
259
880
381
1068
START & START &COMR LAB. COMR LAB.SEAL MODS SEAL MODS
ACM UNIT
EXTRAPOLATED
222 224 259
R1
CASE G
213
881
R1 R1
START & START &COMP. LAB. COMP. LAB.SEAL MODS SEAL MODS
188.3 226.9
924 906 924 890 897
334.3 336.3 390 357 306.5 368,5
1115 1097 1115 1119 1119 1132
259 227.4 227.9
894 9_2 899
$3 47 47.1
519 524 524
6278O 63621 63328
265 213 191.2
902 894 890
55 48
524 525
66442
1,51 1.50 1.51
4.84 4.84 4.82
1.14 1.14 1.14
1.36 1.36
1O2769103923
37.76
1.41
38.57 36.99
0.89 0,87 0.89
0.56 0.56 0.56
1.47
4.89
1.14
1.40
10O9O6
34.02
0.82
0.57
489. 78 490_2 489.15 489.19
0.77 0.77 0.77 0.77
0.75 0,76 0.76 0,00
396.77 377.27 391.43 431.20
420.12 350.12 356.04 408,51
0.94 1.08 1.10 1.06
9.2% 9.3% 9.6%10,7%
40.767
373 349.1 362.2 399
196 163.7 167,8 191
5701 4892 4_5 N/A
-5955 -5075 -5088 N/A
1 -3 -5 N/A
N/A
N/A
N/A
TURB BK THRST LBF 1846 10Q2 971
TURB OUT THRST LBF -1217 -968 -g65
COMP MOMENTUM LBF 45 48 50
TURB MOMENTUM LBF -37 -28 -30
TURBLAB SEAL LBF
NET THRUST LSF
N/A
-21 -17 -18 N/A
364 -80 -179 N/A
4982
-5110
5769
-5867
0
-1640
1830
1.68
4,44
1.18
1.32
106831
26.07
0.89
0.52
465.87
0.79
0.82
316.46
338.23
0.94
5.2%
16.564
235
162
4874
-5398
-11
1569
-1074
22
-27
-20
-66
49565_2
THRUST LOAD ESTaTLIA_E,_
5813
-5146 -5962 -5287
-2 -1 -2 0
-1446 -1449 -1689
1611 1615
45 48 5O
-37 -28 -30 -33
-16 -14 -14 -17
185O
53
-1412
1551
22
-27
-13
-21144
COMPINTHR EST. LBF
COMPBKTHR EST LBF
COMPLABTHR EST LBF
TURB OUT THR EST, LBF
THRBBKTHR ES_ LBF
COMPIN MOMENTUM LBF
TURB OUT MOMENTUM LBF
PTH, TURBLABY SEAL LSF
NET THR EST. LBF
227.9
901
42.6 51.2
523 531
65675 65675
1.63 1.62
4.49 4.45
1.17 1.17
1.30 1.35
105952 106226
29,79 29,24
0.87 0.85
0,53 0,53
467.34 469.05
0.79 0.79
0.81 0.81
306.57 371.11
276.60 320.10
1.11 1.16
5.9% 10.6%
236.6 279,1
133.2 152.9
4215 5081
-4488
-15
-5411
-12
1025 1202
-890 -1070
25 29
-21 -23
-16 -19
-165 -223
4337
-4576
-1
-1260
1387
85 40 47
25
-21
5222
-55O7
-1508
1658
29
-23
-12 -14
-t22 -144
58
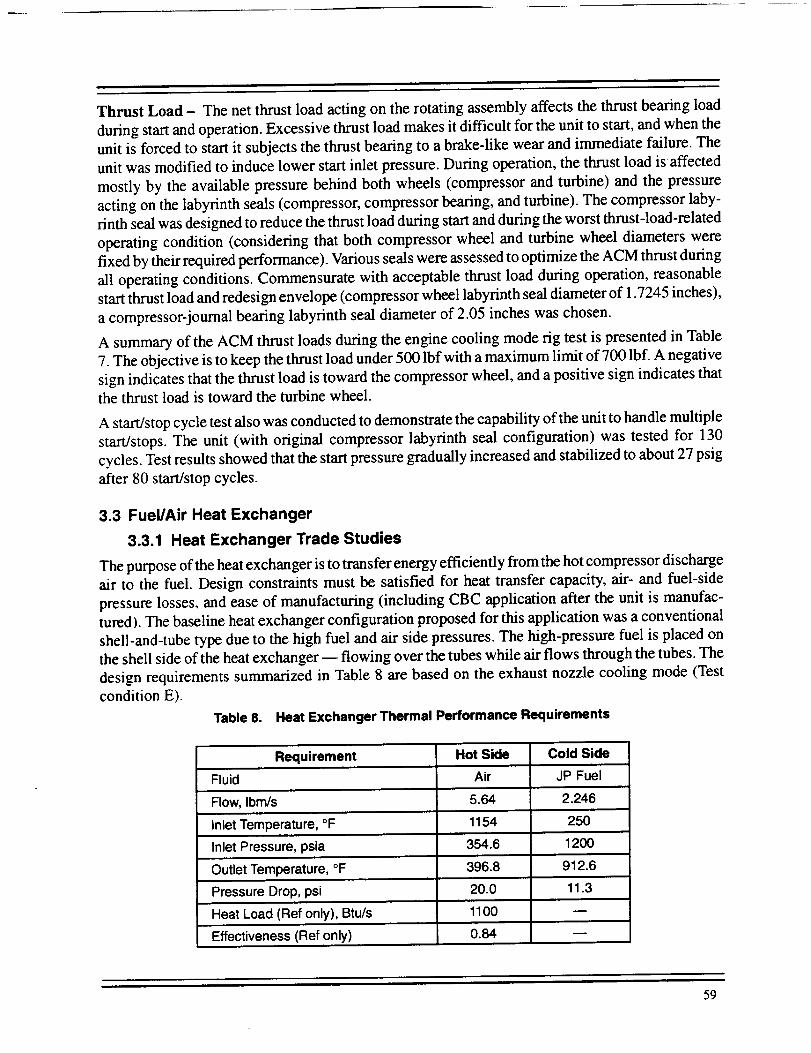
Thrust Load - The net thrust load acting on the rotating assembly affects the thrust bearing load
during start and operation. Excessive thrust load makes it difficult for the unit to start, and when the
unit is forced to start it subjects the thrust bearing to a brake-like wear and immediate failure. The
unit was modified to induce lower start inlet pressure. During operation, the thrust load is affected
mostly by the available pressure behind both wheels (compressor and turbine) and the pressure
acting on the labyrinth seals (compressor, compressor beating, and turbine). The compressor laby-
rinth seal was designed to reduce the thrust load during start and during the worst thrust-load-related
operating condition (considering that both compressor wheel and turbine wheel diameters were
fixed by their required performance). Various seals were assessed to optimize the ACM thrust during
all operating conditions. Commensurate with acceptable thrust load during operation, reasonable
start thrust load and redesign envelope (compressor wheel labyrinth seal diameter of 1.7245 inches),
a compressor-journal bearing labyrinth seal diameter of 2.05 inches was chosen.
A summary of the ACM thrust loads during the engine cooling mode rig test is presented in Table
7. The objective is to keep the thrust load under 500 Ibf with a maximum limit of 700 Ibf. A negative
sign indicates that the thrust load is toward the compressor wheel, and a positive sign indicates that
the thrust load is toward the turbine wheel.
A start/stop cycle test also was conducted to demonstrate the capability of the unit to handle multiple
start/stops. The unit (with original compressor labyrinth seal configuration) was tested for 130
cycles. Test results showed that the start pressure gradually increased and stabilized to about 27 psig
after 80 start/stop cycles.
3.3 Fuel/Air Heat Exchanger
3.3.1 Heat Exchanger Trade Studies
The purpose of the heat exchanger is to transfer energy efficiently from the hot compressor discharge
air to the fuel. Design constraints must be satisfied for heat transfer capacity, air- and fuel-side
pressure losses, and ease of manufacturing (including CBC application after the unit is manufac-
tured). The baseline heat exchanger configuration proposed for this application was a conventional
shell-and-tube type due to the high fuel and air side pressures. The high-pressure fuel is placed on
the shell side of the heat exchanger-- flowing over the tubes while air flows through the tubes. The
design requirements summarized in Table 8 are based on the exhaust nozzle cooling mode (Test
condition E).
Table 8. Heat Exchanger Thermal Performance Requirements
Requirement Hot Side Cold Side
Fluid Air JP Fuel
Flow,Ibm/s 5.64 2.246
Inlet Temperature, °F 1154 250
Inlet Pressure, psia 354.6 1200
Outlet Temperature, °F 396.8 912.6
Pressure Drop, psi 20.0 11.3
Heat Load (Ref only), Btu/s 1100 m
0.84Effectiveness (Ref only)
59

Heat exchanger trade studies were conducted to select a preferred configuration. Initially, seven
configurations of tube OD (outer diameter) and wall thickness were considered, as summarized in
Table 9. Two of the configurations used inserts (turbulators) to enhance the air-side heat transfer.
Preliminary size estimates are also listed in Table 9. Six of these configurations had equilateral
triangular tube patterns with 0.060-in spacing between the tubes; configuration 7 had 0.030-in tube
spacing. Tube spacing of 0.030-in is quite conventional, and the contractor has experience with tube
spacing as low as 0.023-in on production units. The first tube size, in configuration 1, was used as
a starting point. The second configuration was an attempt to reduce the heat exchanger weight. The
third was an attempt to reduce tube count. The fourth was an attempt to reduce the tube length. The
fifth was an attempt to reduce the shell diameter, overall volume, and weight. The sixth was to
determine the effect of small tube diameter on heat exchanger volume. Configuration 7 reduced the
shell diameter and overall heat exchanger volume.
Table 9. Preliminary Heat Exchanger Sizing
NumberTube Configuration of
Tubes
1. 0.1228-in OD, 0.0184-in Wall 1350
2. 0.125-in OD, 0.010-in Wall 925
3. 0.250-in OD, 0.020-in Wall 225
4. 0.150-in OD, 0.012-in Wall 5260
5. 0.150-in OD, 0.010-in Wall 1187
6. 0.0625-in OD, 0.010-in Wall 4321
7. 0.0625-in OD, 0.008-in Wall 4332with 0.030-in Tube Spacing
ShellID (in)
7
6
5
16
8
8.7
6.5
Tube Core Tube BundleLength Volume Weight Turbulators
(in) (ft3) (Ibm)
48 0.93 117
0.86 6464
150 1.3 146
18 1.78 148 Dog-ears
29 0.78 44 Moderate
21 0.67 34
21 0.38 34
The normalized results shown in Table l 0 indicate that the shell inner diameter, tube length, and tube
count are greatly affected by the selected tube configuration. This is caused primarily by the flow
and pressure-drop characteristics of the airflow inside the tubes. Allowable pressure drop was
initially 20 psid. The heat exchanger air-side pressure drop is dictated by the engine cooling mode
system balance. In this operating mode, the heat exchanger air discharge pressure cannot be less than
7.5% above P3 (engine compressor discharge pressure) in order for the cooling to be reintroduced
to the engine cooling system.
A qualitative assessment of the various heat exchanger configurations is presented in Table 1l. As
indicated, configuration 2 is considered the baseline design, primarily because it produces the best
compromise between shell diameter, tube length, tube count and weight. Structural considerations
drive the design toward smaller shell diameters. Packaging considerations drive the design toward
smaller tube lengths. Manufacturing considerations drive the design toward smaller tube counts.
The dog-eared turbulator inserts, configuration 4, produce significantly higher pressure drop than
smooth tubes. Thus, more tubes with less flow per tube (and larger shell diameter) are required to
achieve the 20 psid. The large shell diameter is unacceptable from a structural standpoint; the shell
60

Table 10. Normalized Heat Exchange Sizing
Tube Configuration Tubes Shell ID Volume Weight Tube Length Turbulators
1.0.1228-in OD, 0.0184-in Wall 1.5 1.17 1.08 1.83 0.75
2.0.125-in OD, 0.010-in Wall 1.0 1.00 1.00 1.00 1.00
3.0.250-in OD, 0.020-in Wall 0.2 0.83 1.51 2.28 2.34
4.0.150-in OD, 0.012-in Wall 5.7 2.67 2.07 2.31 0.28 Dog-ears
5.0.150-in OD, 0.010-in Wall 1.3 1.33 0.91 0.69 0.45 'Moderate
6.0.0625-in OD, 0.010-in Wall 4.7 1.45 0.78 0.53 0.33
7.0.0625-in OD, 0.008-in Wall 4.7 1.08 0.44 0.53 0.33with 0.030-in Tube Spacing
Table 11. Qualitative Heat Exchanger Assessment
ConfigurationCharacteristic/Issues
2 7
Tube Length - -- + +
CBC Compatibility + +
Ease of Fabrication + + + --
3 4
---- +4"
m
++ ----
+ -t-
-3 -3
5 6
+ ++
+
+
-- +
+ ++
1 0
Shell Thickness + + + +
Performance Confidence + + +
WeightNolume _ m -- + +
Relative Score +1 +3 3
and header thickness increase dramatically. Configuration 5 attempted to provide an intermediate
solution between the baseline and dog-eared insert configurations. In other words, reduce the shell
diameter from configuration 4 but try to maintain the shorter tube length. The "moderate" turbula-
tion is theoretically based on extrapolation of dimpled-tube heat transfer and pressure drop charac-
teristics. Although the sizing results of configuration 5 are very favorable, the theoretical turbulator
required additional development and was deemed high risk. Configurations 6 and 7 use 0.0625-in
diameter tubes to reduce the overall heat exchanger volume. Configuration 7 produces the best
overall heat exchanger solution relative to volume, tube length, and shell diameter -- by virtue of
the closer packed tubes. However, the contractor team felt that the combination of low tube diame-
ters, quantity of tubes, and high operating pressure and temperature levels would introduce signifi-
cant heat exchanger development risks. Therefore, the 0.0625-in tube OD solutions were droppedfrom consideration.
The preferred heat exchanger arrangement is configuration number 2. To reduce the overall tube
length for configuration 2, the heat exchanger could be divided into modules connected in series
flow, so the shell diameter would remain the same at approximately 6 inches, but the length of each
module would be reduced to about 32 inches (excluding manifolds and fittings). Structurally, this
should be the same as one 64-in module. How-wise, there would be an additional pressure drop dueto two sets of manifold losses rather than one.
61
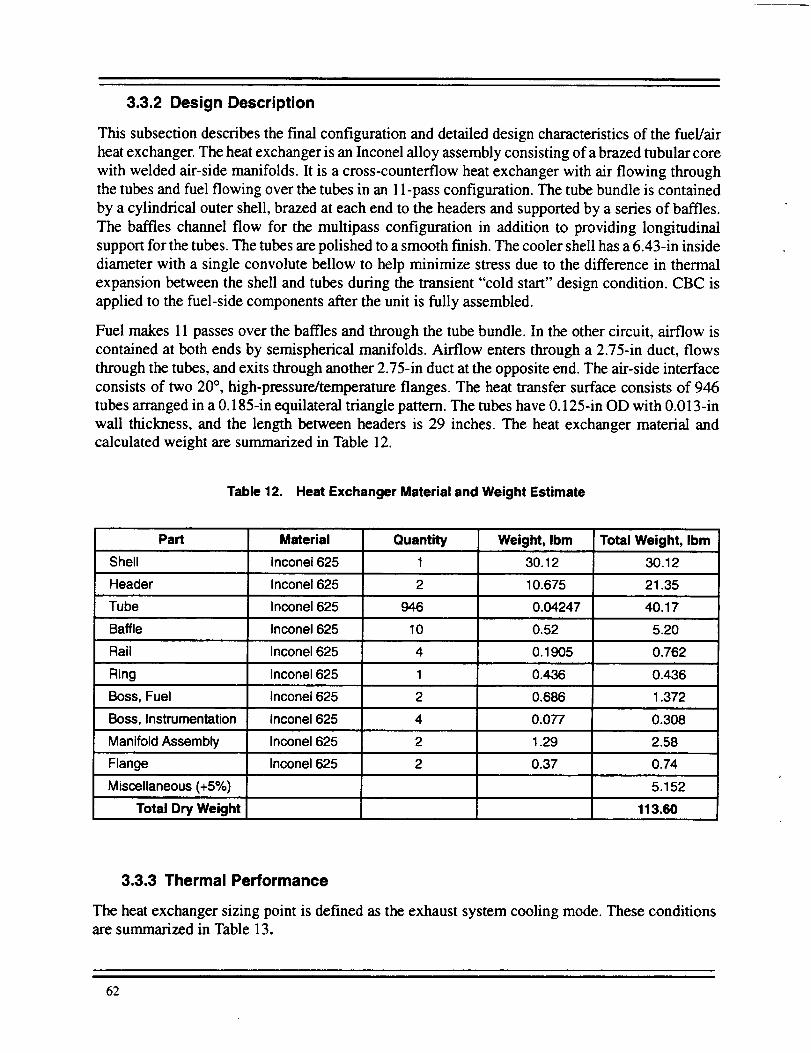
3.3.2 Design Description
This subsection describes the final configuration and detailed design characteristics of the fuel/air
heat exchanger. The heat exchanger is an Inconel alloy assembly consisting of a brazed tubular core
with welded air-side manifolds. It is a cross-counterflow heat exchanger with air flowing through
the tubes and fuel flowing over the tubes in an 11-pass configuration. The tube bundle is contained
by a cylindrical outer shell, brazed at each end to the headers and supported by a series of baffles.
The baffles channel flow for the multipass configuration in addition to providing longitudinal
support for the tubes. The tubes are polished to a smooth finish. The cooler shell has a 6.43-in inside
diameter with a single convolute bellow to help minimize stress due to the difference in thermal
expansion between the shell and tubes during the transient "cold start" design condition. CBC is
applied to the fuel-side components after the unit is fully assembled.
Fuel makes 11 passes over the baffles and through the tube bundle. In the other circuit, airflow is
contained at both ends by semispherical manifolds. Airflow enters through a 2.75-in duct, flows
through the tubes, and exits through another 2.75-in duct at the opposite end. The air-side interface
consists of two 20 °, high-pressure/temperature flanges. The heat transfer surface consists of 946
tubes arranged in a 0.185-in equilateral triangle pattern. The tubes have 0.125-in OD with 0.013-in
wall thickness, and the length between headers is 29 inches. The heat exchanger material and
calculated weight are summarized in Table 12.
Table 12. Heat Exchanger Material and Weight Estimate
Part Material Quantity Weight, Ibm Total Weight, Ibm
Shell Inconel 625 1 30.12 30.12
Header Inconel 625 2 10.675 21.35
Tube Inconel 625 946 0,04247 40.17
Baffle Inconel 625 10 0.52 5.20
Rail Inconel 625 4 0.1905 0.762
Ring Incone1625 1 0.436 0.436
Boss, Fuel Inconel 625 2 0.686 1.372
Boss, Instrumentation Inconel 625 4 0.077 0.308
Manifold Assembly Inconel 625 2 1.29 2.58
Flange Inconel 625 2 0.37 0.74
Miscellaneous (+5%) 5.152
Total Dry Weight 113.60
3.3.3 Thermal Performance
The heat exchanger sizing point is defined as the exhaust system cooling mode. These conditionsare summarized in Table 13.
62
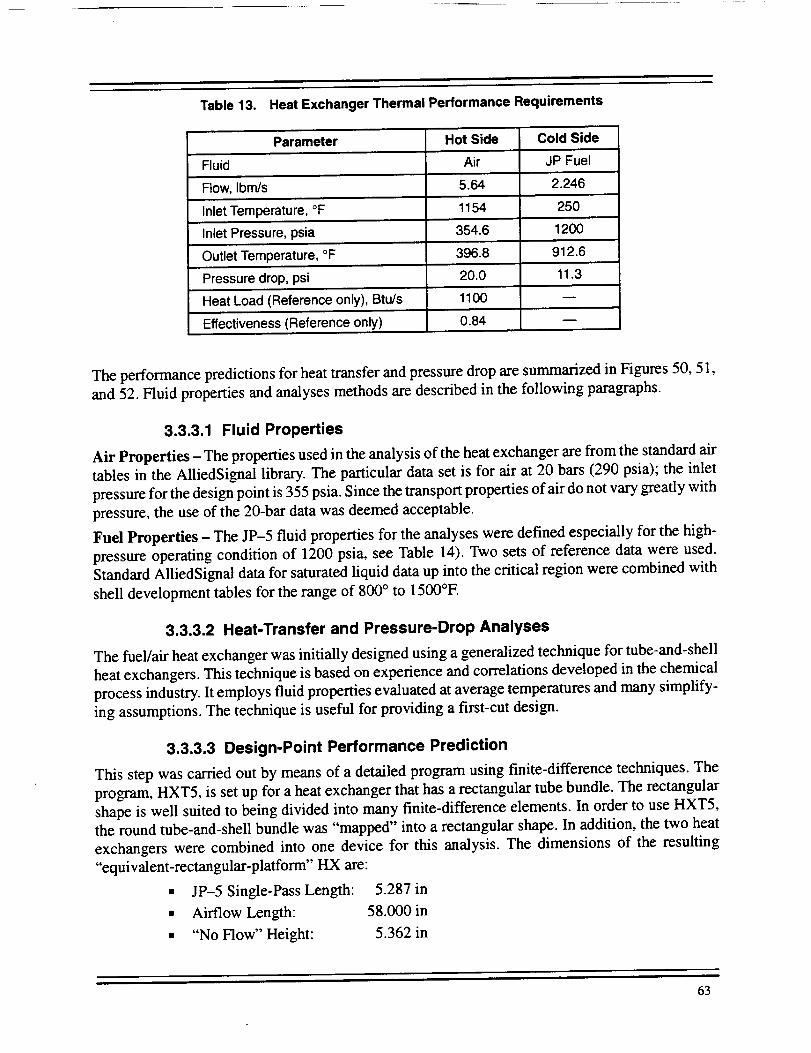
Table 13. Heat Exchanger Thermal Performance Requirements
Parameter Hot Side Cold Side
Fluid Air JP Fuel
Flow, Ibm/s 5.64 2.246
Inlet Temperature, °F 1154 250
Inlet Pressure, psia 354.6 1200
Outlet Temperature, °F 396.8 912.6
Pressure drop, psi 20.0 11.3
Heat Load (Reference only), BtLgs 1100 w/
Effectiveness (Reference only) 0.84
The performance predictions for heat transfer and pressure drop are summarized in Figures 50, 51,
and 52. Fluid properties and analyses methods are described in the following paragraphs.
3.3.3.1 Fluid Properties
Air Properties - The properties used in the analysis of the heat exchanger are from the standard air
tables in the AlliedSignal library. The particular data set is for air at 20 bars (290 psia); the inlet
pressure for the design point is 355 psia. Since the transport properties of air do not vary greatly with
pressure, the use of the 20-bar data was deemed acceptable.
Fuel Properties - The JP-5 fluid properties for the analyses were defined especially for the high-
pressure operating condition of 1200 psia, see Table 14). Two sets of reference data were used.
Standard AlliedSignal data for saturated liquid data up into the critical region were combined with
shell development tables for the range of 800 ° to 1500°F.
3.3.3.2 Heat-Transfer and Pressure-Drop Analyses
The fuel/air heat exchanger was initially designed using a generalized technique for tube-and-shell
heat exchangers. This technique is based on experience and correlations developed in the chemical
process industry. It employs fluid properties evaluated at average temperatures and many simplify-
ing assumptions. The technique is useful for providing a first-cut design.
3.3.3.3 Design-Point Performance Prediction
This step was carried out by means of a detailed program using finite-difference techniques. The
program, HXT5, is set up for a heat exchanger that has a rectangular tube bundle. The rectangular
shape is well suited to being divided into many finite-difference elements. In order to use HXT5,
the round tube-and-shell bundle was "mapped" into a rectangular shape. In addition, the two heat
exchangers were combined into one device for this analysis. The dimensions of the resulting
"equivalent-rectangular-platform" HX are:
• JP-5 Single-Pass Length: 5.287 in
• Airflow Length: 58.000 in
• "No Flow" Height: 5.362 in
63
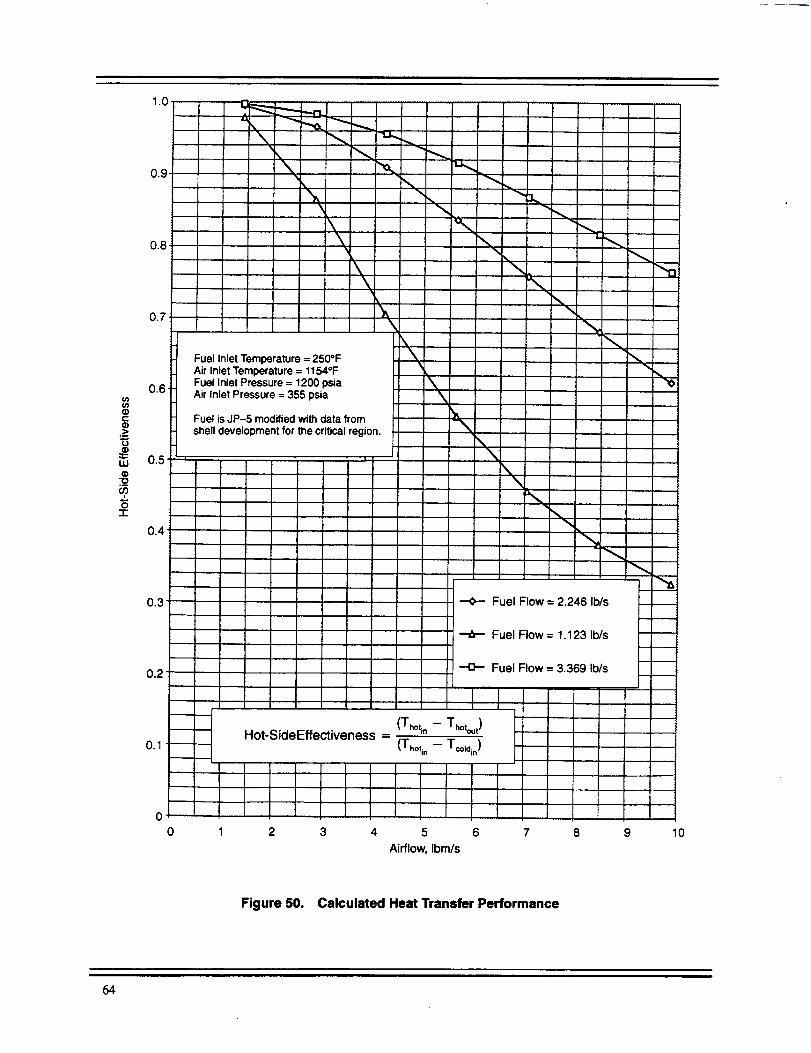
(/)
¢-.Q)
.>
ILl
ooi
O
"1-
1.0
0.9
0.8
0.7
0.6'
0.5
0.4
0.3
0.2
0.1
0
0
\\\
, ,.. ,,
r---o. _.
\ i
\ ,
\J\
i
Fuel Inlet Temperature = 250°FAir Inlet Temperature = 1154°FFuel Inlet Pressure = 1200 psiaAir Inlet Pressure = 355 psia
Fuel is JP-5 modified with data from
shell development for the critical region.
m
I
1
I I ,
I J ,I i
I J I
J i I
I
' ' I
]li
I
Hot-SideEffectiveness
• i Ii i I|
II1 ,,2 3 4
\
,%
\
\
\
\
i
I
\
\
\
\
\\
i
-..0--- Fuel Flow = 2.246 Ib/s
Fuel Flow = 1.123 Ib/s
--O- Fuel Flow = 3.369 Ib/s
(T.ot,. - T.oto,,t)
(Thoti n -- Too.i.)
I 'I15 6
Airflow, Ibm/s
] I
I I I
' [IIJ
I
J
7 8 9
i
Figure 50. Calculated Heat Transfer Performance
64
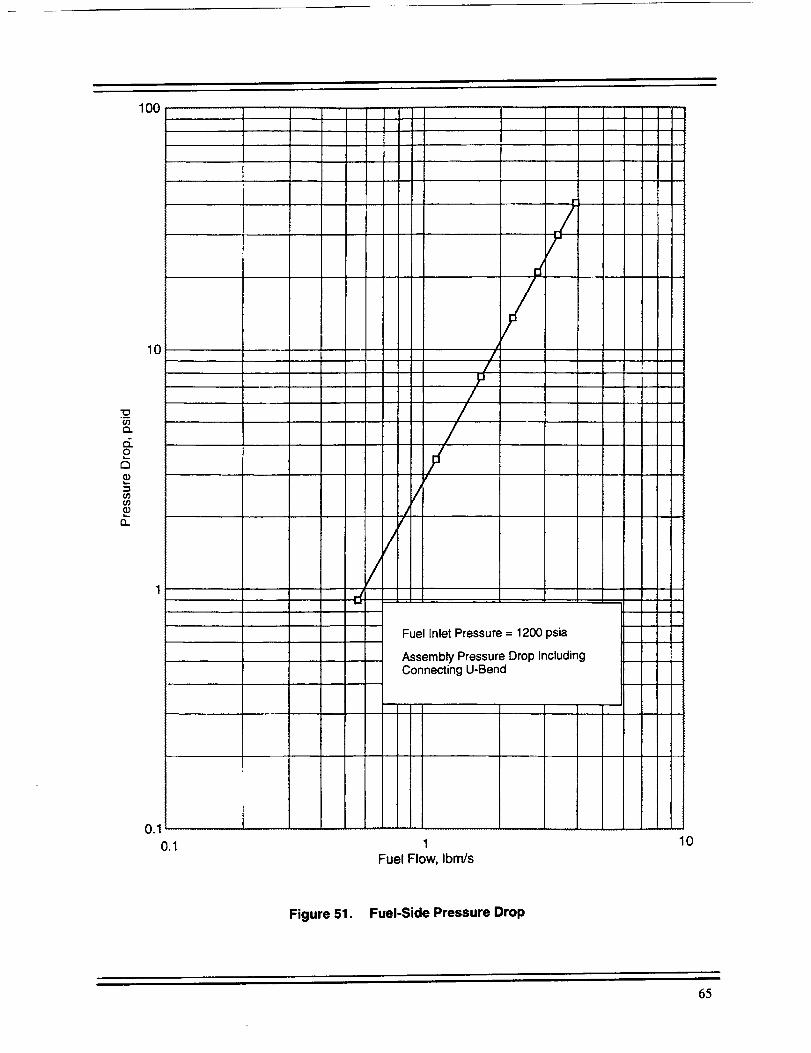
03Q.
{5.
c3
EL
1O0
10
Fuel Inlet Pressure = 1200 psia
Assembly Pressure Drop IncludingConnecting U-Bend
1
Fuel Flow, Ibm/s
10
Figure 51. Fuel-Side Pressure Drop
65
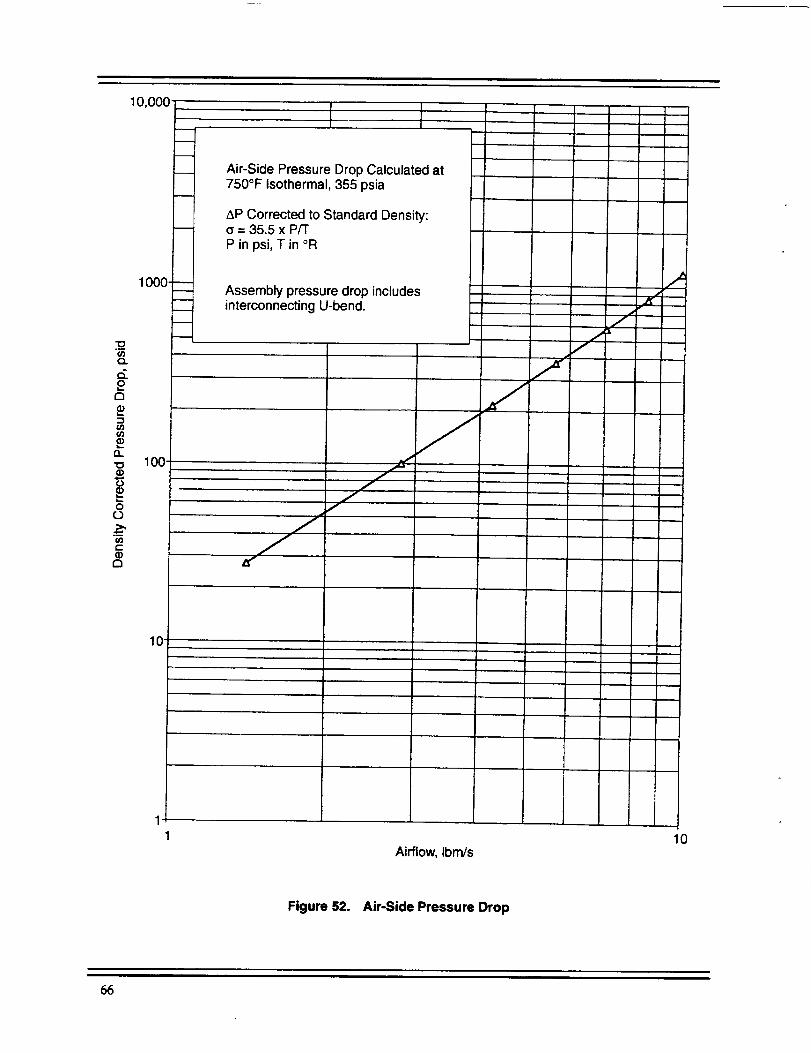
10,000 ....
1000-
oE3
D..
-a 100(1)
O
t-
a)
10
m
Air-Side Pressure Drop Calculated at750°F Isothermal 355 psia
AP Corrected to Standard Density:= 35.5 x P/T
P in psi, T in °R
Assembly pressure drop includesinterconnecting U-bend.
J
Airflow, Ibm/s
rJ
/j,
/
i
10
Figure 52. Air-Side Pressure Drop
66
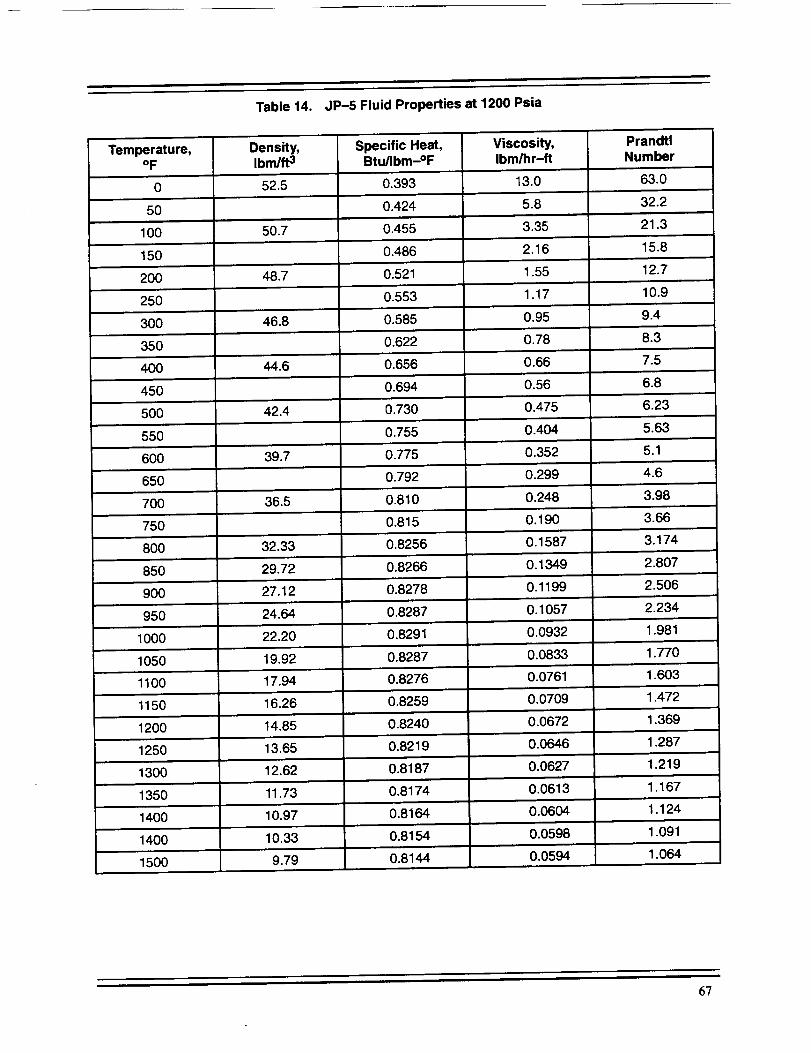
Table 14. JP-5 Fluid Properties at 1200 Psia
Temperature, Density,OF Ibm/ft 3
0 52.5
50
100
150
200
250
300
350
400
50.7
48.7
46.8
44.6
Specific Heat, Viscosity, PrandtlBtu/Ibm-OF Ibm/hr-ft Number
0.393 13.0 63.0
0.424 5.8 32.2
0.455
0.486
0.521
0.553
0.585
0.622
0.656
3.35
2.16
1.55
1.17
0.95
0.78
0.66
21.3
15.8
12.7
10.9
9.4
8.3
7.5
450
5OO
550
600
650
700
750
800
850
900
950
1000
1050
1100
1150
1200
1250
42.4
39.7
36.5
32.33
29.72
27.12
24.64
22.20
19.92
17.94
16.26
14.85
0.694
0.730
0.755
0.775
0.792
0.810
0.815
0.8256
0.8266
0.8278
0.8287
0.8291
0.8287
0.8276
0.8259
0.8240
0.56
0.475
0.404
0.352
0.299
0.248
0.190
0.1587
0.1349
0.1199
0.1057
0.0932
0.0833
0.0761
0.0709
0.0672
6.8
6.23
5.63
5.1
4.6
3.98
3.66
3.174
2.807
2.506
2.234
1.981
1.770
1.603
1.472
1.369
13.65 0.8219 0.0646 1.287
1300 12.62 0.8187 0.0627 1.219
1350 11.73 0.8174 0.0613 1.167
1400 10.97 0.8164 0.0604 1.124
1400 10.33
1500 9.79
0.8154 0.0598 1.091
0.8144 0.0594 1.064
6?
It can be seen that this rectangular bundle shape is not greatly different from the actual tube bundle
in the circular shell. The tube bundle configuration (tube pitch and alignment) remained the same
as in the actual heat exchanger.
The finite-difference computations matrix was 6 x 66, for a total of 396 elements. That is, 6 elements
across the heat exchanger and 66 elements along the length. The program has the capability of
evaluating fluid properties and heat transfer coefficients based on the average temperature of a fluid
(average from inlet and outlet) or optionally using the local fluid temperature at each and every
finite-difference element. For the ACEP fuel/air heat exchanger, the latter computation mode of
local evaluation was used because it is more accurate than average-temperature evaluation as the
fuel properties vary significantly from inlet to outlet.
The pressure-drop computations in the program always use local properties (viscosity and density)
and local friction factors. For each element, the friction and flow acceleration (or deceleration)
losses are evaluated rigorously. For liquid flow outside of the tube bundle, the friction and heat
transfer data of Bergelin were used. The evaluations of friction factor and j factor for the liquid
involve corrections involving the ratio of the free-stream viscosity to that at the tube wall. For the
airflow within the tubes, standard tubularf and j data were used.
The pressure-drop computations involve the frictional/accelerational losses within the heat-transfer
matrix, the various entrance and exit losses into the matrix, and the losses associated with the pans
(or headers) at the ends of each unit. The HXT5 pressure drop computations had to be augmented
to include the additional pressure losses in the air-side exit pan of the first unit, the inlet pan of the
second unit, and the connecting piping between the two units. This was done via a spreadsheet
computation. The pressure-drop computation for the interconnecting piping includes special consid-
erations for the pipe bends in these tubes.
The program considers heat conduction within the heat transfer matrix. For a tubular unit, there is
usually little conduction across the unit (via the baffles); thus, the matrix is limited to longitudinal
conduction in the tube walls. This is considered automatically for the ACEP fuel/air heat exchanger
with its very long tubes, and it is judged that there is very little effect due to this conduction.
The conduction in the tube header plates is considered, but that of the baffles within the shell is not.
The effect of the lateral conduction in the baffles is not expected to be great, especially since the
contact between tubes and baffles is, by design, minimal.
3.3.3.4 Effect of Coating on Heat Exchanger Performance
The performance predictions are for clean, noncoated tubes. The heat exchanger analysis program
can accommodate the effects of a coating in the form of a "fouling factor" and a "fouled-layer
thickness" (both built-in options). Very little performance change due to coating is expected sinceit is very thin (5000 ,_,), is only applied on the fuel side (outside the tubes), and the heat-transfer
conductance is far greater on the outside of the tubes than that on the inside of the tubes. The pertinent
conductances are approximately 91,000 Btu/hr-°F outside the tubes and 34,000 Btu/hr-°F inside
the tubes. Clearly the performance is dominated by the air-side heat transfer.
3.3.4 Structural Analysis
The analysis described in this section addresses key structural design areas including the header,
manifold, collars, and tubes. All of these items respond to pressure and thermal load. The structural
68

analysisfor theheatexchangerrequiresthermalandpressureloading.Theshelldesignincludesaconvolutionthatsignificantlyreducesthermallyinducedloadingfromtheheatexchangertubesandshell.Themajorcomponentsareshownin Figure53.
Manifold Collar Convolution Shell Tube Header
t'll ]=,==,= le, =,---,-=,=-1=l--"tl'
Figure 53. Fuel/Air Heat Exchanger Components
The following subsection (3.3.4.1) addresses analysis results based on the start-up transient devised
in the initial stages of the program. It involves establishment of full fuel flow through the heat
exchanger well before any air is admitted to the unit. Then, over a 60-second period, the airflow isincreased to the full flow rate.
Subsection 3.3.4.2 describes low-cycle fatigue analysis using ANSYS.
3.3.4.1 Start-Up Transient Structural Analysis
The start-up transient, devised in the initial stages of the program, involves establishment of full fuel
flow through the heat exchanger well before any air is admitted to the unit. The initial stress analysis
indicated a shell thickness of 0.14 inch using Inconel 625 as the heat exchanger material. This was
set primarily by the 1200-psia fuel pressure in the shell and tube and shell steady-state temperature
distributions. However, transient startup conditions are more severe than steady-state conditions in
terms of tube-to-shell temperature differences. Prior to startup, cold fuel flows through the heat
exchanger (over the tubes), but no air is flowing through the tubes. At startup, hot air is introduced
to the heat exchanger over a 60-second period. The thin-walled tubes quickly heat up while the shell
temperature lags behind. This produces a tube-to-shell temperature difference larger than the steady-
state condition (as high as 400°F). The tubes expand faster than the cooler shell which, in turn,
restrains the tubes. The greatest thermal stresses are expected during the startup of the unit, so this
special type of startup transient was envisioned to limit such stress. This stress situation is only
experienced by the heat exchanger immediately downstream of the ACM compressor. Originally
the stress analysis was to be based on a transient involving a "cold soak" of 250°F (representing the
initial fuel temperature in the aircraft). However, test conditions on the ground, involving a fuel
storage facility at 60°F, changed the cold-soak initial condition to the latter temperature. The primary
fix for this classic condition is placement of one or more bellows in the shell so that the shell will
flex with the expanding tubes. To accommodate this, the shell thickness (and therefore the shell
diameter) should be kept to a minimum so the bellows will have approximately the same thickness
69

as the shell. The bellows must provide the same hydrostatic restraint against the 1200-psia fuel
pressure and still provide adequate flexibility.
HXT5 was used to compute the transient response of the fluids and the heat transfer matrix during
the 60-second startup. This was done for both the 250°F and 60°F initial conditions. HXT5 is a fully
functional, transient-analysis program. When used to obtain steady-state results, as discussed in
previous sections, the boundary conditions (flow rates, inlet temperatures, and inlet pressures) are
held constant with time and the performance prediction is continued until steady conditions areattained.
For a shell-and-tube heat exchanger, HXT5 does not compute the shell and pan temperatures. (They
are not considered part of the active thermal matrix.) Because of the relative mass of the shell,
headers, and manifold -- and the typically poor heat-transfer coefficients associated with them --
these parts of the heat exchanger will lag significantly behind the fluid and tube temperatures. This
lag can introduce considerable stresses within the heat exchanger.
To compute the shell, header, and manifold temperatures during the transient, it is necessary to use
a separate analysis using a thermal analyzer program. For the start-up transient, HXT5 is first run;
at specified time intervals, the temperatures of all finite-difference elements (metal and the two
fluids) are printed out (or alternatively written to an external file). These transient fluid and tube-wall
temperatures form the boundary conditions for the transient thermal analyzer computations. This
approach is based upon the assumption that the fluid and tube-wall temperatures are minimally
affected by the presence of the massive shell, header, and manifold; thus, the separate computation
can be made using the stand-alone, finite-difference program. This approach has been verified in
many previous projects that involve heat exchangers.
Design Point Assumptions - For the steady-state loads, the pressures and temperatures wereassumed to be:
• Air inlet pressure: 354.6 psia
• Air inlet temperature: 1154°F
• Fuel inlet pressure: 1200 psia
• Fuel inlet temperature: 250°F
For the transient analysis, it was assumed the system will reach steady conditions after 60 seconds.
Material Properties - The material properties of Inconel 625 listed in Table 15 were used in thestress calculations.
Table 15. Inconel 625 Properties (Annealed), from MIL HDBK-SG
Minimum Properties 70°F
Ultimate Strength, ksi 120
Yield Strength, ksi 54
300OF
112.8
45.4
600°F 1100°F
106.8 98.4
40.0 36.7
Steady-State Analysis - The 2D, axisymn_tric, finite-element model developed for the steady-
state analysis is shown in Figure 54. The model consists of the header, manifold, collar, shell, and
tubes. The requirements for operating, proof, and burst pressures and temperatures are summarizedin Table 16.
70
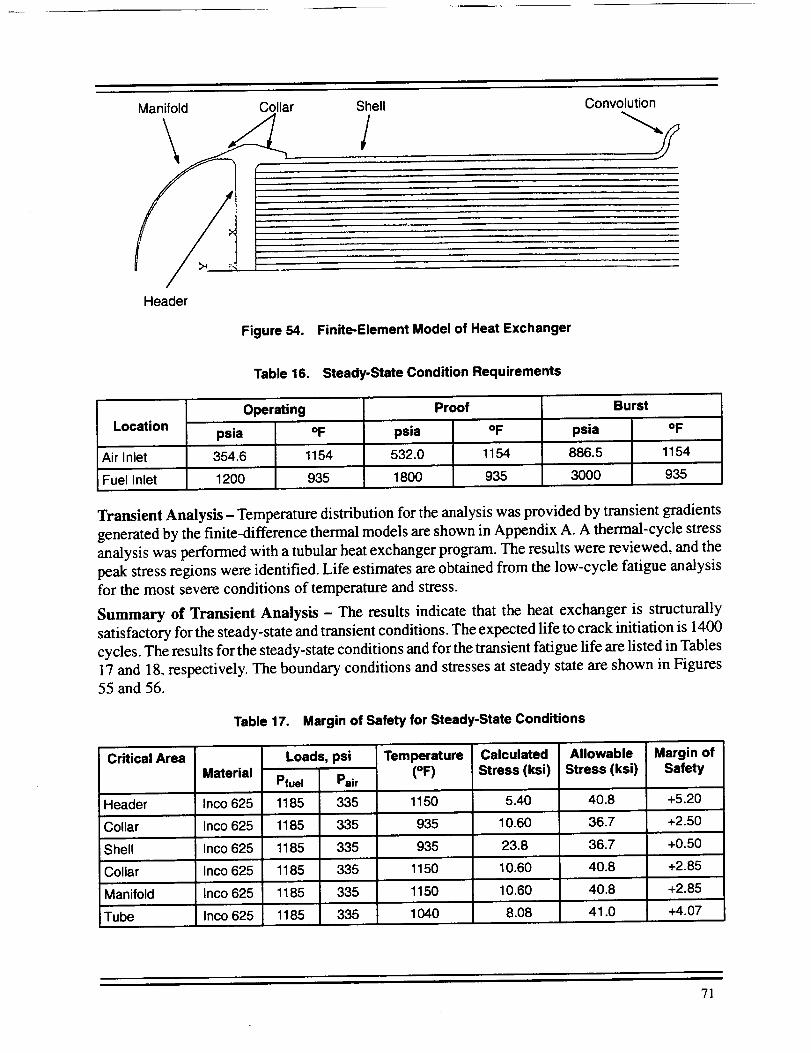
Manifold Collar Shell
JConvolution
-..f
Header
Figure 54. Finite-Element Model of Heat Exchanger
Table 16. Steady-State Condition Requirements
Operating ProofLocation
psia °F psia °F
Air Inlet 354.6 1154 532.0 1154
Fuel Inlet 1200 935 1800 935
Burst
psia °F
886.5 1154
3000 935
Transient Analysis- Temperature distribution for the analysis was provided by transient gradients
generated by the finite-difference thermal models are shown in Appendix A. A thermal-cycle stress
analysis was performed with a tubular heat exchanger program. The results were reviewed, and the
peak stress regions were identified. Life estimates are obtained from the low-cycle fatigue analysis
for the most severe conditions of temperature and stress.
Summary of Transient Analysis - The results indicate that the heat exchanger is structurally
satisfactory for the steady-state and transient conditions. The expected life to crack initiation is 1400
cycles. The results for the steady-state conditions and for the transient fatigue life are listed in Tables
17 and 18, respectively. The boundary conditions and stresses at steady state are shown in Figures55 and 56.
Table 17. Margin of Safety for Steady-State Conditions
Critical Area
Header
Collar
Shell
Collar
Manifold
Tube
MaterialLoads, psi Temperature
(OF)CalculatedStress (ksi)
Pfuel Pair
1185 335
1185 335
1185 335
1185 335
1185 335
1185 335
AllowableStress (ksi)
Margin ofSafety
Inco 625 1150 5.40 40.8 +5.20
Inco 625 935 10.60 36.7 +2.50
Inco 625 935 23.8 36.7 +0.50
Inco 625 1150 10.60 40.8 +2.85
Inco 625 1150 10.60 40.8 +2.85
1040 8.08 41.0 +4.07Inco 625
71

Table 18. Predicted Minimum Life for Transient Conditions (Includes Scatter Factor of 10)
Stress, ksiCritical Area Material
30 Seconds 40 Seconds 60 Seconds
Header Inconel 625 14.0 15.0 12.3 4.8 x 10¹⁰
Collar Inconel 625 121,0 125.4 95.3 5.0 x 10³
Shell Inconel 625 45.5 47.4 37.2 5.1 x 10⁷
Collar Inconel 625 155.0 157.5 110.0 1.4 x 10³
Manifold Inconel 625 20.0 19.1 12.3 7.1 x 10⁹
Tube Inconel 625 9.1 9.3 9.1 3.7 x 10¹²
Estimated Life
(Cycles)
x
H ,o0s,a 12000,,a
Figure 55. ACEP Fuel/Air Cooler Steady-State Boundary Conditions
_:: _ i ANSYS 5.1
_E i _ i May91996___',// X i "_ i 07:20:58
i "] :: Plot No. 2F i 1 1 Nodal Solution
//j IZ y i _' ': STEP = 1/// _ Y i _ :: SUB = 1
// i "_ i TIME = 1// i _ ! SEQV (Avg)II :: 4 i DMX = 0.013693__ -._.___! SMN = 103.994
SMX = 23814
A = 1421B = 4056C = 6690D = 9324E = 11959F = 14593G = 17228H = 19862I = 22496
Figure 56. ACEP Fuel/Air Cooler Equivalent-Stress Plot at Steady-State Conditions
72

3.3.4.2 Low-Cycle Fatigue Structural Analysis
A thermal cycle stress analysis was performed with an ANSYS finite-element model of the fuel/air
heat exchanger. Stresses were calculated for several transient temperatures. The thermal maps used
for this analysis are shown in Appendix A.
Life estimates were made from low cycle fatigue life prediction methodology (Mason-Halford
Universal Slope) for the most severe conditions of temperature and stress. The analysis results show
that the heat exchanger is structurally satisfactory for the operating conditions. The expected life to
crack initiation is 10,550 cycles, which greatly exceeds the 1,000 cycle requirement. Table 19 is a
summary of the results.
Table 19. Estimated Life Based on ANSYS Analysis (Includes Scatter Factor of 10)
LocationStress (Thermal + Pressure Loads), ksi
20 Seconds 35Seconds 50 Seconds 60 Seconds
EstimatedCritical-Area Life
(Cycles)
Location A 57.2 100 105 96.2 10,550
Location B 45.1 66 69.6 62.7 170,000
Convolution 106 77.5 45.8 29.3 13,860
Finite-Element Model - To capture the local behavior of the heat exchanger at the header-to-collar
and collar-to-manifold junctions, a detailed finite-element model with fine mesh was created (shown
in Figure 57).
Material - The heat exchanger is constructed of Inconel 625. The material properties used for
analysis, per MIL-HDBK-5G, are listed in Table 15 and illustrated in Figure 58.
Loads- The finite-element model was loaded with 354.6 psi on the air side and 1200 psi on the fuel
side with the transient temperature distribution at various intervals. The temperatures were provided
by transient gradients generated by finite-difference thermal models using the H0298 Thermal
Analyzer. They are shown in Appendix A.
Summary of Results - Stresses and estimated life at the critical areas are summarized in Table 19
and Figure 59. Stresses and temperature plots are shown in Appendix A.
3.3.5 Manufacturing
The fuel/air heat exchanger is a welded and brazed assembly. There were a number of manufacturing
challenges associated with the fabrication of the heat exchanger. Brazing of the long Inconel unit
was the biggest challenge. The brazing is performed in accordance with the contractor's internal
procedures (AES specification WBS27 using braze alloy in accordance with AMS4778). The first
major assembly that takes place in fabrication of the heat exchanger is brazing of the core assembly.
The components included in this brazed assembly are listed in Table 20.
73
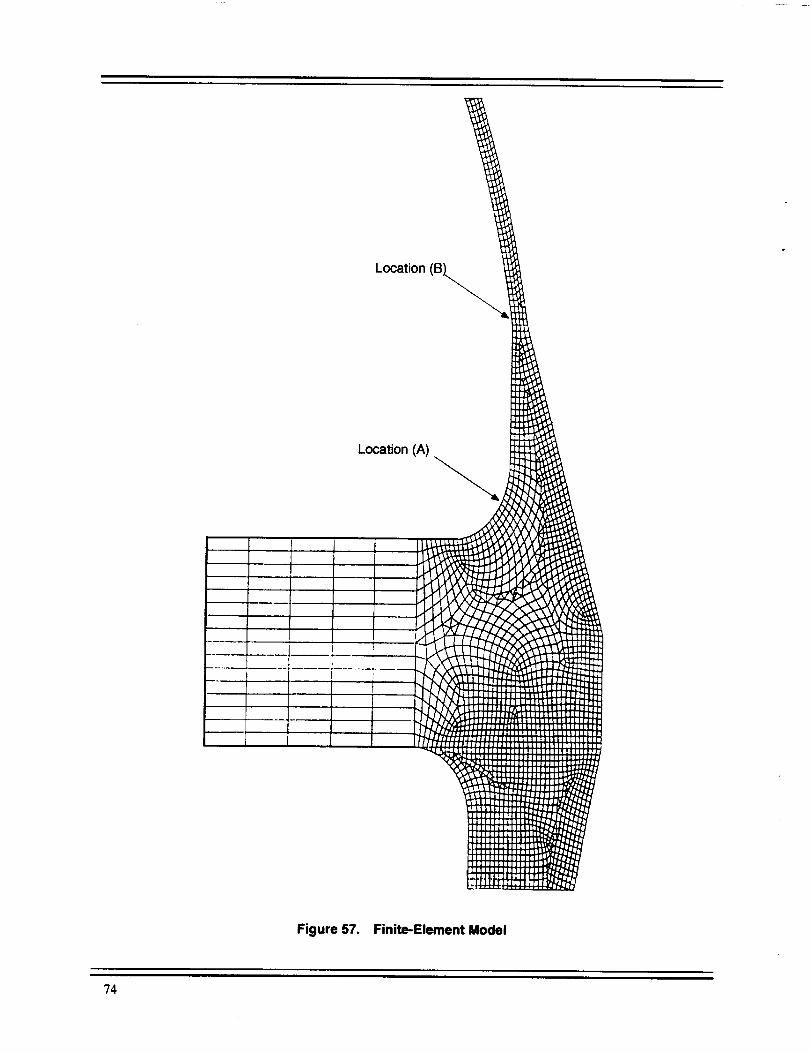
Location (B'
Location (A)
Figure 57. Finite-Element Model
?4

100
Effect of Temperature on the Tensile and CompressiveModuli (E and Ec) of Annealed Inconel 625
O
_Eo_#_
EOO
EE
80
6O
4O
20
Exposure up to 1/2 hour Typical
0 200 400 600 800 1000 1200 1400 1600
Temperature, °F
15
LL
° I
E
n_
ov
-1-O°_
O
Q.0O
Effect of Temperature on the Physical Properties of Inconel 625 Alloy
0.30
0.25
0.20
0.15
0.10
0.05
I K - At Indicated Temperature=I C - At Indicated Temperature
L _
200 400 600 800 1000
Temperature, °F
I i
1200 1400
OO
9==
85"rrl
_o
7 o
160O
Figure 58. Inconel 625 Material Properites
?5

MaximumStressat50Seconds
OneCycle >
N
1
2 x _p,%Ei _p" Plastic Strain Range
--_-_P ) _p' = D (Tensile Cyclic Ductility)
Figure 59. Cyclic Life Prediction (Manson-Halford Universal-Slope Method)
Table 20. Braze Assembly Components
Part Number Description CRy
2372587-1 Shell Assembly 1
2372589-1 Headers 2
2372592-1 Tubes 946
2372590-1 Baffles 10
2372591-1 Diverter Rails 4
2372593-1 Ring 1
Brazing occurs at the joints between the shell assembly and the headers (two places) and between
the headers and each end of the 0.125-in tubes. All other joints are unbrazed to allow thermal growth
induced by the temperature differential between the tubes and the shell at transient conditions.
Following the braze operation, the air-side manifolds and flanges are arrached via full-penetration
butt welds (AES internal weld specification WBS28).
3.3.5.1 Brazing Issues
Prior to brazing a full-scale unit, a number of braze samples were tested. These samples represented
the same tube diameter and header thickness as the full-scale heat exchanger. The objective was to
determine the optimum tube-to-header gap, the optimmum braze alloy, and the ideal orientation for
placing the full-scale unit into the furnace. All of these tests were performed in the vacuum brazefurnace.
At the conclusion of this testing, it was determined that the unit would be brazed in a two-step process
in the vertical orientation. Vertical orientation was chosen because of the tendency of the braze alloy
to run-off when brazed in a horizontal position. A generous amount of braze alloy must be applied
to ensure adequate wicking down the 0.68-in thick tube-to-header joint. Initially, use of AMS4779
76

braze alloy was considered because it offers good consistency at braze temperature. (It tends to be
thicker when melted, thereby reducing the tendency of the alloy to run through the tube/header joint
and down the length of the tubes.) However, initial braze tests indicated that AMS4779 did not flow
adequately across the surface of the header, and ability to "wick" around the tubes and form braze
fillets was inadequate. The braze testing also answered a number of other issues including:
• The smooth tube surface was not adversely effected by the braze process.
• The smooth tube surface had no effect on the ability of the braze alloy to "wick"
and adhere to the tubes to create quality braze joints.
• Although difficult, machining the 0.125-in tube holes through the 0.68-inInconel header material was achieved by initially drilling undersized and then
reaming to the final tolerance.
In the first braze, the unit is oriented with the tube-to-header joint facing upward. The lower
shell-to-header joint is alloyed using AMS4778 powder mixed with a binder to create a slurry. The
shell-to-header joints are "bridge" tack welded to hold the details in place during braze. A graphite
spacer is used at the bottom of the unit to register the tubes in proper location during braze. The unit
is then loaded into the furnace, and the furnace is ramped up to the braze temperature of 1920°F. The
same procedure is repeated with the unit oriented in the opposite direction (see Figure 60).
After the first braze of the subject unit, the brazing looked acceptable. Brazing alloy flowed nicely
in the tube-to-header and shell-to-header joints, forming the desirable braze fillets. During the
second braze, the temperature and resultant thermal expansion differential (approximately 600°F
and 0.135 inch) between the tubes and the shell produced an undesirable result. After removing the
Alloy Applied
Alloy Applied
--_ ..... I
1st Braze
Figure 60.
Flip Unit
Alloy Applied
raze Joints
Iloy Applied
Braze Joints2nd Braze
Two-Step Braze Process
77
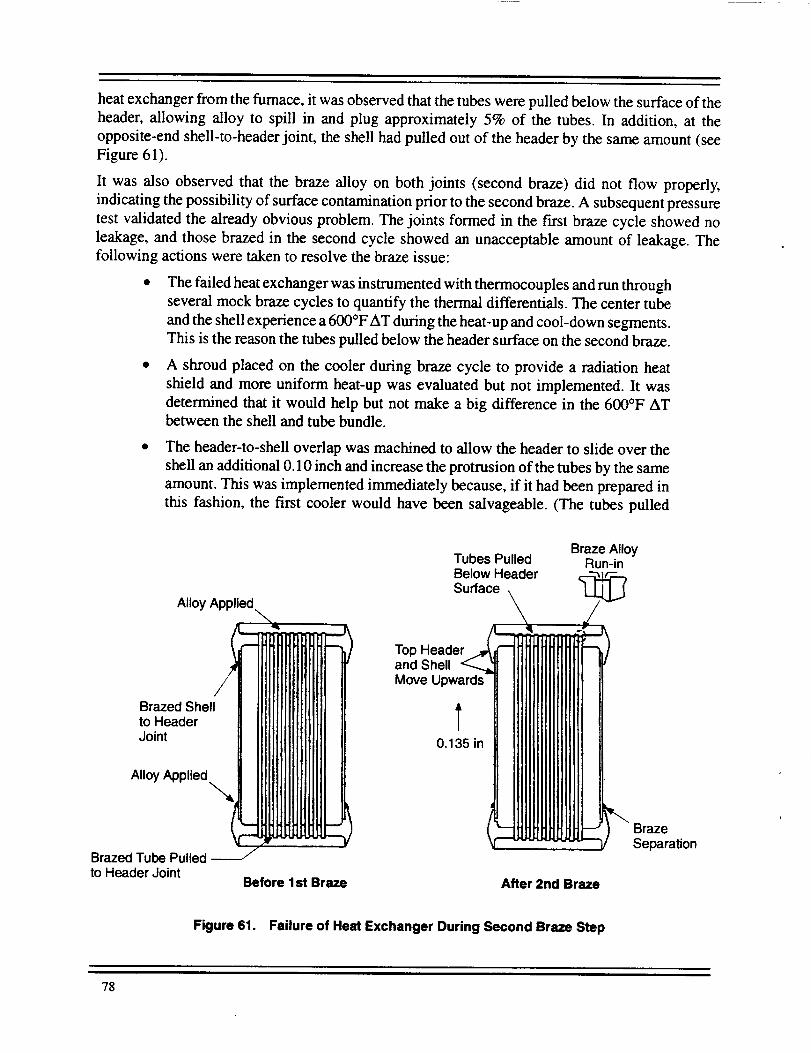
heat exchanger from the furnace, it was observed that the tubes were pulled below the surface of the
header, allowing alloy to spill in and plug approximately 5% of the tubes. In addition, at the
opposite-end shell-to-header joint, the shell had pulled out of the header by the same amount (see
Figure 61).
It was also observed that the braze alloy on both joints (second braze) did not flow properly,
indicating the possibility of surface contamination prior to the second braze. A subsequent pressure
test validated the already obvious problem. The joints formed in the fLrst braze cycle showed no
leakage, and those brazed in the second cycle showed an unacceptable amount of leakage. Thefollowing actions were taken to resolve the braze issue:
• The failed heat exchanger was instrumented with thermocouples and run through
several mock braze cycles to quantify the thermal differentials. The center tube
and the shell experience a 600°F AT during the heat-up and cool-down segments.
This is the reason the tubes pulled below the header surface on the second braze.
• A shroud placed on the cooler during braze cycle to provide a radiation heat
shield and more uniform heat-up was evaluated but not implemented. It was
determined that it would help but not make a big difference in the 600°F ATbetween the shell and tube bundle.
• The header-to-shell overlap was machined to allow the header to slide over the
shell an additional 0.10 inch and increase the protrusion of the tubes by the same
amount. This was implemented immediately because, if it had been prepared in
this fashion, the first cooler would have been salvageable. (The tubes pulled
Alloy Applied
Brazed Shellto HeaderJoint
Alloy Applied
Brazed Tube Pulledto Header Joint
Before 1st Braze
Tubes PulledBelow HeaderSurface
Top Header/_and ShellMove Upwards
0.135 in
\Braze Alloy
Run-in
,-...
After 2nd Braze
BrazeSeparation
Figure 61. Failure of Heat Exchanger During Second Braze Step
78

below the header surface and alloy was able to plug approximately 5% of the
tubes; the increased protrusion would have prevented this plugging.)
• The ramp rate was slowed, and an addition soak was included in the braze cycle
where the maximum AT occurred. A mock braze cycle indicated the double-soak
braze cycle reduced the AT by only 100°E from 600 ° to 500°E
• Hydrogen furnace brazing was investigated to take advantage of enhanced
convection and decrease the thermal lag between core components. A mock
braze cycle in the hydrogen braze furnace showed that the effect of convection
could decrease the AT between the tube bundle and shell to 225°F with a resultant
growth A of 0.06 inch.
Given the size of the unit, the thick outer shell, and the dense tube bundle, it is not surprising that
thermal lag was a challenge. After running a number of "mock" braze cycles, it was also obvious
that the hydrogen furnace presented the brazing process of choice. The unit would still undergo a
two-step process and be brazed with the same ramp-up and cool-down rates. The convective nature
of the hydrogen furnace also presented the lowest risk solution.
All three deliverable units were brazed in the hydrogen furnace. In all three cases, the units went
through an additional braze cycle above the two-step base process. This was performed to add alloy
into the shell-to-header joint. The additional braze operation was necessary due to the diameter and
the gap between the shell and header m and the fact that the amount of alloy that can be applied prior
to brazing is limited. During braze, the alloy wicks down into the joint, consuming all the alloy. An
ideal braze joint does "wick" in this manner; however, a generous braze fillet at the top of the joint
is desirable. This third braze cycle is designed to ensure this filleting. Small leaks in the tube-to-
header joints were also repaired at the same time.
3.3.6 Acceptance test
The fuel/air heat exchanger was subjected to various in-process inspections (core pressure test, x-ray
of the manifold and flange welds, workmanship, etc.) culminating in a final inspection and accep-
tance test. Final inspection included a detailed visual examination, dimensional inspection, and
review of the manufacturing history to verify prior inspections and tests. The acceptance test was
performed in accordance to the plan provided in Appendix A and included the following:
• Visual Examination
• Fuel-side proof pressure
• Air-side proof pressure and leakage
• Fuel-side internal leakage (using helium)
• Fuel-side external leakage (using helium)
• After-test examination
The three heat exchangers successfully passed the acceptance test, and (with the quality control heat
exchanger) all four units were provided to GEAE for coating application. The quality control heat
exchanger was used to verify the coating process prior to coating the three acceptable units. Two of
the heat exchangers are required for the turbocooler rig test; the third is a spare.
79

3.4 High-Temperature Fuel Injection System
The goal for integrating a high-temperature fuel system into the ACEP program is to define and
implement a technical approach that satisfies the turbocooler rig test requirements and at the same
time retains many of the F404 production fuel nozzle characteristics.
3.4.1 Design Description
Precise and highly responsive control of fuel flow is the most important aspect of the overall engine
control strategy. The fuel-delivery system for current military engines typically contains:
• A main fuel pump that pressurizes the fuel
• A bypass valve to set the metering valve AP to establish the demand fuel flow
• A fuel/oil heat exchanger to transfer lube oil heat load
• A pressurizing valve at the head of the combustor fuel nozzle assembly to
maintain the pressure in the fuel manifold (prevents leakage at shutdown and
minimizes ignition delay at engine start-up)
Gas turbine combustors must supply uniformly mixed hot gases to the turbine while providing stable
and efficient operation over a wide range of operating conditions and must be capable of starting and
accelerating the engine. To satisfy the combustor requirements, typical pressure-atomizing fuel
nozzle designs employ a dual fuel circuit. The primary circuit is for low-power/starting operation.
The secondary circuit opens (via the flow-divider valve), when the fuel system pressure is increased,
to provide good fuel atomization at high-fuel-flow operating conditions. The primary and secondary
circuits both contain spin chambers that swirl the liquid fuel and produce fine spray after the fuel
passes through the final orifice. Modern fuel-delivery systems are designed to maintain fuel temper-
atures below 300°F. To accommodate the high-temperature fuel (>900°F) associated with the
turbocooler rig test, a production F404 full-annular fuel injection system was modified. Four funda-
mental issues dictated the fuel injection system modifications:
I. Fuel vaporization due to the increased fuel temperature
2. Fouling due to fuel deposition
3. Complications associated with particulates suspended in the fuel
4. Thermal stresses
3.4.1.1 Vaporization and Fuel System Pressure
Fuel system pressure must be sufficient to provide acceptable fuel atomization and eliminate the
adverse effects of vaporization in the fuel nozzle. To avoid vaporization within the fuel system, the
pressure level should be maintained above the fuel vapor pressure. The vapor curve for JP-5 fuel
is illustrated in Figure 62. If the fuel condition is below the vapor pressure curve (to the right-hand
side), vaporization is likely. Once the critical pressure is achieved (330 psia), the fuel is supercritical
and will no longer vaporize, although fuel density will continue to decrease with temperature.
Vaporization is a key concern in the secondary fuel passage because, at low-fuel flow conditions,
the secondary circuit fuel pressure is established primarily by the combustor operating conditions.
The problems associated with two-phase flow are:
80

60O
•_ 500Q..
_ 400
_- 3oo
Q.
¢ 2oo
100
VaporizationUnlikely
400 500Temperature °F
J
Vaporization Likely
0 1O0 200 300 600 700 800 900 1000
Figure 62. JP-5 Vapor Pressure as a Function of Temperature
• Maldistribution of fuel flow in the fuel manifold leading to nonuniform flow tothe fuel nozzles
• Combustor instability associated with the large density changes
• Inability to predict and reproduce heat transfer and AP characteristics in the heat
exchanger
At low-altitude/high-power flight conditions, combustor operating pressure is typically above criti-
cal pressure for JP-5, so vaporization is less likely. At high-altitude, low-power conditions, the
combustor operates below critical pressure, and fuel vaporization may be an issue.
A dynamic simulation representing the turbocooler/F404 engine system was developed to evaluate
and define an acceptable rig test envelop in order to avoid potential vaporized fuel conditions. The
model includes detailed component representations (ACM, heat exchangers, fuel-delivery compo-
nents, and fuel nozzles), complete fuel and air thermodynamic properties, and was integrated with
a dynamic engine model.
Fuel system pressure is set by the combustor operating pressure plus the pressure drop across the
fuel nozzle. The F404 engine uses pressure-atomizing fuel nozzles designed with small orifices and
consequently large pressure drops across the fuel nozzle (approximately 500 psid at maximum
flow). Contributing to the overall fuel nozzle pressure drop is the flow-divider valve and the
secondary tip orifice. As the turbocooler heats the fuel, the density of the fuel will decrease dramati-
cally as shown in Figure 63.
The reduction in fuel density directly affects the overall fuel nozzle pressure drop characteristic due
to the increase in the volumetric flow rate. The effect of fuel temperature on the production F404
fuel nozzle flow characteristic is illustrated in Figure 64. If the fuel nozzle flow-through areas are
not increased to accommodate the volumetric flow as temperature increases, fuel system pressure
becomes excessive. The goal was to keep the maximum fuel system pressure under 1200 psia due
to the heat exchanger design limitations and also to avoid vaporization.
A detailed analytical model of the fuel nozzle was created and integrated into a turbocooler transient
simulation. Predicted fuel nozzle pressures, temperatures, and vaporization margins were observed
81

E..O
z_
c-
a
00 .50 I
4O I - _'-m--
3O
2O
10--
ISaturated Liquid
Saturated Gas
, _. _. _. A ,l . . . •
0 250
-i--
--o--
--o--
-l--
_-___,_i= =_=____ 1000 psiai m m m mmm m i _ m N--i--m m -- --/
- --- 100 psia
1500
Saturated100psia Liquid300 psia
400 psia
500 psia
600 psia
700 psia
1000 psia
Saturated Gas
500 750 1000 1250
Figure 63. Fuel Density as a Function of Temperature
EJ_
0
z
t_
LL
LL
8OO
700
600
5OO
400
30O
200
100
00
/Test
Range /?
///
• _ •
/ J
___ln/ TermepeSringFuel
200 400 600 800 1000 1200 1400
Delta Pressure, psid
Fuel Temperature
--_-- 80OF
--B-- 300°F
---)le- 500OF
700OF
800°F
900OF
Figure 64. F404 Fuel Nozzle (Baseline) Flow Characteristic Versus Fuel Temperature
during operations throughout the flight envelope in order to identify potential concern areas in the
flight envelope, define operational boundaries for the rig demonstration test, and analytically evalu-
ate potential modifications to the fuel nozzle. The fuel nozzle performance characteristics for a
sea-level static power hook (or full throttle movement) are presented in Figure 65. As the engine
power level angle (PLA) is increased from 40 to 102 (military power), the pressure in the combustorand fuel nozzle circuits increases.
82

E.o
N0z
Q_
o
600
550
5OO
450
400
350
300
250
200
150
1O0
5O
0
-- Flow Number =
PLA = 102
1000.X
900
800
7O0
60O
5OO
4OO
3OO
20O
100
01400
•4- Manifold Pressure
- l- - Secondary Circuit PressureP4 (Combustor)
Vapor Pressure- - * - - Fuel Temperature
Critical Pressure
0 200 400 600 800 1000 1200Pressure, psia
3'13
E"
-I"1
Figure 65. F404 Fuel Nozzle Flow Characteristic Over a Sea-Level Static Throttle Hook
The estimated turbocooler fuel temperature is also shown on Figure 64. The objective of the fuel
nozzle modifications is to always maintain fuel system pressure above the fuel vapor pressure and
above the fuel critical pressure (Pc = 334 psia), when the fuel temperature exceeds 770°F, but to limit
the maximum fuel pressure below 1200 psia in the fuel manifold and heat exchangers.
A similar fuel nozzle performance analysis is presented in Figure 66 for the altitude power hook
condition (30,000 ft, Mach 0.9). By varying the fuel nozzle slot sizes in the secondary spin chamber
and in the flow divider valve, a final overall flow number of 80 or 76 was selected for the final fuel
nozzle configuration.
3.4.1.2 Suspended Fuel Particulates
Regular petroleum distillate fuels, when heated, may undergo chemical changes that precipitate
solid matter, depending on fuel quality and the conditions of heating. Carbon-bamer coating will
be used to prevent adhesion of deposits to the surfaces of the tube walls. Narrow passages and
stagnant regions where suspended particulate might accumulate should be avoided downstream of
the heat exchangers. The flow divider valve, made of 440C for erosion resistance, is an underfeed,
spring-loaded, spool-and-sleeve assembly calibrated to distribute the fuel uniformly as a function
of fuel manifold pressure and combustor pressure. The spool-and-sleeve assembly is a matched setwith clearances on the order of 0.0003 to 0.0005 inch. The flow divider valves are located in the fuel
nozzle bodies downstream of the fuel/air heat exchangers but outside of the main engine air stream.
In this region, no additional heat load is applied to the fuel. Due to the lack of additional heat load,
fuel deposits were not considered an issue. From the onset of the program it was decided that a
high-temperature fuel filter would be installed downstream of the heat exchangers to protect the fuel
injectors and flow-divider valves from the potential problems of suspended particulates. In related
83
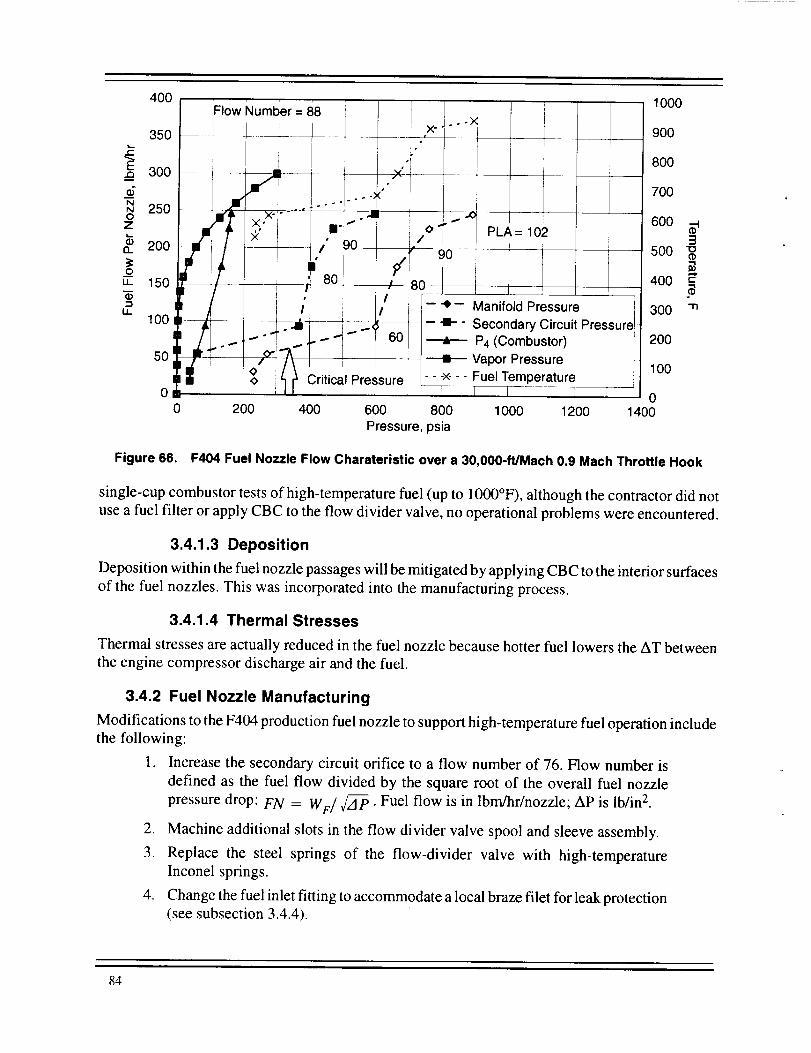
e'_
_o"NN0z
ou_
i1
400
350
300
250
200
150
1O0
5O
0
'Flow Number = 88
t
o PLA = 102
!- -e- Manifold Pressure
Critical Pressure
0 200 400 600 800 1000 1200Pressure, psia
1000
900
8O0
70O
60O
5O0
40O
300
20O
100
01400
3"1o
@E"@"1"1
Figure 66. F404 Fuel Nozzle Flow Charateristic over a 30,000-ft/Mach 0.9 Mach Throttle Hook
single-cup combustor tests of high-temperature fuel (up to 1000°F), although the contractor did not
use a fuel filter or apply CBC to the flow divider valve, no operational problems were encountered.
3.4.1.3 Deposition
Deposition within the fuel nozzle passages will be mitigated by applying CBC to the interior surfaces
of the fuel nozzles. This was incorporated into the manufacturing process.
3.4.1.4 Thermal Stresses
Thermal stresses are actually reduced in the fuel nozzle because hotter fuel lowers the AT between
the engine compressor discharge air and the fuel.
3.4.2 Fuel Nozzle Manufacturing
Modifications to the F404 production fuel nozzle to support high-temperature fuel operation includethe following:
1. Increase the secondary circuit orifice to a flow number of 76. Flow number is
defined as the fuel flow divided by the square root of the overall fuel nozzle
pressure drop: FN = WF/dv/-_ • Fuel flow is in lbm/hr/nozzle; AP is lb/in 2.
2. Machine additional slots in the flow divider valve spool and sleeve assembly.
3. Replace the steel springs of the flow-divider valve with high-temperature
Inconel springs.
4. Change the fuel inlet fitting to accommodate a local braze filet for leak protection(see subsection 3.4.4).
84
5. Apply CBC to the fuel nozzle support surfaces (the flow-divider valve will be
uncoated).
6. Install a high-temperature fuel filter downstream of the fuel/air heat exchangers
to preclude the potential adverse effects of suspended particulates.
An updated drawing, including modified fuel fitting, of the high-temperature fuel nozzle is pres-
ented in Figure 67. Photographs of a modified flow divider spool piece are presented in Figures 68
and 69. The top spool piece in Figure 67 shows the normal production valve slot. The bottom spool
piece in Figure 68 shows the increased-flow slot in the same radial location. Two of these slots are
located on each spool piece 180 ° apart. Figure 69 shows the added slot located 90 ° from the normal
production slot. Two auxiliary slots were added to the spool piece (total of four slots per spool piece).
3.4.2.1 Application of CBC to the Flow-Divider Valve
Two risks were associated with applying CBC to the flow-divider valve. The initial concern was over
fuel deposits in the region. The contractor's test experience indicated that areas in the system without
heat addition to the fuel are less susceptible to fuel deposits. Since the flow-divider valve is located
outside the main engine air stream, this risk was judged acceptable; fuel deposits would not likely
form at the valve location. Also, the use of a fuel filter downstream of the fuel/air heat exchangers
eliminated the concern over suspended particulates getting trapped on the valve sliding surfaces.
The second risk concerned the effect of the coating process on the current production valve material
(CRES 440C). The coating application temperature is high enough that valve material, which is
normally hardened to a RHc of 55-60 for wear/galling resistance, is annealed and the hardness
reduced to RHc 38-40. The failure mode for a valve with softer material properties is potential
galling of the two sliding units as a result of material deformation in the spool and essentially locking
the valve in a fixed position. Switching the valve material, for example to lnconel 718, would
mitigate the hardness-reduction associated with the coating process. However, Inconel 718 is not
used in any of contractor's fuel nozzles and would require some additional development. In addition,
the potential dimensional changes of the flow-divider valve spool and sleeve assembly as a result
of the coating process (either thermally induced or as a result of the coating thickness) created
assembly problems: the spool would not fit correctly into the sleeve. The dimensional clearances
on the spool and sleeve assemblies are small (0.0003 to 0.0005 inch on the diameters) and are
processed as matched sets. One alternative would be to increase the clearance to account for the
thermal-induced dimensional changes and coating thickness. Launching a flow-divider valve devel-
opment (either new materials or optimizing clearances) was outside the scope of the program.
To better understand the issues associated with coating the flow-divider valves, a simple endurance
cycle test was performed with contaminated fuel on a coated fuel nozzle valve cartridge. Similar data
were already available on the production flow-divider valve. Prior to the test, the valve (CRES 440C
material) was modified/machined to account for the additional coating thickness. The coated valve
cartridge was assembled into a fuel nozzle support and exposed to 5000 cycles that ranged from a
low-pressure of 0 to 50 psig (valve closed) to a high pressure of 350 to 400 psig (1000 lb/hr to
simulate valve full-stroke). The fluid (ambient temperature) is the typical media used to perform
accelerated life testing in the design assurance phase of new fuel nozzle designs. The acceptance
criteria for the assembly was a comparison of the flow rate between a pretest flow and a posttest flow
plus visual examination. After 5000 cycles, there was essentially no flow difference between the
pretest flow recordings and the posttest flow recordings. Upon visual examination of the valve
85

:I:_
Figure 67. High-Temperature Fuel Nozzle Drawing
86

Figure 68. Modified Flow Divider Valve Figure 69. Modified Flow Divider Valve:Additional Slot
cartridge spool and sleeve, the only notable finding was a discoloration on the spool. This discolor-
ation appears to be the result of the mechanical forces of the spool sliding inside the sleeve, or the
abrasive effects of the contaminated fluid flowing past this surface, or a thinning of the CBC. These
results indicate that the coated valve cartridge could perform adequately for the test program. In
related high-temperature fuel single-cup combustor testing, no operational issues were encountered
with uncoated flow divider valves or by not using a fuel filter. The potential for less than optimum
clearances and softening of the valve material leading to potential valve failure prompted the
decision not to coat the valve cartridge.
Standard vendor processes were used in fabrication/assembly of the fuel nozzles. The only excep-
tion was that CBC was applied to the fuel nozzle support (everything but the flow-divider valve)
prior to installation of the flow-divider valve and welding of the cap piece. Twenty-four fuel nozzles
were manufactured: 18 required for the F404 full-annular combustor plus spares.
3.4.3 Fuel Nozzle Acceptance Test
Each fuel nozzle was subjected to a four-point flow check (including hysteresis at 225 psig) and a
six-port patternation test. Fuel nozzle patternation accuracy is a measure of the nozzle spray pattern
or cone shape and is defined as the maximum flow sector minus the minimum flow sector divided
by the maximum flow sector. The fuel nozzle acceptance test data are presented in Table 21. Note
that 3 of the 24 nozzles are slightly outside the production patternation limit of 30%. This is
attributed to opening up of the secondary flow slots to accommodate the increased volumetric flow
requirements.
In related high-temperature, single-cup combustor testing (funded by a complementary program),
the final ACEP fuel nozzle configuration was successfully tested. The fuel nozzle flow-divider valve
was uncoated, and no fuel filter was used to capture suspended particulates. Fuel temperatures up
to 1000°F were evaluated at combustor operating conditions exceeding the planned ACEP test
conditions. There was no discernible change in combustor operation between cold and hot fuel. The
only notable difference was a 50°F increase in the tip of the combustor venturi with hot fuel.
87

Table 21. Fuel Nozzle Acceptance Test Flow Rates (Ibm/hr)
TestPoint
1: A91691
2: A94230
3: A96160
4: A91626
5: A91125
6: A90110
7: A70141
8: A95640
9: A96095
10: A92957
11 : A90063
12: A95959
13: A71072
14: A91265
15: A90284
16: A83567
17: A90019
18: A93681
19: A95411
25
9.47
9.4
9.7
9.4
9.8
9.3
9.7
9.4
9.4
9.03
9.2
9.08
9.2
9.7
9.2
9.2
9.2
9.7
9.5
20: A90574 9.6
21: A90199 9.6
22: A87195 9.8
23: A71140
24: A90999
Average
Low Tolerance
High Tolerance
9.2
9.6
9.54
9.0
10.0
Inlet Fuel Pressure, psi
600225 350
280 707
279 707
288 728
286 719
272 713
292 700
283 694
285 726
268 719
270 701
282 685
284 720
287 718
280 704
272 707
288 712
274 704
271 700
280 711
275 706
272 707
277 710
277 713
281 718
280.5 712.5
266.5 684.0
294.5 741.0
1226
1242
129O
1278
1264
1225
1220
1292
1263
1249
1199
1287
1272
1256
1257
1264
1257
1242
1263
1268
1267
1262
1264
1264
1245
1195.2
1294.5
Hysteresis
(& Flow)
2.5
2.2
0.3
1.1
0.5
3.7
1.2
0.3 24
0.1 20
2.4
0.5
1.6
2.1
0.5
2.9
0.1
Patternation
(%)
15
17
25
17
19
28
29
21
15
31
29
32
26
29
1.9 33
1.4 26
2.5 9
0.9
2.7
0.5
0.1
2.7
15
24
28
27
8
During single-cup combustor testing, thermocouples were installed at three axial locations on the
venturi (see Figure 70) to evaluate flash-back and autoignition issues. The outside of the venturi is
covered in counterswirling combustor inlet air. The inside of the venturi is bathed in fuel exiting
from the fuel nozzle. During hot-fuel operation, the aft section of the venturi was approximately
50°F hotter. This result was expected and did not pose any risk to the integrated rig test.
88
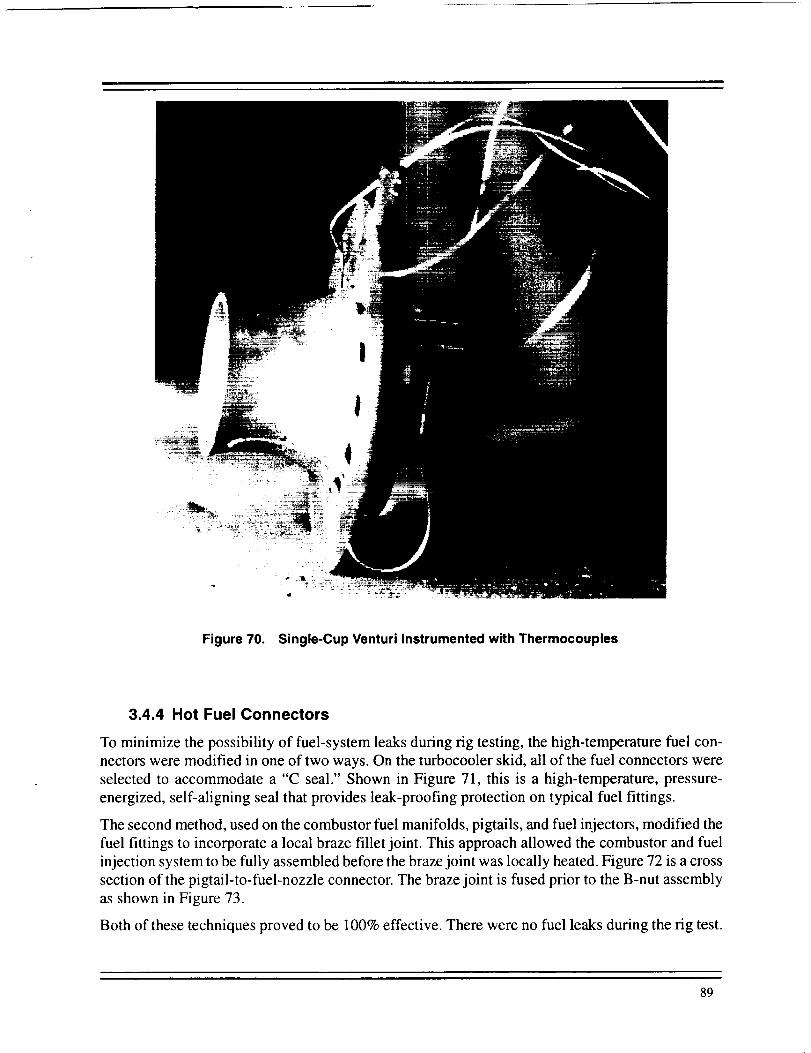
Figure 70. Single-Cup Venturi Instrumented with Thermocouples
3.4.4 Hot Fuel Connectors
To minimize the possibility of fuel-system leaks during rig testing, the high-temperature fuel con-
nectors were modified in one of two ways. On the turbocooler skid, all of the fuel connectors were
selected to accommodate a "C seal." Shown in Figure 71, this is a high-temperature, pressure-
energized, self-aligning seal that provides leak-proofing protection on typical fuel fittings.
The second method, used on the combustor fuel manifolds, pigtails, and fuel injectors, modified the
fuel fittings to incorporate a local braze fillet joint. This approach allowed the combustor and fuel
injection system to be fully assembled before the braze joint was locally heated. Figure 72 is a cross
section of the pigtail-to-fuel-nozzle connector. The braze joint is fused prior to the B-nut assembly
as shown in Figure 73.
Both of these techniques proved to be 100% effective. There were no fuel leaks during the rig test.
89
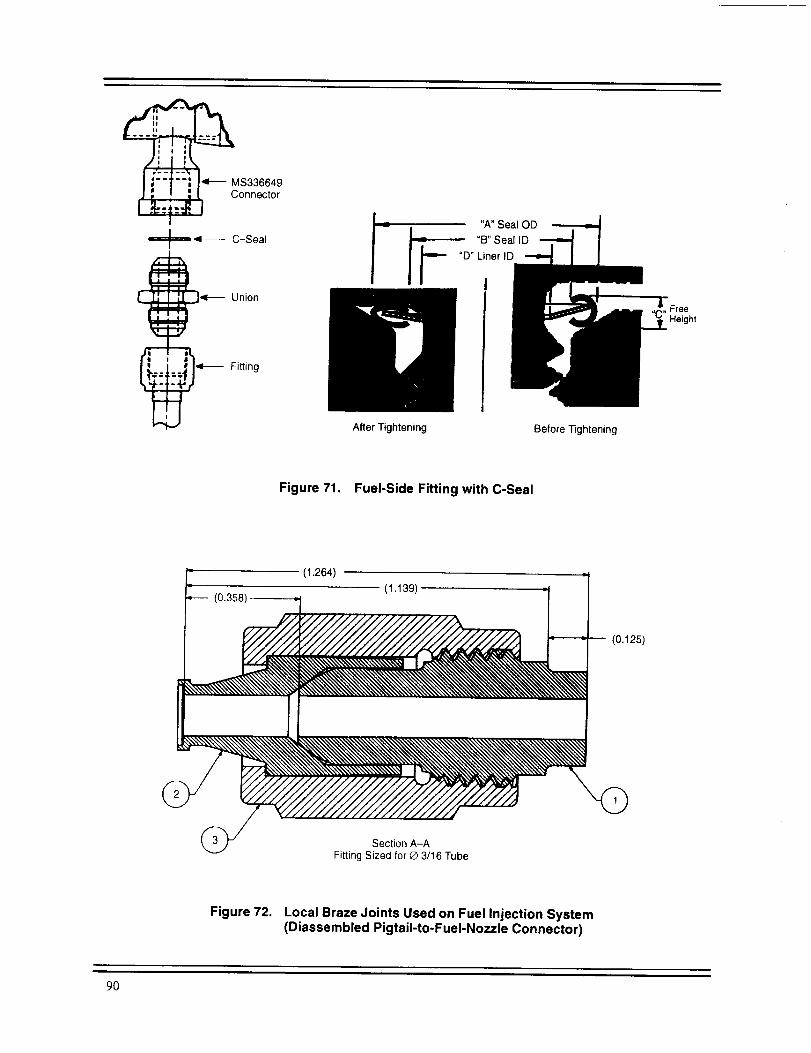
I
C-Seal
_ Union
q_--_ Fitting
After Tightening Before _ghtening
FreeHeight
Figure 71. Fuel-Side Fitting with C-Seal
(1.264)f- (1.139) -I
(0.35__ = :- , (0.125)
E
Section A-A
Fitting Sized for _ 3/16 Tube
Figure 72. Local Braze Joints Used on Fuel Injection System
(Diassembled Pigtail-to-Fuel-Nozzle Connector)
9O
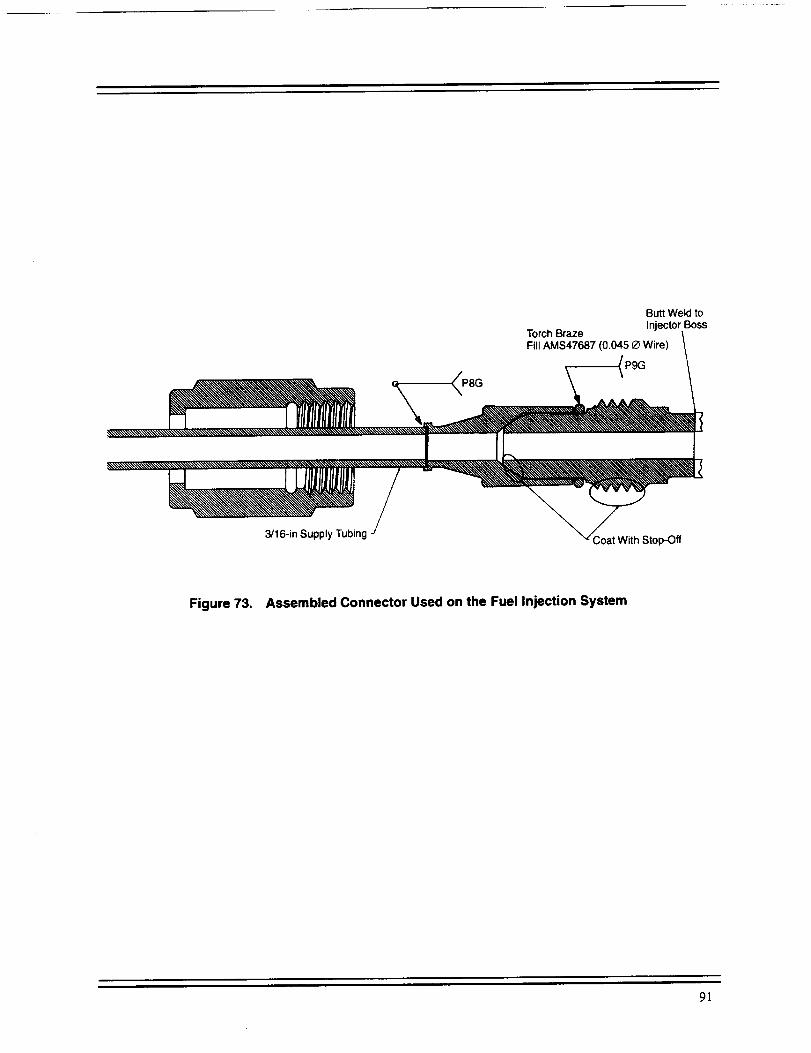
Torch Braze
Fill AMS47687 (0.045 _ Wire) \
, (_P8G
/3/16-in Supply Tubing J x,,z/ ......... _, r_,Coat With Stop-Off
Butt Weld toInjector Boss
Figure 73. Assembled Connector Used on the Fuel Injection System
91

4.0 Turbocooler System Rig Test
4.1 Test Setup and Procedures
The objectives of the test program are to verify the technical feasibility and performance of the
turbocooler and the F404 full-annular combustor system arranged in an exhaust nozzle cooling-
mode configuration. Key figures of merit for the primary system components are:
1. Combustor performance with both cold and hot fuel operation
• Efficiency
• Exit temperature profile
• Liner, dome, and venturi metal temperatures
• Dynamic pressure characterization
• Fuel nozzle operation (modified F404)
• Emissions (secondary objective)
2. Air cycle machine performance
• Efficiency
• Operability
• Air bearing operation and cooling
3. Heat exchanger performance
• Effectiveness
• Air-side AP
• Fuel-side AP
• Hot-fuel filter AP
• Coating effectiveness
4.1.1 Test Approach
The test approach to accomplish the program objectives is illustrated in the test flow chart (Figure
74). The prime objectives for each phase are summarized as follows:
Phase A - Conduct a combustor facility functional checkout. The combustor test rig and facility are
evaluated before any fired tests occur. The objective of the checkout runs is to verify the integrity
of the facility and combustor hardware before any fired testing. These tests also blow-down the
facility -- minimizing the potential for foreign-object damage to the ACM. These checkout runs
first provide airflow to the combustor at the maximum operating pressure, unheated, and without
the fuel delivered to the combustor (unfired). Next, airflow is supplied to the combustor rig at high
temperature and high pressure with the combustor unfired.
Phase B - Conduct low-power combustor mapping, at SLS and 30,000-ft/Mach 0.9 power-hook test
points with cold fuel.
92

Phase A
FunctionalCheckout
FunctionalCheckout
Phase B
Cold FuelCombustor Mapping
Phase C
Initiate TurbocoolerOperation
Hot Fuel
Phase D
Hold
_High-Pressure, Cold Airto CombustorUnfired / Blowdown
High-Pressure, Hot Airto CombustorUnfired
Low / High-Power CombustorCold Fuel
Low / High-Power CombustorHot Fuel
High / Intermediate CombustorPower SettingHot Fuel
High / LowCombustor PowerHot Fuel
Low / High-Power CombustorCold Fuel
I Terminate Combustor
Operation
Phase E
Combustor MappingHot Fuel
Phase F
Terminate TurbocoolerOperationCold Fuel Mapping
Figure 74. NASA ACEP Test FIow Chart Turbocoolertestplanbeginswithunfiredcombustorcheckout
and proceeds to cold-fuel mapping and turbocooler operation (hot fuel).
Phase C - Initiate turbocooler operation and map the turbocooler system in a similar manner as
Phase B (with hot fuel). Turbocooler operation will be initiated at low to intermediate power levels.
Phase D - Hold steady-state conditions with the turbocooler operating (hot fuel).
Phase E - Conduct combustor and turbocooler performance mapping with hot fuel.
Phase F - Conduct combustor performance mapping with cold fuel.
4.1.2 Test Point Conditions and Operating Procedures
The planned test point conditions are listed in Table 22.
93

Table 22. Planned Test Point Conditions
Test Cycle Air Flow (pps)Test
Point TT30A I PTcom Facility, Bleed, Combustor,
(°F) J (p$ia) WAmain WAACM WAcomi
Phase B - Cold-Fuel Combustor Mapping
100 650 90
101 650 125
1011 650 117
102 650 125
102 650 141
103 750 139
104 750 186
105 750 227
106 860 164
107 860 170
108 860 275
30.9 0 24.7
36.7 0 29.3
36.7 0 29.3
36.7 0 29.3
46.7 0 37.3
42.1 0 33.6
58.8 0 46.9
69.1 0 55.1
47.8 0 38.1
48.2 0 38.5
80.5 0 64.2
Phase C - Hot-Fuel Combustor Mapping
200 650 90 31.3
201 650 117 39.7
202 650 141 49.4
203 750 139 44.6
204 750 186 62.8
205 750 227 72.8
206 860 164 52.0
207 860 170 51.6
208 860 275 86.3
Phase D - Hot-Fuel Hold Condition
300 I 750 1227 I 72.8
1.5 23.8
2.0 30.1
2.7 37.3
2.5 33.6
3.0 47.7
3.8 55.1
3.2 38.9
3.3 38.5
4.8 65.0
ACM Inlet, ACM Exit,WF36MV PT$1AA Pcncrl PT92AA Estimated
(pph) (psia) (psia) (psia) Tfuk_x(°F)
1633 Amb.
2070 Amb.
2455 Amb.
2070 Arab.
2593 Arab.
3148 An'lb.
3750 Amb.
4944 Arab.
4075 Amb.
4435 Arab.
6604 Arab.
Arab.
Amb.
Amb.
Amb.
Amb.
Amb.
Amb.
Amb.
Amb.
Arab.
Amb.
1685 65.3 41
2455 86.0 48
2593 105.8 56
3148 104.8 56
3750 122.0 58
4944 152.3 69
4075 131.3 70
4435 140.5 74
66O4 196.1 85
3.78 55.1 4944 I 152.3 I 69
Phase E - Post Endurance Hot-Fuel Combustor Mapping - Repeat 200 Series Points
49.4 2.7 37.3
86.3 4.8 65.0
86.3 4.1 65.6
86.3 3.4 66.1
86.3 2.6 66.8
86.3 1.9 67.4
2593
6604
6604
6604
6604
6604
105.8 56
196.1 85
156.0 75
130.0 65
105.0 55
79.0 45
400 650 141
401 860 275
450 860 275
451 860 275
452 860 275
453 860 275
Phase F- Post EnduranceCold Fuel CombustorMapping - Repeatl00Serms Points
500 650 141 48.7 0 37.3 2593 Amb.
501 650 141 48.7 0 37.3 2830 Amb.
502 860 275 80.5 0 64.2 6604 Amb.
503 860 275 80.5 0 64_ 7120 Amb.
Amb.
Arab.
Arab.
Amb.
Amb. 100
Amb. 100
Amb. 100
Amb. 100
Amb. 100
Amb. 100
Amb. 100
Arab. 100
Arab. 100
Arab. 100
Am b. 100
24.4 708
28.3 778
38.8 728
31.9 822
38.6 811
44.4 832
37.3 864
37.5 906
53.1 869
44.4 832
38.8 728
53.1 869
53.1 740
53.1 614
53.1 469
53.1 334
Arab. 100
Amb. 1O0
Arab. 100
Arab. 100
94
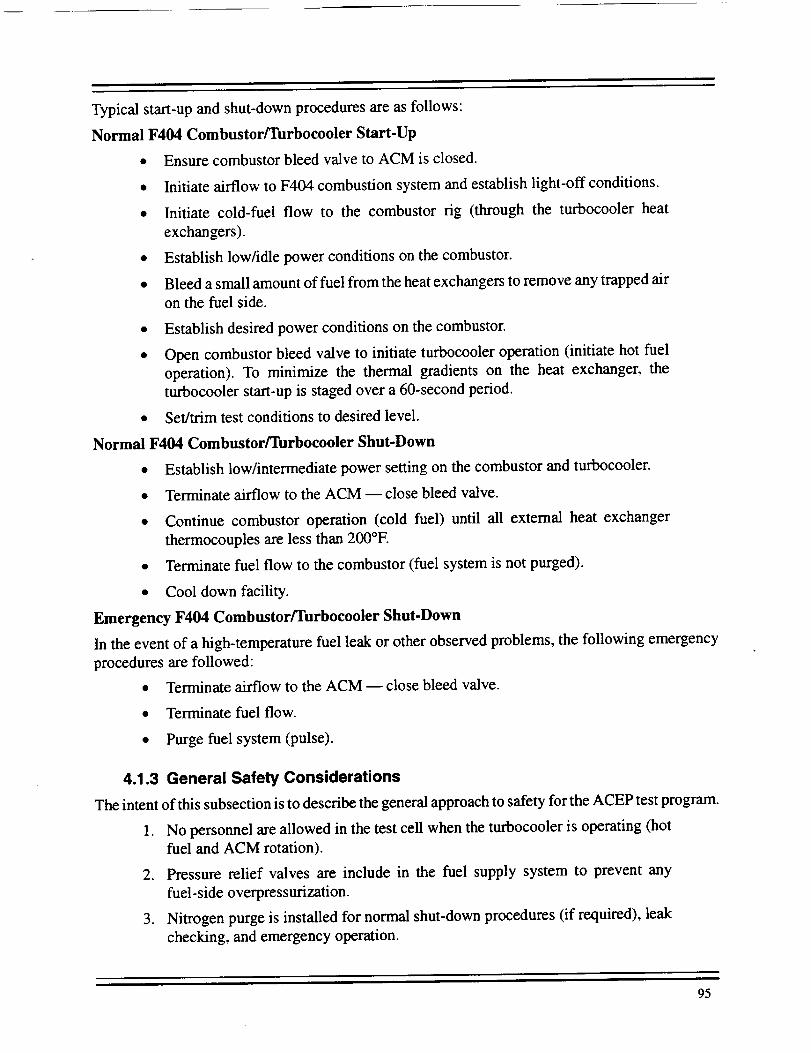
Typical start-up and shut-down procedures are as follows:
Normal 17404 Combustorfrurboeooler Start-Up
• Ensure combustor bleed valve to ACM is closed.
• Initiate airflow to F404 combustion system and establish light-off conditions.
• Initiate cold-fuel flow to the combustor rig (through the turbocooler heat
exchangers).
• Establish low/idle power conditions on the combustor.
• Bleed a small amount of fuel from the heat exchangers to remove any trapped airon the fuel side.
• Establish desired power conditions on the combustor.
• Open combustor bleed valve to initiate turbocooler operation (initiate hot fuel
operation). To minimize the thermal gradients on the heat exchanger, the
turbocooler start-up is staged over a 60-second period.
• Set/trim test conditions to desired level.
Normal F404 Combustor/Turbocooler Shut-Down
Establish low/intermediate power setting on the combustor and turbocooler.
Terminate airflow to the ACM -- close bleed valve.
Continue combustor operation (cold fuel) until all external heat exchanger
thermocouples are less than 200°E
• Terminate fuel flow to the combustor (fuel system is not purged).
• Cool down facility.
Emergency F404 Combustor/Tnrbocooler Shut-Down
In the event of a high-temperature fuel leak or other observed problems, the following emergency
procedures are followed:
• Terminate airflow to the ACM -- close bleed valve.
• Terminate fuel flow.
• Purge fuel system (pulse).
4.1.3 General Safety Considerations
The intent of this subsection is to describe the general approach to safety for the ACEP test program.
1. No personnel are allowed in the test cell when the turbocooler is operating (hot
fuel and ACM rotation).
2. Pressure relief valves are include in the fuel supply system to prevent any
fuel-side overpressurization.
3. Nitrogen purge is installed for normal shut-down procedures (if required), leak
checking, and emergency operation.
95
4. All ACEPturbocoolercomponentsareanchoredto preventanymovementorshifting that might contributeto a leak. The turbocooler skid is designed to
accommodate thermal growth.
5. Valves are designed for fail-safe operation on loss of power. The combustor bleed
valve fails close, terminating the turbocooler operation. The back-pressure valve
fails close, terminating the turbocooler operation. A flow-measuring orifice in
the ACM turbine discharge line is sized to prevent ACM overspeed.
6. Operating limits are established on critical parameters to provide early warning
of potential problems.
7. Leak and fire detection devices (CO and HC sensors) are installed and
continuously monitored.
8. The local CO2 deluge system is installed near the turbocooler skip to augment
cell deluge. The local CO2 deluge does not bypass the normal cell CO2 system.
9. The fuel system, including the heat exchangers, is leaked-checked each day prior
to testing.
10. Video cameras monitor critical hardware. At a minimum, cameras are located on
both sides of the combustor rig, viewing the fuel manifold, and one camera onthe turbocooler skid.
4.2 Turbocooler Performance and Test Results
Test demonstration of the turbocooler systems and the F404 combustor with the turbocooler system,
configured in an exhaust nozzle cooling mode, was successful. A maximum fuel temperature of
732°F was achieved along with subcooled cooling air as low as -7°E A heat sink capacity of 360Btu/s was achieved with conventional JP fuel. The turbocooler and F404 combustor demonstrated
safe, stable operation throughout the operating range of this study. There was no observed change
in combustor operation with hot or cold fuel and no evidence of combustor instability, flashback,
or any change in the combustor exit temperature profile. Observed performance levels of the
primary components, air cycle machine, heat exchangers, and fuel injection system, agreed with
predicted levels. Heat exchanger and fuel injector performance was on target, and the units were
visually clean at the end of the test.
4.2.1 Turbocooler Performance
The first two test runs were associated with the system shakedown and checkout, primarily focusing
on the combustor rig. Detailed descriptions of the operational procedures and test instrumentation
are provided in Section 4.3. There were some unexpected problems getting started: power outages
and community-wide power curtailment. Critical instrumentation problems were identified during
this time and corrected. Control and safety valves were cycled, and positions were checked. The
combustor discharge rake assembly was successfully rotated. Data analysis programs were updated.
During run 3, cold-fuel combustor mapping was initiated. Combustor operability with the modified
fuel injectors was as expected relative to lightoff capability, stability, emissions, and temperature
profiles on the combustor liners and at the combustor discharge plane. At test point 106, reference
Table 22 (page 94), the packing material (rope seals) that help form air seals on the combustor rig
modules disintegrated and had to be reapplied to plug several leaks.
96
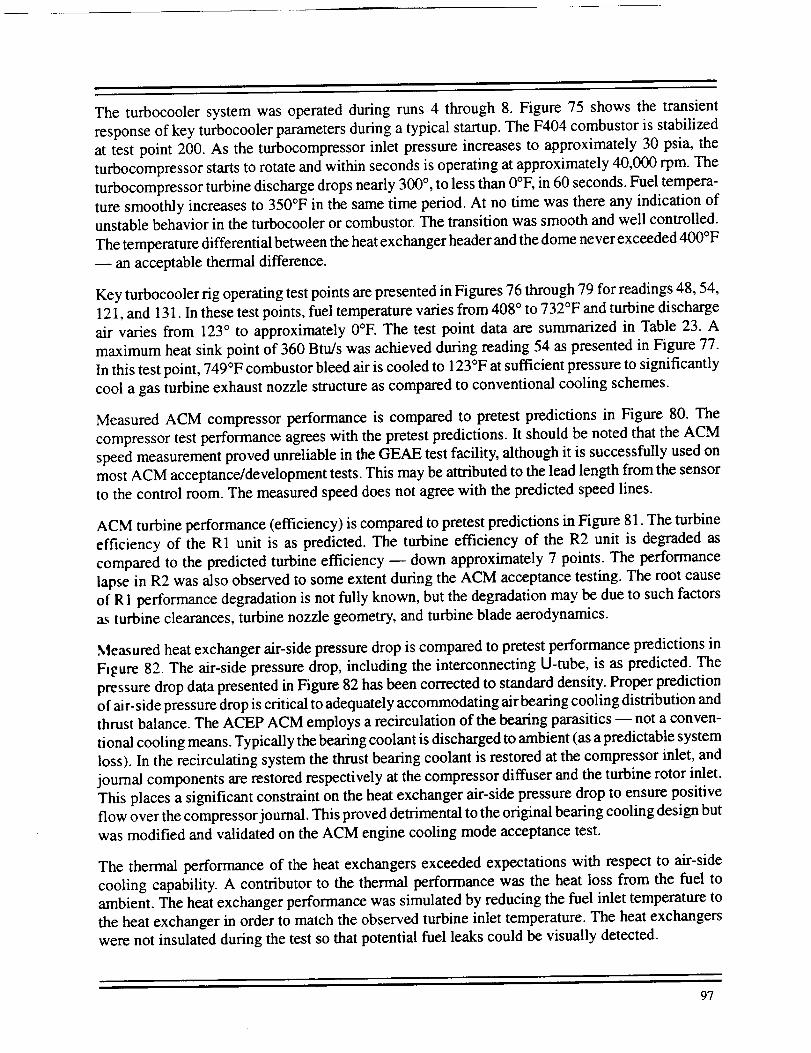
The turbocoolersystemwasoperatedduring runs 4 through 8. Figure 75 showsthe transientresponseof keyturbocoolerparametersduringatypical startup.TheF404combustoris stabilizedat testpoint 200.As the turbocompressorinlet pressureincreasesto approximately30 psia,theturbocompressorstartsto rotateandwithin secondsisoperatingatapproximately40,000rpm.Theturbocompressorturbinedischargedropsnearly300°, tolessthan0°E in 60seconds.Fueltempera-ture smoothly increases to 350°F in the same time period. At no time was there any indication of
unstable behavior in the turbocooler or combustor. The transition was smooth and well controlled.
The temperature differential between the heat exchanger header and the dome never exceeded 400°F
an acceptable thermal difference.
Key turbocooler rig operating test points are presented in Figures 76 through 79 for readings 48, 54,
121, and 131. In these test points, fuel temperature varies from 408 ° to 732°F and turbine discharge
air varies from 123 ° to approximately 0°E The test point data are summarized in Table 23. A
maximum heat sink point of 360 Btu/s was achieved during reading 54 as presented in Figure 77.
In this test point, 749°F combustor bleed air is cooled to 123°F at sufficient pressure to significantly
cool a gas turbine exhaust nozzle structure as compared to conventional cooling schemes.
Measured ACM compressor performance is compared to pretest predictions in Figure 80. The
compressor test performance agrees with the pretest predictions. It should be noted that the ACM
speed measurement proved unreliable in the GEAE test facility, although it is successfully used on
most ACM acceptance/development tests. This may be attributed to the lead length from the sensor
to the control room. The measured speed does not agree with the predicted speed lines.
ACM turbine performance (efficiency) is compared to pretest predictions in Figure 81. The turbine
efficiency of the R1 unit is as predicted. The turbine efficiency of the R2 unit is degraded as
compared to the predicted turbine efficiency -- down approximately 7 points. The performance
lapse in R2 was also observed to some extent during the ACM acceptance testing. The root cause
of R 1 performance degradation is not fully known, but the degradation may be due to such factors
a_ turbine clearances, turbine nozzle geometry, and turbine blade aerodynamics.
Measured heat exchanger air-side pressure drop is compared to pretest performance predictions in
Figure 82. The air-side pressure drop, including the interconnecting U-tube, is as predicted. The
pressure drop data presented in Figure 82 has been corrected to standard density. Proper prediction
of air-side pressure drop is critical to adequately accommodating air beating cooling distribution and
thrust balance. The ACEP ACM employs a recirculation of the bearing parasitics -- not a conven-
tional cooling means. Typically the bearing coolant is discharged to ambient (as a predictable system
loss). In the recirculating system the thrust bearing coolant is restored at the compressor inlet, and
journal components are restored respectively at the compressor diffuser and the turbine rotor inlet.
This places a significant constraint on the heat exchanger air-side pressure drop to ensure positive
flow over the compressor journal. This proved detrimental to the original bearing cooling design but
was modified and validated on the ACM engine cooling mode acceptance test.
The thermal performance of the heat exchangers exceeded expectations with respect to air-side
cooling capability. A contributor to the thermal performance was the heat loss from the fuel to
ambient. The heat exchanger performance was simulated by reducing the fuel inlet temperature to
the heat exchanger in order to match the observed turbine inlet temperature. The heat exchangers
were not insulated during the test so that potential fuel leaks could be visually detected.
97
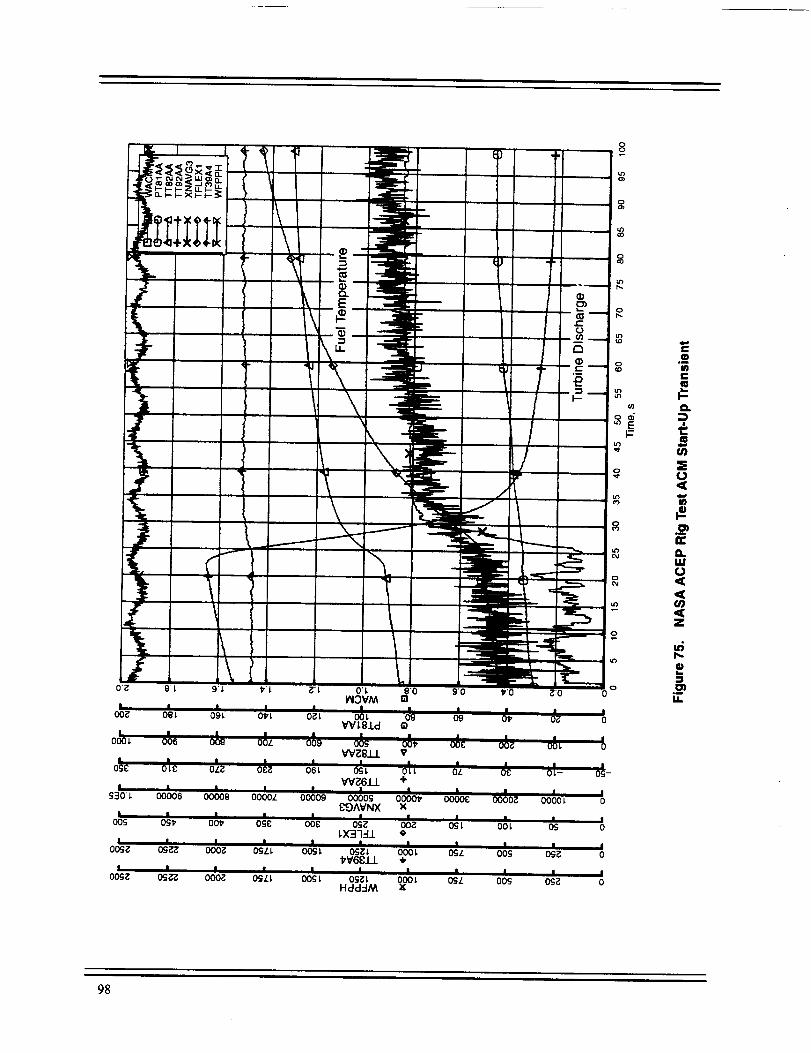
8
0'_ 8"L 9']. '_'L _'L O'L g'o 9'0 I,'0 _'0 0_IOVM D
I l I I I Io0_ 0gL 09L o,t 0_L O0L _B _ 11, o1_ I
W¢ _8.Lcl •
W_811 V
0_j£ I I I
W_6J_L ÷I I I I I I I I, ,, I I I
g30't. 00006 OO00B O000t 00009 0000g 00001, O000C O000Z 0000 L 0£OAVNX x
O_ * I I I I I I I I Ios_ ool, ogc ooc os_ ooz os L oo _ os oI.X37-II
I i I i I I I I I i I0os_ 0S_ oo0_ 0sZ_ o0st 0S_t o00L 0St. o0s os_ o
1,V6£J_L ,_I I I I I , I I I I I I
OOg_ 0_"_ 000_ OgZL oogL Og_L O00L O_Z OOS og_ 0Hdd_-IM X
.o
e_
e_
¢.)
re
LLI0,,_
(n,d:z
i,,,.
.__
98

Fuel
Pf = 280 psiaTf = 77.6°F
Wf = 1692 Ibm/hr
Pf = 277.6 psia
TI = 501.1°F
Fuel HX 2
Main FuelFlow
Pf = 275.6 psia
Tf = 674.4°F
Back
P_relVs_ae
&
-"-: Pa = 26.1 psia
--- Ta = 123.6°F
t" W a = 1.54 Ibm/s
/_ Pa = 95.4 psia
Ta = 274.4°F
Air CycleMachlne
Pa = 106.7 psia
Ta = 743.8°F
Start Jumper
^el _1 Tube
5: ,.PI = 277.6 psia _. J Ta = 514.9°F !
Tf = 674.4°F
PcontrolPressure Regulating
-- Shut-off Valve
Air Supply
I Pa = 90.2 psiaTa = 650.7°F
Wa = 24.6 Ibm/s
Figure 76. F404 Full-Annular Combustor Rig: Reading 48, Test Point 200
99

Fuel
Pf = 411.9 psia Pa = 32.8 psia
Ta = 123,5°FW a = 2.36 Ibm/s
!
Pa = 147.1 psia ITa = 258.5°F I
Air CycloMachine
I
Pa = 163 psia ITa = 838.6°F I
_ Start Jumper
Tube
Pa = 118.5 psia
Ta = 708.2°F
b PressureRegulating" Shut-off Valve
b
Pa = 139.9 psia
Ta = 749°F
W a = 34 Ibm/s
Figure 77. F404 Full-Annular Combustor Rig: Reading 54, Test Point 203(Maximum Heat Sink Test Point)
100

Figure 78. F404 Full-Annular Combustor Rig: Reading 121, Test Point 202
101
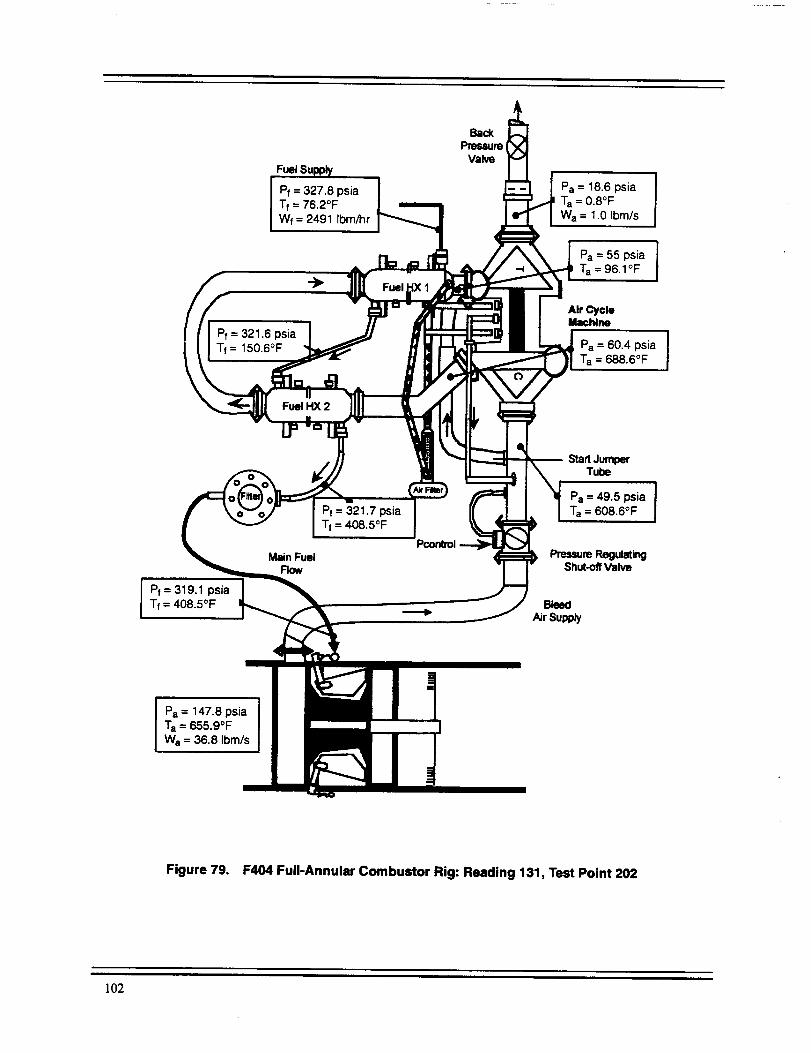
BackPmuum
Valve
Fuel S._._Pa = 18.6 psia
Pf = 327.8 psia Ta = 0.8o FTf = 76.2°FWI = 2491 Ibm/hr Wa = 1.0 Ibm/s
Pa = 55 psia I
fl _ I-Ue,, Ta=96"1°F
I
I ( F= 321"6 PSi--"_I -_ Pa = 60.4 psJa
_. Tube• Pa = 49.5 psia7 psia Ta = 608.6°F
TI = 408"5°F Pcordm
Main Fuel Pressure RegulatingFlow Shut-off Valve
I Pf = 319"1 psia jTI : 408.5°F BleedAir Supply
I
Pa = 147.8 psia
Ta = 655.9°F
Wa = 36.8 Ibm/s
Figure 79. F404 Full-Annular Combustor Rig: Reading 131, Test Point 202
102
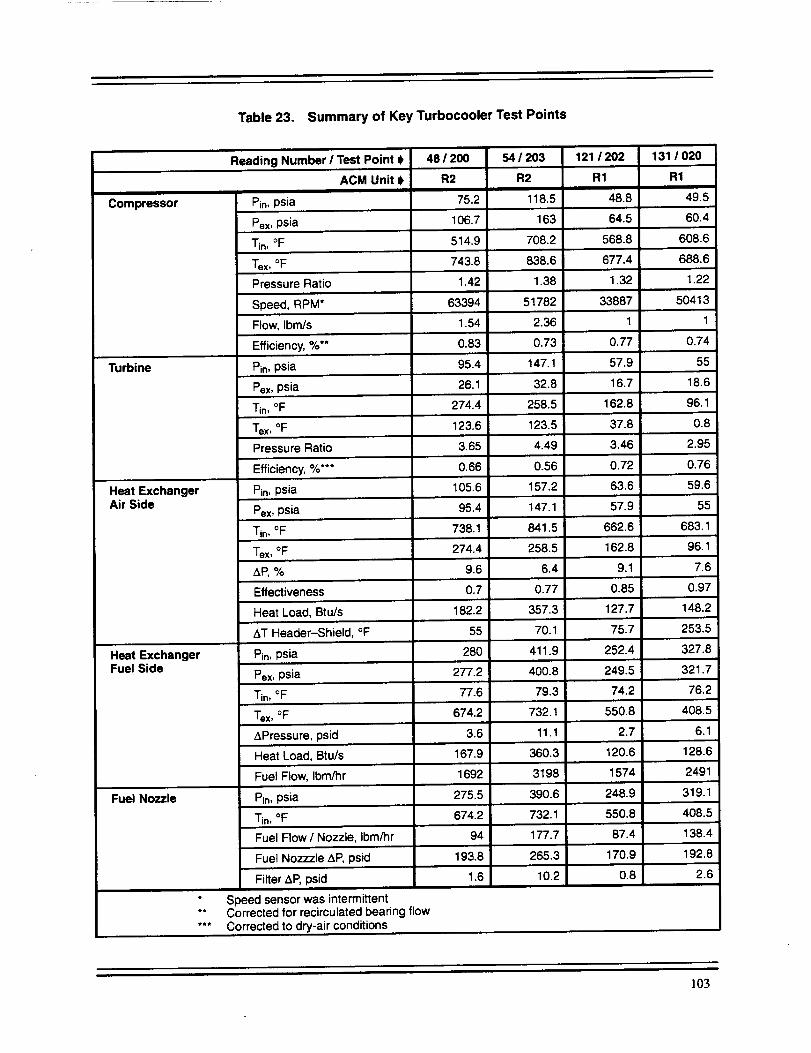
Table 23. Summary of Key Turbocooler Test Points
Reading Number/Test Point 0 48/200 54/203 121/202 131/020
ACM Unit 0 R2 R2 R1 R1I
Compressor Pin, psia 75.2 118.5 48.8 49.5
Pex, psia 106.7 163 64.5 60.4
Tin, °F 514.9 708.2 568.8 608.6
"rex, OF 743.8 838.6 677.4 688.6
Pressure Ratio 1.42 1.38 1.32
Speed, RPM*
Flow, Ibm/s
Efficiency, %**
63394
1.54
51782
2.36
33887
1.22
50413
0.83 0.73 0.77 0.74
Turbine Pin, psia 95.4 147.1 57.9 55
Pex, psia 26.1 32.8 16.7 18.6
Tin, °F 274.4 258.5 162.8 96.1
"rex, OF 123.6 123.5 37.8 0.8
Pressure Ratio 3.65 4.49 3.46 2.95
Efficiency, %*** 0.66 0.56 0.72 0.76
Heat Exchanger Pin, psia 105.6 157.2 63.6 59.6Air Side
Pex, psia 95.4 147.1 57.9 55
Tin, °F 738.1 841.5 662.6 683.1
Tex, °F 274.4 258.5 162.8 96.1
&P, % 9.6 6.4 9.1 7.6
Effectiveness 0.7 0.77 0.85 0.97
Heat Load, Btu/s 182.2 357.3 127.7 148.2
AT Header-Shield, °F 55 70.1 75.7 253.5
Heat Exchanger Pin, psia 280 411.9 252.4 327.8Fuel Side
Pex, psia 277.2 400.8 249.5 321.7
Tin, OF 77.6 79.3 74.2 76.2
"rex, OF 674.2 732.1 550.8 408.5
&Pressure, psid 3.6 11.1 2.7 6.1
Heat Load, Btu/s 167.9 360.3 120.6 128.6
Fuel Flow, Ibm/hr 1692 3198 1574 2491
Fuel Nozzle Pin,psia 275.5 390.6 248.9 319.1
Tin, °F 674.2 732.1 550.8 408.5
Fuel Flow/Nozzle, Ibm/hr 94 177.7 87.4 138.4
Fuel Nozzzle ,_,P, psid 193.8 265.3 170.9 192.8
Filter &P, psid 1.6 10.2 0.8 2.6
* Speed sensor was intermittent** Corrected for recirculated bearing flow*** Corrected to dry-air conditions
103

O..
0-
13_
OI--
u)
Eo
i iI
• Test Data I(Readings48, 54, 121,131) I
81
,8O
78--
T4
7OI
6516O
5O
3O
1.010 14
Figure 80.
]r
18 22 26 30 34 38 42 46 50 54
Compressor Corrected Airflow,Wc_s/bs
Comparison of ACM Compressor Performance with Prelest Predictions
lOO
9o
80
7ok-
o 60r--._¢:1:="' 50._.R.o
4Ot-
30
20
lO/0
0 0.1
r
!
I
! i tl
,F,I
i
fi
i|0.2 0.3 0.4 0.5 0.6 0.7 0.8 0.9 1.0 1.1
TurbineFactor,FV
Figure 81.
i!
II i i j !
' z_ R1 UnitIi = R2 Unit iI
I
r i
I
1.2 1.3
Comparison of ACM Turbine Performance with Pretest Predictions
58
]04
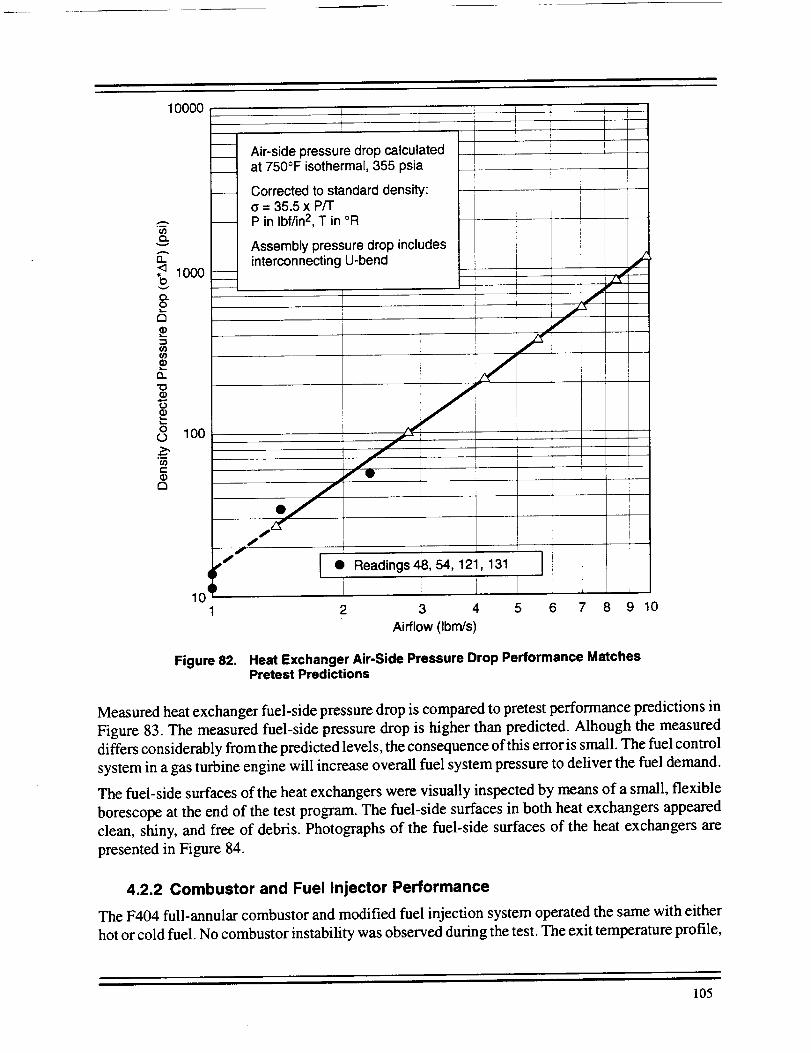
10000
v
lO0O
Q
o_ 100
¢¢)e-
4
i0q
Air-side pressure drop calculatedat 750°F isothermal, 355 psia
Corrected to standard density:a = 35.5 x P/TP in Ibf/in2, T in °R
Assembly pressure drop includesinterconnecting U-bend
/
d
_//" Ii
lip
S_' [ • Readings48,54, 121,131 ]
7 m
i i
i
iIi
i
i2_
2 3 4 5 6 7 8 9 10
Airflow (Ibm/s)
Figure 82. Heat Exchanger Air-Side Pressure Drop Performance MatchesPretest Predictions
Measured heat exchanger fuel-side pressure drop is compared to pretest performance predictions in
Figure 83. The measured fuel-side pressure drop is higher than predicted. Alhough the measured
differs considerably from the predicted levels, the consequence of this error is small. The fuel control
system in a gas turbine engine will increase overall fuel system pressure to deliver the fuel demand.
The fuel-side surfaces of the heat exchangers were visually inspected by means of a small, flexible
borescope at the end of the test program. The fuel-side surfaces in both heat exchangers appeared
clean, shiny, and free of debris. Photographs of the fuel-side surfaces of the heat exchangers are
presented in Figure 84.
4.2.2 Combustor and Fuel Injector Performance
The F404 full-annular combustor and modified fuel injection system operated the same with either
hot or cold fuel. No combustor instability was observed during the test. The exit temperature profile,
105

100
I0
¢/3Q.
v
2D=m'=i¢/3
EL
0.1
Fuel-side pressure drop calculatedat 750°F isothermal
Fuel inlet pressure = 1200 psia
Assembly pressure drop includingconnecting U-bend
I
I
t
i I'
/i
//
!i
i i i
Ai
Readings 48, 54, 121,131
Readings 48, 54, 121,131Corrected for Density
r0.1 1
Fuel Flow (Ibm/s)10
Figure 83. Fuel Side Pressure Drop
106
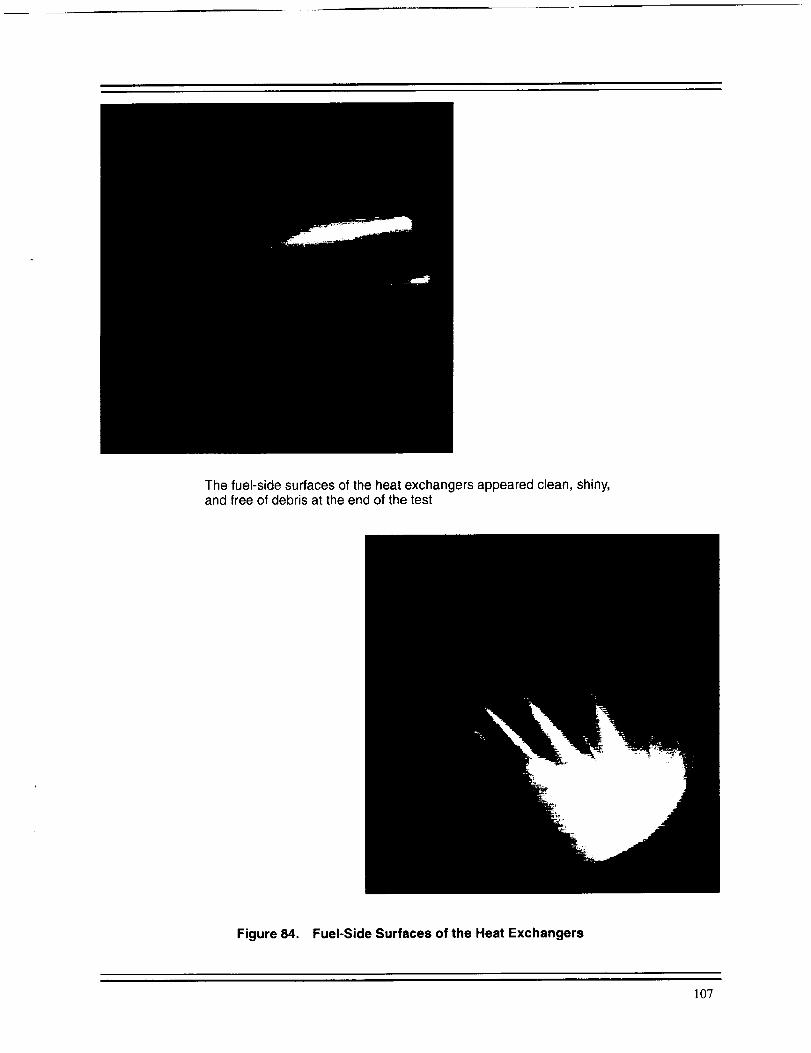
The fuel-side surfaces of the heat exchangers appeared clean, shiny,and free of debris at the end of the test
Figure 84. Fuel-Side Surfaces of the Heat Exchangers
107

combustor dynamics, and axial location of the flame front (flashback) were unchanged between hot-
and cold-fuel operation. Normalized exit temperature profiles, as measured from the discharge rake,
for hot- and cold-fuel operation are presented Figure 85. The combustor was operating at similar
conditions for the comparison. The hot-fuel temperature was 674°F, and the cold fuel temperature
was approximately 100°E Normalized temperature or profile factor is calculated as:
Profile Factor = (Tprob e - T3avg ) /(T4avg - T3avg )
where T3avg is the average combustor inlet temperature and T4avg is the average combustor exit
temperature. The profile factor with hot fuel has a similar shape and general magnitude as with
cold-fuel operation. The temperature profile that would be experienced by a turbine nozzle/rotor in
an engine is essentially unchanged; no change would be required in the turbine cooling arrangement.
Combustor liner metal temperatures with hot- and cold-fuel operation are presented in Figure 86.
Metal temperatures for the upper liner and the lower combustor liner are shown. During hot-fuel
operation, the fuel temperature reached 732°E As indicated in the plot, there is essentially no
difference in the liner metal temperatures due to fuel heating.
Combustor exhaust gas emission levels with hot and cold fuel are presented in Figure 87. At this
combustor operating condition, emission of CO and unburned hydrocarbons is reduced over 50%
with hot fuel. Nitrous oxide (NO2) and other nitrogen products (NOx) appear to increase with fuel
temperature; however, when plotted against average combustor discharge temperature, NOx emis-
sions appear comparable or slightly lower with hot fuel than with cold fuel (see Figure 88).
Posttest inspection of the fuel nozzles found them clean in appearance. A comparison of the pre- and
posttest fuel nozzle flow checks indicated no change in the fuel nozzle flow characteristics. Figure
89 shows the results of the pre- and posttest fuel nozzle flow checks at four fuel pressure levels. The
fuel nozzle flow ranges overlap, and there are no statistical differences in the variances.
Point: 100 vs 200, T3=650°F, P3=90 psia, Tf = 674°F
cO
.D
oO
._1
cO
-_EE
7
6
5
4
3
2
1
!
0 L-0.4
Outer Diameter 1 .....
J......... [ ---)[--- Cold Reading 46 --
-- - l + Cold Reading 45
Hot Reading 48
....... i --_-- Hot Reading 47
-- " t
Inner Diameter
I
-0.3 -0.2 -0.1 0 0.1 0.2 0.3 0.4
Profile Factor
Figure 85. Combustor Temperature Profile With Hot- and Cold-Fuel Operation Normalized exittemperature profiles are similar in shape and/eve/with both hot and co/d fuel
108
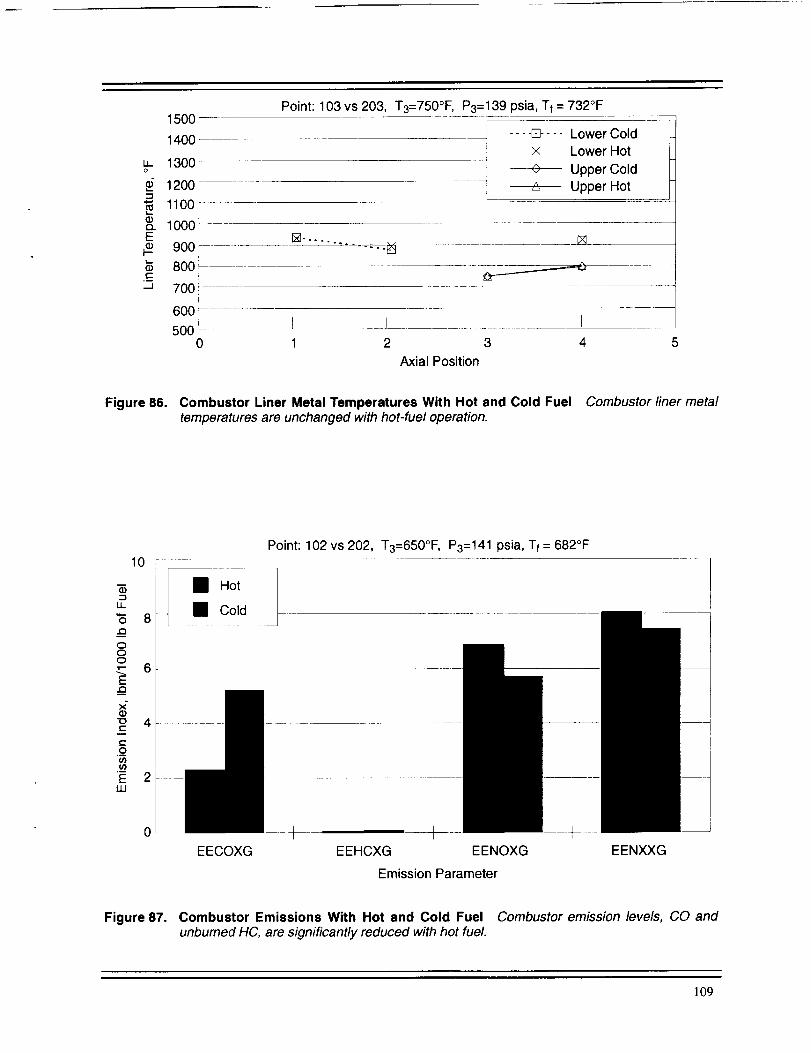
1500!Point: 103 vs 203, T3=750°F, P3=139 psia, Tf = 732°F
LLo
Q_Q.E
t-
-J
1400_
1300
1200
1100
1000
900
800
700
600
5OO0
.... [] .... Lower Coldx Lower Hot
0 Upper ColdUpper Hot
I I _l I
1 2 3 4 5
Axial Position
Figure 86. Combustor Liner Metal Temperatures With Hot and Cold Fuel Combustor finer metaltemperatures are unchanged with hot-fuel operation.
10
LL
.Q
ooo
E&x"
"0
¢-
._oU}
ELU
6
4
2
Point: 102 vs 202, T3=650°F, P3=141 psia, Tf = 682°F
l BB Hot
_. co,`.̀...
EECOXG EEHCXG EENOXG
Emission Parameter
EENXXG
Figure 87. Combustor Emissions With Hot and Cold Fuel Combustor emission levels, CO andunburned HC, are significantly reduced with hot fuel.
109

>_-_"_ LLt- ,+.-
-- OC.9 Eco_cO
-_- oOUJ O
z_-o
20
18
16
14
12
10
8
6
4
2
01
[] Hot Fuel __ !l
A Cold Fuel
i ...... . T
000 1250 1500 1750 2000 2250 2500 2750 3000
Average T4 (AVTT39), °F
Figure 88. NOx Emissions for Hot and Cold Fuel as a Function of Combustor DischargeTemperature NOx emissions with hot fuel are unchanged when evaluated againstcombustor discharge temperature.
r--
oLL
"1LL
1400
1200
1000
8O0
600
400
200
0
m m
,.,4b-
-IP --41--
m
Means are Indicated
by Solid Circles
I I I I I I I I
u3 u-) u3 u') O O O O04 04 04 04 _ u3 C) OW I-- oJ cJ cO cO (D (D
n O rr co rr 60 rr cOn n 0 n 0 n 0
13_ 13_ 13._
Fuel Pressure, psia
Figure 89. One-Way Analysis of Fuel Nozzle Flow Variance Pre- and posttest fuel nozzle flowcheck indicated that fuel nozzle performance did not deteriorate with hot fuel operation
llO

4.3 ACEP Test Rig System Description
The turbocooler system with the F404 full-annular combustor was tested in GEAE Cell A19. This
facility is used for large-combustor testing and can accommodate combustors up to 92-in diameter.
Drawings of the turbocooler test rig are presented in Figures 90 and 91. The main combustor supply
air, pressurized and heated to the appropriate temperature, is housed in a separate facility. The
turbocooler system is mounted on a separate skid adjacent to the main combustor installation.
Combustor inlet air is supplied to the turbocooler through the single bleed port on the combustor case
and a F-18 pressure regulating shutoff valve (PRSOV). In the exhaust nozzle cooling mode configu-
ration, the turbocooler discharge air is designed to be returned to the nozzle cooling manifold. The
test facility simulates the exhaust nozzle cooling manifold characteristics by installing a back-pres-
sure valve at the ACM turbine exit to control the discharge pressure. Figure 92 is a photograph of
the test facility; a photograph of the skid is shown in Figure 93, and a schematic of the adjacent
turbocooler skid is shown in Figure 94.
4.3.1 Description of Key Components
The design and features of the primary components specifically for the turbocooler test are described
in Sections 3.2 through 3.4. However, additional components were used in support of the rig test,
including: an F404 full-annular combustor, ACM start bypass and bearing cooling restoration, fuel
filter, air filters, and pressure-regulating valves.
4.3.1.1 F404 Full-Annular Combustor Rig
The F404-GE-400 combustion system comprises a machined-ring, annular-flow-type combustor
and annular step diffuser; 18 pressure-atomizing fuel nozzles (modified for the ACEP program); and
a single capacitive-discharge igniter. The fuel injection system has 18 pressure-atomizing, dual-
orifice fuel nozzles with integral air shrouds. Final fuel atomization is completed in the combustordome swirler/venturi.
The fuel is delivered to each fuel nozzle by a single manifold with 18 individual pigtails to accommo-
date differential thermal expansion (see Figure 95). All of the manifold, pigtail, and fuel nozzle
fittings were modified for the ACEP program to incorporate a local braze joint. Fuel is delivered to
the manifold through a single inlet connection on the bottom centerline of the combustor rig.
Uniform fuel distribution is achieved through the use of flow-divider valves that are integral parts
of each fuel nozzle assembly. The flow-divider valve schedules flow to the secondary orifice as a
function of fuel pressure, and the valve-cracking point occurs during acceleration to ground idle at
sea level. In an aircraft installation, a check and drain valve is located between the main fuel control
and the nozzle manifold to drain the fuel manifold at engine shutdown. The check and drain valve
is not used for combustor rig testing.
Bleed air for the turbocooler is extracted uniformly around the combustor outer annulus immediate-
ly downstream from the step diffuser. This air is collected in a 360 ° internal manifold and ducted
through the fan stream by a single port located on the engine/combustor rig bottom vertical
centerline (see Figure 96).
4.3.1.2 ACM Start Bypass and Bearing Cooling Restoration
The details of the ACM are described in Section 3.2. Two features that need clarification for the
integrated systems test are the start bypass valve and restoration of the bearing cooling to the ACM
lll
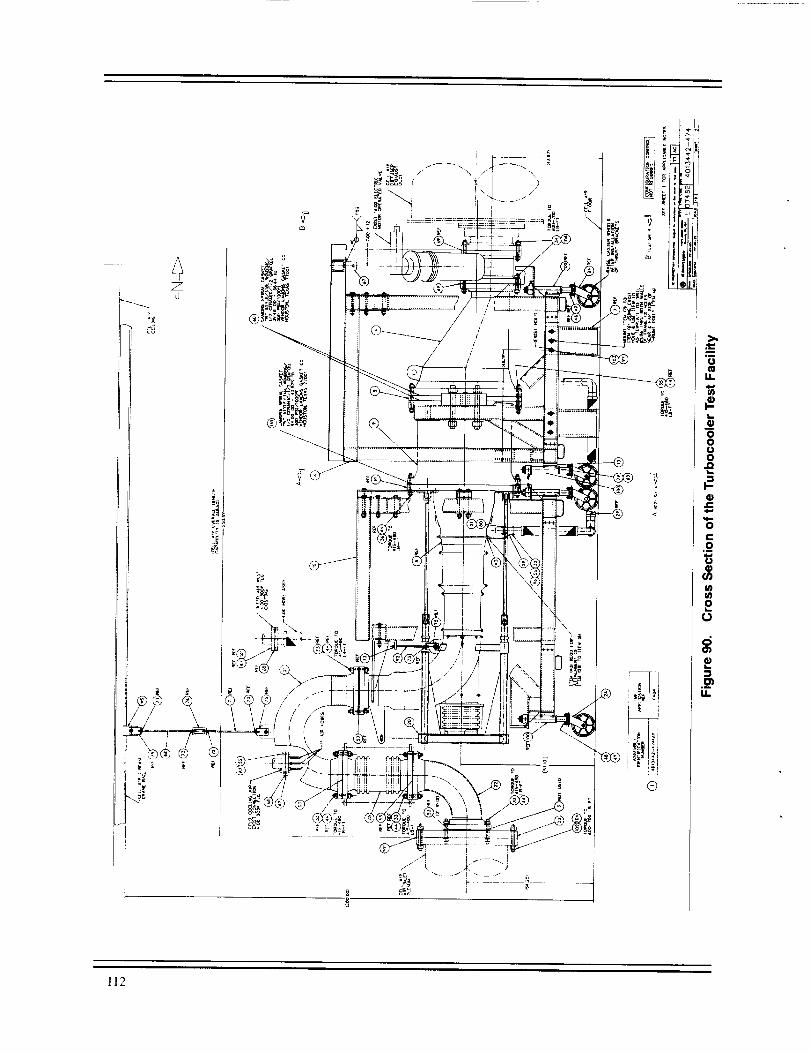
Zu
i
¢
!t
/
//
i' ,--., [
®
o
00u0
.2
if)
ffl
o0
.__U.
112
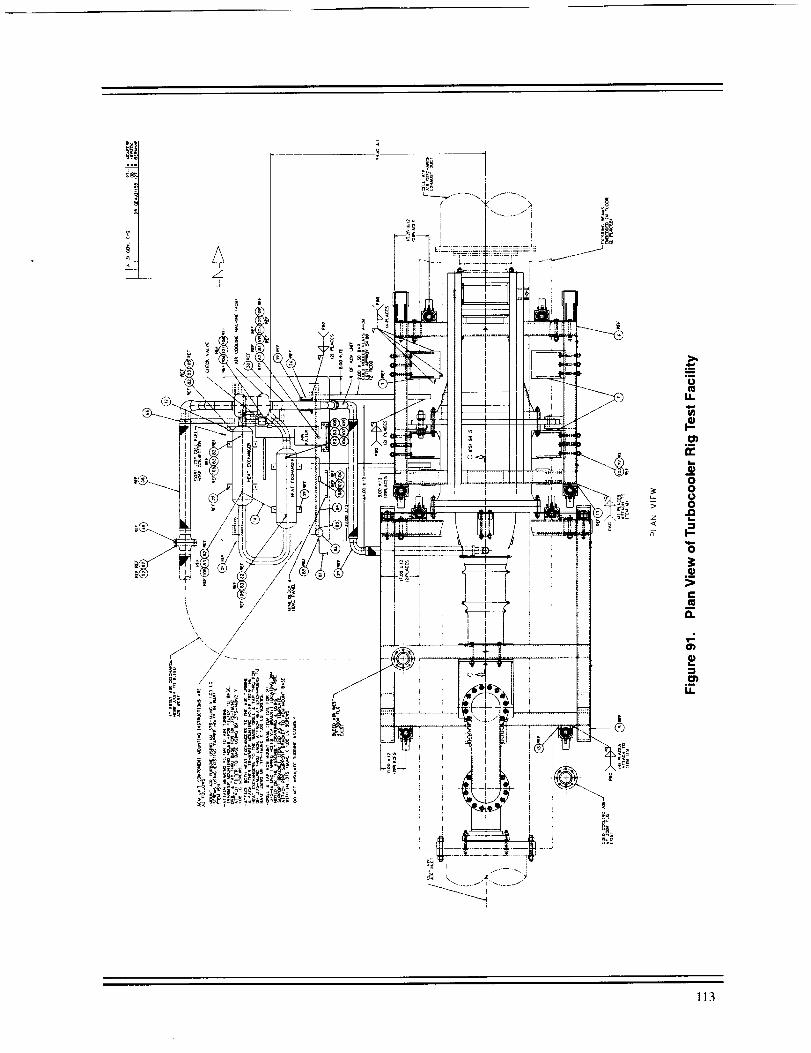
0
!1
m
oo@0
@
.__
o.
.__U.
113

Fuel/Air Heat Exchangers
Figure 92. GEAE Cell 19A Overall test facility includes F404 full-annularcombustor and turbocooler.
Figure 93. Turbocooler Installation
114

High Pressure
i, .... .Facilily" F ue_Supply ................ p_ .....
...>
Fuel HX 2
Fuel HX 1
Main FuelFlow
Skid
Bleed
Air Supply
Backpressu reValve
Venturi
!
Air BearingFilter
Pref
/k==.,
Air Cycle Machine ]
Original BearingCooling Configuration
I'1
_.
Checkvalve 1
I Start JumperTube
Pressure RegulatingShutoff Valve
Figure 94. Turbocooler Skid Layout
115

Figure 95. Fuel Manifold A single manifold supplies fuel to the 18 fuelnozzles; pigtails connect the fuel nozzles to the manifold.
Figure 96. Combustor Discharge Bleed Port
116

compressor inlet. A turbine inlet bypass line (from compressor inlet duct to the turbine torus inlet)
was incorporated to increase available pressure at the turbine inlet during start (see Figure 97).
During the ACM start sequence, the inlet pressure (and airflow) is increased at the compressor inlet.
With the bypass line installed, similar conditions are seen at the turbine inlet -- facilitating ACM
rotation as the pressure increases. Once the ACM begins to rotate, the compressor discharge pressure
increases, driving the checkvalve in the bypass line closed.
Bearing cooling air is extracted upstream of the turbine inlet, filtered, and delivered to ports on either
side of the thrust bearing. Most of the bearing cooling air is collected at the thrust bearing exit port
and restored to the compressor inlet via an external line (see Figure 97).
4.3.1.3 Air Bleed Valves
Combustor Bleed Valve - The purpose of this valve is to regulate the pressure and flow of the
combustor bleed air supply to the air cycle machine (see Figure 98). The ACEP bleed valve is an
F-15 environmental control system (ECS) pressure regulating/shutoff valve (PRSOV) that has been
modified to accommodate pneumatic actuation input supply for controlling the downstream pres-
sure (ACM inlet). In the event of loss of control pressure, the bleed valve fails-closed, terminating
air flow to the turbocooler. The operation of the valve was verified in a separate component test.
ACM Backpressure Valve - The purpose of this valve is to regulate the exit pressure of the ACM
turbine discharge air in order to simulate predicted exhaust nozzle cooling manifold characteristics.
The valve is part of the Cell A19 test facility. This valve also provides a secondary means of shutting
off airflow to the turbocooler. A choke plate is incorporated near the ACM turbine discharge to
prevent an overspeed from occurring in the event of a backpressure valve failure (full open); the
choke plate also serves as a means to calculate turbine discharge flow.
4.3.1.4 Filters
High-Temperature Fuel Filter- When petroleum fuels are heated, they undergo chemical changes
that result in precipitation of solid matter (insoluble gum, etc.), depending upon fuel quality and
conditions of heating. Precipitation of solid matter in hot fuel need not be detrimental to engine
operation if the paniculate can be passed into the combustor without accumulating or depositing in
the fuel system. The ACEP fuel nozzles, like most GEAE pressure-atomizing fuel nozzles, contain
a mechanical, variable-orifice, flow-divider valve that distributes fuel to the primary (low-power
operation) and secondary circuits (high-power operation). The flow-divider valve will be retained
in order to maintain cold-fuel operation consistent with the production engine. A high-temperature
barrier filter was used to mitigate downstream propagation of suspended particulates to the fuel
nozzles and flow divider valves (see Figure 99). The fuel filter element was removed half way
through the test (because of an erroneous pressure measurement) without any adverse effects.
Similar experience was obtained on related single-cup combustor testing with hot fuel.
Air Filter - On today's aircraft environmental control systems, engine bleed air is fairly free of
entrained particulates that could be detrimental to the ACM air bearings. However, some applica-
tions employ particle separators to protect the ACM turbomachinery and air bearings. Because the
bleed port is at the six o'clock position and the turbocooler will be run in an test cell that might
contain some debris, an air bearing filter is used to protect the ACM air bearings as a precaution (see
Figure 100). Only the air extracted from the turbine inlet that is used to cool the air bearing is filtered.
117

Figure97. Test Rig and Closeup Turbine inlet bypass enhances ACM starting; bearing cooling flow isreturned to the cycle at the compressor inlet.
118

Figure 98. Turbocooler Bleed Air Control Valve A Modified F- 15 ECS bleed valve was
used to regulate airflow into the turbocooler system.
Figure 99. High-Temperature Fuel FilterInstalled Downstream of the Fuel
Heat Exchangers
119

Figure 100. Barrier Filter Used to Protect the ACM
Air Bearings from Potential EntrainedDebris
4,3,1.5 Connectors
Air Side - All of the air-side connectors, starting with the combustor bleed port, are rigid V-band
couplings and mating machined flanges used with resilient, all-metal, E seals. These type of inter-
faces are used on most commercial and military engine bleed systems and other high-temperature,high-pressure applications.
Fuel Side - Two types of fuel-side connectors are used. For the fuel/air heat-exchanger fuel and
inspection ports, a standard AN-type fitting is used that incorporates a C seal. The C seal is to provide
added protection from external fuel leaks. The second type of fuel fitting, used exclusively on the
fuel manifold, pigtails, and fuel nozzles, is similar to typical AN connectors with the exception thata local braze joint can be applied (and removed) to form a leak-free connection.
4.3.2 Test Instrumentation
Figure 101 is a schematic identifying the principle turbocooler, combustor, and related facility
instrumentation. The specific transducer parameter names, descriptions, ranges, and units are listedin Appendix B.
Turbocooler Skid, Air Side - Inlet and exit pressure and temperature sensors are installed to help
assess component performance. Turbocooler airflow is measured at the turbine discharge. The
bearing cooling flow air filter AP is monitored throughout the test. ACM internal instrumentation
was operational during a portion of the test series. In addition to the standard instrumentation, the
ACM was equipped with external accelerometers and a speed pickup (see Figure 102). The speed
pickup detects a one-per-revolution signal from a magnetized washer at the turbine discharge.
120

PTg0AAPTg0BB
"I-I'g0AA 4_PF361N TTg0BB
TF361N HSCN01TFUELA HSCN02
TFUELBFacility Fuel Supply
PS855XTA855X _ = _'
//_., ---_ _"_ _V0 J Fuel HX1
/fPFU L37 _1.,,,_._ ,1_
J f TFUL37 __
PS85HX _ 0 Fuel HX2TABSHX V
TKDM01- =_
.... _k,,,.p__X. ....
Main Fuel _ _ TAB4HXPFULEX
Flow DPFFLT TFLEX1 PT82AA
TFLEX2 PT82BB
TT82AA
f_"_ PFLDYN TT82BBPFMANXTFLNOZ
Bleed Venturi
P1W10A
P1WOBP2W 10A
T 110WAT110WB
,,.,,'-I-
_' TBRGCX
PBRGCX
PCVACTiI_
_' 1BB
TT81AA
1-1"81BB
-_ PSB31N
PT92AAPS92BB
"Fr92AATT92BB
InternalAir Cycle Machine
PCBTIPPCBMID
PCBHUB
ePCLXXXTCLXXXPCJBXX
TCJBXXPTJ BXX1-rJBXX
PTH RBX1-FHRBXPTBTIPPTBMIDPTBHIIR
XNTC81
ZVACM2ZHACM1
WAMAIN TT30AX
WACOMB TT30BX
P 1MAOA/B TT30CX
P2MAONB PTCOM1-3
T1MA01A/B PS31XX
DPPTP
PT40A1-A5 TT30A1-A5
PT40B1-B5 TT39B1-B5
PS41AA
PS41BB
PS41CC
PLMDYN
Emission Rakes
F404 Full Annular Combustor Rig
Figure 101. Turbocooler Instrumentation
121
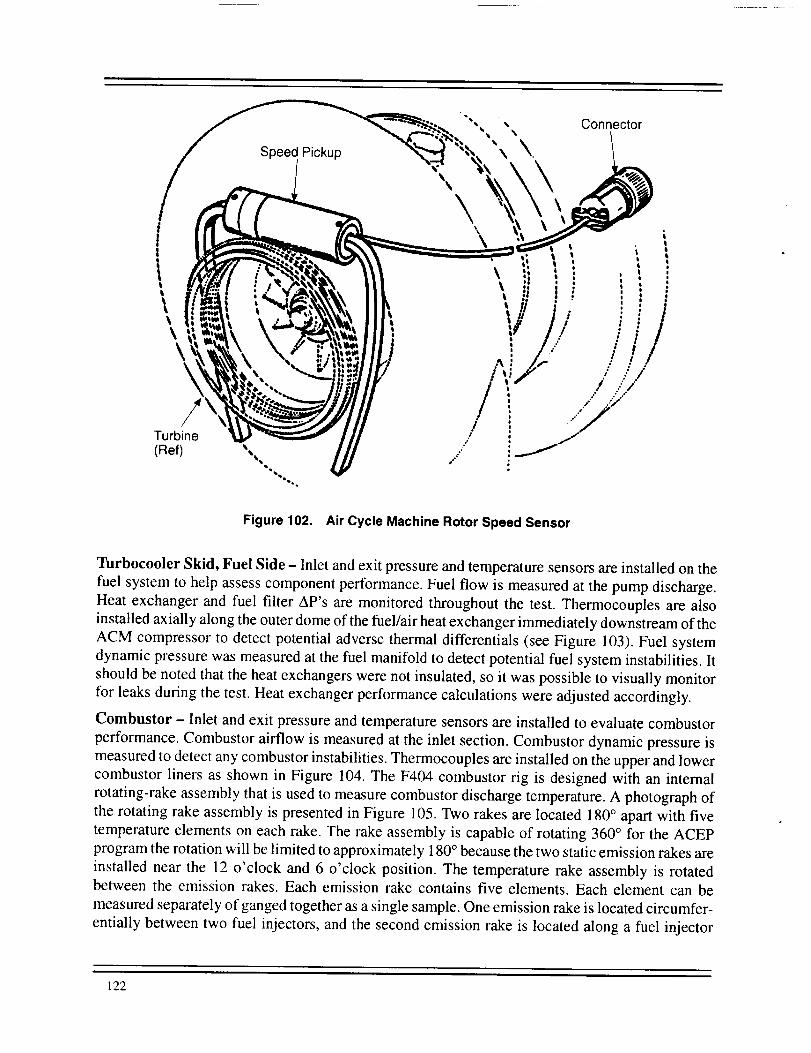
Turbine(Ref)
Figure 102. Air Cycle Machine Rotor Speed Sensor
Turbocooler Skid, Fuel Side - Inlet and exit pressure and temperature sensors are installed on the
fuel system to help assess component performance. Fuel flow is measured at the pump discharge.
Heat exchanger and fuel filter AP's are monitored throughout the test. Thermocouples are also
installed axially along the outer dome of the fuel/air heat exchanger immediately downstream of the
ACM compressor to detect potential adverse thermal differentials (see Figure 103). Fuel system
dynamic pressure was measured at the fuel manifold to detect potential fuel system instabilities. It
should be noted that the heat exchangers were not insulated, so it was possib]e to visually monitor
for leaks during the test. Heat exchanger performance calculations were adjusted accordingly.
Combustor - Inlet and exit pressure and temperature sensors are installed to evaluate combustor
performance. Combustor airflow is measured at the inlet section. Combustor dynamic pressure is
measured to detect any combustor instabilities. Thermocouples are installed on the upper and lower
combustor liners as shown in Figure 104. The F404 combustor rig is designed with an internal
rotating-rake assembly that is used to measure combustor discharge temperature. A photograph of
the rotating rake assembly is presented in Figure 105. Two rakes are located 180 ° apart with five
temperature elements on each rake. The rake assembly is capable of rotating 360 ° for the ACEP
program the rotation will be limited to approximately 180 ° because the two static emission rakes are
installed near the 12 o'clock and 6 o'clock position. The temperature rake assembly is rotated
between the emission rakes. Each emission rake contains five elements. Each element can be
measured separately of ganged together as a single sample. One emission rake is located circumfer-
entially between two fuel injectors, and the second emission rake is located along a fuel injector
122

TKDM01-05 Collar
Manifold
\
05
Shell
/Convolution
Header
Figure 103. Heat Exchanger No. 2 Surface-Mounted Thermocouples
TC's (Upper Liner) Hastelloy X
X TKCLU1-4
Hastelloy X
TC's (Lower Liner)TKCLU1-4
T4RKA1-5
T4RKB1-5
EMISA1-5EMISB1-5
Figure 104. Combustor Liner Thermocouples
123

Figure 105. Combustor Exit Rotating Rake Assembly with Temperature and Emission Probes
centerline. The rotating rake assembly is typically used at operating pressures below 8 atmospheres
and proved particularly troublesome (failed to consistently rotate) during the turbocooler test.
Turbocooler Control Parameters and Limits - The basic operation of the test rig is controlled
through the operation of the parameters defined in Table 24. Parameters that require automatic alarm
and/or limit trips are defined in Table 25 along with the recommended action. It should be noted that
two hydrocarbon leak detectors were installed in the turbocooler test facility. The HC detectors
monitored the quality of the airflow into the ACM turbine to determine if the fuel/air heat exchanger
was leaking fuel (into the air stream).
4.3.3 Data Acquisition
The combustor test facility records and stores all steady-state sensor, emission, and performance
calculations defined in the Phase I analysis program. All engineering units and specific performance
calculations can be monitored in real time. ACEP component performance parameters are calculated
on-line from measured data. Combustor discharge temperature contours are processed off-line from
the recorded rotating-rake instrumentation. Transient recordings of predefined parameter sets are
available on request.
124

Table 24. Turbocooler Rig Control Parameters
Parameter Range
Name Description Low High
Air Side PACTIN Actuator Supply Pressure Ambient 400
PT81AA ACM Compressor Inlet Ambient 300
PT90AA ACM Turbine Exit Ambient 100
Fuel Side WF36MV Main Fuel Flow 0 8000
WF36W Fuel FLow Rate Verification 0 8000
Combustor FARCOM Combustor Fuel/Air Ratio 0 0.033
PSCMU1 Main Airflow Oriface Pressure Ambient 350
PSCMU2 Main Airflow Oriface Pressure Ambient 350
PTCOM1 Combustor Inlet Total Pressure Ambient 350
TTCOM1 Combustor Inlet Total Temp Ambient 1000
DPCOMB Combustor _P 0 0
Units
psia
psia
psia
pph
pph
psia
psia
psia
oF
psig
Comments
;Controls bleed valve position
Set by bleed valve position
Set by ACM backpressure valve
Set by pump pressure
Set by pump pressure
Set by pump pressure or airflow
Facilitycontrolled
Facility controlled
Facility controlled
Facility controlled
Combustor backpressure valve
Table 25. Turbocooler Rig Alarm and Trip Parameters
Parameter
Name Description
=Air Side PT82AA ACM Compressor Exit PT (psia)
"I-r90AA ACM Turbine Inlet TT (°F)
TT92AA ACM Turbine Exit TT (°F)
DPBRGF Air Bearing Filter &P (psid)
XNTC81 ACM Shaft RPM
ZHACM1 Horizontal ACM Vibration (mils)
ZVACM2
HCSN01-2
Vertical ACM Vibration (mils)
HC Sniffer at Turbine Inlet (% LEL CH4)
PCNTRL ACM Bleed Valve Control
Fuel Side PF361N Fuel Inlet Pressure to HX1 (psia)
PFLDYN Dynamic Fuel Pressure at Nozzle (P-P)
DPFULF Fuel Filter AP (psid)
Combustor FARCOM Combustor Fuel/Air Ratio
TKCLU1-5 Upper Liner Temperature (°F)
TKCLL1-5 Lower Liner Temperature (°F)
PTCOM1 Inlet Total Pressure (psia)
TTCOM1 Inlet Total Temperature (°F)
T4RKA1--5 Exit Temperature (°F)
T4RKB1-5 Exit Temperature (°F)
PCMDYN Dynamic Pressure (P-P)
Limits
Yellow Red
380 400
300 400
40 32
4 5
80,000 110,000
3 10
3 fO
50 50
65 71
1100 1200
3 5
10 25
0.03 0.035
1400 1600
1400 1600
350 400
1000 1200
2600 3200
2600 3200
3 5
Alarm I Action
Close bleed valve 10%, reducePCNTRL
Close backpressure valve 10%
Change filterelement
Close backpressure valve 10%
Close bleed valve, shut-off fuel
Reduce regulation pressure
Reduce fuel temperature; closebleed valve $ reduce PCNTRL
Change filter element
Reduce fuel/air ratio
Reduce facility supply
Reduce fuel/air ratio
Reduce fuel temperature; closebleed valve _ reduce PCNTRL
]25

Appendix A- Heat Exchanger Analysis
Temperature Distributions: Start-Up Transient Analysis
The ACEP turbocooler heat exchanger thermal-network model is shown below. The following
pages, replicated from the AlliedSignal report, superpose transient temperature distributions onto
a half cross section (perpendicular to the coolant-fuel flow) of the symmetrical ACEP turbocooler
heat exhanger -- section B-B on the left-hand side (section A-A) of the drawing below.
I04
|
_YM. A-A
126

oLL
3LL
0
-I._ot,-
{3..t,-.9
03
838(885) t_l
LL
_0
03O_
LL
04QO
¢q
E
1
_-J
o
(DQ.E
(D
.o
(DEE
oo¢)
G')
0c,')
LL
(-._o
E
e-._e-
e-
XLIJ
t_
00
0
<
127
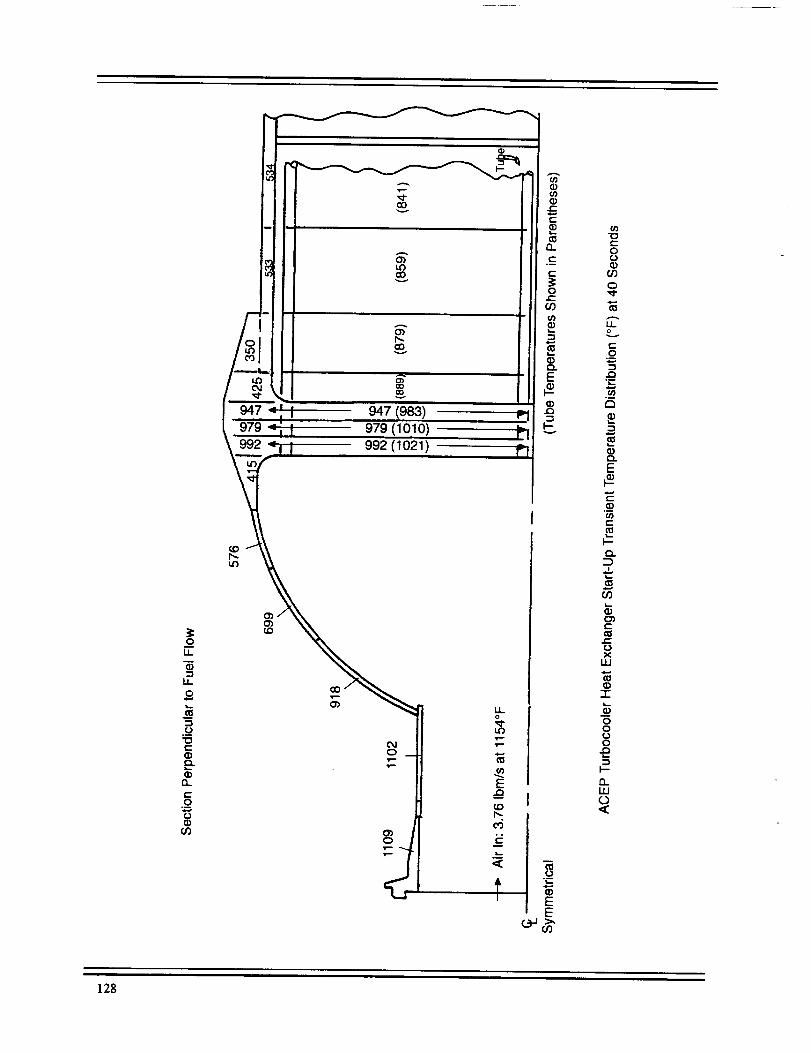
oLL
0
LL
.u"0¢...Q)
13.
0,e.e
o
O3
947 947 (983) rl
(1010)992 (1021)
o)
D
o
EE
e-0oo
o
1.1_ov
e-._o
°B
a
oQ.E
e-
I--
D
e--
t-ox
la.l
o-r
oooo
I-.-
IJJo
128

oU..
I.J_
.9o
._oc
13_
t--._o
O3
,,,,.
cO_.o
v
'q'l
o,I
O300
1078 (1095) rl
1104(1115)
1113 (1123) FI
o
o_
,z-.
13.
.=_t,..
0t,..
O0o_m
Q.E
I-.-v
O3"o
0o
g')
0t.o
¢..
o_
a
E
.__O3e-
D
O9
e"
e'-
XkU
-r
oo
o
I--
13_UJO<
129

° II III•iI _ _!I _- _l_IJI 102 411 375(412) _il _.t.,o_--',i _i i-;I :0\'_.._04_.. _5 (423) Fii
Ill
,<
0 u_
g _
t_ i I:::cm E
"0c-O0
cOoOJ
u_
._o
._121
E
.__
¢..
._
>,
c-
O._1
r-
e'-0X
LU
1-
00
0
I---
0<
130
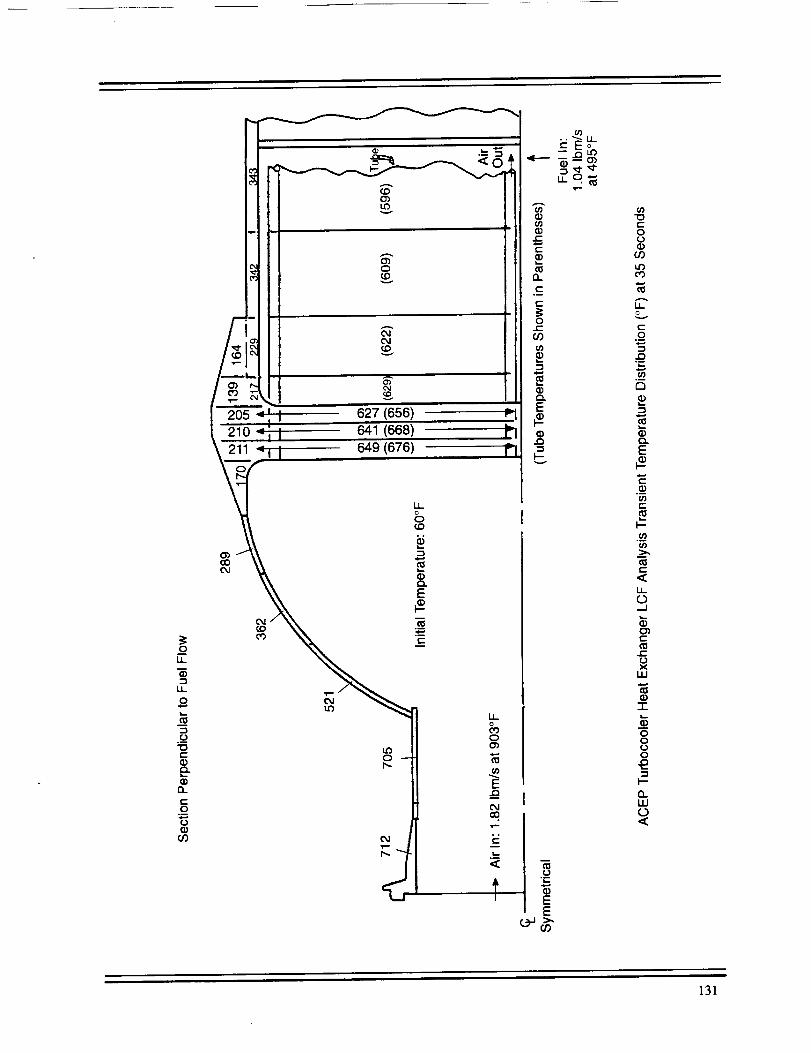
._oEL
LL
0
"0e-
13..
t-O
0
O0
CO
627 (656)641 (668)
211 649 (676)
LL
CO
0_).E
t-
I.no
LL
0o3
E
CMCOl--
r-
8t,=
EE
• • .._ LL--03
_ ,¢ ,¢
"o
ooo
I.L
e.-
°--
ffl°--
c_
e'_E
.__e,-
I---
.__
c-
U_
._1
e-
e-
xW
--r
oo
o
O.
0
131

132
oU-
II
"0t-
On
t-O
00)
768 (785)
783 (799)
790 (806)
0
"0e-0oo
0
.¢,..,
I.L0
¢zo
._
121
o
E
E.__
e-
.__
e-
U.-
-,J
e"
¢.-
XLLI
0-r-
00
0

oI..L
tl
¢-.._o"5
°t-
/-il _ -rl o=
;!Z _ ._LL _-"--I'--_ 819(861) _i #.
\426_1i ,. 8 ( ) , _! =I--
ii
%
o
E
e6EL,.
I
I,..
EE
t-Oo
O0
o_0
¢-._o
e_
E
.__e-
.__ffl
_.J
e-
e.-
x_U
:lz
00
o
LU
133

Stesses and Temperature Plots: LCF Analysis
1
\
Temp at 20 sec {8-29-96 GEAE ). Thermal+ ssur
ANSYS 5.2
SEP 25 1996
13:22:23
PLOT NO. 1
ELEMENTS
TEMPERATURES
TMIN--79
TMAX=432
ZV =I
*DIST--I. 889
*XF --3.015
*YF =. 553214
EDGE
A =98.611
B =137.833
C --177.056
D =216. 278
S =255.5
F =294.722
G =333.944
H ---373.167
I =412. 389
134
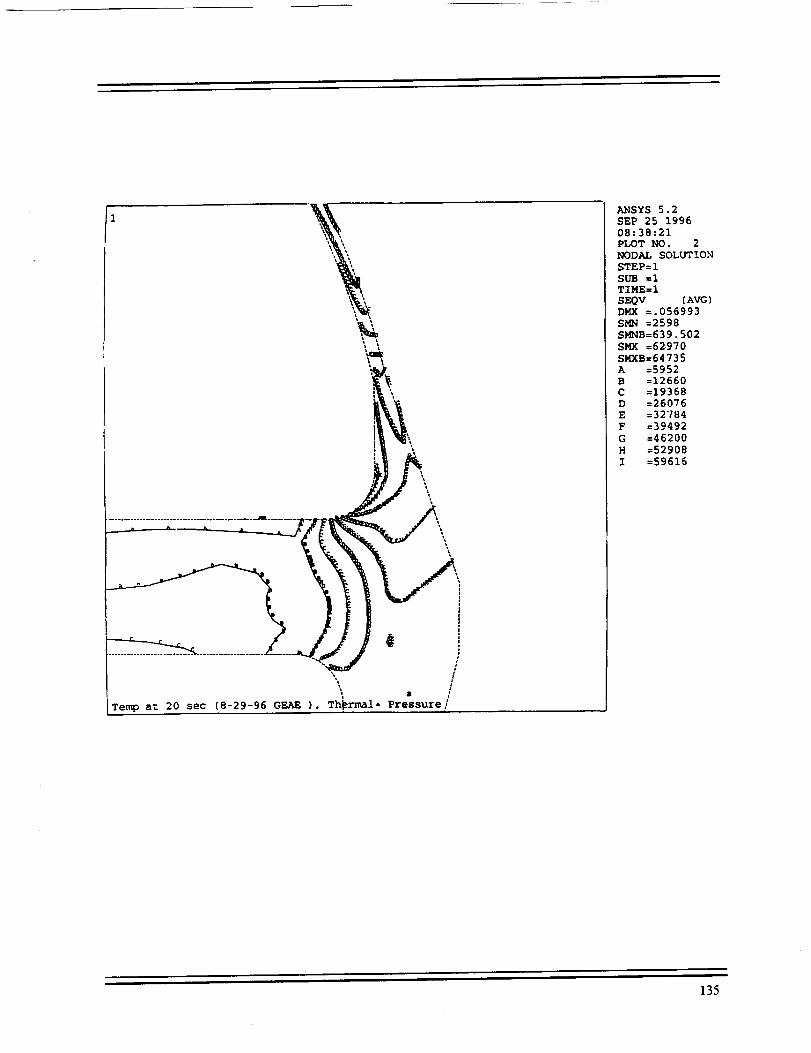
[i
\
\\
/
Temp at 20 sec (8-29-96 GEAE ). Thermal, Pressure,
ANSYS 5.2
SEP 25 1996
08:38:21
PLOT NO. 2
NODAL SOLUTION
STEP=I
SUB =i
TIME=I
SEQV {AVG)
DMX =. 056993
SMN =2598
SMNB=639. 502
SMX =62970
SMXB=64735
A =5952
B =12660
C =19368
D =26076
E =52784
F =39492
G =46200
H =52908
I =59616
135

ANSYS 5.2
SEP 25 1996
08:42:07
PLOT NO. 3
NODAL SOLUTION
STEP=I
SUB =1
TIME=I
SEQV (AVG ]
DMX =.04681
SMN =5642
SMNB=2338
SMX =111843
SMXB=113318
A =11542
B =23342
C =35142
D =469.42
E =58742
F --70542
G =82342
H =94143
I =105943
136

11\\
\\\\,,
\%
\
\\\\
\\
/
J
iTe-_a_35sec,82996G_ ,.___1÷_s_e_ pi
\
ANSYS 5.2
SEP 25 1996
13:_4:08
PLOT NO. I
ELEMENTS
TEMPERATURES
TMIN=139
TMAX=712
ZV =1
*DIST=l.089
*XF =2.925
*YF =.601814
EDGE
A =170.833
B =234.5
C =298.167
D =361.833
E =425.5
F =489.167
G =552.833
H =616.5
I =680.167
137
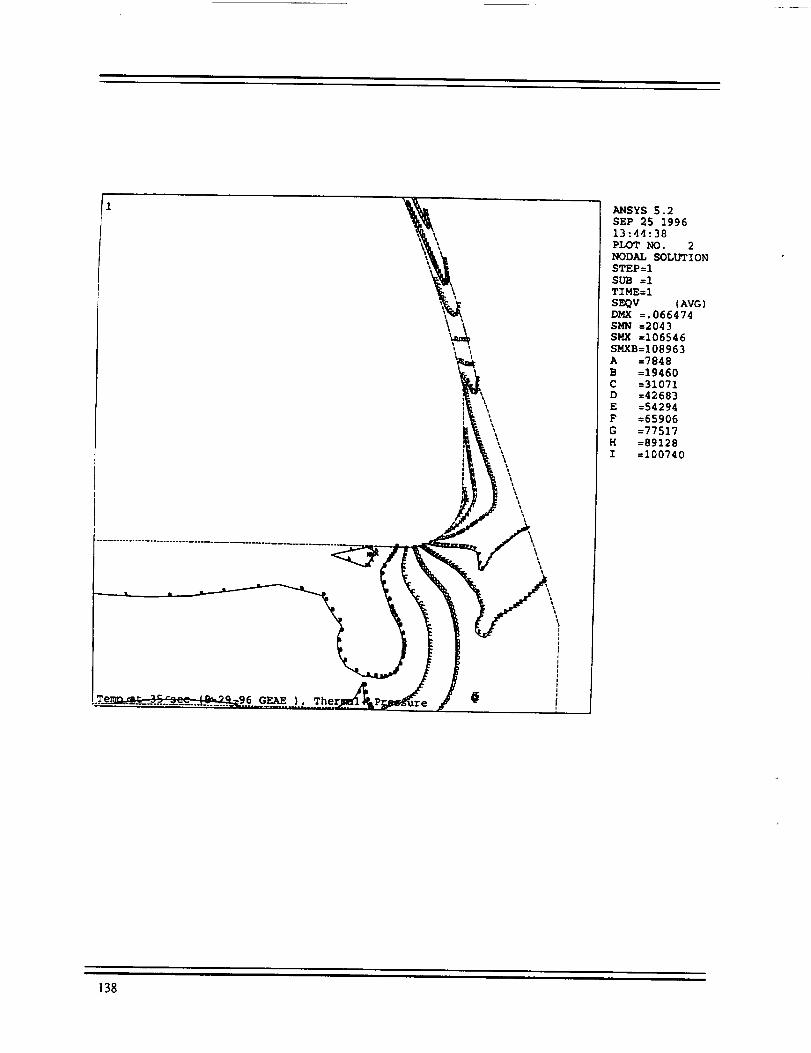
i
GEAE
\
\\\\\
\
\
ANSYS 5.2
SEP 25 1996
13:44:38
PLOT NO. 2
NODAL SOLUTION
STEP=I
SUB =i
TIME=I
SEQV (AVG¿
DMX =.066474
SMN =2043
SMX =106546
SMXB=I08963
A =7848
B =19460
C =31071
D =42683
E =54294
F =65906
G =77517
H =89128
I =100740
138

Temp at 35 sec (8-29-96 GEAE ]
/
/
Pressure
ANSYS 5.2
SEP 25 1996
I'1.( )'r I,K,.
NODAl. SOl,Ill'IONSTEP=I
SUB I
TIME=I
SEQV (AVG)
DMX =.049944
SMN =5516
SMNB=2881
SMX =84226
SMXB=85394
D =36i2_,
F :53S15G =62362
H =71107
I =79853
139

i
Temp at 50 sec [8-29-96 GEAE ), Therz
\
\ \\ \
\
\ \% %
%
%|% I
l
L5
\\\%
\, \
\
l
ss
L
\\\\\\,%
\
\%%
ANSYS 5.2
SEP 25 1996
13:51:42
PLOT NO. 1
ELEMENTS
TEMPERATURES
TMIN=235
TMAX=847
ZV =i
*DIST=.890955
*XF =2.969
*YF =.546815
EDGE
A =269
B =337
C :405
D =473
E =541
F =609
G =677
H =745
I =813
140

Temp at 50 sec {8-29-96 GEAE ),
' \
\\\\\\%
\%
ANSYS 5.2
SEP 25 1996
13:52:13
PLOT NO. 2
NODAL SOLUTION
STEP=I
SUB =i
TIME=I
SEQV (AVG)
DMX =.075288
SMN =4098
SMNB=446.484
SMX =111288
SMXB=II3732
A =10053
B =21963
C =33873
D =45783
E =57693
F :69603
G =81513
H =93423
I =105333
141

Temp an 50 sec (8-29-96 GEAE
ANSYS 5.2
SEP 25 1996
13:55:32
PLOT NO. 1
NODAL SOLUTION
STEP=I
SUB =I
TIME=I
S EQV (AVG )
DMX =.054793
SMN =4169
SMNB=3254
SMX =56793
SMXB=57496
A =7093
B =12940
C =18787
D =24634
E =30481
F =36328
G =42175
H =48022
I =53869
142

Te_ at. 60 sec (8-29-96 GEAE ), Thermalil
\\\\\
'\\, \
[ \
E \
%
%
ANSYS 5.2
SEP 25 1996
14:03:21
PLOT NO ; 1
ELEMENTS
TEMPERATURF._
TMIN=308
TMAX=882
ZV =I
*DIST=.978953
*XF =2. 892
*YF =.535817
EDGE
A =339.889
B =403.667
C --467.444
D =531.222
E =595
F =658.778
G =722. 556
H =786.333
I =850.111
143

\\\\
ANSYS 5.2
SEP 25 1996
14:03:49
PLOT NO. 2
NODAL SOLUTION
STEP=I
SUB =I
TIME=I
SEQV (AVG)
DMX =_080295
SMN =4585
SMNB=2502
SMX =101749
SMXB=103958
A =9983
B =20779
C =31575
D =42371
E =53167
F =63963
G =74759
H =85555
I =96351
\\
Temp at 60 sec (8-29-96 GEAE ), Thermal+
144
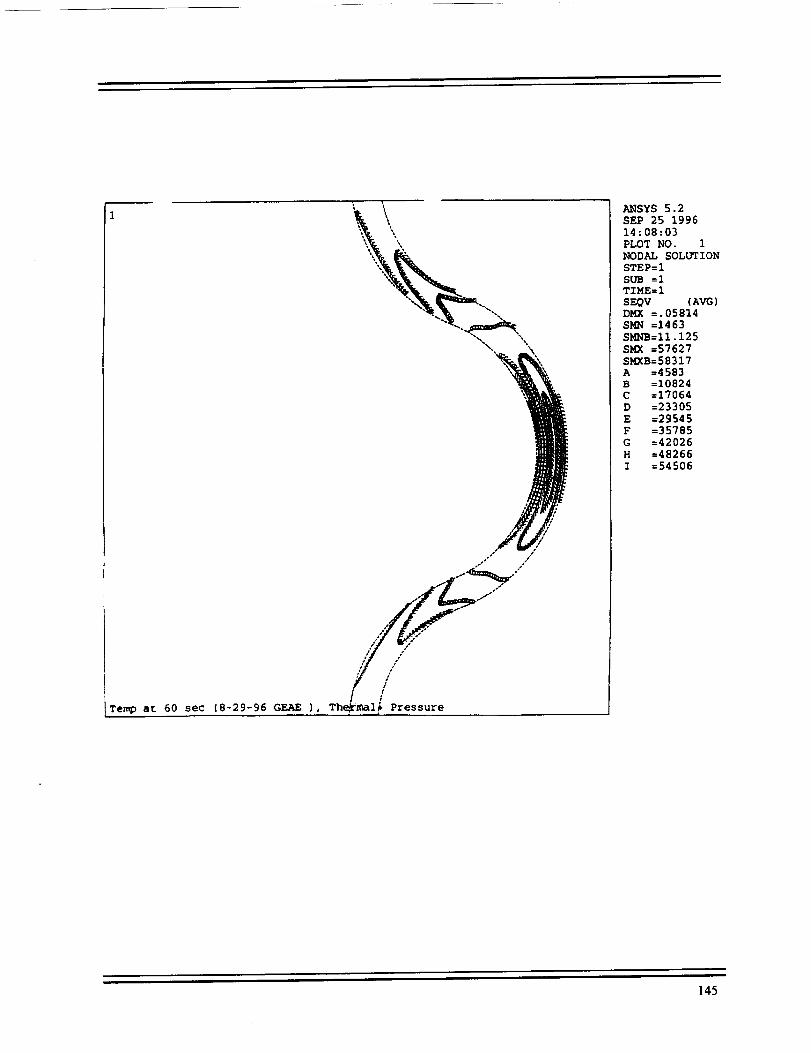
"" ",
".,,, \\
," /
•/" /
! /Tem{_ at 60 sec (8-29-96 GF_E; ), Th ,e_n_ml,_ Pressure
ANSYS 5.2SEP 25 199614:08:03PLOT NO. I
NODAL SOLUTION
STEP=I
SUB =1
TIME=I
SEQV (AVG)
DMX =.05814
SMN =1463
SMNB=11.125SMX =57627
SMXB=58317
A =4583
B =10824
C =17064
D =23305
E =29545
F =35785
G =42026
H =48266
I =54506
145
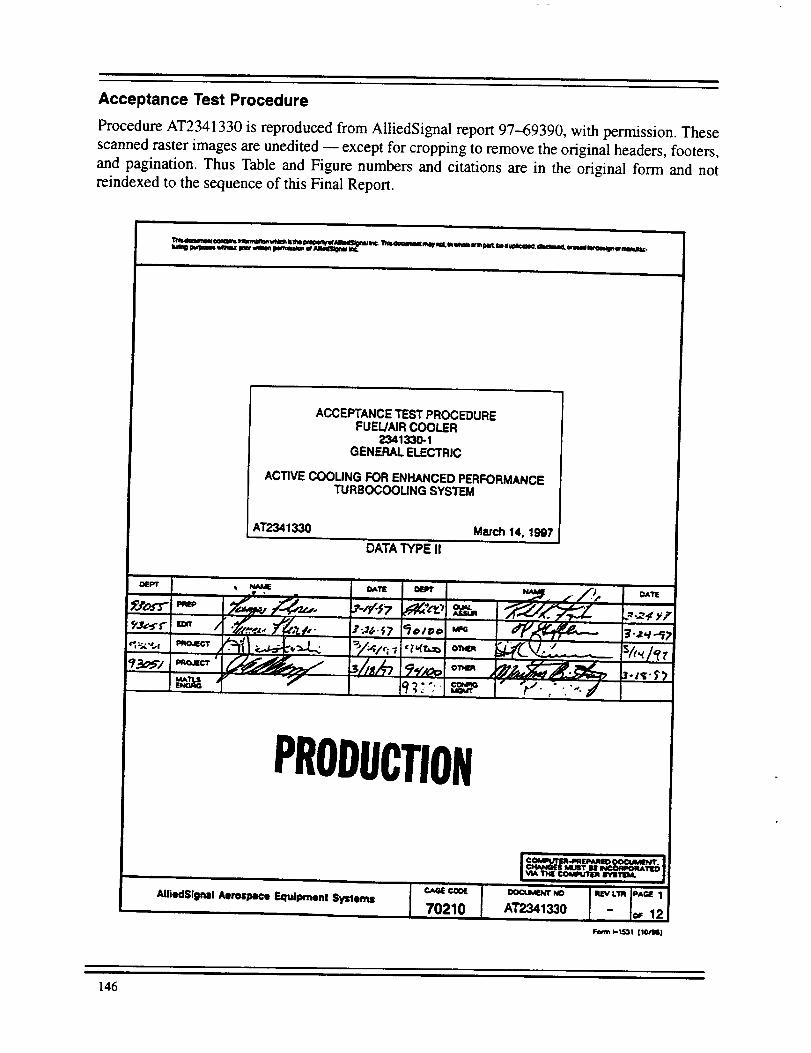
Acceptance Test Procedure
Procedure AT2341330 is reproduced from AlliedSignal report 97--69390, with permission. These
scanned raster images are unedited -- except for cropping to remove the original headers, footers,
and pagination. Thus Table and Figure numbers and citations are in the original form and not
reindexed to the sequence of this Final Report.
ACCEPTANCE TEST PROCEDUREFUEU/UR COOLER
2341330-1GENERAL ELECTRIC
ACTIVE COOLING FOR ENHANCED PERFORMANCETURBOCOOLING SYSTEM
AT2341330 Match 14. 1997
DATA TYPE II
lt RODI JI TI(IN
T IUl _'rlm II
THE ©olAptJ'rl_ IrfllSl'lM.nl i •
AnlioclSignalAerospaco,, SquJprr,on, s_err, s 70210 AT2341330 .[ - lc_ 12
146
1. SCOPE
This document spedfies the tests to be conducted on each research unit of theFuel/Air Cooler 2341330-1. Only those units which meet all of the test requirementsshall be accepted for delivery to the customer.
2. GENERAL TEST REQUIREMENTS
2.1 TEST LOCATION
All tests descn'bed herein will be performed at the AlliedSignal AerospaceEquipment Systems (AE$), Torrance, Card'omia.
2.2 AMBIENT CONDITIONS
Unless otherwise specified in an individual test description, all testing shall beconducted with the test unit at the ambient pressure and temperature existing in the testarea at the time of the test.
2.3 TEST SURVEILLANCE AND WITNESSING
The tests required herein shall be conducted under the surveillance of the AESquality assurance department. Authorized customer representatives(s) may witnessany or all testing.
2.4 TEST FACILITIES REQUIREMENT
The following special test equipment, or its equivalent, shall be used to conductthe test descn'bed in this document:
2.5
(a) Hydrostatic Test Stand
(b) Helium Leakage Test Stand
INSTRUMENTATION SELECTION AND CALIBRATION
Instrumentation shall be provided to measure the test parameters as listed in eachtest procedure below. The instrumentation shall be appropriate for the parameter beingmeasured. The accuracy of the instruments shall be verified and certified or verifiedand calibrated periocrcally in accordance with the applicable government, commercial,and AES-Torrance specifications and procedures. Any certified or verif'c_dand cali-brated insmJment may be used providing the accuracy requirements are met. Stan-dard convers'K)n factors shall be used to convert parameter values when the selectedinstrumentation units of measurement differ from those presented in the test procedure.The parameters to be measured, nominal test values and required accuracy at the testvalues are given in Table 1.
147

2.6 TEST TOLERANCES
The test tolerances for test conditions and requirements are specified within theapplicable paragraphs. The test tolerances are independent of the instrumentationaccuracy.
2.7 FAILURE REPORTING
2.7.1 Fa,ure Criteria
A failure is defined as any malfunction or combination of malfunctions thatdegrades any performance parameter to a level outside its specified performance limit.Every instance of performance outside of a performance limit, including intermittentoperation, is considered a failure unless sufficient supportive data are provided torecla_ the occurrence as an incident. Test f_qures considered for reclassification asan inddent will be demonstrated to be the direct result of:. (1) accidents, (2) operatorerror, and (3) test equ'_ment or test facility malfunction.
2.7.2 Failure ReportJr_ and Closeout
Should a failure occur, the test shall be stopped and the failure recorded on theapplicable data sheet in the acceptance test procedure and coordinated with theresponsible engineer.
TABLE
INSTRUMENTATION ACCURACY REQUIREMENTS
Parameter Nominal Test Required AccuracyTest Description Measured Value or Range at Test Value
Fuel circuit
Proof Pressure
Leakage
/_r drcu_
Proof Pressure
Leakage
Bothcircu s'd ng
Pressure"rime
Displacement(s ht ga.ge)Helium leakageT.'ne
PressureTime
Displacement(sight gauge)PressureT, ne
2339 psig5 minutesIcn9
1.0 x 10"sscc/sec1 minute
812 peig5 minuteslcr#
812 psig5 minutes250"F2 hours
!± 10peig±Ssec±.10 cms
1.0 x 10⁴ scc/sec±5 sec
±5±5see±.10 crr
±3"F± 5 min
148
2.8 TEST SEQUENCE
(a) Before test examination
(b) Fuel side proof pressure
(c) Air side proof pressure and leakage
(d) Fuel side internal leakage
(e| Fuel side external leakage
(f) After-test examination
2.9 DATA RECORD
Test data shall be recorded by the test technician on the data sheets provided inthe back of this document. As each test is performed, the test technician shall observeand record the data using black ink (erasures are not permitted). Each completed datasheet shall be signed and dated by the performing test technician, and stamped aseither accepted or rejected by qualified personnel. If the data sheet is stamped asrejected, a statement describing the discrepancy shall be written in the REMARKScolumn.
3. TESTS
Recordsof satisfactory completion of any required assembly operations,inspections, weighing, or tests not covered by It_is ATP are provided on the AssemblyOperat_-i and Inspection Record (AOIR), Assembly Inspection Traveler (AIT), or othertravele'. Procedures are specified, as apprcable, in documents such as theManufacturing Operations and Tooling (MOT) and Quality Assurance procedures.
3.1 BEFORE TEST EXAMINATION
Before performing the tests described herein, the test technician shall examine theunit for any evidence of physical damage such as cracks, dents, harmful scratches,etc., and record the results on the data sheet
3.2 FUEL SIDE PROOF PRESSURE AND LEAKAGE
CAUTION: DURING ANY HIGH PRESSURE TEST, CARE MUST BE TAKEN TOPROTECT PERSONNEL AND SURROUNDINGS AGAINST EXPLO-SION HAZARD.
3.2.1 Setup
Connect one -16 fuel port to a static pressure fitting and plug all other fuel ports.Connect the static pressure _ting to a hydrostatic pressure source. Fiil the air circuitwith water and seal _ a'u"side bosses and flanges except the one which will be con-nected to a sight gage. See Rgure 1. Place the unit in a safety enclosure or completelyimmerse it in a safety water bath.
149

PRESSURE (_GAUGE
.e-.--- PRESSURE REGULATEDPRESSURESOURCE
[ ! J:l oucT
/ -16 AIRPOFrT / -4 FUELPORT SAFETYWATERBATHPLUGGED OR ADEQUATESAFETY
-4 NR PORT FUEL PORT 4 PLACES ENCLOSUREPLUGGED PLUGGED(4 PLACES)
IG-309:12-1
Figure 1. Fuel Circuit Proof Pressure Setup
150

3.2.2 Procedure
Hydrostaticallypressurize the fuel side to 2339 (+24, -0) psig. Close off thepressure source at a point as close to the unit as practical and hold for 5 minutes mini-mum. Observe the air side sight gauge for displacement indicating leakage.
After release of the applied pressure, there shall be no evidence of permanentdeformation (bulging or buckling). If the unit exhibits any pressure decay, external leak-age, or sight gauge displacement, a pneumatic pressure test at 100 (+ 10, -0) psigmay be conducted to detect the exact location of the leakage.
3.2.3 Acceptance Criteria
There shall be no visible external leakage, no pressure decay due to leakage, andno sight gauge displacement. To accommodate temperature related expansion or con-lzaction of fluid volume, a minute sight gauge displacement, not to exceed 1 cc perminute of test duration (not to be interpreted as a rate, but rather a maximum), is per-missible. In addition, minor variations in pressure gauge readings (less than .25% ofthe applied pressure) are permissible in either direction.
3.2.4 D_ing
Dry _ unit within 24 hours in an oven at 250 _25"F for at least 2 hours. Leaveall ports open to allow free circulation of air.
3.3 AIR SIDE PROOF PRESSURE AND LEAKAGE
This test is to be conducted hydrostatically.
CAUTION: DURING ANY HIGH PRESSURE TEST, CARE MUST BE TAKEN TOPROTECT PERSONNEL AND SURROUNDINGS AGAINST EXPLO-SION HAZARD.
3.3.1 Seep
Seal one air flange, four -4 air side bosses, and one -16 air side bess. Connectother air flange to a hydrostatic pressure source. Fill the fuel circuit with liquid, seal
all fuel side bosses except one which will be connected to a sight gauge. See F_ure 2.
3.3.2 Procedure
Apply a hydrostatic pressure of 812 (+10, -0) psig. Close off the pressuresource at a point as close to the unit as practical and hold for 5 minutes minimum.Observe the fuel side sight gauge for displacement indicating leakage.
3.3.3 Acceptance Criteria
There shall be no visible leakage, no pressure decay due to leakage, and no sightgauge displacement. A minute sight gauge or pressure gauge movement as defined inparagraph 3.2.3 is permiss_le to accommodate temperature related changes in fluidvolume.
151

PRESSUREREGULATEDHYDROSTATIC PRESSURE
GAUGE
PLUGGED PLUGGED _-4 FUELPORTPLUGGED
4 PLACES -16 AIR PORT 4 PLACESPLUGGED
SkrEW WATER BATHOR ADEQUATESAFETYENCLOSURE
IG-3o11_-2
Figure 2. Air Circuit Proof Pressure and Leakage Setup
152

After release of the applied pressure, there shell be no evidence of permanentdeformation (bulging or budding). If the unit exhibitsany pressure decay, external leak-age, or sight gauge displacement, a pneumatic pressure test at 100 (+ 10, -0) psigmay be conducted to detect the exact location of the leakage.
3.3.4 Dryi_
Dry the unit within 24 hours in an oven at 250 _+25"F for at least 2 hours. Leaveall ports open to allow free circulation of air.
3.4 FUEL SIDE INTERNAL LEAKAGE
NOTE: PRIOR TO PERFORMING THIS HELIUM LEAKAGE TEST, CLEAN THEUNIT INTERNALLY TO REMOVE ALL RESIDUE.
3.4.1 Test Setup
Plug one -16 and four -4 fuel ports. Connect the remaining -16 fuel port to a he-lium mass spectrometer leak detector. On the air side, cap one air flange, plug four -4air ports, plug one -18 air port, and connect t_e remaining air flange to a regulated he-lium source. See Figure 3.
3.4.2 Test Procedure
Using the leak detector vacuum roughing pump, evacuate the fuel circuit until theleak detector can be switched to the test mode. Apply helium at atmospheric pressure,± .5 psi, to the air circuit. Measure the leakage rate for a minimum of 1 minute.
3.4.3 Success Criterion
The leakage rate shall not exceed 1.0 x 10"sscc/sec for a minimum of 1 minute.
3.5 FUEL SIDE EXTERNAL LEAKAGE
3.5.1 Test Setup
Plug one -16 and four -4 fuel ports. Connect the remaining -16 fuel port to a he-lium mass spectrometer leak detector. On _ air side, all flanges and ports shall re-main open to allow the flow of helium into the cooler air circuit. Insert entire unit into anenclosure (plastic bag will suffice) capable of containing a regulated helium environ-ment. See Rgure 4.
3.5.2 Test Procedure
Using the leak detector vacuum roughing pump, evacuate the fuel circuit until theleak detector can be switched to the test mode. Apply helium at atmospheric pressure,_+.5 psi, to the enclosure surrounding the unit. Measure the leakage rate for a rrdni-mum of I minute.
153

-4 NR PORT
pLUGGeD)4 PLACES
NR FLANGE __
C_PED _]
-16 AIR PORT
pLUGGED)
-16 FUEL PORTP_GED)
HEUUM MASSSPECTROMETER
L_ETECTOR
E-1
t!I P
1--4 FUEL PORT(PLUGGED)4 PLA_
Rgure 3. Fuel Circuit Internal Leakage Setup
_)He SOURCE
IG_4
-4 AIR PORT
(OPEN)4 PLACES
AIR FLANGE I
-16 AIR PORT -16 FUEL PORT
(OPEN) pLUGGED)
HELIUM MASSSPECTROMETER
ENCLOSED AREA FORCONTNNMENT OF HELIUM
1
AIR FLANGE
(OPEN)
-4 FUEL PORTpLUGGED)4 PLACES
IG.-:_I2-S
Figure 4. Fuel Circuit External Leakage Setup
154

3.5.3 Success Criterion
The leakage rate shall not exceed 1.0 x 10-s scc/sec for a minimum of 1 minute.The difference between the internal leakage rate as measured in para 3.4, and the leak-age rate measured in this section, will determine the presence of external leakage, anditscorresponding rate.
3.6 CLEANUNESS
At the conclusion of anacceptance tests, flush each circuitfor5 minutes minimumwith an aqueous solution of duracJean 212, followed by a de-ionized water flush for 5minutes minimum. Dry unit within 24 hours in an oven at 250"F __.25"F for 2 hoursminimum. Leave all ports open to allow free circulation of air.
3.7 AFTER-TEST EXAMINATION
After all tests have been completed, the test technician shall visua_ examine theunit for any evidence of physical damage such as cracks, dents, harmful sc='atches,etc.Record the results on the finaldata sheet.
DATA SHEETPAGE 1 OF 1
PART NAME Fuel/Air Cooler MFGSERIAL NO.
PART NO. 2341330 NAMEPLATESERIAL NO.
Required
Para. Measurement or Observation Min Max Actual
3.1 BEFORE TEST EXAMINATION Accept _ Reject3.2 FUEL SIDE PROOF PRESSURE
Applied pressure, psigDuration, minute
3.3
3.4
3.5
3.63.7
2339 23635
Sight gauge displacementVisible deformation
Drying: 250 _+25"F for 2 hrAIR SIDE PROOF PRESSURE
Applied pressure, psigDuration, minuteSight gauge displacement
Visible leakage, interpassageVisible leakage, externalVisible deformation
"Drying: 250 _25"F for 2 hrFUEL SIDE INIP.HNAL LEAKAGE
Duration, minutes
Leakage rate, scc/sec, heliumFUEL SIDE EX i P..RNALI _A.KAGE
Duration, minutesLeakage rate, scc/se¢, helium
CLEANUNESSAFTER-TEXT EXAMINATION
NoneNone
Technician's Initials
r812 822
5None-
NoneNoneNone
Technician's Initials
m
-- 1.0 x 10.=
I
' I -- 1.0x 10 .=Technician's Initials
Accept Reject
155

Appendix B- Instrumentation List
ACM Cart PS Parameters
TERM POS
2
3
4
6
7
8
9
COMP NAME
PT81 AA
PT81BB
PT82AA
PS84HX
PS85HX
PS855X
PT90AA
11 PT92AA
12 PT92BB
13 PBRGF1
14
15
16
17
18
19
PBRGF2
PCVACT
NA DPFFLT
NA PFULEX
NA PFUL37
NA
NA
PARAMETER
COMP INLT PT
COMP EXIT PT
HX2 AIR INLT PS
HX2 INTRM AIR PS
HX1 AIR INLT PS
ACM TRBN INLT PT
ACM TRBN EXIT PT
AIR BRNG FLTR P1
uP2
BLEED CV ACTUATOR PS
AVG
A01
A01
FUEL FLTR DP 25D
FUEL FROM HX2
INTERM FUEL PS
PF361N FUEL INLT TO HX1
DPBFLT AIR BRNG FLTR DP
ZVACM2
ZHACM1
XNTC81
VERT ACM VlBE
HOR ACM VlBE
ACM SHAFT SPEED
RANGEII
400A
400A
u
u
350A
100A
350A
u
100A
1200A
1200A
1200A
5D
10MtL
10MIL
120K RPM
156

ACM Cart MB A Parameters
TERM POS
MB A1
COMPNAME PARAMETER
MB REFERANCE
AVG RANGE
REF
2 TT81AA ACM COMPR INLT TT A03 1000F
3 TT81BB " " "
4 TT82AA " EXIT TT " "
TA84HX6 HX2 AIR INLT TT
HX2 INTERM AIR -IT7 TA85HX
400F
800F
8 TA855X HX1 AIR INLT TT 800F
9 TT90AA ACM TRBN INLT TT A03 400F
11 TT92AA ACM TRBN EXIT IT " 100F
12 TT92BB ....
14 TKDM01 HX2 AIR INLT DOM TSRF-1 1200F
15 TKDM02 "TSRF-2 " "
16 TKDM03 "TSRF-3 " "
17
18
TKDM04
TKDM05
TFUL37
"TSRF-4
"TSRF-5
INTRM FUEL TT 700F
FUEL EXIT FROM H2X R05 1000F
REFRENCE
DYN FUEL PS AT CMBSTR MAN.
HC SNIFFER @ TRBN INLT
HC SNIFFER @ ACM CART
20
21 TFLEX1
25 REF
PFLDYN
HSCN01
HSCN02
TBD
TBD
157
Combustor
TERM POS
HOK B1
2
3
4
6
10
11
Vehicle PS
COMPNAME
PSB31N
PTCOM1
PTCOM2
PTCOM3
PS41AA
PS41AB
PS41AC
PT40A1
PT40A2
PT40A3
PT40A4
PARAMETER
BLEED PORT ADAPT PS
COMBIN_ PT
COMB DISCH PS
COMB DISCH PT, GAS SAMP RAKE
AVG
R01
A03
A05
12 PT40A5 " u "
13 PT40B1 " u "
14 PT40B2 u . .
15 PT40B3 u u "
16 PT40B4 " " "
17 PT40B5 " " u
u18 PS31XX Diffuser dnstrm Ps.
19
20
21
22
23
24
HSCN03 HC SNIFFER AT FUEL MAN.
PCMDYN COMB KULITE
PFMANX COMB FUEL MAN PS
RANGE
350A
350Au
u
350
u
u
350
u
u
10psi ptp
1000A
158

Combustor
TERM POS
MB B1
2
3
4
5
Vehicle MB B
COMP NAME PARAMETER
REF REFERENCE
TKFMAN FUEL MAN SKIN TC
TKCLU1 COMB UPR LNR SKIN TC
TKCLU2 COMB UPR LNR SKIN TC
TKCLU3 COMB UPR LNR SKIN TC
i
AVG RANGE
1000F
1600F
1600F
1600F
6 TKCLU4 COMB UPR LNR SKIN TC 1600F
7 Delete
8 TKCLL1 COMB LWR LNR SKIN TC 1600F
9 TKCLL2
TKCLL3
COMB LWR LNR SKIN TC
COMB LWR LNR SKIN TC10
1600F
1600F
11 TKCLL4 COMB LWR LNR SKIN TC 1600F
12 Delete
13 TT30AX COMB INLET TT A05 1000F
14 TT30BX " " "
15 TT30CX " " "
TTHUBX
TTMTR1
TT3BIN
TFLNOZ
TKTERM
TKARM1
TKARM2
16
17
TRAV HUB COOLING TEMP
TRAV MOTOR 1 TEMP
BLEED HOSE ADPTR "IT
FUEL MANIFOLD TT
ACTUATOR TERM STRIP TEMP
TRAV RAKE ARM TC
TRAV MOTOR 2 TEMP
18
19
20
21
22
23
24
TKARM3
TTMTR2
250F
900F
1000F
159

Combustor Venicle Traverse
TERM POS
NA
COMP NAME
TT39A1
PARAMETER
TRAV RAKE TT
AVG
A10COMB DISCH R10
NA TT39A2 COMB DISCH TRAV RAKE TT R10 A10 3200F
NA TT39A3 COMB DISCH TRAV RAKE TT R10 A10 3200F
NA TT39A4 COMB DISCH TRAV RAKE TT R10 A10 3200F
NA TT39A5 COMB DISCH TRAV RAKE TT R10 A10 3200F
NA TT39A6 COMB DISCH TRAV RAKE TT R10 A10 3200F
NA TT39B1 COMB DISCH TRAV RAKE TT R10 A10 3200F
NA TT39B2 COMB DISCH TRAV RAKE TT R10 A10 3200F
NA TT39B3 COMB DISCH TRAV RAKE TT R10 A10 3200F
NA TT39B4 COMB DISCH TRAV RAKE TT R10 A10 3200F
NA TT39B5 COMB DISCH TRAV RAKE TT R10 A10 3200F
NA TT39B6 COMB DISCH TRAV RAKE TT R10 A10 3200F
RANGEi
3200F
Facility PS
TERM POS COMP NAME
P1MAOA
PARAMETER
MAIN AIR ORF
AVG
A01
RANGE
400A
P1MAOB " " "
P2MAOA " A03 400A
P2MAOB " " "
P1W10A WEST 10" BLD ORF A01 100A
PlWl0B " " "
P2Wl 0A " A03 "
P2Wl 0B " " "
PTRVCL TRAV COOLING, COLD CA SPLY 400A
PSQNRN 1000APS QUENCH, RING
PS QUENCH, BARS
FAC PURGE MANIFOLD
PS QUENCH, HUB/RAKES
EXHAUST DUCT PS
PSQNBR
PSPURG
PSQNHB
PSEXHD
1000A
500A
1000A
20A
160

Facility Temperatures
TERM POS COMP NAME PARAMETER AVG
T1MAOA MAIN AIR ORF TT A03
T1MAOB " " "
T110WA WEST 10" BLD ORF TT R03 100F
T 110WB " " "
TSEVEN BLAST GATE TT (T7) 500F
TTEXHD EXHAUST DUCT TT 500F
RANGE
1000F
Facility Fuel
TERM POS COMP NAME PARAMETER AVG RANGEi
CPSMAN FUEL FLOW METER, FM3066 900pph
CPSVER ", FM3067 " "
PFMANA FLOW METER PS A05 1200A
PFMANB " " "
TFUELA FUEL TT AT FLOWMETER R05 AMB
TFUELB " " "
161

Appendix C- Phase I Performance Calculations
This appendix presents a listing of the Phase I performance calculations program together with a test
case.
CC
C
CC
C
CC
CC
C
CC
CC
C
CC
CC
CC
CC
C
CC
CC
C
CC
C
CC
CC
CC
C
C
CC
C
Created for ACEP Test Program in CA19.
[ PURPOSEI
PHASE I CALCULATIONSBASED ON MEASURED EU'S, CALCULATEDAVG'S
I ADS SECTION I
PROCEDUREFOR RUNNINGA TEST CASE:
embedded test case
external test case
PROCEDUREFOR EXECUTION:
PROGRAM RUNS UNDER AUTOPROCESSING.
I SUBROUTINESECTION I
LIBRARIES:
FULL FUEL THERMO ROUTINES NOT INCLUDED
SPECIAL :
] COMMONS I
GLOBAL : NONE
PRIVATE SHARED: NONE
162

C
C
C
C
C
C
C
C
C
C
C
C
C
C
C
C
C
C
C
C
C
C
C
C
C
C
C
C
C
C
C
C
C
C
C
C
C
C
C
C
C
C
C
C
C
C
C
C
C
C
C
C
C
C
I SPECIAL INSTRUCTIONS I
UNITS TABLE DEFINITIONS:
I : CUBIC IN
2 : INCHES
3 = CUBIC FT
4 = FEET
5 = SQ IN
6 = FT/SEC7 = PERCENT
8 = LBS
9 = LB/HR
10 = LB/SEC
11 = LB/HR/LB
12 = BTU/LB13 = PPH
14 = SCFM
15 = PSIG
16 = PSI
17 = PSIA
18 = PSID
19 = RPH/PSIA
20 = GRAINS
21 = UNITS
22 = DEGREES
23 = DEG F
24 = DEG R
25 = RPM
26 = GPM
27 = MPH
28 = VDC
TYPEFL - TYPE OF FUEL AND VISCOSITY DATA REFERENCE
I.O----JP4 - ESSO *
2.0----JP4, JET B - CRC **
3.0....JPS, - ESSO
4.0----JP5, JET A, JP-8 - CRC
5.0----JP7 - CRC
6.0----MARINE DIESEL - GE TM 81-315, SHAYESON
* ESSO = DATA BOOK FOR DESIGNERS
Aviation Fuels and Lubricating Oils
Complied by ESSO Standard Oil Company
December 1, 1956
** CRC = HANDBOOK OF AVIATION FUEL PROPERTIES
COORDINATING RESEARCH COUNCIL
CRC REPORT NO. 530
May 1984
163
C
C
C SPECIAL NOTES:
C
C
C
C
C
C
C
C
C
$1,EU
$$1,CON
I DEFINITION OF MAJOR VARIABLES I
MAJOR VARIABLES FOLLOW DATA BASE CODE DEFINITION.
PSB31N
PSB3EX
PS84HX
PS85HX
PSB55X
PBRGF1
PBRGF2
PFULEX
PFUL37
TA84HX
TA85HX
TA855X
TKDM01
TKDM04
TFUL37
PFMANX
CPSMAN
CPSVER
PFMANA
PFMANB
TFUELA
TFUELB
XNTC81
PF361N
PSEXHD
PBAR01
TFLNOZ
256.11
196.08
309.31
290.46
290.5
350.0
345.0
547.41
551.54
1050.1
664.
664.
1050.
1050.
538.
930.
679.64
679.64
930.
930.
lOO.
100.
66145.
554.76
15.0
14.4
873.5
BCRC81
BCRCgl
BCRC84
DIA91
GRAV
CJ
GAM
CPAIR
CPFULI
CPFUL2
HV
PFLOW
1.03
0.985
1.045
4.75
32.2
778.16
1.33
0.24
0.52
0.8357
18200.0
20.0
164
PFHIGHPFTOLTFLOW
TFHIGHTFTOL
MAODIAFt_OPIPMAOTYPWBODIA
WBOPIPWBOTYPCONXNBYPCON
$$1,MA
SGFUEL
TFSG01
TYPEFL
RUNNUM
POINT
$$1,AVG
AVPT81
AVPT82
AVPT90
AVPT92
AVTT81
AVTT82
AVTTgO
AVTT92
RTFLEX
RPTCOM
AVPS41
AVPT40
AVTT30
AVTT39
AVPIMA
AVP2MA
AVPIW1
AVP2W1
AVTIMA
RT110W
RTFUEL
$$B,BANNER
RUNNUM
POINT
$SO,CALl
WAMAIN
WAACM
WF36AV
WACOMB
DTCOMB
1500.0
5.0
-10.0
120.0
10.0
5.875
11.75
1.0
4.0
8.0
1.0
1.0
O.7978
0.81
68.0
1.0
1.0
2.0
196.08
309.96
276.69
53.08
859.
1050.1
294.1
52.
873.5
275.43
255.75
255.45
859.
2563.3
366.1
275.43
53.08
49.81
859.0
52.0
100.0
<10>
<10>
<9>
<10>
<23>
165

FARCOM
ETACOM
WFULNZ
DPFNOZ
FNDPSY
FNNOZ
DPCOMB
DPCOMP
FFCOMB
AECOMB
DPEXHD
PRACM
DPACM
DPBFLT
DPFFLT
EFCTHX
P84DQ8
H4RK
DPFLXQ
AVPT39
WCOMB
AVGWF
WAR
AVFUEL
T4RKAV
SWT4RKDPPTP
$
$O,CAL2
THT81
DLT81
WCOR81
P82Q81
T82Q81XNR81
ETA81
PW81
T81CF
T82CF
PW81C
ETA81C
WR81CM
XNR81C
SMW81
$
$O,CAL3
WCOR90
P92Q90
PgOQ92
ETA90
UTIP90
XNRgO
PW90
ETAMEC
<RAT>
<9>
<18>
<18>
<7>
<5>
<18>
<RAT>
<18>
<18>
<18>
<RAT>
<RAT>
<RAT>
<23>
<7>
<10>
<25>
<HP>
<23>
<23>
<HP>
<RAT>
<LBM/MIN><25>
<7>
<10>
<6>
<25>
<HP>
166

FV90
T92CF <23>
ETAgOC <RAT>
PW90C <HP>
S$O,CAL4
EFFHXI
QAIR85 <B/SEC>
WCAP85 <B/SEC/DEG>
DPQP85TAAVG1 <23>
QFL85H <B/HR>
QFL85S <B/SEC>
FCAP85 < B/SEC/DEG>
TFAVG1 <23>
UAHXMI <B/HR/DEG>
CMNHXl <B/SEC/DEG>
CRHXl
XNUTMI
ARGI
EFHXM1
S$O,CAL5
EFFHX2
QAIR84 <B/SEC>
WCAP84 <B/SEC/DEG>
DPQP84
TAAVG2 <23>
QFL84H <B/HR>
QFL84S <B/SEC>
FCAP84 <B/SEC/DEG>TFAVG2 <23>
UAHXM2 <B/HR/DEG>
CMNHX2 <B/SEC/DEG>CRHX2
XNUTM2
ARG2
EFHXM2
PQM3
DTHDR <22>
SEND
C
C
REAL*4 MAODIA,MAOPIP,MAOTYP,MAODPQ
PROGRAM CONSTANTS
INCLUDE "constx"
CHARACTER*6 CVWFMN /'CVWFMN'/
CHARACTER*6 CVWFVF /'CVWFVF'/
JFUELX USED BY SUBROUTINE FUELX
INTEGER JFUELX(IO)
167

CCCCCCCC
JHUMBA USED BY SUBROUTINE HUMBAR
INTEGER JHUMBA(IO)
$DBI
CALL PUTLAB(O,'ENGINEERING UNITS')
$P,EU
CALL PUTLAB(O,'AVERAGES')
SP,AVG
CALL PUTLAB(O,'CONSTANTS')
$P,CON
CALL PUTLAB(O,'IVt_NUALINPUTS')
$P,MA
CALCULATIONS:
FUEL FLOW CALCULATIONS FOR VOLUMETRIC METERS
ITEST,SGFUEL,TFSGO1,TYPEFL,PFLOW,PFHIGH,PFTOL,TFLOW,
TFHIGH,TFTOL are config constants and manual inputs
C **** FACILITY TOTAL fuel flowmeters
C
CALL FUELX(ITEST,SGFUEL,TFSGOI,TYPEFL,CPSMAN,TFUELA,
& PFMANA,CPSVER,TFUELB,PFMANB,CVWFMN,CVWFVF,
& PFLOW,PFHIGH,PFTOL,TFLOW,TFHIGH,TFTOL,
& TFMTOT,TFVTOT,TFUELT,DTFTOT,PFMTOT,PFVTOT,
& PFMQVF,WFI'IAIN,WFVERI,GPMTTM,GPMTTV,SG6060,
& PSCM,PSCV,JFUELX)
Average of fuelflows for main and verif, meters
AVWFTT = (WFMAIN + WFVERI) * 0.5TF361N=RTFUEL
WFTTDF = ABS( 100. * (1.-(WFMAIN/WFVERI)))
IF (WFTTDF .GT. 5.0) THEN
WRITE(IERMSG,IO01) PROGID
WRITE(IERMSG,IOO4)PROGID,WFTTDF
END IF
1001FOR_t_T(AIO,6X)
1004 FORMAT(AIO,6X,'***** WARNING : WFMAIN vs WFVERI DEVIATION(_)=',
&F15.5," *****')
IF(JFUELX(4) .NE. 0.0) THEN
WRITE(IERMSG,IO01) PROGID
WRITE(IERMSG,1200) PROGID,DTFTOT
1200 FORMAT(AIO,6x,'WARNING : TOTAL FUEL FLOWMETER TEMP. SPREAD =',
&FIO.3,'DEG F')
END IF
AIR FLOW CALCULATIONS
MAOPIP = Pipe dia.MAODIA --Orifice dia.
MAOBET = Orifice Beta ratio
168

WAMAIN = 0.0
MAODPQ= (AVPIMA-AVP2MA)/AVP1MA
CALL AIRFLO(AVPIMA,AVP2MA,AVTIMA,MAOPIP,MAODIA,MAOTYP,WAMAIN)
IF(MAODPQ .GT. O.35)THEN
WRITE(IERMSG, 130O)PROGID
END IF
1300 FORMAT(/2X,"WARNING: MAO DP/P EXCEEDS 0.35")
CALL AIRFLO(AVPIWI,AVP2W1,RTIIOW,WBOPIP,WBODIA,WBOTYP,WAACM)
WBODPQ=(AVPIW1-AVP2WI)/AVPIW1
IF(WBODPQ .GT. O.35)THEN
WRITE(IERMSG, 1310)
1310 FORMAT(/2X,"WARNING: WBO DP/P EXCEEDS 0.35")
END IF
IF(WBODPQ .LE. O.01)THEN
WAACM = 0.0
END IF
ACM COMPRESSOR:
THT81=(AVTT81+C459)/518.7
DLT81=AVPT81/14.696
WCOR81=WAACM*SQRT(THT81)/DLT81*BCRC81
P82Q81=AVPT82/AVPT81
T82Q81=(AVTT82+C459)/(AVTT81+C459)
XNR81=XNTC81/SQRT(THT81)
H82D8S = HT(TCSTP(AVTT81+C459,P82Q81))-HT(AVTT81+C459)
H82D81 = HT(AVTT82+C459)-HT(AVTT81+C459)
ETA81 = 999.
IF (H82D81.NE.O.O) ETA81 = H82D8S/H82D81
PW81=WAACM*BCRC81*H82D81*1.4148
PQM3=PSB31N/AVPT81
T81QM=(1.+((BCRC81-
& I.)*(AVTT90+C459)+4.3/(WAACM*O.245))/(AVTT81+C459))/BCRC81
T81CR=(AVTT81+C459)*T81QM
TDJC=1.71/(WAACM'O.245*(BCRC84-BCRC81))
T82QM=(BCRC84-(AVTT90+C459+TDJC)*(BCRC84-
& BCRC81)/(AVTT82+C459))/BCRC81
T82CR=(AVTT82+C459)*T82QM
H82DC=HT(T82CR)-HT(T81CR)
H82DCS=HT(TCSTP(T81CR,P82Q81))-HT(T81CR)
ETA81C= -999.
IF(H82DC.GT.O.O) ETA81C=H82DCS/H82DC
PW81C=WAACM*BCRC81*H82DC*1.4148
XNR81C=XNR81/SQRT(T81QM)
WR81CM=WCOR81*SQRT(T81QM)*60.
PQ81S=(2.79E-4*WR81CM+2.94E-2)*WR81CM+O.827064
SMW81=(PQ81S/P82Q81-1.)*100.
169

ACM TURBINE:
WCORgO=WAACM*SQRT(AVTT90+C459)/AVPTgO*BCRC91
Pg2QgO=AVPTg2/AVPT90
PgOQ92 = I./P92QgO
H9ODgS = HT(AVTTgO+C459) - HT(TCSTP(AVTTgO+C459,P92Q90))
HgOD92 = HT(AVTTgO+C459) - HT(AVTT92+C459)ETA90 = 999.
IF (HgODgS.NE.O.) ETA90 = H90D92/HgODgS
UTIPgO=XNTC81*DIA91/229.2
XNRgO = XNTC81/(SQRT((AVTT90+C459)/518.7))
FV90 = UTIPgO/SQRT(2.*GRAV*CJ*HgOD9S)/O.707PwgO=WAACM*BCRC91*HgOD92*1.4148
Tg2QM=(1.-(I.-BCRCgl)*(AVTTgO+C459+TDJC)/(AVTTg2+c459))/BCRC91
Tg2CR=(AVTTg2+c459)*Tg2QM
HgODC=HT(AVTTgO+C459)-HT(Tg2CR)ETA90C= -999.
IF(HgODgS.GT.O.) ETAgOC=HgODC/HgODgS
Pwgoc=WAACM*BCRC91*HgODC*I.4148
ETAMEC=PW81C/PW90C
PP-ACM=AVPT81/AVPT92DPACM=AVPT81-AVPT92
DPBFLT=PBRGF1-PBRGF2
HEAT EXCHANGER 1, FUEL INLET:
WF36AV=AVWFTT
EFFHX1=(TA855X-AVTTgO)/(TA855X-TF36IN)
QAIR85=WAACM*BCRC84*(HT(TA855X+C459)-HT(AVTT90+C459))
WCAP85=WAACM*BCRC84*CT(TA855X+C459)
IF (TA855X.NE.AVTTgO) WCAP85=QAIR85/(TA855X-AVTTgO)
DPQP85=(PS855X-AVPT90)/PS855X
TAAVG1=(TA855X+AVTT90)/2.0
CALL J50PTX(PF361N,TF361N,O.,HFULIN,SFULIN,DUM1,CPFIN,DNFIN,DUM2,
& PRNFIN,DUM3,THCFIN,DUM4,VSCFIN)
CALL J50PTX(PFUL37,TFUL37,0.,HFUL37,SFUL37,DUM1,CPF37,DNF37,DUM2,
& PRNF37,DUM3,THCF37,DUM4,VSCF37)
QFL85H=WF36AV *(HFUL37-HFULIN)
QFL85S= QFL85H/3600.O
FCAP85= WF36AV*CPFIN/3600.
IF (TFUL37.NE.TF361N) FCAP85= QFL85S /(TFUL37-TF361N)TDAF11 = TA855X-TFUL37
TDAF12 = AVTTgO-TF36IN
TDLX1 = MAX(O.5*(TDAFII+TDAF12),I.0)
TFAVGI = (TF361N + TFUL37)/2.
IF (TDAF11.NE.TDAF12.AND.TDAF11.NE.O.O.AND.TDAFI2.NE.O.O)
& TDLXI = (TDAFII-TDAFI2)/ALOG(TDAF11/TDAF12)
UAHXM1=QAIR85/TDLXI*3600.
CMNHXI=MAX(O.1,MIN(WCAP85,FCAP85))
IF (WCAP85.EQ.CMNHXI) CRHX1 = WCAP85/FCAP85
IF (FCAP85.EQ.CMNHX1) CRHXI = FCAP85/WCAP85
XNUTMI= UAHXMI/(CMNHX1*3600.)
ARGI=EXP(XNUTMI*(CRHXI-I))
EFHXMI=(I-ARGI)/(I-CRHXI*ARG1)
170

HEAT EXCHANGER 2, HOT FUEL:
EFFHX2=(TA84HX-TA85HX)/(TA84HX-TFUL37)
TAAVG2=(TA85HX+TA84HX)/2.0
CP8485=CT(TAAVG2+C459)
QAIR84 = WAACM*BCRC84*(HT(TA84HX+C459)-HT(TA85HX+C459))
WCAP84=WAACM*BCRC84*CT(TA85HX+C459)
IF (TA84HX.NE.TA85HX) WCAP84= QAIR84/(TA84HX-TA85HX)
DPQP84=(PS84HX-PS85HX)/PS84HX
CALL J5OPTX(PFULEX,RTFLEX,O.,HFULEX,SFULEX,DUM1,CPFEX,DNFEX,DUM2,
& PRNFEX,DUM3,THCFEX,DUM4,VSCFEX)
QFL84H= WF36AV*(HFULEX-HFUL37)
QFL84S= QFL84H/3600.
FCAP84 = WF36AV*CPF37/3600.
IF (RTFLEX.NE.TFUL37) FCAP84= QFL84S/(RTFLEX-TFUL37)
TFAVG2=(RTFLEX+TFUL37)/2.0TDAF21 = TA84HX-RTFLEX
TDAF22 = TA85HX-TFUL37
TDLX2 = MAX(O.5*(TDAF21+TDAF22),1.0)
IF (TDAF21.NE.TDAF22.AND.TDAF21.NE.O.O.AND.TDAF22.NE.O.O)
& TDLX2 = (TDAF21-TDAF22)/ALOG(TDAF21/TDAF22)
UAHXM2= QAIR84/TDLX2*3600.
CMNHX2= MAX(O.1,MIN(WCAP84,FCAP84))
IF (WCAP84.EQ.CMNHX2) CRHX2 = WCAP84/FCAP84
IF (FCAP84.EQ.CMNHX2) CRHX2 = FCAP84/WCAP84
XNUTM2= UAHXM2/(CMNHX2*3600.)
ARG2=EXP(XNUTM2*(CRHX2-1.O))
EFHXM2=(I.-ARG2)/(I.-CRHX2*ARG2)
DPFFLT = PFULEX - PFMANX
DTHDR=TA84HX-TKDM04
OVERALL HEAT X PERFORMANCE, COOLING EFFECT & DP.
EFCTHX = (TA84HX- AVTT90)/(TA84HX-TF361N)
P84DQ8=(PS84HX-AVPTgO)/PS84HX
DPFLXQ=(PF361N-PFULEX)/PF36IN
COMBUSTOR:
WACOMB=(WAIVt_IN-WAACM)*BYPCON
DTCOMB=AVTT39-AVTT30
FARCOM=WF36AV/(WACOMB*3600.)
T4RKAV=AVTT30+O.15*(TFLNOZ-
120.)+(O.9875*FARCOM*I8400.)/((O.244+2.184*FARCOM)*(I.+FARCOM))
SWT4RK=(AVTT39-T4RICAV)/T4RIC_V
HF36 = 172.2 + HFULEX
H30 = HT(AVTT30+C459)
H4RK = HTF(AVTT39+C459,FARCOM)*(I.+FARCOM)
ETACOM=((H4RK-H30) / FARCOM - HF36)/HV
DPCOMB=RPTCOM-AVPS41
DPCOMP=IOO.*DPCOMB/RPTCOM
FFCOMB=WACOMB**2.0*(AVTT30+C459)/RPTCOM**2.0
DPEXHD=PSEXHD-PBAR01
AECOMB=(WACOMB/I.O98)*SQRT((AVTT30+C459)/(RPTCOM*DPCOMB))
171
C
C
C
$PAGE
C
$DBO
AVPT39=AVPT40
WCOMB=WACOMB
AVGWF=WF36AV
WAR=60.O
AVFUEL=RTFUEL
DPPTP=IOO.*(RPTCOM-AVPT40)/RPTCOM
FUEL NOZZLE:
WFULNZ=WF36AV/18.DPFNOZ=PFMANX-AVPS41
FNNOZ=WFULNZ/SQRT(DPFNOZ)
FNSF36=.75347+RTFLEX*(-1.706E-3+RTFLEX*2.6853E-6)
FNDPSY=(72.088*ALOG(WFULNZ)-97.698)*MAX(FNSF36,0.75)T81CF=T81CR-C459
T82CF=T82CR-C459
Tg2CF=Tg2CR-C459
PRINTOUT SECTION
CALL PUTLAB(O,'OVERALL & COMBUSTOR CALCS.')$P,CALI
CALL PUTLAB(O,'COMPRESSOR CALCS.')
$P,CAL2
CALL PUTLAB(O,'TURBINE CALCS.')
$P,CAL3
CALL PUTLAB(O,'HEAT X1CALCS.')
$P,CAL4
CALL PUTLAB(O,'HEAT X2 CALCS.')
$P,CAL5
STOP
END
AIR THERMO FUNCTIONS:
FUNCTION GT(T)
GAMMA FOR AIR
C=CT(T)
C=14.584356"C
GT=C/(C-1)
RETURN
END
FUNCTION CT(T)
SPECIFIC HEAT FOR AIR
DATA AI,A2,A3,A4,A5,A6,A7,A8/1.0115540E-25,-1.452677E-21,
&7.6215767E-18,-1.5128259E-14,-6.7178376E-12,6.5519486E-08,
&-5.153687gE-O5,2.5020051E-01/
CT=((((((AI*T+A2)*T+A3)*T+A4)*T+A5)*T+A6)*T+A7)*T+A8RETURN
END
172
C
FUNCTION HT(T)
C ENTHALPY FOR AIR
DATA BI,B2,B3,B4,B5,B6,B7,B8,Bg/I.2644425E-26,-2.0752522E-22,
& 1.2702630E-18,-3.0256518E-15,-1.6794594E-12,2.1839826E-08,
& -2.5768440E-O5,2.5020051E-O1,-I.7558886EO0/
HT=(((((((BI*T+B2)*T+B3)*T+B4)*T+B5)*T+B6)*T+B7)*T+B8)*T+B9
RETURN
END
FUNCTION TCSTP(T,PR)
C TEMPERATURE FOR ISENTROPIC PROCESS
A=ALOG(PR)
G=GT(T)
U=T*EXP(A*(G-I.)/G)
G=GT(.5*(T+U))
U=T*EXP(A*(G-I.)/G)TCSTP=U*(I.+(ST(T)+A*.O68566621-ST(U))/CT(U))
RETURN
END
FUNCTION ST(T)
C ENTROPY FUNCTION FOR AIR - TEMPERATURE PART ONLY
DATA CO,C1,C2,C3,C4,C5,C6,C7,C8/2.5020051E-O1,I.4450767E-26,
&-2.4211288E-22,1.5243153E-18,-3.7820648E-15,-2.2392790E-12,
&3.2759743E-O8,-5.157687gE-O5,4.5432300E-02/
ST=CO*ALOG(T)+((((((CI*T+C2)*T+C3)*T+C4)*T+C5)*T+C6)*T+C7)*T+C8
RETURN
END
FUNCTION HF(T)
C ENTHALPY FOR COMBUSTION PRODUCTS
DATA EI,E2,E3,E4,E5,E6,E7,E8,E9/
&9.0848388E-26,-I.gO50949E-21,1.7021525E-17,-8.4102208E-14,
&2.4921698E-IO,-4.5906332E-7,6.129315E-4,7.3816638E-2,3.058153E+I/
HF=(((((((EI*T+E2)*T+E3)*T+E4)*T+E5)*T+E6)*T+E7)*T+E8)*T+E9
RETURN
END
FUNCTION HTF(T,F)
C ENTHALPY FOR AIR AND PRODUCTS OF COMBUSTION
H = HT(T)
HTF = H + (HF(T)-H)*F/(I.+F)
C FOLLOWING IS EMPIRICAL CORRECTION FOR DISSOCIATION
C APPLICABLE FOR EXPECTED RIG OPERATING LINE
DIS = AMINI(I.008 - 1.37952E-5*HTF, 1.000)
HTF = HTF/DIS
RETURN
END
END OF AIR THERMO FUNCTIONS.
173

REPORT DOCUMENTATION PAGE FormApprovedOMBNo,0704-0188
Public reporting burden for this collection of informahon is estimated to average 1 hour per response, including the lime for reviewing instructions, searching existing data sources,
gathering and maintaining the data needed, and completing and reviewing the collection of information. Send comments regarding this burden estimate or any other aspect of this
collection of information, including suggestions for reducing this burden, to Washington Headquarters Services, Directorate for Information Operations and Reports, 1215 Jefferson
Davis Highway, Suite 1204, Arlington, VA 22202-4302, and to the Office of Management and B_Jdget, Paperwork Reduction Project (0704-0188), Washington. DC 20503.
1. AGENCY USE ONLY (Leave blank) 2. REPORT DATE 3. REPORT TYPE AND DATES COVERED
January 2001 Final Contractor Report
4. TITLE AND SUBIITLE 5. FUNDING NUMBERS
Design, Fabrication, and Testing of an Auxiliary Cooling System for Jet Engines
6. AUTHOR(S) WU-529-40-14-00NAS3-27395
Kevin Leamy, Jim Griffiths, Paul Andersen, Fidel Joco, and Mark Laski
7. PERFORMING ORGANIZATION NAME(S) AND ADDRESSEES) 8. PERFORMING ORGANIZATION
GE Aircraft Engines REPORT NUMBER
One Neumann Way
Cincinnati, Ohio 54215--6301 E- i 2402
9. SPONSORING/MONITORING AGENCY NAME(S) AND ADDRESS(ES) 10. SPONSORING/MONITORING
AGENCY REPORT NUMBER
National Aeronautics and Space Administration
Washington, DC 20546-0001 NASA CR--2001-210353
R20OOAE 114
11. SUPPLEMENTARY NOTES
Kevin Leamy and Jim Griffiths, GE Aircraft Engines, One Neumann Way, Cincinnati, Ohio 54215-6301; Paul Andersen,
Fidel Joco, and Mark Laski, Honeywell, Inc., 2525 West 190th Street, Torrance, California 90509. Project Manager,
Jeffrey S. Balser, Aeropropulsion Research Pro_am Office, NASA Glenn Research Center, organization code 0141,216--433-5714.
12a.
13.
DISTRIBUTION/AVAILABILITY STATEMENT 12b. DISTRIBUTION CODE
Unclassified - Unlimited
Subject Categories: 07 -and 28 Distribution: Nonstandard
Available electronically at http://gltrs.__orc.nasa.__ov/GLTRS
This publication is available from the NASA Center for AeroSpace Information, 301--621-0390.
ABSTRACT (Maximum 200 words)
This report summarizes the technical effort of the Active Cooling for Enhanced Performance (ACEP) program sponsored
by NASA (NAS3-27395). It covers the design, fabrication, and integrated systems testing of a jet engine auxiliary cooling
system, or turbocooler, that significantly extends the use of conventional jet fuel as a heat sink. The turbocooler is designed
to provide subcooled cooling air to the engine exhaust nozzle system or engine hot section. The turbocooler consists of
three primary components: (1) a high-temperature air cycle machine driven by engine compressor discharge air, (2) a fuel/
air heat exchanger that transfers energy from the hot air to the fuel and uses a coating to mitigate fuel deposits, and (3) a
high-temperature fuel injection system. The details of the turbocooler component designs and results of the integrated
systems testing are documented. Industry Version--Data and information deemed subject to Limited Rights restrictions areomitted from this document.
14. SUBJECT TERMS
Auxiliary cooling system: Turbocooler; High-temperature fuel
17. SECURITY CLASSIFICATION
OF REPORT
Unclassified
NSN 7540-01-280-5500
18. SECURITY CLASSIFICATIONOF THIS PAGE
Unclassified
19. SECURITY CLASSIRCATIONOF ABSTRACT
Unclassified
15. NUMBER OF PAGES
18916. PRICE CODE
A0920. LIMITATION OF ABSTRACT
Standard Form 298 (Rev. 2-89)PrescriDed by ANSI Std. Z39-18
298-102


_y