Embed Size (px)
Citation preview
1
Paper No. 99-4208 An ASAE Meeting Presentation
Design Criteria for Portable Timber Bridge Systems:Static versus Dynamic Loads
by
John M. Franklin, Graduate Research Assistant, Biosystems Engineering Dept., Auburn University, ALS.E. Taylor, Associate Professor, Biosystems Engineering Dept., Auburn University, AL
Paul A. Morgan, Engineer, Trus Joist MacMillan, Charlotte, NCM.A. Ritter, Project Leader, USDA Forest Products Laboratory, Madison, WI
Written for Presentation at the1999 Annual International Meeting
sponsored byASAE and CSAE-SCGR
Sheraton Centre HotelToronto, Ontario, Canada
July 18-21, 1999
Summary:Design criteria are needed specifically for portable bridges to insure that they are safe and cost effective. Thispaper discusses different portable bridge categories and their general design criteria. Specific emphasis is givento quantifying the effects of dynamic live loads on portable bridge design. Results from static and dynamic loadtests of two portable timber bridges showed that dynamic loads can be significantly greater than static loads.Under smooth bridge entrance conditions, the mean dynamic bridge deflections were 1.13 times greater thanstatic bridge deflections. Under rough bridge entrance conditions, mean dynamic bridge deflections were 1.44times greater than static bridge deflections.
Keywords: portable bridges, glued-laminated timber, design criteria, dynamic loads, timber bridges, forestroads
The author(s) is solely responsible for the content of this technical presentation. The technical presentation does not necessarilyreflect the official position of ASAE, and its printing and distribution does not constitute an endorsement of views which maybe expressed.
Technical presentations are not subject to the formal peer review process by ASAE editorial committees; therefore, they are notto be presented as refereed publications.
Quotation from this work should state that it is from a presentation made by (name of author) at the (listed) ASAE meeting.
EXAMPLE — From Author’s Last Name, Initials. “Title of Presentation.” Presented at the Date and Title of meeting, PaperNo X. ASAE, 2950 Niles Road, St. Joseph, MI 49085-9659 USA.
For information about securing permission to reprint or reproduce a technical presentation, please address inquiries to ASAE.
ASAE, 2950 Niles Rd., St. Joseph, MI 49085-9659 USAVoice: 616.429.0300 FAX: 616.429.3852 E-Mail:[email protected]
2
DESIGN CRITERIA FOR PORTABLE TIMBER BRIDGESYSTEMS: STATIC VERSUS DYNAMIC LOADS
J.M. Franklin, S.E. Taylor, P.A. Morgan, M.A. Ritter1
ABSTRACTInterest in portable bridge systems has increased in the U.S. due to heightened awareness of the need toreduce environmental impacts and costs associated with road stream crossings. However, design criteriaare needed for portable bridges to insure that they are safe and cost effective. This paper discussesdifferent portable bridge categories and their general design criteria. Specific emphasis is given toquantifying the effects of dynamic live loads on portable bridge design. Results from static and dynamicload tests of two portable timber bridges demonstrated that dynamic loads can be significantly greater thanstatic loads. Under smooth bridge entrance conditions, the mean dynamic bridge deflections were 1.13times greater than static bridge deflections. Under rough bridge entrance conditions, mean dynamic bridgedeflections were 1.44 times greater than static bridge deflections.
INTRODUCTIONThere is considerable interest in the U.S. for portable bridge systems designed for forestry and relatednatural resources industries as well as other more traditional applications, such as for military orconstruction uses. In typical civilian construction applications, portable bridges are used when apermanent highway bridge is being replaced and a temporary bypass is needed during the constructionperiod. Also, portable bridges are needed to serve as temporary structures during disaster situations, e.g.when a flood washes out a highway bridge. In addition, there are many situations where temporary accessis needed across streams in remote areas for the construction or maintenance of utility structures.
Access to our forests and other natural resources requires an extensive roadway network over a widerange of geographical conditions. Environmental concerns are the primary reason for the current interestin portable bridges used in forestry and natural resource applications. Forest roads typically require a largenumber of structures to cross streams and other topographical features. Rothwell (1983) and Swift(1985), in separate studies on forest roads, found that forest road stream crossings were the most frequentsources of erosion and sediment introduction into streams. Taylor et al. (1999) reviewed several studiesthat documented significant increases in sediment levels downstream from stream crossings.
Bridges for forest roads can be permanent or temporary. Permanent bridges, which are typically designedfor service lives of 40 to 50 years, are not economically feasible for short use periods frequentlyencountered in forest operations. Also, permanent bridges for low-volume forest roads are commonlydesigned to lower standards than most public access facilities and can be a potential liability to bridgeowners if public access is possible. One solution to short-term bridge needs is the concept of portablebridges. Blinn et al. (1998) and Mason (1990) summarized portable bridges available in the US. Ifproperly designed and constructed, portable bridges can be easily transported, installed, and removed for
1 The authors are, respectively, Graduate Research Assistant and Associate Professor, BiosystemsEngineering Department, Auburn University, AL, USA; Engineer, Trus Joist MacMillan, Charlotte, NC, USA; andProject Leader, USDA Forest Service Forest Products Laboratory, Madison, WI, USA.

3
reuse at multiple sites. The ability to serve multiple installations makes them more economically feasiblethan permanent structures. In addition, if they are installed and removed so that disturbance to the site isminimized, they alleviate many water quality and other potential environmental problems. Thompson et al.(1995) and Tornatore et al. (1996) reported that proper installation of portable bridges could significantlyreduce levels of sediment introduced into streams compared to other crossings. In addition to theirenvironmental sensitivity and cost effectiveness, portable bridges provide forest operations planners withadditional structures that can be used to bypass existing stream crossings that are structurally orfunctionally deficient. For example, loggers can temporarily place portable bridges over existing bridgesthat are unsuitable for carrying heavy truck loads. The portable bridge can be used to support log trucktraffic while harvesting occurs, then at the completion of the operation, the portable bridge can be removedfor use at another site.
Many of the advantages of timber bridges make them ideal for temporary stream crossings. However, toinsure that the portable bridge is cost effective and is designed with adequate levels of safety, research isneeded to accurately characterize design loads. The objective of this paper is to quantify vehicle live loadson typical designs of portable timber bridges. Emphasis is placed on quantifying the effects of dynamicloads on portable timber bridges.
BACKGROUND ON PORTABLE BRIDGE DESIGN CONSIDERATIONSDesign procedures for timber bridges used in permanent highway applications in the United States can befound in the American Association of State Highway and Transportation Officials (AASHTO) StandardSpecifications for Highway Bridges (1993) and the design manual by Ritter (1990). Little previousresearch, however, has been conducted on appropriate design procedures for portable timber bridges.Knab et al. (1977) studied military theater-of-operations glulam bridges with design lives of 2 to 5 years.They concluded that using civilian design procedures, which are generally based on design lives of 50 to 75years with relatively high levels of reliability, could result in unnecessarily conservative and uneconomicaldesigns for the limited performance needs of temporary bridges. Using results from reliability analyses,they developed new design procedures and modification factors for allowable stresses that would result inadequate levels of structural safety for glulam girder bridges. They concluded that modification factorscould be used to increase allowable bending, shear, and compression stresses for these temporary militarybridges.
Other work by GangaRao and Zelina (1988) examined the design specifications for low-volume civilianroads. They concluded that the use of urban highway standards for low-volume road bridges results inoverly conservative and uneconomical designs. They defined low-volume roads as those with maximumtwo-directional ADT of 200 vehicles or maximum two-directional Average Daily Truck Traffic (ADTT)of approximately 30 trucks per day. They suggested that allowable stresses for steel and concretestructures might be increased for such roads and that deflection limits might be relaxed for steel bridges.They did not recommend changing the deflection criteria of L/400 and L/300, where L is the bridge span,for low-volume concrete or timber bridges, respectively.
These research results of Knab et al. (1977) and GangaRao and Zelina (1988) indicate that applyingAASHTO design procedures to portable bridges on low-volume roads may result in overly conservativedesigns. The designer must consider that in many cases, the design life of such a bridge may only be 5 to10 years. Therefore, it may be possible to make changes such as increasing the load duration factorabove the value of 1.15 that is currently specified by AASHTO.
4
Taylor et al. (1995) proposed a matrix of design criteria for different types of portable bridges, dependingon their intended use. The matrix was developed for bridges used on three different types of roads: sub-low volume, low volume, and high volume. Franklin (1999) modified this matrix to include four classes ofbridge applications: two cases of sub-low volume, and one case each of low-volume and high-volumeroads. The matrix is presented in Table 1. The sub-low volume bridge, Case 1, would include bridgesintended for use by forestry machines such as wheeled skidders. The sub-low volume bridge, Case 2,would include bridges intended for log truck traffic, with very low traffic rates as might be expected for asingle logging operation. The low volume bridge would be intended for use on main forest roads withhigher traffic rates. The high-volume bridge would be intended for use in highway applications where itwas serving as a bypass for permanent bridges that were under construction.
STATIC VERSUS DYNAMIC DESIGN LOADS FOR PORTABLE BRIDGESTraditional design procedures for bridges account for both strength and serviceability criteria. Strengthcriteria dictate design loads or forces the bridge should safely support. Serviceability criteria mainlyinclude prescribed deflection limitations for the bridge. The bridge design criteria outlined in Table 1contain several differences from the criteria typically used for permanent bridges. Since portable bridgesfor forest roads do not typically use an additional wearing surface, the deflection limitations are not ascritical as in highway bridge design. However, strength or load criteria are obviously of utmost concern inany bridge design.
STATIC DESIGN LOADSDesign vehicles for low-volume forest roads include highway vehicles and off-highway vehicles. Table 1indicates that some bridges may be designed specifically for off-highway vehicles such as wheeled-skidders. Also, for bridges carrying truck traffic, bridges generally should be designed for standardhypothetical design vehicles such as the AASHTO HS20 truck.
Because portable bridges are needed for a wide variety of conditions and vehicle types, it seemsappropriate to develop bridge designs for a specific set of design vehicles, such as the standard AASHTOtrucks, which are used for the design of most highway bridges in the US. Therefore, research currentlyunderway by Auburn University and the USDA Forest Service is developing methodology to determinethe loads exerted by the various types of forestry equipment and then find an equivalent AASHTO truckthat would result in similar levels of shear forces and bending moments (Franklin, 1999). For example, awheeled grapple skidder with an operating weight of 15,000 kg (33,000 lbs) and a wheelbase of 3.5 m(11.5 ft) may apply shear forces and bending moments similar to those of an AASHTO HS20 truck forbridge spans ranging from 3 m to 15 m (10 ft to 50 ft). Therefore, when specifying the bridgerequirements, the forest operations manager simply needs to specify that the bridge design vehicle is anAASHTO HS20 truck rather than a specific forest machine. When this work is completed, it will helpforest operations personnel specify and or design portable bridges that fit a broad range of applications.
DYNAMIC DESIGN LOADSThe current methodology for designing timber bridges in the US is based on using static axle and wheelloads of the design vehicle. However, Wipf et al. (1996) presented research that showed that behavior ofbridges under dynamic loading could be quite different from that under static loading. They measured thedynamic bridge response to trucks traveling at various speeds by recording deflection of the bridges with ahigh speed data acquisition system. They found that bridge deflections under dynamic loads were higherthan those under static loads. Therefore, actual forces applied to the bridge by a moving vehicle weregreater than those assumed in a simple static analysis. The magnitudes of these forces are influenced by
5
factors such as vehicle characteristics, bridge characteristics, vehicle speed, road conditions, and bridgeentrance conditions. For example, if a truck encounters a large bump before driving onto the bridge, it willinduce a new vibration mode in the truck (i.e., the truck will begin bouncing and pitching) and when thevehicle crosses the bridge, this will lead to higher dynamic loads than would have been observed in a staticcondition. Therefore, as part of the ongoing cooperative research by Auburn University and the USDAForest Service, field tests were conducted to document the dynamic effects of vehicle loads and determineif design procedures need to account for these effects. The testing procedures and results aresummarized next.
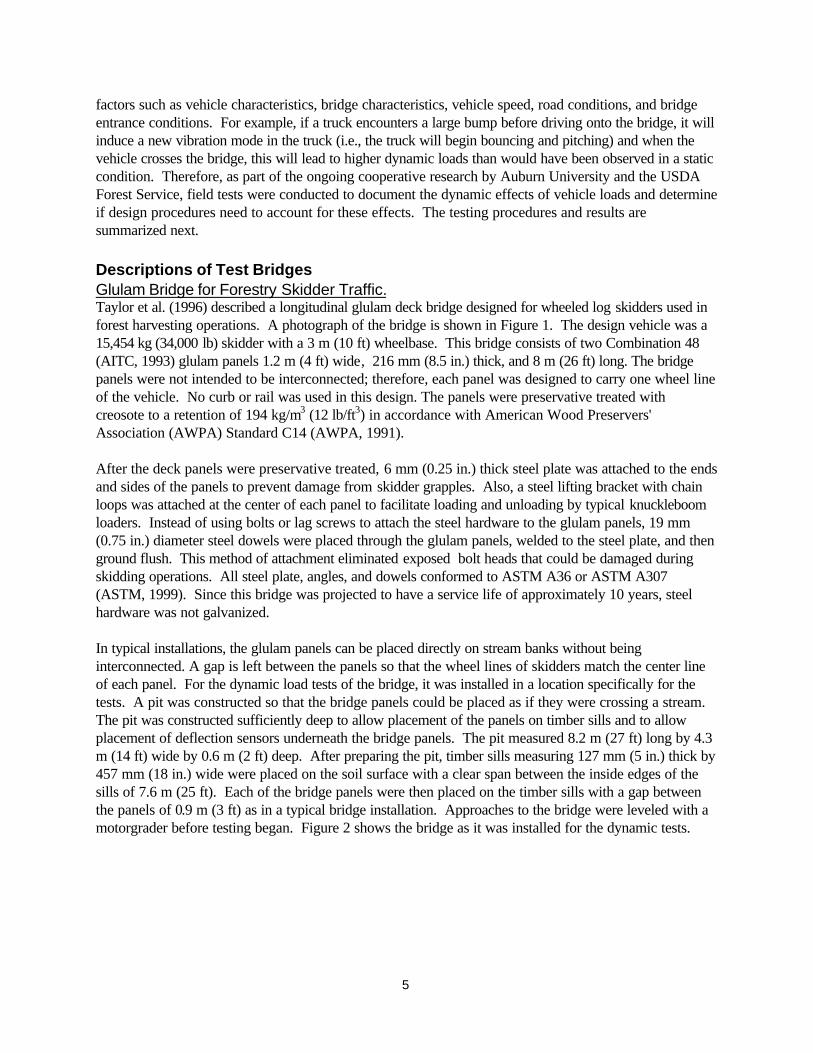
Descriptions of Test BridgesGlulam Bridge for Forestry Skidder Traffic.Taylor et al. (1996) described a longitudinal glulam deck bridge designed for wheeled log skidders used inforest harvesting operations. A photograph of the bridge is shown in Figure 1. The design vehicle was a15,454 kg (34,000 lb) skidder with a 3 m (10 ft) wheelbase. This bridge consists of two Combination 48(AITC, 1993) glulam panels 1.2 m (4 ft) wide, 216 mm (8.5 in.) thick, and 8 m (26 ft) long. The bridgepanels were not intended to be interconnected; therefore, each panel was designed to carry one wheel lineof the vehicle. No curb or rail was used in this design. The panels were preservative treated withcreosote to a retention of 194 kg/m3 (12 lb/ft3) in accordance with American Wood Preservers'Association (AWPA) Standard C14 (AWPA, 1991).
After the deck panels were preservative treated, 6 mm (0.25 in.) thick steel plate was attached to the endsand sides of the panels to prevent damage from skidder grapples. Also, a steel lifting bracket with chainloops was attached at the center of each panel to facilitate loading and unloading by typical knuckleboomloaders. Instead of using bolts or lag screws to attach the steel hardware to the glulam panels, 19 mm(0.75 in.) diameter steel dowels were placed through the glulam panels, welded to the steel plate, and thenground flush. This method of attachment eliminated exposed bolt heads that could be damaged duringskidding operations. All steel plate, angles, and dowels conformed to ASTM A36 or ASTM A307(ASTM, 1999). Since this bridge was projected to have a service life of approximately 10 years, steelhardware was not galvanized.
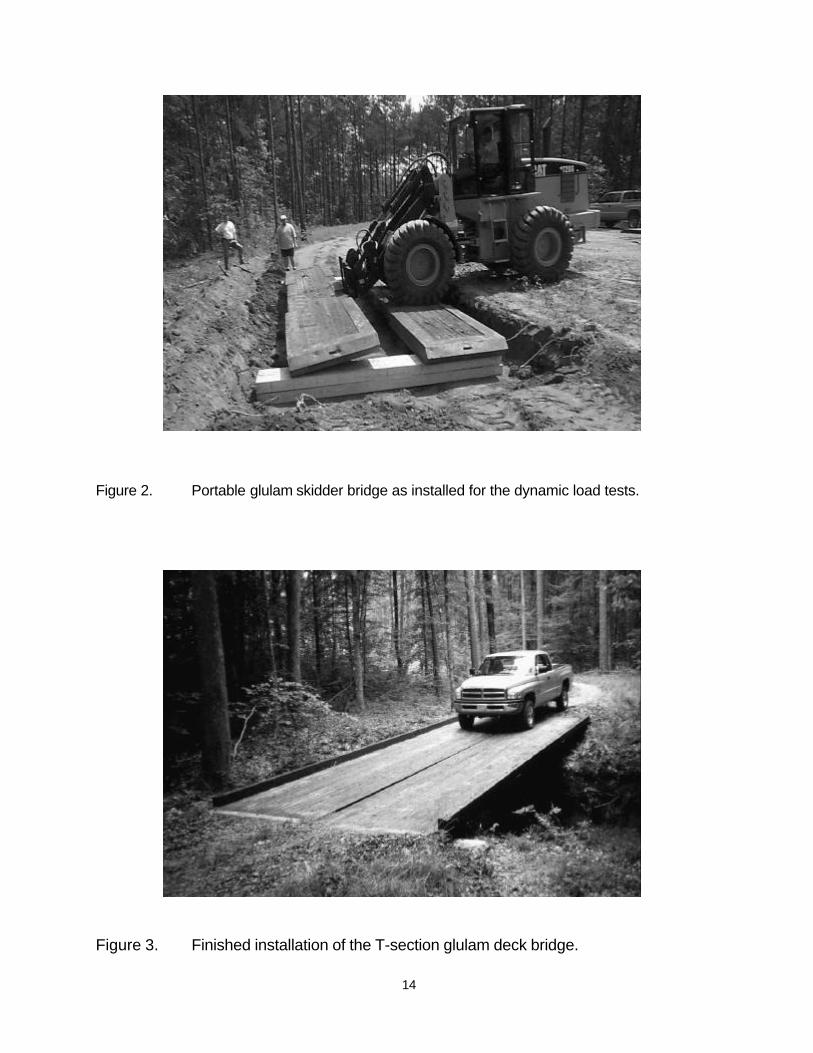
In typical installations, the glulam panels can be placed directly on stream banks without beinginterconnected. A gap is left between the panels so that the wheel lines of skidders match the center lineof each panel. For the dynamic load tests of the bridge, it was installed in a location specifically for thetests. A pit was constructed so that the bridge panels could be placed as if they were crossing a stream.The pit was constructed sufficiently deep to allow placement of the panels on timber sills and to allowplacement of deflection sensors underneath the bridge panels. The pit measured 8.2 m (27 ft) long by 4.3m (14 ft) wide by 0.6 m (2 ft) deep. After preparing the pit, timber sills measuring 127 mm (5 in.) thick by457 mm (18 in.) wide were placed on the soil surface with a clear span between the inside edges of thesills of 7.6 m (25 ft). Each of the bridge panels were then placed on the timber sills with a gap betweenthe panels of 0.9 m (3 ft) as in a typical bridge installation. Approaches to the bridge were leveled with amotorgrader before testing began. Figure 2 shows the bridge as it was installed for the dynamic tests.
6
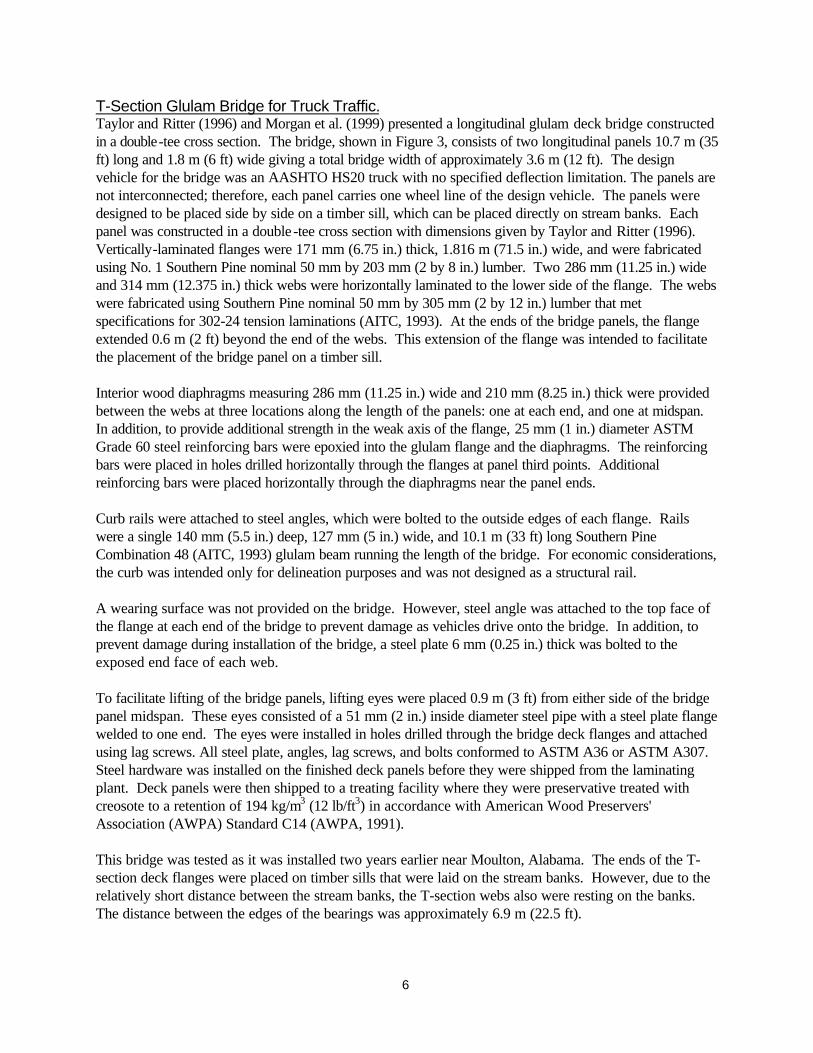
T-Section Glulam Bridge for Truck Traffic.Taylor and Ritter (1996) and Morgan et al. (1999) presented a longitudinal glulam deck bridge constructedin a double-tee cross section. The bridge, shown in Figure 3, consists of two longitudinal panels 10.7 m (35ft) long and 1.8 m (6 ft) wide giving a total bridge width of approximately 3.6 m (12 ft). The designvehicle for the bridge was an AASHTO HS20 truck with no specified deflection limitation. The panels arenot interconnected; therefore, each panel carries one wheel line of the design vehicle. The panels weredesigned to be placed side by side on a timber sill, which can be placed directly on stream banks. Eachpanel was constructed in a double -tee cross section with dimensions given by Taylor and Ritter (1996).Vertically-laminated flanges were 171 mm (6.75 in.) thick, 1.816 m (71.5 in.) wide, and were fabricatedusing No. 1 Southern Pine nominal 50 mm by 203 mm (2 by 8 in.) lumber. Two 286 mm (11.25 in.) wideand 314 mm (12.375 in.) thick webs were horizontally laminated to the lower side of the flange. The webswere fabricated using Southern Pine nominal 50 mm by 305 mm (2 by 12 in.) lumber that metspecifications for 302-24 tension laminations (AITC, 1993). At the ends of the bridge panels, the flangeextended 0.6 m (2 ft) beyond the end of the webs. This extension of the flange was intended to facilitatethe placement of the bridge panel on a timber sill.
Interior wood diaphragms measuring 286 mm (11.25 in.) wide and 210 mm (8.25 in.) thick were providedbetween the webs at three locations along the length of the panels: one at each end, and one at midspan.In addition, to provide additional strength in the weak axis of the flange, 25 mm (1 in.) diameter ASTMGrade 60 steel reinforcing bars were epoxied into the glulam flange and the diaphragms. The reinforcingbars were placed in holes drilled horizontally through the flanges at panel third points. Additionalreinforcing bars were placed horizontally through the diaphragms near the panel ends.
Curb rails were attached to steel angles, which were bolted to the outside edges of each flange. Railswere a single 140 mm (5.5 in.) deep, 127 mm (5 in.) wide, and 10.1 m (33 ft) long Southern PineCombination 48 (AITC, 1993) glulam beam running the length of the bridge. For economic considerations,the curb was intended only for delineation purposes and was not designed as a structural rail.
A wearing surface was not provided on the bridge. However, steel angle was attached to the top face ofthe flange at each end of the bridge to prevent damage as vehicles drive onto the bridge. In addition, toprevent damage during installation of the bridge, a steel plate 6 mm (0.25 in.) thick was bolted to theexposed end face of each web.
To facilitate lifting of the bridge panels, lifting eyes were placed 0.9 m (3 ft) from either side of the bridgepanel midspan. These eyes consisted of a 51 mm (2 in.) inside diameter steel pipe with a steel plate flangewelded to one end. The eyes were installed in holes drilled through the bridge deck flanges and attachedusing lag screws. All steel plate, angles, lag screws, and bolts conformed to ASTM A36 or ASTM A307.Steel hardware was installed on the finished deck panels before they were shipped from the laminatingplant. Deck panels were then shipped to a treating facility where they were preservative treated withcreosote to a retention of 194 kg/m3 (12 lb/ft3) in accordance with American Wood Preservers'Association (AWPA) Standard C14 (AWPA, 1991).
This bridge was tested as it was installed two years earlier near Moulton, Alabama. The ends of the T-section deck flanges were placed on timber sills that were laid on the stream banks. However, due to therelatively short distance between the stream banks, the T-section webs also were resting on the banks.The distance between the edges of the bearings was approximately 6.9 m (22.5 ft).
7
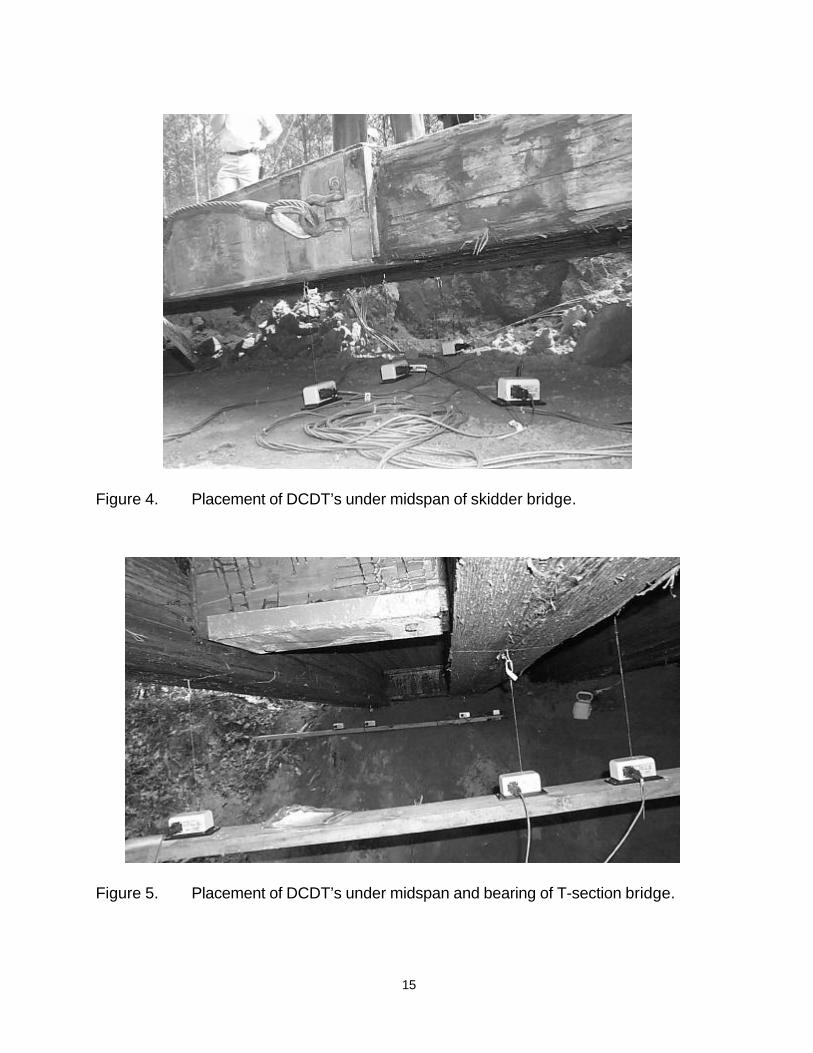
InstrumentationDynamic response of the bridge panels was recorded during repeated passage of a wheeled skidder overthe skidder bridge and a tandem-axle truck over the T-section bridge. Deflections of the bridge panelswere measured at midspan and at locations immediately adjacent to the bearings using Celesco ModelPT101 direct current displacement transducers (DCDTs). At each of the three transducer locations (i.e.,midspan and at each bearing), multiple transducers were placed across the width of the bridge panels. Forthe skidder bridge tests, three DCDTs were placed across the width of the each panels: one DCDTpositioned under the panel centerline and two DCDTs positioned 150 mm (6 in.) from the outside edges ofthe panel. For tests of the T-section bridge, four DCDT’s were placed across the width of each of thepanels: two DCDTs positioned under the centerline of each of the webs and two DCDTs positioned 75mm (3 in.) from the outside edges of the flanges. Figures 4 and 5 show placement of the DCDTs for theskidder bridge and for the T-section bridge, respectively. A PC-based data acquisition system was thenused to record the deflection values from each DCDT. Data were recorded at a rate of 45 Hz.
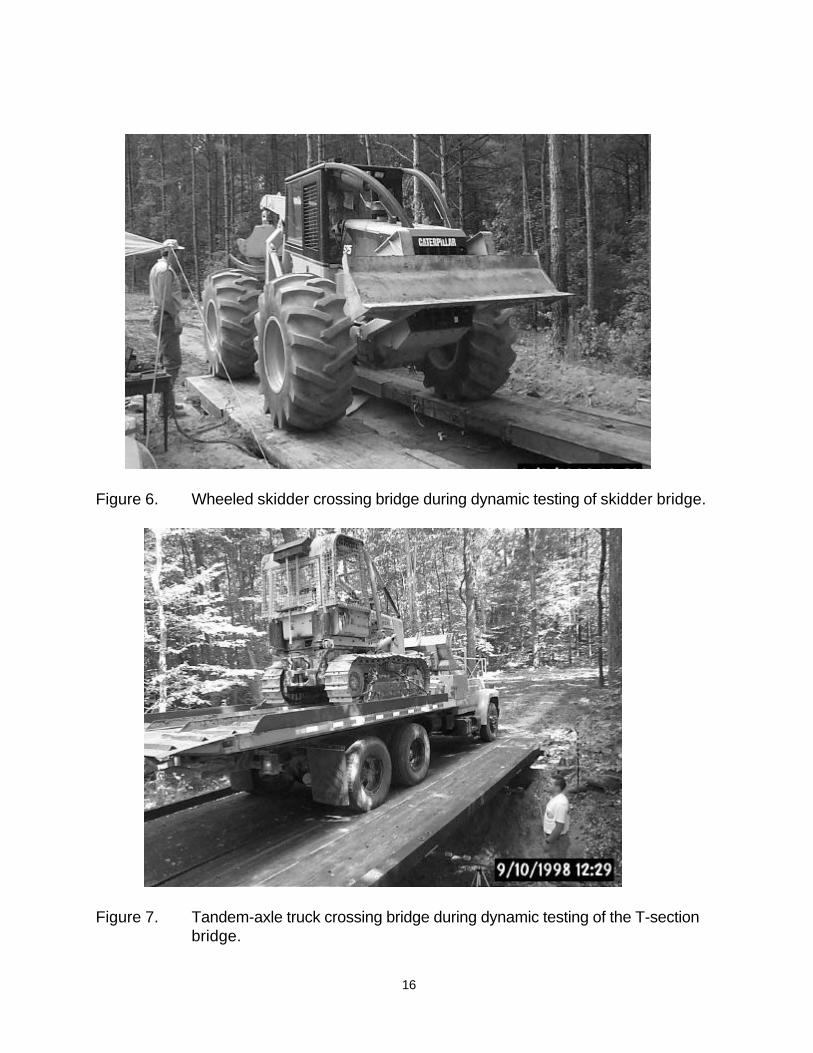
Test ProceduresThe dynamic deflection behavior for the bridges was determined using two different vehicles operating atthree different speeds with two bridge entrance conditions. A Caterpillar 525 wheeled grapple skidderwas used as the test vehicle for the skidder bridge as shown in Figure 6. This skidder had an operatingweight of 15,331 kg (33,800 lbs) and a wheelbase of 3.5 m (11.5 ft). The skidder was operated withoutcarrying any logs. Axle weights were 8664 kg (19,060 lb) and 6686 kg (14,709 lb) for the front and rearaxles, respectively. Test runs of the skidder were made at 9.2 kph (5.7 mph), 13 kph (8 mph), and 23.5kph (14.6 mph) with the wheel lines of the skidder centered over the longitudinal axis of the bridge panels.An artificial rough bridge approach was created by forming an earthen bump measuring approximately 200mm (8 in.) wide by 100 mm (4 in.) thick and placing it approximately 300 mm (12 in.) away from the endof the bridge panel. Five test runs were made at each speed and entrance condition for each bridge panel.
A tandem-axle flatbed truck carrying a crawler tractor was used for tests of the T-section bridge asshown in Figure 7. The truck had a wheelbase of 5.0 m (16.4 ft) and a gross weight of 17,600 kg (38,720lbs) with front and rear tandem axle weights of 4163 kg (9160 lbs) and 13,436 kg (29,560 lbs),respectively. Test runs of the truck were made at 8 kph (5 mph), 16 kph (10 mph), and 24 kph (15 mph)with the wheel lines of the truck centered over the longitudinal axis of the bridge panels. An artificialrough bridge approach was created by using a sawn timber measuring 200 mm (8 in.) wide by 100 mm (4in.) thick and placing it approximately 300 mm (12 in.) away from the end of the bridge panel. Ten testruns were made at each speed and entrance condition for each panel; however, safety considerationsprevented the truck from testing the rough approach at the 16 kph (10 mph) and 24 kph (15 mph) speeds.
To obtain a reference condition for comparison with the dynamic deflection values, static load tests wereconducted for both bridges. In these tests, the vehicles were positioned on the bridge to obtain themaximum bending moment, then deflection values were recorded for all DCDTs.
Data AnalysisPlots of bridge deflection versus time were created for each DCDT in each test run and the static loadtests. Since the bridges were installed on the timber sills, which were placed directly on uncompacted soil,measurable deflections were recorded by the DCDTs at the bearings. Therefore, to obtain a true netdeflection value at midspan, the deflection readings from the bearings were subtracted from the midspandeflection values.
8
Using the dynamic and static deflection data, a Dynamic Amplification Factor (DAF) was determined foreach data stream recorded for each DCDT located at the midspan of the bridge. The DAF is found by:
The DAF is a relatively simple term to help quantify the magnitude of dynamic bridge loads relative tostatic loads exerted by a given vehicle.
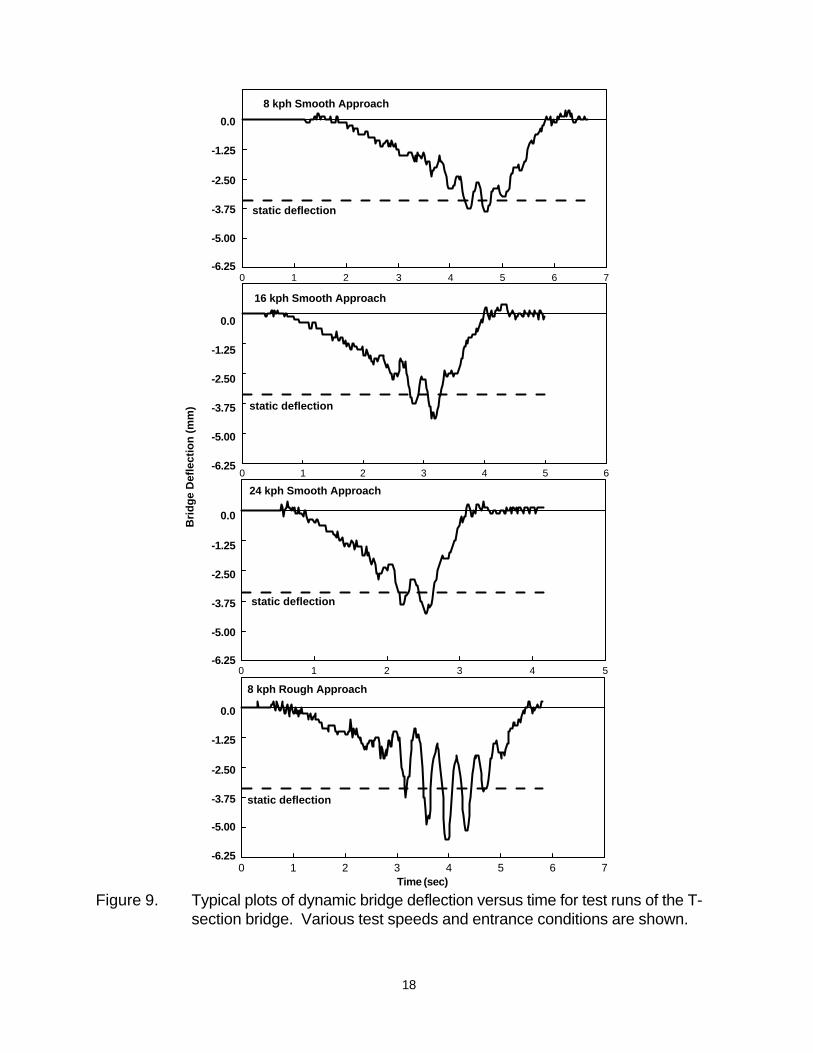
Dynamic Test Results and DiscussionExamples of typical dynamic deflection plots are shown in Figures 8 and 9 for the skidder bridge and theT-section bridge, respectively. These figures contain example plots for various speeds and entranceconditions.
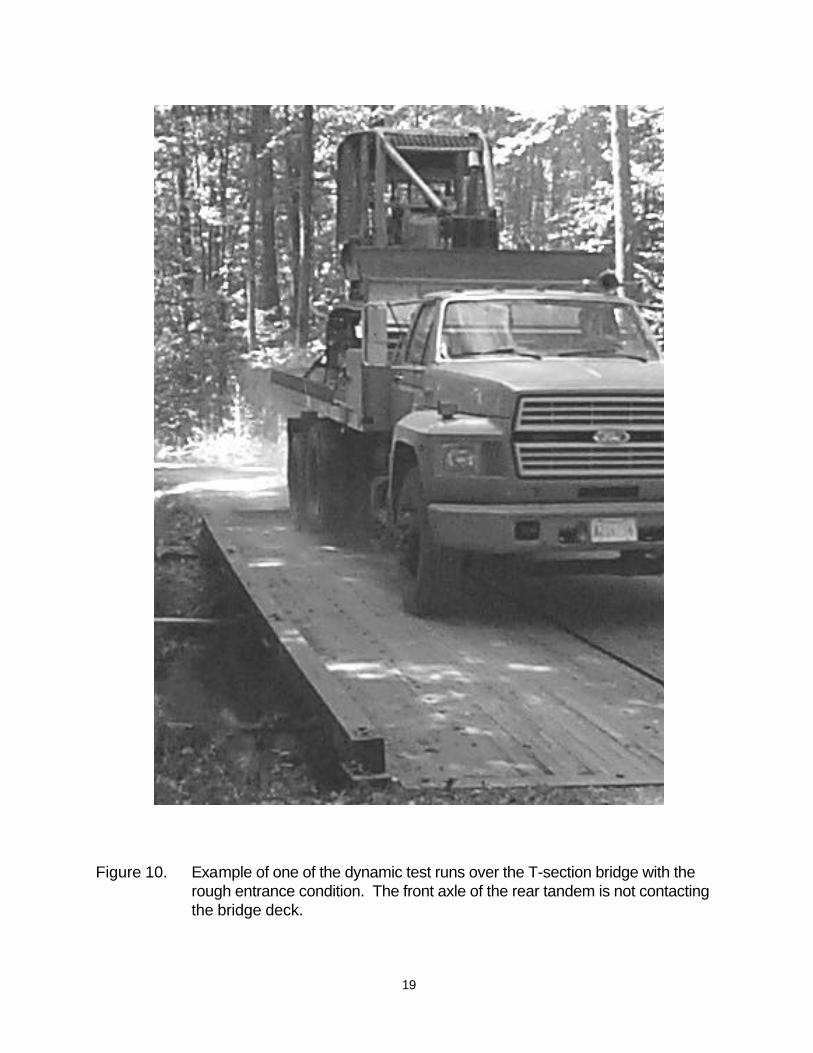
Several interesting points are found in the plots. First, the plots are good illustrations of how bridgedeflection can increase due to dynamic loads exerted by moving vehicles. In the plots shown, the dynamicdeflection values are considerably greater than the values recorded in static load tests of the bridges. Thisincrease in deflection indicates that the bridges are experiencing levels of dynamic loads that areconsiderably higher than those exerted by a static vehicle. Figure 10 illustrates how, after the vehicleencounters a rough bridge entrance condition, the vehicle and its axles can bounce, which in turn can leadto greater loads on the bridge.
The plots also illustrate that in the dynamic bridge - vehicle system, there are two primary vibration modespresent. The first mode is a relatively high-frequency, low-amplitude vibration that is the fundamentalvibration mode of the bridge deck panel. The second mode is a relatively low-frequency, high-amplitudevibration mode due to the bounce and pitch of the vehicle. The plots of dynamic deflection for test runswith rough approaches show that the amplitude of vehicle vibration is significantly greater when thevehicle encountered the rough bridge entrance condition. Similar results would be observed if the road ortrail conditions leading to the bridge were rough. The rough entrance conditions tested were not differentfrom what could be found in many portable bridge installations on temporary skid trails or forest roads.Therefore, the deflection plots indicate that, for bridges installed on skid trail and forest roads, it would notbe unusual to see significantly greater dynamic loads than the static load levels customarily used for designpurposes.
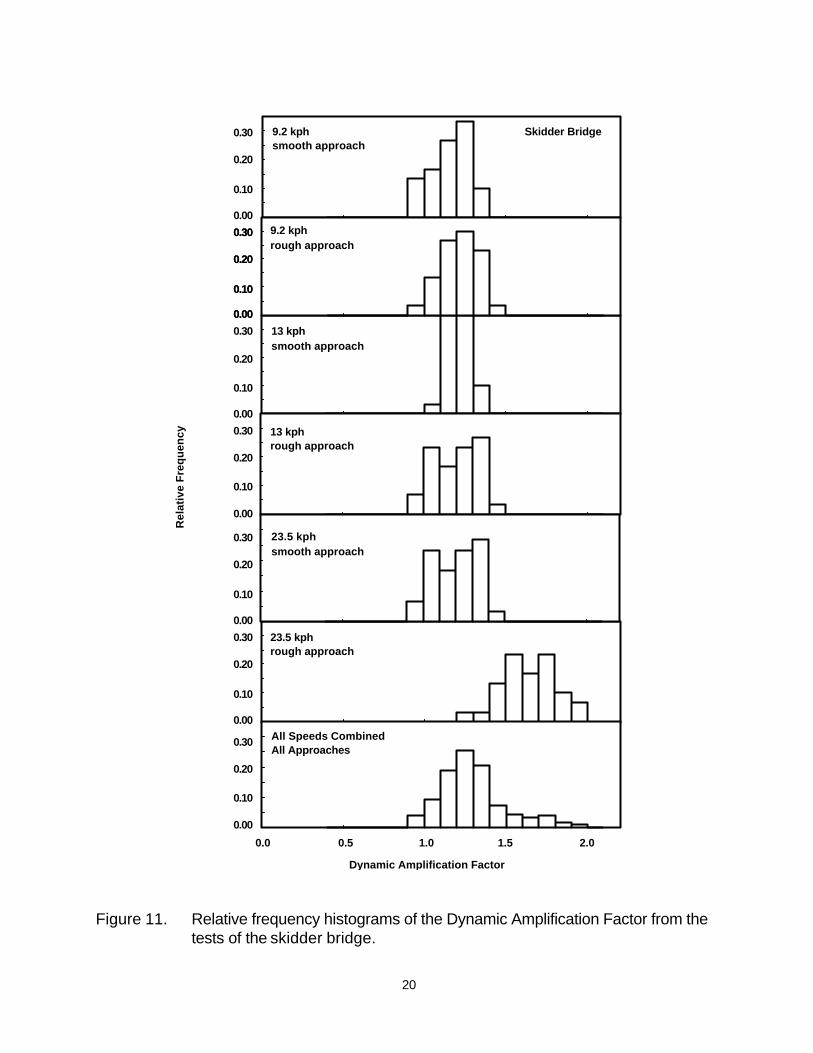
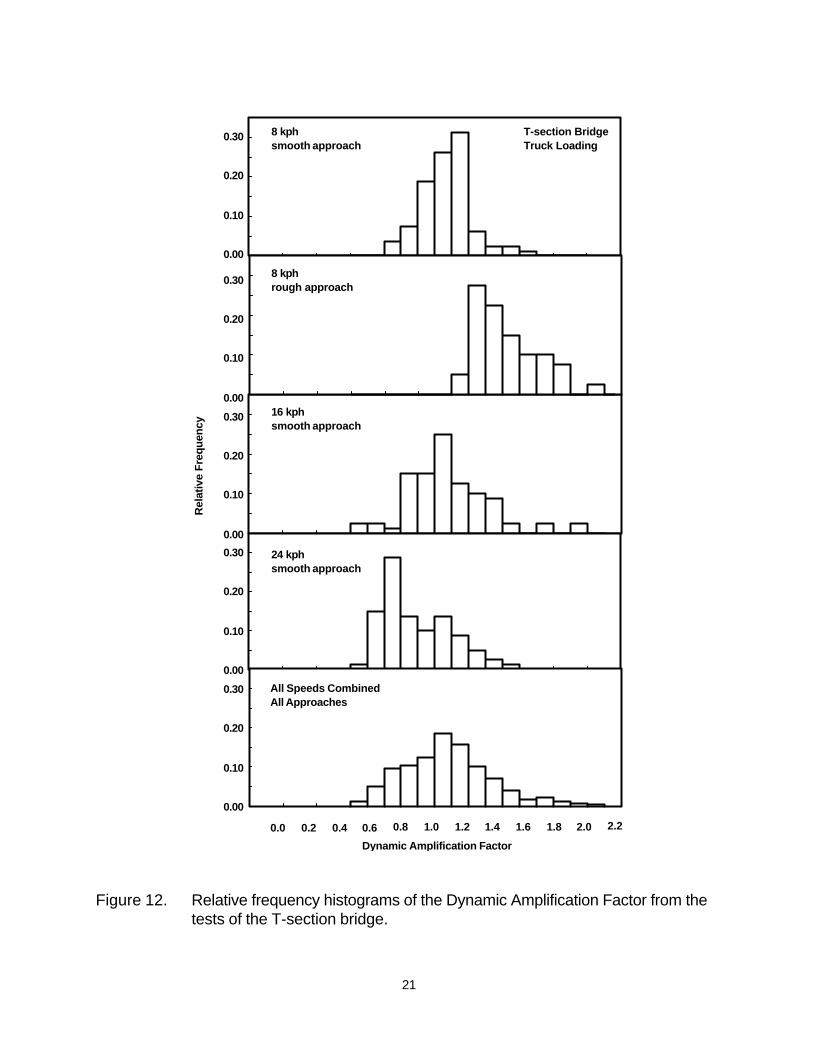
The deflection data from each test run were used to calculate values of DAFs. Tables 2 and 3 includesummary statistics for DAFs determined for the skidder bridge and the T-section bridge tests,respectively. Also, Figures 11 and 12 contain relative frequency histograms of the DAF data for theskidder bridge and the T-section bridge, respectively.
The data in these tables and figures indicate that, overall, the levels of bridge deflection resulting from thedynamic loads were greater than those measured in static tests; i.e. all mean values of DAF were greaterthan 1.0. For the tests of the skidder bridge, values of DAF ranged from 0.90 to 1.49 and 0.93 to 1.93 forthe smooth and rough entrance conditions, respectively. Mean values of DAF were 1.15 and 1.41 for thesmooth and rough entrance condition tests of the skidder bridge, respectively.
DeflectionStaticDeflectionDynamicMaximum
DAF ==
9
For the T-section bridge, values of DAF ranged from 0.81 to 1.95 and 1.22 to 2.06 for the smooth andrough entrance conditions, respectively. Mean values of DAF were 1.19 and 1.53 for the smooth andrough entrance condition tests of the bridge, respectively.
Also, although the mean values of DAF are not considerably different for different speeds, there aredifferences in the shapes of the histograms for DAF for different vehicle speeds. In the case whererough entrance conditions exist, the dynamic forces are considerably greater than static levels. Therefore,the moving vehicle exerts considerably more force on the bridge than we would assume with a staticanalysis.
The tables contain quantile information that may be used to modify our current design procedures. Forexample, to safely consider the effects of actual dynamic loads in the design of a portable bridge, we mightwant to use a dynamic load adjustment factor to increase the traditional static vehicle loads. Also, forstructural design, we typically choose design values for loads or material properties that are in the upper orlower tails of the respective probability distribution. Similarly, to choose an appropriate value of DAF foruse in adjusting static design loads, we should consider a value in the upper tail of the distribution of DAF.If, for example, we choose the 95th percentile value of DAF for the dynamic amplification factor, thiswould result in increasing the current static design loads by a factor of approximately 1.65 or 1.7.However, upon a closer examination of the test conditions, the tests of the skidder bridge that wereconducted at the higher speeds are not representative of common operating speeds for wheeled skidders.Therefore, if we only consider the tests conducted at speeds of approximately 8 kph (5 mph), the 95th
percentile of DAF for both smooth and rough conditions is approximately 1.37, which would suggest theuse of a DAF of approximately 1.4 for designing the sub-low volume bridges. After examining the datafrom the test of the T-section bridge, which would typically be used in the low or high volume bridgecategories, the 95th percentile of DAF for all speeds and approaches was 1.64. Since it is conceivable forthis bridge to experience all of the speeds and entrance conditions tested, it may be advisable to use thehigher DAF value of approximately 1.6 for design purposes.
Using these suggested values of DAF to adjust the design loads would be a significant increase over thedesign loads that are currently being used; therefore, additional study is necessary before recommending afinal value for a dynamic amplification factor. However, based on the test data presented here, it is clearthat the bridge designer should not ignore the higher levels of vehicle loads due to dynamic effects.
SUMMARYPortable bridges are experiencing increased use in the U.S. due to several factors. These factors includepressure to reduce environmental impacts at forest road stream crossings, pressure to reduce constructionand maintenance costs for stream crossings, and the desire to find innovative ways to access forestresources over inadequate roads and bridges. Several different types of portable timber bridges arecurrently being used that have proven to be cost effective and environmentally sensitive stream crossingstructures.
Current timber bridge design methods do not specifically account for dynamic effects from vehicle liveloads. However, recent research on highway bridges indicated that dynamic loads can be greater thanstatic loads. Therefore, to further refine design criteria for portable bridges, dynamic load tests wereconducted on two portable timber bridges: one designed for forestry skidder traffic and one designed forlog truck traffic.
10
Data collected in these dynamic load tests indicate that vehicle loads and the resulting bridge deflectionsunder moving vehicle loads were significantly greater than those observed for static vehicles. For smoothbridge entrance conditions, mean bridge deflection values were 1.15 and 1.19 times greater than staticdeflections for the skidder bridge and the T-section bridge, respectively. Rough bridge entrance conditionsresulted in the highest levels of dynamic load amplification. For the rough bridge entrance conditions,mean bridge deflection values were 1.4 and 1.5 times greater than static deflections for the skidder bridgeand the T-section bridge, respectively. Therefore, when designing the portable bridge, the engineer needsto account for dynamic load effects produced by typical forestry vehicles. Additional work is needed todetermine the appropriate level of this dynamic adjustment for design procedures.
REFERENCES1. American Association of State Highway and Transportation Officials (AASHTO). 1993. Standard
specifications for highway bridges. Washington, DC. AASHTO.2. American Institute of Timber Construction (AITC). 1993. AITC 117-93 Design, standard
specifications for structural glued-laminated timber of softwood species. Englewood, CO. AITC,44 p.
3. American Society for Testing and Materials. 1999. Annual book of standards - Iron and SteelProducts. ASTM, Philadelphia, PA, USA.
4. American Wood Preserver's Association (AWPA). 1991. Standards. Woodstock, MD. AWPA.200 p.
5. Blinn, C.R., R. Dahlman, L. Hislop, M.A. Thompson. 1998. Temporary stream and wetlandcrossing options for forest management. General Technical Report NC-202, USDA ForestService, North Central Research Station. 125 pp.
6. Franklin, J.M. 1999. Design provisions for portable longitudinal glued-laminated timber deckbridges for use in forestry operations. M.S. Thesis. Auburn University, AL. 237 pp.
7. GangaRao, H.V.S., and T.R. Zelina. 1988. Development of low-volume road bridges. ASCEJournal of Structural Engineering 114(9):1941-1961.
8. Knab, L.I., R.C Moody, W.W. Sanders, and H.A. Elleby. 1977. Design criteria for theater ofoperations glued-laminated timber highway bridges, Volume I. Technical Report No. M-198,Construction Engineering Research Laboratory, Champaign, IL. 19 p.
9. Mason, L. 1990. Portable wetland and stream crossings. Pub. No. 9024 1203- SDTDC USDAForest Service, San Dimas Technology and Development Center. 110 pp.
10. Morgan, P.A., S.E. Taylor, M.A. Ritter, J.M Franklin. T-section glulam timber bridge modules:modeling and performance. ASAE Technical Paper No. 99-4207. ASAE, St. Joseph, MI. 22 pp.
11. Ritter, M.A. 1990. Timber bridges, design, construction, inspection, and maintenance. USDAForest Service, Washington, DC. 944 p.
12. Rothwell, R.L. 1983. Erosion and sediment production at road-stream crossings. ForestryChronicle 23:62-66.
13. Swift, L.W. Jr. 1985. Forest road design to minimize erosion in the southern Appalachians. InProceedings of Forestry and Water Quality: A Mid-south Symposium. B.G. Blackmon, Ed.Cooperative Extension Service, University of Arkansas. 141-151.
14. Taylor, S.E.; Keliher, K.P.; Thompson, J.D.; Ritter, M.A.; Murphy, G.L. 1995. Portable glulamtimber bridge design for low-volume forest roads. In Proceedings of the Sixth InternationalConference on Low-Volume Roads. TRB. National Academy Press. Vol. 2:32-338.

11
15. Taylor, S.E.; M.A. Ritter. 1996. Portable T-section glulam timber bridge for low-volume roads.In Proceedings of the National Conference on Wood Transportation Structures, Ed. By M.A.Ritter, S.R. Duwadi, and P.D. Lee. Gen. Tech. Rep. FPL-GTR-94. USDA Forest Service,Madison, WI, USA. Pp. 427-436.
16. Taylor, S.E., M.A. Ritter, K.P. Keliher, and J.D. Thompson. 1996. Portable glulam timber bridgesystems. In Proceedings of the Fourth International Conference on Wood Engineering. Edited byV.K.A. Gopu. Omnipress, Madison, WI.
17. Taylor, S.E., R.B. Rummer, K.H. Yoo, R.A. Welch, J.D. Thompson. 1999. What we know -and don't know - about water quality at stream crossings. Journal of Forestry 97(8):12-17.
18. Thompson, J.D., S.E. Taylor, K.H. Yoo, R.W. Brinker, and R.A. Tufts. 1995. Water qualityimpacts of different forest road stream crossings. In: Proceedings of the 18th Annual Meeting ofthe Council on Forest Engineering. COFE. Pp. 68-76.
19. Tornatore, T.A., D.R. DeWalle, and W.E. Sharpe. 1996. Short stream impacts associated withforest road and skid trail crossings. In: Environmental Issues Affecting the Forestry and ForestProducts Industries in the Eastern United States. Ed. By J.D. Dolan and A Riegel. Gen. Tech.Report NE-219. USDA Forest Service. Northeast Forest Experiment Station. Radnor, PA. Pp162-166.
20. Wipf, T.J., M.A. Ritter, and D.L. Wood. 1996. Dynamic evaluation of timber bridges. InProceedings of the National Conference on Wood Transportation Structures, Ed. By M.A. Ritter,S.R. Duwadi, and P.D. Lee. Gen. Tech. Rep. FPL-GTR-94. USDA Forest Service, Madison,WI, USA. Pp. 114-119.
ACKNOWLEDGMENTSThe authors wish to thank Caterpillar Corporation, personnel from the Caterpillar Forest EquipmentTraining Center, Champion International Corporation, the Morgan County Alabama Forestry PlanningCommittee, and personnel from the USDA Forest Service - Bankhead National Forest for theircooperation during the design, fabrication, and testing of the bridges. This research was supported by theUSDA Forest Service Forest Products Laboratory, USDA Forest Service Southern Research Station -Engineering Research Work Unit and the Alabama Agricultural Experiment Station.
12
Table 1. Suggested categories for portable timber bridges and their respective generaldesign criteria.
Criterion Case 1 Case 2 Case 3 Case 4
Sub-Low Vol. A Sub-Low Vol. B Low Volume High Volume
Design Life 5 years 5 years 10 years 25 years
Traffic Type Off-highway/Forestry Vehicles
i.e. skidders
Off-highway/Trucks
i.e. log trucks
Trucks/Light Vehicles
Unlimited
AverageDaily
Traffic50 15 100 500
Design Speed 8 kph (5 mph) 8 kph (5 mph) 8 kph (5 mph) 40 kph (25 mph)
Load Off-highway HS 20 Off-highway HS 20 or HS 25
LoadApplication
Period
6 months 24 months 24 months 36 months
Deflection none none none AASHTO
Span Type simple simple simple simple
Table 2. Summary statistics for the Dynamic Amplification Factor (the ratio of dynamicbridge deflection to static bridge deflection) from dynamic load tests of the skidderbridge.
9.2kph
Smooth
9.2kph
Rough
13kph
Smooth
13kph
Rough
23.5kph
Smooth
23.5kph
Rough
All SpeedsSmooth
andRough
N 30 30 30 30 30 30 180Mean 1.15 1.22 1.22 1.36 1.2 1.64 1.29Coefficient ofVariation
10.9% 9.1% 5.6% 6.8% 11.8% 10.0% 15.7%
Maximum 1.36 1.40 1.36 1.61 1.49 1.93 1.93Minimum 0.90 0.93 1.09 1.14 0.92 1.24 0.9090th Percentile 1.28 1.35 1.29 1.47 1.36 1.84 1.6095th Percentile 1.31 1.37 1.34 1.49 1.37 1.88 1.71
13
Table 3. Summary statistics for the Dynamic Amplification Factor (the ratio of dynamicbridge deflection to static bridge deflection) from dynamic load tests of the T-section bridge.
8 kphSmooth
Approach
8 kphRough
Approach
16 kphSmooth
Approach
24 kphSmooth
Approach
All Speeds andApproachesCombined
N 80 40 80 80 280Mean 1.16 1.53 1.18 0.99 1.17Coefficient ofVariation
12.4% 11.8% 20.6% 19.6% 21.8
Maximum 1.61 2.06 1.95 1.53 2.06Minimum 0.81 1.22 0.63 0.69 0.6390th Percentile 1.36 1.81 1.47 1.26 1.5095th Percentile 1.42 1.83 1.73 1.37 1.64
Figure 1. Typical installation of the portable longitudinal glulam deck bridge for skiddertraffic.
14
Figure 2. Portable glulam skidder bridge as installed for the dynamic load tests.
Figure 3. Finished installation of the T-section glulam deck bridge.
15
Figure 4. Placement of DCDT’s under midspan of skidder bridge.
Figure 5. Placement of DCDT’s under midspan and bearing of T-section bridge.
16
Figure 6. Wheeled skidder crossing bridge during dynamic testing of skidder bridge.
Figure 7. Tandem-axle truck crossing bridge during dynamic testing of the T-sectionbridge.

17
Figure 8. Typical plots of dynamic bridge deflection versus time for test runs of theskidder bridge. Various test speeds and entrance conditions are shown.
9.2 kph Smooth Approach
staticdeflection
13 kph Rough Approach
13 kph Smooth Approach
9.28 kph Rough Approach
23.5 kph Smooth Approach
23.5 kph Rough Approach
-37.5
-25.0
-12.5
0.0
-50.0
-62.5
-37.5
-25.0
-12.5
0.0
-50.0
-62.5
-37.5
-25.0
-12.5
0.0
-50.0
-62.5
-37.5
-25.0
-12.5
0.0
-50.0
-62.5
-37.5
-25.0
-12.5
0.0
-50.0
-62.5
-37.5
-25.0
-12.5
0.0
-50.0
-62.5
Bri
dg
e D
efle
ctio
n (m
m)
0.0 2.3 4.5 6.7 8.9
Time (sec)
staticdeflection
staticdeflection
staticdeflection
staticdeflection
staticdeflection
18
Figure 9. Typical plots of dynamic bridge deflection versus time for test runs of the T-section bridge. Various test speeds and entrance conditions are shown.
0 1 2 3 4 5 6 7
0 1 2 3 4 5 6
0 1 2 3 4 5
0 1 2 3 4 5 6 7Time (sec)
8 kph Smooth Approach
static deflection
16 kph Smooth Approach
static deflection
24 kph Smooth Approach
static deflection
8 kph Rough Approach
static deflection
Bri
dg
e D
efle
ctio
n (
mm
)
-3.75
-2.50
-1.25
0.0
-5.00
-6.25
-3.75
-2.50
-1.25
0.0
-5.00
-6.25
-3.75
-2.50
-1.25
0.0
-5.00
-6.25
-3.75
-2.50
-1.25
0.0
-5.00
-6.25
19
Figure 10. Example of one of the dynamic test runs over the T-section bridge with therough entrance condition. The front axle of the rear tandem is not contactingthe bridge deck.
20
Figure 11. Relative frequency histograms of the Dynamic Amplification Factor from thetests of the skidder bridge.
Skidder Bridge9.2 kphsmooth approach
9.2 kphrough approach
13 kphsmooth approach
13 kphrough approach
23.5 kphsmooth approach
23.5 kphrough approach
All Speeds CombinedAll Approaches
0.0 0.5 1.0 1.5 2.0
Dynamic Amplification Factor
0.00
0.10
0.20
0.30
0.00
0.10
0.20
0.30
0.00
0.10
0.20
0.30
0.00
0.10
0.20
0.30
0.00
0.10
0.20
0.30
0.00
0.10
0.20
0.30
0.00
0.10
0.20
0.30
0.00
0.10
0.20
0.30
Rel
ativ
e F
req
uen
cy
21
Figure 12. Relative frequency histograms of the Dynamic Amplification Factor from thetests of the T-section bridge.
8 kphsmooth approach
8 kphrough approach
16 kphsmooth approach
24 kphsmooth approach
0.0 0.2 0.4 0.6 0.8 1.0 1.2 1.4 1.6 1.8 2.0 2.2
Dynamic Amplification Factor
T-section BridgeTruck Loading
All Speeds CombinedAll Approaches
0.00
0.10
0.20
0.30
0.00
0.10
0.20
0.30
0.00
0.10
0.20
0.30
0.00
0.10
0.20
0.30
0.00
0.10
0.20
0.30
Rel
ativ
e F
req
uen
cy