Embed Size (px)
Citation preview
Design Considerations of LED based Visible Notification Appliances
Johnny K. W. Siu, Ph.D. - Light Engine Limited
I. INTRODUCTION
Solid state light emitters, Light Emitting Diodes, LEDs have been widely used in signal
lights, automobile lights, large screen display, decorative lights and general
illumination. Recent technology advancement has triggered consideration of LED as
an alternative light source for the traditional xenon flash tubes in fire alarm notification
strobes. The consideration is driven by four key factors, lower power consumption,
reduced costs, potential reliability enhancement and increased design flexibility.
The proposed xenon tube alternative has triggered considerable controversy and in
turn has resulted in the publication of a number of research papers examining the
performance of LED light sources as effective replacements for the traditional xenon
flash tube. Savage [1] reported LEDs have a very different light output profile than a
xenon tube. Since the power capability of high brightness LEDs is limited relative to
that of the xenon tube, LEDs can only achieve candela ratings in the range required in
mainstream fire notification applications by lengthening the light output pulse width.
Savage found that light sources with longer durations tended to have lower
detectability and in some cases [2], 100 ms pulse was essentially invisible.
Bullough et al [3] proposed that the absolute or instantaneous intensity from a light
source when viewed indirectly should be used to measure the source’s performance.
Bullough et al [4] further proposed to use Indirect Effectiveness Quantity (IEQ) to
measure the performance of a light source and establish a baseline for an indirect
detection rate of 90% with IEQ value of more than 750 cd under a room illuminance of
500 lux for light sources at a distance of 20 feet.
In this paper, we discuss how this baseline luminous intensity requirement can be
achieved using an LED light source while maintaining a short pulse length. Based on
the equation of IEQ [4], we will derive a formula for the luminous flux requirement of
LED. Since strobe light is a very unique LED application, special design considerations
and optimizations are needed for the selection of LED, over driving LED with pulse
current, thermal design and optical design parameters. We will present a list of design
considerations for LED strobe light. We will also examine the performance of a LED
prototype by presenting analytical as well as experimental results.
II. IEQ and LED FLUX
Bullough et al [4], based on the definition of effective intensity, developed IEQ to
measure the performance of a light source:
𝐼𝐼𝐸𝐸𝐸𝐸 = ∫ 𝐼𝐼(𝑡𝑡)𝑑𝑑𝑡𝑡𝑡𝑡2𝑡𝑡1
𝑎𝑎 + 𝑡𝑡2 − 𝑡𝑡1
where t1 and t2 are the start and end times (in seconds) of the flash of light respectively;
I(t) is the instantaneous luminous intensity (in candela) of the flash at time t; and a is a
constant equals to 0.01s.
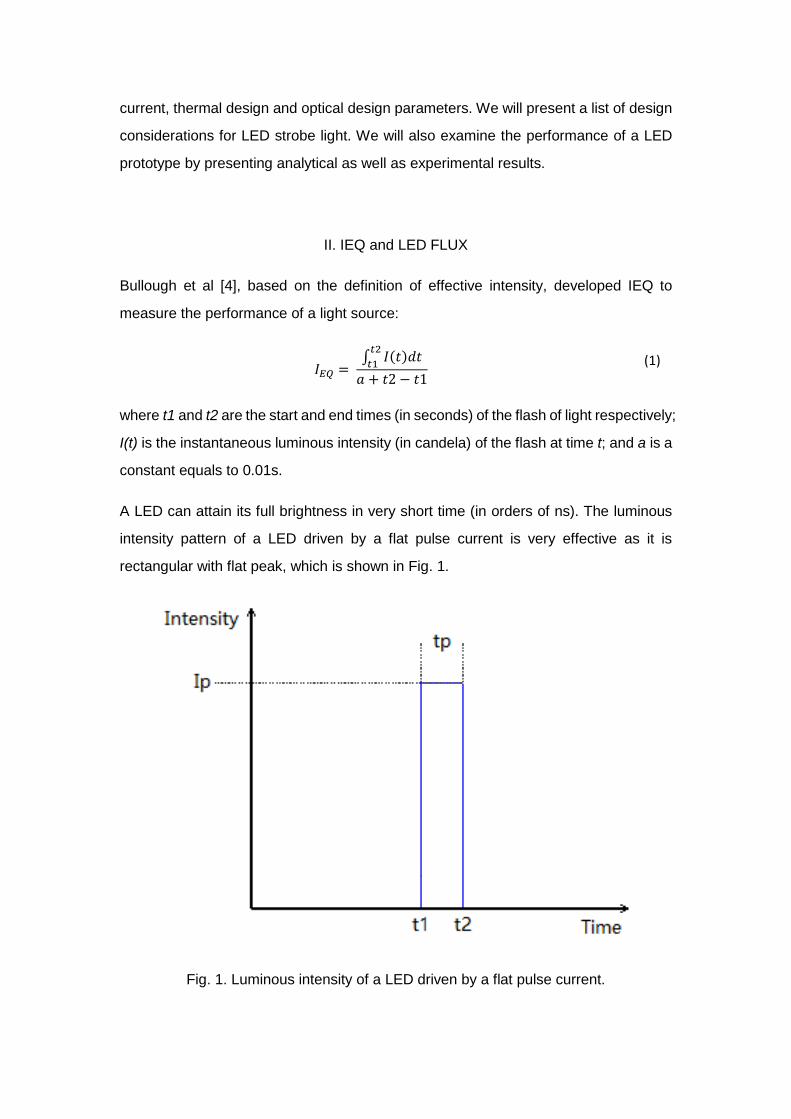
A LED can attain its full brightness in very short time (in orders of ns). The luminous
intensity pattern of a LED driven by a flat pulse current is very effective as it is
rectangular with flat peak, which is shown in Fig. 1.
Fig. 1. Luminous intensity of a LED driven by a flat pulse current.
(1)
For the LED luminous intensity pattern shown in Fig. 1, the IEQ as given by (1)
becomes
𝐼𝐼𝐸𝐸𝐸𝐸 = 𝐼𝐼𝑝𝑝 𝑡𝑡𝑝𝑝𝑎𝑎 + 𝑡𝑡𝑝𝑝
where tp is the pulse duration (in seconds); Ip is the peak luminous intensity (in candela).
Rearranging, we get
𝐼𝐼𝑝𝑝 = 𝐼𝐼𝐸𝐸𝐸𝐸(𝑎𝑎 + 𝑡𝑡𝑝𝑝)
𝑡𝑡𝑝𝑝
A complete LED lighting solution always includes an optical component such as a lens
or reflector to achieve of the required optical performance of the product. One
important parameter of the optical component is the on-axis intensity, which is in terms
of candela per lumen (cd/lm), as it specifies the height of the light distribution curve in
absolute scale.
High power LEDs are usually specified in terms of lumen for the luminous flux output.
To get the flux requirement Φv for a specific IEQ value, it is assumed that the on-axis
intensity of the optical system is Ki.
𝛷𝛷𝑣𝑣 = 𝐼𝐼𝑝𝑝𝐾𝐾𝑖𝑖
=𝐼𝐼𝐸𝐸𝐸𝐸(𝑎𝑎 + 𝑡𝑡𝑝𝑝)
𝐾𝐾𝑖𝑖 𝑡𝑡𝑝𝑝
Putting practical values of tp = 0.01s and Ki = 0.25 cd/lm into (4), the baseline IEQ
value of 750 cd can be achieved with Φv of 6000 lm.
III. LED SELECTION
With the establishment of (4), the LED can be selected according to the luminous flux
requirement for a specific design. To achieve certain flux requirement, one can use
multiple LEDs or a single package LED. It is preferred to use single package LED in
strobe light applications as a lens is required for a desired light distribution. The LED
should be selected with high rated pulse current to deliver high output lumen while the
LED package should remain small for easy accommodation in the optical lens.
(2)
(3)
(4)
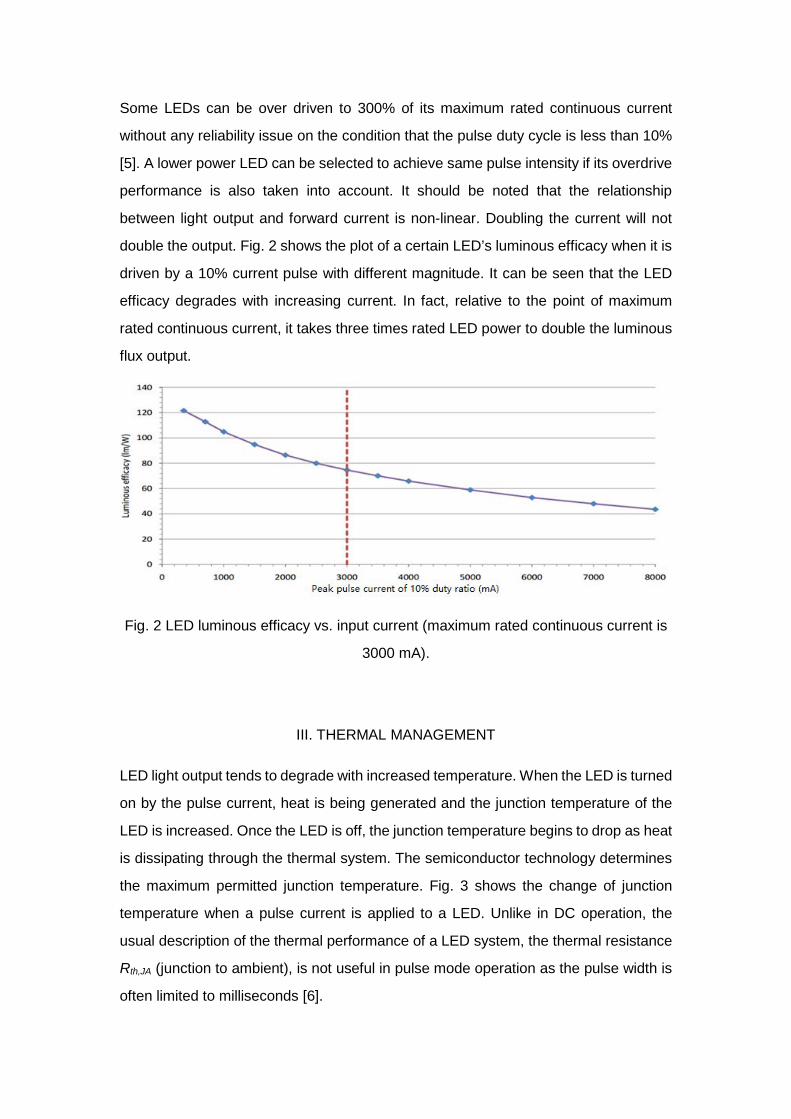
Some LEDs can be over driven to 300% of its maximum rated continuous current
without any reliability issue on the condition that the pulse duty cycle is less than 10%
[5]. A lower power LED can be selected to achieve same pulse intensity if its overdrive
performance is also taken into account. It should be noted that the relationship
between light output and forward current is non-linear. Doubling the current will not
double the output. Fig. 2 shows the plot of a certain LED’s luminous efficacy when it is
driven by a 10% current pulse with different magnitude. It can be seen that the LED
efficacy degrades with increasing current. In fact, relative to the point of maximum
rated continuous current, it takes three times rated LED power to double the luminous
flux output.
Fig. 2 LED luminous efficacy vs. input current (maximum rated continuous current is
3000 mA).
III. THERMAL MANAGEMENT
LED light output tends to degrade with increased temperature. When the LED is turned
on by the pulse current, heat is being generated and the junction temperature of the
LED is increased. Once the LED is off, the junction temperature begins to drop as heat
is dissipating through the thermal system. The semiconductor technology determines
the maximum permitted junction temperature. Fig. 3 shows the change of junction
temperature when a pulse current is applied to a LED. Unlike in DC operation, the
usual description of the thermal performance of a LED system, the thermal resistance
Rth,JA (junction to ambient), is not useful in pulse mode operation as the pulse width is
often limited to milliseconds [6].
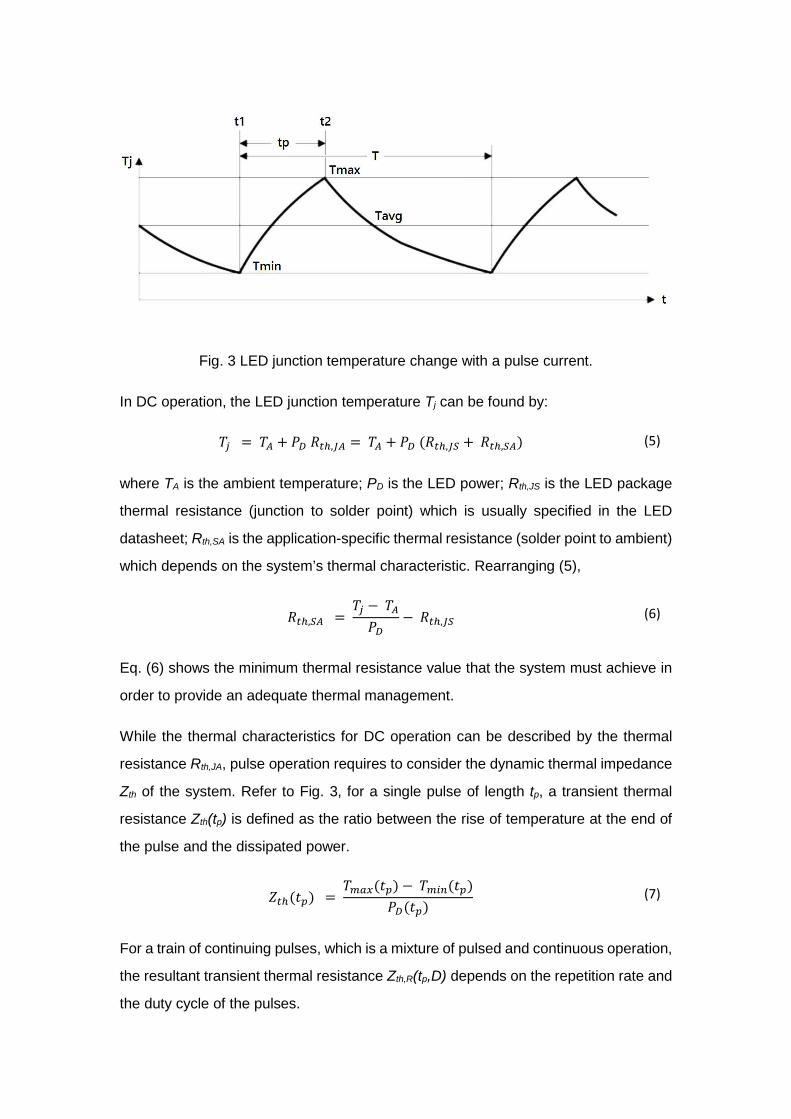
Fig. 3 LED junction temperature change with a pulse current.
In DC operation, the LED junction temperature Tj can be found by:
𝑇𝑇𝑗𝑗 = 𝑇𝑇𝐴𝐴 + 𝑃𝑃𝐷𝐷 𝑅𝑅𝑡𝑡ℎ,𝐽𝐽𝐴𝐴 = 𝑇𝑇𝐴𝐴 + 𝑃𝑃𝐷𝐷 (𝑅𝑅𝑡𝑡ℎ,𝐽𝐽𝐽𝐽 + 𝑅𝑅𝑡𝑡ℎ,𝐽𝐽𝐴𝐴)
where TA is the ambient temperature; PD is the LED power; Rth,JS is the LED package
thermal resistance (junction to solder point) which is usually specified in the LED
datasheet; Rth,SA is the application-specific thermal resistance (solder point to ambient)
which depends on the system’s thermal characteristic. Rearranging (5),
𝑅𝑅𝑡𝑡ℎ,𝐽𝐽𝐴𝐴 = 𝑇𝑇𝑗𝑗 − 𝑇𝑇𝐴𝐴𝑃𝑃𝐷𝐷
− 𝑅𝑅𝑡𝑡ℎ,𝐽𝐽𝐽𝐽
Eq. (6) shows the minimum thermal resistance value that the system must achieve in
order to provide an adequate thermal management.
While the thermal characteristics for DC operation can be described by the thermal
resistance Rth,JA, pulse operation requires to consider the dynamic thermal impedance
Zth of the system. Refer to Fig. 3, for a single pulse of length tp, a transient thermal
resistance Zth(tp) is defined as the ratio between the rise of temperature at the end of
the pulse and the dissipated power.
𝑍𝑍𝑡𝑡ℎ(𝑡𝑡𝑝𝑝) = 𝑇𝑇𝑚𝑚𝑚𝑚𝑚𝑚(𝑡𝑡𝑝𝑝) − 𝑇𝑇𝑚𝑚𝑖𝑖𝑚𝑚(𝑡𝑡𝑝𝑝)
𝑃𝑃𝐷𝐷(𝑡𝑡𝑝𝑝)
For a train of continuing pulses, which is a mixture of pulsed and continuous operation,
the resultant transient thermal resistance Zth,R(tp,D) depends on the repetition rate and
the duty cycle of the pulses.
(5)
(6)
(7)
𝑍𝑍𝑡𝑡ℎ,𝑅𝑅�𝑡𝑡𝑝𝑝,𝐷𝐷� = (1 − 𝐷𝐷) 𝑍𝑍𝑡𝑡ℎ�𝑡𝑡𝑝𝑝�+ 𝐷𝐷 𝑅𝑅𝑡𝑡ℎ,𝐽𝐽𝐴𝐴
where D = tp / T;
It should be noted that when tp → ∞, Zth(tp) → Rth,JA.
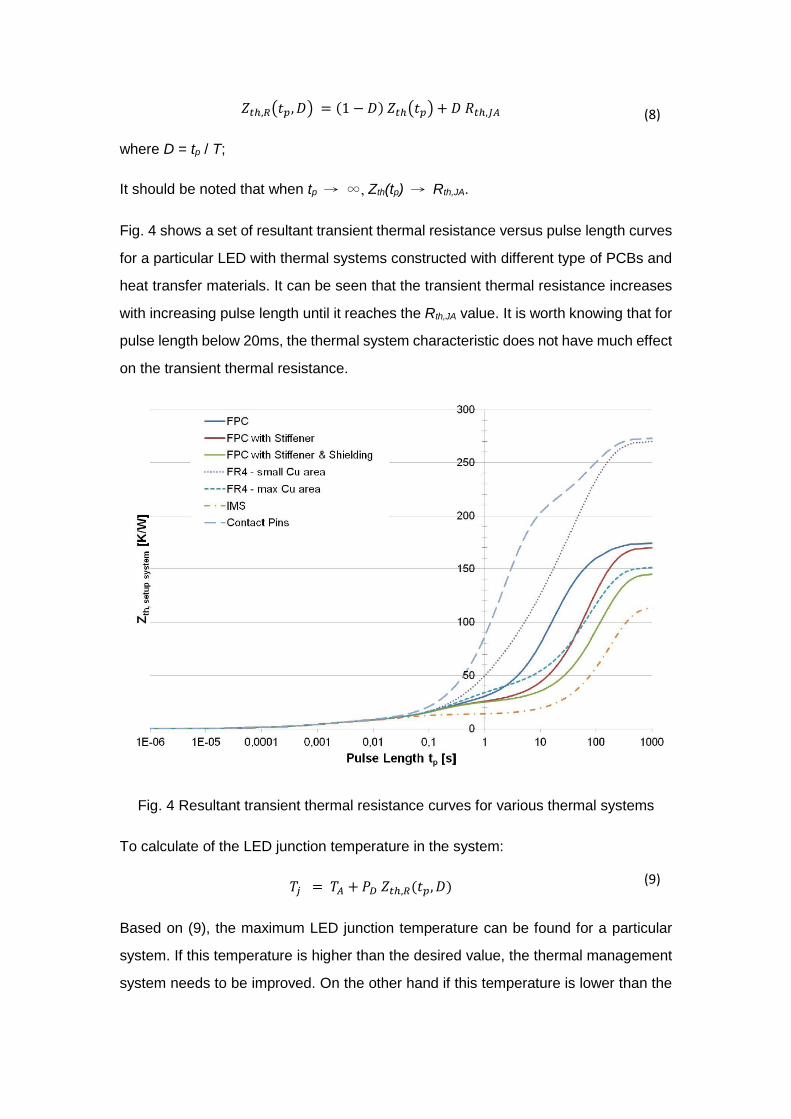
Fig. 4 shows a set of resultant transient thermal resistance versus pulse length curves
for a particular LED with thermal systems constructed with different type of PCBs and
heat transfer materials. It can be seen that the transient thermal resistance increases
with increasing pulse length until it reaches the Rth,JA value. It is worth knowing that for
pulse length below 20ms, the thermal system characteristic does not have much effect
on the transient thermal resistance.
Fig. 4 Resultant transient thermal resistance curves for various thermal systems
To calculate of the LED junction temperature in the system:
𝑇𝑇𝑗𝑗 = 𝑇𝑇𝐴𝐴 + 𝑃𝑃𝐷𝐷 𝑍𝑍𝑡𝑡ℎ,𝑅𝑅(𝑡𝑡𝑝𝑝,𝐷𝐷)
Based on (9), the maximum LED junction temperature can be found for a particular
system. If this temperature is higher than the desired value, the thermal management
system needs to be improved. On the other hand if this temperature is lower than the
(8)
(9)
desired value, there is room for operating the system at a higher current or ambient
temperature.
IV. OPTICAL LENS
The light pattern of a LED can be modified with the addition of an optical lens. Unlike
reflector designs, almost all the light generated by an LED can be directed to the lens
for distribution. Spilled light can be recovered by the use of a lens with efficiency over
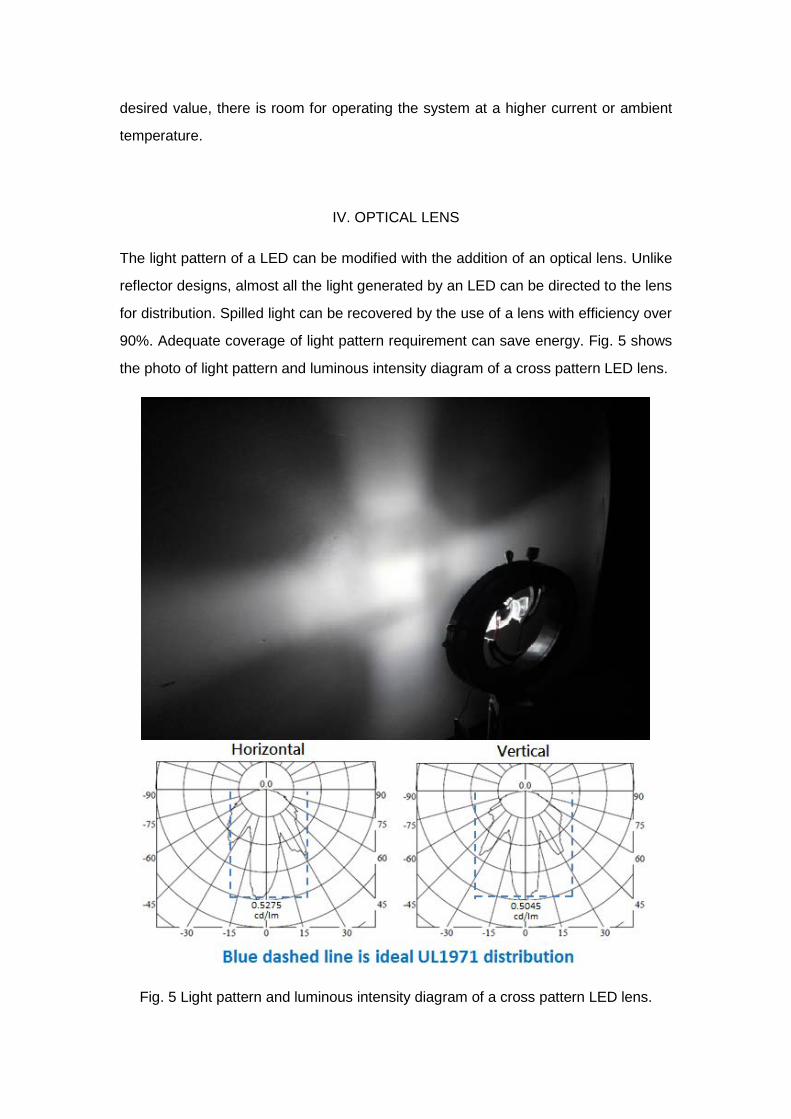
90%. Adequate coverage of light pattern requirement can save energy. Fig. 5 shows
the photo of light pattern and luminous intensity diagram of a cross pattern LED lens.
Fig. 5 Light pattern and luminous intensity diagram of a cross pattern LED lens.
The on-axis intensity of the cross pattern lens is about 0.5 cd/lm. The blue dashed
lines indicate the ideal UL1971 [7] distribution pattern. The lens cannot fulfill the ideal
pattern at varies angles which can be visualized as dark zones in the photo.
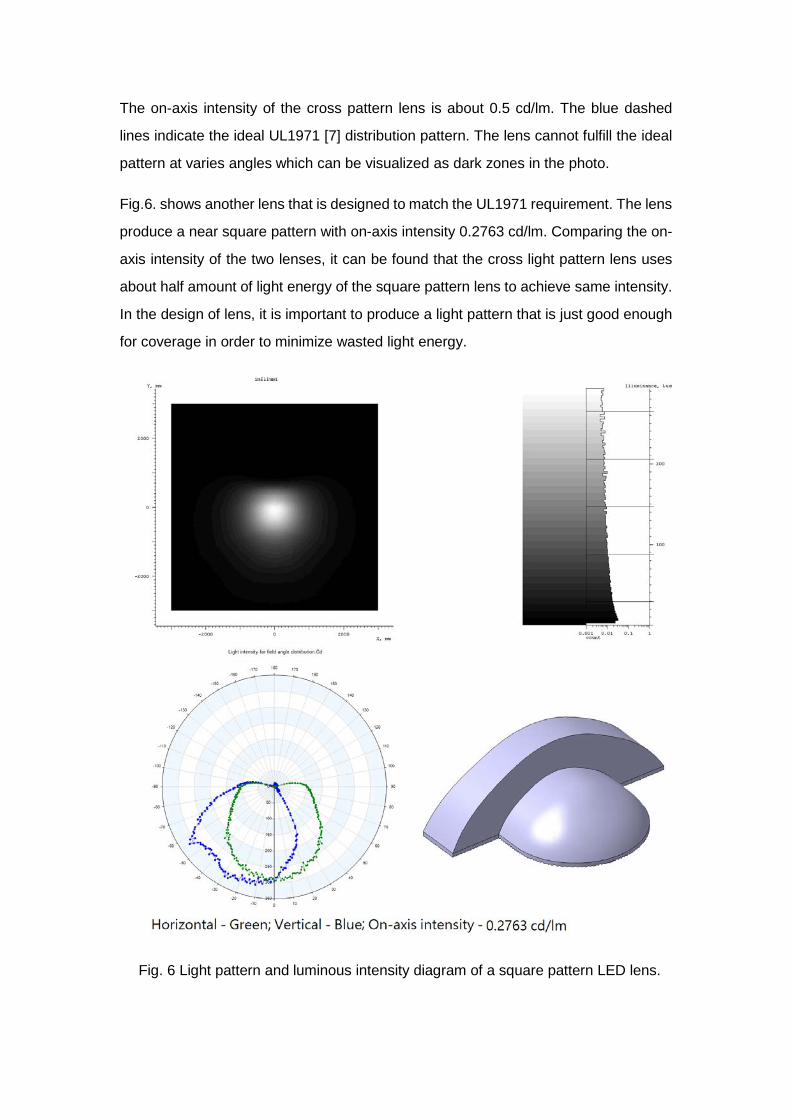
Fig.6. shows another lens that is designed to match the UL1971 requirement. The lens
produce a near square pattern with on-axis intensity 0.2763 cd/lm. Comparing the on-
axis intensity of the two lenses, it can be found that the cross light pattern lens uses
about half amount of light energy of the square pattern lens to achieve same intensity.
In the design of lens, it is important to produce a light pattern that is just good enough
for coverage in order to minimize wasted light energy.
Fig. 6 Light pattern and luminous intensity diagram of a square pattern LED lens.
V. EXPERIMENTAL PROTOTYPE
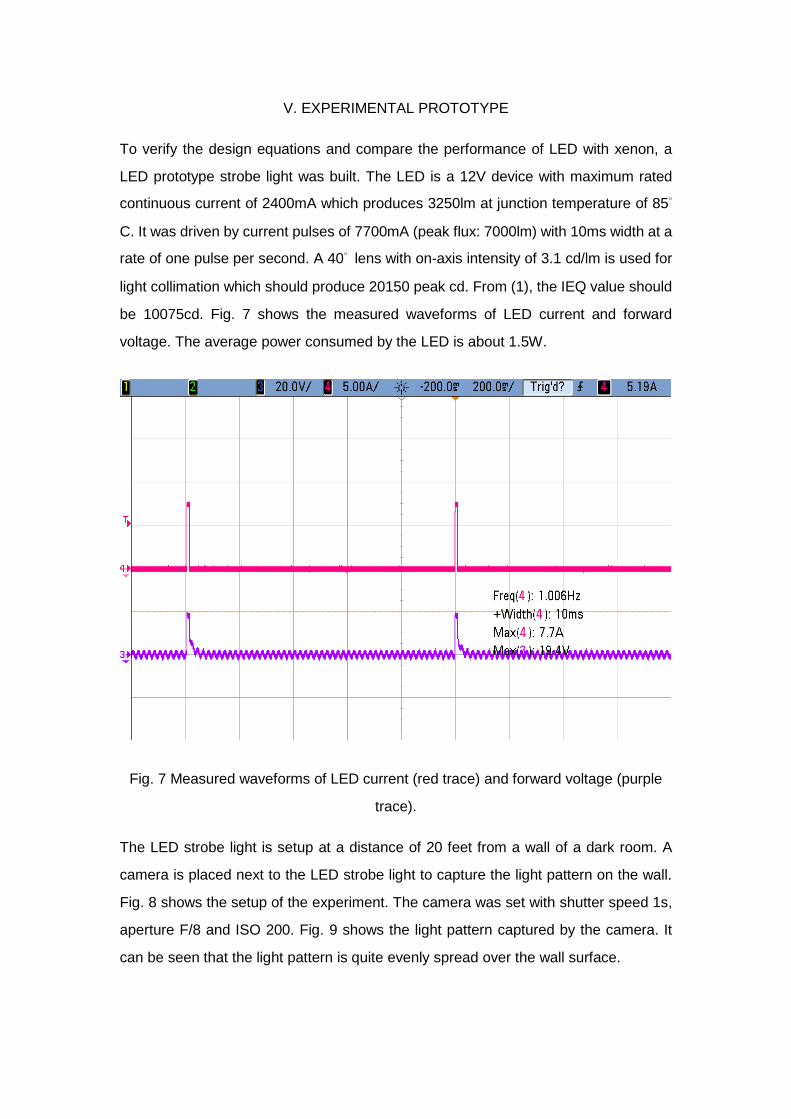
To verify the design equations and compare the performance of LED with xenon, a
LED prototype strobe light was built. The LED is a 12V device with maximum rated
continuous current of 2400mA which produces 3250lm at junction temperature of 85°
C. It was driven by current pulses of 7700mA (peak flux: 7000lm) with 10ms width at a
rate of one pulse per second. A 40° lens with on-axis intensity of 3.1 cd/lm is used for
light collimation which should produce 20150 peak cd. From (1), the IEQ value should
be 10075cd. Fig. 7 shows the measured waveforms of LED current and forward
voltage. The average power consumed by the LED is about 1.5W.
Fig. 7 Measured waveforms of LED current (red trace) and forward voltage (purple
trace).
The LED strobe light is setup at a distance of 20 feet from a wall of a dark room. A
camera is placed next to the LED strobe light to capture the light pattern on the wall.
Fig. 8 shows the setup of the experiment. The camera was set with shutter speed 1s,
aperture F/8 and ISO 200. Fig. 9 shows the light pattern captured by the camera. It
can be seen that the light pattern is quite evenly spread over the wall surface.

Fig. 8 Setup of the experiment
Fig. 9 Light pattern of LED strobe light.
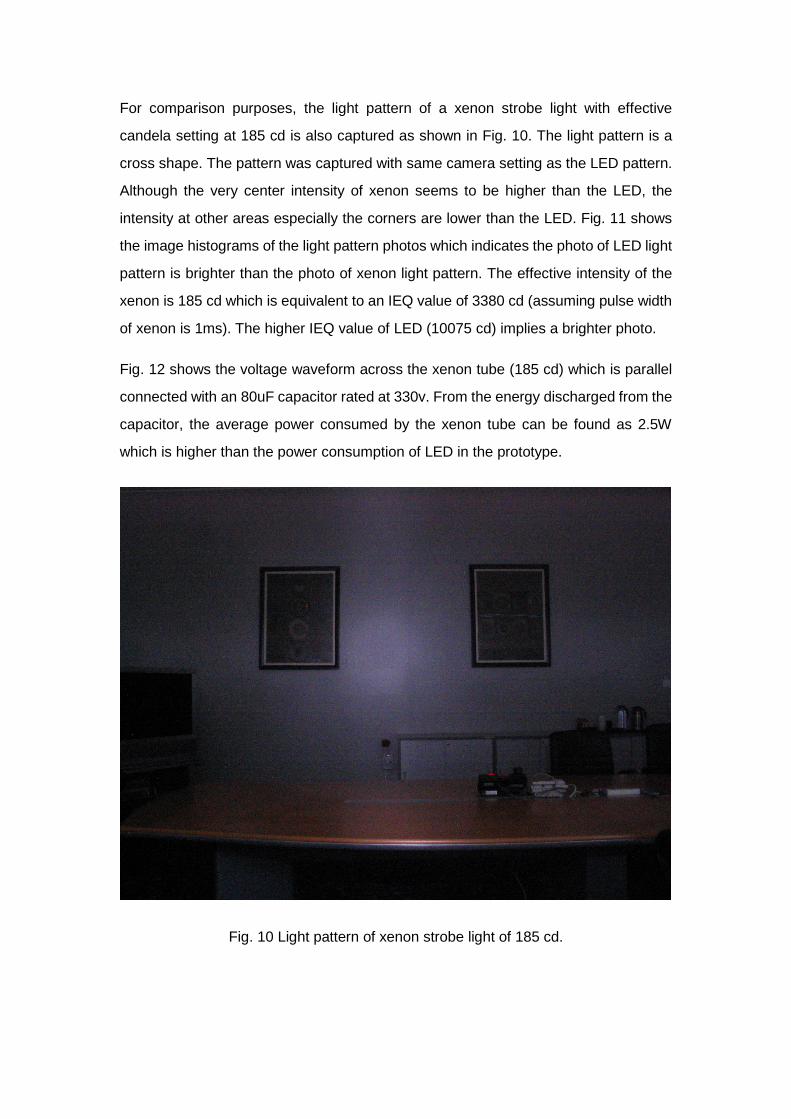
For comparison purposes, the light pattern of a xenon strobe light with effective
candela setting at 185 cd is also captured as shown in Fig. 10. The light pattern is a
cross shape. The pattern was captured with same camera setting as the LED pattern.
Although the very center intensity of xenon seems to be higher than the LED, the
intensity at other areas especially the corners are lower than the LED. Fig. 11 shows
the image histograms of the light pattern photos which indicates the photo of LED light
pattern is brighter than the photo of xenon light pattern. The effective intensity of the
xenon is 185 cd which is equivalent to an IEQ value of 3380 cd (assuming pulse width
of xenon is 1ms). The higher IEQ value of LED (10075 cd) implies a brighter photo.
Fig. 12 shows the voltage waveform across the xenon tube (185 cd) which is parallel
connected with an 80uF capacitor rated at 330v. From the energy discharged from the
capacitor, the average power consumed by the xenon tube can be found as 2.5W
which is higher than the power consumption of LED in the prototype.
Fig. 10 Light pattern of xenon strobe light of 185 cd.
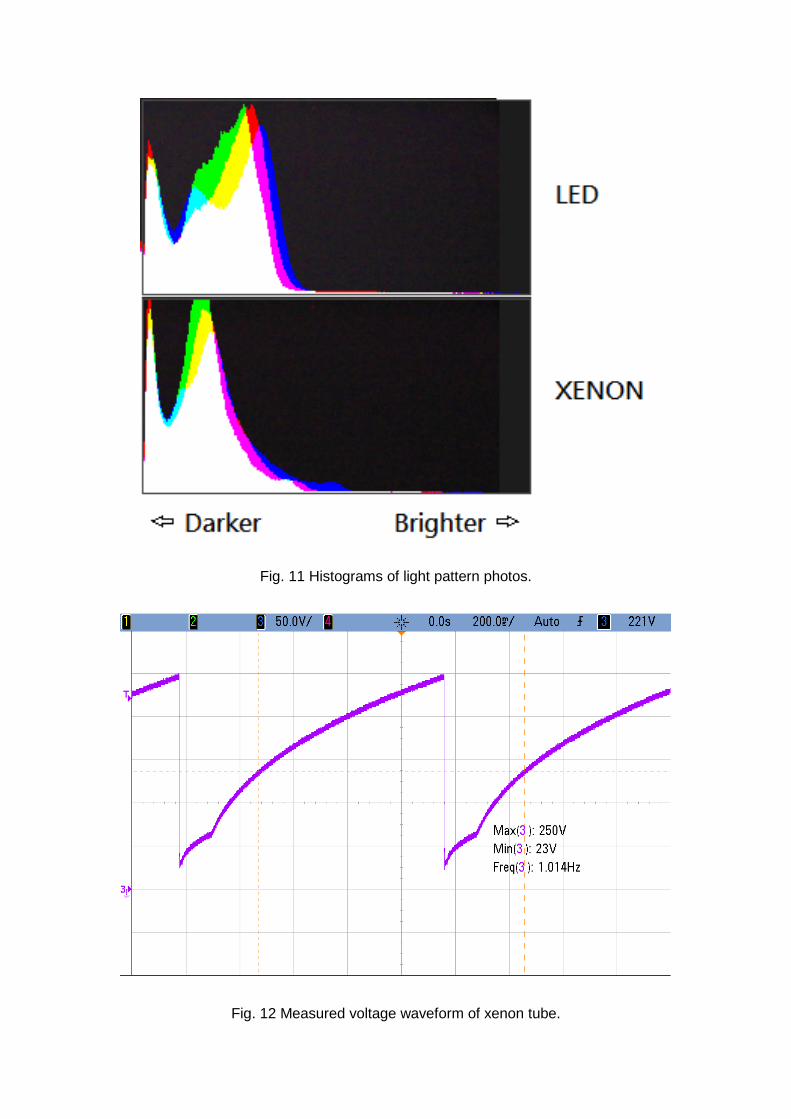
Fig. 11 Histograms of light pattern photos.
Fig. 12 Measured voltage waveform of xenon tube.
VI. INDIRECT VIEWING EXPERIMENT
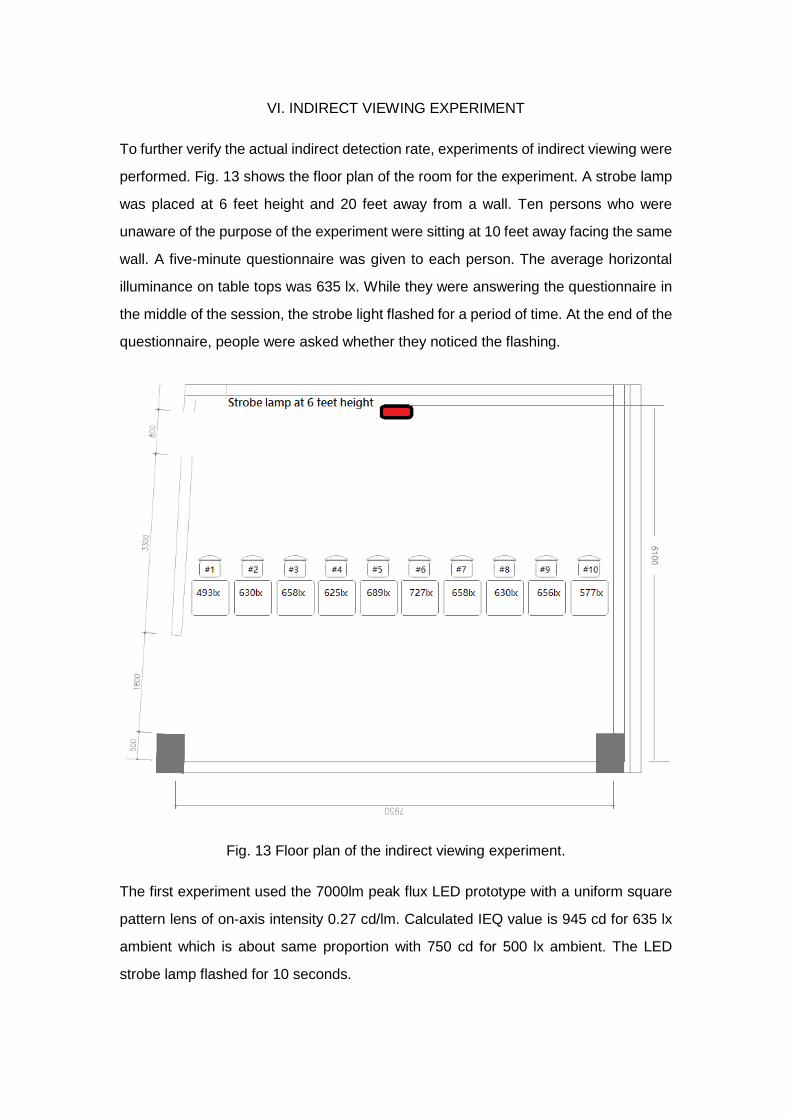
To further verify the actual indirect detection rate, experiments of indirect viewing were
performed. Fig. 13 shows the floor plan of the room for the experiment. A strobe lamp
was placed at 6 feet height and 20 feet away from a wall. Ten persons who were
unaware of the purpose of the experiment were sitting at 10 feet away facing the same
wall. A five-minute questionnaire was given to each person. The average horizontal
illuminance on table tops was 635 lx. While they were answering the questionnaire in
the middle of the session, the strobe light flashed for a period of time. At the end of the
questionnaire, people were asked whether they noticed the flashing.
Fig. 13 Floor plan of the indirect viewing experiment.
The first experiment used the 7000lm peak flux LED prototype with a uniform square
pattern lens of on-axis intensity 0.27 cd/lm. Calculated IEQ value is 945 cd for 635 lx
ambient which is about same proportion with 750 cd for 500 lx ambient. The LED
strobe lamp flashed for 10 seconds.
The second experiment used a 135 cd effective intensity xenon strobe lamp. Assuming
the xenon pulse width is 1ms, the calculated IEQ value is 2466cd. The xenon strobe
lamp flashed for 10 seconds.
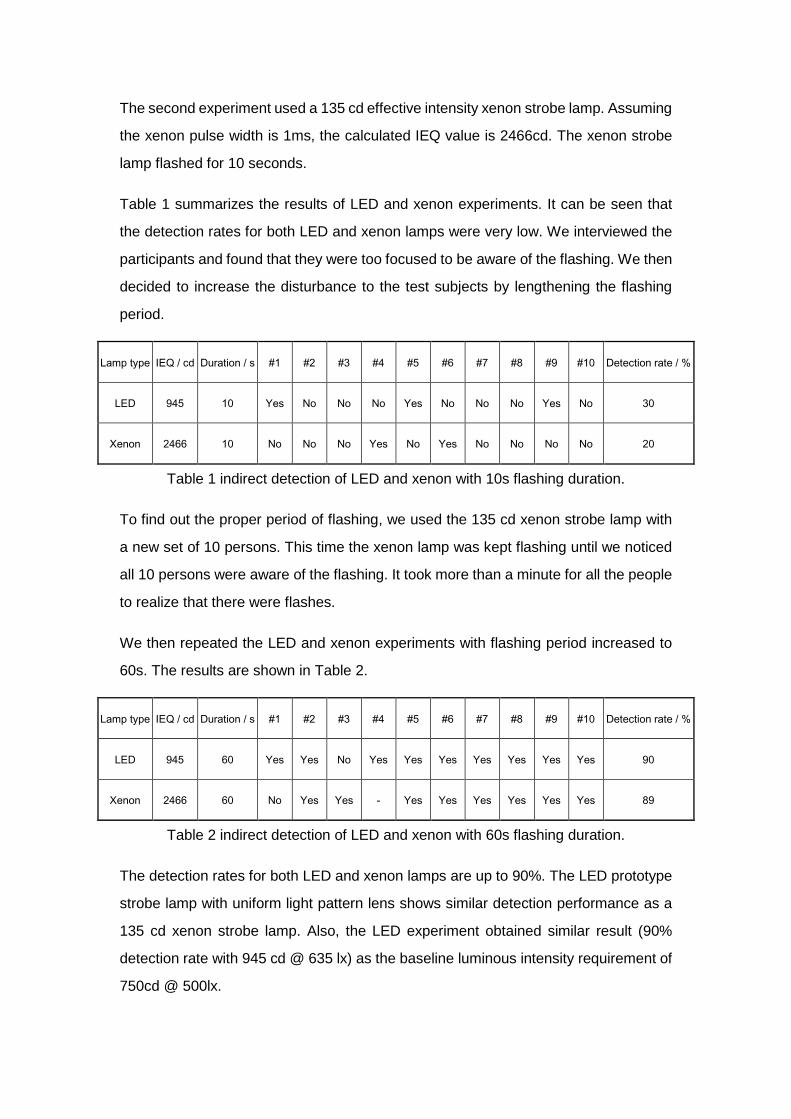
Table 1 summarizes the results of LED and xenon experiments. It can be seen that
the detection rates for both LED and xenon lamps were very low. We interviewed the
participants and found that they were too focused to be aware of the flashing. We then
decided to increase the disturbance to the test subjects by lengthening the flashing
period.
Lamp type IEQ / cd Duration / s #1 #2 #3 #4 #5 #6 #7 #8 #9 #10 Detection rate / %
LED 945 10 Yes No No No Yes No No No Yes No 30
Xenon 2466 10 No No No Yes No Yes No No No No 20
Table 1 indirect detection of LED and xenon with 10s flashing duration.
To find out the proper period of flashing, we used the 135 cd xenon strobe lamp with
a new set of 10 persons. This time the xenon lamp was kept flashing until we noticed
all 10 persons were aware of the flashing. It took more than a minute for all the people
to realize that there were flashes.
We then repeated the LED and xenon experiments with flashing period increased to
60s. The results are shown in Table 2.
Lamp type IEQ / cd Duration / s #1 #2 #3 #4 #5 #6 #7 #8 #9 #10 Detection rate / %
LED 945 60 Yes Yes No Yes Yes Yes Yes Yes Yes Yes 90
Xenon 2466 60 No Yes Yes - Yes Yes Yes Yes Yes Yes 89
Table 2 indirect detection of LED and xenon with 60s flashing duration.
The detection rates for both LED and xenon lamps are up to 90%. The LED prototype
strobe lamp with uniform light pattern lens shows similar detection performance as a
135 cd xenon strobe lamp. Also, the LED experiment obtained similar result (90%
detection rate with 945 cd @ 635 lx) as the baseline luminous intensity requirement of
750cd @ 500lx.

VII. CONCLUSION
LED can provide a reasonably high luminous intensity with short pulse length for strobe
light applications. A formula for estimating the lumen requirement of LED for strobe
lights is derived. Short LED pulse current can ease the design of thermal system. Light
energy could be reduced with lens of shaped light patterns. Experimental verification
has shown that the design of LED based visible notification appliances is feasible.
References
[1] K. Savage, “Flash Pulse Width Effectiveness in Notification Appliances,” SUPDET 2011 Conference, Quincy, MA: Fire Protection Research Foundation.
[2] K. Savage, “Human Factors Comparison of Detectability For LED and Xenon Tube Light Sources for Fire Alarm Notification Strobes Follow On Testing to Determine Xenon Equivalency,” TYCO Fire Protection Products, 2012.
[3] J. D. Bullough, Y. Zhu, “Performance Objectives for Light Sources Used in
Emergency Notification Appliances,” Lighting Research Center, Rensselaer Polytechnic Institute, May 2013.
[4] John D. Bullough, Nicholas P. Skinner, Yiting Zhu, “Parameters for Indirect
Viewing of Visual Signals Used in Emergency Notification,” Lighting Research Center, Rensselaer Polytechnic Institute, September 2013.
[5] “Pulsed Over‑Current Driving of Cree XLamp LEDs: Information and Cautions,” Cree application note, CLD-AP60 REV 1A, 2014.
[6] Andreas Stich, Rainer Huber, “Thermal Consideration of Flash LEDs,” Osram Opto Semiconductors application note, December 2014.
[7] UL 1971, Standard for Signaling Devices for the Hearing Impaired, Underwriters Laboratories.