Embed Size (px)
Citation preview

Design aspects
of drinking water
treatment plants
Handout - Introduction to Drinking Water Treatment
0
10
20
30
40
50
60
70
% not connected number per 100,000 inhabitants
1900 1920 1940 1960 1980
year
percentage not connected and number of deceased due to typhoid

1
Contents
1. The technical setup of drinking water supply
2. Drinking water resources
3. Production
3.1 Groundwater
3.2 Surface water
3.2.1 Surface water using direct treatment
3.2.2 Surface water using soil aquifer recharge
4. Transport and Distribution
4.1 Transport
4.2 Storage
4.3 Distribution network
4.4 Drinking water installations
5. Planning process for public water supply
5.1 Identifi cation
5.2 Defi nition
5.3 Design
5.4 Contract
5.5 Construction, start-up and operation
5.6 Laws, permits and standards
6. Costs
6.1 Investment costs
Defi nition
Investment costs and capacity
6.2 Operational (exploitation) costs
Defi nition
Structure
7. The practice of designing (Heel example)
7.1 Preliminary studies
7.2 Block diagram, site layout plan and sketch design
7.3 Preliminary design
7.4 Final design and detailed design
7.5 Construction and start-up
This handout is based on Drinking Water, Principles and Practices by de Moel et al.

2
1. The technical setup of drinking water supply
The public water supply played an important role
in the development of our modern society. The
supply of good and reliable (i.e., safe) drinking
water, since about 1850, has caused public health
in Western Europe and North America to drasti-
cally improve. The public drinking water supply
is important for economic development as well.
Because of the supply of good and inexpensive
water, any economic development is less tied to
the direct surroundings. Therefore industries and
companies can fl ourish more easily.
The public drinking water supply typically has a
technical setup, as shown in Figure 1.
Production consists of the abstraction of raw water
(either groundwater from the soil or surface water
from rivers, canals and lakes) followed by treat-
ment, in order to obtain drinking water quality.
When production is located remote from the sup-
ply area, the water is fi rst transported via pumps
and pipes.
To reduce the daily variation in the water demand,
distribution reservoirs are used. From these reser-
voirs, the drinking water is pressurized for distribu-
tion to the supply area using distribution pumps.
In the supply area, there is a distribution network
available (a system of larger and smaller pipes),
transporting water to customers. In some cases,
water towers are used in the distribution networks
in order to lessen pressure fl uctuations.
A customer typically has a home connection to the
distribution network (including a water meter), that
distributes drinking water to the different taps in
and around the house (bath, toilet, kitchen, wash-
ing machine, garden, etc.).
The quality of drinking water should comply with
legal standards. In the Netherlands, the drinking
water supply is regulated by the Water Supply Act
and the specifi c quality standards are elaborated
in the Decree on the Water Supply.
The Dutch legislation is stricter than the general
European one. Internationally, there is much ref-
erence to the directives from the World Health
Organization (WHO).
The technical installations and the operation of a
drinking water production plant are primarily deter-
mined by the microbiological parameters. This is
because the concentration of bacteria in source
waters might be between 10,000 to 1,000,000,000
times higher than the maximum acceptable value
in drinking water. Therefore, even a small con-
Figure 1 - Setup of the drinking water supply system
production distribution
abstraction treatment storage transport storage distribution network

3
tamination or a small disturbance in the production
process may cause the standards to be exceeded.
Also, bacteria populations may develop during long
retention times in installations or pipes.
2. Drinking water resources
Most of the water on earth (97%) is salty whereas
only 3% is fresh water, from which more than two
thirds is frozen. The unfrozen fraction is predomi-
nantly underground water leaving a small fraction
to surface water (see Figure 2).
For the production of drinking water, almost exclu-
sive use is made of water containing only a limited
amount of dissolved compounds (fresh water).
This choice is made in view of the high costs of
removing salts from water.
Desalination of brackish water or sea water is
only used in drinking water production when fresh
water is scarce, like in arid areas (Saudi Arabia,
Libya) and on tourist islands (like Malta, Aruba or
Bermuda).
Thus, the main sources for production of drinking
water are fresh groundwater and surface water.
3. Production
3.1 Groundwater
Groundwater can be abstracted in substantial
amounts if an extensive, porous aquifer is available
and if recharge from the surface or the surround-
ings is possible.
For drinking water production it is important that
the aquifer is more or less isolated from the upper
soil (confi ned aquifer) to avoid contamination.
In order to further prevent contamination, the
abstraction area is marked as such, according to
strict regulations regarding land use and the use
of dangerous compounds (oil, pesticides, etc.).
In areas where the aquifer has an open connec-
tion to the upper soil, the water abstraction area is
chosen considerably more carefully. In general a
minimum retention time of 50 years in the under-
ground is used to determine the size of the water
abstraction area..
Groundwater abstraction infl uences the water
level in the soil. This may cause desiccation of
the surrounding area, resulting in agricultural and
environmental damage. Therefore, permits are
required for groundwater abstraction, in which the
maximum amounts to be abstracted are regulated
(yearly, monthly and daily maxima).
Due to the long underground retention time,
groundwater is usually microbiologically stable and
of an almost consistent good quality.
These properties mean that often, only limited and
relatively simple treatment is necessary.
The chemical composition of the water, however,
strongly depends on the local circumstances,
which may cause wide differences.
The most important factor determining the quality
of groundwater is related to the oxygen content
of the water or to the degree of oxygen shortage
(aerobic/ anoxic/ anaerobic)
Figure 2- Fractions of water on earth

4
The oxygen content actually determines the
amount to which a few undesirable compounds
can dissolve from the soil (iron, manganese,
ammonium, methane, hydrogen sulfi de).
Generally, the oxygen content can be easily pre-
dicted based on the origin of the groundwater
(Figure 3). Though rainwater contains oxygen in
all cases, this oxygen can be consumed by the
decay of organic compounds in the soil. . Besides,
a longer retention time in the ground yields a lower
oxygen concentration (water under a clay layer).
Aerobic groundwater is mostly abstracted from the
phreatic sand layer. It contains oxygen and typi-
cally needs only very little treatment.
Anoxic groundwater is typically located under a
continuous clay layer in the underground. Due
to this layer, no oxygen is present in the water,
but ammonium, iron and manganese are. These
compounds are undesirable in the water and they
need to be removed. However, the concentrations
of these compounds are rather low.
Anaerobic groundwater is typically located below
a peat layer. This water is characterized by the
absence of oxygen and nitrate and by the pres-
ence of ammonium, iron, manganese, methane
and hydrogen sulfi de.
A second important factor in determining the qual-
ity of groundwater is its pH value.
Rainwater always contains a small amount of car-
bon dioxide (CO2), though at larger concentrations,
in industrial countries.
Because of the oxidation of organic matter (forma-
tion of CO2), the CO
2 concentration in the ground-
water may dramatically rise. In acid environments
undesirable metals like nickel and aluminium may
also dissolve from the soil matrix.
Carbon dioxide may react with limestone in the
ground, causing the pH value to increase, but also
causing a considerable increase in the hardness
and bicarbonate concentration of the water.
A third factor determining the quality of the ground-
water is related to land use. Due to fertilizing in
agriculture, the amount of nitrates in groundwater
can signifi cantly increase (Figure 4) and, in addi-
tion, pesticides may enter the groundwater.
Finally, industrial contamination of the soil infl u-
ences the quality of the groundwater.
Because of the variety of differences in water qual-
ity prior to treatment, there is no uniform treatment
setup for groundwater. In the Netherlands, almost
exclusively well-protected anoxic groundwater is
abstracted, requiring aeration and rapid fi ltration in
any treatment process (Figures 5 and 6). Aeration
brings oxygen in the water and removes the dis-
solved gases, like carbon dioxide. After this, iron,
manganese and ammonium oxidize, causing these
compounds to be removed in the subsequent fi lter.
To reduce the amount of abstracted water, the
water companies also treat and reuse the back-
wash water from their rapid fi lters.
.
Being abstracted directly adjacent to surface water,
riverbank groundwater is a mixture of aerobic “sur-
face water” infi ltrated into the soil, via the riverbank
, with natural anoxic or anaerobic groundwater.
Figure 3- Consumption of oxygen in the soil has an in-
fl uence on the composition of groundwater
peat layer
light anaerobic groundwater
clay layer
deep anaerobic groundwater
aerobic freatic groundwater
5
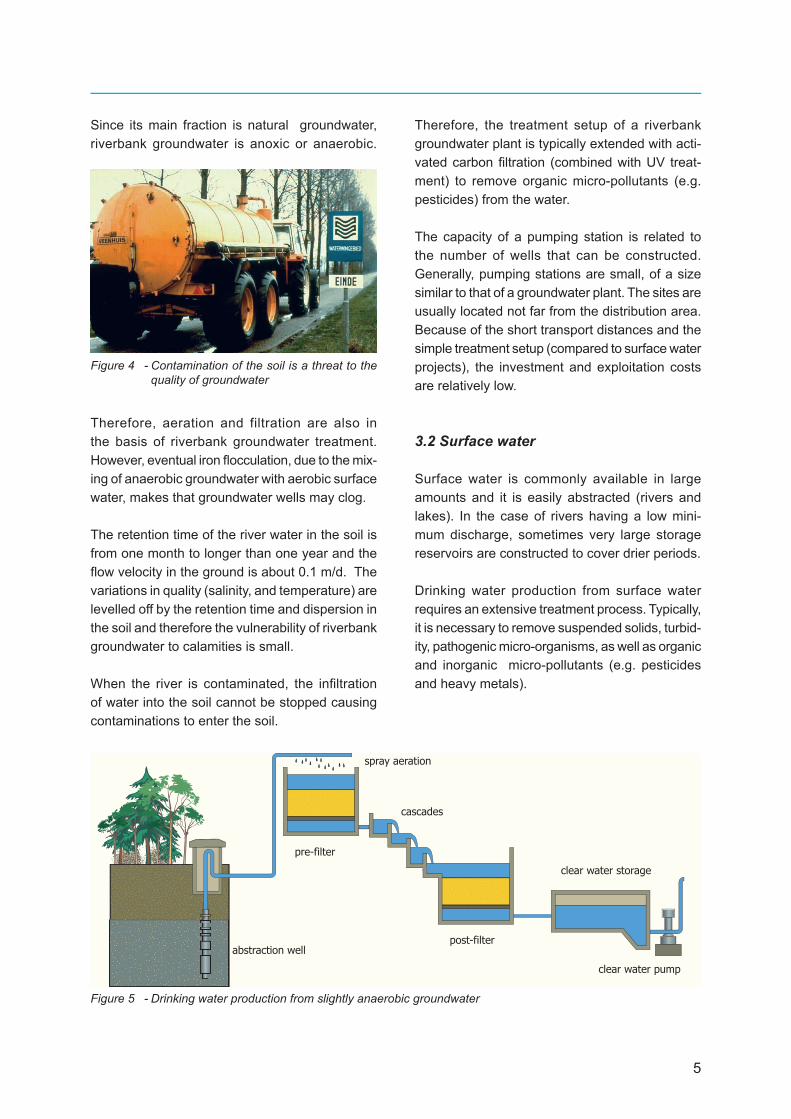
Since its main fraction is natural groundwater,
riverbank groundwater is anoxic or anaerobic.
Therefore, aeration and filtration are also in
the basis of riverbank groundwater treatment.
However, eventual iron fl occulation, due to the mix-
ing of anaerobic groundwater with aerobic surface
water, makes that groundwater wells may clog.
The retention time of the river water in the soil is
from one month to longer than one year and the
fl ow velocity in the ground is about 0.1 m/d. The
variations in quality (salinity, and temperature) are
levelled off by the retention time and dispersion in
the soil and therefore the vulnerability of riverbank
groundwater to calamities is small.
When the river is contaminated, the infi ltration
of water into the soil cannot be stopped causing
contaminations to enter the soil.
Therefore, the treatment setup of a riverbank
groundwater plant is typically extended with acti-
vated carbon fi ltration (combined with UV treat-
ment) to remove organic micro-pollutants (e.g.
pesticides) from the water.
The capacity of a pumping station is related to
the number of wells that can be constructed.
Generally, pumping stations are small, of a size
similar to that of a groundwater plant. The sites are
usually located not far from the distribution area.
Because of the short transport distances and the
simple treatment setup (compared to surface water
projects), the investment and exploitation costs
are relatively low.
3.2 Surface water
Surface water is commonly available in large
amounts and it is easily abstracted (rivers and
lakes). In the case of rivers having a low mini-
mum discharge, sometimes very large storage
reservoirs are constructed to cover drier periods.
Drinking water production from surface water
requires an extensive treatment process. Typically,
it is necessary to remove suspended solids, turbid-
ity, pathogenic micro-organisms, as well as organic
and inorganic micro-pollutants (e.g. pesticides
and heavy metals).
Figure 4 - Contamination of the soil is a threat to the
quality of groundwater
Figure 5 - Drinking water production from slightly anaerobic groundwater
clear water pump
pre-filter
post-filter
clear water storage
cascades
abstraction well
spray aeration

6
There are two systems for the production of drink-
ing water from surface water:
- storage in reservoirs followed by an extensive
treatment process (direct treatment)
- pre-treatment, soil aquifer recharge and
abstraction followed by a limited post-treatment
(surface water using soil aquifer recharge)
Figures 7 and 8 show the production sites of
drinking water and the origin of drinking water,
respectively.
3.2.1 Surface water using direct treatment
When abstracting river water for direct treatment to
drinking water, signifi cant variations of water dis-
charge and quality should be considered. Besides,
surface water is rather vulnerable to pollution.
For these reasons a storage reservoir is required
before the treatment process itself.
The surface water that is used as a source for
drinking water production is usually located at a
large distance from the distribution area., requiring
long transport distances (see Figure 9).
In order to prevent sedimentation and biologi-
cal growth in the transport pipes, either the total
treatment process is situated at the inlet site or
a pre-treatment plant is constructed there. The
main treatment plant is then constructed near the
distribution area.
Reservoirs
In the Netherlands, the surface water used for
drinking water production is mainly abstracted from
the Rhine and Meuse rivers. Due to the large fl uc-
tuations of quality and quantity., water abstraction
from the river is not always possible. In order to
be able to supply drinking water, a storage reser-
voir should be available to cover periods of intake
interruptions (Figure 10).
In most cases, the results of a contamination are
only known a week after doing analysis. Therefore,
there is usually an analysis reservoir or compart-
ment situated before the storage reservoir..
Moreover, these reservoirs are also large to allow
for a long retention time. The fl ow velocity in a
reservoir is much slower than the fl ow velocity in
a river, causing the settlement of suspended sol-
ids. A dampening of concentration peaks is also
Figure 6 - Modern design of Welschap pumping station (Noord-Brabant) where anaerobic groundwater is treated to
produce drinking water

7
achieved. However, because of the mere size of
the reservoirs, the processes in them are not fully
controllable. Weather and wind have a substantial
infl uence on the processes.
Because of the long retention time in the reser-
voirs, some suspended particles settle and are
removed from the water. However, colloidal parti-
cles will not settle, because of their size and their
stability.
To remove these particles, coagulation-fl occulation
is necessary. Coagulation is the process of add-
ing positively charged salts to the water (iron or
aluminum salts, Figure 11), to reduce the negative
charges of the colloidal particles and destabilize
them. Flocculation is the subsequent process
where neutralized particles collide to form larger
fl ocs..
After the flocs have formed, they need to be
removed. This can be done in two ways (see
Figure 12). The fi rst method is to let the fl ocs, which
have a density slightly higher than that of water,
settle to the bottom (sedimentation). The second
method is to let them collide with small air bubbles,
causing the density of the fl ocs decrease below
that of water, thus making them fl oat (fl otation).
The removed fl ocs also contain heavy metals,
organic matter, and viruses.
Not all fl ocs are removed during sedimentation or
fl otation. Small fl ocs may remain in the water and
may be removed using rapid sand fi ltration.
Figure 9 - Direct production of drinking water from
surface water in the Netherlands
Groningen
Andijk
Berenplaat
Braakman
Weesperkaspel
Loenen
Brabantse BiesboschZevenbergen
Kralingen
Baanhoek
intake
treatment
intake and treatment
transport
Figure 8 - Origin of drinking water in the Netherlands
surface water
groundwater
mixed
Figure 7 - Sites for the production of drinking water in
the Netherlands
groundwater
surface water

8
In 1987 small amounts of the pesticide Bentazon
were found in the drinking water of Amsterdam, the
Netherlands. This pesticide was probably present
in the water for a long time, but because analyti-
cal capabilities to detect these micro-pollutants
were not yet well-developed, this contamination
could not be proven before then. The detection
of Bentazon in the drinking water initiated more
extensive monitoring campaigns towards the
presence of other micro-pollutants present in the
surface water.
Organic micro-pollutants (e.g pesticides) can be
removed from the water using activated carbon
fi ltration, which is somewhat similar to rapid fi ltra-
tion, but uses activated carbon grains instead of
sand. Activated carbon is able to adsorb organic
micro-pollutants. until it becomes saturated. At
that moment the activated carbon needs to be
regenerated.
Activated carbon fi ltration is typically used after
rapid fi ltration, where any remaining fl ocs will be
retained. The activated carbon fi lter is therefore
not loaded with suspended material, so it rarely
needs to be backwashed.
Surface water also contains many pathogenic
micro-organisms. These micro-organisms enter
the water through sewage - mostly treated - and
the drainage of pavements.
Disinfection, i.e, the removal or deactivation of
pathogenic micro-organisms, is partially obtained
by fl oc removal and rapid fi ltration, but this removal
is not suffi cient, which requires an additional treat-
ment step.
In the past, chlorine was applied for this purpose
but due to its harmful side effects, it is not used in
the Netherlands anymore.
Other methods of disinfection include the use of
ozonation and Ultra Violet light (UV). Ozonation
applies the strong oxidizer ozone to kill pathogenic
micro-organisms. However, the use of ozone is
also hindered by some harmful side effects.
Figure 10 - The three Biesbosch reservoirs for the drinking water supply in the southwestern part of the Netherlands

9
UV disinfection treats the water with UV radiation
inactivating pathogenic microorganisms.
3.2.2 Surface water using soil aquifer recharge
An example of surface water using soil aquifer is
found on the Dutch dune areas
The many small lakes (Figure 13) found in those
areas, are often recharge facilities that have been
used for quite a long time to produce drinking
water.
Originally, the dunes were only fed by rainwater
and dune water was only used by the local popu-
lation. After 1853, the dune water supply was
extended to Amsterdam as well. The amount of
abstracted water increased further and further.
As a consequence, some wells yielded salt water
during the 1950s.
Since that time, surface water is pre-treated before
being infi ltrated into the dunes, in order to push
back the salt water and to maintain a fresh water
barrier.
The pre-treatment prevents the clogging of the
pipes and contamination of the infi ltration area.
The infi ltrated water comes from the major rivers
and lakes, in most cases, and needs to comply
with the requirements of the Infi ltration Regulation.
Therefore, the pre-treatment of recharge water can
be extensive (Figure 14).
After the water has been re-abstracted, it is post-
treated, because it has become anoxic during
the soil passage and therefore contains iron,
manganese and ammonium. The post-treatment
is thus similar to the set-up of the treatment of
groundwater.
The infi ltration areas act as a storage system to
cover periods in which the surface water is con-
taminated and to reduce quality fl uctuations.
After the post-treatment, the water is transported to
a reservoir near the distribution area, from where
it is distributed.
Table 1 shows the total amounts of drinking water
produced from surface water through soil aquifer
recharge in The Netherlands.
4. Transport and Distribution
4.1 Transport
In the setup, shown in Figure 1, there is a large
distance between the production plant and the
supply area, which is bridged by a transport sys-
Figure 12 - Flocculation, with fl oc removal via fl otation
or sedimentation
Figure 11 - The production of drinking water from surface water with direct treatment
activated carbon filters
post-disinfection
pumppump
double-layered filters
floc aid
ferric salt
precipitation
flocculation
basin
ozone ferric saltcaustic soda
10
tem. Transport systems consist of both pipes and
pumping stations, where the necessary pressure
is provided (Figure 15).
The Dutch water companies have a total of about
500 kilometers of transport pipes which have diam-
eters between 400 and 1,000 mm.
A transport system is designed based on the maxi-
mum daily use (measured once every ten years)
of the supply area. The pressure in the transport
system is determined by the height of the water
level in the storage reservoir and by the hydraulic
resistance.
4.2 Storage
The setup in Figure 1 shows that storage takes
place in (drinking water) reservoirs. These res-
ervoirs are often called “clear water tanks”. They
achieve a dampening of the daily use fl uctuations,
so that production and transport can continue on a
more or less constant level. The required capac-
ity of clear water reservoirs is roughly 25% of the
daily use (or the daily production), or the produc-
tion of 6 hours.
At the Dutch production sites, storage of 1,500 to
10,000 m3 of drinking water is available. Because
of supply uncertainty in the case of maintenance or
defects, this storage capacity is subdivided across
several distinct reservoirs or compartments. Clear
water reservoirs are, of course, closed to maintain
the quality of the drinking water. For the “respira-
tion” of these reservoirs - when the water level
changes, air will fl ow in or out - special air fi lters
are employed.
In Figure 16 the clear water reservoirs and their
relatively large size at the Berenplaat production
plant of the Rotterdam water supply are clearly
discernible.
Water towers generally contain between 250 and
1,000 m3. These towers barely play any role in
the dampening of fl uctuations in use. They mainly
dampen the pressure, for short periods and in case
of a severely fl uctuating demand. In former days
water towers were used as water hammer vessels
for the distribution pumps. When the water level
in the tower fell, an extra distribution pump was
switched on. In this way, water towers could main-
tain a relatively constant pressure and could also
guarantee some minutes of delivery even after a
power failure at the distribution pumps.
4.3 Distribution network
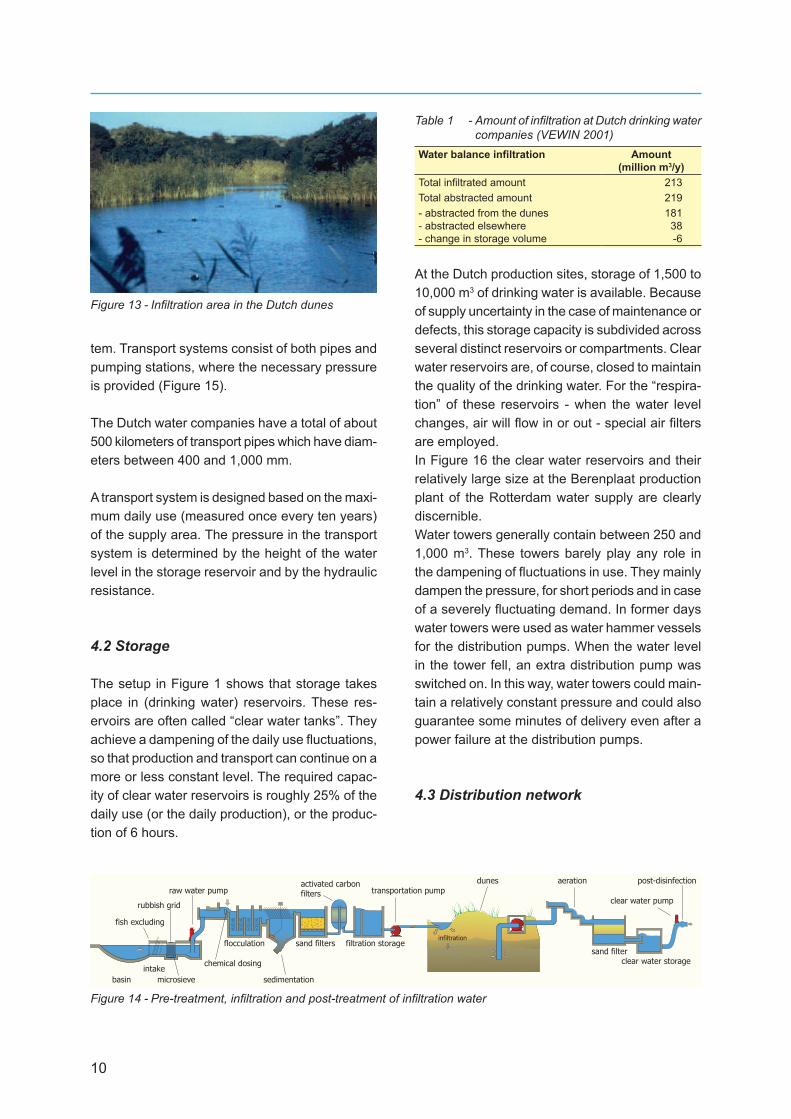
Figure 13 - Infi ltration area in the Dutch dunes
Figure 14 - Pre-treatment, infi ltration and post-treatment of infi ltration water
activated carbonfilters
filtration storage
transportation pump
sand filters
fish excluding
rubbish grid
raw water pump
microsieve
chemical dosing
sedimentation
flocculation
intake
basin
dunes
clear water storage
clear water pump
post-disinfection
sand filter
aeration
infiltration
Table 1 - Amount of infi ltration at Dutch drinking water
companies (VEWIN 2001)
Water balance infi ltration Amount
(million m3/y)
Total infi ltrated amount 213
Total abstracted amount 219
- abstracted from the dunes
- abstracted elsewhere
- change in storage volume
181
38
-6

11
From the storage reservoirs, the drinking water is
pumped into the distribution network using high
pressure pumps. Figure 17 shows an overview
of a distribution network for a water company in a
rural area. From the production site (pumping sta-
tion), there are pipes going to the different villages
and hamlets, where there is a water pipe in every
street with houses.
In the Netherlands, there are over 100,000 km
of water pipes with an external diameter over 50
mm, which amounts to about 7 m per inhabitant.
The smaller branches and home connections are
not included in this pipe length. Those additions
will make the total pipe length per person about
10 - 13 m. In the distribution network, pipes may
have a diameter up to 1,800 mm (Rotterdam), but
the majority of them have a diameter between 75
and 150 mm.
The design criterion for a distribution network
is to maintain a supply pressure of 20 m above
ground level (200 kPa) in the farthest branches
of the network (at the home water meters). In
order to achieve this, a minimum pressure of 25
m above ground level (250 kPa) in the streets is
usually targeted. In rural areas with remotely situ-
ated clients, this might imply that during maximum
demand there should be a pressure of 60 m above
ground level at the production site. During the
night, though, a pressure of slightly over 25 m will
suffi ce, because during very low use the hydraulic
resistance of the network will be very small. Near
the production site, therefore, there would be large
pressure differences.
Actually, the differences will not be that great in
practice, because there seldom is a “maximum
day” and because the difference between the
normal demand and the maximum demand is
relatively high (Figure 18).
To keep the pressure in the distribution network
within certain boundaries, in some cases, boost-
ers are used. These are pumps which have been
constructed in the pipe to bring the water to a
higher pressure.
In an area of variable topography, the distribu-
tion network is subdivided into different pressure
zones. This prevents a high distribution pressure
in the lower areas. When water is produced in the
Figure 16- The round and square clear water reservoirs at the Berenplaat production site (Zuid-Holland)
Figure 15 - Pumps used for the transportation of drinking
water

12
lower regions, pumping energy is also saved by
this practice.
In apartment buildings it will be impossible to have
suffi cient pressure on the upper fl oors. Therefore,
those dwellings are equipped with booster installa-
tions which consist of pumps and a pressure tank.
The pressure tanks function as a water hammer
vessel and for pressure smoothing.
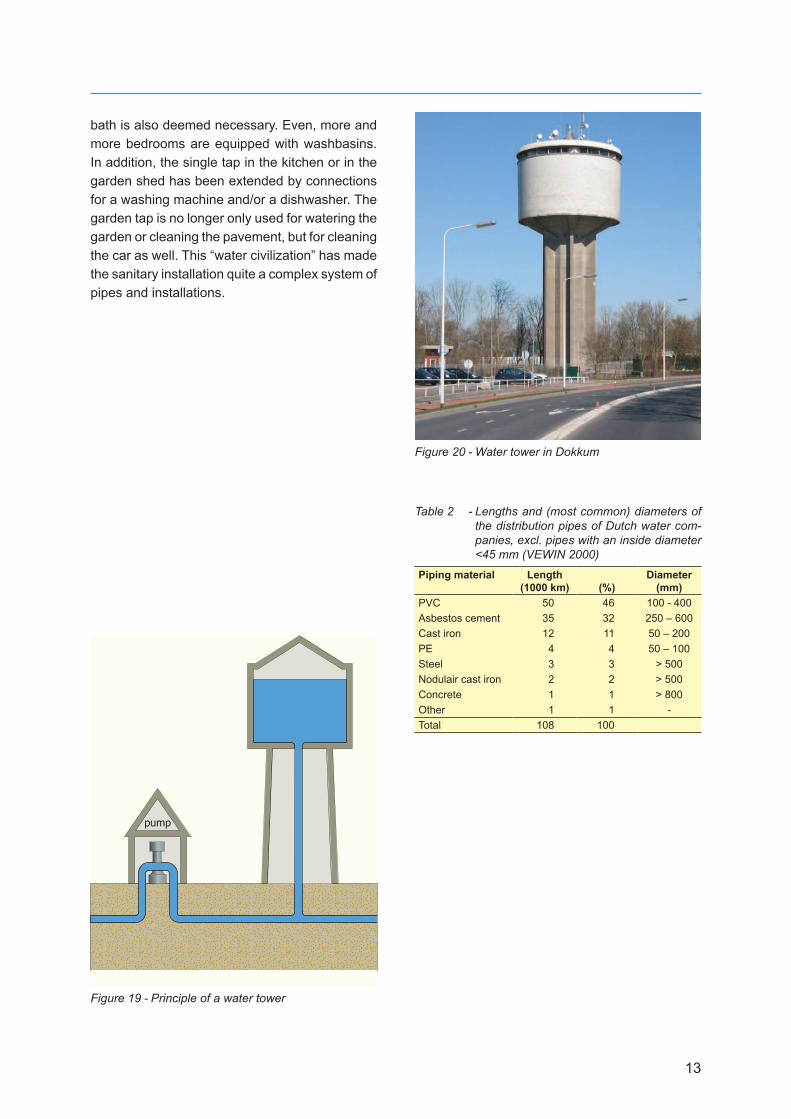
The underground distribution of drinking water
is virtually invisible. And, above ground, only the
water towers can be seen (Figures 19 and 20).
Today, water towers are no longer neces-
sary. Speed-controlled pumps can deliver any
desired amount of water on a continuous scale.
Emergency power aggregates can provide power
within 30 seconds and water hammer vessels at
the distribution pumps have a suffi cient capacity
to cover this period.
Every dwelling is connected to the street water
pipe through a home connection, which is also
called a service pipe. The home connection ends
at the water meter, after which the client is the
owner of that water.
In the Netherlands there are about 6 million tech-
nical connections to the drinking water network,
of which 5.7 million are for small users. Ninety-six
percent of all connections have a meter.
Table 2 indicates the lengths of the pipes of the
Dutch water companies, per pipe material (service
pipes excluded). The total length of over 100,000
km increases some 2.5% per year, mainly because
of the development of new residential areas (new
3%; 0.5% removed). The low removal percentage
suggests a pipe lifetime of 200 years. The techni-
cal and economic lifetime of pipes is shorter, which
suggests that more pipes will need to be changed
in the future.
Formerly, cast iron was used for pipes of smaller
diameters. Nowadays, those pipes are mostly
made of plastics (PVC, PE). Because of the sus-
tainability and costs, asbestos cement, was often
used for the middle-sized pipes. Due to the health
risks of working with asbestos cement, its use is
no longer permitted. The consequences of this
for existing pipes are currently being discussed.
4.4 Drinking water installations
Before the last world war, the sanitary equipment
for social housing was limited to a kitchen tap
and a fl ushing toilet. Nowadays, a shower or a
Figure 17 - A distribution network in a rural area
pumping station
teuge
twello
stenenkamer
voorst
klarenbeek
wilp
Figure 18 - Model for water consumption on an average
day and on an extreme day
0
50
100
150
200
250
300
0 6 12 18 24
time (h)
consu
mption (
m3/h
)
consumption on maximum day
consumption on average day
13
bath is also deemed necessary. Even, more and
more bedrooms are equipped with washbasins.
In addition, the single tap in the kitchen or in the
garden shed has been extended by connections
for a washing machine and/or a dishwasher. The
garden tap is no longer only used for watering the
garden or cleaning the pavement, but for cleaning
the car as well. This “water civilization” has made
the sanitary installation quite a complex system of
pipes and installations.
Figure 19 - Principle of a water tower
pump
Figure 20 - Water tower in Dokkum
Table 2 - Lengths and (most common) diameters of
the distribution pipes of Dutch water com-
panies, excl. pipes with an inside diameter
<45 mm (VEWIN 2000)
Piping material Length
(1000 km) (%)
Diameter
(mm)
PVC 50 46 100 - 400
Asbestos cement 35 32 250 – 600
Cast iron 12 11 50 – 200
PE 4 4 50 – 100
Steel 3 3 > 500
Nodulair cast iron 2 2 > 500
Concrete 1 1 > 800
Other 1 1 -
Total 108 100

14
5. Planning and design process for public water supply
Extensive preparations are necessary in order to
build drinking water production plants. The govern-
ment plays an important role in the planning pro-
cess, as public health is one of the main concerns.
However, water companies are responsible for the
construction and operation of the infrastructure.
Usually, it takes many years from the time the
fi rst idea for expanding water production facilities
comes up, until the completion and start-up of
the new plant. During this period, a highly diverse
development process is carried out, involving
many different specialties, such as environmental
science, hydrology, hydraulics, structural engineer-
ing, electrical engineering, architecture, law, and
economics.
The expansion of the infrastructure for drinking
water production requires therefore a multi-dis-
ciplinary approach. A successful project requires
a lot of organization. Besides, it is necessary to
consider that the existing water supply must not
be compromised during construction works.
The planning process for a public water supply
is embedded in the general spatial planning pro-
cess. The primary structure of and the hierarchy
in this process in the Netherlands are summarized
in Table 3. The planning process needs to com-
ply with the legal framework, in which the Water
Supply Act is especially important.
5.1 Identifi cation
A construction project for public water supply
can be initiated by different motivations. First of
all, it is necessary to analyse which problem or
problems must be solved with the project. Typical
problems are:
- insuffi cient capacity due to growing demand
- decrease of production capacity due to a dif-
ferent source policy (i.e., reduction in groundwater
abstraction)
- economic considerations: scaling up of plants
- technical obsolescence of current installations
- new requirements regarding the treatment pro-
cess (more stringent quality levels or changes in
raw water quality)
.Within the water supply plan of the company and
the multi-year investment plan, possible solutions
are drawn up and provisional decisions are made.
This is based on feasibility studies which compare
several alternatives. Technological research leads
to a general direction for the desired treatment
process. Prior to the construction process, the
following questions need to be answered:
- what, where, and what capacity needs to be
constructed?
- when should it be completed?
- what needs to be achieved?
- what are the estimated costs?
These questions are answered in several prelimi-
nary studies, like:
- feasibility studies (technological, technical,
fi nancial, economic, environmental impact)
- location studies (possibility of land acquisition)
- literature studies
- project comparisons by site visits
Table 3 - Hierarchical planning process for the public drinking water supply in the Netherlands
Planning level Name Timeframe (years) Organization
National policy plan Policy plan for drinking and industrial water supply 20 – 30 Ministry VROM
National section plan Ten-year plan 5 – 10 VEWIN
Provincial plan Provincial policy plans
Provincial management plans
5 – 10
5 – 10
Province
Province
Regional plan Regional plans 5 – 10 Province
Municipal plan Land use plans 5 – 10 Municipality
Company plan Water supply plan
Multi-year investment plan
Business plan
10 – 30
5 – 10
5
Company
Company
Company

15
- specialist research (hydraulics, (soil) mechan-
ics, ergonomics, material science, control engi-
neering, physics, chemistry, environmental
science, social aspects, etc.)
- system design studies (comparison of different
treatment methods)
During these preliminary studies, the following data
should be collected:
- existing plants (raw water source, process fl ow
diagram, hydraulic scheme, drawings, operating
experiences)
- surrounding area (drawings, descriptions,
measurements, photographs) concerning founda-
tions, soil conditions, groundwater levels, wires,
pipes, roads, working areas, property rights, obli-
gations, utility company connections, etc.
- necessary permits (provincial, municipal, water
boards, spatial planning legislation, utility compa-
nies, public services, etc.)
The fi nal part of the identifi cation phase is the deci-
sion to start a new construction project.
5.2 Defi nition
To be able to begin a construction project, the fol-
lowing documents need to be drawn up::
- requirements program
- sketch design
- building scheme
Requirements program
The term “requirements program” is broadly used
and has many different meanings, varying from a
precise contract document to a general wish list.
It is also applied to the collection of documents in
the construction phase.
A requirements program is, preferably, limited to
the purpose and outlines of the construction pro-
ject, including:
- motivation for the project
- summary of preliminary studies
- purpose of the project
- wishes and side purposes
- future developments after construction
Based on the requirements program, a sketch
design can be formulated.
Sketch design
In the sketch design, general options are consid-
ered, and the chosen one is sketched in terms of
its technical and spatial outline. A sketch design
can consist of the collection of relevant preliminary
studies and reviews, as well as a more detailed
items such as:
- treatment scheme (i.e., block diagram)
- rough hydraulic line scheme
- rough terrain arrangement
- phasing of construction
- cost estimation
A sketch design gives a good indication of the
dimensions of the construction project. It includes,
not only the construction phases but also the plan
and terrain arrangements for future expansions
. This design is important to inform all parties
involved in the project’s next phases.
The building scheme can be formulated on the
basis of the sketch design.
Building scheme
The building scheme is the general project plan,
covering all aspects of the construction phase. It
contains the full project defi nition and consists of:
- requirements program
- sketch design
- time schedule for design, contracting and con-
struction
- design of the project organization (task setting
between different parties involved in future studies
and construction)
- estimation of investment costs (total project
costs)
The building scheme is also important for inter-
nal decision making of the water company itself,
including considerations such as the project man-
date for organizational, technical, contractual and
fi nancial aspects.
5.3 Design
Designing a drinking water production plant is a
creative process, infl uenced by several factors,
of different importance and typically subject to
personal preferences. These differences make

16
people to conceive different results. Thus, the
design needs to be negotiated. The fi nal design is
a compromise between the parties involved (e.g.,
managers, economists, ecologists, PR-offi cers,
designers, builders, etc.).
During the design process, it is important that the
motivation for selecting the chosen solution is clear
to third parties as well. The large number of parties
involved necessitates an open planning so they
have insight into the progress of the design and
the effects on their own roles. A phased procedure,
including a characteristic coarse-to-fi ne approach
is necessary.
At the end of every design phase, a complete
image of the construction should be presented.
This will make clear not only the progress in that
phase, but also the way in which the design might
have been modifi ed from prior phases. Often,
besides the sketch design phase, three other
design phases can be discerned:
- preliminary design
- fi nal design
- detailed design
Changing the design
The coarse-to-fi ne approach is applied due to the
need for design changeability. From identifi cation
to start-up, the project proceeds within smaller and
smaller boundaries. This is expressed in:
- more precise estimations of costs
- more expensive design changes
- less freedom to change plans
In Table 4 some characteristic phases in the
construction process have been quantifi ed. The
given values are indicative for a drinking water
production plant.
Design documents
During the design process, a number of documents
are prepared. It is desirable that these documents
remain up to date, so they represent reliable
images of the completed construction during later
phases (not only during construction, but during
actual operation as well). Figure 21 shows a dia-
gram of the information fl ow during the construc-
tion’s life cycle. Most of the information related to
the various stages of the design is recorded in the
design documents.
Preliminary design
The preliminary design is intended to give a rough
layout of the plant’s elements, including their loca-
tion, size of buildings and a description of any large
mechanical or electronic devices needed by the
plant during operation.
Also during this phase, the different construction
forms for the desired process will be considered,
possibly including a detailed preliminary design
of the different options. A consideration of costs,
operation, fl exibility, robustness, etc. makes these
details necessary.
Activities for the preliminary design include:
- processing of responses to the sketch design
- discussing the design with other stakeholders,
like government agencies, suppliers, third parties
Table 4 - Sketch of the construction process, upon
completion of the different phases
Phase Accuracy
of costs
Changeability
of design
Change
in costs
Identifi cation ± 50% - -
Sketch design ± 30% 100% 1%
Preliminary design ± 25% 40% 5%
Final design ± 15% 10% 10%
Detailed design ± 5% 2% 25%
Building ± 1% - 100%
Figure 21 - Design documents provide information for
the building and operation phases
life cyclebuilding
information flowinitiative stage
information flowdesign stage
information flowbuilding stage
information flowoperation stage

17
- formulating process descriptions
- formulating the necessary technical design
drawings for the different operating conditions
(minimal, maximal and normal capacity) among
which are:
- process fl ow diagram (PFD) (including rough
balance sheets of water, energy and chemicals)
- hydraulic line scheme
- rough design of buildings (necessary space,
building height)
- calculating rough dimensions of buildings and
determining their sizes
- formulating construction drawings (fl oor plans,
sections, views)
- specifying main components of (civil) structure
(foundation, materials, architecture, spatial coding)
- specifying main components of mechanical
installations (capacity, number, type, material)
- specifying main components of electrical instal-
lations, instruments and control systems
- formulating rough estimates of:
- construction costs
- operation costs
- construction time
- handing out documents for approval of the
results of the preliminary design
Final design
The fi nal design follows directly from the prelimi-
nary design. This design is more detailed and con-
tains construction drawings and the calculations of
those parts which were considered “black boxes”
during earlier phases.
Activities for the fi nal design consist of the follow-
ing elements:
- processing responses to the preliminary design
- discussing the design with other stakeholders
like government agencies, suppliers, third partners
- calculating fi nal capacity and dimensions
- elaborating preliminary designs into fi nal con-
struction drawings
- formulating:
- process fl ow diagrams (PFD) for mainstream
and secondary fl ows (chemicals, energy, sludge
treatment, backwash water treatment)
- hydraulic line scheme
- piping and instrument diagrams (P&ID)
- control schemes based on an automatization
master plan
- deciding on necessary space for auxiliary facili-
ties
- preparing requisitions for technical details and
prices of necessary installations
- preparing requisitions for necessary permits
including completing necessary documents
- discussing fi nancial topics and contracts
- discussing the method of contracting
- estimating investment costs and completion
time
- handing out documents for approval of the fi nal
design
Detailed design
The detailed design focuses on the construction
part of the project. For the concrete structure, this
refers to reinforcement calculations, drawings and
fi nishing elements (façades, window frames, parti-
tion walls, roofi ng, etc.).
The mechanical part of the installation is elabo-
rated upon with respect to the pipes (support
constructions, division of pipeline parts, detailed
design of vessels and appurtenances).
The electrical installation deals with cable calcula-
tions and control board design, for example.
The control system is concerned with the design
of control and computer programs.
5.4 Contract
In almost every project, the actual building is done
by contractors and suppliers.
This makes it important, then, that the principal
be provided with the expected construction and
goods of the required quality, at the agreed upon
price, and at the pre-set time. Therefore, offers
need to be requested that can serve as future
contract documents, and later checked to deter-
mine whether the delivered item agrees with the
negotiations and what the consequences will be
for diverging from those plans.
Commonly, contracts are agreed upon with many
bidders. This is because most bidders only can
deliver within a very specifi c range or because
they cannot guarantee quality for the entire project.

18
Though a great variety of contracts exist, both in
type and in range, the following steps can always
be expected:
- formulating contract documents (specifi cations)
- requesting bids
- granting bids
Due to the large number and variety of contracts
and to the necessity of monitoring all forms of
progress, a separate department is charged with
contract writing.
Specifi cations
The specifi cations consist of a detailed descrip-
tion and drawings of the plant. The goal is to give
as accurate a picture as possible of the various
parts of the plant.
The specifi cations have the following functions:
- it is the chief source of information for describ-
ing the work to be conducted, so an accurate price
can be set
- it is one of the instruments for steering, control-
ling and supervising the building process
- it is part of the contract, together with a descrip-
tion of tasks, rights and obligations of both parties
5.5 Construction, start-up and opera-
tion
After the project has been assigned, construction
begins. Only seldom is a structure built on a loca-
tion where no disturbance of the present produc-
tion takes place (Figure 22).
Because of the hygienic nature of drinking water
supply, special measures to prevent contamina-
tion of the operation’s production process need
to be taken.
Figure 22 - The building area is 3-6 times larger than the building

19
It is always necessary to work clean during the
construction. A dirty building place will contaminate
new parts of the plant as well. At the start-up, such
contamination can be quite troublesome, making it
diffi cult to attain the required microbiological quality
of the drinking water being produced.
The main tasks for the water company during
construction are:
- direction of the construction process
- supervision of the construction process
- conduction of guarantee measurements and
takeover
At takeover, the water company begins the plant’s
operation. This includes the start-up of the produc-
tion process.
Only after it has been proved that the plant truly
produces reliable drinking water, can the water be
supplied to the distribution network.
During this introductory phase, the operators need
to become familiar with the installation.
After the start-up, the new plant will be included
in the normal operation of the water company.
During the production period it is not uncommon
to replace whole installation components, due to
technological obsolescence.
The main mechanical parts are seldom replaced.
Rather, a whole new plant will be constructed.
Estimating investment costs
A surface water treatment plant of 20 million m3/y (design capacity 3,200 m3/h) consists of several pro-
cesses, like those below.
Process part
Flocculation Residence time 20 min Volume 1,070 m3
Flotation Surface load 15 m / h Surface 215 m2
Filtration Surface load 7 m / h Surface 460 m2
Activated carbon fi ltration Empty bed contact time 15 min Volume of carbon 800 m3
Clear water storage Volume 20,000 m3
Clear water pumping station Capacity 5,760 m3 / h
Based on these process units, the investment costs (level of policy plan or sketch design) are estimated
using the cost functions for the process units. The table below gives the result of the cost estimation.
Cost element Costs
(million € )
Construction and equipment costs for process units:
- Flocculation 2.3
- Flotation 2.8
- Filtration 6.8
- Activated carbon fi ltration 6.7
- Clean water storage 3.7
- Clean water pumping station 7.3
Subtotal process units 29.6
Other (non-process related) investment costs (41% of subtotal process units) 12.1
- Land costs (2% of subtotal process units)
- Other construction costs (5% of subtotal process units)
- Additional costs:
- Preparation and supervision (20% of subtotal process units)
- Financing costs (10% of subtotal process units)
- Other additional costs (4% of subtotal process units)
Total investment costs 41.7

20
5.6. Laws, permits and standards
Laws and permits
Building a production plant for drinking water sup-
ply is bound to normal legal obligations. Many of
those regulations are carried out by permit proce-
dures. Those require the intended activity to be
specifi ed, including the way it will comply with the
relevant legislation. After the competent authority
has approved the application, the legal require-
ment will have been fulfi lled.
Typical permits for normal construction work are:
- tree cutting permit (making the area construc-
tion ready)
- building permit (for construction)
- environmental permit (for operation)
- draining permit (for discharge of drain water)
- abstraction permit for groundwater
Standards
Many permit procedures require the design to
comply with specifi c standards. These standards
make up a rather complex system of technical
directives and obligations.
Even when the permit does not necessitate it,
testing the design against the standards is desir-
able in almost any case. On the one hand, this is
because standards defi ne several quality levels
for the construction and, on the other hand, the
standards create a more uniform design process.
This improves the quality of the design and the
effi ciency of the design process.
Standards are important in regulating responsi-
bility for the design. They also play an important
role in fostering good communication between the
different parties involved in a construction project,
as standards defi ne the meaning of specifi c con-
cepts as well.
Estimating operational costs
A surface water treatment plant of 20 million m3/y (design capacity 3,200 m3/h) exists for several pro-
cesses, like in the previous example.
The operational parameters are given below.
Process unit
Flocculation Energy 24 Wh / m3 Dosing Fe 5 mg / l
Flotation Energy 50 Wh / m3 Suspended solids (sludge) 20 mg / l
Filtration Energy 12 Wh / m3 Suspended solids (sludge) 5 mg / l
Activated carbon fi ltration Energy 8 Wh / m3 Regeneration 15,000 BV
Clear water storage
Clear water pumping station Energy 200 Wh / m3
Based on this, operational costs (sketch design phase) can be estimated as given below.
Process unit Total
(€ / m3)
Fixed costs
(€ / m3)
Consumables
(€ / m3)
Maintenance
(€ / m3)
Specifi c
operational costs
(€ / m3)
Administrative
costs
(€ / m3)
Flocculation 0.047 0.017 0.017 0.002 0.006 0.005
Flotation 0.053 0.022 0.017 0.002 0.008 0.005
Filtration 0.088 0.046 0.004 0.006 0.018 0.009
Activated carbon fi ltration 0.116 0.051 0.030 0.005 0.018 0.010
Clear water storage 0.039 0.025 0.000 0.001 0.010 0.003
Clear water pumping station 0.108 0.058 0.012 0.007 0.020 0.010
Total 0.446 0.220 0.081 0.024 0.081 0.042

21
6. Costs
6.1. Investment costs
Defi nition
The investment costs represent the total costs
of developing a project or plant. These costs are
paid during the preparation and construction of
the project until the moment that the project (e.g.,
treatment plant) is taken into operation. From that
moment on, the installation generates revenues
and the costs afterwards are considered to be
operational costs. Usually this timing corresponds
to the date the completed construction is taken
over by the principal (water company).
Investment costs can also appear during the oper-
ation period of the asset. Examples include expan-
sion of the plant and replacement of major parts.
Table 5 shows the initial cost estimations for some
functions
Investment costs and capacity
To transfer the investment costs of a realized pro-
ject to a future project, the following questions are
important to consider:
- is the treatment scheme of the projects equal?
- is the capacity of the projects equal?
- is the complexity and/or “luxury level” of the
projects equal?
To compare production plants with different treat-
ment schemes, investment functions per treatment
process can be formulated. By adding the costs of
the different processes, the total investment costs
can be determined.
The complexity may differ per project. Sometimes
the building permit only allows a very restricted
building area, which means that a complex piled
up construction is needed. Therefore, the invest-
ment costs are higher.
Also, aspects like representative buildings, with
facilities for excursions, infl uence construction
costs.
Because of these variations, the investment
costs differ, even when the treatment scheme
and capacity are equal. Differences of ±30% are
possible, which is a factor of 2 between the most
expensive and the least expensive project design.
Scale factor
Of course, the capacity of the plant determines, to
an important extent, its investment costs.
For the relation between capacity and investment
costs, cost functions can be formulated.
The relation between capacity and investment
costs are usually well described by the general
formula:
K = a * (capacity)b
where:
K = investment costs (E)
a = costs factor ( - )
b = scale factor ( - )
In Figure 23 this relationship is given graphically
for various scale factors. In this relationship the
scale factor is the most important part.
Table 5 - Examples of investment cost functions for
initial cost estimations
Process / Process part Cost factor
(€ / m3 yearly capacity)
Production from groundwater 1.5 - 3.5
Production from bank fi ltration 2.0 - 4.0
Production from surface water
(direct)
3.0 - 5.0
Production from surface water
(soil aquifer recharge)
4.0 - 8.0
Groundwater abstraction 0.10 - 0.15
Aeration 0.10 - 0.15
Degasifying 0.20 - 0.30
Rapid sand fi ltration 0.30 - 0.55
Filter backwash water treatment 0.05 - 0.15
Raw water pumping 0.10 - 0.15
Microstrainers 0.05 - 0.15
Flocculation 0.10 - 0.25
Floc removal
(sedimentation/fl otation)
0.5 - 0.25
Rapid sand fi ltration 0.30 - 0.55
Activated carbon fi ltration (GAC) 0.50 - 0.90
Softening 0.35 - 0.60
Disinfection 0.05 - 0.20
Membrane fi ltration 1.00 - 2.00
Slow sand fi ltration 0.70 - 1.50
Clear water pumping station 0.40 - 0.70
Clear water storage 0.20 - 0.35

22
The cost ratio of two different capacities depends
only on the scale factor:
A scale factor of 1.0 indicates that there is a lin-
ear relationship between capacity and investment
costs. This usually occurs when more of the same
elements are needed for a larger plant, like in
membrane fi ltration in which more of the relatively
expensive membrane elements are necessary.
An example is rapid sand fi lters that, due to restric-
tions in backwash water facilities, are usually not
larger than 30 - 50 m2.
A scale factor of 0.6 - 0.7 occurs for process parts
for which, at a larger capacity, the size of the ele-
ments increases. Reservoirs are a typical example.
When the water height of a reservoir is selected,
then with a larger volume the surface of the fl oor
and roof will change on a linear scale with the vol-
ume (scale factor 1.0). The surface of the walls will
change with the square root of the volume (scale
factor 0.5).
In practice the scale factor for units of water pro-
duction plants will be between 0.6 and 0.9, within
the capacity range of factor 2 to 6.
6.2 Operational (exploitation) costs
The operational costs contain all costs which are
made or will be made to use an object, construc-
tion or plant.
These costs are made during (parts of) the opera-
tion period of the installation or plant and after
completion of the construction.
The operational costs are estimated to calculate
the total cost price of the different parts of the
company. This is important for the calculation of
costs to the buyers, because there are different
rates charged, such as to large consumers, for
bulk delivery to other water supply companies, or
for rate differences per part of the distribution area.
The operational costs will also be calculated when
determining various alternatives during the prelimi-
nary studies. The operational costs will eventually
be calculated back into consumers’ rates.
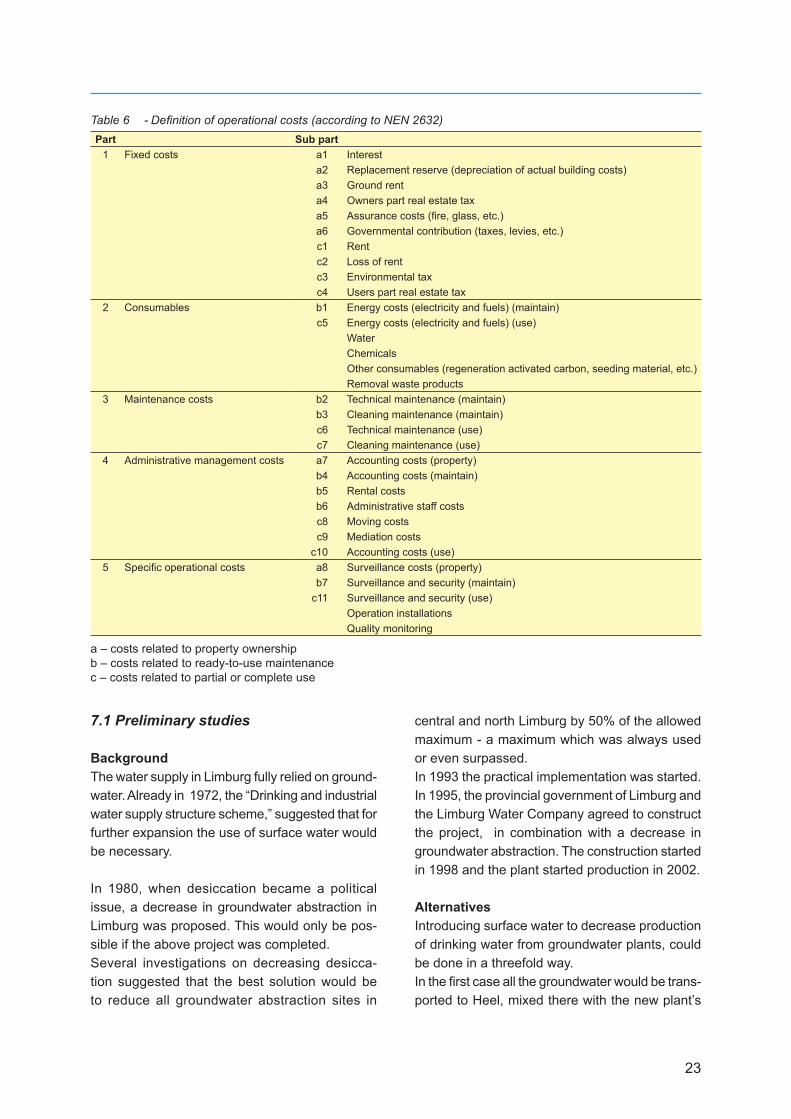
A uniform and unambiguous concept defi nition is
needed to explain and justify the operational costs.
A classifi cation is given in Table 6. In the table a
few typical cost items for drinking water supply
are included.
7. The practice of designing (Heel example)
In the previous sections the basic elements of the
design process have been explained. In the follow-
ing, the design process will be further elaborated
on using a concrete project: the construction of a
new drinking water production plant, in Heel, for
the Limburg Water Company.
The design is further discussed regarding the
phases previously described and the necessary
documents, according to the NEN/ISO 10628
“Flow diagrams for process plants.”
The following items will be elucidated:
- preliminary studies
- sketch design and building scheme
- preliminary design
- fi nal design and detailed design
- construction and start-up
Figure 23 - Relationship between capacity and invest-
ment costs for different scale factors
0
1
2
3
4
5
0 1 2 3 4
capacity
invest
ment
cost
s
b = 1.0 b = 0.75 b = 0.5
23
7.1 Preliminary studies
Background
The water supply in Limburg fully relied on ground-
water. Already in 1972, the “Drinking and industrial
water supply structure scheme,” suggested that for
further expansion the use of surface water would
be necessary.
In 1980, when desiccation became a political
issue, a decrease in groundwater abstraction in
Limburg was proposed. This would only be pos-
sible if the above project was completed.
Several investigations on decreasing desicca-
tion suggested that the best solution would be
to reduce all groundwater abstraction sites in
central and north Limburg by 50% of the allowed
maximum - a maximum which was always used
or even surpassed.
In 1993 the practical implementation was started.
In 1995, the provincial government of Limburg and
the Limburg Water Company agreed to construct
the project, in combination with a decrease in
groundwater abstraction. The construction started
in 1998 and the plant started production in 2002.
Alternatives
Introducing surface water to decrease production
of drinking water from groundwater plants, could
be done in a threefold way.
In the fi rst case all the groundwater would be trans-
ported to Heel, mixed there with the new plant’s
Table 6 - Defi nition of operational costs (according to NEN 2632)
a – costs related to property ownership
b – costs related to ready-to-use maintenance
c – costs related to partial or complete use
Part Sub part
1 Fixed costs a1 Interest
a2 Replacement reserve (depreciation of actual building costs)
a3 Ground rent
a4 Owners part real estate tax
a5 Assurance costs (fi re, glass, etc.)
a6 Governmental contribution (taxes, levies, etc.)
c1 Rent
c2 Loss of rent
c3 Environmental tax
c4 Users part real estate tax
2 Consumables b1 Energy costs (electricity and fuels) (maintain)
c5 Energy costs (electricity and fuels) (use)
Water
Chemicals
Other consumables (regeneration activated carbon, seeding material, etc.)
Removal waste products
3 Maintenance costs b2 Technical maintenance (maintain)
b3 Cleaning maintenance (maintain)
c6 Technical maintenance (use)
c7 Cleaning maintenance (use)
4 Administrative management costs a7 Accounting costs (property)
b4 Accounting costs (maintain)
b5 Rental costs
b6 Administrative staff costs
c8 Moving costs
c9 Mediation costs
c10 Accounting costs (use)
5 Specifi c operational costs a8 Surveillance costs (property)
b7 Surveillance and security (maintain)
c11 Surveillance and security (use)
Operation installations
Quality monitoring

24
production from surface water, and afterwards
distributed over all north and central Limburg. An
advantage of this is a uniform scheme and a con-
stant water quality over the entire province (i.e.,
no local differences).
In the second case, the groundwater plants would
supply the boundary locations of the distribution
area, while the centrally located Heel site would
supply the immediate surroundings. An advantage
of this solution is that ground- and surface water
systems would remain separated.
In the third case, the water produced in Heel would
be transported to the different groundwater sites
and mixed with the locally produced water there.
These alternatives have been thoroughly com-
pared, by investigating the consequences for the
water quality, distribution infrastructure, possibility
for phasing the project, costs, reliability, etc. Of
course, this needed several design activities. All
three possible solutions would require extensive,
extra distribution infrastructures (Figure 24).
Without describing the decision process in detail,
the fi nal decision was to add the surface water to
the groundwater (Figure 25).
Water supply plan
In most cases the production capacity is not
reduced drastically. Usually, the increase in the
water demand leads to new production plants or
capacity increase of current plants.
Figure 26 shows how such a demand coverage
can be monitored. The net demand is shown,
based on one of the different situations (minimum,
maximum and most probable). From those fi gures
and a reserve, a gross demand can be calculated.
New capacity is realized stepwise, making avail-
able a spare capacity. In a water supply plan, the
calculations are based on yearly capacities. Based
on the expected maximum peak factor, the maxi-
mum daily production can be determined.
The water supply plan describes which production
plants need to be functional and when to increase
Figure 24 - For all alternatives, a considerable pipeline infrastructure was needed

25
a plant’s production capacity. The uncertainty in
the predictions might lead to shifting the moment
at which the additional capacity is realized.
To estimate the time when an extra facility to han-
dle additional capacity will be required, one can
calculate backwards to determine the last possi-
ble moment to start preparations for building the
new plant.
7.2 Block diagram, site layout plan and
sketch design
Besides the required capacity, the treatment
process needs to be decided upon as well. The
following research methods are used to come to
this decision:
- evaluation of current experience
- investigation of new treatment techniques
- pilot research (semi-technical scale)
- full-scale research (temporary production plant)
Time and means do not always allow the use of
all those methods. This increases the uncertainty
of the process design and of the entire operation.
In the plant this can be compensated for by
increasing fl exibility and safety in the design (larger
buildings or increased possibilities for expansion)
and in the operation (increased control options,
increased doses). Either of these will increase the
investment costs and complicate the operation.
The start-up can take longer as well, because
operators might not be familiar, or are less familiar,
with the chosen treatment process.
Block diagram (treatment scheme)
The treatment process in this phase is represented
as a block diagram (ISO 10628), which can also
be used for treatment plants or other units.
The block diagram consists of named rectangular
blocks, connected to each other by streamlines
and it includes
the names of in- and out-fl owing mass and energy
fl ows (for the block diagram as a whole), as well
as the
directions of the main streams between the blocks.
Also, a block diagram may contain additional
information, like the names of the fl ows between
the blocks, the amounts of in- and out-fl owing
mass and energy fl ows, the amounts of the most
important fl ows between the blocks, and the typi-
cal process conditions. A limited block diagram is
shown in Figure 27.
Figure 25 - Surface water treatment in Heel supplies
drinking water to the province of Limburg in
addition to the existing groundwater plants
Venray
Weert
Breehei
Houthuizen
Californië
Helden
Reuver
Roermond
Tegelen
Venlo
Herten
‘t Reutje
Beegden
Heel
Susteren
Figure 26 - Growth and coverage of water demand
time
capaci
ty
capacity
gross water demand
reserve
net water demand
over capacity

26
In addition to the block diagram, a more visual
representation of the treatment process can
be drawn. Mostly, this is a rough section of the
process, including the most important pumping
phases. Figure 28 shows an example.
Site layout plan
When the capacity and the treatment processes
are roughly known, a provisional site layout plan
can be drawn. This plan especially aims at the
zoning of the plant area and at the related orienta-
tion of the buildings. Site layout plans are usually
drawn at a scale of either 1:500 or 1:1000.
Typical zones within a site layout plan are:
- clean water reservoirs with high pressure
pumping station
- treatment plant
- sludge and backwash water treatment units
- energy supply (including emergency power)
- additional services (e.g., workshops)
- main roads and transport routes
- space for future expansion
When formulating the site layout plan, the build-
ing boundaries are either not important or not yet
known. Generally, the spatial demand per process
part can be determined. The spatial demand of
most processes (i.e., fi ltration, fl occulation, sedi-
mentation, etc.) is about 2 to 3 times as much as
the actual area necessary for the process. This is
because of necessary pipe galleries and control
rooms. Besides, during construction a large space
around the building is required.
Finally, it is desirable to consider future develop-
ments and replacements. For a replacement, the
new construction should be fi nished before an old
construction is demolished, to maintain continuity
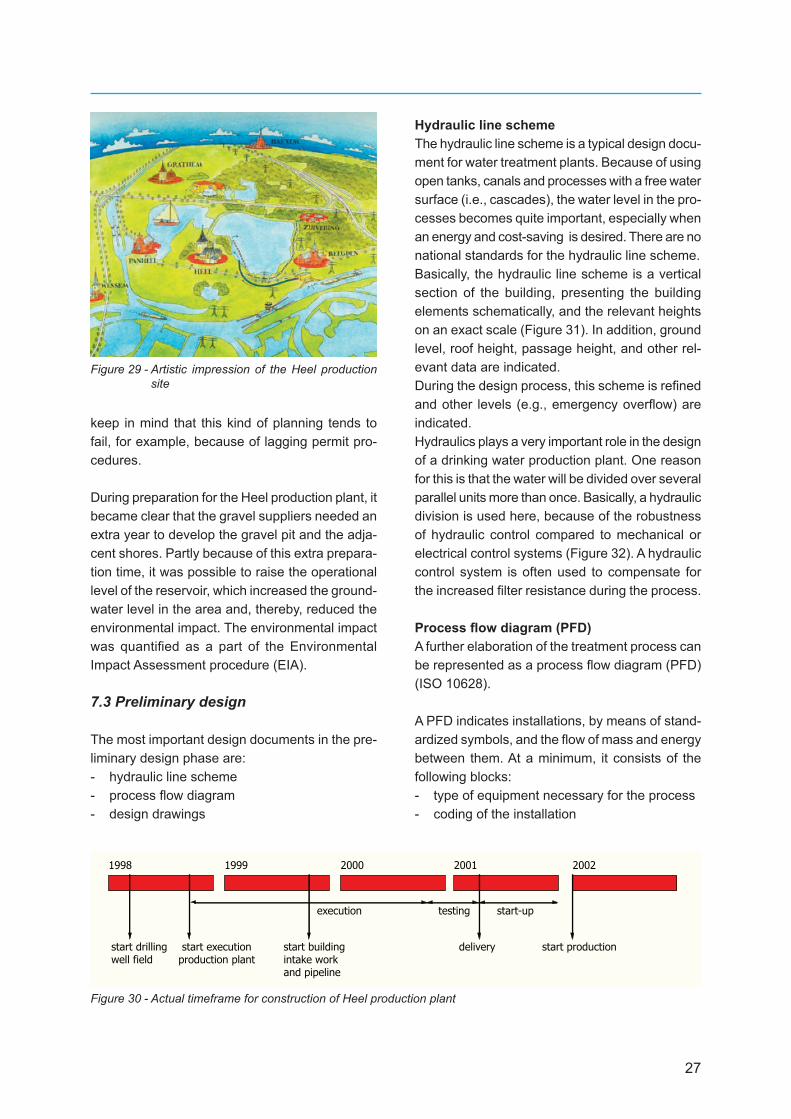
in the supply of drinking water. Figure 29 gives
an artistic impression of the Heel production site.
Sketch design
In addition to the documents named above, formu-
lating some very rough design drawings to present
the intended construction to third parties may be
desirable. Usually, a single fl oor plan and one or
two sections will suffi ce.
The sketch design names the projected structures
and their dimensions. The building scheme is
formulated based on this design, including plans
for the construction work (Figure 30). One should
Figure 27 - Global setup of the treatment scheme
Clear water storageter stor
UV-disinfectioninfect
Activated carbon filtrationcarbon
Filtrationration
Aerationration
Abstraction
Figure 28 - Visual presentation of the treatment process
basin
abstractionwell
aeration
rapid filter
pump
activated carbon filter
UV-disinfection
clear water storage
pumping station 1
pumping station 2pump
27
keep in mind that this kind of planning tends to
fail, for example, because of lagging permit pro-
cedures.
During preparation for the Heel production plant, it
became clear that the gravel suppliers needed an
extra year to develop the gravel pit and the adja-
cent shores. Partly because of this extra prepara-
tion time, it was possible to raise the operational
level of the reservoir, which increased the ground-
water level in the area and, thereby, reduced the
environmental impact. The environmental impact
was quantifi ed as a part of the Environmental
Impact Assessment procedure (EIA).
7.3 Preliminary design
The most important design documents in the pre-
liminary design phase are:
- hydraulic line scheme
- process fl ow diagram
- design drawings
Hydraulic line scheme
The hydraulic line scheme is a typical design docu-
ment for water treatment plants. Because of using
open tanks, canals and processes with a free water
surface (i.e., cascades), the water level in the pro-
cesses becomes quite important, especially when
an energy and cost-saving is desired. There are no
national standards for the hydraulic line scheme.
Basically, the hydraulic line scheme is a vertical
section of the building, presenting the building
elements schematically, and the relevant heights
on an exact scale (Figure 31). In addition, ground
level, roof height, passage height, and other rel-
evant data are indicated.
During the design process, this scheme is refi ned
and other levels (e.g., emergency overfl ow) are
indicated.
Hydraulics plays a very important role in the design
of a drinking water production plant. One reason
for this is that the water will be divided over several
parallel units more than once. Basically, a hydraulic
division is used here, because of the robustness
of hydraulic control compared to mechanical or
electrical control systems (Figure 32). A hydraulic
control system is often used to compensate for
the increased fi lter resistance during the process.
Process fl ow diagram (PFD)
A further elaboration of the treatment process can
be represented as a process fl ow diagram (PFD)
(ISO 10628).
A PFD indicates installations, by means of stand-
ardized symbols, and the fl ow of mass and energy
between them. At a minimum, it consists of the
following blocks:
- type of equipment necessary for the process
- coding of the installation
Figure 29 - Artistic impression of the Heel production
site
Figure 30 - Actual timeframe for construction of Heel production plant
1998 1999 2000 2001 2002
start-up
start drillingwell field
start executionproduction plant
start buildingintake workand pipeline
execution testing
start productiondelivery

28
- direction and route of in- and outfl owing mass
and energy
- labelling and quantifying of in- and outfl owing
masses
- labelling and quantifying of in- and outfl owing
energy fl ows
- typical process conditions
Additional information can be included, such as
the magnitudes of fl ows and amounts between
process steps, major valves, functional indication
of instrument and control systems in a specifi ed
position, additional process conditions, names of
characteristic installation data, names and charac-
teristic data of propulsion systems, and the eleva-
tion levels of terraces and installations.
For the design of a drinking water production plant,
it is only useful to formulate a PFD in addition to
the hydraulic line scheme when all parallel process
parts are presented separately. This makes the
diagram correspond to the much used main water
fl ow diagram (Figure 33).
This specifi cation is desirable so that the PFD can
be used to determine the different hydraulic loads
of units and piping, both in normal and in special
circumstances. For normal conditions one can
describe the different process conditions with the
diagram (e.g., fi lter during backwash, etc.). The
extraordinary conditions determine the dimensions
of the parts. In this way, the PFD is the basis for the
detailed hydraulic calculations and the functional
description of the control and operating system.
Design drawings
Design drawings represent the physical reality.
During the preliminary design phase, especially the
dimensions of the process units and the different
rooms will be decided.
More and more, these drawings are made by 3D
design systems (Figures 34 and 35).
Structural aspects
During the preliminary design phase, the dimen-
sions of the structural elements cannot be deter-
mined accurately yet because the loads are only
approximated. Nevertheless, it has proven feasible
to make some realistic assumptions instead. For
concrete constructions, the fl oor and wall sizes are
mostly estimated at 0.4-0.6 m.
Figure 31 - Hydraulic line scheme
25.7+ (max)31.5+
22.00+
field level
30.5+ (min)
30.8+ (max)
25.8+ (min)
28.00+
24.00+
cascade pre-filtration pre-filtrationbuffer
28.3+ (min)28.2+ (max)
groundwater level
25.3+ (min)
30.00+27.1+ (min)
26.00+
28.6+ (max)
32.00+
34.00+
activatedcarbon filter
UV-disinfection
clear waterstorage
26.5+ (max)
Figure 32 - Hydraulic solutions are easier and more
robust
division flow over streets
Q Q
1/4 Q
1/4 Q
1/4 Q
1/4 Q
1/4 Q
1/4 Q
1/4 Q
1/4 Q
filter regulation (compensation the increase of the pressure drop):
H
FIC
FIC
FIC
FIC

29
Architecture
Adjustment of the design because of architectural
considerations may be desirable. Therefore, it
is useful to indicate the functional relationships
between the different components. This will give
a better indication to the architect of the degrees
of freedom and of the consequences of breaking
them (Figures 36 and 37).
7.4 Final design and detailed design
During the fi nal design and detailed design phases,
many more design documents are still formulated.
Here, only the piping and instrument diagram is
considered.
Piping and instrument diagram (P&ID)
The piping and instrument diagram (P&ID) (ISO
10628) indicates the technical construction of a
process through standardized symbols for instal-
lations, pipes, instruments and control systems.
The minimum information in such diagram includes
the following:
- function or type of apparatus, including drives
and installed spare parts
Figure 33 - A part of the process fl ow diagram (Main water fl ow diagram)
pre-filtrate
pre-filtrate
circulation
1
2
4
3
5
6
7
8
1
2
4
3
5
6
7
8
clear water
clear water
rinse water
transport pumps/rinse water pumps
aeration clear water storageUV-unitsactivated carbon filters
UV
UV
UV
UV
UV
UV
UV
UV
1
2
4
3
1
2
4
3
Figure 34 - Design of building Figure 35 - Design cascade aeration

30
- identifi cation number of apparatus including
drives and installed spare parts
- characteristic data of apparatus (on a separate
list)
- identifi cation of nominal diameter, pressure
class, piping material and classifi cation
- details of installations, pipes, gauges and junc-
tions
- process measurement installations and control
systems with identifi cation
- characteristic data of drivers
7.5 Construction and start-up
Even during the construction phase, several
design activities are performed. These may include
a further detailed elaboration of the design (i.e.,
form and reinforcement drawings) or temporary
constructions (dam walls, concrete molds).
Figure 36- Architectural design drawings
Figure 37 - An architect’s scale model

31