Embed Size (px)
Citation preview
Page 1 of 17
5/08/2017
20XX-01-XXXX
Design and Validation of a Custom Muffler
Woodland, M., Sedgwick, A., Eliason, A., Arteaga, M.
University of Idaho
Abstract
A custom muffler was designed for the University of Idaho Clean
Snowmobile Challenge team to meet National Park Services
standards for noise emissions. A flow bench and an anechoic sound
box was used to conduct research on muffler design. Initial designs
were simulated through SolidWorks Flow Simulation and Sidlab to
compare results. The final muffler was manufactured, validated,
tested, and implemented on the University of Idaho’s clean
snowmobile. At the Clean Snowmobile Challenge the muffler was
able to reduce noise emission to 5 dBA below National Park
Services noise standards and place third quietest snowmobile overall.
Introduction
The exhaust system is a critical part of engine performance and a
major contributor to overall noise. This paper discusses the process of
designing a muffler for a two-stroke snowmobile. However, the
principals can be applied to any combustion vehicle muffler. The
designed muffler was used by the University of Idaho Clean
Snowmobile team (UICSC) on the Rotax 800cc E-Tec engine, as a
step towards meeting National Park Service (NPS) standards for
noise emissions. NPS standards say that snowmobiles can only be
allowed into national parks if the sound is below 67 + 2 dBA and
currently has not been met by any original equipment manufacturer
two-stroke platform.
Design Criteria
The UICSC team required a muffler that would meet NPS standards,
have minimal impact on engine performance, and be able to
withstand extreme temperatures from a catalyst. In order to meet
these goals a table of requirements was set by the muffler design
team, shown in Table 1, to provide parameters for the project. The
parameters were baselined off of the stock mufflers performance and
characteristics.
Table 1. Design Specifications
Goal Acceptable
dBA
Reduction 4 2
Peak Engine
Power
89.5 kW
(120 hp)
82.0 kW
(110 hp)
Weight 9.1 kg
(20 lbs)
11.3 kg
(25 lbs)
Flow Rate 0.1 m3/s
(3.5 cfs)
0.09 m3/s
(3.3 cfs)
Back Pressure 4.34 kPa
(0.63 psi)
5.03 kPa
(0.73 psi)
Cost to
Manufacture $300 $500
MSRP $650 (Stock) $850
Size
40.6 cm x14.0 cm x
33.0 cm
(16"x5.5"x13")
Has to fit
Robustness
982°C (1800°F)
withstand winter
conditions
982°C (1800°F)
withstand winter
conditions
CSC
Competition
Meet NPS Standards,
Quietest Snowmobile
Meet NPS
Standards
Initial Research
Research was conducted to understand the acoustic and performance
characteristics that influence the design of a muffler. The design team
decided to conduct research in the areas of sound absorption material,
attenuation through muffler geometry, and backpressure. As a
starting point the design team looked at industry muffler design.
Page 2 of 17
5/08/2017
Industry Design
There are multiple muffler manufacturers in industry that use three
techniques in muffler design. The first being an absorptive style
muffler where only sound absorption material is used to convert
sound energy into heat [1]. Second, a reactive style muffler uses only
wave cancellation principles in the form of expansion chambers,
chambers with plates, extended tubes, perforated tubes, or resonators.
Lastly, a combination muffler uses both techniques. Typically,
combination mufflers are the most common because they are able to
effectively target a wide range of frequencies as well as produce
minimal backpressure [2]. The design team decided to build a better
understanding of muffler design by breaking the methods into three
individual components: sound material, geometry, and backpressure.
Material Selection
When selecting a material to be used, sound material fiber size,
acoustic characteristics, durability, chemical resistance, and
temperature resistance need to be taken into consideration [3].
Materials that are porous make good absorbers while nonporous
materials reflect sound waves back into the exhaust stream. The
Knudsen number (Kn), given in Equation 1, determines the sizes of
the pores and the materials ability to absorb sound.
𝐾𝑛 = 𝑙𝑚𝑓𝑝
𝑙𝑐ℎ𝑎𝑟 (1)
lmfp is the average distance an air molecule can move before colliding
with another and lchar is the average distance between pore walls
within the material. This means that the smaller the Knudsen number
the better absorber it will be. An example would be ceramic foam
being a better absorber than aerogel, as seen in Table 2 [3].
Table 2. Knudsen numbers for various porous materials
Material lmfp ,
m
lchar ,
m Kn
Ceramic foam 7 x 10⁻⁸ 1x10⁻³ 7x10⁻⁵
Metal foam 7x10⁻⁸ 2x10⁻⁴ 4x4-4
Aerogel 7x10⁻⁹ 5x10⁻⁸ 2x10⁻¹
Sound material is most effective at attenuating high frequencies, but
also has a minor effect on the lower frequencies. Noise is
significantly attenuated when the material is one tenth the wavelength
[3]. Although, the thicker the sound material the greater the
attenuation.
𝑐 = √𝛾 ∗ 𝑅 ∗ 𝑇 (2)
𝜆 = 𝑐𝑓 (3)
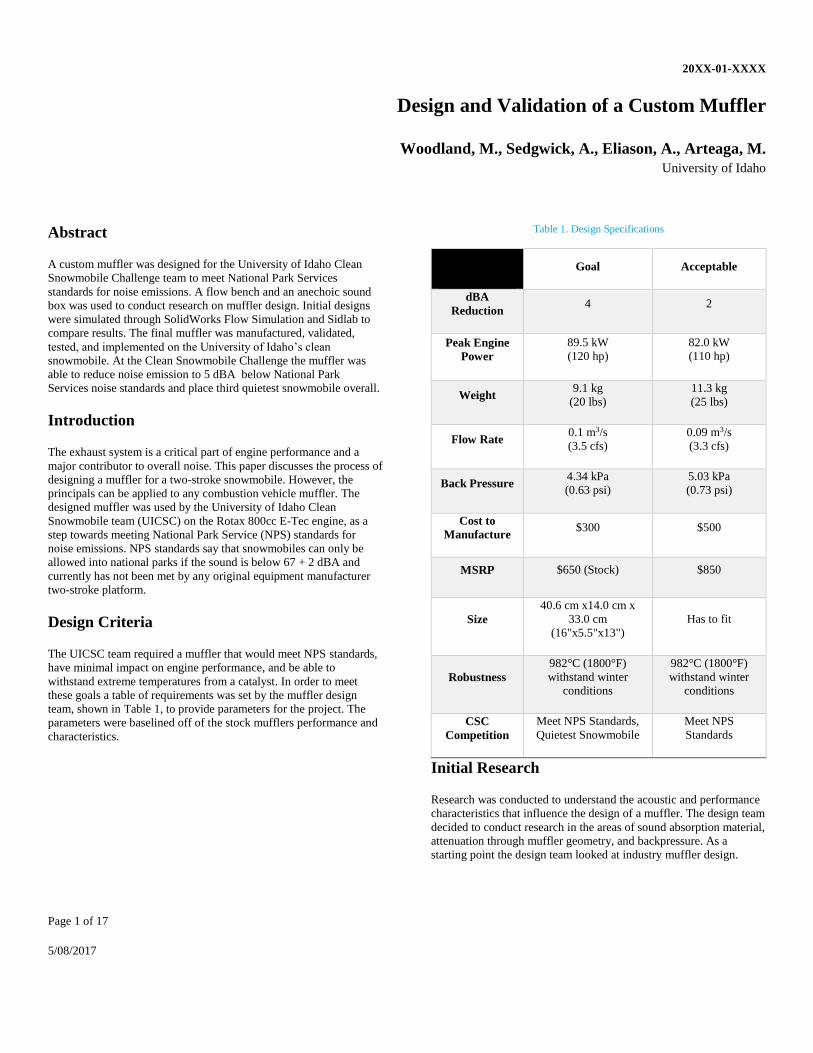
Figure 1 represents the thickness of sound material required to reduce
the targeted frequency. First, the speed of sound, c, was calculated
using equation 2, given an average exhaust temperature, T, of 538 °C
(1000 °F). Using the one tenth assumption, the sound material
thickness was adjusted from one to fifteen inches and multiplied by
ten to get the targeted wavelength, 𝜆. The frequencies that would be
affected were calculated by equation 3.
Figure 1. Sound material frequency attenuation
Besides good acoustic characteristics, the ability of that material to
withstand high temperatures produced by the catalyst [up to 982°C
(1800 °F)] and robustness were taken into consideration. For this
purpose, a number of materials were selected for further testing and
will be discussed in a later section.
Acoustics and Geometry
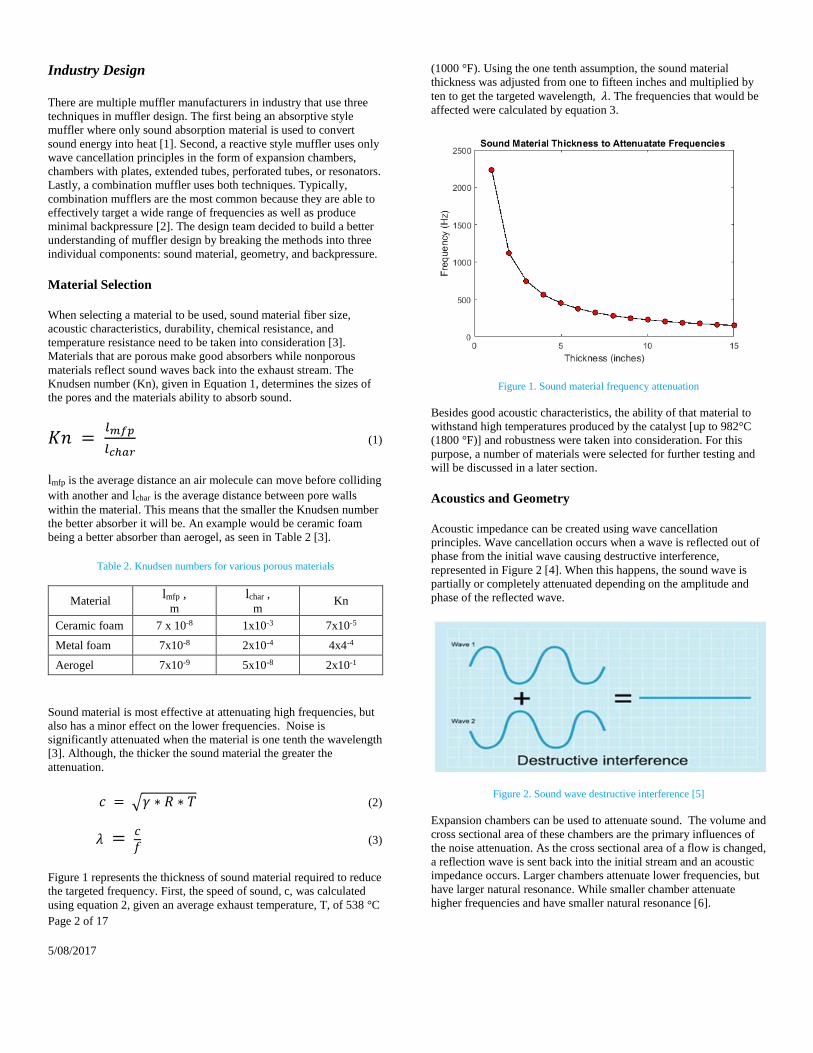
Acoustic impedance can be created using wave cancellation
principles. Wave cancellation occurs when a wave is reflected out of
phase from the initial wave causing destructive interference,
represented in Figure 2 [4]. When this happens, the sound wave is
partially or completely attenuated depending on the amplitude and
phase of the reflected wave.
Figure 2. Sound wave destructive interference [5]
Expansion chambers can be used to attenuate sound. The volume and
cross sectional area of these chambers are the primary influences of
the noise attenuation. As the cross sectional area of a flow is changed,
a reflection wave is sent back into the initial stream and an acoustic
impedance occurs. Larger chambers attenuate lower frequencies, but
have larger natural resonance. While smaller chamber attenuate
higher frequencies and have smaller natural resonance [6].
Page 3 of 17
5/08/2017
Helmholtz and quarter wave resonators are a form of destructive
interference and can be designed to attenuate noise at a specific
frequency. Helmholtz resonator’s frequency is based on the entrance
length, entrance cross section area, and volume of the closed
chamber, while quarter wave resonators are based solely on pipe
length.
Another attenuation method is geometric interference that uses “V”
shaped, “C” shaped, or straight plates that reflect sound waves.
Backpressure and Muffler Design
The performance of a two-stroke engine is highly reliant on the
backpressure of the exhaust system. Backpressure is the resistance to
flow. There is a strong correlation between back pressure and noise
attenuation [4]. This means typically performance suffers from a
decrease in noise emissions. For maintaining the performance and
minimizing calibration time, a muffler redesign should have similar
pack pressure at various flow rates compared to stock.
Testing Equipment
The UICSC developed testing equipment and procedures to gain an
empirical understanding of fluid flow and acoustics. The two
apparatuses developed were a flow bench and anechoic sound box.
Anechoic Sound Box
To improve understanding of sound attenuation, the UICSC team
manufactured an anechoic sound box testing apparatus, referred to as
the UI sound box (UISB). The initial design of the UISB was based
on an existing design, which was used to test the acoustic
effectiveness of quarter-wave and Helmholtz resonators [7]. The
anechoic sound box was designed to emit pure frequencies through a
waveguide (pipe) without interference. The final UISB specifications
are given in Table 3.
Table 3. UI Sound box specifications
Speakers [8] 15.88 cm (6.25 in)
Tweeters [8] 4.60 cm (1.81 in)
UI Sound Box .23 m3 (8.00 ft3)
Waveguide Diameter 5.08 cm (2.00 in)
Waveguide Length 4.06 m (13.33 ft)
Studio-foam [9] 10.16 cm (4 .00in)
Audio Amplifier [10] 1100 W
Microphone Locations [11]
45.72 cm (18 .00 in), 137.16
cm (54.00 in), 289.56 cm
(114.00 in), 381.00 cm (150.00
in)
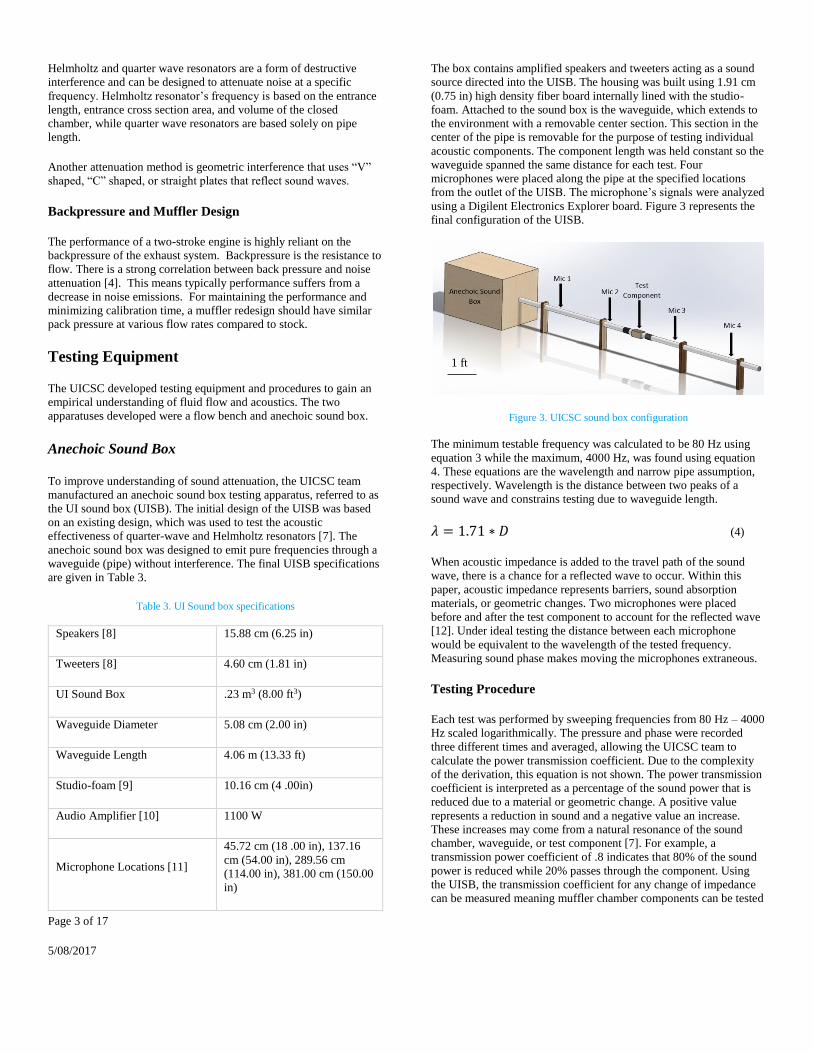
The box contains amplified speakers and tweeters acting as a sound
source directed into the UISB. The housing was built using 1.91 cm
(0.75 in) high density fiber board internally lined with the studio-
foam. Attached to the sound box is the waveguide, which extends to
the environment with a removable center section. This section in the
center of the pipe is removable for the purpose of testing individual
acoustic components. The component length was held constant so the
waveguide spanned the same distance for each test. Four
microphones were placed along the pipe at the specified locations
from the outlet of the UISB. The microphone’s signals were analyzed
using a Digilent Electronics Explorer board. Figure 3 represents the
final configuration of the UISB.
Figure 3. UICSC sound box configuration
The minimum testable frequency was calculated to be 80 Hz using
equation 3 while the maximum, 4000 Hz, was found using equation
4. These equations are the wavelength and narrow pipe assumption,
respectively. Wavelength is the distance between two peaks of a
sound wave and constrains testing due to waveguide length.
𝜆 = 1.71 ∗ 𝐷 (4)
When acoustic impedance is added to the travel path of the sound
wave, there is a chance for a reflected wave to occur. Within this
paper, acoustic impedance represents barriers, sound absorption
materials, or geometric changes. Two microphones were placed
before and after the test component to account for the reflected wave
[12]. Under ideal testing the distance between each microphone
would be equivalent to the wavelength of the tested frequency.
Measuring sound phase makes moving the microphones extraneous.
Testing Procedure
Each test was performed by sweeping frequencies from 80 Hz – 4000
Hz scaled logarithmically. The pressure and phase were recorded
three different times and averaged, allowing the UICSC team to
calculate the power transmission coefficient. Due to the complexity
of the derivation, this equation is not shown. The power transmission
coefficient is interpreted as a percentage of the sound power that is
reduced due to a material or geometric change. A positive value
represents a reduction in sound and a negative value an increase.
These increases may come from a natural resonance of the sound
chamber, waveguide, or test component [7]. For example, a
transmission power coefficient of .8 indicates that 80% of the sound
power is reduced while 20% passes through the component. Using
the UISB, the transmission coefficient for any change of impedance
can be measured meaning muffler chamber components can be tested
1 ft
Page 4 of 17
5/08/2017
either individually or in series.
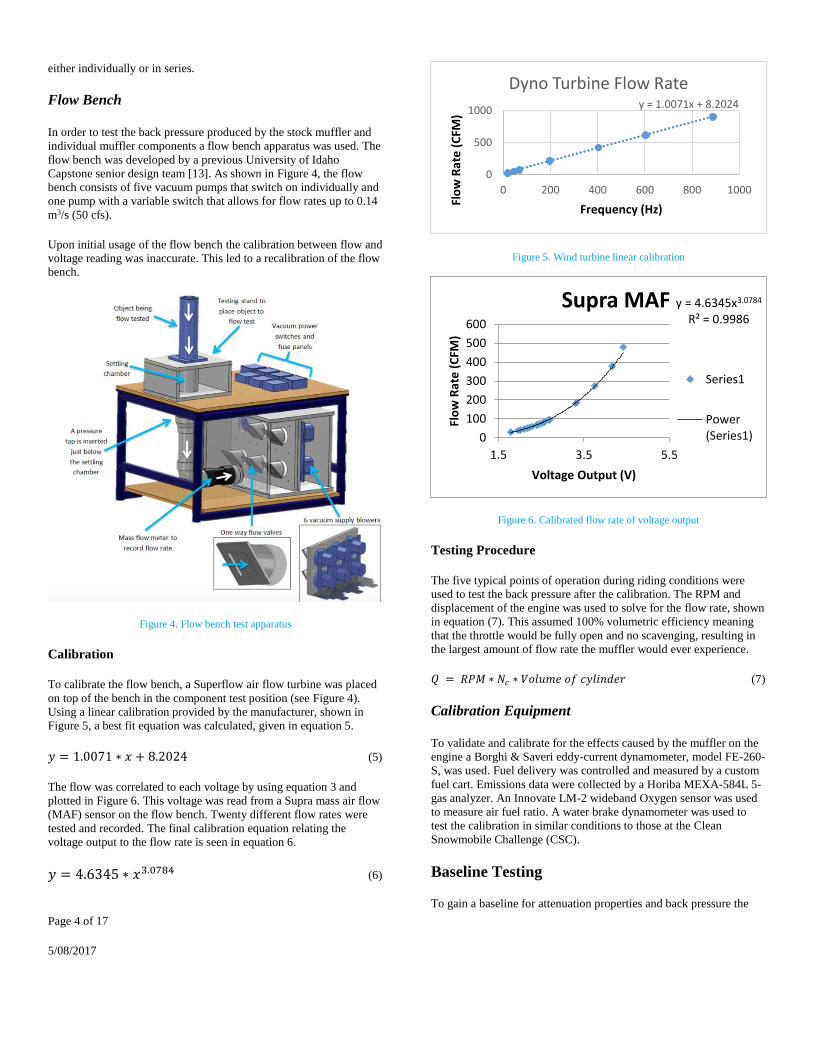
Flow Bench
In order to test the back pressure produced by the stock muffler and
individual muffler components a flow bench apparatus was used. The
flow bench was developed by a previous University of Idaho
Capstone senior design team [13]. As shown in Figure 4, the flow
bench consists of five vacuum pumps that switch on individually and
one pump with a variable switch that allows for flow rates up to 0.14
m3/s (50 cfs).
Upon initial usage of the flow bench the calibration between flow and
voltage reading was inaccurate. This led to a recalibration of the flow
bench.
Figure 4. Flow bench test apparatus
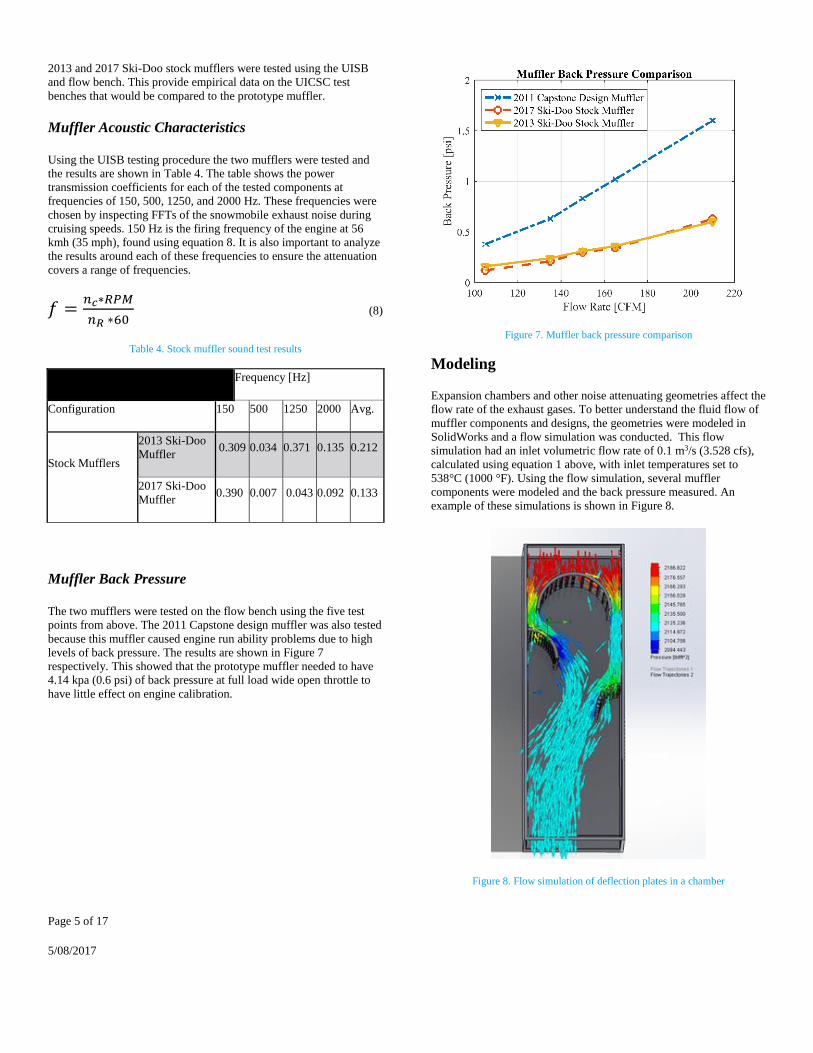
Calibration
To calibrate the flow bench, a Superflow air flow turbine was placed
on top of the bench in the component test position (see Figure 4).
Using a linear calibration provided by the manufacturer, shown in
Figure 5, a best fit equation was calculated, given in equation 5.
𝑦 = 1.0071 ∗ 𝑥 + 8.2024 (5)
The flow was correlated to each voltage by using equation 3 and
plotted in Figure 6. This voltage was read from a Supra mass air flow
(MAF) sensor on the flow bench. Twenty different flow rates were
tested and recorded. The final calibration equation relating the
voltage output to the flow rate is seen in equation 6.
𝑦 = 4.6345 ∗ 𝑥3.0784 (6)
Figure 5. Wind turbine linear calibration
Figure 6. Calibrated flow rate of voltage output
Testing Procedure
The five typical points of operation during riding conditions were
used to test the back pressure after the calibration. The RPM and
displacement of the engine was used to solve for the flow rate, shown
in equation (7). This assumed 100% volumetric efficiency meaning
that the throttle would be fully open and no scavenging, resulting in
the largest amount of flow rate the muffler would ever experience.
𝑄 = 𝑅𝑃𝑀 ∗ 𝑁𝑐 ∗ 𝑉𝑜𝑙𝑢𝑚𝑒 𝑜𝑓 𝑐𝑦𝑙𝑖𝑛𝑑𝑒𝑟 (7)
Calibration Equipment
To validate and calibrate for the effects caused by the muffler on the
engine a Borghi & Saveri eddy-current dynamometer, model FE-260-
S, was used. Fuel delivery was controlled and measured by a custom
fuel cart. Emissions data were collected by a Horiba MEXA-584L 5-
gas analyzer. An Innovate LM-2 wideband Oxygen sensor was used
to measure air fuel ratio. A water brake dynamometer was used to
test the calibration in similar conditions to those at the Clean
Snowmobile Challenge (CSC).
Baseline Testing
To gain a baseline for attenuation properties and back pressure the
y = 1.0071x + 8.2024
0
500
1000
0 200 400 600 800 1000
Flo
w R
ate
(C
FM)
Frequency (Hz)
Dyno Turbine Flow Rate
y = 4.6345x3.0784
R² = 0.9986
0
100
200
300
400
500
600
1.5 3.5 5.5Fl
ow
Rat
e (
CFM
)
Voltage Output (V)
Supra MAF
Series1
Power(Series1)
Page 5 of 17
5/08/2017
2013 and 2017 Ski-Doo stock mufflers were tested using the UISB
and flow bench. This provide empirical data on the UICSC test
benches that would be compared to the prototype muffler.
Muffler Acoustic Characteristics
Using the UISB testing procedure the two mufflers were tested and
the results are shown in Table 4. The table shows the power
transmission coefficients for each of the tested components at
frequencies of 150, 500, 1250, and 2000 Hz. These frequencies were
chosen by inspecting FFTs of the snowmobile exhaust noise during
cruising speeds. 150 Hz is the firing frequency of the engine at 56
kmh (35 mph), found using equation 8. It is also important to analyze
the results around each of these frequencies to ensure the attenuation
covers a range of frequencies.
𝑓 =𝑛𝑐∗𝑅𝑃𝑀
𝑛𝑅 ∗60 (8)
Table 4. Stock muffler sound test results
Frequency [Hz]
Configuration 150 500 1250 2000 Avg.
Stock Mufflers
2013 Ski-Doo
Muffler 0.309 0.034 0.371 0.135 0.212
2017 Ski-Doo
Muffler 0.390 0.007 0.043 0.092 0.133
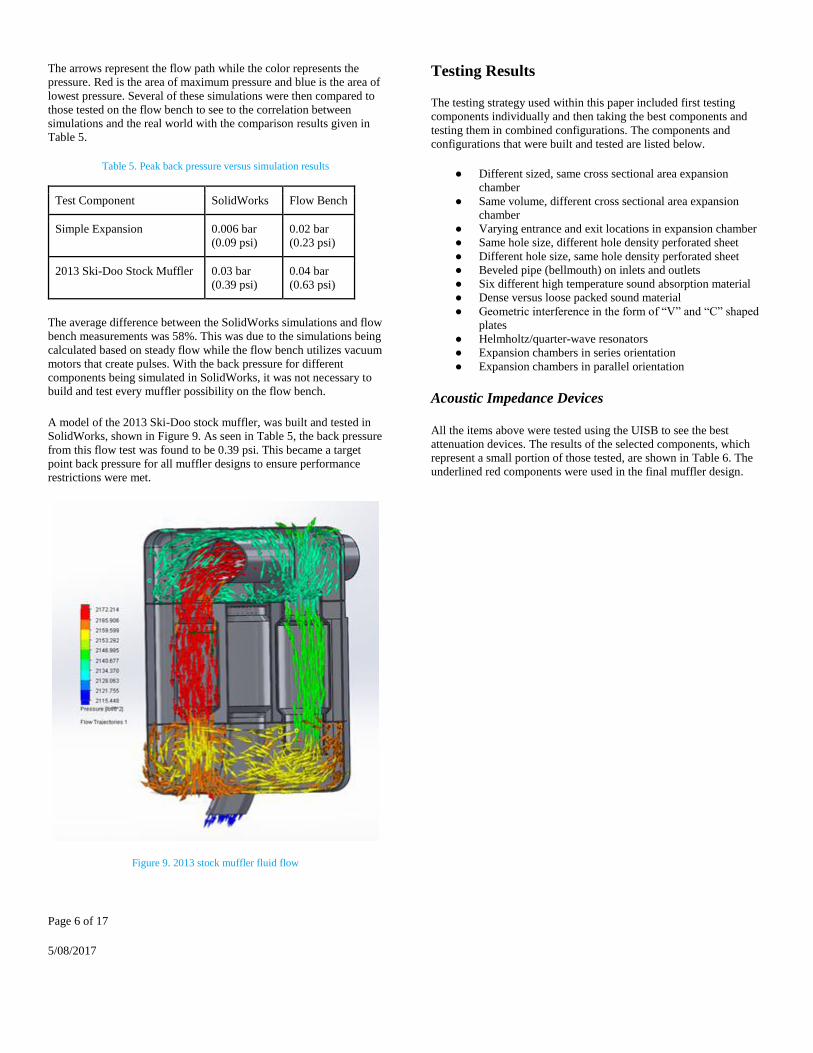
Muffler Back Pressure
The two mufflers were tested on the flow bench using the five test
points from above. The 2011 Capstone design muffler was also tested
because this muffler caused engine run ability problems due to high
levels of back pressure. The results are shown in Figure 7
respectively. This showed that the prototype muffler needed to have
4.14 kpa (0.6 psi) of back pressure at full load wide open throttle to
have little effect on engine calibration.
Figure 7. Muffler back pressure comparison
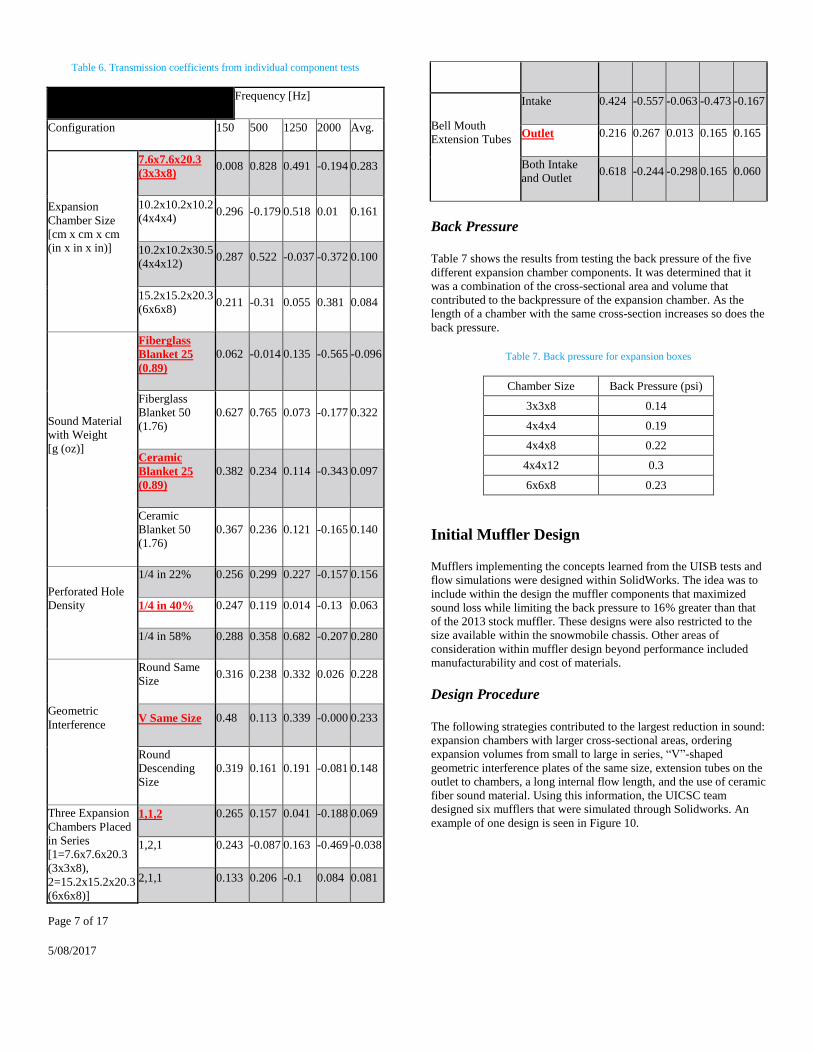
Modeling
Expansion chambers and other noise attenuating geometries affect the
flow rate of the exhaust gases. To better understand the fluid flow of
muffler components and designs, the geometries were modeled in
SolidWorks and a flow simulation was conducted. This flow
simulation had an inlet volumetric flow rate of 0.1 m3/s (3.528 cfs),
calculated using equation 1 above, with inlet temperatures set to
538°C (1000 °F). Using the flow simulation, several muffler
components were modeled and the back pressure measured. An
example of these simulations is shown in Figure 8.
Figure 8. Flow simulation of deflection plates in a chamber
Page 6 of 17
5/08/2017
The arrows represent the flow path while the color represents the
pressure. Red is the area of maximum pressure and blue is the area of
lowest pressure. Several of these simulations were then compared to
those tested on the flow bench to see to the correlation between
simulations and the real world with the comparison results given in
Table 5.
Table 5. Peak back pressure versus simulation results
Test Component SolidWorks Flow Bench
Simple Expansion 0.006 bar
(0.09 psi)
0.02 bar
(0.23 psi)
2013 Ski-Doo Stock Muffler 0.03 bar
(0.39 psi)
0.04 bar
(0.63 psi)
The average difference between the SolidWorks simulations and flow
bench measurements was 58%. This was due to the simulations being
calculated based on steady flow while the flow bench utilizes vacuum
motors that create pulses. With the back pressure for different
components being simulated in SolidWorks, it was not necessary to
build and test every muffler possibility on the flow bench.
A model of the 2013 Ski-Doo stock muffler, was built and tested in
SolidWorks, shown in Figure 9. As seen in Table 5, the back pressure
from this flow test was found to be 0.39 psi. This became a target
point back pressure for all muffler designs to ensure performance
restrictions were met.
Figure 9. 2013 stock muffler fluid flow
Testing Results
The testing strategy used within this paper included first testing
components individually and then taking the best components and
testing them in combined configurations. The components and
configurations that were built and tested are listed below.
● Different sized, same cross sectional area expansion
chamber
● Same volume, different cross sectional area expansion
chamber
● Varying entrance and exit locations in expansion chamber
● Same hole size, different hole density perforated sheet
● Different hole size, same hole density perforated sheet
● Beveled pipe (bellmouth) on inlets and outlets
● Six different high temperature sound absorption material
● Dense versus loose packed sound material
● Geometric interference in the form of “V” and “C” shaped
plates
● Helmholtz/quarter-wave resonators
● Expansion chambers in series orientation
● Expansion chambers in parallel orientation
Acoustic Impedance Devices
All the items above were tested using the UISB to see the best
attenuation devices. The results of the selected components, which
represent a small portion of those tested, are shown in Table 6. The
underlined red components were used in the final muffler design.
Page 7 of 17
5/08/2017
Table 6. Transmission coefficients from individual component tests
Frequency [Hz]
Configuration 150 500 1250 2000 Avg.
Expansion
Chamber Size
[cm x cm x cm
(in x in x in)]
7.6x7.6x20.3
(3x3x8) 0.008 0.828 0.491 -0.194 0.283
10.2x10.2x10.2
(4x4x4) 0.296 -0.179 0.518 0.01 0.161
10.2x10.2x30.5
(4x4x12) 0.287 0.522 -0.037 -0.372 0.100
15.2x15.2x20.3
(6x6x8) 0.211 -0.31 0.055 0.381 0.084
Sound Material
with Weight
[g (oz)]
Fiberglass
Blanket 25
(0.89)
0.062 -0.014 0.135 -0.565 -0.096
Fiberglass
Blanket 50
(1.76)
0.627 0.765 0.073 -0.177 0.322
Ceramic
Blanket 25
(0.89)
0.382 0.234 0.114 -0.343 0.097
Ceramic
Blanket 50
(1.76)
0.367 0.236 0.121 -0.165 0.140
Perforated Hole
Density
1/4 in 22% 0.256 0.299 0.227 -0.157 0.156
1/4 in 40% 0.247 0.119 0.014 -0.13 0.063
1/4 in 58% 0.288 0.358 0.682 -0.207 0.280
Geometric
Interference
Round Same
Size 0.316 0.238 0.332 0.026 0.228
V Same Size 0.48 0.113 0.339 -0.000 0.233
Round
Descending
Size
0.319 0.161 0.191 -0.081 0.148
Three Expansion
Chambers Placed
in Series
[1=7.6x7.6x20.3
(3x3x8),
2=15.2x15.2x20.3
(6x6x8)]
1,1,2 0.265 0.157 0.041 -0.188 0.069
1,2,1 0.243 -0.087 0.163 -0.469 -0.038
2,1,1 0.133 0.206 -0.1 0.084 0.081
Bell Mouth
Extension Tubes
Intake 0.424 -0.557 -0.063 -0.473 -0.167
Outlet 0.216 0.267 0.013 0.165 0.165
Both Intake
and Outlet 0.618 -0.244 -0.298 0.165 0.060
Back Pressure
Table 7 shows the results from testing the back pressure of the five
different expansion chamber components. It was determined that it
was a combination of the cross-sectional area and volume that
contributed to the backpressure of the expansion chamber. As the
length of a chamber with the same cross-section increases so does the
back pressure.
Table 7. Back pressure for expansion boxes
Chamber Size Back Pressure (psi)
3x3x8 0.14
4x4x4 0.19
4x4x8 0.22
4x4x12 0.3
6x6x8 0.23
Initial Muffler Design
Mufflers implementing the concepts learned from the UISB tests and
flow simulations were designed within SolidWorks. The idea was to
include within the design the muffler components that maximized
sound loss while limiting the back pressure to 16% greater than that
of the 2013 stock muffler. These designs were also restricted to the
size available within the snowmobile chassis. Other areas of
consideration within muffler design beyond performance included
manufacturability and cost of materials.
Design Procedure
The following strategies contributed to the largest reduction in sound:
expansion chambers with larger cross-sectional areas, ordering
expansion volumes from small to large in series, “V”-shaped
geometric interference plates of the same size, extension tubes on the
outlet to chambers, a long internal flow length, and the use of ceramic
fiber sound material. Using this information, the UICSC team
designed six mufflers that were simulated through Solidworks. An
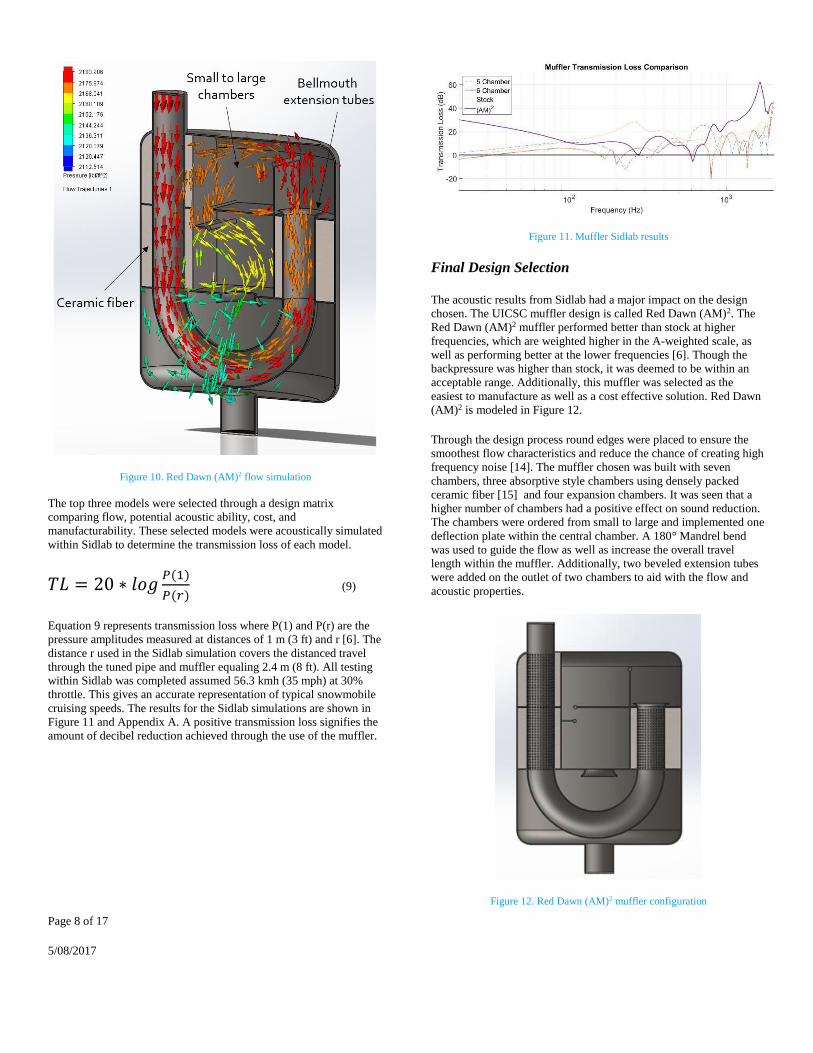
example of one design is seen in Figure 10.
Page 8 of 17
5/08/2017
Figure 10. Red Dawn (AM)2 flow simulation
The top three models were selected through a design matrix
comparing flow, potential acoustic ability, cost, and
manufacturability. These selected models were acoustically simulated
within Sidlab to determine the transmission loss of each model.
𝑇𝐿 = 20 ∗ 𝑙𝑜𝑔𝑃(1)
𝑃(𝑟) (9)
Equation 9 represents transmission loss where P(1) and P(r) are the
pressure amplitudes measured at distances of 1 m (3 ft) and r [6]. The
distance r used in the Sidlab simulation covers the distanced travel
through the tuned pipe and muffler equaling 2.4 m (8 ft). All testing
within Sidlab was completed assumed 56.3 kmh (35 mph) at 30%
throttle. This gives an accurate representation of typical snowmobile
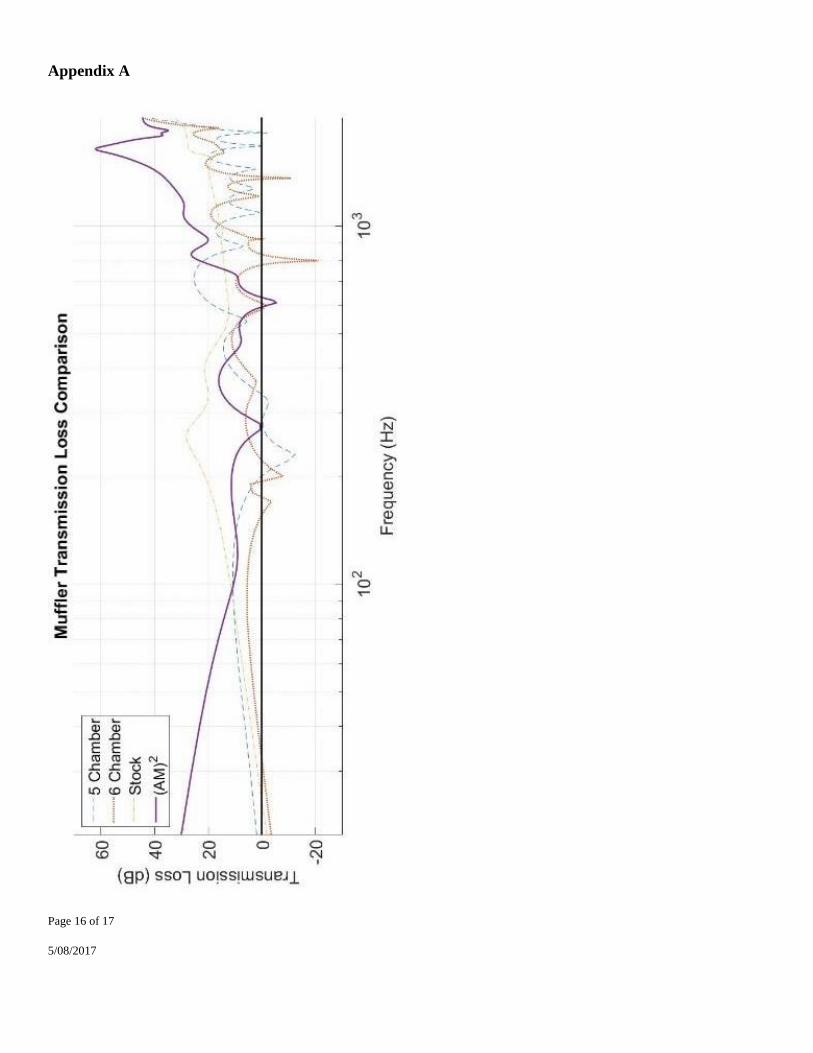
cruising speeds. The results for the Sidlab simulations are shown in
Figure 11 and Appendix A. A positive transmission loss signifies the
amount of decibel reduction achieved through the use of the muffler.
Figure 11. Muffler Sidlab results
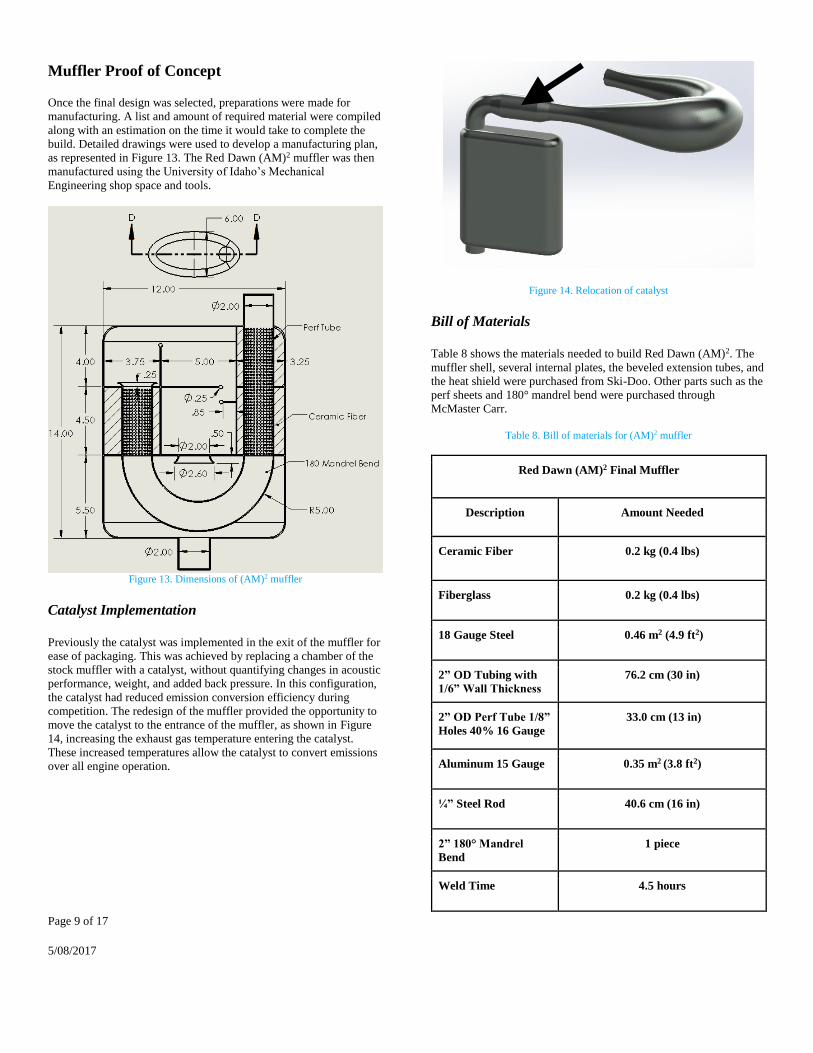
Final Design Selection
The acoustic results from Sidlab had a major impact on the design
chosen. The UICSC muffler design is called Red Dawn (AM)2. The
Red Dawn (AM)2 muffler performed better than stock at higher
frequencies, which are weighted higher in the A-weighted scale, as
well as performing better at the lower frequencies [6]. Though the
backpressure was higher than stock, it was deemed to be within an
acceptable range. Additionally, this muffler was selected as the
easiest to manufacture as well as a cost effective solution. Red Dawn
(AM)2 is modeled in Figure 12.
Through the design process round edges were placed to ensure the
smoothest flow characteristics and reduce the chance of creating high
frequency noise [14]. The muffler chosen was built with seven
chambers, three absorptive style chambers using densely packed
ceramic fiber [15] and four expansion chambers. It was seen that a
higher number of chambers had a positive effect on sound reduction.
The chambers were ordered from small to large and implemented one
deflection plate within the central chamber. A 180° Mandrel bend
was used to guide the flow as well as increase the overall travel
length within the muffler. Additionally, two beveled extension tubes
were added on the outlet of two chambers to aid with the flow and
acoustic properties.
Figure 12. Red Dawn (AM)2 muffler configuration
Page 9 of 17
5/08/2017
Muffler Proof of Concept
Once the final design was selected, preparations were made for
manufacturing. A list and amount of required material were compiled
along with an estimation on the time it would take to complete the
build. Detailed drawings were used to develop a manufacturing plan,
as represented in Figure 13. The Red Dawn (AM)2 muffler was then
manufactured using the University of Idaho’s Mechanical
Engineering shop space and tools.
Figure 13. Dimensions of (AM)2 muffler
Catalyst Implementation
Previously the catalyst was implemented in the exit of the muffler for
ease of packaging. This was achieved by replacing a chamber of the
stock muffler with a catalyst, without quantifying changes in acoustic
performance, weight, and added back pressure. In this configuration,
the catalyst had reduced emission conversion efficiency during
competition. The redesign of the muffler provided the opportunity to
move the catalyst to the entrance of the muffler, as shown in Figure
14, increasing the exhaust gas temperature entering the catalyst.
These increased temperatures allow the catalyst to convert emissions
over all engine operation.
Figure 14. Relocation of catalyst
Bill of Materials
Table 8 shows the materials needed to build Red Dawn (AM)2. The
muffler shell, several internal plates, the beveled extension tubes, and
the heat shield were purchased from Ski-Doo. Other parts such as the
perf sheets and 180° mandrel bend were purchased through
McMaster Carr.
Table 8. Bill of materials for (AM)2 muffler
Red Dawn (AM)2 Final Muffler
Description Amount Needed
Ceramic Fiber 0.2 kg (0.4 lbs)
Fiberglass 0.2 kg (0.4 lbs)
18 Gauge Steel 0.46 m2 (4.9 ft2)
2” OD Tubing with
1/6” Wall Thickness
76.2 cm (30 in)
2” OD Perf Tube 1/8”
Holes 40% 16 Gauge
33.0 cm (13 in)
Aluminum 15 Gauge 0.35 m2 (3.8 ft2)
¼” Steel Rod 40.6 cm (16 in)
2” 180° Mandrel
Bend
1 piece
Weld Time 4.5 hours
Page 10 of 17
5/08/2017
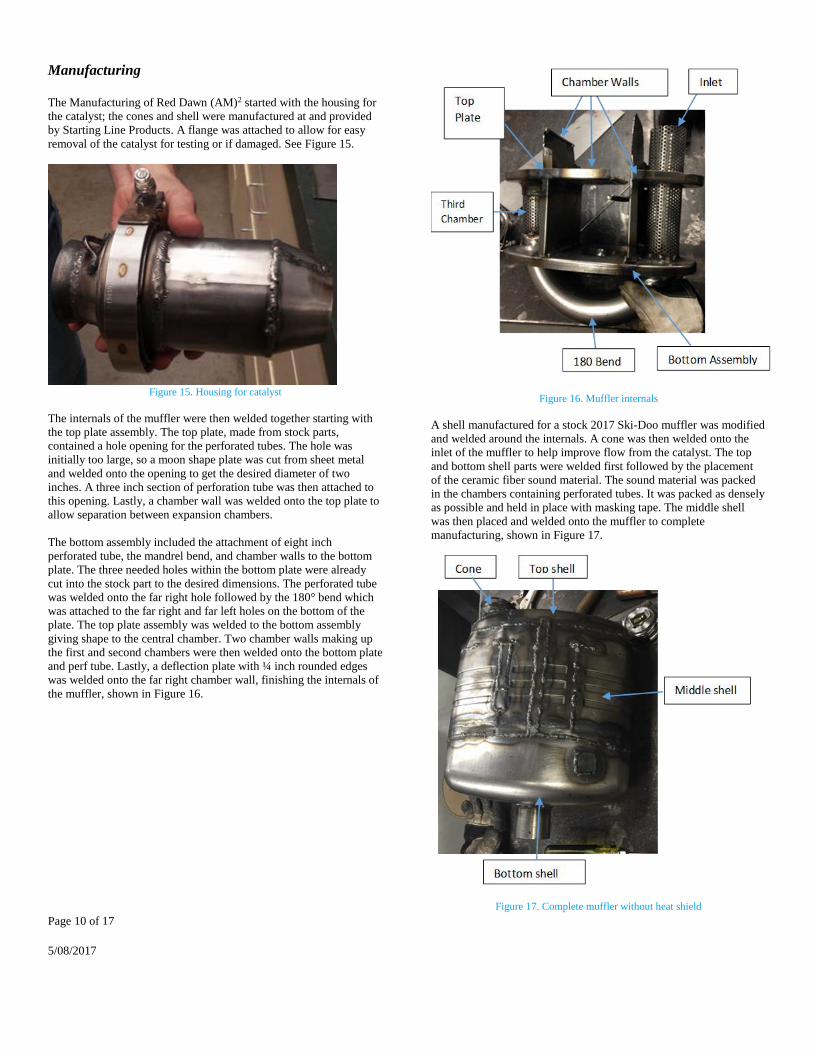
Manufacturing
The Manufacturing of Red Dawn (AM)2 started with the housing for
the catalyst; the cones and shell were manufactured at and provided
by Starting Line Products. A flange was attached to allow for easy
removal of the catalyst for testing or if damaged. See Figure 15.
Figure 15. Housing for catalyst
The internals of the muffler were then welded together starting with
the top plate assembly. The top plate, made from stock parts,
contained a hole opening for the perforated tubes. The hole was
initially too large, so a moon shape plate was cut from sheet metal
and welded onto the opening to get the desired diameter of two
inches. A three inch section of perforation tube was then attached to
this opening. Lastly, a chamber wall was welded onto the top plate to
allow separation between expansion chambers.
The bottom assembly included the attachment of eight inch
perforated tube, the mandrel bend, and chamber walls to the bottom
plate. The three needed holes within the bottom plate were already
cut into the stock part to the desired dimensions. The perforated tube
was welded onto the far right hole followed by the 180° bend which
was attached to the far right and far left holes on the bottom of the
plate. The top plate assembly was welded to the bottom assembly
giving shape to the central chamber. Two chamber walls making up
the first and second chambers were then welded onto the bottom plate
and perf tube. Lastly, a deflection plate with ¼ inch rounded edges
was welded onto the far right chamber wall, finishing the internals of
the muffler, shown in Figure 16.
Figure 16. Muffler internals
A shell manufactured for a stock 2017 Ski-Doo muffler was modified
and welded around the internals. A cone was then welded onto the
inlet of the muffler to help improve flow from the catalyst. The top
and bottom shell parts were welded first followed by the placement
of the ceramic fiber sound material. The sound material was packed
in the chambers containing perforated tubes. It was packed as densely
as possible and held in place with masking tape. The middle shell
was then placed and welded onto the muffler to complete
manufacturing, shown in Figure 17.
Figure 17. Complete muffler without heat shield
Page 11 of 17
5/08/2017
The catalyst housing was then mounted onto the muffler inlet with a
Marman clamp to insure a complete seal and placed in chassis to
ensure final placement. Figure 18 shows Red Dawn (AM)2 in chassis.
Figure 18. Muffler in chassis leak test
Lastly, ¼ inch fiberglass matting and an aluminum heat shield, from
Ski-Doo, were measured and placed around the muffler to give it
additional protection, robustness, and aesthetics. This shield was very
important for the protection of snowmobile chassis components
including the side panels, oil well, and wiring harness. The final
product is shown in Figure 19.
Figure 19. Complete muffler with heat shield
Validation
Validation of Red Dawn (AM)2 was needed before it could be used
by the UICSC team for the CSC competition. This included
validation of acoustic ability, back pressure, and performance on
chassis.
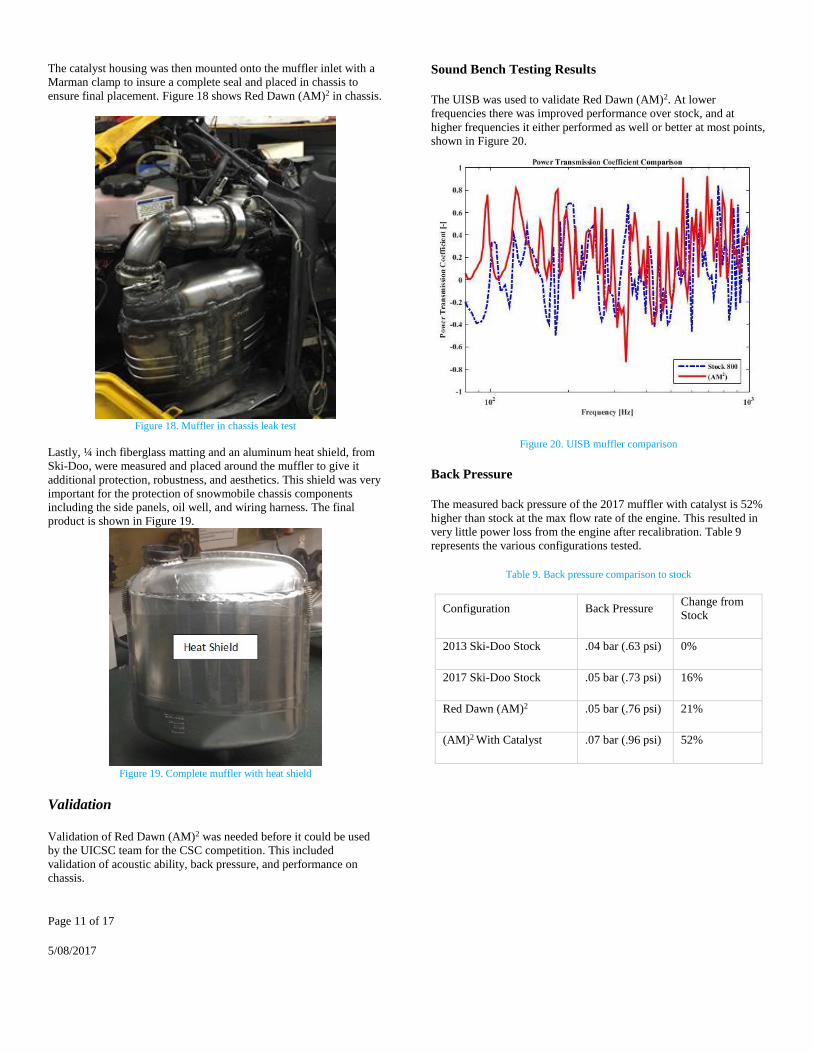
Sound Bench Testing Results
The UISB was used to validate Red Dawn (AM)2. At lower
frequencies there was improved performance over stock, and at
higher frequencies it either performed as well or better at most points,
shown in Figure 20.
Figure 20. UISB muffler comparison
Back Pressure
The measured back pressure of the 2017 muffler with catalyst is 52%
higher than stock at the max flow rate of the engine. This resulted in
very little power loss from the engine after recalibration. Table 9
represents the various configurations tested.
Table 9. Back pressure comparison to stock
Configuration Back Pressure Change from
Stock
2013 Ski-Doo Stock .04 bar (.63 psi) 0%
2017 Ski-Doo Stock .05 bar (.73 psi) 16%
Red Dawn (AM)2 .05 bar (.76 psi) 21%
(AM)2 With Catalyst .07 bar (.96 psi) 52%
Page 12 of 17
5/08/2017
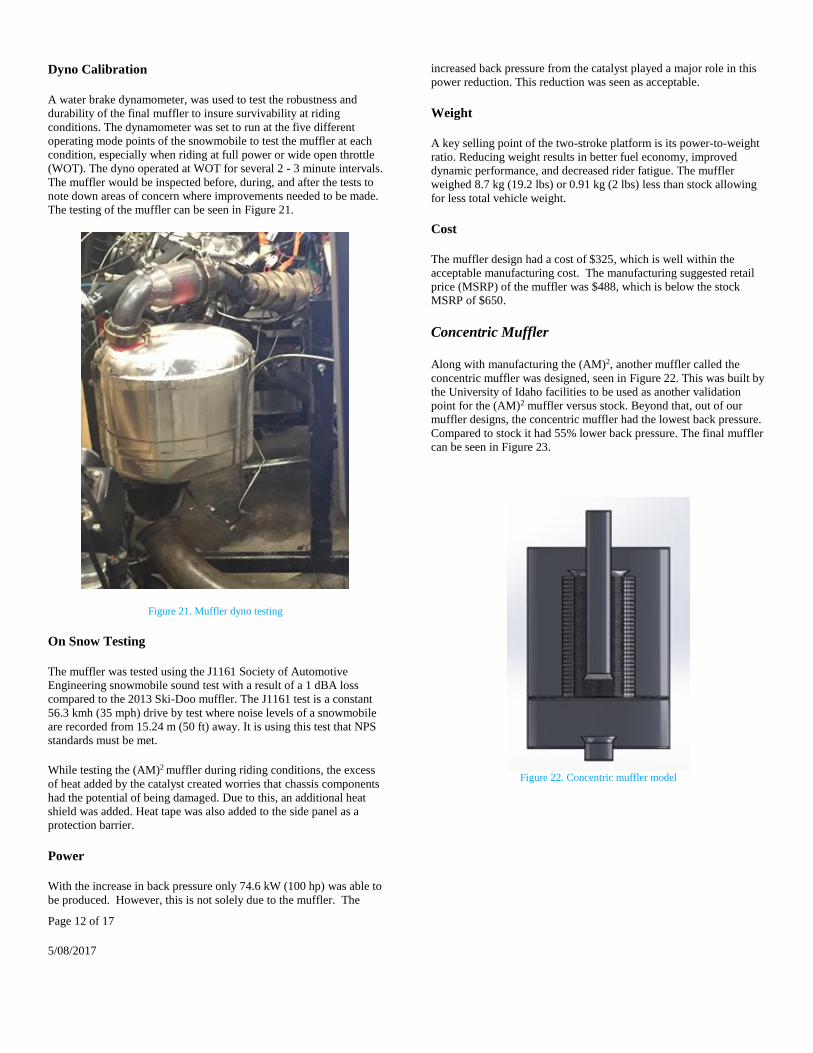
Dyno Calibration
A water brake dynamometer, was used to test the robustness and
durability of the final muffler to insure survivability at riding
conditions. The dynamometer was set to run at the five different
operating mode points of the snowmobile to test the muffler at each
condition, especially when riding at full power or wide open throttle
(WOT). The dyno operated at WOT for several 2 - 3 minute intervals.
The muffler would be inspected before, during, and after the tests to
note down areas of concern where improvements needed to be made.
The testing of the muffler can be seen in Figure 21.
Figure 21. Muffler dyno testing
On Snow Testing
The muffler was tested using the J1161 Society of Automotive
Engineering snowmobile sound test with a result of a 1 dBA loss
compared to the 2013 Ski-Doo muffler. The J1161 test is a constant
56.3 kmh (35 mph) drive by test where noise levels of a snowmobile
are recorded from 15.24 m (50 ft) away. It is using this test that NPS
standards must be met.
While testing the (AM)2 muffler during riding conditions, the excess
of heat added by the catalyst created worries that chassis components
had the potential of being damaged. Due to this, an additional heat
shield was added. Heat tape was also added to the side panel as a
protection barrier.
Power
With the increase in back pressure only 74.6 kW (100 hp) was able to
be produced. However, this is not solely due to the muffler. The
increased back pressure from the catalyst played a major role in this
power reduction. This reduction was seen as acceptable.
Weight
A key selling point of the two-stroke platform is its power-to-weight
ratio. Reducing weight results in better fuel economy, improved
dynamic performance, and decreased rider fatigue. The muffler
weighed 8.7 kg (19.2 lbs) or 0.91 kg (2 lbs) less than stock allowing
for less total vehicle weight.
Cost
The muffler design had a cost of $325, which is well within the
acceptable manufacturing cost. The manufacturing suggested retail
price (MSRP) of the muffler was $488, which is below the stock
MSRP of $650.
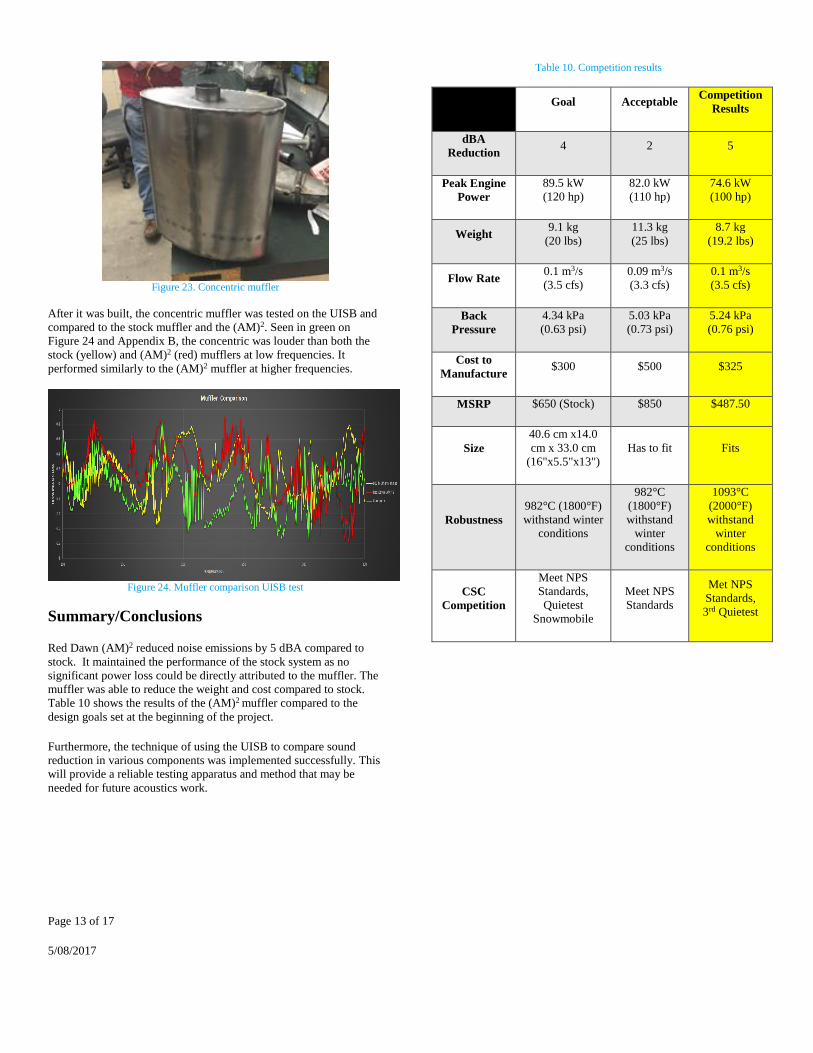
Concentric Muffler
Along with manufacturing the (AM)2, another muffler called the
concentric muffler was designed, seen in Figure 22. This was built by
the University of Idaho facilities to be used as another validation
point for the (AM)2 muffler versus stock. Beyond that, out of our
muffler designs, the concentric muffler had the lowest back pressure.
Compared to stock it had 55% lower back pressure. The final muffler
can be seen in Figure 23.
Figure 22. Concentric muffler model
Page 13 of 17
5/08/2017
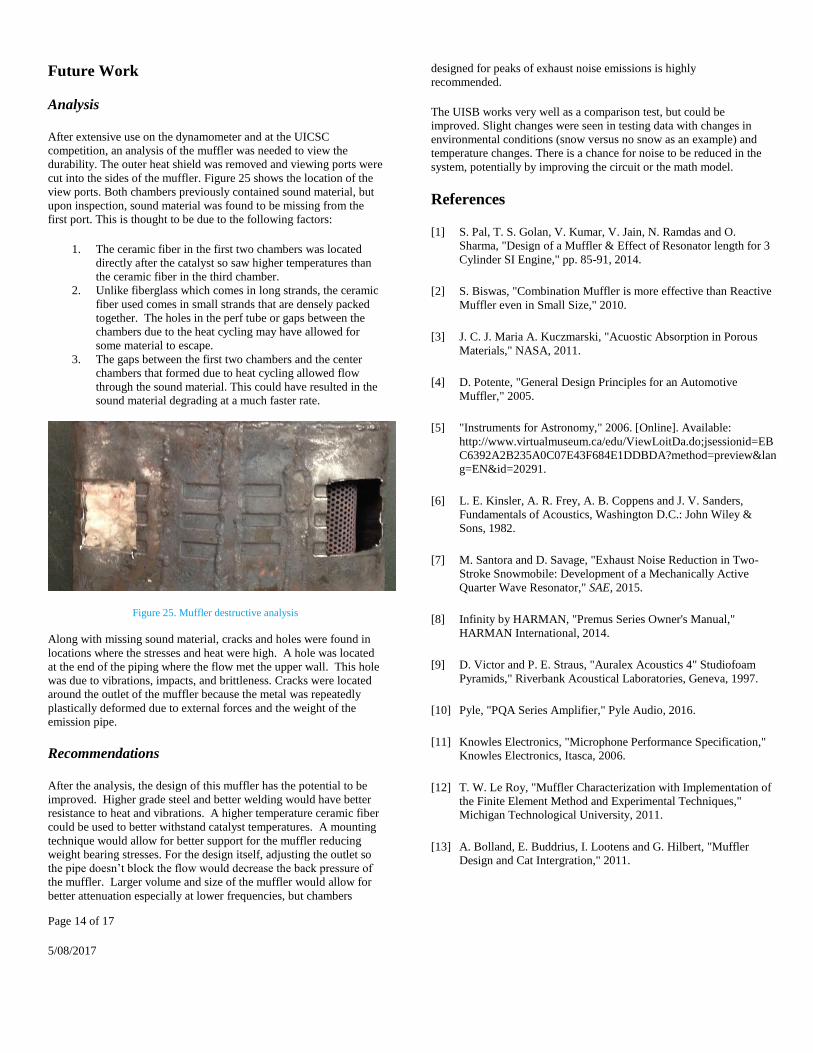
Figure 23. Concentric muffler
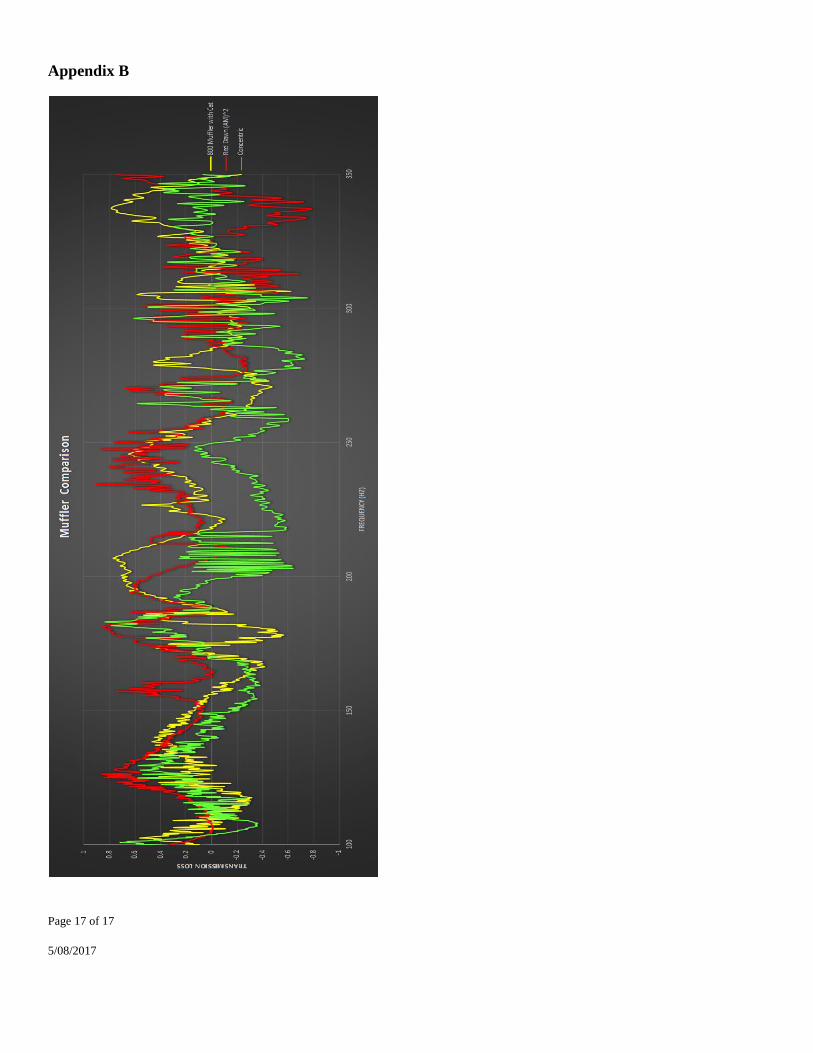
After it was built, the concentric muffler was tested on the UISB and
compared to the stock muffler and the (AM)2. Seen in green on
Figure 24 and Appendix B, the concentric was louder than both the
stock (yellow) and (AM)2 (red) mufflers at low frequencies. It
performed similarly to the (AM)2 muffler at higher frequencies.
Figure 24. Muffler comparison UISB test
Summary/Conclusions
Red Dawn (AM)2 reduced noise emissions by 5 dBA compared to
stock. It maintained the performance of the stock system as no
significant power loss could be directly attributed to the muffler. The
muffler was able to reduce the weight and cost compared to stock.
Table 10 shows the results of the (AM)2 muffler compared to the
design goals set at the beginning of the project.
Furthermore, the technique of using the UISB to compare sound
reduction in various components was implemented successfully. This
will provide a reliable testing apparatus and method that may be
needed for future acoustics work.
Table 10. Competition results
Goal Acceptable Competition
Results
dBA
Reduction 4 2 5
Peak Engine
Power
89.5 kW
(120 hp)
82.0 kW
(110 hp)
74.6 kW
(100 hp)
Weight 9.1 kg
(20 lbs)
11.3 kg
(25 lbs)
8.7 kg
(19.2 lbs)
Flow Rate 0.1 m3/s
(3.5 cfs)
0.09 m3/s
(3.3 cfs)
0.1 m3/s
(3.5 cfs)
Back
Pressure
4.34 kPa
(0.63 psi)
5.03 kPa
(0.73 psi)
5.24 kPa
(0.76 psi)
Cost to
Manufacture $300 $500 $325
MSRP $650 (Stock) $850 $487.50
Size
40.6 cm x14.0
cm x 33.0 cm
(16"x5.5"x13")
Has to fit Fits
Robustness
982°C (1800°F)
withstand winter
conditions
982°C
(1800°F)
withstand
winter
conditions
1093°C
(2000°F)
withstand
winter
conditions
CSC
Competition
Meet NPS
Standards,
Quietest
Snowmobile
Meet NPS
Standards
Met NPS
Standards,
3rd Quietest
Page 14 of 17
5/08/2017
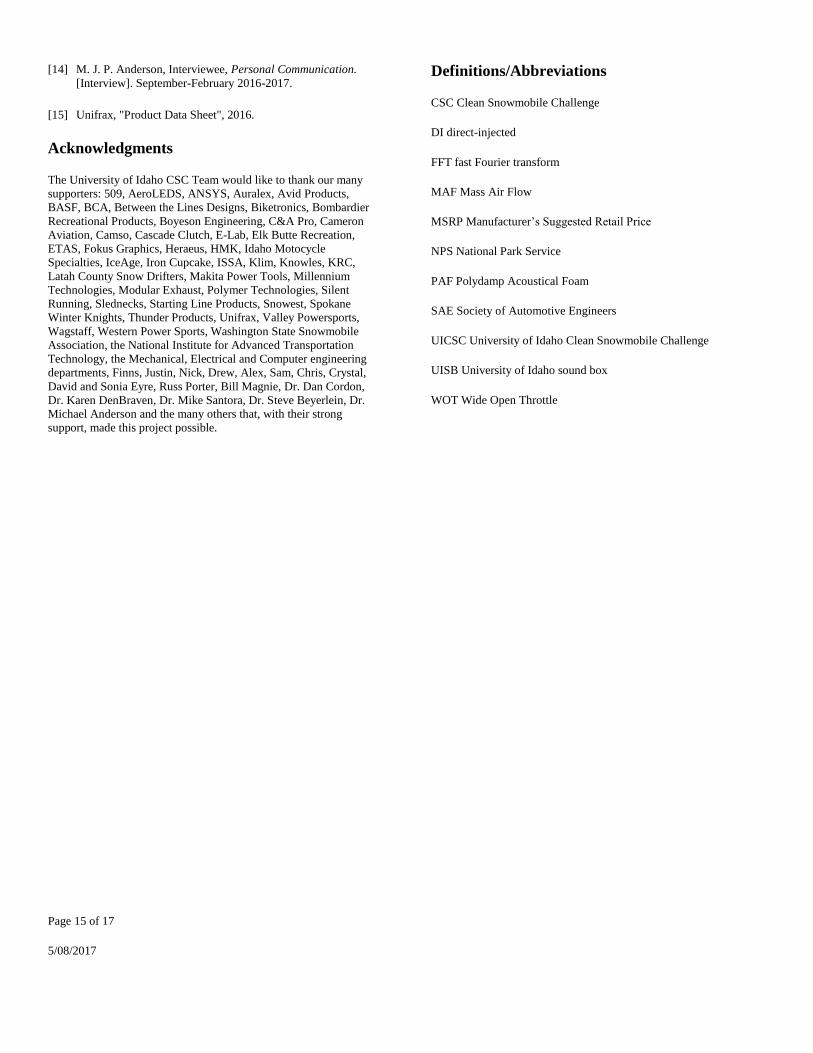
Future Work
Analysis
After extensive use on the dynamometer and at the UICSC
competition, an analysis of the muffler was needed to view the
durability. The outer heat shield was removed and viewing ports were
cut into the sides of the muffler. Figure 25 shows the location of the
view ports. Both chambers previously contained sound material, but
upon inspection, sound material was found to be missing from the
first port. This is thought to be due to the following factors:
1. The ceramic fiber in the first two chambers was located
directly after the catalyst so saw higher temperatures than
the ceramic fiber in the third chamber.
2. Unlike fiberglass which comes in long strands, the ceramic
fiber used comes in small strands that are densely packed
together. The holes in the perf tube or gaps between the
chambers due to the heat cycling may have allowed for
some material to escape.
3. The gaps between the first two chambers and the center
chambers that formed due to heat cycling allowed flow
through the sound material. This could have resulted in the
sound material degrading at a much faster rate.
Figure 25. Muffler destructive analysis
Along with missing sound material, cracks and holes were found in
locations where the stresses and heat were high. A hole was located
at the end of the piping where the flow met the upper wall. This hole
was due to vibrations, impacts, and brittleness. Cracks were located
around the outlet of the muffler because the metal was repeatedly
plastically deformed due to external forces and the weight of the
emission pipe.
Recommendations
After the analysis, the design of this muffler has the potential to be
improved. Higher grade steel and better welding would have better
resistance to heat and vibrations. A higher temperature ceramic fiber
could be used to better withstand catalyst temperatures. A mounting
technique would allow for better support for the muffler reducing
weight bearing stresses. For the design itself, adjusting the outlet so
the pipe doesn’t block the flow would decrease the back pressure of
the muffler. Larger volume and size of the muffler would allow for
better attenuation especially at lower frequencies, but chambers
designed for peaks of exhaust noise emissions is highly
recommended.
The UISB works very well as a comparison test, but could be
improved. Slight changes were seen in testing data with changes in
environmental conditions (snow versus no snow as an example) and
temperature changes. There is a chance for noise to be reduced in the
system, potentially by improving the circuit or the math model.
References
[1] S. Pal, T. S. Golan, V. Kumar, V. Jain, N. Ramdas and O.
Sharma, "Design of a Muffler & Effect of Resonator length for 3
Cylinder SI Engine," pp. 85-91, 2014.
[2] S. Biswas, "Combination Muffler is more effective than Reactive
Muffler even in Small Size," 2010.
[3] J. C. J. Maria A. Kuczmarski, "Acuostic Absorption in Porous
Materials," NASA, 2011.
[4] D. Potente, "General Design Principles for an Automotive
Muffler," 2005.
[5] "Instruments for Astronomy," 2006. [Online]. Available:
http://www.virtualmuseum.ca/edu/ViewLoitDa.do;jsessionid=EB
C6392A2B235A0C07E43F684E1DDBDA?method=preview&lan
g=EN&id=20291.
[6] L. E. Kinsler, A. R. Frey, A. B. Coppens and J. V. Sanders,
Fundamentals of Acoustics, Washington D.C.: John Wiley &
Sons, 1982.
[7] M. Santora and D. Savage, "Exhaust Noise Reduction in Two-
Stroke Snowmobile: Development of a Mechanically Active
Quarter Wave Resonator," SAE, 2015.
[8] Infinity by HARMAN, "Premus Series Owner's Manual,"
HARMAN International, 2014.
[9] D. Victor and P. E. Straus, "Auralex Acoustics 4" Studiofoam
Pyramids," Riverbank Acoustical Laboratories, Geneva, 1997.
[10] Pyle, "PQA Series Amplifier," Pyle Audio, 2016.
[11] Knowles Electronics, "Microphone Performance Specification,"
Knowles Electronics, Itasca, 2006.
[12] T. W. Le Roy, "Muffler Characterization with Implementation of
the Finite Element Method and Experimental Techniques,"
Michigan Technological University, 2011.
[13] A. Bolland, E. Buddrius, I. Lootens and G. Hilbert, "Muffler
Design and Cat Intergration," 2011.
Page 15 of 17
5/08/2017
[14] M. J. P. Anderson, Interviewee, Personal Communication.
[Interview]. September-February 2016-2017.
[15] Unifrax, "Product Data Sheet", 2016.
Acknowledgments
The University of Idaho CSC Team would like to thank our many
supporters: 509, AeroLEDS, ANSYS, Auralex, Avid Products,
BASF, BCA, Between the Lines Designs, Biketronics, Bombardier
Recreational Products, Boyeson Engineering, C&A Pro, Cameron
Aviation, Camso, Cascade Clutch, E-Lab, Elk Butte Recreation,
ETAS, Fokus Graphics, Heraeus, HMK, Idaho Motocycle
Specialties, IceAge, Iron Cupcake, ISSA, Klim, Knowles, KRC,
Latah County Snow Drifters, Makita Power Tools, Millennium
Technologies, Modular Exhaust, Polymer Technologies, Silent
Running, Slednecks, Starting Line Products, Snowest, Spokane
Winter Knights, Thunder Products, Unifrax, Valley Powersports,
Wagstaff, Western Power Sports, Washington State Snowmobile
Association, the National Institute for Advanced Transportation
Technology, the Mechanical, Electrical and Computer engineering
departments, Finns, Justin, Nick, Drew, Alex, Sam, Chris, Crystal,
David and Sonia Eyre, Russ Porter, Bill Magnie, Dr. Dan Cordon,
Dr. Karen DenBraven, Dr. Mike Santora, Dr. Steve Beyerlein, Dr.
Michael Anderson and the many others that, with their strong
support, made this project possible.
Definitions/Abbreviations
CSC Clean Snowmobile Challenge
DI direct-injected
FFT fast Fourier transform
MAF Mass Air Flow
MSRP Manufacturer’s Suggested Retail Price
NPS National Park Service
PAF Polydamp Acoustical Foam
SAE Society of Automotive Engineers
UICSC University of Idaho Clean Snowmobile Challenge
UISB University of Idaho sound box
WOT Wide Open Throttle
Page 16 of 17
5/08/2017
Appendix A
Page 17 of 17
5/08/2017
Appendix B


![[Challenge:Future] mindworks: Make.it.WORK](https://img.pdfslide.us/doc/110x75/58edfff11a28ab820a8b45e7/challengefuture-mindworks-makeitwork.jpg)