Embed Size (px)
Citation preview

IEEE SENSORS JOURNAL, VOL. XX, NO. XX, MONTH X, XXXX 1
XXXX-XXXX © XXXX IEEE. Personal use is permitted, but republication/redistribution requires IEEE permission. See http://www.ieee.org/publications_standards/publications/rights/index.html for more information.
Abstract— A novel Kinetic Energy Harvester (KEH) has been
developed for powering oceanic undrogued drifters. It consists on a double pendulum system capable of transforming the wave oscillations into rotation on a flywheel. This rotation is converted into DC current by an electrical generator and further processed by a power management unit (PMU). The PMU includes a “maximum power point tracking” system to maximize energy production by the generator. An oceanic drifter has also been designed to embed the KEH and a custom-made measurement system to perform real sea tests. It counts on an Inertial Measurement Unit to study the motion of the drifter and an embedded measurement system to estimate the rotation speed of the generator and the power at both the input and output of the PMU. A Wi-Fi connection is also included for data transfer at short distances. The generator was firstly characterized at the laboratory; the drifter was then placed on a linear shaker to assess its performance. Finally, the drifter was deployed in a controlled sea area with average values of wave height and frequency of 1.43 m and 0.29 Hz, respectively. In these conditions, the drifter showed horizontal and vertical oscillations with peak-to-peak accelerations of 0.8 g and power spectra centered around 1.5 Hz and 1 Hz, respectively. As a result, the KEH generated a mean output power of 0.18 mW, with peaks of 2.5 mW.
Index Terms— Lagrangian Drifter, Natural Frequency, Kinetic Energy Harvester (KEH), Microgenerator, Power Management Unit (PMU), Maximum Power Point Tracking (MPPT).
I. Introduction
HE scientific community requirements related to oceanographic data availability are growing fast. Oceans
and seas must be monitored to preserve their biodiversity and to predict their evolution. This means that huge amounts of data from a very wide range of sensors should be acquired and delivered as fast as possible. Research vessels collecting data from the ocean during long periods are not suited for this task due to their high-cost [1]. As a consequence, cabled observatories, gliders, profiling floats and long-term moorings are taking their place and are delivering enormous amounts of
Manuscript submitted November 30, 2019; revised February 2, 2020; accepted February 23, 2020. Date of publication …, 2020; date of current version February 2, 2020. This work was supported by the project MELOA from the European Commission’s Horizon 2020 research and Innovation program under Grant Agreement No. 776280 and by the Spanish Ministry of Economy and Competitiveness and the European Regional Development Fund under project TEC2016-76991-P. The first author has a grant from the Secretariat of Universities and Research of the Ministry of Business and Knowledge of the Government of Catalonia on the FI program (ref. BDNS 362582).
This work is an extended version of 10.1109/I2MTC.2019.8826996, presented at I2MTC 2019 in Auckland, New Zeeland, and of 10.1109/OCEANSE.2019.8867143, presented at OCEANS 2019 in Marseille, France.
M. Carandell, D. T. Mihai, M. Carbonell and J. del Río are with the SARTI Research Group of the Electronics Engineering Department, Universitat Politècnica de Catalunya, Spain (e-mail: [email protected]). M. Gasulla is with the e-CAT Research Group of the Electronics Engineering Department, Universitat Politècnica de Catalunya, Spain.
real or near-real time data to the scientific community [2], [3]. Other ocean platforms that collect data are Lagrangian drifters, which are autonomous floating passive devices that provide oceanographic surface data. They are low-cost, versatile and easy-deployable marine instrumentation used in climate research, oil spill tracking, or search and rescue operations.
A wide range of commercial drifters can be found in the market. Basic drifters offer ocean current tracking and near surface temperature, but growing science requirements are pushing their evolution. Consequently, some of them can now be found with Acoustic Doppler Current Profilers (ADCP), salinity sensors, or weather stations [4], [5]. Drifters use wireless GSM-based communications, in near-shore deployments, or satellite-based (mostly Iridium-based [6]) for off-shore communications.
As described by Lumpkin et al. [6], power autonomy is one of the main challenges in the evolution of drifters. Depending on the instruments carried and the sampling period of the units, their lifespan may vary from hours up to a few years when powered from primary batteries. To extend their autonomy, some manufacturers include photovoltaic (PV) panels around the drifters’ case, achieving unlimited lifespan at some low transmitting interval and favorable solar conditions (Sofar: Spotter, Fastwave: Voyager Solar). Nevertheless, if the drifter is strictly dedicated to current monitoring, its body should be mostly submerged to avoid the wind effect [7] and, thus, the irradiation at the panels is attenuated. Also, in many oceanic regions solar irradiation is
Design and Testing of a Kinetic Energy Harvester Embedded into an Oceanic Drifter
Matias Carandell, Daniel Mihai Toma, Montserrat Carbonell, Joaquín del Río, Member, IEEE, and Manel Gasulla, Senior Member, IEEE
T

2 IEEE SENSORS JOURNAL, VOL. XX, NO. XX, MONTH X, XXXX
low during some periods of the year. For this reason, other energy sources may be explored, such as the oscillatory movement of waves.
Previous works have shown many harvesting possibilities from kinetic sources in marine environments [8], [9]. Inertia-based harvesters are one of the main solutions for low-power, non-anchored oceanic devices, which is the case of drifters, and they can be further classified as gyroscopic or pendulum systems [10]. Ding et al. have proposed pendulum-type harvesters for underwater gliders [11] and mooring platforms [12]. These medium size and weight systems (1500 cm3 - 5 kg) were tested on a Stewart platform at the laboratory, reporting average power production of hundreds of milliwatts. However, power was directly measured across a load resistor without using a power management unit (PMU), which is normally used to power the electronic sensors. In addition, no sea tests were performed. Li et al. designed a small size and weight (630 cm3 - 0.3 kg) pendulum harvester for non-anchored floating platforms such as ocean buoys [13], which is more aligned with the objective of our work. In the laboratory tests, the harvester included a PMU to charge a 50 mAh rechargeable lithium battery that could be used to power the sensors. However, the PMU and the battery were not present during the sea test, in which only the AC open circuit voltage at the output of the harvester was measured by an embedded system. They reported a maximum peak-to-peak voltage of 15.9V and from it they inferred a maximum peak output power of 130 mW.
This paper continues and extends two previous works. A first design of a Kinetic Energy Harvester (KEH) system for spherical oceanic drifters was presented in [14], including a preliminary characterization of the electrical generator and the PMU followed by first results of the prototype when located in an anchored buoy placed on a water tank. Later, in [15], an improved version of the KEH device was presented, as well as a first approach of a specially designed oceanic drifter for testing purposes. An Inertial Measurement Unit (IMU) placed inside the drifter allowed to obtain its dynamic behavior and determine the natural frequency of its motion when placed at sea. However, no power data of the KEH system were produced. In this work, the acquisition setup has been updated to gather that data as well as the rotation speed of the generator during the drifter’s deployment at sea. In addition, the electrical generator has been replaced by a more rugged and reliable one.
The main objective of this paper is to present a novel small-size KEH device and its ensuing PMU, as well as to validate their functionality and performance in a spherical test drifter in a real environment. To assess the performance, an embedded
system was designed to measure the drifter motion, rotation speed of the generator and input and output power of the PMU. Data were sent wirelessly to a nearby point. Simulations were also performed for the drifter motion. These are important advances so far not fully achieved by previous studies. The paper is organized as follows. First, the KEH system is described in section II. Section III describes the test drifter. Section IV presents the materials and method used to obtain the simulation and experimental data, which are summarized and discussed in section V. Finally, section VI concludes the work.
II. KINETIC ENERGY HARVESTING SYSTEM
A KEH system can be structured as shown in Fig. 1 [16]. First, a KEH device, in which a mechanical converter transforms the waves’ oscillation into DC current. Secondly, an Energy Storage Element (ESE), which handles the power variability from both the KEH device and the drifter, e.g. the load; so, it either gathers energy when the KEH device produces more power than required or provides energy to the load in the opposite case. Thirdly, a PMU, an electronic system that fits the generated power to the power supply requirement of the load and which oversees the power flow control. The three are fully described below.
A. KEH Device
Harvesting the energy from the waves at non-anchored autonomous devices is usually done by inertial systems. These systems rely on a proof mass which moves in relation to the main body thanks to the excitation of the waves. That relative motion drives an electrical generator which converts the energy from mechanical to electrical. The harvested energy depends on the physical characteristics of the harvester, achieving higher power levels with higher sizes and weights. Also, this energy is directly proportional to the wave frequency and amplitude [17].
Recently, a first prototype of an inertial KEH device was designed and manufactured [14], which is a mixture of gyroscopic and pendulum systems. It consists of three gyroscopic arms which capture the oscillation induced by waves and transforms it into rotation in a DC generator. In this work, a modified version of the KEH device, previously presented in [15], is used. Fig. 2 shows a 3D model of the design with the description of the different parts. Relative to
ESE
KEH device
LOAD
KEH System
PMU
MPPT Storage control Voltage Supply
Fig. 1. Kinetic Energy Harvesting (KEH) system composed by the KEHdevice, the Power Management Unit (PMU) and the Energy StorageElement (ESE). The Load represents the remaining drifter electronics.
Gear System
Proof mass
Main Body
Pendulum arm
Flywheel
Electrical generator
Fig. 2. Architecture of the proposed KEH device with the description ofthe different parts.
M. Carandell et al.: Design and Testing of a Kinetic Energy Harvester Embedded into an Oceanic Drifter 3
the device introduced in [14], the three gyroscopic arms have been replaced by an articulated pendulum arm with a proof mass. This way, the design of the KEH device is simplified and its size is reduced, thus increasing its power density. The proof mass moves relatively to the drifter with pendulum motion. Then, through a gear system, energy is accumulated in a flying wheel which drives a DC electrical generator. The gear system also increases the rotation velocity with a positive ratio of 35 and, thanks to a one-way gear mechanism, the flying wheel only rotates in one angular direction, at which energy is accumulated.
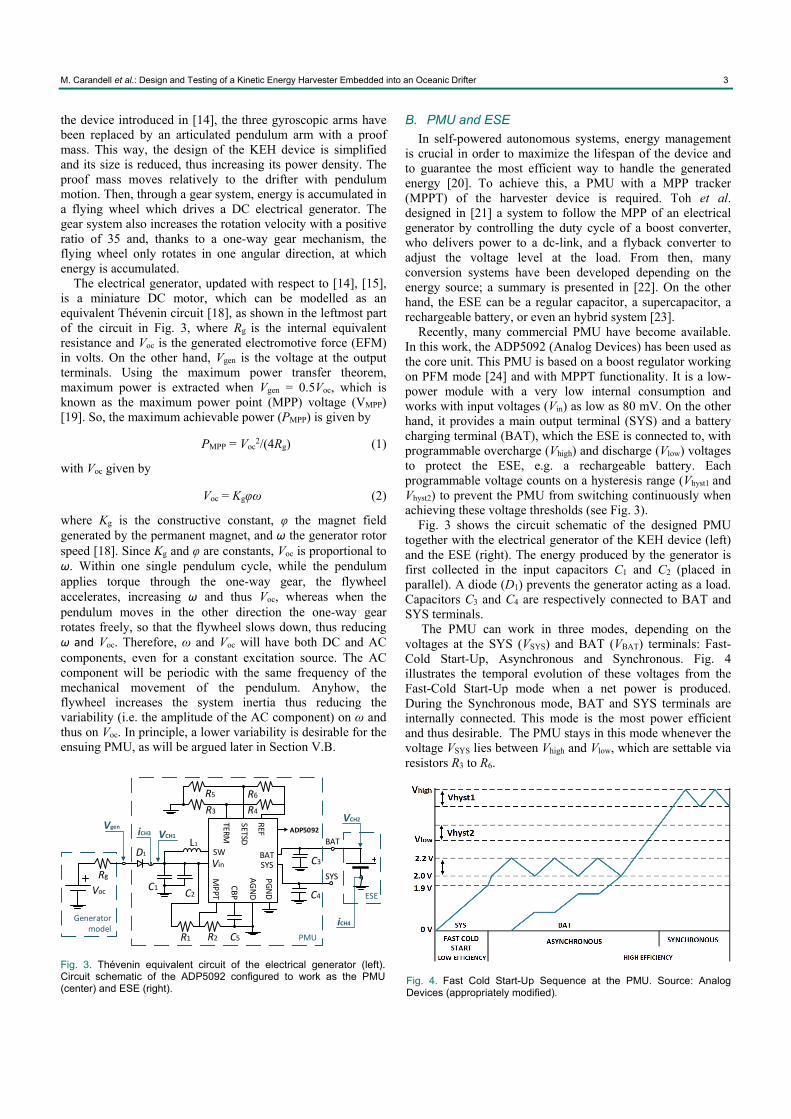
The electrical generator, updated with respect to [14], [15], is a miniature DC motor, which can be modelled as an equivalent Thévenin circuit [18], as shown in the leftmost part of the circuit in Fig. 3, where Rg is the internal equivalent resistance and Voc is the generated electromotive force (EFM) in volts. On the other hand, Vgen is the voltage at the output terminals. Using the maximum power transfer theorem, maximum power is extracted when Vgen = 0.5Voc, which is known as the maximum power point (MPP) voltage (VMPP) [19]. So, the maximum achievable power (PMPP) is given by
PMPP = Voc2/(4Rg) (1)
with Voc given by
Voc = Kgφω (2)
where Kg is the constructive constant, φ the magnet field generated by the permanent magnet, and ω the generator rotor speed [18]. Since Kg and φ are constants, Voc is proportional to ω. Within one single pendulum cycle, while the pendulum applies torque through the one-way gear, the flywheel accelerates, increasing ω and thus Voc, whereas when the pendulum moves in the other direction the one-way gear rotates freely, so that the flywheel slows down, thus reducing ω and Voc. Therefore, ω and Voc will have both DC and AC components, even for a constant excitation source. The AC component will be periodic with the same frequency of the mechanical movement of the pendulum. Anyhow, the flywheel increases the system inertia thus reducing the variability (i.e. the amplitude of the AC component) on ω and thus on Voc. In principle, a lower variability is desirable for the ensuing PMU, as will be argued later in Section V.B.
B. PMU and ESE
In self-powered autonomous systems, energy management is crucial in order to maximize the lifespan of the device and to guarantee the most efficient way to handle the generated energy [20]. To achieve this, a PMU with a MPP tracker (MPPT) of the harvester device is required. Toh et al. designed in [21] a system to follow the MPP of an electrical generator by controlling the duty cycle of a boost converter, who delivers power to a dc-link, and a flyback converter to adjust the voltage level at the load. From then, many conversion systems have been developed depending on the energy source; a summary is presented in [22]. On the other hand, the ESE can be a regular capacitor, a supercapacitor, a rechargeable battery, or even an hybrid system [23].
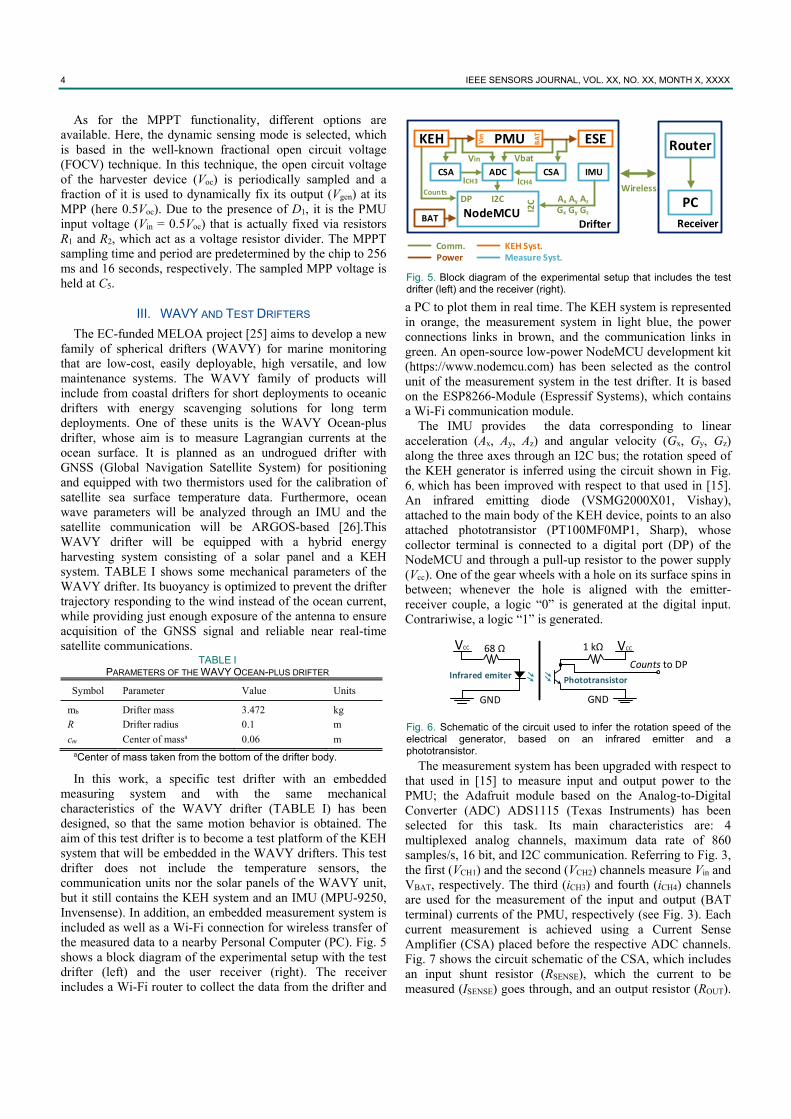
Recently, many commercial PMU have become available. In this work, the ADP5092 (Analog Devices) has been used as the core unit. This PMU is based on a boost regulator working on PFM mode [24] and with MPPT functionality. It is a low-power module with a very low internal consumption and works with input voltages (Vin) as low as 80 mV. On the other hand, it provides a main output terminal (SYS) and a battery charging terminal (BAT), which the ESE is connected to, with programmable overcharge (Vhigh) and discharge (Vlow) voltages to protect the ESE, e.g. a rechargeable battery. Each programmable voltage counts on a hysteresis range (Vhyst1 and Vhyst2) to prevent the PMU from switching continuously when achieving these voltage thresholds (see Fig. 3).
Fig. 3 shows the circuit schematic of the designed PMU together with the electrical generator of the KEH device (left) and the ESE (right). The energy produced by the generator is first collected in the input capacitors C1 and C2 (placed in parallel). A diode (D1) prevents the generator acting as a load. Capacitors C3 and C4 are respectively connected to BAT and SYS terminals.
The PMU can work in three modes, depending on the voltages at the SYS (VSYS) and BAT (VBAT) terminals: Fast-Cold Start-Up, Asynchronous and Synchronous. Fig. 4 illustrates the temporal evolution of these voltages from the Fast-Cold Start-Up mode when a net power is produced. During the Synchronous mode, BAT and SYS terminals are internally connected. This mode is the most power efficient and thus desirable. The PMU stays in this mode whenever the voltage VSYS lies between Vhigh and Vlow, which are settable via resistors R3 to R6.
R6R5
R4R3
BAT
C3
C4
SYS
R2 C5
C2C1
D1
PMU
ESE
VCH1
VCH2
iCH3
iCH4Generator model
Rg
Voc
Vgen
R1
REF
SETSD
TERM
PGND
Vin
MPPT
AGND
CBP
BATSYS
ADP5092
SWL1
Fig. 3. Thévenin equivalent circuit of the electrical generator (left).Circuit schematic of the ADP5092 configured to work as the PMU (center) and ESE (right).
Fig. 4. Fast Cold Start-Up Sequence at the PMU. Source: AnalogDevices (appropriately modified).
4 IEEE SENSORS JOURNAL, VOL. XX, NO. XX, MONTH X, XXXX
As for the MPPT functionality, different options are available. Here, the dynamic sensing mode is selected, which is based in the well-known fractional open circuit voltage (FOCV) technique. In this technique, the open circuit voltage of the harvester device (Voc) is periodically sampled and a fraction of it is used to dynamically fix its output (Vgen) at its MPP (here 0.5Voc). Due to the presence of D1, it is the PMU input voltage (Vin = 0.5Voc) that is actually fixed via resistors R1 and R2, which act as a voltage resistor divider. The MPPT sampling time and period are predetermined by the chip to 256 ms and 16 seconds, respectively. The sampled MPP voltage is held at C5.
III. WAVY AND TEST DRIFTERS
The EC-funded MELOA project [25] aims to develop a new family of spherical drifters (WAVY) for marine monitoring that are low-cost, easily deployable, high versatile, and low maintenance systems. The WAVY family of products will include from coastal drifters for short deployments to oceanic drifters with energy scavenging solutions for long term deployments. One of these units is the WAVY Ocean-plus drifter, whose aim is to measure Lagrangian currents at the ocean surface. It is planned as an undrogued drifter with GNSS (Global Navigation Satellite System) for positioning and equipped with two thermistors used for the calibration of satellite sea surface temperature data. Furthermore, ocean wave parameters will be analyzed through an IMU and the satellite communication will be ARGOS-based [26].This WAVY drifter will be equipped with a hybrid energy harvesting system consisting of a solar panel and a KEH system. TABLE I shows some mechanical parameters of the WAVY drifter. Its buoyancy is optimized to prevent the drifter trajectory responding to the wind instead of the ocean current, while providing just enough exposure of the antenna to ensure acquisition of the GNSS signal and reliable near real-time satellite communications.
In this work, a specific test drifter with an embedded measuring system and with the same mechanical characteristics of the WAVY drifter (TABLE I) has been designed, so that the same motion behavior is obtained. The aim of this test drifter is to become a test platform of the KEH system that will be embedded in the WAVY drifters. This test drifter does not include the temperature sensors, the communication units nor the solar panels of the WAVY unit, but it still contains the KEH system and an IMU (MPU-9250, Invensense). In addition, an embedded measurement system is included as well as a Wi-Fi connection for wireless transfer of the measured data to a nearby Personal Computer (PC). Fig. 5 shows a block diagram of the experimental setup with the test drifter (left) and the user receiver (right). The receiver includes a Wi-Fi router to collect the data from the drifter and
a PC to plot them in real time. The KEH system is represented in orange, the measurement system in light blue, the power connections links in brown, and the communication links in green. An open-source low-power NodeMCU development kit (https://www.nodemcu.com) has been selected as the control unit of the measurement system in the test drifter. It is based on the ESP8266-Module (Espressif Systems), which contains a Wi-Fi communication module.
The IMU provides the data corresponding to linear acceleration (Ax, Ay, Az) and angular velocity (Gx, Gy, Gz) along the three axes through an I2C bus; the rotation speed of the KEH generator is inferred using the circuit shown in Fig. 6, which has been improved with respect to that used in [15]. An infrared emitting diode (VSMG2000X01, Vishay), attached to the main body of the KEH device, points to an also attached phototransistor (PT100MF0MP1, Sharp), whose collector terminal is connected to a digital port (DP) of the NodeMCU and through a pull-up resistor to the power supply (Vcc). One of the gear wheels with a hole on its surface spins in between; whenever the hole is aligned with the emitter-receiver couple, a logic “0” is generated at the digital input. Contrariwise, a logic “1” is generated.
The measurement system has been upgraded with respect to that used in [15] to measure input and output power to the PMU; the Adafruit module based on the Analog-to-Digital Converter (ADC) ADS1115 (Texas Instruments) has been selected for this task. Its main characteristics are: 4 multiplexed analog channels, maximum data rate of 860 samples/s, 16 bit, and I2C communication. Referring to Fig. 3, the first (VCH1) and the second (VCH2) channels measure Vin and VBAT, respectively. The third (iCH3) and fourth (iCH4) channels are used for the measurement of the input and output (BAT terminal) currents of the PMU, respectively (see Fig. 3). Each current measurement is achieved using a Current Sense Amplifier (CSA) placed before the respective ADC channels. Fig. 7 shows the circuit schematic of the CSA, which includes an input shunt resistor (RSENSE), which the current to be measured (ISENSE) goes through, and an output resistor (ROUT).
TABLE I PARAMETERS OF THE WAVY OCEAN-PLUS DRIFTER
Symbol Parameter Value Units
mb Drifter mass 3.472 kg
R Drifter radius 0.1 m
cm Center of massa 0.06 m aCenter of mass taken from the bottom of the drifter body.
IMU
Drifter
Ax Ay Az
PMU
Receiver
Router
PCWireless
Comm.Power
Gx Gy GzI2CI2C
ADC
KEH
KEH Syst.Measure Syst.
ESE
BAT NodeMCU
CSA
Vbat
ICH4
Vin
CountsDP
CSAICH3
Vin
BAT
Fig. 5. Block diagram of the experimental setup that includes the testdrifter (left) and the receiver (right).
Counts to DP
68 Ω
Infrared emiter
GND
VCC
GND
VCC 1 kΩ
Phototransistor
Fig. 6. Schematic of the circuit used to infer the rotation speed of theelectrical generator, based on an infrared emitter and aphototransistor.

M. Carandell et al.: Design and Testing of a Kinetic Energy Harvester Embedded into an Oceanic Drifter 5
The output terminal (VOUT) is connected to the ADC channel. The CSA is based on a MAX9934 chip (Maxim) with a transconductance gain of 25 µA/mV.
IV. MATERIALS AND METHOD
A. KEH system and test drifter
Fig. 8 shows the manufactured prototype of the KEH device. It has a proof mass of 220 g and a total diameter of 10 cm. The main body has been 3D printed with polyamide and the proof mass made with lead. The total gear ratio is 35. The miniature DC motor referred to in [14], [15], used as electrical generator, has been replaced here by the 118391 model from Maxon Motors, presenting a nominal voltage of 12 V and a terminal resistance (Rg) of 114 . Apart from being more rugged and reliable, it provides higher voltage outputs at the same mechanical excitation, letting the PMU to work at higher efficient rates.
A BAT47 schottky diode was chosen for the PMU; according to manufacturer information of the ADP5092, the following capacitor and inductor values were used: C1 = 10 uF, C2 = 100 nF, C3 = 220 uF, C4 = 4.7 uF, C5 = 10 nF, and L1 = 22 µH. The selected ESE was a Li-ion battery of 3.6 V and 2.2 Ah, which sets VBAT. In order to protect it, Vhigh and Vlow were set at 4.2 V and 2.4 V, respectively, using R3 =3.57 MΩ, R4 = 6.49 MΩ, R5 =4.12 MΩ, and R6 = 5.9 MΩ, as indicated by the chip manufacturer. Thus, the PMU mostly worked in the synchronous mode. The MPPT was set at dynamic sensing mode with a ratio of 0.5 with respect to Voc, programmed with R1 = R2 = 10 MΩ.
As for the embedded measuring system, which is upgraded from that described in [15], as described in section III, the NodeMCU was configured to send collected data every 20 ms through its Wi-Fi connection. The data collected consist of the
following: IMU (Ax, Ay, Az, Gx, Gy, Gz), the rotation speed of the generator in the KEH device (in number of counts) and the input and output voltages and currents at the PMU (VCH1, VCH2, iCH3, and iCH4). The IMU was placed on the center of mass of the drifter. The mean rotation in the generator shaft was inferred during a time interval long enough to achieve a tolerable resolution. The ADC was set with single-shot operation and a data rate of 475 samples/s. The first CSA (iCH3) used RSENSE = 0.5 Ω and ROUT = 22 kΩ, resulting in a gain of 275 V/A, whereas the second CSA (iCH4) used RSENSE = 3.3 Ω and ROUT = 12 kΩ, resulting in a gain of 990 V/A. The NodeMCU was powered by a 9V Li-Ion battery; an internal linear regulator (AMS1117, Advanced Monolithic Systems) provided 3.3 V to the IMU, the pair emitting diode–phototransistor, and the CSAs. In addition, an external switching regulator (TSRN 1-2450A, TracoPower) provided 5 V to the ADC. Fig. 9 shows a 3D design of the test drifter with the distribution of the different components (top) and a photo of the drifter with the cover removed (bottom left).
B. Tests Performed
The first step was to characterize the Maxon DC motor, working in reverse mode as an electrical generator, in the laboratory. Its shaft was excited by attaching it to the shaft of another DC motor at different rotation speeds (ω) and the generator output (Vgen) was connected to a source measurement unit (SMU, Agilent B2901), in order to emulate different electrical loads (RLOAD) as shown in Fig. 10. For each rotation speed (ω), a voltage sweep was performed with the SMU while measuring the output power.
to ADC
VCC
MAX9934
RSENSE
ISENSE
ROUT 1000 pF
+
‐
0.1 µF
RS‐
RS+
GND
VOUT
Fig. 7. Circuit schematic of the Current Sense Amplifier based on aMAX9934 (Maxim).
KEH Device
NodeMCU
BAT
IMU
ESE
Ballast
PMU
CSA + ADC
XY
Z
Fig. 9. (Top)The 3D model of the test drifter with the internal axisposition and the distribution of the components. (Bottom) Photos of thedrifter (left) with the cover removed and (right) during the deploymentat sea.
Fig. 8. Photograph of the designed KEH device.

6 IEEE SENSORS JOURNAL, VOL. XX, NO. XX, MONTH X, XXXX
A laboratory test was then performed to the test drifter (Fig. 5 left box), which consisted on placing it on a linear shaker (APS Dynamics: 129) with displacements in a single direction with controllable acceleration amplitude and frequency. The IMU X-axis was aligned with the shaker direction so accelerations were restricted to this axis. The pendulum arm of the KEH device was also aligned with that direction to maximize the energy conversion. This test allowed to assess the performances of all subsystems.
Finally, a test was performed in real sea conditions near the OBSEA observatory [27] off the coast of Vilanova i la Geltrú, Spain. It is a controlled area in which sea conditions are monitored and measured by an Acoustic Doppler Current Profiler (ADCP). Fig. 9 (bottom right) shows images of the test drifter deployed at sea. A boat was used to carry the PC where the data were collected. In addition, the drifter motion was also simulated in OrcaFlex (Orcina), which is a dynamic analysis software for offshore marine systems. The drifter was modelled with the parameters shown in TABLE I, with the sphere modelled by 24 stacked flat cylinders of appropriate diameters [15]. The sea state was modelled using the average values shown on TABLE II and the Ochi-Hubble wave spectrum [28]; this spectrum was considered more appropriate than that used in [15]. These simulations were then compared with the experimental results.
V. EXPERIMENTAL RESULTS
A. Electrical generator characterization
Fig. 11 shows the output power and current versus the output voltage (Vgen) of the electrical generator at different rotation speeds (ω defined in revolutions per minute, rpm), with no load connected to the generator output. It can be seen that the maximum power (PMPP) happens at around half Voc, which is coherent with the Thévenin model of the generator presented in Section II.A. In addition, PMPP and Voc are found to be nearly proportional to the square of Voc and to ω, respectively, as predicted by (1) and (2). From the corresponding current-voltage characteristic (in dashed lines),
an equivalent internal resistance of around 125 is inferred, which nearly matches the terminal resistance (RG) specified by the manufacturer (114 ).
Comparing these results with those of the generator used in [14], [15], a three-fold increase in voltage is achieved. This benefits the performance of the PMU, since low input voltages (below 0.2 V) lead to a significant decrease of the power efficiency, according to data provided by the chip manufacturer. This behavior can also be observed in Fig. 9 of [14], in which the PMU was characterized. In addition, the values of PMMP also increase.
B. Shaker test
Fig. 12 (top) shows the drifter linear acceleration Ax registered by the IMU during a time interval of 52 s when the acceleration frequency of the shaker was configured to 2.1 Hz. It can be readily seen that the peak-to-peak amplitude was changed from an initial value of 0.45 g to 0.34 g (rms values of 0.16 g to 0.12 g, respectively) at time 28 s. Fig. 12 (bottom) shows the power spectral density (PSD) of Ax obtained by applying the Fast Fourier Transform (FFT) with MATLAB software. The frequency detected in the PSD matches with that programmed for the shaker. A constant vertical (Z-axis) acceleration of 1 g (not plotted in Fig. 12) was also found, corresponding to the gravitational acceleration.
Fig. 13 shows the corresponding generator rotation speed (in rpm and averaged in time intervals of 3 s) and Vin at the PMU. The ESE was previously charged to 3.9 V (VBAT). While the Ax amplitude was high, rotation speed was around 900 rpm and the PMU VMPP about 0.6 V (Voc ~1.2 V). When the Ax amplitude decreased, rotation speed fell to around 600 rpm and VMPP decreased to about 0.3 V (Voc ~0.6 V). These changes in rotation speed and VMPP happened at a later time (at time 34 s) than the change in Ax amplitude due to the interval update of VMPP of 16 s. Correspondence between rotation speeds and voltages are coherent with the results shown in Fig. 11.
Fig. 14 shows the input (blue line, top plot) and output power (green line, middle plot) at the PMU with peak values of 2.73 mW and 2.17 mW, respectively, before the step change, and 0.97 mW and 0.72 mW after the step. In both plots, the mean power (Pin and Pout for input and output power, respectively) before and after the step change in Ax amplitude are also represented. Before the step, Pin was 608 W and Pout was 522 W. After the step, Pin and Pout fell to 243 W and 207 W, respectively.
Electrical generatorRLOAD
SMU
GND
G
Vgen
Fig. 10. Setup for the characterization of the electrical generator.
Fig. 12. Linear acceleration of the drifter along the X axis (Ax) whenattached to the shaker (above) and its Power Spectral Density (PSD,below).
Fig. 11. Results of the generator characterization: output power (solid lines, left axis) and current (dashed lines, right axis) versus output voltage (Vgen) at different rotation speeds.

M. Carandell et al.: Design and Testing of a Kinetic Energy Harvester Embedded into an Oceanic Drifter 7
Peak input powers are coherent with the results of Fig. 11. However, power generation is not constant, but pulsating. The frequency of this pulsating power production is 2.1 Hz, matching with the frequency of Ax, which is coherent with the performance of the KEH device described in section II.A. As mentioned, Voc presents an AC component with the same frequency of the movement of the pendulum and thus of Ax. Since Vin is constant between the update intervals (16 s), the input power and thus the output power will be pulsating. The variation of Voc between update intervals also prevents the system from continuously working at the generator’s MPP and thus from achieving the maximum energy production. However, this problem is minimized by reducing the variability on Voc, done by the flying wheel as described in Section II.A. On the other hand, the diode avoids draining power from the generator whenever Voc (which changes within an update interval) is lower than Vin (which is constant within an update interval) but also introduces some losses. To quantify them, both the diode voltage drop and the current through the diode were monitored during the first 28 seconds, before the step change in Ax, resulting in average values of 0.18 V and 1.2 mA, respectively. The average power loss at the diode was 310 µW, which is significant compared to Pin (608 µW). Future designs should tackle this loss and reduce it.
The bottom plot of Fig. 14 shows the evolution of the PMU efficiency averaged in time intervals of 3 seconds. Most values are around 85 %. This is a significant improvement compared to the generator used in [14] and [15], in which the efficiency significantly decreased for rotations speeds below
900 rpm, as shown at Fig. 9 of [14], due to the lower generator voltage as previously stated.
C. Test at sea
TABLE II shows the wave parameters data provided by the OBSEA ADCP during the test at sea. The mean values of the wave height and frequency were 1.43 m and 0.29 Hz,
respectively.
1) Drifter motion behavior Drifter hydrodynamic motions are composed of two
movements, the vertical lineal oscillation and the horizontal angular oscillation. The first one (along the Z axis) is originated by the drifter buoyancy when an external excitation sinks it. The horizontal angular oscillation is due to the center of mass displacement relative to the geometrical center (TABLE I). A previous, exhaustive analysis of the drifter hydrodynamic motion behavior was presented in [15]; it consists of an analysis of the accelerometer (Ax, Ay, Az) and gyroscope (Gx, Gy, Gz) data provided by the IMU sensor. The inferred drifter orientation (Roll, Pitch and Yaw) were also studied. Here, some of those parameters considered relevant for this work (Ax and AZ) are shown and analyzed with new data acquired during the test at sea.
Fig. 15 shows Ax and Az during a time interval of 142 s when the drifter was placed at sea, as well as their PSD. For the horizontal component, only data corresponding to the X axis is shown since the PSD of the Y axis component was found to be similar. It can be seen that Ax has a peak-to-peak amplitude of 0.8 g (with a rms value of 0.08 g) and a peak frequency (PSD graph) around 1.5 Hz. On the other hand, Az is centered at 1 g due to the gravitational acceleration, with a peak-to-peak amplitude of also 0.8 g (with a rms value of its AC component of 0.14 g). The DC component of the
TABLE II
WAVE PARAMETERS DURING THE DEPLOYMENT B
Parameter Mean Value Max./Min Value Units
Wave height 1.43 2.12 mWave Frequency 0.29 0.15 HzWave Direction 195.94 - º(N)
bData from the ADCP located in the OBSEA observatory
Fig. 13. Rotation speed (dotted-orange, right axis) and Vin (solid-blue, left axis) with the drifter attached to the shaker.
Fig. 14. PMU input (top plot, in blue) and output (middle plot, in green)powers. Both with their mean value (in red and orange, respectively) before and after the step change in Ax amplitude. The bottom plotshows the PMU efficiency averaged at intervals of 3 s. The drifter wasattached to the shaker.
Fig. 15. Drifter linear accelerations at X (Ax) and Z (Az) axis when placed at the sea and their respective PSD compared with the PSD from the simulated results.

8 IEEE SENSORS JOURNAL, VOL. XX, NO. XX, MONTH X, XXXX
gravitational acceleration is not shown in the PSD to facilitate the visualization of the other components, showing a peak frequency around 1 Hz and also lower frequency components related to the wave movement. Peak frequencies are similar to that obtained in [15].
Fig. 15 also includes the PSD of Ax and Az from the simulation results. These spectra are similar to those of the experimental results, which validates the simulation model. The OrcaFlex model is thus a powerful tool with which to anticipate the behavior of the drifter in different sea states. Availing of this, different sea conditions have been simulated with the model. The results show that the PSD peak frequencies of the vertical and horizontal oscillations do not depend on the sea conditions but rather on the constructive parameters of the drifter. This is coherent with [29], where it is stated that the natural frequency of oscillation of a body placed in a fluid depends on the fluid properties (density) and the physical parameters of the body. On the other hand, the amplitude of the accelerations and therefore the potential generated power depends on the wave height and frequency [17]. So, by using the validated OrcaFlex model, future simulations may provide information about how to tune parameters from TABLE I to maximize the power generated in the drifter.
2) KEH system analysis Fig. 16 shows the generator rotation speed and Vin at the
PMU for the same time frame as in Fig. 15. Here, the ESE was charged at 4.1 V before the test. As expected, both the rotation speed and voltage have a much higher variability than in the shaker test. Rotation data in Fig. 16 are plotted with values averaged over time intervals of 6 s to reduce their higher variability. The average rotation speed was 437 rpm. Again, MPP voltages were updated every 16 seconds. When the generator rotates at low motion or even stops (t = 140 s), Vin falls to 0 V, harvesting no energy during the next 16 seconds until Vin is updated again.
Fig. 17 shows the corresponding PMU input and output power. As in the shaker test, power signals are pulsating, now with peak values of 3.5 mW and 2.6 mW, respectively. The average power values were Pin = 225 W and Pout = 179 W. These values are lower but not far from those achieved in the shaker test when using the low acceleration (rms of 0.12 g), which is coherent with the lower acceleration for Ax achieved in the sea test (rms of 0.08 g). Finally, the bottom plot presents the mean PMU efficiency for 20 s intervals, ranging from 70 % to 90 % with an average of 80%.
In a previous work [30], the power consumption of a TD1205P, including sensing, processing and transmitting, was evaluated as an option for tracking drifters in coastal areas. Since the energy used per transmitting cycle was 1.49 J, 10 transmissions per day would be feasible with the power generated during the sea test (average of 179 W). This issue will be better assessed in the near future with longer term deployments.
From the related literature presented in section I, only the work of Li et al. [13] is similar to this paper with regard to the KEH device size and weight and to testing it in an actual sea environment. However, they did not use any PMU and only gathered the AC open circuit voltage at the output of the KEH
device using a commercial measurement system. This paper goes beyond that work by including a PMU after the KEH device with MPPT functionality in a test at sea, able to recharge a battery and power electronic loads and sensors. In addition, a custom-made embedded measuring system was developed, enabling the acquisition of several crucial parameters such as accelerations and velocities of the drifter, rotation speed of the generator and input and output powers of the PMU. Future work is foreseen in improving both the KEH device and the PMU to increase the overall power output.
VI. CONCLUSIONS
A novel KEH device has been designed and developed for powering undrogued drifters. It is comprised of a gearing system that transforms the pendulum oscillations induced by wave motion into rotation of a flywheel, which are then transmitted to an electrical generator. Its output is further processed by a PMU, which includes an MPPT to gather the maximum energy from the generator. To assess the performance of the KEH system at sea, a specific test drifter has been designed. The drifter contains the KEH system together with an embedded measurement system which counts on an IMU and other parts to estimate the rotation speed of the generator and the input and output power in the PMU. A Wi-Fi connection for transferring data at short distances is also present. First, the generator was characterized, verifying that it behaves as an equivalent Thévenin circuit. Then, the test drifter was validated on a linear shaker and later deployed at sea. Results of the test at sea, with waves of 1.43 m height and 0.29 Hz in average, show horizontal and vertical oscillations
Fig. 16 Rotation speed (dotted-orange, right axis) and Vin (solid-blue, left axis) with the drifter deployed at sea.
Fig. 17. PMU input (top plot, in blue) and output (middle plot, in green)powers. Both with their mean value (in red and orange, respectively).The bottom plot shows the PMU efficiency average at intervals of 20 s.The drifter was deployed at sea.

M. Carandell et al.: Design and Testing of a Kinetic Energy Harvester Embedded into an Oceanic Drifter 9
with peak-to-peak accelerations of 0.8 g and power spectra centered around 1.5 Hz and 1 Hz, respectively. This resulted in a mean power of 179 W achieved at the PMU output with peaks of 2.2 mW. A priori, this would be enough for powering a TD1205P low-power module, proposed for tracking drifters, transmitting 10 times a day, but this result must be further verified with longer term deployments.
ACKNOWLEDGMENT
The authors express their thanks to Orcina for their kind support and offer of the academic license OrcaFlex N2703 (2018) to Universitat Politècnica de Catalunya.
REFERENCES [1] R. E. Thomson and W. J. Emery, Data Analysis Methods in Physical
Oceanography: Third Edition. 2014. [2] H. Nam, “Data-gathering protocol-based AUV path-planning for long-
duration cooperation in underwater acoustic sensor networks,” IEEE Sens. J., vol. 18, no. 21, pp. 8902–8912, 2018.
[3] R. Al-Zaidi, J. C. Woods, M. Al-Khalidi, and H. Hu, “Building Novel VHF-Based Wireless Sensor Networks for the Internet of Marine Things,” IEEE Sens. J., vol. 18, no. 5, pp. 2131–2144, 2018.
[4] S. Subbaraya et al., “Circling the seas: Design of lagrangian drifters for ocean monitoring,” IEEE Robot. Autom. Mag., vol. 23, no. 4, pp. 42–53, 2016.
[5] M. Postacchini, L. R. Centurioni, L. Braasch, M. Brocchini, and D. Vicinanza, “Lagrangian Observations of Waves and Currents from the River Drifter,” IEEE J. Ocean. Eng., vol. 41, no. 1, pp. 94–104, 2016.
[6] R. Lumpkin, T. Özgökmen, and L. Centurioni, “Advances in the Application of Surface Drifters,” Ann. Rev. Mar. Sci., vol. 9, no. 1, pp. 59–81, 2017.
[7] P. M. Poulain, R. Gerin, E. Mauri, and R. Pennel, “Wind effects on drogued and undrogued drifters in the eastern Mediterranean,” J. Atmos. Ocean. Technol., vol. 26, no. 6, pp. 1144–1156, 2009.
[8] F. U. Qureshi, A. Muhtaroǧlu, and K. Tuncay, “Near-Optimal Design of Scalable Energy Harvester for Underwater Pipeline Monitoring Applications With Consideration of Impact to Pipeline Performance,” IEEE Sens. J., vol. 17, no. 7, pp. 1981–1991, 2017.
[9] G. Bracco, A. Cagninei, E. Giorcelli, G. Mattiazzo, D. Poggi, and M. Raffero, “Experimental validation of the ISWEC wave to PTO model,” Ocean Eng., vol. 120, pp. 40–51, 2016.
[10] L. D. A. Thorner, P. D. Mitcheson, A. S. Holmes, and E. M. Yeatman, “Scaling laws for energy harvesters in a marine environment,” in PowerMEMS - Washington DC, 2009, pp. 249–252.
[11] W. Ding, B. Song, Z. Mao, and K. Wang, “Experimental investigation on an ocean kinetic energy harvester for underwater gliders,” in IEEE Energy Conversion Congress and Exposition - Montreal, 2015, pp. 1035–1038.
[12] W. Ding, K. Wang, Z. Mao, and H. Cao, “Layout optimization of an inertial energy harvester for miniature underwater mooring platforms,” Mar. Struct., vol. 69, no. 102681, p. 17, 2020.
[13] Y. Li et al., “Study of an Electromagnetic Ocean Wave Energy Harvester Driven by an Efficient Swing Body Toward the Self-Powered Ocean Buoy Application,” IEEE Access, vol. 7, pp. 129758–129769, 2019.
[14] M. Carandell, D. M. Toma, M. Carbonell, M. Gasulla, and J. del Río, “Design and development of a kinetic energy harvester device for oceanic drifter applications,” in Instrumentation and Measurement Technology Conference - Auckland, 2019, pp. 1718–1723.
[15] M. Carandell, D. Mihai Toma, M. Gasulla, and J. del Río, “Experimental Validation of a Kinetic Energy Harvester Device for Oceanic Drifter Applications,” in OCEANS - Marseille, 2019, p. 17.
[16] H. Liu, Z. Ji, T. Chen, L. Sun, S. C. Menon, and C. Lee, “An Intermittent Self-Powered Energy Harvesting System from Low-Frequency Hand Shaking,” IEEE Sens. J., vol. 15, no. 9, pp. 4782–4790, 2015.
[17] N. Pozzi, G. Bracco, B. Passione, A. S. Sergej, G. Vissio, and G. Mattiazzo, “Wave Tank Testing of a Pendulum Wave Energy Converter 1:12 Scale Model,” Int. J. Appl. Mech., vol. 9, no. 2, p. 30,
2017. [18] M. E. El-Hawary, “Principles of Electric Machines with Power
Electronic Applications,” in IEEE Power Engineering Society, 2n ed., 2002, pp. 185-187. Chap. 4.3.
[19] S. Heo, Y. S. Yang, J. Lee, S. Lee, and J. Kim, “Micro Energy Management for Energy Harvesting at Maximum Power Point,” Integr. Circuits, vol. 13th, no. International Symposium, pp. 136–139, 2011.
[20] Q. Ju, H. Li, and Y. Zhang, “Power management for kinetic energy harvesting IoT,” IEEE Sens. J., vol. 18, no. 10, pp. 4336–4345, 2018.
[21] T. T. Toh, A. Bansal, G. Hong, P. D. Mitcheson, A. S. Holmes, and E. M. Yeatman, “Energy harvesting from rotating structures,” in Proc. PowerMEMS, 2007, no. 50, pp. 327–330.
[22] J. Kokert, T. Beckedahl, and L. M. Reindl, “Medlay: A reconfigurable micro-power management to investigate self-powered systems,” Sensors, vol. 18, no. 1, p. 259, 2018.
[23] M. T. Penella and M. Gasulla, “Runtime extension of low-power wireless sensor nodes using hybrid-storage units,” IEEE Trans. Instrum. Meas., vol. 59, no. 4, pp. 857–865, 2010.
[24] F. Reverter and M. Gasulla, “Optimal Inductor Current in Boost DC/DC Converters Regulating the Input Voltage Applied to Low-Power Photovoltaic Modules,” IEEE Trans. Power Electron., vol. 32, no. 8, pp. 6188–6196, 2017.
[25] “MELOA project.” [Online]. Available: https://www.ec-meloa.eu/. [26] X. André, B. Moreau, and S. Le Reste, “Argos-3 satellite
communication system: Implementation on the Arvor oceanographic profiling floats,” J. Atmos. Ocean. Technol., vol. 32, no. 10, pp. 1902–1914, 2015.
[27] M. Nogueras et al., “OBSEA an Oceanographic Seafloor Observatory,” Sea Technol., vol. 51, no. 7, pp. 37–39, 2010.
[28] M. K. Ochi and E. N. Hubble, “Six-parameter wave spectra,” in Coastal Engineering - Honolulu, 1976, pp. 301–328.
[29] Z. Ballard and B. P. Mann, “Two-Dimensional Nonlinear Analysis of an Untethered Spherical Buoy Due to Wave Loading,” J. Comput. Nonlinear Dyn., vol. 8, no. 4, p. 12, 2013.
[30] M. Carandell, D. Mihai, J. del Río, K. Ganchev, and J. Peudennier, “Evaluation of Sigfox LPWAN technology for autonomous sensors in coastal applications,” Instrum. Viewp., vol. 20, pp. 36–37, 2018.
Matias Carandell was born in Barcelona, Spain, in 1991. He received a B.Sc. and a M.S. in Industrial Engineering from Universitat Politècnica de Catalunya (UPC), with the specialty of electrical engineering, in 2015. After that, he spent one year at Universidad Técnica Federica Santa Maria (UTFSM, Chile), working with solar power converters. He is currently doing his Ph.D. in Electronic Engineering at the Remote Acquisition Systems and Data Processing (SARTI) research group,
at UPC. His current research interests include energy harvesting in marine environment, energy conditioning systems for autonomous sensors and autonomy concerning Lagrangian Drifter electronics.
Daniel Mihai Toma received a M.Sc. degree in Electrical Engineering from the Technical University “Gheorghe Asachi,” Iasi, Romania, in 2008 and a Ph.D. degree in Electronic Engineering from the Universitat Politècnica de Catalunya (UPC), Barcelona, Spain, in 2012. He is currently a member of the research group Remote Acquisition Systems and Data processing (SARTI), Electronic Engineering Department, UPC. His current research interests include electronic instrumentation,
wireless ad hoc networks, interoperability in sensor networks, and synchronization and scheduling.
Montserrat Carbonell was born in Catalonia, Spain, in 1963. She received a B.Sc. Geology degree from the University of Barcelona (UB), in 1986, and a PGCert degree in groundwater hydrology and Ph.D. degree in Industrial Engineering from the Universitat Politècnica de Catalunya (UPC), Barcelona, Spain, in 1987 and 2000, respectively. Since 1990, she has been a Professor in the Fluid Mechanics Department, UPC. She was a member of the research

10 IEEE SENSORS JOURNAL, VOL. XX, NO. XX, MONTH X, XXXX
group Modeling and Environmental Technology (MTA), from 2004 to 2013, and since 2013, she is a member of the research group Remote Acquisition Systems and Data Processing (SARTI). Her current research interests include the study and design of devices for marine renewable energy harvesting with applications to wireless sensor networks of marine environment monitoring.
Joaquín del Río was born in Catalonia, Spain, in 1976. He received a B.Sc., M.Sc., and Ph.D. degrees in Telecommunication Engineering and Electronic Engineering from the Universitat Politècnica de Catalunya (UPC), Barcelona, Spain, in 1999, 2002, and 2011, respectively. Since 2001, he has been a Professor in the Electronic Engineering Department, UPC. He is a member of the research group Remote Acquisition Systems and Data Processing
(SARTI). His research focuses on electronic instrumentation, interoperability in marine sensor networks, and wireless sensor networks. Prof. del Río is a member of the National Institute of Standards and Technology (NIST) IEEE1451.2 Working Group and the Smart Ocean Sensors Consortium and PUCK Standard Working Group (SWG). He is involved in numerous projects within the industry and is a National Instruments Certified Instructor for teaching official LabVIEW courses.
Manel Gasulla was born in Vinaròs, Spain, on May 26th, 1967. He received an Enginyer (M.Eng.) and a Doctor Enginyer (Ph.D.) degrees in Telecommunications from the Universitat Politècnica de Catalunya (UPC BarcelonaTech), Barcelona, in 1992 and 1999, respectively. Since 1993 he has been with UPC, where he is an associate professor, engaged in teaching on Analog and Power Electronics and Electronic Instrumentation. In 2001-2002 he was a Visiting Postdoctoral
Fellow at the Electronic Instrumentation Laboratory, Delft University of Technology, The Netherlands. His research interests include capacitive sensors, direct sensor-to-microcontroller interfaces, and energy harvesting and wireless power transfer circuits for autonomous sensors. Presently, he leads the research group e-CAT (Electronic Transducers and Interfaces) at UPC, which focuses on new electronic circuits applied to transducers for signal and power processing with the aim of developing energy-autonomous smart sensors. He is co-author of more than 70 papers in journals and conferences, seven Spanish patents, several chapters in books and the book Powering Autonomous Sensors (Springer, 2011). ORCID ID: 0000-0002-0364-6806


![Kinetic Energy Harvester for Freight Train Applications · fore [3]. However, due to their nature, ... [7–12]. References [8, 13] discuss a concept, which utilizes a linear stator](https://img.pdfslide.us/doc/110x75/5b08546c7f8b9a404d8c2ec3/kinetic-energy-harvester-for-freight-train-applications-3-however-due-to-their.jpg)