Embed Size (px)
Citation preview

Design and Testing of a 30-Degree Sweep Laminar Flow Wing for a High-Altitude Long-Endurance Aircraft
William D. Solomon, Jr. / Aaron Drake Northrop Grumman Integrated Systems
El Segundo, California, USA
Helen L. Reed / William S. Saric Arizona State University
Engineering Research Center Room 342 Mechanical and Aerospace Engineering, Box 87-6106
Tempe, Arizona 85287-6106 USA
Email: [email protected] /[email protected] / [email protected] /[email protected]
ABSTRACT
A laminar flow wing was designed for a high-altitude long-endurance flying-wing aircraft with a sweep angle of 30 degrees. The resulting wing design satisfied the lift and pitching moment requirements of the aircraft and had extensive runs of laminar flow on the upper and lower surface. A portion of the wing was tested in a low-speed wind tunnel at flight Reynolds number with an equivalent pressure distribution designed to reproduce the effects of the transonic cruise Mach number. Measurements of the boundary layer included transition location, local shear stress, and limited boundary layer profiles.
To examine the boundary layer characteristics of the wing design, a section of the wing was modelled in a 7-ft x 10-ft low-speed wind tunnel. The model scale was selected to match Reynolds number to the flight conditions. Extensive computational design effort was spent modifying the wing and developing wall treatments to ensure that the low-speed wind tunnel model pressure distribution matched that of the transonic free-air flight condition. The resulting wall treatments were substantially less extensive than is conventionally assumed to be necessary. Measurement of the pressure distributions on the model confirmed that the wall treatments successfully compensated for the presence of the walls.
The experimental results correlated well with pre-test stability calculations. Extensive runs of laminar flow were observed with the 30-degree leading edge wing sweep. Multiple measurement methods showed that with the careful attention to boundary layer stability paid during design of the wing, for a typical cruise condition for a high altitude long-endurance aircraft, extensive laminar flow with minimal separation can be achieved, leading to substantial drag reduction.
1.0 INTRODUCTION
1.1 SensorCraft HALE Northrop Grumman has been studying an unmanned high-altitude long endurance intelligence, surveillance, and reconnaissance flying wing concept featuring structurally integrated antennas in support of the United
Paper presented at the RTO AVT Specialists’ Meeting on “Enhancement of NATO Military Flight Vehicle Performance byManagement of Interacting Boundary Layer Transition and Separation”, held in Prague,
Czech Republic, 4-7 October 2004, and published in RTO-MP-AVT-111.
RTO-MP-AVT-111 11 - 1
UNCLASSIFIED/UNLIMITED
UNCLASSIFIED/UNLIMITED

Report Documentation Page Form ApprovedOMB No. 0704-0188
Public reporting burden for the collection of information is estimated to average 1 hour per response, including the time for reviewing instructions, searching existing data sources, gathering andmaintaining the data needed, and completing and reviewing the collection of information. Send comments regarding this burden estimate or any other aspect of this collection of information,including suggestions for reducing this burden, to Washington Headquarters Services, Directorate for Information Operations and Reports, 1215 Jefferson Davis Highway, Suite 1204, ArlingtonVA 22202-4302. Respondents should be aware that notwithstanding any other provision of law, no person shall be subject to a penalty for failing to comply with a collection of information if itdoes not display a currently valid OMB control number.
1. REPORT DATE 01 OCT 2004
2. REPORT TYPE N/A
3. DATES COVERED -
4. TITLE AND SUBTITLE Design and Testing of a 30-Degree Sweep Laminar Flow Wing for aHigh-Altitude Long-Endurance Aircraft
5a. CONTRACT NUMBER
5b. GRANT NUMBER
5c. PROGRAM ELEMENT NUMBER
6. AUTHOR(S) 5d. PROJECT NUMBER
5e. TASK NUMBER
5f. WORK UNIT NUMBER
7. PERFORMING ORGANIZATION NAME(S) AND ADDRESS(ES) Northrop Grumman Integrated Systems El Segundo, California, USA
8. PERFORMING ORGANIZATIONREPORT NUMBER
9. SPONSORING/MONITORING AGENCY NAME(S) AND ADDRESS(ES) 10. SPONSOR/MONITOR’S ACRONYM(S)
11. SPONSOR/MONITOR’S REPORT NUMBER(S)
12. DISTRIBUTION/AVAILABILITY STATEMENT Approved for public release, distribution unlimited
13. SUPPLEMENTARY NOTES See also ADM201868, RTO-MP-AVT-111 Enhancement of NATO Military Flight Vehicle Performance byManagement of Interacting Boundary Layer Tranisition and Separation (L’amelioration des performancesdes vehicules aeriens militaires de l’OTAN par la gestion de l’interaction entre la transition et ledecollement de la couche limite)., The original document contains color images.
14. ABSTRACT
15. SUBJECT TERMS
16. SECURITY CLASSIFICATION OF: 17. LIMITATION OF ABSTRACT
UU
18. NUMBEROF PAGES
40
19a. NAME OFRESPONSIBLE PERSON
a. REPORT unclassified
b. ABSTRACT unclassified
c. THIS PAGE unclassified
Standard Form 298 (Rev. 8-98) Prescribed by ANSI Std Z39-18

Design and Testing of a 30-Degree Sweep Laminar Flow Wing for a High-Altitude Long-Endurance Aircraft
States Air Force Research Laboratory’s (AFRL) SensorCraft program. SensorCraft is a concept platform for exploring combinations of sensor, airframe, air-breathing propulsion, aerodynamics, and information technologies as one component of an integrated network to provide persistent detection and surveillance of assorted targets [1]. One of the technologies pursued was swept wing laminar flow, which is the focus of this paper.
1.2 General Relationships Between Instability Mechanisms and Wing Sweep Angles Boundary-layer transition in 3-D flows is a complicated process involving complex flow structures, multiple instability mechanisms, and nonlinear interactions. Four fundamental types of instability mechanisms cause transition in swept-wing flows: curvature-induced, leading-edge contamination, streamwise, and crossflow [2].
Centrifugal instabilities sometimes appear on locally concave portions of the wing surface. For low wing sweep angles, they lead to the appearance of slow-moving counter-rotating Görtler vortices [3]. They occur when the local pressure gradient is insufficient to compensate for the excess in angular momentum of an air particle undergoing an outward virtual displacement. This tends to be a design consideration limited to the lower surfaces of some wings.
Swept wings with a large leading-edge radius are susceptible to contamination from wing-root turbulence or other instabilities propagating along the flow attachment line. For a given sweep and flight condition, the maximum acceptable leading edge radius can be calculated by limiting the value of the attachment-line momentum-thickness Reynolds number to less than 100; i.e.,
Reθ= 0.404 [U∞ r tanΛ sinΛ / {ν(1+e)}] 1/2 ≤ 100
where U∞ is the dimensional freestream speed, ν is the freestream kinematic viscosity, r is the dimensional normal-to-leading-edge radius, Λ is the sweep angle, and e is the leading-edge ellipticity of an equivalent ellipse (where e=0 for a circle is used to be conservative) [2].
Streamwise viscous instabilities referred to as Tollmien-Schlichting (TS) disturbances amplify and cause natural transition independent of wing sweep, and usually dominate for sweeps from 0° to 10° [4]. They increase with viscosity (reduced local Reynolds number), and are affected by instabilities at the wall more than by those from the far field. Within certain limits on freestream turbulence and 3-D surface roughness, they are more sensitive to freestream sound than to freestream turbulence [3], and more sensitive to 2-D surface roughness than to 3-D surface roughness [3]. In a non-accelerating flow, steps and gaps on the wing surface can trip the boundary layer. The growth rate of these disturbances can be reduced by the introduction of weak favourable (accelerating flow) pressure gradients, weak wall suction, and wall cooling [3].
For sweep angles greater than 30°, crossflow disturbances typically dominate, amplifying and causing transition, usually near the leading edge [4]. The combination of the flow external to the boundary layer encountering the sweep and the high local pressure gradients produces curved streamlines near the leading edge. Within the boundary layer, the flow speed is reduced due to the no-slip condition without a change in the pressure gradients. This results in a secondary flow component (crossflow) within the boundary layer normal to the direction of the streamline. Since the crossflow component of velocity must vanish at the wall and the edge of the boundary layer, an inflection point in the crossflow-velocity mean-flow profile appears as a dynamic near-body source of instability, manifested by co-rotating vortices with axes aligned within a few degrees of the local mean flow streamlines [3]. The amplified crossflow instabilities are both stationary and
11 - 2 RTO-MP-AVT-111
UNCLASSIFIED/UNLIMITED
UNCLASSIFIED/UNLIMITED

Design and Testing of a 30-Degree Sweep Laminar Flow Wing for a High-Altitude Long-Endurance Aircraft
travelling [2]. Stationary crossflow waves tend to dominate transition in low freestream turbulence environments like flight, while travelling waves dominate in highly turbulent conditions [3]. They are not sensitive to 2-D roughness or freestream sound [2]. The near-body crossflow instabilities are more difficult to control with suction than TS instabilities. Cooling has minimal effect [5].
For sweep angles between 10° and 30°, both TS and crossflow disturbances are present [4]. Using a favourable pressure gradient to stabilize the TS instabilities tends to destabilize the crossflow. The sweep angle at which the crossflow instability dominates depends to a large extent on the pressure gradients associated with the airfoils chosen.
1.3 Discrete Roughness Elements Background Work by Saric and others over the last decade has demonstrated that the crossflow instabilities on appropriately designed swept wings can be passively controlled by the addition of very small cylindrical surface elements (up to 50 µm tall) spaced periodically in a single line parallel to the leading edge and just downstream of the attachment line [6]. These discrete roughness elements (DREs) disturb the nonlinear evolution of the primary stationary crossflow waves and distort the mean boundary layer flow [2]. When stationary crossflow is the dominant instability (often the case for swept wings in flight), boundary-layer linear stability analysis can be used to determine the necessary position and spacing between elements to extend the laminar flow run.
1.4 Importance of Propulsion Effects in High Endurance Vehicle Performance Fuel burn per unit time must be minimized to maximize endurance (time of flight). The endurance for a turbofan aircraft is given by
te = ∫ ( = f
i
W
WdWfuellbhours )_/ ∫
f
i
W
WdW
sfcD ))((1
= ∫f
i
W
WdW
sfcDLW ))](//([1
= ∫f
i
W
W WdW
DsfcL
))((
where Wi is the initial weight, Wf is the final weight, D is the vehicle drag, L is the vehicle lift, and sfc is the installed specific fuel consumption (rate of fuel consumption per unit thrust) [7]. If sfc and L/D are assumed constant throughout the flight or taken as average values, this equation reduces to
te =
f
ie W
WDL
sfclog1
But for turbofans, sfc is not constant with speed, so the speed for the best endurance must be balanced between propulsion efficiency and maximum lift to drag during each segment of flight. It is not necessarily minimum drag speed [7]. Hence a more accurate value for the endurance is obtained by adding partial results with local averages of sfc and L/D and initial and final weights for each flight segment.
te = ∑land
takeoff jf
ie
jj WW
DL
sfc
log1
RTO-MP-AVT-111 11 - 3
UNCLASSIFIED/UNLIMITED
UNCLASSIFIED/UNLIMITED

Design and Testing of a 30-Degree Sweep Laminar Flow Wing for a High-Altitude Long-Endurance Aircraft
2.0 FULL-SCALE POINT DESIGN
2.1 Mission profile The mission profile in Figure 1 is representative with advanced engines. All of the weight change is fuel burn. Note that the lift and Mach number do not change appreciably during the bulk of the mission. Propulsion requirements were a major driver in determining flight speed.
0
10,000
20,000
30,000
40,000
50,000
60,000
70,000
0 10 20 30 40 50
Mission Time - hrs
Alti
tude
- ft
Climb(Constant q = 75)
2,000 nmIngress
2,000 nmEgress
Descent
Warm-up (20 min Idle)Taxi (5 min mid Power)
Takeoff
Loiter (60 min)Land
Mach=0.65
Mach=0.65
Alt = 53,700
Maintain Mach=0.65 in Loiter
Mach=0.16
CL = 0.45 0.35
100 fps Ceiling CL = 0.45
Loiter Time = 38 Hrs
0
10,000
20,000
30,000
40,000
50,000
60,000
70,000
0 10 20 30 40 50
Mission Time - hrs
Alti
tude
- ft
Climb(Constant q = 75)
2,000 nmIngress
2,000 nmEgress
Descent
Warm-up (20 min Idle)Taxi (5 min mid Power)
Takeoff
Loiter (60 min)Land
Climb(Constant q = 75)
2,000 nmIngress
2,000 nmEgress
Descent
Warm-up (20 min Idle)Taxi (5 min mid Power)
Takeoff
Loiter (60 min)Land
Mach=0.65
Mach=0.65
Alt = 53,700
Maintain Mach=0.65 in Loiter
Mach=0.16
CL = 0.45 0.35
100 fps Ceiling CL = 0.45
Mach=0.65
Mach=0.65
Alt = 53,700
Maintain Mach=0.65 in Loiter
Mach=0.16
Mach=0.65
Mach=0.65
Alt = 53,700
Maintain Mach=0.65 in Loiter
Mach=0.16
CL = 0.45 0.35
100 fps Ceiling CL = 0.45
Loiter Time = 38 HrsLoiter Time = 38 Hrs
6060
Figure 1: Representative Sensorcraft Mission Profile
2.2 Planform Selection Assorted planforms were generated assuming a minimum allowable propulsion length, with various sweep angles, planform breaks, and antenna positions. Assuming an engine and common wing thickness to chord, wet weight estimates were generated using the CONceptual MAss Properties program CONMAP. Northrop Grumman used its sizing program, WISE (Weight Integration Sizing Evaluation) to explore mission profiles consistent with SensorCraft mission requirements. WISE contains lookup tables based on past aircraft, but allows substitutions of propulsion decks, weight, and aerodynamics to be made as they become available. Scale factors were introduced to WISE’s weight model to match CONMAP values. WISE’s default aerodynamics model is based on an equivalent trapezoid for a given planform area, aspect ratio, and sweep angle. Factors were introduced to account for estimated laminar flow. The engine size and weight of entire vehicle were scaled until mission targets were achieved.
A flying wing planform in Figure 2a was chosen after balancing the requirements of assorted disciplines, especially sensor performance and minimum weight. WISE’s trapezoidal approximation of this planform does not account for the high loading at the inboard wing break. A Northrop Grumman Corporation (NGC) viscous version of the full-potential FLO22 wing design code [8][9] was employed to refine the planform to Figure 2b. Lift to drag was improved and outboard wing weight reduced by maintaining span while increasing the outboard chord length, and reducing the aspect ratio. Other disciplines also benefited from this change.
11 - 4 RTO-MP-AVT-111
UNCLASSIFIED/UNLIMITED
UNCLASSIFIED/UNLIMITED

Design and Testing of a 30-Degree Sweep Laminar Flow Wing for a High-Altitude Long-Endurance Aircraft
(a) (b)
Figure 2: SensorCraft Planform Evolution
2.3 Point Design Approach to Quickly Assess Laminar Flow Compatibility The goal of the initial design was to demonstrate the viability of the flying wing approach, including laminar flow compatibility. Since SensorCraft is a concept vehicle with fairly benign changes in condition during the majority of flight, a midmission single point design was chosen as representative to verify that laminar flow was not incompatible with the flying wing. An alternate, production-oriented approach would have been to perform a multipoint design followed by tailoring to support laminar flow, but with the risk of committing greater resources before answering the basic laminar flow compatibility question. Specifically, could laminar flow be realized on the 30° swept wing subject to other constraints?
2.4 Flying Wing Constraints The design priorities in gross terms were 1) compatible packaging, 2) flying qualities deemed essential for an unmanned vehicle, and 3) enhanced performance. Specific aerodynamic design constraints in descending importance included sensor and subsystem geometric constraints, sufficient lift for estimated weight at reasonable angle of attack (α), pitch balance and stability, minimal separation on control surfaces, some robustness with respect to Mach number, α, and sideslip, delayed tip stall, and minimum drag subject to other priorities.
2.5 The Need for Propulsion Terms The quest for laminar flow required a higher level of analysis than typically associated with preliminary design. A first-cut flowing inlet and exhaust (consistent with the point design process) were included to capture representative effects on pitching moment and crossflow. Thus, no time was wasted pursuing laminar flow on an untrimmed vehicle.
RTO-MP-AVT-111 11 - 5
UNCLASSIFIED/UNLIMITED
UNCLASSIFIED/UNLIMITED

Design and Testing of a 30-Degree Sweep Laminar Flow Wing for a High-Altitude Long-Endurance Aircraft
2.6 Computational Approach and Codes Employed The general analysis sequence was 1) conduct Euler runs with flowing propulsion, 2) use resulting pressures at selected buttlines as input to a boundary layer code, 3) use those results as input to a stability code to predict boundary-layer laminar to turbulent transition locations, 4) specify transition in a Reynolds-Averaged Navier-Stokes solver and integrate resulting forces and moments.
Euler and Navier-Stokes runs were conducted using NGC’s Generalized Compressible Navier Stokes finite volume code GCNSfv on a SGI Origin. The structured, multi-block solver allows for simultaneous use of both overset (chimera) and face-matching (patched) block interfaces. The code can be run Euler, Thin-Layer or full Navier-Stokes on a block-by-block basis. Menter’s k-ω Shear Stress Transport turbulence model was used for all viscous runs [10].
Transition estimates were based on 1950’s linear stability theory referred to as the (logarithmic) eN or “N-factor” method [5]. First, pressures are used as input for boundary layer analysis. Output from that analysis is fed to the stability code, where sinusoidal disturbances of various frequencies are introduced. The growth rate of the disturbance along a path is integrated to yield “N”. The method assumes there is a correlation between boundary layer transition and when the most unstable wave has grown by a factor of eN. Typically a value of 9 has been associated with transition in flight, but a more conservative value of 7 is preferred for DRE work.
When stationary crossflow is the dominant instability, boundary-layer linear stability analysis can be used to identify the most unstable (critical) crossflow wavelength and where it first becomes unstable. The analysis can also be used to identify shorter (subcritical) wavelength stationary crossflows that grow faster near the leading edge than the critical wave, but decay after about 40% chord without exceeding N-factor limits. The DREs are spaced to amplify the growth of the subcritical wave, which changes the basic state of the boundary layer so that the critical wave does not take hold and transition is delayed [2]. Predicted transition with DREs in place is then based on the stability of the TS waves. High Technology Corporation’s Q3BL (Quasi-three-dimensional boundary layer) / LST3D (Linear Stability Theory code for 3-D boundary layers) package was used to predict transition [11].
2.7 Projected Benefit The predicted transition pattern for continuous surfaces (i.e., no control surface breaks or access panels) is shown in Figure 3. The upper surface portion of the span near the propulsion was assumed turbulent for simplicity. The extent of upper surface laminar flow is limited by pressure recovery required for pitch trim, and is dominated by streamwise instabilities. To estimate more realistic system performance benefits, the run of laminar flow was reduced in some areas of the wing to 75% chord as shown in Figure 4. With no laminar flow assumed during climb or descent, the estimated endurance benefit from swept wing laminar flow is shown in Figure 5, along with promised benefits from other technologies. This benefit was estimated by comparing fully turbulent results to those with the “performance transition” pattern. Such a comparison is admittedly simplistic, since no attempt was made to optimise a version of the aircraft without compromises for laminar flow.
11 - 6 RTO-MP-AVT-111
UNCLASSIFIED/UNLIMITED
UNCLASSIFIED/UNLIMITED

Design and Testing of a 30-Degree Sweep Laminar Flow Wing for a High-Altitude Long-Endurance Aircraft
LOWER SURFACEUPPER SURFACEChord on
Outboard Wing40-55% Chord on Outboard Wing
LOWER SURFACEUPPER SURFACEChord on
Outboard Wing40-55% Chord on Outboard Wing
90%90%
75%75%
Figure 3: Ideal Analytical Laminar Flow Extent
LOWER SURFACEUPPER SURFACEChord on
Outboard Wing45% Chord on Outboard Wing
LOWER SURFACEUPPER SURFACEChord on
Outboard Wing45% Chord on Outboard Wing
Figure 4: Assumed Laminar Flow Extent for Performance Calculations
20
25
30
35
40
Loite
r L/D
Tim
e-O
n-St
atio
n (h
rs)
70
60
50
40
30
20
10Current-Day Technology
Advanced StructuresAdvanced Structures
Integrated AntennasIntegrated Antennas
Swept Wing Swept Wing Laminar FlowLaminar Flow
2015 SensorCraft
Active Aeroelastic WingActive Aeroelastic WingAdaptive StructuresAdaptive Structures
20
25
30
35
40
Loite
r L/D
Tim
e-O
n-St
atio
n (h
rs)
70
60
50
40
30
20
10Current-Day Technology
Advanced StructuresAdvanced Structures
Integrated AntennasIntegrated Antennas
Swept Wing Swept Wing Laminar FlowLaminar Flow
2015 SensorCraft
Active Aeroelastic WingActive Aeroelastic WingAdaptive StructuresAdaptive Structures
0.40
0.50
0.55
0.45
Empty Weight Fraction
0.40
0.50
0.55
0.45
Empty Weight Fraction
Figure 5: Estimated Technology Contributions to Endurance
RTO-MP-AVT-111 11 - 7
UNCLASSIFIED/UNLIMITED
UNCLASSIFIED/UNLIMITED

Design and Testing of a 30-Degree Sweep Laminar Flow Wing for a High-Altitude Long-Endurance Aircraft
3.0 WIND TUNNEL TEST PREPARATION
3.1 Identify Unique Design Aspects to Demonstrate A test was desired to demonstrate swept wing laminar flow experimentally; especially the effects associated with the Discrete Roughness Elements. Saric previously discovered DRE effectiveness on swept wings at near zero lift. The SensorCraft point design combined pressure gradient characteristics required by DREs with the other aforementioned design constraints. New elements included a moderate angle of attack, washout on the outboard wing, airfoil variation on the inboard wing, taper, and the cranked planform.
3.2 How to Save $1 Million on Testing A low-speed wind tunnel test was formulated which preserved the full-scale point design Reynolds number and pressure distributions. Preserving these quantities while lowering Mach number from the design value significantly reduces testing costs by lowering energy consumption.
3.3 Wind Tunnel & Flow Quality Assessment The NGC-operated 7-ft x 10-ft wind tunnel is a closed-circuit type originally constructed in 1956 for low speed testing of fighter type aircraft. It was refined in the early 1960s to support the X-21 swept wing laminar flow project. For the current test, its 7 flow-conditioning screens were cleaned and flow quality was assessed using a hot wire anemometer on a traverse rake. The streamwise perturbation velocity was below 0.1% for dynamic pressures below about 100 psf. An 85 psf ceiling was selected for air quality sufficient for laminar testing. The corresponding Reynolds number per unit length dictated the scale of the model to preserve the flight outboard chord Reynolds number of 7.13 million. The size of the scaled aircraft relative to the wind tunnel is shown in Figure 6.
FLOW
LOWER SURFACE
FLOW
LOWER SURFACE
Figure 6: Portion of Wing Tested in Wind Tunnel
11 - 8 RTO-MP-AVT-111
UNCLASSIFIED/UNLIMITED
UNCLASSIFIED/UNLIMITED

Design and Testing of a 30-Degree Sweep Laminar Flow Wing for a High-Altitude Long-Endurance Aircraft
3.4 Implications of the Low-Speed Wind Tunnel Approach Figure 7 shows a representative buttline pressure distribution and the impact of significantly reducing Mach number from the cruise value. The extent of favourable gradients and the fishtail pattern at the trailing edge result from local pitching moment constraints. At slower speed, the adverse leading edge pressure gradient is not conducive to laminar flow. So the low-speed wind tunnel approach requires: 1) identification of a preferred portion of the span for modelling; 2) modification of wing to produce the high-speed pressure distribution in the low speed wind tunnel; and 3) introduction of wall liners to simulate missing portions of the aircraft and minimize tunnel wall effects. One limitation of this approach is the unlikelihood that the model and liners will continue to mimic the design pressure distribution at different angles of attack.
Q (psf)44.2
85.0
70.0
Q (psf)44.2
85.0
70.0
Figure 7: Free-Air Mach Effect
The primary issue regarding the choice of planform portion was whether to model the cranked region or the constant outboard airfoil with washout. The design point pressure variation along the span is significant but gradual in either case, as shown in Figure 8. The level of effort to design an equivalent outboard airfoil and twist distribution was perceived to be less than to mimic the inboard airfoil variation. Introducing twist and operational lift and moment also appeared to be a more natural extension of Saric’s previous tests.
Mach number compensation is similar to an inverse of Prandtl-Glauert airfoil design principles, where the pressures and geometry of very subsonic airfoils are scaled to estimate transonic Mach number effects. However, those scaling relationships were not precise enough for this effort. First, an equivalent free-air design was generated using the inverse design mode of the MSES airfoil code [12][13] and the FLO22 wing analysis code [8][9]. Other inverse methods at hand were not used because of their limited ability to properly remodel the leading edge region. Figure 9 shows very close agreement between the target pressures from the wing and those from the equivalent low-speed design in free air at a slightly different angle of attack.
RTO-MP-AVT-111 11 - 9
UNCLASSIFIED/UNLIMITED
UNCLASSIFIED/UNLIMITED

Design and Testing of a 30-Degree Sweep Laminar Flow Wing for a High-Altitude Long-Endurance Aircraft
Figure 8: Outboard Point Design Pressure Coefficient Distributions
16.11% T/C SCEQ17WOA, M=0.23954, 0 ft, α=4.8°13.06% T/C Target, M=0.65, 60K ft, α=4.3°16.11% T/C SCEQ17WOA, M=0.23954, 0 ft, α=4.8°13.06% T/C Target, M=0.65, 60K ft, α=4.3°
Figure 9: Agreement Between Pressures From Full-Scale and Equivalent Free-Air Wing
11 - 10 RTO-MP-AVT-111
UNCLASSIFIED/UNLIMITED
UNCLASSIFIED/UNLIMITED

Design and Testing of a 30-Degree Sweep Laminar Flow Wing for a High-Altitude Long-Endurance Aircraft
3.5 Design Sequence and Project Realities The design sequence was similar to that outlined above for the wing design with some additional tasks: 1) model the empty wind tunnel in CFD, 2) introduce the wing section, 3) conduct Navier-Stokes runs of the combination with a slip-wall boundary condition on the wing surface, 4) compare resulting pressures at selected buttlines to their full-scale targets, 5) modify the equivalent wing and repeat steps 2 through 4 until the desired pressures at the centre buttline are predicted and those inboard and outboard are reasonably close, 6) use resulting pressures near model centre as input to a boundary layer code, 7) use those results as input to a stability code to verify acceptable boundary-layer laminar to turbulent transition location, 8) introduce wall liners to improve the pressure correlation at buttlines near the walls, 9) use resulting pressures at selected buttlines as input to a boundary layer code, 10) pass those results into a stability code to predict boundary-layer laminar to turbulent transition locations, 11) specify transition in a Reynolds-Averaged Navier-Stokes solver and obtain final solution.
This design sequence was influenced by scheduling requirements of the project which were closely tied to its funding period. Since the wind tunnel model wing section was to be of aluminum (which had to be ordered) with small tolerances (which would take a long time to meet), it was identified as the long-lead item in the manufacturing process. The amount of twist in the wing was among the factors dictating the size (and cost) of the aluminum blocks. Step 7 above was identified as a major milestone, after which the wing section outer mold line was frozen to maximize the amount of time available for model construction. It was assumed that the liner design would compensate for any lingering discrepancies from the target pressure distribution without adversely affecting those near the centre buttline.
3.6 Empty CFD Wind Tunnel Calibration A Navier-Stokes CFD representation of the wind tunnel was generated to incorporate wall and blockage effects. A portion of the 6,504,795-point structured overset 7-block grid is shown in Figure 10. Initially, it included only the test section based on recent hand measurements at several stations, approximations of the diffuser and the 12.17:1 contraction. The breathers at the edges of the two entrance doors were soon introduced for better static pressure correlation. Finally, a free-air plenum was introduced downstream to ameliorate convergence issues in the diffuser.
Test Section Center StationTest Section Center Station
Figure 10: Upstream Portion of Empty Wind Tunnel CFD Grid
RTO-MP-AVT-111 11 - 11
UNCLASSIFIED/UNLIMITED
UNCLASSIFIED/UNLIMITED

Design and Testing of a 30-Degree Sweep Laminar Flow Wing for a High-Altitude Long-Endurance Aircraft
Just as a wind tunnel must be calibrated to establish which settings correspond to a particular set of conditions in the test section, the CFD boundary conditions were modified until the representative test section conditions were obtained (Mach=0.241059, static pressure=14.467 psi, static temperature=518.61 R, dynamic pressure=84.738 psf). Exhaust-type boundary conditions (specifying nozzle pressure and temperature ratios relative to sea level static conditions) were applied upstream, at the breathers, and on the upstream plenum face. An extrapolation condition was used downstream, and a far field condition was applied on the plenum sides aligned parallel to the flow. A turbulent boundary layer was assumed on the wind tunnel walls and the Girmaji Algebraic Reynolds Stress Model (ARSM) was employed to better capture turbulence effects in the corners of the channel [14].
3.7 Introduction of Model into the CFD Wind Tunnel A portion of the free-air design at the low Mach number that provided equivalent high altitude pressures was introduced into the CFD tunnel by oversetting a single “O”-type grid block. Sample flow results with the entire grid are shown in Figure 11. Since the portion of interest is in the washed-out region of the planform, the angle of attack was expressed in terms of the vehicle wing reference plane relative to the tunnel axes. A slip-wall boundary condition was applied on the wing surface to mimic the Euler step usually employed in free-air analysis to feed the boundary layer codes. The full-scale target pressure coefficients were inviscid. The resulting pressures for the 4.5° angle of attack which worked so well in the FLO22 analysis produced a poor correlation everywhere as seen in Figure 12. Increasing the angle of attack to 5.8° improved correlation at the centre section, but it was apparent that a larger washout was required for agreement near the walls. The approach pursued to remedy the situation was to modify the airfoil (using MSES), then maintain it along the span while varying twist and angle of attack. Because the pressures disagreed even near the leading edge, a cut and try approach was employed.
FLOW
VIEWED FROM BENEATH TUNNEL
DOWNSTREAM APPROXIMATED AS DUMPING INTO A PLENUM
SIMULATED BREATHER
FLOW
VIEWED FROM BENEATH TUNNEL
DOWNSTREAM APPROXIMATED AS DUMPING INTO A PLENUM
SIMULATED BREATHER
Figure 11: Axial Velocity Over Length of Computational Domain
11 - 12 RTO-MP-AVT-111
UNCLASSIFIED/UNLIMITED
UNCLASSIFIED/UNLIMITED

Design and Testing of a 30-Degree Sweep Laminar Flow Wing for a High-Altitude Long-Endurance Aircraft
FULL-SCALE AIRFOIL= SC35
W.T. AIRFOIL= SCEQ17
IDENTICAL WASHOUT = WOA
FULL-SCALE:MACH = 0.650, q=44.252 psf
WIND-TUNNEL:MACH=0.241, q=84.738 psf
FULL-SCALE AIRFOIL= SC35
W.T. AIRFOIL= SCEQ17
IDENTICAL WASHOUT = WOA
FULL-SCALE:MACH = 0.650, q=44.252 psf
WIND-TUNNEL:MACH=0.241, q=84.738 psf
Figure 12: High Speed Target Pressure Coeff. and Free-Air Equivalent in Low Speed Wind Tunnel
The resulting equivalent airfoil is overlaid against the thinner full-scale airfoil in Figure 13. The corresponding wing washout distributions are shown in Figure 14. The angle of attack estimated for the model was 11.1° compared to 4.3° for the full-scale aircraft. So, while the free-air equivalent design required exaggeration of certain features to compensate for the Mach number reduction, replacing the inboard and outboard portions of the aircraft with tunnel walls required additional levels of exaggeration. The resulting pressure distributions with the slip-wall boundary condition are shown in Figure 15.
7-ft x10-ft Equivalent (SCEQ26, 15.04% T/C)
W-1J Outboard Point Design (SC35, 13.06% T/C)
7-ft x10-ft Equivalent (SCEQ26, 15.04% T/C)
W-1J Outboard Point Design (SC35, 13.06% T/C)
Figure 13: Full Scale High Speed Airfoil and Low Speed Equivalent Thickness & Camber
RTO-MP-AVT-111 11 - 13
UNCLASSIFIED/UNLIMITED
UNCLASSIFIED/UNLIMITED

Design and Testing of a 30-Degree Sweep Laminar Flow Wing for a High-Altitude Long-Endurance Aircraft
INBOARD TUNNEL WALL
OUTBOARD TUNNEL WALL
INBOARD TUNNEL WALL
OUTBOARD TUNNEL WALL
Figure 14: High Speed Full Scale (Black) and Wind Tunnel (Red) Washout Distributions
W-1J FULL-SCALE = SC35, WOA, MACH=0.65, q=44.252 psf
W.T. = SCEQ26, WOG, NO WALL LINERS, MACH=0.241, q=84.738 psf
W-1J FULL-SCALE = SC35, WOA, MACH=0.65, q=44.252 psf
W.T. = SCEQ26, WOG, NO WALL LINERS, MACH=0.241, q=84.738 psf
Figure 15: Inviscid Target and Slip-Wall Equivalent Pressure Coefficients With No Liners
11 - 14 RTO-MP-AVT-111
UNCLASSIFIED/UNLIMITED
UNCLASSIFIED/UNLIMITED
Design and Testing of a 30-Degree Sweep Laminar Flow Wing for a High-Altitude Long-Endurance Aircraft
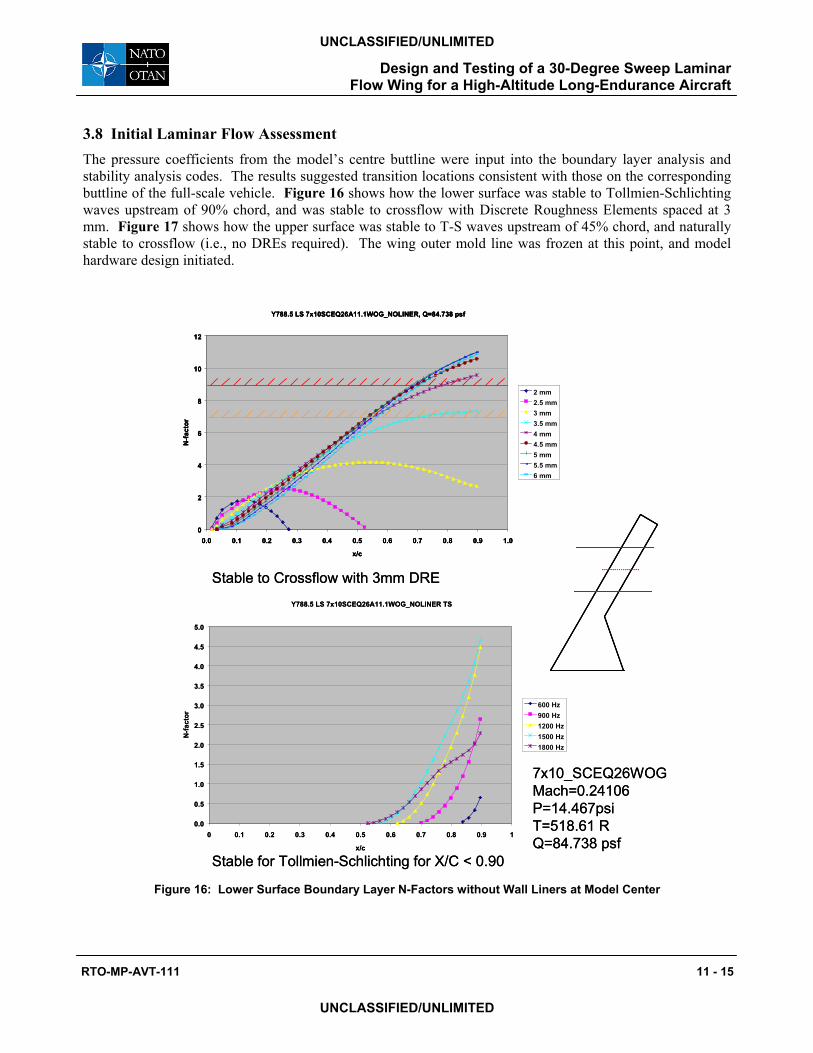
3.8 Initial Laminar Flow Assessment The pressure coefficients from the model’s centre buttline were input into the boundary layer analysis and stability analysis codes. The results suggested transition locations consistent with those on the corresponding buttline of the full-scale vehicle. Figure 16 shows how the lower surface was stable to Tollmien-Schlichting waves upstream of 90% chord, and was stable to crossflow with Discrete Roughness Elements spaced at 3 mm. Figure 17 shows how the upper surface was stable to T-S waves upstream of 45% chord, and naturally stable to crossflow (i.e., no DREs required). The wing outer mold line was frozen at this point, and model hardware design initiated.
Y788.5 LS 7x10SCEQ26A11.1WOG_NOLINER, Q=84.738 psf
0
2
4
6
8
10
12
0.0 0.1 0.2 0.3 0.4 0.5 0.6 0.7 0.8 0.9 1.0
x/c
N-fa
ctor
2 mm2.5 mm3 mm3.5 mm4 mm4.5 mm5 mm5.5 mm6 mm
Y788.5 LS 7x10SCEQ26A11.1WOG_NOLINER TS
0.0
0.5
1.0
1.5
2.0
2.5
3.0
3.5
4.0
4.5
5.0
0 0.1 0.2 0.3 0.4 0.5 0.6 0.7 0.8 0.9 1
x/c
N-fa
ctor
600 Hz900 Hz1200 Hz1500 Hz1800 Hz
Stable for Tollmien-Schlichting for X/C < 0.90
Stable to Crossflow with 3mm DRE
7x10_SCEQ26WOGMach=0.24106P=14.467psiT=518.61 RQ=84.738 psf
Y788.5 LS 7x10SCEQ26A11.1WOG_NOLINER, Q=84.738 psf
0
2
4
6
8
10
12
0.0 0.1 0.2 0.3 0.4 0.5 0.6 0.7 0.8 0.9 1.0
x/c
N-fa
ctor
2 mm2.5 mm3 mm3.5 mm4 mm4.5 mm5 mm5.5 mm6 mm
Y788.5 LS 7x10SCEQ26A11.1WOG_NOLINER, Q=84.738 psf
0
2
4
6
8
10
12
0.0 0.1 0.2 0.3 0.4 0.5 0.6 0.7 0.8 0.9 1.0
x/c
N-fa
ctor
2 mm2.5 mm3 mm3.5 mm4 mm4.5 mm5 mm5.5 mm6 mm
Y788.5 LS 7x10SCEQ26A11.1WOG_NOLINER TS
0.0
0.5
1.0
1.5
2.0
2.5
3.0
3.5
4.0
4.5
5.0
0 0.1 0.2 0.3 0.4 0.5 0.6 0.7 0.8 0.9 1
x/c
N-fa
ctor
600 Hz900 Hz1200 Hz1500 Hz1800 Hz
Stable for Tollmien-Schlichting for X/C < 0.90
Stable to Crossflow with 3mm DRE
7x10_SCEQ26WOGMach=0.24106P=14.467psiT=518.61 RQ=84.738 psf
Figure 16: Lower Surface Boundary Layer N-Factors without Wall Liners at Model Center
RTO-MP-AVT-111 11 - 15
UNCLASSIFIED/UNLIMITED
UNCLASSIFIED/UNLIMITED

Design and Testing of a 30-Degree Sweep Laminar Flow Wing for a High-Altitude Long-Endurance Aircraft
Y788.5 US 7x10SCEQ26A11.1WOG_NOLINER TS, Q=84.738 psf
0
1
2
3
4
5
6
7
8
9
10
0 0.1 0.2 0.3 0.4 0.5 0.6
x/c
N-fa
ctor
900 Hz1200 Hz1500 Hz1800 Hz2100 Hz2400 Hz2700 Hz3000 Hz3300 Hz3600 Hz3900 Hz4200 Hz4500 Hz4800 Hz
Y788.5 US 7x10SCEQ26A11.1WOG_NOLINER, Q=84.738 psf
0.0
0.2
0.4
0.6
0.8
1.0
1.2
0.0 0.1 0.2 0.3 0.4 0.5 0.6
x/c
N-fa
ctor
2.5 mm3 mm3.5 mm4 mm4.5 mm5 mm5.5 mm6 mm
Stable for Tollmien-Schlichting for X/C < 0.45
Stable to Crossflow
7x10_SCEQ26WOGMach=0.24106P=14.467psiT=518.61 RQ=84.738 psf
Y788.5 US 7x10SCEQ26A11.1WOG_NOLINER TS, Q=84.738 psf
0
1
2
3
4
5
6
7
8
9
10
0 0.1 0.2 0.3 0.4 0.5 0.6
x/c
N-fa
ctor
900 Hz1200 Hz1500 Hz1800 Hz2100 Hz2400 Hz2700 Hz3000 Hz3300 Hz3600 Hz3900 Hz4200 Hz4500 Hz4800 Hz
Y788.5 US 7x10SCEQ26A11.1WOG_NOLINER TS, Q=84.738 psf
0
1
2
3
4
5
6
7
8
9
10
0 0.1 0.2 0.3 0.4 0.5 0.6
x/c
N-fa
ctor
900 Hz1200 Hz1500 Hz1800 Hz2100 Hz2400 Hz2700 Hz3000 Hz3300 Hz3600 Hz3900 Hz4200 Hz4500 Hz4800 Hz
Y788.5 US 7x10SCEQ26A11.1WOG_NOLINER, Q=84.738 psf
0.0
0.2
0.4
0.6
0.8
1.0
1.2
0.0 0.1 0.2 0.3 0.4 0.5 0.6
x/c
N-fa
ctor
2.5 mm3 mm3.5 mm4 mm4.5 mm5 mm5.5 mm6 mm
Stable for Tollmien-Schlichting for X/C < 0.45
Stable to Crossflow
7x10_SCEQ26WOGMach=0.24106P=14.467psiT=518.61 RQ=84.738 psf
Figure 17: Upper Surface Boundary Layer N-Factors without Wall Liners at Model Center
3.9 Wall Liner Development The purpose of wall liners is to simulate the aerodynamic effects of the missing parts of the aircraft. The initial approach taken for the wall liner development was to generate streamlines for the free-air equivalent wing, and patch those together to form liner surfaces. Generating the streamlines required several passes to obtain the spanwise starting points corresponding to contours which could be captured in the tunnel over their nearfield lengths. The patching process was very time-consuming, so only the outboard liner was designed for this first try. The result was a very thick liner (Figure 18), reminiscent of those used for the X-21 tests [15]. The blockage associated with this liner was tremendous, and much more modest liners were pursued using a cut-and-try approach, focusing on the resulting pressures on model buttlines near the walls. A speed bump was required to slow down the outboard flow so it could be modified by the outboard liner without introducing excessive lift. The final liner design is shown in Figure 19, and the corresponding pressures with the slip-wall boundary condition on the wing surface appear in Figure 20. The final CFD run required 56.45
11 - 16 RTO-MP-AVT-111
UNCLASSIFIED/UNLIMITED
UNCLASSIFIED/UNLIMITED

Design and Testing of a 30-Degree Sweep Laminar Flow Wing for a High-Altitude Long-Endurance Aircraft
hours on 16 Hewlett Packard SPP-9000 processors for two levels of grid sequencing (4000 coarse mesh iterations, 7000 medium mesh iterations, and 10000 fine mesh iterations).
LOOKING DOWNSTREAM
LOOKING UPSTREAM
UPPER PLANFORM
FLOW
LOOKING DOWNSTREAM
LOOKING UPSTREAM
UPPER PLANFORM
FLOW UPPER PLANFORM
FLOW
Figure 18: Initial Outboard Wall Liner Design
LOOKING AFT
LOOKING FORWARD
FLOW
LOOKING AFT
LOOKING FORWARD
FLOW
Figure 19: Final Wall Liner Design (Liner 10)
RTO-MP-AVT-111 11 - 17
UNCLASSIFIED/UNLIMITED
UNCLASSIFIED/UNLIMITED

Design and Testing of a 30-Degree Sweep Laminar Flow Wing for a High-Altitude Long-Endurance Aircraft
W-1J FULL-SCALE = SC35, WOA, MACH=0.65, q=44.252 psf
WIND TUNNEL = SCEQ26, WOG, WITHOUT & WITH LINER10, MACH=0.241, q=84.738 psf
W-1J FULL-SCALE = SC35, WOA, MACH=0.65, q=44.252 psf
WIND TUNNEL = SCEQ26, WOG, WITHOUT & WITH LINER10, MACH=0.241, q=84.738 psf
Figure 20: Slip Wall Pressure Coefficients for Target and Equivalent with & without Wall Liners
3.10 Effect of Viscosity on Circulation Figure 21 shows that for the free-air full-scale aircraft, the effects of viscosity (Navier-Stokes v.s. Euler) are minimal upstream of the trailing edge. This common result was the basis for using the slip wall condition on the model design with viscous tunnel walls to capture the primary blockage effects. However, Figure 22 shows how that in the CFD wind tunnel for the wing with no liners, the effect of viscosity (with transition forced at 44% chord upper and 92% chord lower) extends further and results in a significant increase in lift. In an attempt to compensate, the angle of attack of the model was reduced from its slip-wall value of 11.1° to 10.4°. The resulting correlation between Navier-Stokes predictions for the target pressures and the installed model design with liners is not as good as it could have been if a viscous wall with some assumed transition had been employed instead of the slip-wall condition from the start (Figure 23). (A subsequent analysis with an all laminar condition featured separation and uncharacteristic pressure contours, so that approach is not recommended.) The equivalent wing aft lower surface gradient is less favourable than the target, and it’s upper surface gradient was more favourable but has a similar rooftop length.
At this point in the project, it was too late to change the wing, and the prospect of successfully modifying the liners to alter pressures all along the span was unlikely and inconsistent with budget and schedule constraints. Fortunately, the pressure gradients near the leading edge matched sufficiently, and the boundary layer stability analysis predicted similar laminar run percentages. The pre-test transition locations are summarized in Table 1.
11 - 18 RTO-MP-AVT-111
UNCLASSIFIED/UNLIMITED
UNCLASSIFIED/UNLIMITED

Design and Testing of a 30-Degree Sweep Laminar Flow Wing for a High-Altitude Long-Endurance Aircraft
W-1J FULL-SCALE = SC35, WOA
Viscosity Effect is Minimal Upstream of Trailing Edge in Free-Air Full-Scale
W-1J FULL-SCALE = SC35, WOA
Viscosity Effect is Minimal Upstream of Trailing Edge in Free-Air Full-Scale
Figure 21: Effect of Viscosity on Full-Scale Design in CFD Free Air
WIND TUNNEL= SCEQ26, WOG, NO LINERS
Viscosity Effect is Enormous in the Tunnel
WIND TUNNEL= SCEQ26, WOG, NO LINERS
Viscosity Effect is Enormous in the Tunnel
Figure 22: Effect of Viscosity in CFD Low-Speed Wind Tunnel
RTO-MP-AVT-111 11 - 19
UNCLASSIFIED/UNLIMITED
UNCLASSIFIED/UNLIMITED

Design and Testing of a 30-Degree Sweep Laminar Flow Wing for a High-Altitude Long-Endurance Aircraft
W-1J FULL-SCALE = SC35, WOA, Xt/C = 72% LOWER, 44% UPPER
WIND TUNNEL = SCEQ26, WOG, WITH LINER10, Xt/C = 92% LOWER, 44% UPPER
Equivalent Wing Aft Lower Surface Gradient is Less Favorable than W-1J’s
Equivalent Wing’s Upper Surface Gradient is More Favorable than W-1J’s but Has Similar Rooftop Length
Figure 23: Viscous CFD Pressure Coefficients for Target & Equivalent with Wall Liners
Table 1: Pre-Test Model Boundary Layer Transition Predictions
100*100*72.2100*100*70.2100*100*64.1100*100*61.5100*100*58.0100*100*56.0
Upper>868572.2>868670.2>868664.1>8686.561.5>878758.0>888856.0T-SCrossflowT-SCrossflowLower
N=9N=7PERCENT AIRPLANE SEMI-SPAN
SURFACE
100*100*72.2100*100*70.2100*100*64.1100*100*61.5100*100*58.0100*100*56.0
Upper>868572.2>868670.2>868664.1>8686.561.5>878758.0>888856.0T-SCrossflowT-SCrossflowLower
N=9N=7PERCENT AIRPLANE SEMI-SPAN
SURFACE
4944>505048.54446.54346.54348.544
805666.5505944574258456450
4944>505048.54446.54346.54348.544
805666.5505944574258456450
*Extremely Low N-Factors
11 - 20 RTO-MP-AVT-111
UNCLASSIFIED/UNLIMITED
UNCLASSIFIED/UNLIMITED

Design and Testing of a 30-Degree Sweep Laminar Flow Wing for a High-Altitude Long-Endurance Aircraft
3.11 Model Mechanical Design The model had 150 static pressure taps in chordwise rows at 3 span locations positioned to emphasize details near the leading edge and predicted natural and DRE-augmented transition locations. The centre buttline had 74 pressure taps (39 on the upper and 35 on the lower surface), and the inboard and outboard rows had 38 each (21 upper and 17 lower). Local incidence of the 3 tap buttlines ranged from about 5.18° inboard to 1.85° outboard. The tap orifices were 0.020”, with 0.032” tube outer diameter, in brass sleeves of 0.100” outer diameter.
The wing was constructed from aluminum to facilitate manufacture and preservation of the desired shape to required tolerances. Schedule and other practical concerns encouraged piece-wise bolted construction of the model. The resulting design featured seams on both the upper and lower surfaces at 15.6 and 75.1 percent chord, with some variation due to the wing twist. Since achieving the desired shape was considered so critical to experimental success, a sample article with about a 6” span was fabricated early in the design process to exercise model assembly ideas and to acquaint the machinists with tolerances and finish requirements. A near-mirror finish and tolerances of +/- 0.002” over the first 30 percent chord and +/- 0.005” over the remainder was requested. Measurement of the resulting article (Figure 24) proved this request was achievable, and on the final model these tolerances were in fact met everywhere except one spot near the leading edge where it slipped to –0.004”. An actuated probe was employed for the measurements, so in an absolute sense, perhaps all this proved was that the actuator used for cutting and for measuring was consistent. Between milling machine passes, the wing was left outside to help relieve manufacturing-induced stresses.
Figure 24: Fabrication Demonstration Article
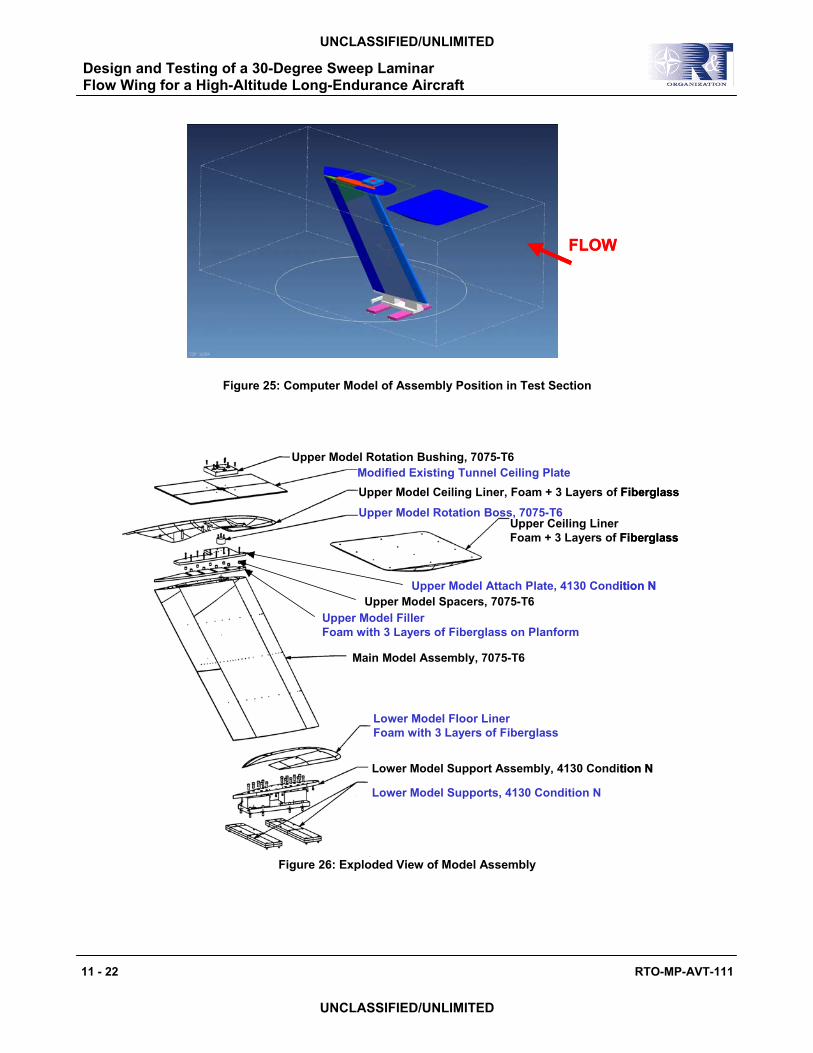
The model was designed to mount vertically in the test section with the inboard portion of the wing secured to the turntable on the floor as shown in Figure 25. Because of the wing sweep and the desire to secure the model at both ends, the design to accommodate limited rotational adjustments required careful consideration. The assembly plan was to set up the model at the design angle of attack to verify fit, rotate it to the desired angle of attack from CFD, secure the outboard wing at the ceiling, turn the wind on and compare pressures. If required, angle of attack changes would be performed between runs after loosening the outboard bolts.
An exploded view of the model is shown in Figure 26. The weight of the model was about 1200 pounds. From the CFD calculations, the anticipated lift, drag, and side force (opposing the weight) on the wing without wall liners were 1641, 23, and 185 pounds respectively. The lower support hardware was designed to take all of the calculated loads and moments based on stress analysis. To transfer the loads from the model to the tunnel structure, solid steel cross-members were welded and bolted to the turntable frame. These cross-members bolted to spacer blocks which bolted to the inboard mounting plate. After the wing was lowered by crane into the test section, the tunnel ceiling plate was reinstalled and drilled to facilitate securing the outboard edge. The upper and lower mounting plates are shown in Figure 27.
RTO-MP-AVT-111 11 - 21
UNCLASSIFIED/UNLIMITED
UNCLASSIFIED/UNLIMITED
Design and Testing of a 30-Degree Sweep Laminar Flow Wing for a High-Altitude Long-Endurance Aircraft
FLOWFLOW
Figure 25: Computer Model of Assembly Position in Test Section
Upper Model Rotation Bushing, 7075-T6Modified Existing Tunnel Ceiling PlateUpper Model Ceiling Liner, Foam + 3 Layers of Fiberglass
Upper Model Rotation Boss, 7075-T6Upper Ceiling LinerFoam + 3 Layers of Fiberglass
Upper Model Attach Plate, 4130 Condition NUpper Model Spacers, 7075-T6
Upper Model FillerFoam with 3 Layers of Fiberglass on Planform
Main Model Assembly, 7075-T6
Lower Model Floor LinerFoam with 3 Layers of Fiberglass
Lower Model Support Assembly, 4130 Condition N
Lower Model Supports, 4130 Condition N
Figure 26: Exploded View of Model Assembly
11 - 22 RTO-MP-AVT-111
UNCLASSIFIED/UNLIMITED
UNCLASSIFIED/UNLIMITED

Design and Testing of a 30-Degree Sweep Laminar Flow Wing for a High-Altitude Long-Endurance Aircraft
Figure 27: Lower (Inboard) & Upper (Outboard) Support Assemblies
The outboard rotation centre was above the wing’s upper surface, so the upper liner had to be cut to enclose the outboard support plate. A foam spacer and long bolts were used between this plate and the wing for a custom fit. The liners were fiberglass covered foam, secured by bolts and aluminum tape. Clay and tape were used to fill gaps between the wing and liners.
4.0 WIND TUNNEL TEST
4.1 Overlapping Data Acquisition Methods Data acquisition methods were selected for the test to enhance understanding of the boundary layer. Some redundancy between methods was intentional, so that test results and their interpretation would hinge on no single method.
The pressure taps were used to verify that the model and its orientation produced the anticipated pressures throughout the test. Both sublimation and infrared imaging were used for global visualization of boundary-layer transition. Oil film interferometry [16][17] was used both to visualize transition and to directly measure skin friction. Stanton gages were used sparingly as an alternate method for measuring skin friction coefficients. A single-hole rotatable probe was traversed from the surface at several upper surface stations to measure boundary-layer velocity profiles [18]. Other methods (Preston tubes for skin friction from pressure differentials, hot film gages for the boundary layer state and disturbance frequency content at discrete locations from heat transfer) were in the original test matrix but not used.
4.2 Selected Results This section gives an overview of results that will be presented in greater detail in Reference [16].
Static pressure and temperature ratios near the upstream calibrated pitot in the actual wind tunnel were compared in CFD for the tunnel empty and with the model and liners in place. Since observed changes were
RTO-MP-AVT-111 11 - 23
UNCLASSIFIED/UNLIMITED
UNCLASSIFIED/UNLIMITED
Design and Testing of a 30-Degree Sweep Laminar Flow Wing for a High-Altitude Long-Endurance Aircraft
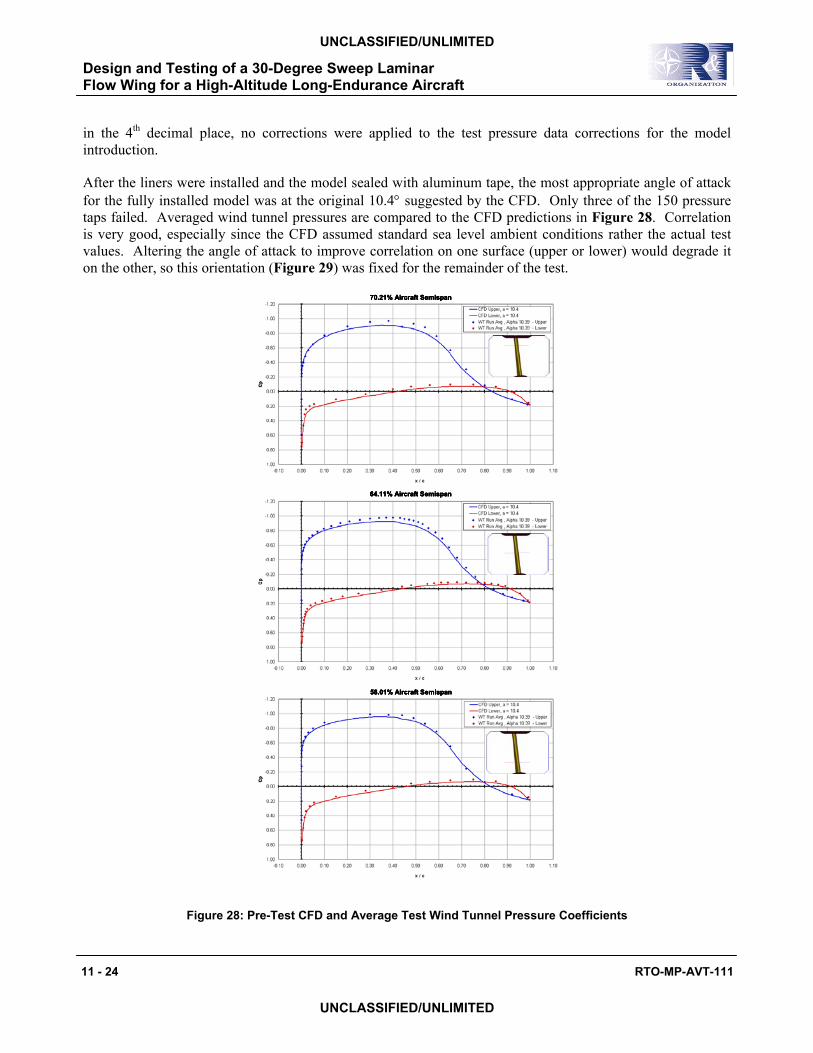
in the 4th decimal place, no corrections were applied to the test pressure data corrections for the model introduction.
After the liners were installed and the model sealed with aluminum tape, the most appropriate angle of attack for the fully installed model was at the original 10.4° suggested by the CFD. Only three of the 150 pressure taps failed. Averaged wind tunnel pressures are compared to the CFD predictions in Figure 28. Correlation is very good, especially since the CFD assumed standard sea level ambient conditions rather the actual test values. Altering the angle of attack to improve correlation on one surface (upper or lower) would degrade it on the other, so this orientation (Figure 29) was fixed for the remainder of the test.
64.11% Aircraft Semispan64.11% Aircraft Semispan
58.01% Aircraft Semispan58.01% Aircraft Semispan
70.21% Aircraft Semispan70.21% Aircraft Semispan
64.11% Aircraft Semispan64.11% Aircraft Semispan
58.01% Aircraft Semispan58.01% Aircraft Semispan
70.21% Aircraft Semispan70.21% Aircraft Semispan
Figure 28: Pre-Test CFD and Average Test Wind Tunnel Pressure Coefficients
11 - 24 RTO-MP-AVT-111
UNCLASSIFIED/UNLIMITED
UNCLASSIFIED/UNLIMITED

Design and Testing of a 30-Degree Sweep Laminar Flow Wing for a High-Altitude Long-Endurance Aircraft
(a) View Looking Aft (b) View Looking Forward
Figure 29: Model and Wall Liner Test Orientation
Sublimation was examined first, using naphthalene in 200-proof ethyl alchohol to comply with clean air requirements. It soon became obvious that the seams in the model were not completely sealed, as blue cutting oil oozed out and was identified as the source for some of the turbulent wedges. Another wedge was attributed to surface discontinuities around one of the centre buttline leading edge pressure ports, and that area was cleaned up later in the test. Often the slow evaporation and application technique resulted in crystals of naphthalene sufficiently large to be the obvious trigger for other wedges. Natural laminar flow results for the upper and lower surfaces are shown in Figures 30 and 31. Ignoring the wedges, transition appeared to occur at about 55% chord on the upper surface, and 65% chord near the center of the lower surface. The natural laminar runs were consistently longer (to about 90%) on the outboard lower surface.
Fewer problems were encountered with oil film interferometry. Six 5-inches-wide Mylar strips were placed on the model’s lower surface, and reference lines were drawn with a marker along the span based on the pressure tap locations. The resulting reference system is shown in Figure 32, where dashed lines highlight the 3 pressure tap rows. Prior to each run, vertical or slanted lines of silicon oil were applied at intervals sufficiently wide to avoid smearing into each other once the wind was turned on. The reflections of light from the air/oil interface and oil/Mylar interface have constructive and descructive interference patterns which are a function of shear stress and temperature time history. Fine stripes typically indicate low shear stress, while the largest stripes indicate high shear stress. Transition is indicated by a rapid change in the fringe spacing as illustrated in Figure 33. A qualitative assessement of the laminar flow extent was thus apparent at the end of each run. Photographs were taken of the pattern from each oil line along with a ruler to document the stripe widths for post-test shear stress calculations which are thoroughly explained in Reference [16].
RTO-MP-AVT-111 11 - 25
UNCLASSIFIED/UNLIMITED
UNCLASSIFIED/UNLIMITED

Design and Testing of a 30-Degree Sweep Laminar Flow Wing for a High-Altitude Long-Endurance Aircraft
Figure 30: Upper Surface Sublimation (Natural) Figure 31: Lower Surface Sublimation (Natural)
Figure 32: Mylar Strips and Reference System for Oil Film Interferometry
11 - 26 RTO-MP-AVT-111
UNCLASSIFIED/UNLIMITED
UNCLASSIFIED/UNLIMITED

Design and Testing of a 30-Degree Sweep Laminar Flow Wing for a High-Altitude Long-Endurance Aircraft
Figure 33: Sample Oil Film Interferometry Image
The rotatable probe was employed only along one buttline (61.7% aircraft semispan) at six different chordwise locations (45.9%, 51.2%, 59.8%, 66.4%, 72.8% and 77.6% chord) on the upper surface. The probe and its traverse normal to the surface were bolted to the model at one of these stations for a given run as shown in Figure 34. Mean and crossflow velocity profiles were obtained assuming incompressible flow. The boundary layer could not be resolved at the two upstream stations, probably because it was still laminar and therefore thin. The thicker mean velocity profiles downstream suggested turbulent flow. Qualitatively, the appearance of a noticeable crossflow velocity profile aft of 67% chord is consistent with the pretest CFD simulated oil flow (which unfortunately includes some perspective) in Figure 35.
Figure 34: Installed Rotatable Probe
RTO-MP-AVT-111 11 - 27
UNCLASSIFIED/UNLIMITED
UNCLASSIFIED/UNLIMITED

Design and Testing of a 30-Degree Sweep Laminar Flow Wing for a High-Altitude Long-Endurance Aircraft
FLOW
OUTBOARD
W
U
Crossflow Velocity Profilex / c = 0.664
0
2
4
6
8
10
12
14
16
18
20
-0.25 -0.20 -0.15 -0.10 -0.05 0.00 0.05 0.10 0.15 0.20 0.25
w / U0
Y (m
m)
Crossflow Velocity Profilex / c = 0.728
0
2
4
6
8
10
12
14
16
18
20
-0.25 -0.20 -0.15 -0.10 -0.05 0.00 0.05 0.10 0.15 0.20 0.25
w / U0
Y (m
m)
Crossflow Velocity Profilex / c = 0.776
0
2
4
6
8
10
12
14
16
18
20
-0.25 -0.20 -0.15 -0.10 -0.05 0.00 0.05 0.10 0.15 0.20 0.25
w / U0
Y (m
m)
FLOWFLOW
OUTBOARD
W
U
W
U
Crossflow Velocity Profilex / c = 0.664
0
2
4
6
8
10
12
14
16
18
20
-0.25 -0.20 -0.15 -0.10 -0.05 0.00 0.05 0.10 0.15 0.20 0.25
w / U0
Y (m
m)
Crossflow Velocity Profilex / c = 0.728
0
2
4
6
8
10
12
14
16
18
20
-0.25 -0.20 -0.15 -0.10 -0.05 0.00 0.05 0.10 0.15 0.20 0.25
w / U0
Y (m
m)
Crossflow Velocity Profilex / c = 0.776
0
2
4
6
8
10
12
14
16
18
20
-0.25 -0.20 -0.15 -0.10 -0.05 0.00 0.05 0.10 0.15 0.20 0.25
w / U0
Y (m
m)
Figure 35: Pre-Test Simulated Oil Traces and Rotatable Probe Crossflow Profiles
To perform the infrared imaging, much of the model lower surface and other bare metal in the tunnel was covered to minimize reflections. Some difficulties were encountered adhering large monokote sheets to the model for more than short periods of time. These sheets provided ample evidence that the aft model seam was not sealed everywhere. Eventually twelve 5-inch wide Mylar strips were applied streamwise, providing better adherence but introducing many corners that occasionally produced turbulent wedges. Infrared imaging allows visualization of transition from the difference in heat transfer rates through the laminar and turbulent boundary layers, so a temperature difference between the model and air (and a camera capable of capturing a sufficiently wide range of temperatures) is required. The combination of low airspeed and extemely limited air temperature control led to infrared images that were difficult to interpret, even after some simultaneous oil film application. A sample image is shown in Figure 36.
Pre-test skin friction coefficients for fully laminar and fully turbulent flows at selected buttlines were calculated using a 2-D boundary layer code and the CFD pressure coefficients at the nominal conditions. These predictions are compared to the skin friction coefficients extracted from the oil film interferometry on the upper surface buttline where the rotatable probe was installed in Figure 37. The degree of uncertainty is indicated by error bars, and the agreement is very good. The estimated transition from the sublimation and the points where the mean velocity profiles from the rotatable probe suggested laminar and turbulent flow are overlaid. All three methods support natural transition at 55% chord at approximately 63% of the SensorCraft semispan. The sublimation results suggest this extent of laminar flow applies over most of the model’s upper surface.
11 - 28 RTO-MP-AVT-111
UNCLASSIFIED/UNLIMITED
UNCLASSIFIED/UNLIMITED

Design and Testing of a 30-Degree Sweep Laminar Flow Wing for a High-Altitude Long-Endurance Aircraft
A similar plot supporting natural transition at 90% chord on the outboard lower surface (Mylar sheet A, 73% semispan) is shown in Figure 38. Shorter laminar runs are demostrated inboard in Figures 39 and 40. At Mylar sheet C (69% semispan), the skin friction coefficients from multiple runs indicate transition in the 72% to 75% chord range, rather than 65% chord from the sublimation. Although there is a data gap in the range of interest along Mylar sheet D (65% semispan), the sublimation and oil film results indicate laminar flow to at least 65% chord.
Figure 36: Mylar Strips and Sample Infrared Image
Figure 37: Upper Surface Predicted Skin Friction Coefficient and Experimental Results
RTO-MP-AVT-111 11 - 29
UNCLASSIFIED/UNLIMITED
UNCLASSIFIED/UNLIMITED

Design and Testing of a 30-Degree Sweep Laminar Flow Wing for a High-Altitude Long-Endurance Aircraft
Figure 38: Mylar A Predicted and Experimental Skin Friction Coefficient (Natural Transition)
Figure 39: Mylar C Predicted and Experimental Skin Friction Coefficient (Natural Transition)
11 - 30 RTO-MP-AVT-111
UNCLASSIFIED/UNLIMITED
UNCLASSIFIED/UNLIMITED

Design and Testing of a 30-Degree Sweep Laminar Flow Wing for a High-Altitude Long-Endurance Aircraft
Figure 40: Mylar D Predicted and Experimental Skin Friction Coefficient (Natural Transition)
4.3 Comments on DREs The Discrete Roughness Elements (DREs) were introduced only on the lower surface, where the boundary layer stability analysis suggested that crossflow could be the dominant transition mechanism. The DREs were generated as round perforations of specific diameter, height, and center-to-center spacing on sheets with adhesive backing. A line of DREs was rubbed on at a percent chord location near the first neutral point of the crossflow instability predicted by the stability analysis [2]. The DRE configurations investigated are listed in Table 2. Typically, one DRE configuration was applied across the entire span of the model, although later in the test some combinations along different parts of the span were investigated. After the dots were applied, the leading edge was carefully wiped down with alcohol to remove any excess marks, fingerprints, or other debris. A close-up of installed DREs with a millimeter scale for reference is shown in Figure 41.
RTO-MP-AVT-111 11 - 31
UNCLASSIFIED/UNLIMITED
UNCLASSIFIED/UNLIMITED

Design and Testing of a 30-Degree Sweep Laminar Flow Wing for a High-Altitude Long-Endurance Aircraft
Table 2: Discrete Roughness Element Configuration Descriptions
Config. Description Desired Effect on BL Transition Location
Diameter (mm)
Height (µm)
Spacing (mm)
Distance from LE(% chord)
DRE-1 Control Delay 0.60 6 3.0 1.0
DRE-2 Critical Advance 0.60 6 5.0 2.3
DRE-2 mod
Critical Advance 0.60 12 5.0 2.3
DRE-5 Control Delay 1.00 6 2.6 1.0
DRE-6 Control Delay 0.60 6 2.5 1.3
Figure 41: Installed Discrete Roughness Elements, Pressure Taps, and Millimeter Scale
Sublimation pictures for DRE-1 and DRE-2 are shown in Figures 42 and 43. No obvious improvement over the natural laminar flow (Figure 31) was observed with the introduction of DRE-1. Some advance of transition appeared inboard with DRE-2, as was expected, but there was no obvious change outboard. One qualitative difference between these sublimation results and those from tests performed on other models at ASU was the absence of a sawtooth appearance at the aft edge of the naphthalene.
11 - 32 RTO-MP-AVT-111
UNCLASSIFIED/UNLIMITED
UNCLASSIFIED/UNLIMITED

Design and Testing of a 30-Degree Sweep Laminar Flow Wing for a High-Altitude Long-Endurance Aircraft
Figure 42: Sublimation Results with DRE-1 Figure 43: Sublimation Results with DRE-2
The estimated transition locations and skin friction coefficients derived from the oil film interferometry along Mylar strip A with various DREs installed are overlaid on the natural (baseline) laminar flow results from Figure 38 in Figure 44. None the DRE configurations had much effect on extending or shortening the laminar run. Together, all results indicate laminar flow to 90% chord at about 73% aircraft semispan.
Quantitative results for the other Mylar strips (B, E, and F) were not processed because of time constraints, but could be in the future if the need arises.
Figure 45 overlays the DRE results at Mylar strip C with DREs installed onto those for the baseline from Figure 39. Whereas the sublimation suggested the application of DRE-2 advanced transition to 50% chord from the 65% chord baseline value, the shear stresses from the oil films show no transition forward of at least 65%, even with the double-thickness DRE-2 modification. Because of some of the problems encountered with the sublimation technique, greater faith is placed in the values from the oil film technique. Again, the control DREs did not delay transition, so the 72% chord transition for natural laminar flow was preserved at 69% aircraft semispan.
The 0.010” thick razor blades used to create the Stanton gages were too thick for laminar skin friction calculations, so they were used qualitatively to assess whether the flow was laminar or turbulent on only a handful of runs, all of which had the DRE-5 pattern. Pressure differentials measured were too small for turbulent flow at the upstream locations tested, so laminar flow was concluded as indicated in the figure.
In Figure 46, results for the DRE configurations at Mylar strip D are added to the baseline results from Figure 40. Again, the oil film results are favoured over those from the sublimation, so there is no conclusive evidence to support that the DREs had any effect on transition at 65% aircraft semispan. Laminar flow extended to somewhere around 65% to 70% chord.
Despite careful application, cleaning, and polishing, the DREs did not perform as anticipated. The results suggest that there is more to be learned regarding the interaction of the DREs and the boundary layer. Unfortunately, time did not allow for an extended investigation. All testing was limited to 9 ½ days due to facility demands from other projects.
RTO-MP-AVT-111 11 - 33
UNCLASSIFIED/UNLIMITED
UNCLASSIFIED/UNLIMITED

Design and Testing of a 30-Degree Sweep Laminar Flow Wing for a High-Altitude Long-Endurance Aircraft
Figure 44: Mylar A Predicted and Experimental Skin Friction Coefficient with Assorted DREs
Figure 45: Mylar C Predicted and Experimental Skin Friction Coefficient with Assorted DREs
11 - 34 RTO-MP-AVT-111
UNCLASSIFIED/UNLIMITED
UNCLASSIFIED/UNLIMITED

Design and Testing of a 30-Degree Sweep Laminar Flow Wing for a High-Altitude Long-Endurance Aircraft
Figure 46: Mylar D Predicted and Experimental Skin Friction Coefficient with Assorted DREs
5.0 CONCLUSIONS
High-order computational analysis indicated that extensive laminar flow was not incompatible with a 30° sweep flying wing SensorCraft point design featuring many real-world constraints and promising significant endurance. The “equivalent wing” approach for the wind tunnel test successfully compensated for the Mach number reduction required for a relatively inexpensive test.
The need for CFD modeling of the article in the wind tunnel was demonstrated during this design process, because the wind tunnel appeared to amplify many effects which appear small in a free-air analysis. Hence, the predicted pressures for the model differed slightly more from the full-scale target values than they otherwise would have, but were close enough to promote similar extents of laminar flow. Correlation between the experimental pressures and the predictions was very good. The computational approach to wall liner design was successful, and the reduction in size compared to traditional liners supported rapid execution of the test matrix.
A model with significant twist was designed and manufactured to specified tolerances. The design, calibration, and preparation of the wind tunnel was adequate to support the experiment.
The extent of natural laminar flow demonstrated throughout this wind tunnel test was significant, and verified with multiple measurement methods. Laminar flow to 55% chord was observed on the upper surface, while ranging from about 70% chord inboard to 90% chord outboard on the model’s lower surface. The experimental results were generally a bit more favourable than the pre-test model predictions which assumed a standard day. They were consistent with SensorCraft performance assumptions (45% chord upper outboard transition, 75% chord lower outboard transition) used for the endurance estimates and illustrated in Figure 47.
RTO-MP-AVT-111 11 - 35
UNCLASSIFIED/UNLIMITED
UNCLASSIFIED/UNLIMITED

Design and Testing of a 30-Degree Sweep Laminar Flow Wing for a High-Altitude Long-Endurance Aircraft
So the goal of demonstrating and assessing laminar flow effects on a model exhibiting similar local lift, pitching moment, and boundary layer characteristics as a portion of the wing designed to meet the SensorCraft midmission requirements was achieved. The success of these activities encourages pursuit of a multipoint design.
LOWER SURFACEUPPER SURFACEChord on
Outboard Wing45% Chord on Outboard Wing
Performance Assumptions
LOWER SURFACEUPPER SURFACEChord on
Outboard Wing45% Chord on Outboard Wing
Performance Assumptions
75%75%
Figure 47: Comparison of Full-Scale Performance Transition Pattern and Test Results
6.0 ACKNOWLEDGEMENTS
Ross Reynolds and John Chauvin performed WISE sizing and performance runs. Ray Schumacher performed the CONMAP weight runs. Ed Hobart created the mechanical design. Michael Boccia and Ron McCool braved the naphthalene fumes and supported our rapid pace. John White provided model support. Gene Moore provided window installation solutions for the IR imaging. Dr. Russ Westphal performed data collection and post-processing associated with the rotatable probe. Andrea Vavra photographed the model, organized test data, and post-processed test results.
7.0 REFERENCES
[1] C.P. Tilmann, P.M. Flick, C.A. Martin, M.H. Love, “High-Altitude Long Endurance Technologies for SensorCraft”, RTO AVT Symposium on “Novel Vehicle Concepts and Emerging Vehicle Technologies”, Brussels, Belgium, 2003.
[2] W.S. Saric, H.L. Reed, “Supersonic Laminar Flow Control on Swept Wings Using Distributed Roughness”, AIAA 2002-0147, 40th Aerospace Sciences Meeting & Exhibit, Reno, Nevada, 2002.
[3] W.S. Saric, H.L. Reed, “Toward Practical Laminar Flow Control Remaining Challenges”, AIAA 2004-2311, 34th AIAA Fluid Dynamics Conference, Portland, Oregon, 2004.
[4] R.D. Joslin, “Overview of Laminar Flow Control”, NASA/TP-1998-208705, 1998.
[5] R.D. Joslin, “Aircraft Laminar Flow Control”, Annual Review of Fluid Mechanics, Volume 30, 1998, pp. 1-29.
[6] R.H. Radeztsky Jr., M.S. Reibert, W.S. Saric, “Effect of Micron-Sized Roughness on Transition in Swept-Wing Flows”, AIAA 93-0076, 31th Aerospace Sciences Meeting & Exhibit, Reno, Nevada, 1993.
11 - 36 RTO-MP-AVT-111
UNCLASSIFIED/UNLIMITED
UNCLASSIFIED/UNLIMITED

Design and Testing of a 30-Degree Sweep Laminar Flow Wing for a High-Altitude Long-Endurance Aircraft
[7] R.S. Shevell, Fundamentals of Flight, Prentice-Hall, 1983, pp. 274-275.
[8] A. Jameson, D.A. Caughey, “Numerical Calculation of the Transonic Flow Past a Swept Wing”, New York University ERDA Report C00-3077-140, 1977.
[9] P.A. Henne, J.A. Dahlin, C.C. Peavey, “Applied Computational Transonics – Capabilities and Limitations”, Douglas Paper 7025, Transonic Perspective Symposium, Moffett Field, CA, 1981.
[10] M.B. Malone, “Turbulence Model Evaluation for Free Shear Dominated Flows”, AIAA 96-2038, 27th AIAA Fluid Dynamics Conference, New Orleans, Louisiana, 1996.
[11] High Technologies Corporation, “BLSAS: Boundary-Layer Stability Analysis Software, Version 2.1: Quasi-3D Swept Wing Geometries”, High Technology Report No. HTC-0101, Hampton, VA, 2001.
[12] M.B. Giles, M. Drela, “Two-Dimensional Transonic Aerodynamic Design Method”, AIAA Journal, Vol. 25, No. 9, 1987, pp. 1199-1206.
[13] M. Drela, M.B. Giles, “Viscous-Inviscid Analysis of Transonic and Low Reynolds Number Airfoils”, AIAA Journal, Vol. 25, No. 10, 1987, pp. 1347-1355.
[14] M.B. Malone, “Extension of a k-ω Two-Equation Turbulence Model to an Algebraic Reynolds Stress Model”, AIAA 98-2552, 29th AIAA Fluid Dynamics Conference, Albuquerque, New Mexico, 1998.
[15] C. Linss, T. Comerinsky, “Data Report of a Laminar Flow Control 33° Swept Suction Wing Test Conducted at the Northrop NORAIR 7 by 10-Foot Wind Tunnel”, Part 5 of 7, NOR 64-240, 1965.
[16] A. J. Vavra, W. D. Solomon Jr., A. Drake, “Comparison of Boundary Layer Transition Measurement Techniques on a Laminar Flow Wing”, AIAA 2005-1030, 43rd AIAA Aerospace Sciences Meeting and Exhibit, Reno, Nevada, 2005.
[17] A. Drake, R.A. Kennelly Jr., “In-Flight Skin Friction Measurements Using Oil Film Interferometry”, Journal of Aircraft, Volume 36, Number 4, 1999, pp. 723-725.
[18] R.V. Westphal and M. Prather, M. Toyooka, “Rotatable Single-Hole Pressure Probe for Flow Velocity and Direction”, AIAA 2002-3138, 2002.
RTO-MP-AVT-111 11 - 37
UNCLASSIFIED/UNLIMITED
UNCLASSIFIED/UNLIMITED

Design and Testing of a 30-Degree Sweep Laminar Flow Wing for a High-Altitude Long-Endurance Aircraft
11 - 38 RTO-MP-AVT-111
UNCLASSIFIED/UNLIMITED
UNCLASSIFIED/UNLIMITED
AVT-111 Specialists’ Meeting on Enhancement of NATO Military Flight Vehicle Performance by Management of Interacting Boundary Layer Transition and Separation
DISCUSSION
1. REFERENCE No. OF THE PAPER: 11 2. DISCUSSOR´S NAME: Hassan Nagib 3. AUTHOR´S NAME: W. D. Solomon, A. Drake, H. L. Reed and W. S. Saric
QUESTION: Why don’t you use the same model & tunnel at gradually higher speeds to introduce small amounts of free stream turbulence and investigate the competition between stationary & travelling 3-D waves with a shorter laminar flow run on this model. AUTHOR´S REPLY: We do need to return to the tunnel to perform hot film gage measurements to determine whether travelling waves are present or not. We know increasing the tunnel speed will increase the free-stream turbulence, which the crossflow instabilities will be more sensitive to, and may introduce or intensify travelling crossflow waves. The suggested approach should shorten the laminar extent and confirm our ideas regarding the role of free-stream turbulence. But it would not distinguish the stationary from the travelling 3-D waves without the hot film gages. 1. REFERENCE No. OF THE PAPER: 11 2. DISCUSSOR´S NAME: Chris Atkin 3. AUTHOR´S NAME: W. D. Solomon, A. Drake, H. L. Reed and W. S. Saric QUESTION: How do you define the limit of applicability of DRE in terms of suppressing travelling crossflow modes/TS modes when these overlap in f,ψ space (assuming that the Tu is low enough). AUTHOR´S REPLY: In a low free-stream turbulence environment such as flight, travelling crossflow waves tend to be less of a problem than stationary crossflow waves. We need to return to the wind tunnel with a sealed model and some hot film gauges to verify or dismiss the presence of travelling crossflow waves in this experiment. Our current understanding of DREs is that they treat only standing crossflow waves, although in several tests Saric observed laminar extents beyond the predicted T-S limit as well because of induced spanwise modulations of the T-S waves.
Design and Testing of a 30-Degree Sweep Laminar Flow Wing for a High-Altitude Long-Endurance Aircraft
RTO-MP-AVT-111 11 - 39
UNCLASSIFIED/UNLIMITED
UNCLASSIFIED/UNLIMITED
1. REFERENCE No. OF THE PAPER: 11 2. DISCUSSOR´S NAME: Fasel 3. AUTHOR´S NAME: W.D. Soloman, A. Drake, H.L. Reed and WS. Saric
QUESTION: Would you conjecture why DRE’s were not effective in your experiments? AUTHOR´S REPLY: The upper surface was T-S limited, so no DRE impact was expected there. On the lower surface, the outboard laminar runs observed in test suggest the extent was T-S limited and the N-Factors employed for crossflow were conservative. The natural laminar flow observed near the model mid-span appears cross-flow limited with less conservatism on N- Factor, but still is in the 65 to 75% chord range. Such long runs do not leave much room for improvement. Either the DRE effect was contaminated by leakage through the model seam, travelling waves, or something else so far unaccounted for, or our understanding of DREs is incomplete.
1. REFERENCE No. OF THE PAPER: 11 2. DISCUSSOR´S NAME: M. Khalid 3. AUTHOR´S NAME: W. D. Solomon, A. Drake, H. L. Reed and W. S. Saric
QUESTION: 1. Why could you not recover coefficient of friction from your Navier-Stokes computations and you had to use a 2D boundary layer code on a flow which is essentially 3D? 2. For a long endurance aircraft CL/CD is very important. How come you did not show any comparisons for these coefficients? AUTHOR´S REPLY: 1. The approach taken was based on practical considerations, Drake wanted to establish a pre- test sanity check for both laminar and turbulent skin friction measurements without adding to the workload of the other authors, so he used a code he was familiar with. While oil traces for the lower surface were not shown, the pressure gradient is so gradual over the majority of the outboard wing that the 2-D assumption is pretty good, the skin friction coefficient could have been extracted from the N-S run for the one transition pattern, but that approach would have provided only a portion of both curves. In any case the data correlation clearly indicates which measurements were laminar or turbulent. 2. The benefit of realizing the laminar flow is indicated in figure 5. Releasing further details about the design is beyond the scope of this paper, but the lift to drag values used in the performance calculations were not unreasonable. Compared to other aircraft, no drag measurements were taken because the focus of the experiment was to validate our basic understanding of the boundary layer, not to perform component force comparisons.

Design and Testing of a 30-Degree Sweep Laminar Flow Wing for a High-Altitude Long-Endurance Aircraft
11 - 40 RTO-MP-AVT-111
UNCLASSIFIED/UNLIMITED
UNCLASSIFIED/UNLIMITED
1. REFERENCE No. OF THE PAPER: 11 2. DISCUSSOR´S NAME: Radespiel 3. AUTHOR´S NAME: W. D. Soloman, A. Drake, H. L. Reed and W. S. Saric
QUESTION: Could the low sensitivity to discrete roughness be explained by the transition scenario on the wing? AUTHOR´S REPLY: The calculated dominant transition mechanisms for the upper and lower surface along the span are listed in table 1, since the lower surface transition should have been crossflow limited, the DREs should have had an effect. Further investigations are necessary.
1. REFERENCE No. OF THE PAPER: 11 2. DISCUSSOR´S NAME: Koerner 3. AUTHOR´S NAME: W. D. Soloman, A. Drake, H. L. Reed and W. S. Saric
QUESTION: The pressure distribution you have chosen is very well-suited to damp TS waves. I don’t see specific provisions to damp CF waves. AUTHOR´S REPLY: Quite a bit of effort was expended by Solomon and Reed to address both T-S and crossflow concerns while meeting realistic aircraft requirements. The leading edge area in particular must be designed very carefully. DRE technology is not a band-aid and must be included during the wing design process to be effective. The gently favourable gradient on the lower surface balances TS-requirements with the tendency of sweep to aggravate crossflow instabilities.


![Laminar Natural Convection Osman Turan of Power-Law Fluids ...pcrobpoole/PAPERS/POOLE_43.pdf · The present study extends the analysis of Turan et al. [23]by modifying the vertical](https://img.pdfslide.us/doc/110x75/5e1e2f4035eec339374ae895/laminar-natural-convection-osman-turan-of-power-law-fluids-pc-robpoolepaperspoole43pdf.jpg)