Embed Size (px)
Citation preview
1
Design and Optimization for Mobile Networks in
Stadium Environments
Carolina Pereira Lopes
Instituto de Telecomunicações and Instituto Superior Técnico
University of Lisbon, Portugal
Abstract— The main problem addressed in this paper is
managing the growing demand for data-intensive
applications while maintaining high-quality customer
experience in a high capacity location. In a large venue like a
stadium, a large number of people use their smartphones to
share pictures and experiences, such as real-time video and
download information. This behavior creates traffic profiles
that differ from those typically seen in an ordinary day
network, with higher uplink traffic and more frequent packet
transmission. This dissertation has a starting point in the
designing of an LTE network solution for stadium José
Alvalade. The process of radio planning began by obtaining
the 3D model of the stadium after doing a site survey. The
selection and best mounting positions for the antennas were
discussed, and the elements responsible for its operation
presented for both a single-operator and multi-operator
scenario. The capacity sizing theoretical background was
exposed, and the number of sectors necessary to satisfy the
nowadays traffic profile and the LTE subscribers was
calculated, as so the number of resources needed to support
each service type. Considering the 1800 and 2600 MHz band,
simulations for measuring signal strength and noise, coverage
areas, maximum achievable data rate, LTE overlapping and
the needed mobile transmission power were performed and
presented. The best solution found was considering 40 sectors
for covering the seating area. 20 antennas were used being
divided in two layers, both 1800 MHz and 2600 MHz band.
Keywords — Growing Demand, High-quality Experience,
Traffic Profiles, Radio Planning, Capacity Sizing,
Simulations
I. INTRODUCTION
The popularity of smartphones creates huge capacity
requirements for the network during mass events that occur
in big venues like stadiums. Today, everyone has a phone
in their pocket and can share the event immediately on
social media, changing the experience of events and the
events themselves. A large number of people use their
smartphones to share pictures and experiences, such as
real-time video, and download information. The traffic is
evolving to data-intensive applications like video.
Counting as video traffic appears the use of embedded
video in social media and web pages, this type of video
traffic continues to grow increasing upstream data usage.
These traffic profiles differ from those typically seen in the
normal day network, with higher uplink traffic and more
frequent packet transmission.
The growth in mobile traffic and the high quality of
experience (QoE) that will be required in the next three to
five years by the spectators, challenges operators to find a
way of boosting mobile phone capacity and high-quality
coverage in stadium environments. This dissertation seeks
to find an optimum solution for a specific stadium
environment by simulating different antenna models,
adapting techniques and practises used before but now
having in consideration the Portuguese spectators’
characteristics.
The case study of this work is the stadium José Alvalade,
located in Central Lisbon. Having in consideration that each
case is different, and the solution is unique, a set of criteria
are established in order to design the most efficient LTE
network solution.
II. SITE SURVEY AND 3D MODELLING
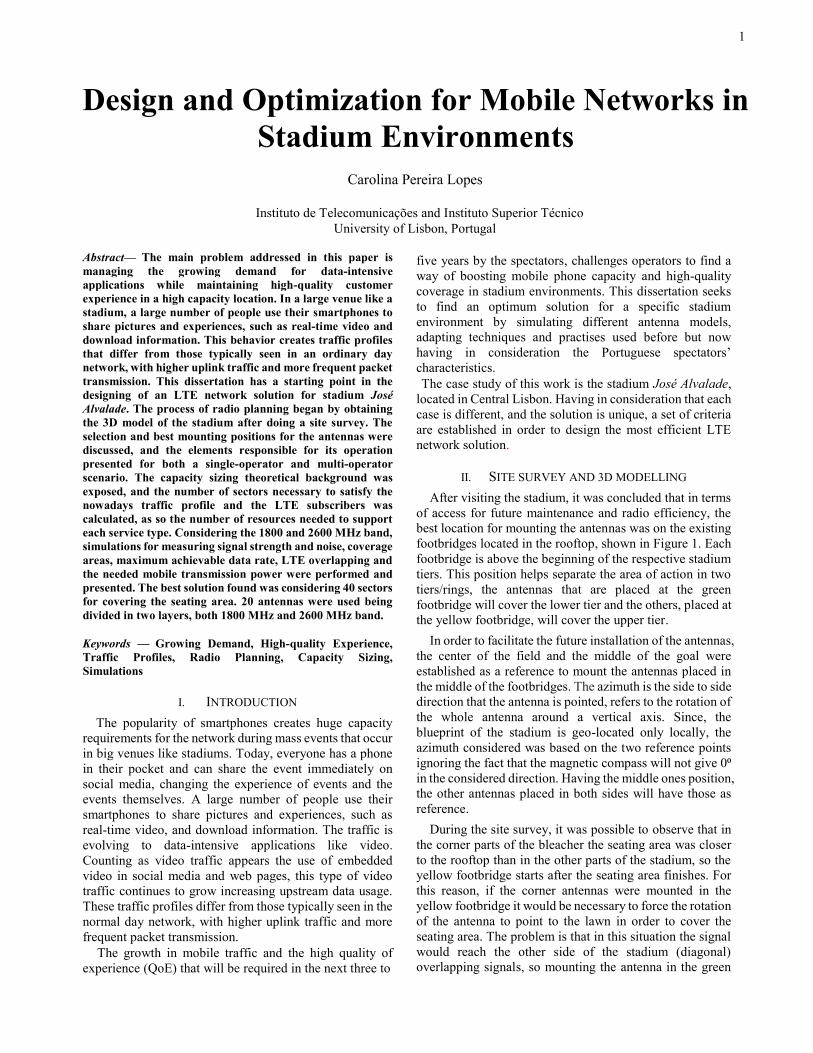
After visiting the stadium, it was concluded that in terms
of access for future maintenance and radio efficiency, the
best location for mounting the antennas was on the existing
footbridges located in the rooftop, shown in Figure 1. Each
footbridge is above the beginning of the respective stadium
tiers. This position helps separate the area of action in two
tiers/rings, the antennas that are placed at the green
footbridge will cover the lower tier and the others, placed at
the yellow footbridge, will cover the upper tier.
In order to facilitate the future installation of the antennas,
the center of the field and the middle of the goal were
established as a reference to mount the antennas placed in
the middle of the footbridges. The azimuth is the side to side
direction that the antenna is pointed, refers to the rotation of
the whole antenna around a vertical axis. Since, the
blueprint of the stadium is geo-located only locally, the
azimuth considered was based on the two reference points
ignoring the fact that the magnetic compass will not give 0⁰
in the considered direction. Having the middle ones position,
the other antennas placed in both sides will have those as
reference.
During the site survey, it was possible to observe that in
the corner parts of the bleacher the seating area was closer
to the rooftop than in the other parts of the stadium, so the
yellow footbridge starts after the seating area finishes. For
this reason, if the corner antennas were mounted in the
yellow footbridge it would be necessary to force the rotation
of the antenna to point to the lawn in order to cover the
seating area. The problem is that in this situation the signal
would reach the other side of the stadium (diagonal)
overlapping signals, so mounting the antenna in the green
2
footbridge was the only option to solve the problem.
Figure 1 - Photography taken during the site survey, identifying both
footbridges.
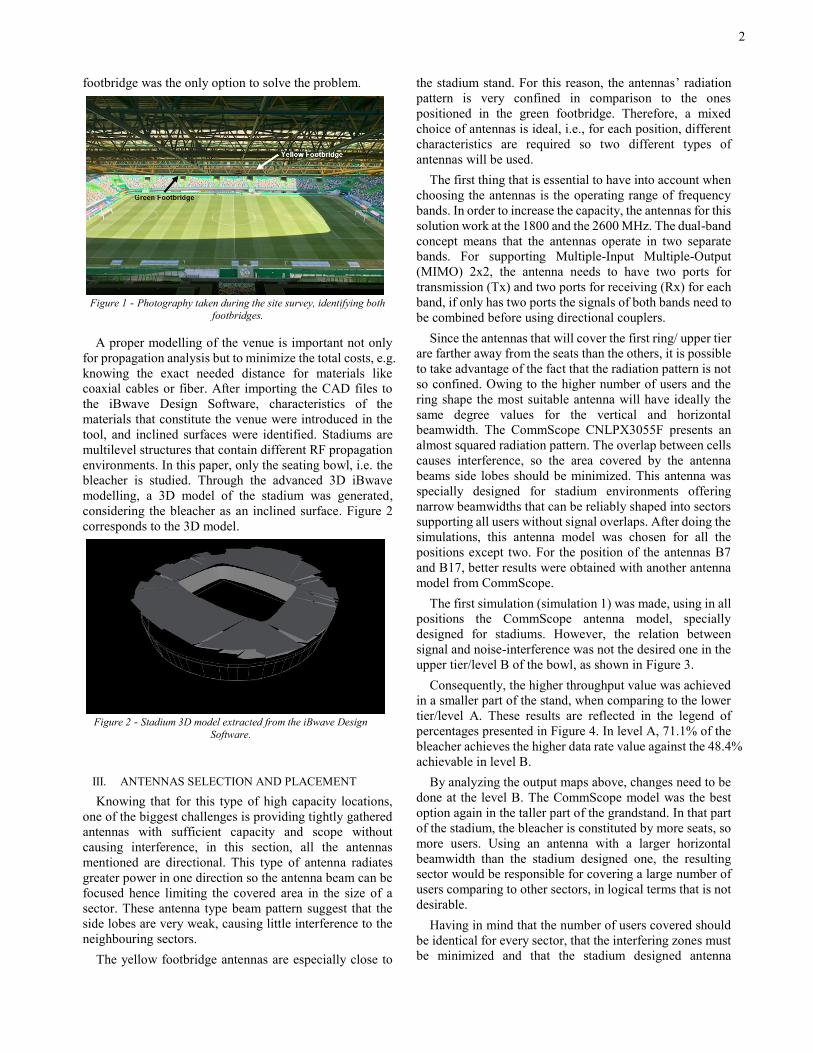
A proper modelling of the venue is important not only
for propagation analysis but to minimize the total costs, e.g.
knowing the exact needed distance for materials like
coaxial cables or fiber. After importing the CAD files to
the iBwave Design Software, characteristics of the
materials that constitute the venue were introduced in the
tool, and inclined surfaces were identified. Stadiums are
multilevel structures that contain different RF propagation
environments. In this paper, only the seating bowl, i.e. the
bleacher is studied. Through the advanced 3D iBwave
modelling, a 3D model of the stadium was generated,
considering the bleacher as an inclined surface. Figure 2
corresponds to the 3D model.
Figure 2 - Stadium 3D model extracted from the iBwave Design
Software.
III. ANTENNAS SELECTION AND PLACEMENT
Knowing that for this type of high capacity locations,
one of the biggest challenges is providing tightly gathered
antennas with sufficient capacity and scope without
causing interference, in this section, all the antennas
mentioned are directional. This type of antenna radiates
greater power in one direction so the antenna beam can be
focused hence limiting the covered area in the size of a
sector. These antenna type beam pattern suggest that the
side lobes are very weak, causing little interference to the
neighbouring sectors.
The yellow footbridge antennas are especially close to
the stadium stand. For this reason, the antennas’ radiation
pattern is very confined in comparison to the ones
positioned in the green footbridge. Therefore, a mixed
choice of antennas is ideal, i.e., for each position, different
characteristics are required so two different types of
antennas will be used.
The first thing that is essential to have into account when
choosing the antennas is the operating range of frequency
bands. In order to increase the capacity, the antennas for this
solution work at the 1800 and the 2600 MHz. The dual-band
concept means that the antennas operate in two separate
bands. For supporting Multiple-Input Multiple-Output
(MIMO) 2x2, the antenna needs to have two ports for
transmission (Tx) and two ports for receiving (Rx) for each
band, if only has two ports the signals of both bands need to
be combined before using directional couplers.
Since the antennas that will cover the first ring/ upper tier
are farther away from the seats than the others, it is possible
to take advantage of the fact that the radiation pattern is not
so confined. Owing to the higher number of users and the
ring shape the most suitable antenna will have ideally the
same degree values for the vertical and horizontal
beamwidth. The CommScope CNLPX3055F presents an
almost squared radiation pattern. The overlap between cells
causes interference, so the area covered by the antenna
beams side lobes should be minimized. This antenna was
specially designed for stadium environments offering
narrow beamwidths that can be reliably shaped into sectors
supporting all users without signal overlaps. After doing the
simulations, this antenna model was chosen for all the
positions except two. For the position of the antennas B7
and B17, better results were obtained with another antenna
model from CommScope.
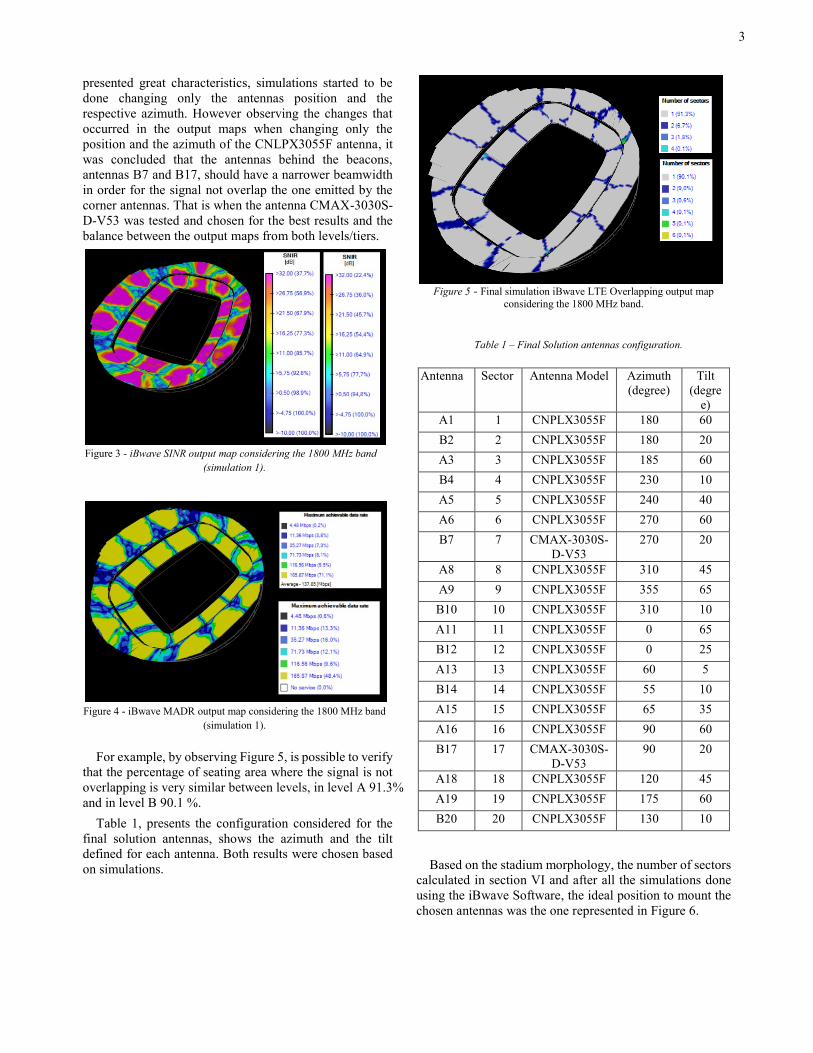
The first simulation (simulation 1) was made, using in all
positions the CommScope antenna model, specially
designed for stadiums. However, the relation between
signal and noise-interference was not the desired one in the
upper tier/level B of the bowl, as shown in Figure 3.
Consequently, the higher throughput value was achieved
in a smaller part of the stand, when comparing to the lower
tier/level A. These results are reflected in the legend of
percentages presented in Figure 4. In level A, 71.1% of the
bleacher achieves the higher data rate value against the 48.4%
achievable in level B.
By analyzing the output maps above, changes need to be
done at the level B. The CommScope model was the best
option again in the taller part of the grandstand. In that part
of the stadium, the bleacher is constituted by more seats, so
more users. Using an antenna with a larger horizontal
beamwidth than the stadium designed one, the resulting
sector would be responsible for covering a large number of
users comparing to other sectors, in logical terms that is not
desirable.
Having in mind that the number of users covered should
be identical for every sector, that the interfering zones must
be minimized and that the stadium designed antenna
3
presented great characteristics, simulations started to be
done changing only the antennas position and the
respective azimuth. However observing the changes that
occurred in the output maps when changing only the
position and the azimuth of the CNLPX3055F antenna, it
was concluded that the antennas behind the beacons,
antennas B7 and B17, should have a narrower beamwidth
in order for the signal not overlap the one emitted by the
corner antennas. That is when the antenna CMAX-3030S-
D-V53 was tested and chosen for the best results and the
balance between the output maps from both levels/tiers.
Figure 3 - iBwave SINR output map considering the 1800 MHz band
(simulation 1).
Figure 4 - iBwave MADR output map considering the 1800 MHz band
(simulation 1).
For example, by observing Figure 5, is possible to verify
that the percentage of seating area where the signal is not
overlapping is very similar between levels, in level A 91.3%
and in level B 90.1 %.
Table 1, presents the configuration considered for the
final solution antennas, shows the azimuth and the tilt
defined for each antenna. Both results were chosen based
on simulations.
Figure 5 - Final simulation iBwave LTE Overlapping output map
considering the 1800 MHz band.
Table 1 – Final Solution antennas configuration.
Antenna Sector Antenna Model Azimuth
(degree)
Tilt
(degre
e)
A1 1 CNPLX3055F 180 60
B2 2 CNPLX3055F 180 20
A3 3 CNPLX3055F 185 60
B4 4 CNPLX3055F 230 10
A5 5 CNPLX3055F 240 40
A6 6 CNPLX3055F 270 60
B7 7 CMAX-3030S-
D-V53
270 20
A8 8 CNPLX3055F 310 45
A9 9 CNPLX3055F 355 65
B10 10 CNPLX3055F 310 10
A11 11 CNPLX3055F 0 65
B12 12 CNPLX3055F 0 25
A13 13 CNPLX3055F 60 5
B14 14 CNPLX3055F 55 10
A15 15 CNPLX3055F 65 35
A16 16 CNPLX3055F 90 60
B17 17 CMAX-3030S-
D-V53
90 20
A18 18 CNPLX3055F 120 45
A19 19 CNPLX3055F 175 60
B20 20 CNPLX3055F 130 10
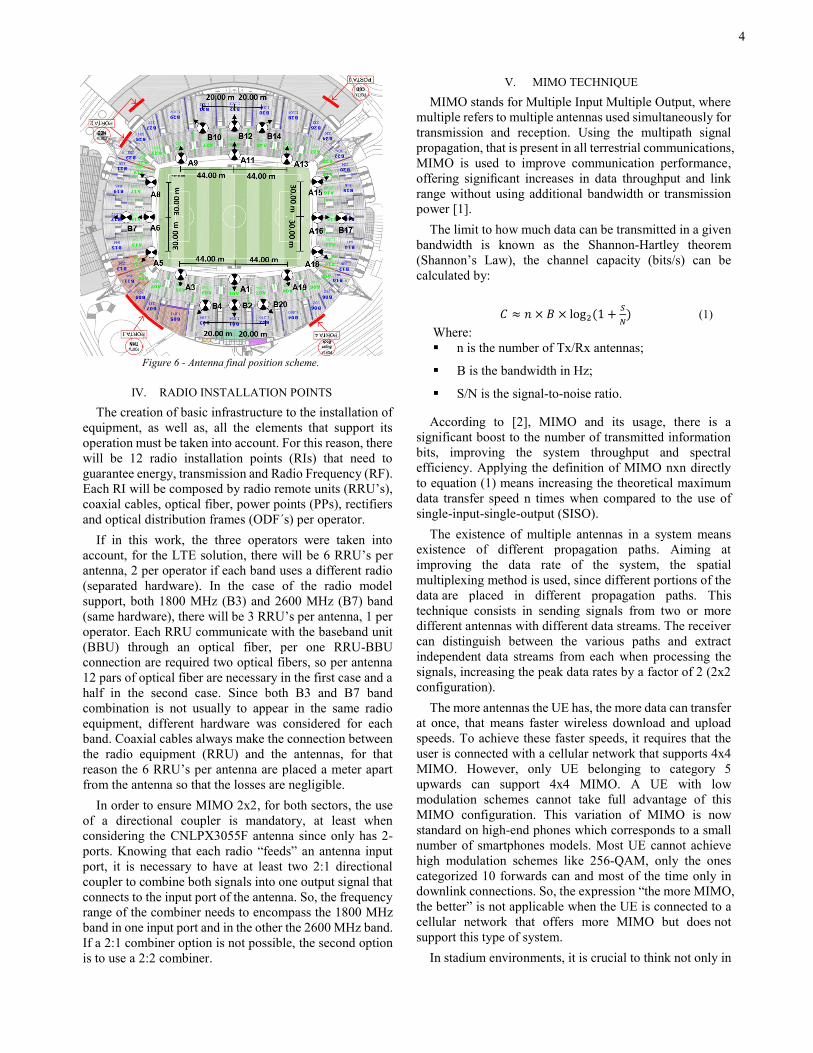
Based on the stadium morphology, the number of sectors
calculated in section VI and after all the simulations done
using the iBwave Software, the ideal position to mount the
chosen antennas was the one represented in Figure 6.
4
Figure 6 - Antenna final position scheme.
IV. RADIO INSTALLATION POINTS
The creation of basic infrastructure to the installation of
equipment, as well as, all the elements that support its
operation must be taken into account. For this reason, there
will be 12 radio installation points (RIs) that need to
guarantee energy, transmission and Radio Frequency (RF).
Each RI will be composed by radio remote units (RRU’s),
coaxial cables, optical fiber, power points (PPs), rectifiers
and optical distribution frames (ODF´s) per operator.
If in this work, the three operators were taken into
account, for the LTE solution, there will be 6 RRU’s per
antenna, 2 per operator if each band uses a different radio
(separated hardware). In the case of the radio model
support, both 1800 MHz (B3) and 2600 MHz (B7) band
(same hardware), there will be 3 RRU’s per antenna, 1 per
operator. Each RRU communicate with the baseband unit
(BBU) through an optical fiber, per one RRU-BBU
connection are required two optical fibers, so per antenna
12 pars of optical fiber are necessary in the first case and a
half in the second case. Since both B3 and B7 band
combination is not usually to appear in the same radio
equipment, different hardware was considered for each
band. Coaxial cables always make the connection between
the radio equipment (RRU) and the antennas, for that
reason the 6 RRU’s per antenna are placed a meter apart
from the antenna so that the losses are negligible.
In order to ensure MIMO 2x2, for both sectors, the use
of a directional coupler is mandatory, at least when
considering the CNLPX3055F antenna since only has 2-
ports. Knowing that each radio “feeds” an antenna input
port, it is necessary to have at least two 2:1 directional
coupler to combine both signals into one output signal that
connects to the input port of the antenna. So, the frequency
range of the combiner needs to encompass the 1800 MHz
band in one input port and in the other the 2600 MHz band.
If a 2:1 combiner option is not possible, the second option
is to use a 2:2 combiner.
V. MIMO TECHNIQUE
MIMO stands for Multiple Input Multiple Output, where
multiple refers to multiple antennas used simultaneously for
transmission and reception. Using the multipath signal
propagation, that is present in all terrestrial communications,
MIMO is used to improve communication performance,
offering significant increases in data throughput and link
range without using additional bandwidth or transmission
power [1].
The limit to how much data can be transmitted in a given
bandwidth is known as the Shannon-Hartley theorem
(Shannon’s Law), the channel capacity (bits/s) can be
calculated by:
𝐶 ≈ 𝑛 × 𝐵 × log2(1 +𝑆
𝑁) (1)
Where:
n is the number of Tx/Rx antennas;
B is the bandwidth in Hz;
S/N is the signal-to-noise ratio.
According to [2], MIMO and its usage, there is a
significant boost to the number of transmitted information
bits, improving the system throughput and spectral
efficiency. Applying the definition of MIMO nxn directly toto equation (1) means increasing the theoretical maximum
data transfer speed n times when compared to the use of
single-input-single-output (SISO).
The existence of multiple antennas in a system means
existence of different propagation paths. Aiming at
improving the data rate of the system, the spatial
multiplexing method is used, since different portions of the
data are placed in different propagation paths. This
technique consists in sending signals from two or more
different antennas with different data streams. The receiver
can distinguish between the various paths and extract
independent data streams from each when processing the
signals, increasing the peak data rates by a factor of 2 (2x2
configuration).
The more antennas the UE has, the more data can transfer
at once, that means faster wireless download and upload
speeds. To achieve these faster speeds, it requires that the
user is connected with a cellular network that supports 4x4
MIMO. However, only UE belonging to category 5
upwards can support 4x4 MIMO. A UE with low
modulation schemes cannot take full advantage of this
MIMO configuration. This variation of MIMO is now
standard on high-end phones which corresponds to a small
number of smartphones models. Most UE cannot achieve
high modulation schemes like 256-QAM, only the ones
categorized 10 forwards can and most of the time only in
downlink connections. So, the expression “the more MIMO,
the better” is not applicable when the UE is connected to a
cellular network that offers more MIMO but does not
support this type of system.
In stadium environments, it is crucial to think not only in
5
terms of the best theoretical solution but in terms of
reaching and providing a good QoE for the biggest number
of users. It is important to mention too, that a user that can
reach this high modulation (256-QAM) occupies a big part
of the band “stealing” from other users that are not capable.
Nowadays not only for a question of fairness but of costs
too, a 2x2 MIMO system was chosen.
VI. SECTORIZATION AND TRAFFIC PROFILE
Sectorization has a dual purpose in the design of a radio
network, increasing network capacity and minimizing the
number of signals present in the area by limiting sector
coverage. There are three sectorization types: horizontal,
vertical and mixed sectorization that corresponds to hybrid
horizontal-and-vertical sectorization. Limiting the
coverage also limits interference from non-serving sectors,
which improves capacity, signal-to-interference-plus-
noise ratio (SINR) and maximum achievable data rate
(MADR). In Line-of-Sight (LOS) areas like the seating
bowl, sector overlap minimization is achieved by using
highly directional and isolated antennas.
Since stadium, Estádio José Alvalade, is partly covered
by a roof and has a different number of seats in the two
levels/rings of sectorization it is not sufficient to use
horizontal sectorization. The number of seats at the lower
tier (level near the field) is superior to the ones existing at
the upper tier. A vertical sectorization will be a better
choice to mitigate the different quantity of users on both
levels due to its type of coverage. However, the most
efficient and expensive too will be the mixed sectorization.
For this solution, a mixed sectorization was selected.
The number of sectors per carrier depends on the
number of seats, the carrier’s subscriber penetration rate
and the carrier’s mobile traffic profile. The case study
stadium has 50 095 seats distributed by two different levels.
In order to not emphasize one of the three mobile network
operators in Portugal: MEO, NOS or Vodafone, a
subscriber uniform market share was considered, so each
operator has 1/3 of the total seats. It is important to have
into account that not all terminals support LTE technology,
the 4G penetration percentage is about 70% in Portugal
UEs, value revealed by Dense Air at the Small Cells World
Summit 2019 in London [3].
According to [4], to understand the total number of
sectors that should cover the seating area is important to
follow some steps. First, a calculation for the maximum
number of LTE subscribers inside the stadium is required:
50 095 is the total capacity/number of seats, 1/3 of this is
approximately 16 699 seats. Giving a margin of growth
until October, an 80% penetration rate was applied to this
number; there will be 13 360 LTE subscribers per operator.
Secondly, the MIMO data rates considered were taken
from both SINR, and MADR output maps, obtained when
simulating the chosen solution and they are used to obtain
the average data rate per sector. Table 2 resumes this step.
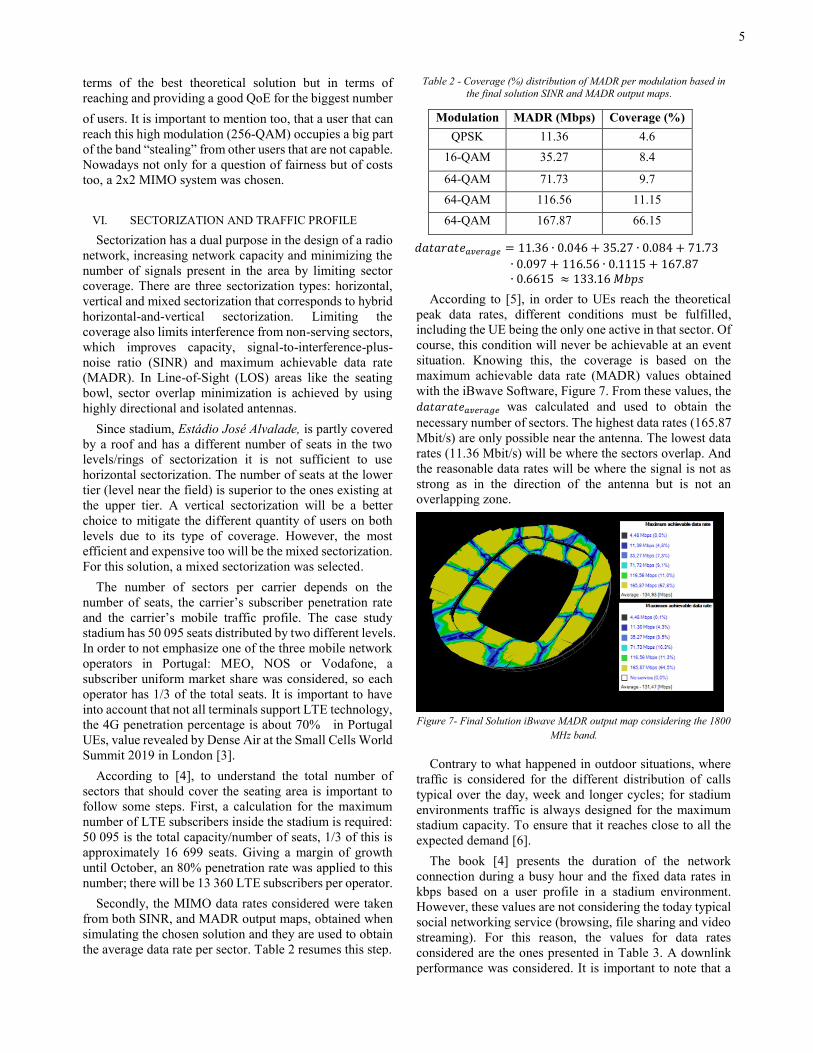
Table 2 - Coverage (%) distribution of MADR per modulation based in
the final solution SINR and MADR output maps.
𝑑𝑎𝑡𝑎𝑟𝑎𝑡𝑒𝑎𝑣𝑒𝑟𝑎𝑔𝑒 = 11.36 ∙ 0.046 + 35.27 ∙ 0.084 + 71.73
∙ 0.097 + 116.56 ∙ 0.1115 + 167.87∙ 0.6615 ≈ 133.16 𝑀𝑏𝑝𝑠
According to [5], in order to UEs reach the theoretical
peak data rates, different conditions must be fulfilled,
including the UE being the only one active in that sector. Of
course, this condition will never be achievable at an event
situation. Knowing this, the coverage is based on the
maximum achievable data rate (MADR) values obtained
with the iBwave Software, Figure 7. From these values, the
𝑑𝑎𝑡𝑎𝑟𝑎𝑡𝑒𝑎𝑣𝑒𝑟𝑎𝑔𝑒 was calculated and used to obtain the
necessary number of sectors. The highest data rates (165.87
Mbit/s) are only possible near the antenna. The lowest data
rates (11.36 Mbit/s) will be where the sectors overlap. And
the reasonable data rates will be where the signal is not as
strong as in the direction of the antenna but is not an
overlapping zone.
Figure 7- Final Solution iBwave MADR output map considering the 1800
MHz band.
Contrary to what happened in outdoor situations, where
traffic is considered for the different distribution of calls
typical over the day, week and longer cycles; for stadium
environments traffic is always designed for the maximum
stadium capacity. To ensure that it reaches close to all the
expected demand [6].
The book [4] presents the duration of the network
connection during a busy hour and the fixed data rates in
kbps based on a user profile in a stadium environment.
However, these values are not considering the today typical
social networking service (browsing, file sharing and video
streaming). For this reason, the values for data rates
considered are the ones presented in Table 3. A downlink
performance was considered. It is important to note that a
Modulation MADR (Mbps) Coverage (%)
QPSK 11.36 4.6
16-QAM 35.27 8.4
64-QAM 71.73 9.7
64-QAM 116.56 11.15
64-QAM 167.87 66.15
6
subscriber can use more than one service type per busy
hour at a stadium environment. The average duration of
video conferencing session is shorter than other venues due
to crowd noise. The value assumed for video streaming
was not the typical average data rate (5120 kbps) since the
video traffic appears embedded in social media and web
pages. These web applications are built in order that a
sufficient quality for video streaming can be achieved with
2000 kbps of data rate.
Table 3- Average data rate [kbps] per type of service (based on [4] and [7]).
Service Service Class Average
Data Rate
[kbps]
Voice Conversational 12.2
Email Background 100.0
Web Browsing Interactive 500.0
File Sharing Interactive 1024.0
Data Download Interactive 1000.0
Social Networking Interactive 384.0
Video Calling Conversational 384.0
Streaming Streaming 2000.0
According to [8], the best way to estimate traffic in the
network is in terms of 'erlangs'. The amount of traffic
generated by a user in one traffic channel for a busy hour.
When a user generates 25 mErl of traffic during the busy
hour is the equivalent to 120 seconds of network usage, i.e.,
2 minutes. One Erlang means that a single circuit is used
100% of the time [6]. The connection duration considered
was based on personal experience.
The blocking rate is the percentage of attempted
network connections that are denied due to insufficient
network resources. In data, connections request is never
denied, for this reason, there is a margin license connection
for users which limits the entrance of users in each carrier.
More users will degrade the cell because the connection
will be delayed until resources are not available. This delay
will give customers the perception of a “slow” network. If
the blocking rate is efficient, a higher wireless utilization
rate would be obtained. However, the aim is to guarantee
the best possible QoE, so the blocking rate is low. Table 4,
shows the connection duration, the data rates and the
desired blocking for the different types of services.
Duty cycle is defined as the ratio of carried traffic to
theoretical maximum traffic when all resources are used
for the full hour. Since the carried traffic corresponds to
the traffic intensity handled, in a peak situation the cell is
loaded, more PRBs are used, so a low value for this
parameter was considered, 10% in this study. In this LTE
capacity calculation, it was assumed that data is
transmitted to each user only once in the LTE frame.
Therefore, a subscriber receives that every 10 ms. So, the
delay between two consecutive data Tx will be 10 ms, and
the transmission duration is 1 ms.
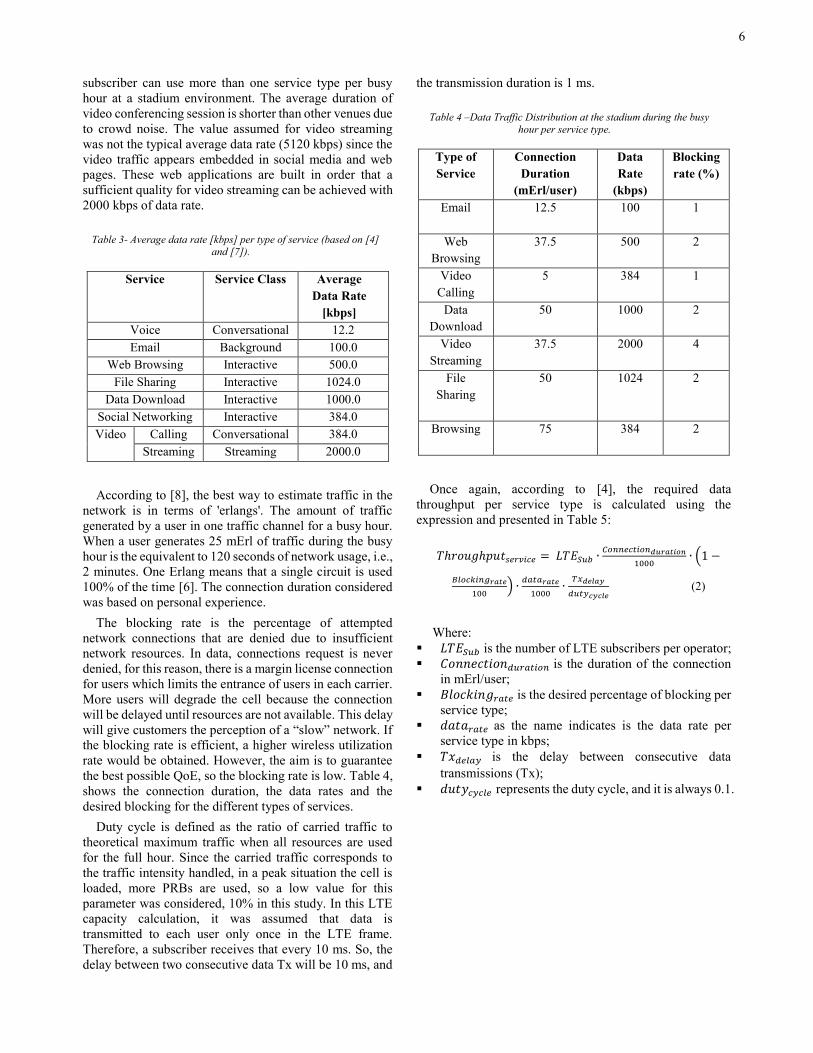
Table 4 –Data Traffic Distribution at the stadium during the busy
hour per service type.
Type of
Service
Connection
Duration
(mErl/user)
Data
Rate
(kbps)
Blocking
rate (%)
Email 12.5 100 1
Web
Browsing
37.5 500 2
Video
Calling
5 384 1
Data
Download
50 1000 2
Video
Streaming
37.5 2000 4
File
Sharing
50 1024 2
Browsing 75 384 2
Once again, according to [4], the required data
throughput per service type is calculated using the
expression and presented in Table 5:
𝑇ℎ𝑟𝑜𝑢𝑔ℎ𝑝𝑢𝑡𝑠𝑒𝑟𝑣𝑖𝑐𝑒 = 𝐿𝑇𝐸𝑆𝑢𝑏 ∙𝐶𝑜𝑛𝑛𝑒𝑐𝑡𝑖𝑜𝑛𝑑𝑢𝑟𝑎𝑡𝑖𝑜𝑛
1000∙ (1 −
𝐵𝑙𝑜𝑐𝑘𝑖𝑛𝑔𝑟𝑎𝑡𝑒
100) ∙
𝑑𝑎𝑡𝑎𝑟𝑎𝑡𝑒
1000∙
𝑇𝑥𝑑𝑒𝑙𝑎𝑦
𝑑𝑢𝑡𝑦𝑐𝑦𝑐𝑙𝑒(2)
Where:
𝐿𝑇𝐸𝑆𝑢𝑏 is the number of LTE subscribers per operator;
𝐶𝑜𝑛𝑛𝑒𝑐𝑡𝑖𝑜𝑛𝑑𝑢𝑟𝑎𝑡𝑖𝑜𝑛 is the duration of the connection
in mErl/user;
𝐵𝑙𝑜𝑐𝑘𝑖𝑛𝑔𝑟𝑎𝑡𝑒 is the desired percentage of blocking per
service type;
𝑑𝑎𝑡𝑎𝑟𝑎𝑡𝑒 as the name indicates is the data rate per
service type in kbps;
𝑇𝑥𝑑𝑒𝑙𝑎𝑦 is the delay between consecutive data
transmissions (Tx);
𝑑𝑢𝑡𝑦𝑐𝑦𝑐𝑙𝑒 represents the duty cycle, and it is always 0.1.
7
Table 5 - Results obtained from the expression (2).
Type of Service Throughput
(Mbit/s)
Email 16.53
Web Browsing 245.49
Video Conferencing 25.39
Data Download 654.64
Video Streaming 961.92
File Sharing 670.35
Browsing 502.76
𝑇ℎ𝑟𝑜𝑢𝑔ℎ𝑝𝑢𝑡𝑡𝑜𝑡𝑎𝑙 = 3077.08 𝑀𝑏𝑖𝑡/𝑠
Considering the distribution of MADR from Table 2, the
number of sectors necessary to obtain the required total
throughput is:
𝑇ℎ𝑟𝑜𝑢𝑔ℎ𝑝𝑢𝑡𝑡𝑜𝑡𝑎𝑙
𝑑𝑎𝑡𝑎𝑟𝑎𝑡𝑒𝑎𝑣𝑒𝑟𝑎𝑔𝑒= 23.11 ≈ 24 𝑠𝑒𝑐𝑡𝑜𝑟𝑠 (3)
In order to guarantee a good QoE for the spectators, 24
sectors are necessary. However, the design and
implementation of a dedicated solution for a large venue,
like the case study, implies a considerable investment cost
so it cannot be implemented only for nowadays traffic
characteristics. The solution needs to be designed in order
to make the investment profitable for as long as possible.
For this reason, the users will be distributed by 40 sectors.
VII. SINR
The performance of any radio channel is not only related
to the absolute signal level, but also the quality of the signal.
When there are active communications between the base
stations (BSs) and the users equipment (UEs), the
interfering power is considered, and the SINR is used to
determine the radio channel conditions for a given UE.
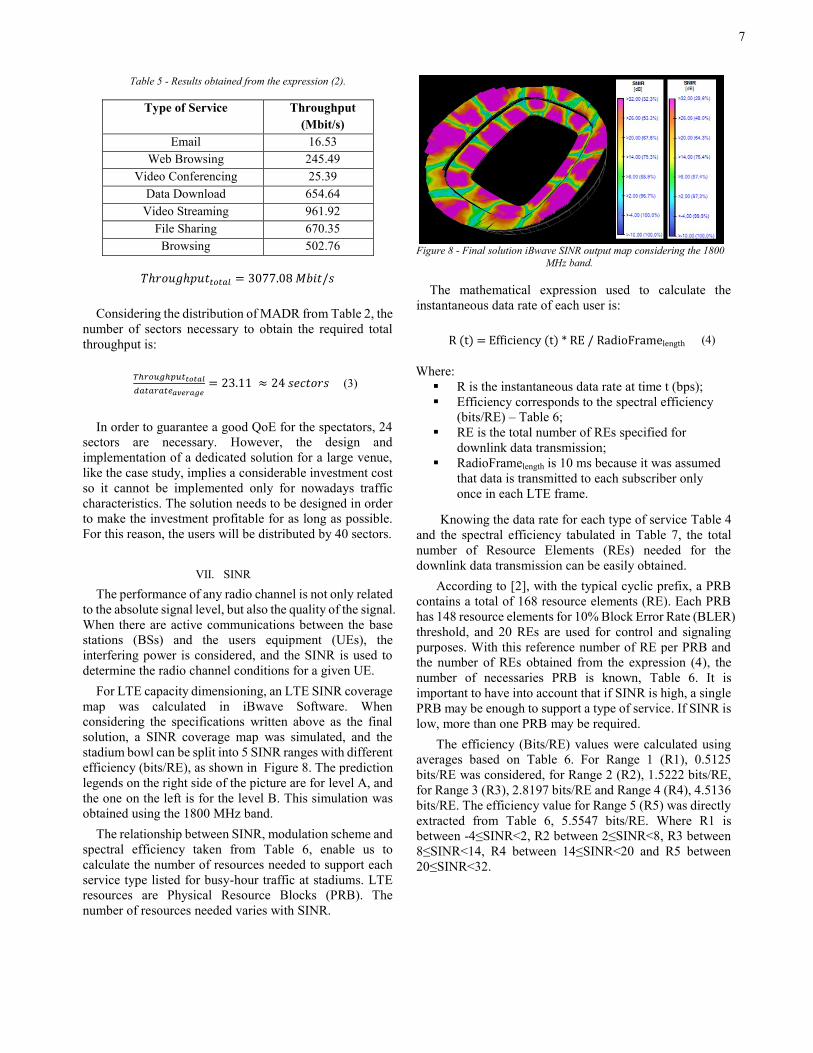
For LTE capacity dimensioning, an LTE SINR coverage
map was calculated in iBwave Software. When
considering the specifications written above as the final
solution, a SINR coverage map was simulated, and the
stadium bowl can be split into 5 SINR ranges with different
efficiency (bits/RE), as shown in Figure 8. The prediction
legends on the right side of the picture are for level A, and
the one on the left is for the level B. This simulation was
obtained using the 1800 MHz band.
The relationship between SINR, modulation scheme and
spectral efficiency taken from Table 6, enable us to
calculate the number of resources needed to support each
service type listed for busy-hour traffic at stadiums. LTE
resources are Physical Resource Blocks (PRB). The
number of resources needed varies with SINR.
Figure 8 - Final solution iBwave SINR output map considering the 1800
MHz band.
The mathematical expression used to calculate the
instantaneous data rate of each user is:
R (t) = Efficiency (t) * RE / RadioFramelength (4)
Where:
R is the instantaneous data rate at time t (bps);
Efficiency corresponds to the spectral efficiency (bits/RE) – Table 6;
RE is the total number of REs specified for downlink data transmission;
RadioFramelength is 10 ms because it was assumed
that data is transmitted to each subscriber only
once in each LTE frame.
Knowing the data rate for each type of service Table 4
and the spectral efficiency tabulated in Table 7, the total
number of Resource Elements (REs) needed for the
downlink data transmission can be easily obtained.
According to [2], with the typical cyclic prefix, a PRB
contains a total of 168 resource elements (RE). Each PRB
has 148 resource elements for 10% Block Error Rate (BLER)
threshold, and 20 REs are used for control and signaling
purposes. With this reference number of RE per PRB and
the number of REs obtained from the expression (4), the
number of necessaries PRB is known, Table 6. It is
important to have into account that if SINR is high, a single
PRB may be enough to support a type of service. If SINR is
low, more than one PRB may be required.
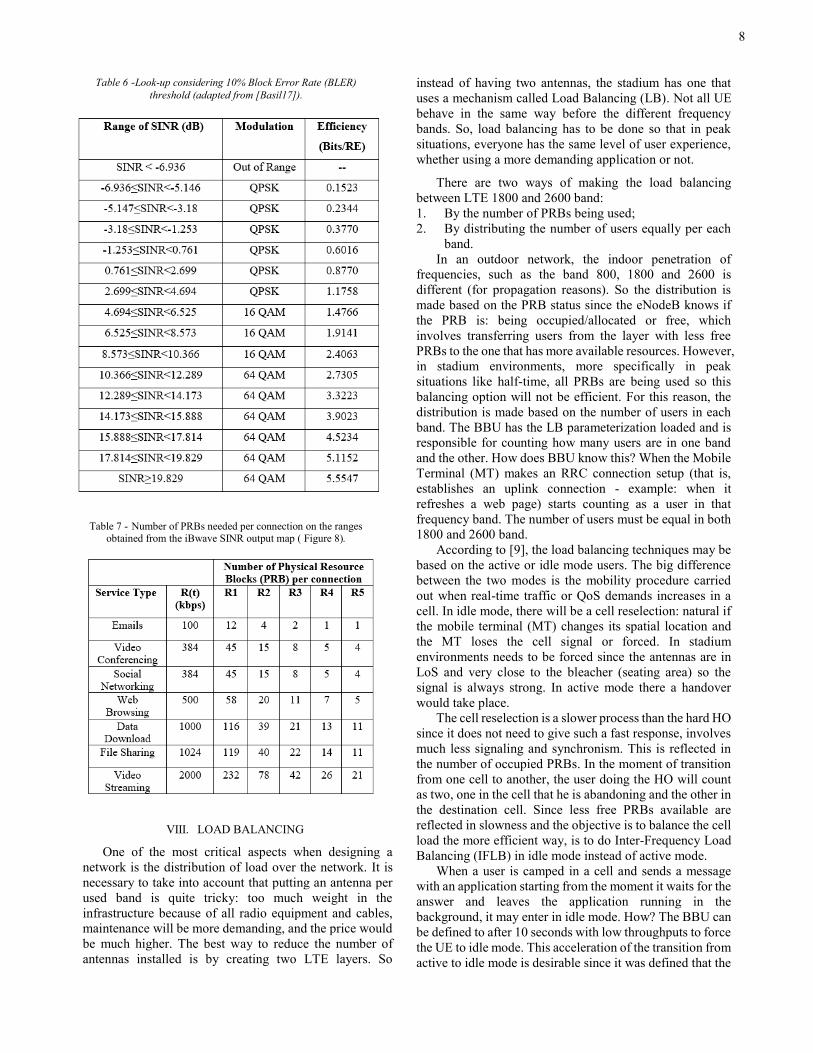
The efficiency (Bits/RE) values were calculated using
averages based on Table 6. For Range 1 (R1), 0.5125
bits/RE was considered, for Range 2 (R2), 1.5222 bits/RE,
for Range 3 (R3), 2.8197 bits/RE and Range 4 (R4), 4.5136
bits/RE. The efficiency value for Range 5 (R5) was directly
extracted from Table 6, 5.5547 bits/RE. Where R1 is
between -4≤SINR<2, R2 between 2≤SINR<8, R3 between
8≤SINR<14, R4 between 14≤SINR<20 and R5 between
20≤SINR<32.
8
Table 6 -Look-up considering 10% Block Error Rate (BLER)
threshold (adapted from [Basil17]).
Table 7 - Number of PRBs needed per connection on the ranges obtained from the iBwave SINR output map ( Figure 8).
VIII. LOAD BALANCING
One of the most critical aspects when designing a
network is the distribution of load over the network. It is
necessary to take into account that putting an antenna per
used band is quite tricky: too much weight in the
infrastructure because of all radio equipment and cables,
maintenance will be more demanding, and the price would
be much higher. The best way to reduce the number of
antennas installed is by creating two LTE layers. So
instead of having two antennas, the stadium has one that
uses a mechanism called Load Balancing (LB). Not all UE
behave in the same way before the different frequency
bands. So, load balancing has to be done so that in peak
situations, everyone has the same level of user experience,
whether using a more demanding application or not.
There are two ways of making the load balancing
between LTE 1800 and 2600 band:
1. By the number of PRBs being used;
2. By distributing the number of users equally per each
band.
In an outdoor network, the indoor penetration of
frequencies, such as the band 800, 1800 and 2600 is
different (for propagation reasons). So the distribution is
made based on the PRB status since the eNodeB knows if
the PRB is: being occupied/allocated or free, which
involves transferring users from the layer with less free
PRBs to the one that has more available resources. However,
in stadium environments, more specifically in peak
situations like half-time, all PRBs are being used so this
balancing option will not be efficient. For this reason, the
distribution is made based on the number of users in each
band. The BBU has the LB parameterization loaded and is
responsible for counting how many users are in one band
and the other. How does BBU know this? When the Mobile
Terminal (MT) makes an RRC connection setup (that is,
establishes an uplink connection - example: when it
refreshes a web page) starts counting as a user in that
frequency band. The number of users must be equal in both
1800 and 2600 band.
According to [9], the load balancing techniques may be
based on the active or idle mode users. The big difference
between the two modes is the mobility procedure carried
out when real-time traffic or QoS demands increases in a
cell. In idle mode, there will be a cell reselection: natural if
the mobile terminal (MT) changes its spatial location and
the MT loses the cell signal or forced. In stadium
environments needs to be forced since the antennas are in
LoS and very close to the bleacher (seating area) so the
signal is always strong. In active mode there a handover
would take place.
The cell reselection is a slower process than the hard HO
since it does not need to give such a fast response, involves
much less signaling and synchronism. This is reflected in
the number of occupied PRBs. In the moment of transition
from one cell to another, the user doing the HO will count
as two, one in the cell that he is abandoning and the other in
the destination cell. Since less free PRBs available are
reflected in slowness and the objective is to balance the cell
load the more efficient way, is to do Inter-Frequency Load
Balancing (IFLB) in idle mode instead of active mode.
When a user is camped in a cell and sends a message
with an application starting from the moment it waits for the
answer and leaves the application running in the
background, it may enter in idle mode. How? The BBU can
be defined to after 10 seconds with low throughputs to force
the UE to idle mode. This acceleration of the transition from
active to idle mode is desirable since it was defined that the
9
LB will occur in idle mode and that with fewer users in
active mode the eNodeB is free for new users to enter.
IX. SIMULATIONS
The first simulation made was using only the
CommScope antenna, designed especially for stadiums,
the CNLPX3055F model. However, it is possible to
observe in
Figure 2 and Figure 3, which for the level B/upper tier,
this solution was not so good. So, the main goal was to
improve the results obtained in the upper tier without
degrading the ones obtained for the lower tier. Identical
output map values for both stadium levels were the results
to achieve.
As explained before, the antennas covering the corners
are closer to the seating area when comparing to other parts
of the bleacher. So, to cover both the upper and lower tier,
the antenna must present a big vertical beamwidth (VB).
For this reason, a second and third simulation were
performed using different antenna models with a wider
vertical beamwidth than the stadium antenna. For
simulation 2, the corner antenna model used was the
CommScope CMAX-DMH60-43-V53 and for simulation
3 was the JMA XGU-FRO-130.
When comparing the RSRP output maps, it was
possible to observe that the signal strength level is higher
and more uniform in simulation 2 than in simulation 3.
These results can be justified by the differences between
both antenna models characteristics. Despite having a
similar VB for the 1800 band, the CommScope antenna
presents a 68 degree horizontal beamwidth (HB) versus the
32 degrees of the JMA antenna. This results in a higher
signal strength level in the corners, higher SINR values and,
consequently, bigger MADR for level B resulted in an
average of 121.53 Mbps for simulation 2 versus 109.79
Mbps for simulation 3, considering 1800 MHz band. Using
the 2600 band, the RSRP Output Maps present drastic
differences from one simulation to the other. This happens
because both JMA antenna VB and HB are smaller than
the beamwidth values of the CommScope antenna. The
signal strength level difference is more visible in the
corners, especially on level A, which reflects on the lower
average values of MADR. Although the difference
between is not so accentuated as expected, this may be
justified by the high gain value of the JMA antenna.
One of the most relevant simulations resulted from
using a discontinued antenna model CMAX-DM60-
CPUSEi53 for the corner antennas, and the best results
were obtained. However, with the same configuration and
conditions, the output maps using the actual antenna model
CMAX-DM60-CPUEV53 were noticeably worse.
Analyzing both antennas datasheets, most parameters were
similar; however, the actual antenna front-to-back ratio
was 3 dB lower. This parameter should have the highest
possible value because of the rooftop characteristics.
After this disappointing result, the closest simulation to
the results obtained in that failed attempt (simulation 5)
were the ones obtained with the final solution. Although
the chosen solution was not so balanced between the results
using both bands as simulation 5 since the front-to-back
ratio varies from one band to the other.
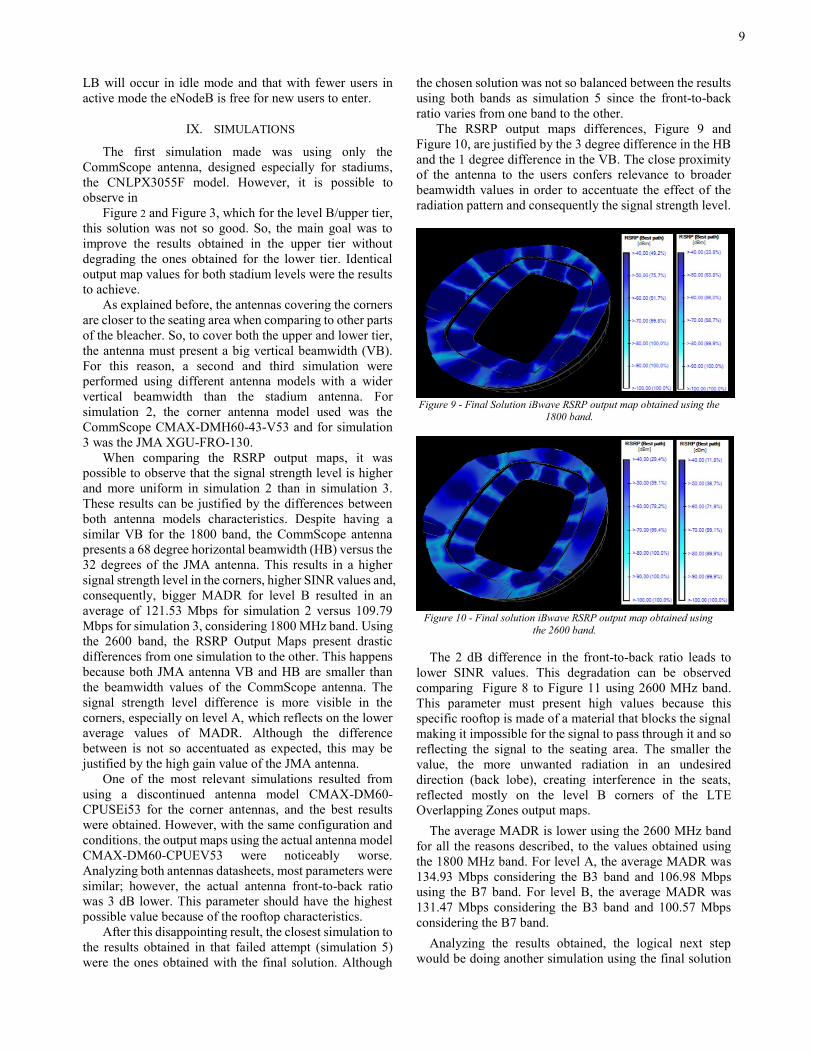
The RSRP output maps differences, Figure 9 and
Figure 10, are justified by the 3 degree difference in the HB
and the 1 degree difference in the VB. The close proximity
of the antenna to the users confers relevance to broader
beamwidth values in order to accentuate the effect of the
radiation pattern and consequently the signal strength level.
Figure 9 - Final Solution iBwave RSRP output map obtained using the
1800 band.
Figure 10 - Final solution iBwave RSRP output map obtained using
the 2600 band.
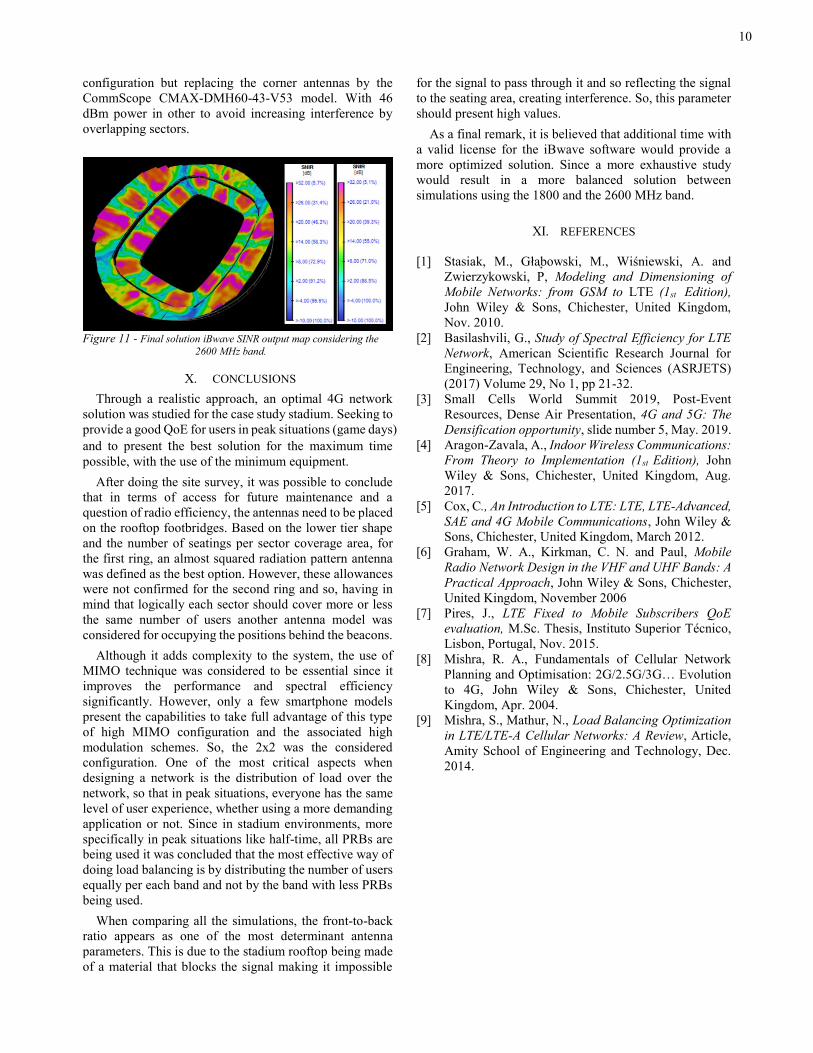
The 2 dB difference in the front-to-back ratio leads to
lower SINR values. This degradation can be observed
comparing Figure 8 to Figure 11 using 2600 MHz band.
This parameter must present high values because this
specific rooftop is made of a material that blocks the signal
making it impossible for the signal to pass through it and so
reflecting the signal to the seating area. The smaller the
value, the more unwanted radiation in an undesired
direction (back lobe), creating interference in the seats,
reflected mostly on the level B corners of the LTE
Overlapping Zones output maps.
The average MADR is lower using the 2600 MHz band
for all the reasons described, to the values obtained using
the 1800 MHz band. For level A, the average MADR was
134.93 Mbps considering the B3 band and 106.98 Mbps
using the B7 band. For level B, the average MADR was
131.47 Mbps considering the B3 band and 100.57 Mbps
considering the B7 band.
Analyzing the results obtained, the logical next step
would be doing another simulation using the final solution
10
configuration but replacing the corner antennas by the
CommScope CMAX-DMH60-43-V53 model. With 46
dBm power in other to avoid increasing interference by
overlapping sectors.
Figure 11 - Final solution iBwave SINR output map considering the
2600 MHz band.
X. CONCLUSIONS
Through a realistic approach, an optimal 4G network
solution was studied for the case study stadium. Seeking to
provide a good QoE for users in peak situations (game days)
and to present the best solution for the maximum time
possible, with the use of the minimum equipment.
After doing the site survey, it was possible to conclude
that in terms of access for future maintenance and a
question of radio efficiency, the antennas need to be placed
on the rooftop footbridges. Based on the lower tier shape
and the number of seatings per sector coverage area, for
the first ring, an almost squared radiation pattern antenna
was defined as the best option. However, these allowances
were not confirmed for the second ring and so, having in
mind that logically each sector should cover more or less
the same number of users another antenna model was
considered for occupying the positions behind the beacons.
Although it adds complexity to the system, the use of
MIMO technique was considered to be essential since it
improves the performance and spectral efficiency
significantly. However, only a few smartphone models
present the capabilities to take full advantage of this type
of high MIMO configuration and the associated high
modulation schemes. So, the 2x2 was the considered
configuration. One of the most critical aspects when
designing a network is the distribution of load over the
network, so that in peak situations, everyone has the same
level of user experience, whether using a more demanding
application or not. Since in stadium environments, more
specifically in peak situations like half-time, all PRBs are
being used it was concluded that the most effective way of
doing load balancing is by distributing the number of users
equally per each band and not by the band with less PRBs
being used.
When comparing all the simulations, the front-to-back
ratio appears as one of the most determinant antenna
parameters. This is due to the stadium rooftop being made
of a material that blocks the signal making it impossible
for the signal to pass through it and so reflecting the signal
to the seating area, creating interference. So, this parameter
should present high values.
As a final remark, it is believed that additional time with
a valid license for the iBwave software would provide a
more optimized solution. Since a more exhaustive study
would result in a more balanced solution between
simulations using the 1800 and the 2600 MHz band.
XI. REFERENCES
[1] Stasiak, M., Głᶏbowski, M., Wiśniewski, A. and
Zwierzykowski, P, Modeling and Dimensioning of
Mobile Networks: from GSM to LTE (1st Edition),
John Wiley & Sons, Chichester, United Kingdom,
Nov. 2010.
[2] Basilashvili, G., Study of Spectral Efficiency for LTE
Network, American Scientific Research Journal for
Engineering, Technology, and Sciences (ASRJETS)
(2017) Volume 29, No 1, pp 21-32.
[3] Small Cells World Summit 2019, Post-Event
Resources, Dense Air Presentation, 4G and 5G: The
Densification opportunity, slide number 5, May. 2019.
[4] Aragon-Zavala, A., Indoor Wireless Communications:
From Theory to Implementation (1st Edition), John
Wiley & Sons, Chichester, United Kingdom, Aug.
2017.
[5] Cox, C., An Introduction to LTE: LTE, LTE‐Advanced,
SAE and 4G Mobile Communications, John Wiley &
Sons, Chichester, United Kingdom, March 2012. [6] Graham, W. A., Kirkman, C. N. and Paul, Mobile
Radio Network Design in the VHF and UHF Bands: A
Practical Approach, John Wiley & Sons, Chichester,
United Kingdom, November 2006
[7] Pires, J., LTE Fixed to Mobile Subscribers QoE
evaluation, M.Sc. Thesis, Instituto Superior Técnico,
Lisbon, Portugal, Nov. 2015.
[8] Mishra, R. A., Fundamentals of Cellular Network
Planning and Optimisation: 2G/2.5G/3G… Evolution
to 4G, John Wiley & Sons, Chichester, United
Kingdom, Apr. 2004.
[9] Mishra, S., Mathur, N., Load Balancing Optimization
in LTE/LTE-A Cellular Networks: A Review, Article,
Amity School of Engineering and Technology, Dec.
2014.