Embed Size (px)
Citation preview
FARM MACHINERY AND POWER
Misr J. Ag. Eng., January 2011 - 1 -
DESIGN AND MANUFACTURE A PROTOTYPE OF
YEMENI COFFEE HULLER MACHINE
Abdel El-Elah Omer Saif*
ABSTRACT
The design, construction and development of a huller is described in this
paper. Some engineering properties were studied as important parameters
affecting the design of the huller machine, and the results showed that, the
highest frequency length, width and thickness of the coffee grains were
1.0, 0.7 and 0.7 cm. The medium size (from 7-10 mm) was denser than
both small and large sizes of coffee as the porosity of that size was lower
than those of both small and large sizes. The angle of repose increased
with the decrease of coffee size. It ranged from 8.75 to 14.30 degrees on
the glass surface. The huller consists basically of a drum, hopper, fan,
motor, frame, belts and pulleys. It was tested at different speeds and
feeding rated. The results indicated that the huller productivity increased
with increasing the drum rotation speed and feeding rate. The
productivity ranged from 240-360 kg/h. It could be used for hulling the
coffee beans at higher rotation speeds with high efficiency.
Keyword: huller, coffee beans, peeling, productivity.
INTRODUCTION
eeling is an important step in the processing of most fruits and
vegetables. Chemical peeling (mostly lye peeling), mechanical
peeling (mainly abrasion peeling), steam peeling and freeze peeling
are conventional methods for peeling in the processing of fruits and
vegetables (Schlimme, Corey, & Frey, 1984; Ben-Shalom, Levi, & Pinto,
1986; Floras, Wetzstein, & Chinnan, 1987; Floras & Chinnan, 1988a, b,
1990; Bolin and Huxoll, 1991; Garrote, Coutaz, Luna, Silva, & Bertone,
1993; Setty, Vijayalakshmi, & Devi, 1993; Garrote, Coutaz, Silva, &
Bertone, 1994; Bayindirli, Bayindirli, Sahin, Sumnu, & Gider, 1996;
Garrote, Silva, Bertone, & Avalle, 1997). Despite providing different
advantages, most of the conventional methods of peeling often cause high
peeling losses and damage the flesh, affecting the quality of the fruit.
Enzymatic peeling was suggested as a more recent alternative.
*Prof. Dr. of Agric. Eng. Dept., Faculty of Agriculture Sana’a Univ., Yemen
P
Misr J. Ag. Eng., 28(1): 1 - 18
FARM MACHINERY AND POWER
Misr J. Ag. Eng., January 2011 - 2 -
Pectin, cellulose and hemi-cellulose are the polysaccharides responsible
for the adherence of the peel to the fruit. Therefore, treating the fruit with
the corresponding lycohydrolases provides the peeling of the fruit (Pretel,
Lozano, Riquelme, & Romojaro, 1997). Since harsh treatments are not
involved, the amount of broken segments and juice losses is much less
than the classical methods and the peeled fruit has a better texture and
appearance (Janser, 1996).
Besides the fact that there is a limited amount of work in literature
regarding enzymatic peeling, almost all of these researches are about
enzymatic peeling of citrus fruits (Ben-Shalom et al., 1986; Rouhana &
Mannheim, 1994; Soffer & Mannheim, 1996; Pretel et al., 1997). As a
result of these studies, the method was proven to be applicable and
optimum peeling condition s of citrus fruits were determined. Following
the researches for the enzymatic peeling of citrus fruits, trials were
conducted for the enzymatic peeling of stone fruits and the feasibility of
the process was shown (Janser, 1996). Better understanding of enzymatic
peeling of stone fruits would probably facilitate and promote its industrial
application. The objectives of this study were to investigate time–
temperature–pH–enzyme concentration relations for enzymatic peeling of
apricots, nectarines and peaches by using four different enzyme
preparations (Peelzym I, II, III and IV) and to determine the optimum
peeling conditions using response surface methodology.
Coffee is an extremely important crop in Yemen. Coffee growing started
since 14th
century, the Yemenis highlands can be considered as secondary
center of origin of Cafea Arabia L (Sylvian, 1956 and Eskes and
Mukred, 1989). In Yemen, coffee grows on valleys and at terraces.
Coffee quality is a function of the inherent characteristics of the cultivars
grown which are then modified by the influences of the environment.
Bean size is the reflection on both these factors and the field husbandry
practices. While the quality is already determined at harvesting and may
not be subsequently improved, poor harvesting and farm processing can
ruin this pre-established quality. Harvesting and farm processing have no
effect on bean size.
FARM MACHINERY AND POWER
Misr J. Ag. Eng., January 2011 - 3 -
The coffee fruit comprises the pulp which houses the parchment,
surrounded by a layer of mucilage. The fruit of the Arabica coffee in
which the pulp is removed from the ripe fruit by a pulping process, the
mucilaging and washing processes and the parchments are dried on the
estate where they are grown. The dried parchment and cherry are further
processed by hulling, sorting and grading.
Many researches have been carried out on the physical and engineering
properties of the agricultural products (Mohsenin, 1970; Abd Alla et al.,
1995; Korayem and Soliman, 1983; Muir and Sinha, 1988; Kukelko
et al., 1988; Irvine et al, 1992; and El-Raie et al., 1996). The
information on size, density, and crushing strength are required for the
development of the grading system for barriers and for the pulpers (Gosh,
1969). The physical properties such as size, friction angle, angle of
repose, crushing strength and bulk density are important in the design of
the handling system, grading and hulling (Chandrasekar and
Viswanathan, 1999). Abd Alla et al. (1995) reported that the shape
index and coefficient of contact surface had a high significant effect on
the rupture force and broken percentage in milling process of rice grains
Surface areas of fruits are important in investigations related to spray
coverage, respiration rate, light reflectance, color evaluation and heat
transfer studies in heating and cooling processes (Mohsenin, 1970).
The characteristic flavor and aroma of coffee result from a combination of
hundreds of chemical compounds produced by the reactions that occur
during roasting. This process can be divided into three consecutive stages:
(i) drying, (ii) roasting or pyrolysis and (iii) cooling. The first stage is
characterized by a slow release of water and volatile substances, during
the first half of processing. Bean color changes from green to yellow.
Pyrolysis reactions take place during the second stage, resulting in
considerable changes in both physical and chemical properties of the
beans. Large quantities of CO2, water and volatile substances are released
and the beans turn brown, due to sugar caramelization coupled to Maillard
reactions. At this point cooling is required in order to avoid burning the
coffee (Sivetz & Desrosier, 1979; Rodrigues, Borges, Franca, Oliveira, &
Correa, 2003).
FARM MACHINERY AND POWER
Misr J. Ag. Eng., January 2011 - 4 -
Roasting is a complex process from a chemistry point of view, since
hundreds of chemical reactions take place simultaneously. Some
examples include Maillard and Strecker reactions, degradation of
proteins, polysaccharides, trigonelline and chlorogenic acids (De Maria,
Trugo, Aquino Neto, Moreira, & Alviano, 1996). Sugars and trigonelline
will act as aroma precursors, originating several substances (furans,
pyrazines, pirroles, pyridines, etc.) that will affect both the flavor and
aroma of the beverage. Thermal degradation of chlorogenic acids will
result on phenolic substances that will contribute to bitterness (Clifford,
1985). Even though caffeine does not take part in any reaction, it should
also contribute to bitterness, besides its known pharmacological effects
(Macrae, 1985). Thus, evaluation of trigonelline, chlorogenic acids and
caffeine, in both green and roasted coffee, could be of relevance in
establishing coffee quality. Furthermore, a few studies have proposed the
use of these substances for determination of the degree of roast (Stennert
& Maier, 1996), as genotype selection criteria (Guerrero & Suárez, 2001)
and for species differentiation (Martín, Pablos, & González, 1998; Ky et
al., 2001). The quality of coffee is commonly evaluated according to
criteria such as bean size, color, shape, processing method, crop year,
flavor and presence of defects (Banks, McFadden, & Atkinson, 1999).
Among those, flavor (cup quality) and presence of defects (type
classification) are the most important criteria employed worldwide in
coffee trading.
The high labour demand of coffee production and processing, Coffee
peeling is the most labour intensive operation in coffee processing,
involving tedious time-consuming manual labour. The main objective of
this study was to design and manufacture a prototype of coffee huller
machine which assure good quality and saving energy.
EXPERIMENTAL PROCEDURES
The coffee used in the study was obtained from a local market. The study
was carried out on the most common variety namely, Esmaely. The
coffee berries were cleaned manually by hand removal of all foreign
matter such as stones, dirt and broken seeds. The engineering parameters
of this variety were studied.
FARM MACHINERY AND POWER
Misr J. Ag. Eng., January 2011 - 5 -
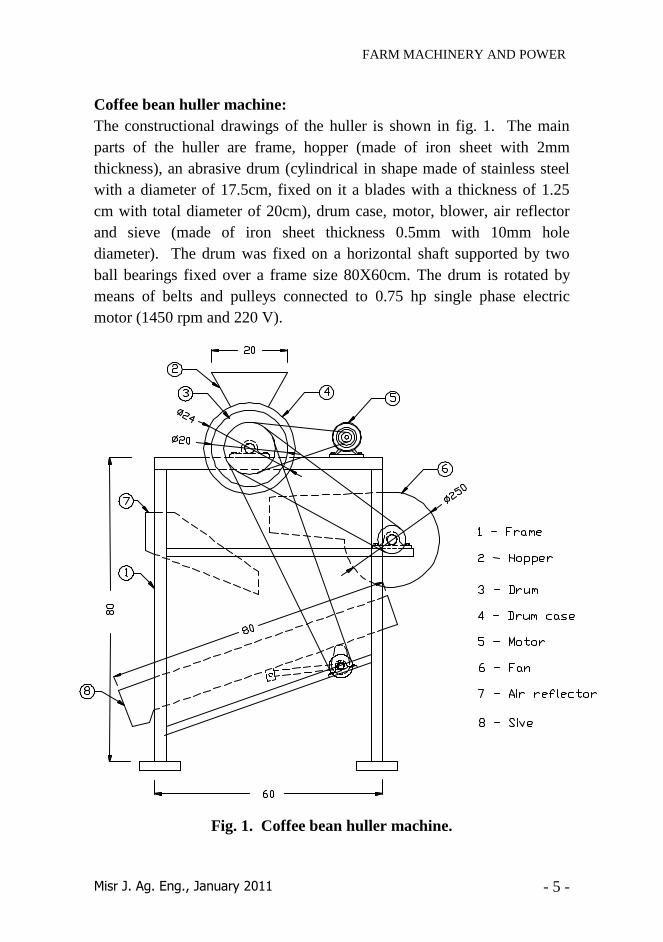
Coffee bean huller machine:
The constructional drawings of the huller is shown in fig. 1. The main
parts of the huller are frame, hopper (made of iron sheet with 2mm
thickness), an abrasive drum (cylindrical in shape made of stainless steel
with a diameter of 17.5cm, fixed on it a blades with a thickness of 1.25
cm with total diameter of 20cm), drum case, motor, blower, air reflector
and sieve (made of iron sheet thickness 0.5mm with 10mm hole
diameter). The drum was fixed on a horizontal shaft supported by two
ball bearings fixed over a frame size 80X60cm. The drum is rotated by
means of belts and pulleys connected to 0.75 hp single phase electric
motor (1450 rpm and 220 V).
Fig. 1. Coffee bean huller machine.
FARM MACHINERY AND POWER
Misr J. Ag. Eng., January 2011 - 6 -
The machine was set for the experiment, a sample of 4,5, 6 kg of coffee
grains was weighed and fed into the machine drum, the drum was rotated
at speeds of 150, 200 and 250 rpm. The speed was varied by changing
the pulley of the drum shaft. Each experiment was carried out in triplicate
and average values are reported:
Apparatus and Procedure
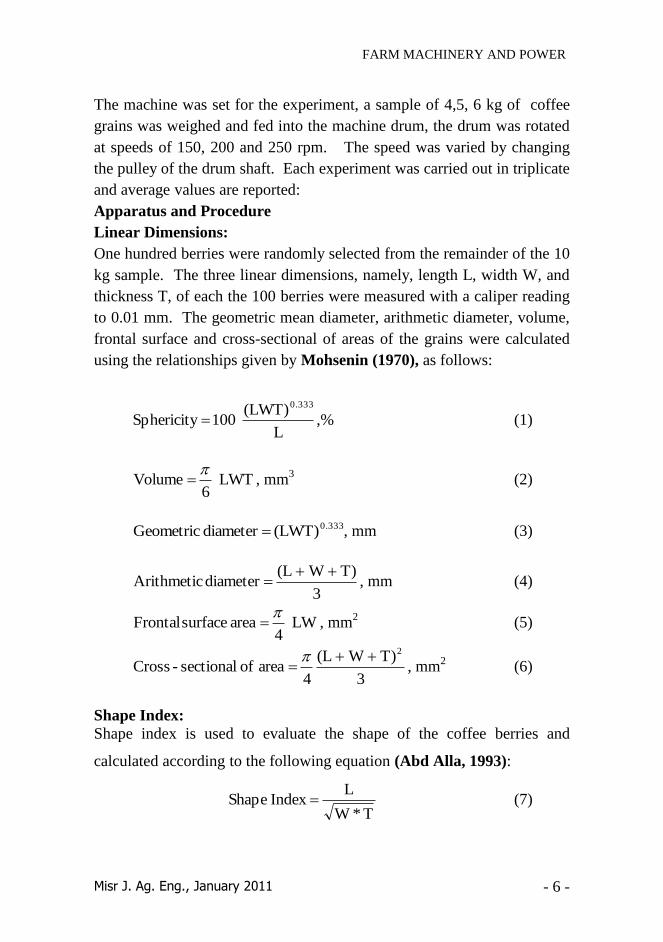
Linear Dimensions:
One hundred berries were randomly selected from the remainder of the 10
kg sample. The three linear dimensions, namely, length L, width W, and
thickness T, of each the 100 berries were measured with a caliper reading
to 0.01 mm. The geometric mean diameter, arithmetic diameter, volume,
frontal surface and cross-sectional of areas of the grains were calculated
using the relationships given by Mohsenin (1970), as follows:
,%L
(LWT) 100 Sphericity
0.333
(1)
LWT 6
Volume
, mm3
(2)
0.333(LWT) diameter Geometric , mm (3)
3
T)W(L diameter Arithmetic
, mm (4)
LW 4
area surface Frontal
, mm2
(5)
3
T)W(L
4 area of sectional- Cross
2
, mm2
(6)
Shape Index:
Shape index is used to evaluate the shape of the coffee berries and
calculated according to the following equation (Abd Alla, 1993):
T*W
L Index Shape (7)
FARM MACHINERY AND POWER
Misr J. Ag. Eng., January 2011 - 7 -
The coffee berry is considered an oval if the shape index > 1.5 on the
other hand it is considered spherical if the shape index ≤ 1.5.
Coefficient of Contact Surface:
The coefficient of contact surface is very important parameter to evaluate
the contact surface between the berry and the other surfaces such as
milling machine’s surface. This coefficient can be calculated using the
following equation (Abd Alla, 1993):
100*A
A surfacecontact oft Coefficien
f
f tA (8)
Where:
Af is the frontal surface area = /4 * L*W , mm2
At is the transverse surface area = /4 * T*W , mm2
Determination of Bulk Density of the Coffee Berries:
The bulk density of the coffee berry was measured by filling a circular
container of 1L volume and weighing the contents. It was calculated from
the mass and volume.
Determination of Angle of Repose
The repose angle of the three categories of the coffee varieties was
determined by allowing the parchment to flow on a plate to form a pile
and the angle of repose is measured by fixing a protractor on the side of
the plate.
Determination of Coefficient of Static Friction:
The need for knowledge of the coefficient of friction of the agricultural
materials on various surfaces has long been recognized by engineers
concerned with rational design of grain bins, silos and other storage
structures. Coefficient of static friction is the ratio of the force required to
slide grain over a surface divided by the normal force pressing the grain
against the surface. Coefficients of friction were determined for grain on
four surfaces: galvanized steel, plywood, tin plate and glass. The material
surface was fastened to tilting table. A frame made with square wooden
bars was placed on the surface. The frame was filled with berries. The
table was tilted slowly manually until movement of the whole gain mass
and frame was detected by the operator. The coefficient of friction was
FARM MACHINERY AND POWER
Misr J. Ag. Eng., January 2011 - 8 -
the tangent of the slope angle of the table measured with a protractor (Oje
and Ugbor, 1991).
RESULTS AND DISCUSSIONS
Engineering properties:
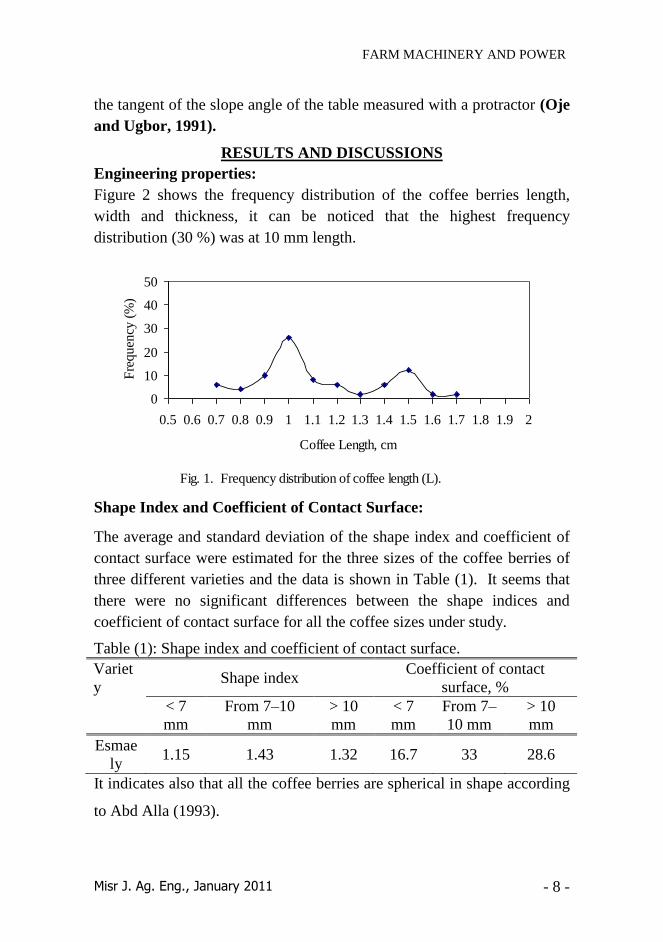
Figure 2 shows the frequency distribution of the coffee berries length,
width and thickness, it can be noticed that the highest frequency
distribution (30 %) was at 10 mm length.
Fig. 1. Frequency distribution of coffee length (L).
0
10
20
30
40
50
0.5 0.6 0.7 0.8 0.9 1 1.1 1.2 1.3 1.4 1.5 1.6 1.7 1.8 1.9 2
Coffee Length, cm
Fre
quen
cy (
%)
Shape Index and Coefficient of Contact Surface:
The average and standard deviation of the shape index and coefficient of
contact surface were estimated for the three sizes of the coffee berries of
three different varieties and the data is shown in Table (1). It seems that
there were no significant differences between the shape indices and
coefficient of contact surface for all the coffee sizes under study.
Table (1): Shape index and coefficient of contact surface.
Variet
y Shape index
Coefficient of contact
surface, %
< 7
mm
From 7–10
mm
> 10
mm
< 7
mm
From 7–
10 mm
> 10
mm
Esmae
ly 1.15 1.43 1.32 16.7 33 28.6
It indicates also that all the coffee berries are spherical in shape according
to Abd Alla (1993).
FARM MACHINERY AND POWER
Misr J. Ag. Eng., January 2011 - 9 -
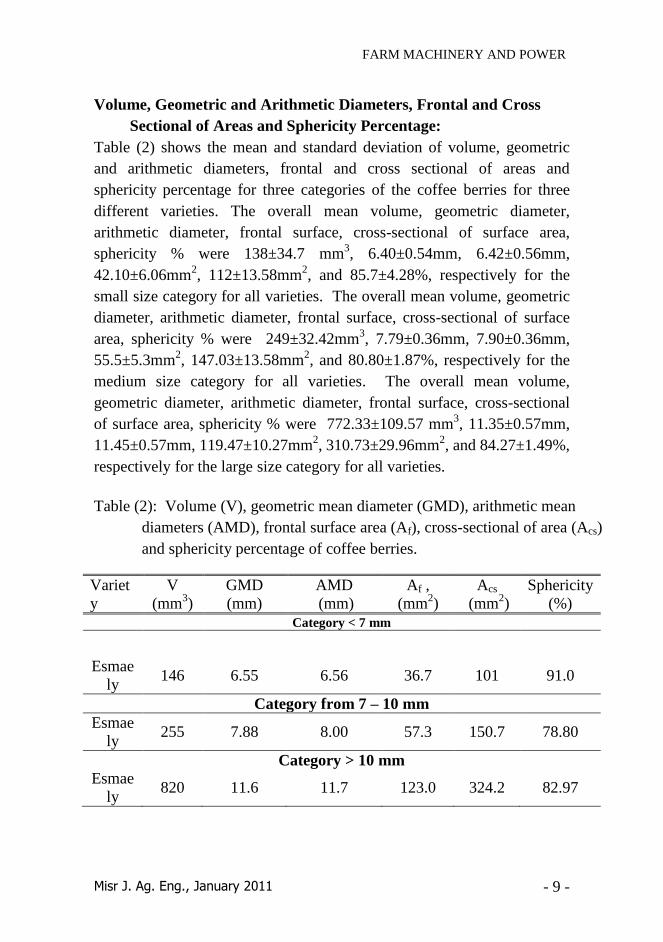
Volume, Geometric and Arithmetic Diameters, Frontal and Cross
Sectional of Areas and Sphericity Percentage:
Table (2) shows the mean and standard deviation of volume, geometric
and arithmetic diameters, frontal and cross sectional of areas and
sphericity percentage for three categories of the coffee berries for three
different varieties. The overall mean volume, geometric diameter,
arithmetic diameter, frontal surface, cross-sectional of surface area,
sphericity % were 138±34.7 mm3, 6.40±0.54mm, 6.42±0.56mm,
42.10±6.06mm2, 112±13.58mm
2, and 85.7±4.28%, respectively for the
small size category for all varieties. The overall mean volume, geometric
diameter, arithmetic diameter, frontal surface, cross-sectional of surface
area, sphericity % were 249±32.42mm3, 7.79±0.36mm, 7.90±0.36mm,
55.5±5.3mm2, 147.03±13.58mm
2, and 80.80±1.87%, respectively for the
medium size category for all varieties. The overall mean volume,
geometric diameter, arithmetic diameter, frontal surface, cross-sectional
of surface area, sphericity % were 772.33±109.57 mm3, 11.35±0.57mm,
11.45±0.57mm, 119.47±10.27mm2, 310.73±29.96mm
2, and 84.27±1.49%,
respectively for the large size category for all varieties.
Table (2): Volume (V), geometric mean diameter (GMD), arithmetic mean
diameters (AMD), frontal surface area (Af), cross-sectional of area (Acs)
and sphericity percentage of coffee berries.
Variet
y
V
(mm3)
GMD
(mm)
AMD
(mm)
Af ,
(mm2)
Acs
(mm2)
Sphericity
(%)
Category < 7 mm
Esmae
ly 146 6.55 6.56 36.7 101 91.0
Category from 7 – 10 mm
Esmae
ly 255 7.88 8.00 57.3 150.7 78.80
Category > 10 mm
Esmae
ly 820 11.6 11.7 123.0 324.2 82.97
FARM MACHINERY AND POWER
Misr J. Ag. Eng., January 2011 - 10 -
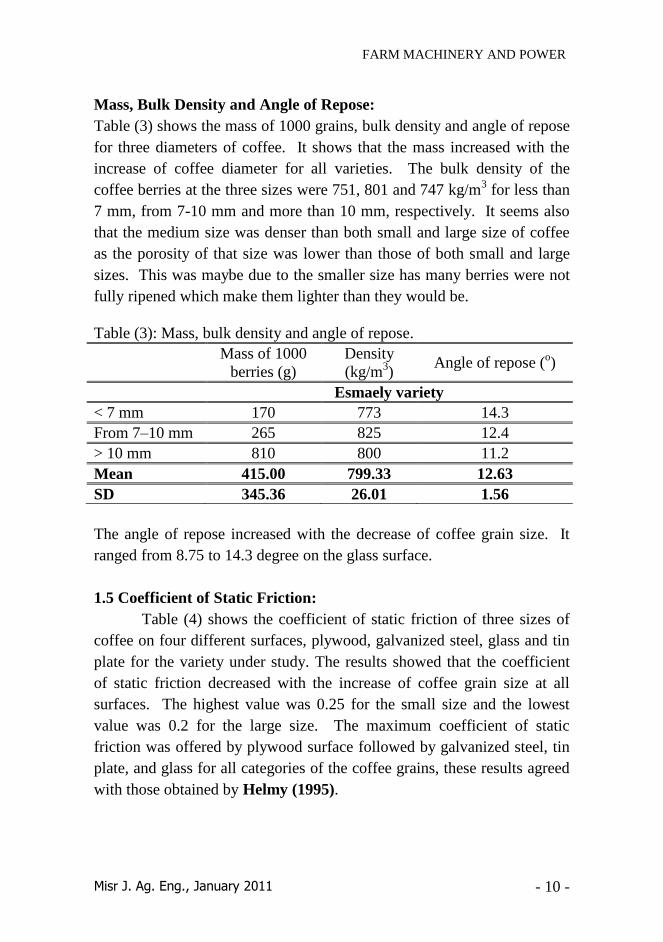
Mass, Bulk Density and Angle of Repose:
Table (3) shows the mass of 1000 grains, bulk density and angle of repose
for three diameters of coffee. It shows that the mass increased with the
increase of coffee diameter for all varieties. The bulk density of the
coffee berries at the three sizes were 751, 801 and 747 kg/m3 for less than
7 mm, from 7-10 mm and more than 10 mm, respectively. It seems also
that the medium size was denser than both small and large size of coffee
as the porosity of that size was lower than those of both small and large
sizes. This was maybe due to the smaller size has many berries were not
fully ripened which make them lighter than they would be.
Table (3): Mass, bulk density and angle of repose.
Mass of 1000
berries (g)
Density
(kg/m3)
Angle of repose (o)
Esmaely variety
< 7 mm 170 773 14.3
From 7–10 mm 265 825 12.4
> 10 mm 810 800 11.2
Mean 415.00 799.33 12.63
SD 345.36 26.01 1.56
The angle of repose increased with the decrease of coffee grain size. It
ranged from 8.75 to 14.3 degree on the glass surface.
1.5 Coefficient of Static Friction:
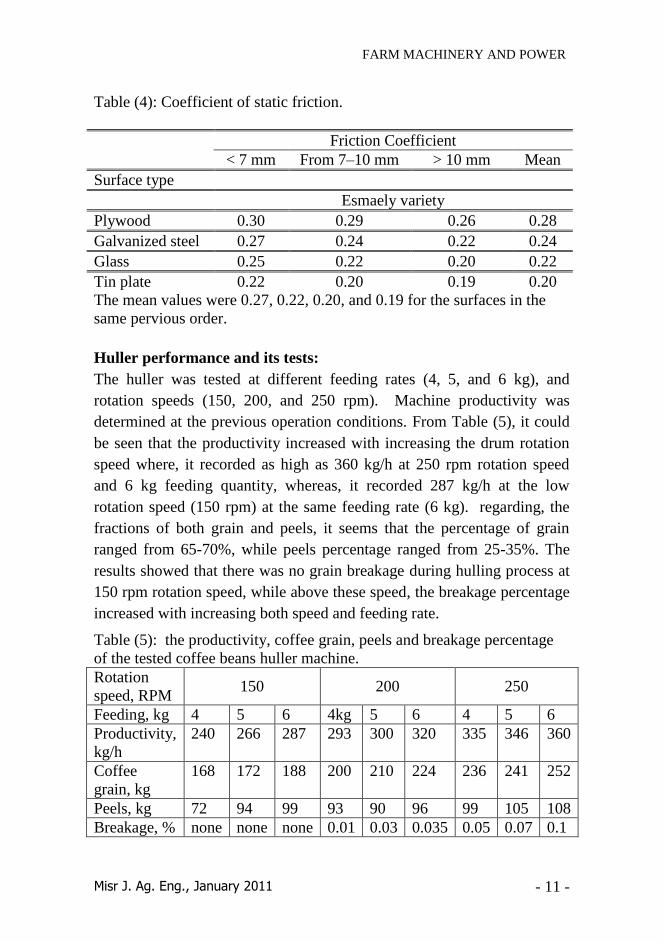
Table (4) shows the coefficient of static friction of three sizes of
coffee on four different surfaces, plywood, galvanized steel, glass and tin
plate for the variety under study. The results showed that the coefficient
of static friction decreased with the increase of coffee grain size at all
surfaces. The highest value was 0.25 for the small size and the lowest
value was 0.2 for the large size. The maximum coefficient of static
friction was offered by plywood surface followed by galvanized steel, tin
plate, and glass for all categories of the coffee grains, these results agreed
with those obtained by Helmy (1995).
FARM MACHINERY AND POWER
Misr J. Ag. Eng., January 2011 - 11 -
Table (4): Coefficient of static friction.
Friction Coefficient
< 7 mm From 7–10 mm > 10 mm Mean
Surface type
Esmaely variety
Plywood 0.30 0.29 0.26 0.28
Galvanized steel 0.27 0.24 0.22 0.24
Glass 0.25 0.22 0.20 0.22
Tin plate 0.22 0.20 0.19 0.20
The mean values were 0.27, 0.22, 0.20, and 0.19 for the surfaces in the
same pervious order.
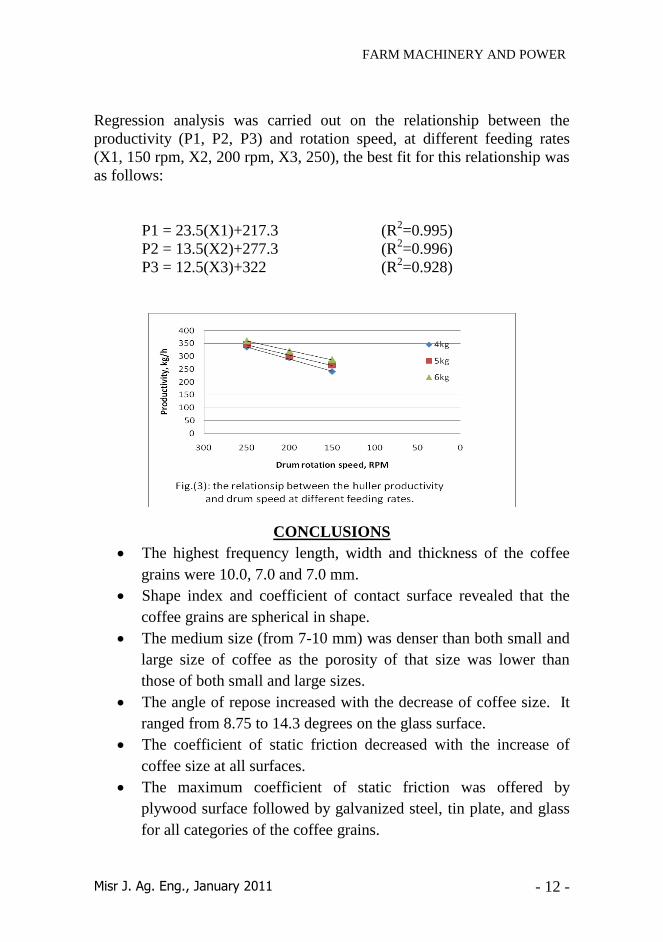
Huller performance and its tests:
The huller was tested at different feeding rates (4, 5, and 6 kg), and
rotation speeds (150, 200, and 250 rpm). Machine productivity was
determined at the previous operation conditions. From Table (5), it could
be seen that the productivity increased with increasing the drum rotation
speed where, it recorded as high as 360 kg/h at 250 rpm rotation speed
and 6 kg feeding quantity, whereas, it recorded 287 kg/h at the low
rotation speed (150 rpm) at the same feeding rate (6 kg). regarding, the
fractions of both grain and peels, it seems that the percentage of grain
ranged from 65-70%, while peels percentage ranged from 25-35%. The
results showed that there was no grain breakage during hulling process at
150 rpm rotation speed, while above these speed, the breakage percentage
increased with increasing both speed and feeding rate.
Table (5): the productivity, coffee grain, peels and breakage percentage
of the tested coffee beans huller machine.
Rotation
speed, RPM 150 200 250
Feeding, kg 4 5 6 4kg 5 6 4 5 6
Productivity,
kg/h
240 266 287 293 300 320 335 346 360
Coffee
grain, kg
168 172 188 200 210 224 236 241 252
Peels, kg 72 94 99 93 90 96 99 105 108
Breakage, % none none none 0.01 0.03 0.035 0.05 0.07 0.1
FARM MACHINERY AND POWER
Misr J. Ag. Eng., January 2011 - 12 -
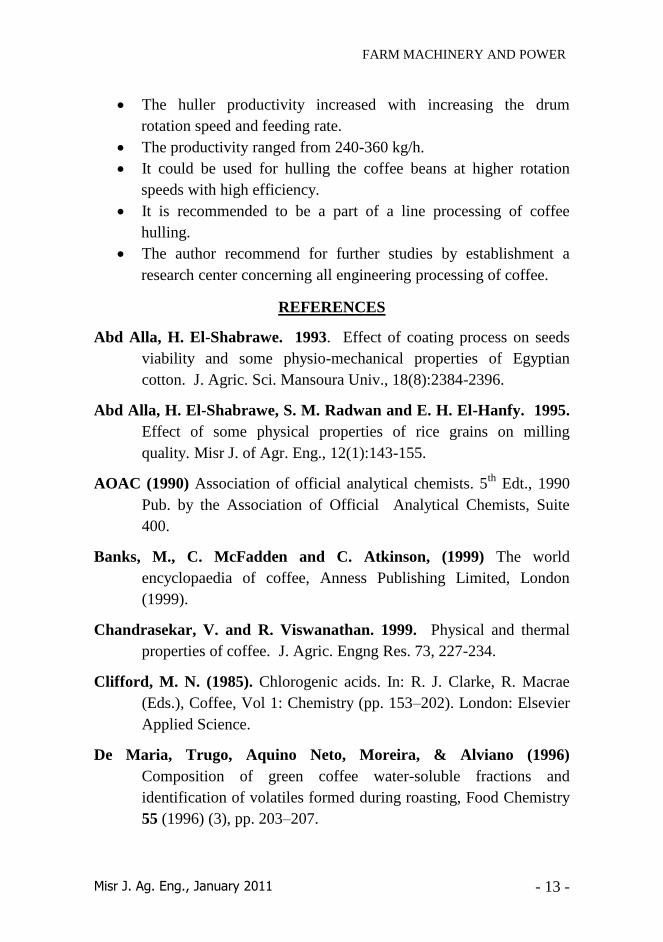
Regression analysis was carried out on the relationship between the
productivity (P1, P2, P3) and rotation speed, at different feeding rates
(X1, 150 rpm, X2, 200 rpm, X3, 250), the best fit for this relationship was
as follows:
P1 = 23.5(X1)+217.3 (R2=0.995)
P2 = 13.5(X2)+277.3 (R2=0.996)
P3 = 12.5(X3)+322 (R2=0.928)
CONCLUSIONS
The highest frequency length, width and thickness of the coffee
grains were 10.0, 7.0 and 7.0 mm.
Shape index and coefficient of contact surface revealed that the
coffee grains are spherical in shape.
The medium size (from 7-10 mm) was denser than both small and
large size of coffee as the porosity of that size was lower than
those of both small and large sizes.
The angle of repose increased with the decrease of coffee size. It
ranged from 8.75 to 14.3 degrees on the glass surface.
The coefficient of static friction decreased with the increase of
coffee size at all surfaces.
The maximum coefficient of static friction was offered by
plywood surface followed by galvanized steel, tin plate, and glass
for all categories of the coffee grains.
FARM MACHINERY AND POWER
Misr J. Ag. Eng., January 2011 - 13 -
The huller productivity increased with increasing the drum
rotation speed and feeding rate.
The productivity ranged from 240-360 kg/h.
It could be used for hulling the coffee beans at higher rotation
speeds with high efficiency.
It is recommended to be a part of a line processing of coffee
hulling.
The author recommend for further studies by establishment a
research center concerning all engineering processing of coffee.
REFERENCES
Abd Alla, H. El-Shabrawe. 1993. Effect of coating process on seeds
viability and some physio-mechanical properties of Egyptian
cotton. J. Agric. Sci. Mansoura Univ., 18(8):2384-2396.
Abd Alla, H. El-Shabrawe, S. M. Radwan and E. H. El-Hanfy. 1995.
Effect of some physical properties of rice grains on milling
quality. Misr J. of Agr. Eng., 12(1):143-155.
AOAC (1990) Association of official analytical chemists. 5th
Edt., 1990
Pub. by the Association of Official Analytical Chemists, Suite
400.
Banks, M., C. McFadden and C. Atkinson, (1999) The world
encyclopaedia of coffee, Anness Publishing Limited, London
(1999).
Chandrasekar, V. and R. Viswanathan. 1999. Physical and thermal
properties of coffee. J. Agric. Engng Res. 73, 227-234.
Clifford, M. N. (1985). Chlorogenic acids. In: R. J. Clarke, R. Macrae
(Eds.), Coffee, Vol 1: Chemistry (pp. 153–202). London: Elsevier
Applied Science.
De Maria, Trugo, Aquino Neto, Moreira, & Alviano (1996)
Composition of green coffee water-soluble fractions and
identification of volatiles formed during roasting, Food Chemistry
55 (1996) (3), pp. 203–207.
FARM MACHINERY AND POWER
Misr J. Ag. Eng., January 2011 - 14 -
Bayindirli, L., Bayindirli, A., Sahin, S., Sumnu, G., & Gider, S.
(1996). Studies on caustic peelingof apples. Journal of Food
Science and Technology, 33, 240–242.
Ben-Shalom, N., Levi, A., & Pinto, R. (1986). Pectolytic enzyme studies
for peeling of grapefruit segment membrane. Journal of Food
Science, 51, 421–423.
Bolin, H. R., & Huxoll, C. C. (1991). Control of minimally processed
carrot (Daucus carota) surface discoloration caused by abrasion
peeling. Journal of Food Science, 56, 416–418.
Box, G. E. P., & Draper, N. R. (1987). Empirical model-building and
response surfaces. New York: Wiley.
Floras, J. D., & Chinnan, M. S. (1988a). Seven factor response surface
optimization of a double-stage lye (NaOH) peeling process for pimiento
peppers. Journal of Food Science, 53, 631–638.
Floras, J. D., & Chinnan, M. S. (1988b). Microstructural
changesduringsteam peelingof fruits and vegetables. Journal of
Food Science, 53, 849–853.
Floras, J. D., & Chinnan, M. S. (1990). Diffusion phenomena
duringchemical (NaOH) peelingof tomatoes. Journal of Food
Science, 55, 552–553.
Floras, J. D., Wetzstein, H. Y., & Chinnan, M. S. (1987). Chemical
(NaOH) peelingas viewed by scanning electron microscopy:
Pimiento peppers as a case study. Journal of Food Science,
52,1312–1316.
Garrote, R. L., Coutaz, V. R., Luna, J. A., Silva, E. R., & Bertone, R.
A. (1993). Optimizingprocessing conditions for chemical
peelingof potatoes using response surface methodology. Journal of
Food Science, 58, 821–826.
Garrote, R. L., Coutaz, V. R., Silva, E. R., & Bertone, R. A. (1994).
Determiningprocess conditions for chemical peelingof asparagus.
Lebensmittel-Wissenschaft und Technologie, 27, 19–22.
FARM MACHINERY AND POWER
Misr J. Ag. Eng., January 2011 - 15 -
Garrote, R. L., Silva, E. R., Bertone, R. A., & Avalle, A. (1997). Effect
of time and number of cycles on yield and peelingquality of steam
peeled potatoes and asparagus. Lebensmittel-Wissenschaft und
Technologie, 30, 448–451.
Janser, E. (1996). Enzymatic peelingof fruit. Food Processing, 3, 1–4.
Javeri, H., Toledo, R., & Wicker, L. (1991). Vacuum infusion of
pectinmethylesterase and calcium effects on firmness of peaches.
Journal of Food Science, 56, 739–742.
Mcardle, R. N., & Culver, C. A. (1994). Enzyme infusion: A
developingtechnolog y. Food Technology, 8, 85–89.
Myers, R. H. (1971). Response surface methodology. Boston: Allyn and
Bacon Inc.
Pretel, M. T., Lozano, P., Riquelme, F., & Romojaro, F. (1997). Pectic
enzymes in fresh fruit processing: Optimization of enzymic
peeling of oranges. Process Biochemistry, 32, 43–49.
Rouhana, A., & Mannheim, C. H. (1994). Optimization of enzymatic
peelingof grapefruit. Lebensmittel-Wissenschaft und Technologie,
27, 103–107.
Schlimme, D. V., Corey, K. A., & Frey, B. C. (1984). Evaluation of lye
and steam peelingusingfour processing tomato cultivars. Journal
of Food Science, 49, 1415–1418.
Setty, G. R., Vijayalakshmi, M. R., & Devi, A. U. (1993). Methods for
peelingfruits and vegetables: A critical evaluation. Journal of Food
Science and Technology, 30, 155–162.
Soffer, T., & Mannheim, C. H. (1996). Optimization of enzymatic
peelingof oranges and pomelo. Lebensmittel-Wissenschaft und
Technologie, 27, 245–248.
Thompson, D. (1982). Response surface experimentation. Journal of
Food Processing and Preservation, 6, 155–188.
FARM MACHINERY AND POWER
Misr J. Ag. Eng., January 2011 - 16 -
Dutta, S. K., Nema. V. K. and R. K. Bhardwaj. 1972. Physical
properties of gram. J. Agric. Eng. Res. 12, 128-137.
El- Raie, A. E.S., Hendawy, N. A. and A.Z. Taib. 1996. Study of
physical and engineering properties for some agricultural
products. Misr J. of Agr. Eng., 13(1):211-226.
Eskes, A. B. and Mukred, A. W. O. 1989. Coffee survey in PDR
Yemen. ASIC, 13, Colloque, Piape, pp 582-590.
Franca, A. S., Oliveira, Mendonça, J.C.F., & Silva (2004) Physical and
chemical attributes of defective crude and roasted coffee beans,
Food Chemistry 90 (2004) (1–2), pp. 84–89.
Gosh, B. N. 1969. Physical properties of the different grades of arabica
beans. Transactions of the ASAE, 9(3):592-593.
Helmy, M. A. 1995. Determination of static friction coefficient of some
Egyptian agricultural products on various surfaces. Misr J. of Agr.
Eng., 12(1):267-282.
Irvine, D. A., D. S. Jayas, N. D. G. White and M. G. Britton. 1992.
Physical properties of flaxseed, lentils, fababeans. Can. Agric.
Eng. 34(1):75-82.
Korayem, A. Y. and S. N. Soliman. 1983. Effect of rough rice on its
physical properties. Com. Agrisic, Dev. Res. Vol (5).
Kukelko, D. D. S. Jayas, N. D. G. White and M. G. Britton. 1988.
Physical properties of Canola (Rapeseed) meal. Can. Agric. Eng.
30(1):61-64.
Ky, C. L., J. Louarn, S. Dussert, B. Guyot, S. Hamon and M. Noirot,
(2001) Caffeine, trigonelline, chlorogenic acids and sucrose
diversity in wild coffea arabica L. and coffea canephora P.
accessions, Food Chemistry 75 (2001), pp. 223–230.
Lingle T.R. (1993) The basics of cupping coffee, Specialty Coffee
Association of America, Long Beach (1993).
FARM MACHINERY AND POWER
Misr J. Ag. Eng., January 2011 - 17 -
Macrae (1985). Nitrogenous compounds. In: R.J. Clarke, & R. Macrae
(Eds.), Coffee, Vol 1: Chemistry (pp. 115–152). London: Elsevier
Applied Science.
Martín, Pablos, & González (1998) Discrimination between arabica and
robusta green coffee varieties according to their chemical
composition, Talanta 46 (1998), pp. 1259–1264.
Mohsenin, N. N. 1970. Physical properties of plant and animal materials.
New York, Gordon and Breach, Sc. Pub. Pp, 51-87, 889.
Muir, W. E. and R. N. Sinha. 1988. Physical properties of cereal and
oilseed cultivars grown in western Canada. Can. Agric. Eng.
30(1):51-55.
Odunfa, S. A. 1985. African fermented foods. In : Microbiology of
fermented foods (Wood, B. J. ed.) vol. 2, pp. 155-191, Elsevier,
Amsterdam.
Oje, K. and E. C. Ugbor. 1991. Some physical properties of oil bean
seed. J. Agric. Eng. Res. 50, 305-313.
Rodrigues, M. A. A., Borges, M. L. A., Franca, A. S., Oliveira, L. S. &
Correa, P. C. (2003). Evaluation of physical properties of coffee
during roasting. Agricultural Engineering International: The CIGR
Journal Of Scientific Research And Development, 5, Manuscript
FP 03004, 12pp.
Sivetz, & Desrosier (1979) M. Sivetz and N.W. Desrosier, Coffee
technology, Avi Publishing Co, Westport, Co (1979).
Stennert A. and H.G. Maier, (1996). Trigonelline in coffee. III.
Calculation of the degree of roast by trigonelline/nicotinic acid
ratio. New gas chromatographic method for nicotinic acid,
Zeitschrift für Lebensmitteluntersuchung und –Forschung A 202
(1996), pp. 45–47.
Sylvian, P. G. 1956. Le Café du Yemen. L’ Agronomie Tropicale
XI(1):62-73.
FARM MACHINERY AND POWER
Misr J. Ag. Eng., January 2011 - 18 -
الملخص العربً
تصميم وتصنيع نمىرج لالة تقشير البن اليمنً
*دكتىر /عبذالاله عمر أحمذ سيف
ىيمىزدبد اىضساعيخ ىه اهميخ قصوى في عمييبد الاعدذاد ااىزدذااه هىذسيخان دساسخ اىخصبئص اى
اىزقشديش اىزدفيد ااىزشييدت ارخضيه اىمىزدبد اىضساعيخ امزىل فدي رصدميآ تلاد خودح اىمىزح اا
رصدميآ اىزي رسجق رىل. مه أخو رىل مبن اىهذف مده اىجثده هدو اىفشص ااىزذسيح اايضب عمييبد
ارىفيز ومورج ىزقشيش اىجه اىيمىي صى الاسمبعييي ثثيه رثبفظ عيي اىدودح ارقيدو مده اىزندبىي
ااسزهلاك اىطبقخ. ارزشمت الاىخ مه خضان ، ادسفيو اموردوس اثندش اسديوس اايدبس يثمدو الاىدخ.
ودذ اىىزدبئح عىذ سدشعبد داساويدخ مخزيفدخ ىيدذسفيو عىدذ متدذلاد ريقديآ مخزيفدخ. امب رآ اخزجبس الاىخ
اىمزثصو عييهب مبىزبىي:
مددآ ، 01ايمندده ريخدديص اىىزددبئح اىمزوصددو اىيهددب فددي ان اىىسددجخ اىتلمددي مدده اىثجددوة ىهددب اىطددوه
مآ(. متبمو اىشنو ااىزلامس ينشد ان اىثجدوة مشايدخ ىهدب 7ااىسمل ااىتشض مبووا مزسباييه )
ب مثبفدخ اعيدي مده اىفئزديه مدآ مبودذ ىهد 01-7وست رلامس صغيشح. فئدخ اىثجدوة اىزدي قطشهدب مده
دسخخ. 03.41-5.78الاقو االاعيي. رشااحذ صاايخ اىزنويآ ىيثجوة مه خميع اىفئبد مبثيه
الاوزبخيخ ىلاىخ رضايذد مع صيبدح سشعخ داسان اىذسفيو عىذ متذلاد اىزيقيآ اىمخزيفخ.
مقشددشح خضئيددب. مبودذ مفددباح الاىددخ عبىيدخ خددذا ثثيدده ىددآ رزدشك اى مدده حجددوة اىقهدوح دان رقشدديش اا
مدآ/سبعخ. 461-031ارشااحذ الاوزبخيخ ثيه
ج. ي. –كلية الزراعة جامعة صنعاء –*أستار بقسم الهنذسة الزراعية