Embed Size (px)
Citation preview

sustainability
Article
Design and Implementation of a Microgrid EnergyManagement System
Eun-Kyu Lee 1,2,*, Wenbo Shi 2, Rajit Gadh 2 and Wooseong Kim 3,*1 Information and Telecommunication Engineering, Incheon National University, Incheon 22012, Korea2 UCLA Smart Grid Energy Research Center, Los Angeles, CA 90095, USA; [email protected] (W.S.);
[email protected] (R.G.)3 Computer Engineering, Gachon University, Seongnam 13120, Korea* Correspondence: [email protected] (E.-K.L.); [email protected] (W.K.);
Tel.: +82-32-835-8629 (E.-K.L.)
Academic Editor: Shuhui LiReceived: 15 August 2016; Accepted: 20 October 2016; Published: 7 November 2016
Abstract: A microgrid is characterized by the integration of distributed energy resources andcontrollable loads in a power distribution network. Such integration introduces new, uniquechallenges to microgrid management that have never been exposed to traditional power systems.To accommodate these challenges, it is necessary to redesign a conventional Energy ManagementSystem (EMS) so that it can cope with intrinsic characteristics of microgrids. While many projectshave shown excellent research outcomes, they have either tackled portions of the characteristicsor validated their EMSs only via simulations. This paper proposes a Microgrid Platform (MP),an advanced EMS for efficient microgrid operations. We design the MP by taking into consideration(i) all the functional requirements of a microgrid EMS (i.e., optimization, forecast, human–machineinterface, and data analysis) and (ii) engineering challenges (i.e., interoperability, extensibility,and flexibility). Moreover, a prototype system is developed and deployed in two smart grid testbeds:UCLA Smart Grid Energy Research Center and Korea Institute of Energy Research. We then conductexperiments to verify the feasibility of the MP design in real-world settings. Our testbeds andexperiments demonstrate that the MP is able to communicate with various energy devices and toperform an energy management task efficiently.
Keywords: energy management system; microgrid; testbed; smart grid; Internet of Things (IoT)
1. Introduction
A microgrid is a low-voltage distribution network that is composed of a variety ofenergy components such as controllable energy loads and Distributed Energy Resources (DERs).Controllable loads include HVAC (heating, ventilation, and air conditioning) systems and EVs (ElectricVehicles), and DERs include PV (Photovoltaic), WT (Wind Turbine), CHP (Combined Heat and Power),fuel cells, and ESS (energy storage systems) [1]. By integrating DERs and controllable loads within thedistribution network, the microgrid is capable of operating either in a grid-connected mode (i.e., it isconnected to the power grid) or in an islanded mode (i.e., it is disconnected from the grid and usesvarious DERs to supply power to the loads). While such integration differentiates the microgrid fromconventional power systems, it also introduces new challenges to the way of power management andcontrol. An Energy Management System (EMS) has been responsible for the management and controloperations in the traditional power systems, and it is now necessary to advance the EMS so as to copewith emerging challenges.
A number of research ideas in the literature have discussed the advancement. Su and Wangexamined the role of EMS in microgrid operations in detail [2]. They also listed four essential
Sustainability 2016, 8, 1143; doi:10.3390/su8111143 www.mdpi.com/journal/sustainability

Sustainability 2016, 8, 1143 2 of 19
functionalities which a new EMS (say, a microgrid EMS) should support; they are forecast, optimization,data analysis, and human–machine interface. Authors in [3–6] proposed various types of EMSframeworks that can work in a microgrid environment. While previous research focuses on a list ofdesign issues for the EMS, they hardly take into account engineering challenges that frequently occurin the implementation of a microgrid EMS. The first type of engineering challenge relates to operationalproperties of energy components in the microgrid. The operation of typical DERs like photovoltaicsis characterized by intermittency and variability, and that of controllable loads by spatiotemporaluncertainty. These properties complicate the microgrid management, and the microgrid EMS must beable to handle them in an appropriate manner. Next, a microgrid operation involves running a listof energy applications including demand response and coordinated EV charging as well as runninginnovative control algorithms [7,8] that are not necessarily implemented in a single system. Therefore,the microgrid EMS must be able to interface with them seamlessly. Finally, various types of energycomponents from different vendors are deployed and interconnected in the microgrid, but most ofthem still use proprietary protocols, which hinders them from interoperating with each other [3].The microgrid EMS must resolve the heterogeneity and interoperation challenges.
We believe that a microgrid EMS must be designed and implemented both to overcomeengineering challenges and to satisfy aforementioned functional requirements. Unfortunately,few previous works have accomplished them simultaneously To address these two orthogonalconcerns together, this paper proposes a Microgrid Platform (MP), an advanced EMS for efficientmicrogrid operations. We also develop and deploy its prototype and run experiments in real-worldsettings within two smart grid testbeds built in the UCLA Smart Grid Energy Research Center (SMERC)and Korea Institute of Energy Research (KIER). The contributions of this paper are three-fold:
(1) We design a microgrid EMS with consideration of both the functional requirements and theengineering challenges. Many existing energy management systems have focused on oneaspect. On the one hand, a system highlighting the functional requirements usually assumes theexistence of computer systems, software, and communications and regards them as a black box.This setting, however, often uses proprietary technologies and thus is not extensible. Moreover,the system often provides predefined energy applications. It is hard to upgrade the system inorder to support emerging applications. A microgrid EMS must be flexible from the softwarepoint of view to accommodate brand-new applications easily. There is an analogy in thecellular phone area. In the feature phone era, users used pre-installed applications that werevery crude. Now, we observe that a user can develop any smartphone applications and sell themat APP stores. On the other hand, a system focusing on computer systems and communicationsusually implements specialized scheduling and control algorithms. Such algorithms are oftencustomized to the underlying communication technologies and network topologies. In order toadopt new algorithms, the system may be rebuilt and these configurations are re-customized.To address these challenges, we design the MP with a modular system in mind. The MP isdeveloped as a framework in which a variety of modules (e.g., scheduling algorithm module andcommunication module) are added and/or deleted seamlessly. For instance, a specific powergeneration model can be added and incorporated in an existing optimization module. In thisway, the MP supports the functional requirements and addresses the engineering challenges.
(2) We develop the MP prototype in a resource-oriented architecture (ROA) style [9]. Most previousmicrogrid systems have been implemented in a multi-agent system architecture or aservice-oriented architecture (SOA) style that functions well in a homegeneous, proprietary,and server-centered system environment. However, an emerging microgrid environment includesdeployment of heterogeneous energy devices using different communication technologies anduse of a variety of standard message formats. A new microgrid system, therefore, must be able tocope with heterogeneity and diversity so as to communicate with energy devices seamlessly inan interoperable manner. A plug-and-play trend would be an example—say, a new smartmeter from a random third-party vendor using new technologies is added to a microgrid.

Sustainability 2016, 8, 1143 3 of 19
This device must be able to communicate with the microgrid system or with other energydevices (if necessary) with minimum configuration so as to be ready to be used. With traditionalarchitecture styles, we must re-build a microgrid management system to customize so as tocommunicate with the brand-new device. The MP prototype addresses this system engineeringissue by adopting the ROA that abstracts an energy device as a resource—a software conterpartof the hardware itself. Just as the concept of Class in a Java programming language, a resource inthe ROA maintains states and takes actions. Unlike the Java, however, the resource makes realcommunications and interactions with other energy devices or the microgrid system. Because ofthis abstraction concept, our MP can work in a distributed environment. To implement thesofware part and the abstraction, we take an Energy Service Interface (ESI) technology [10].
(3) We deploy the MP prototype in our testbeds and run experiments to evaluate performanceof microgrid management and controls. A microgrid is a complicated and delicate system,and thus development, deployment, and evaluation of its management system must be carefullydesigned and performed. When deploying the prototype and connected energy devices,thus building a microgrid system testbed, we must consider how much data we can obatinfrom the testbed. The more we get data, the more accurately we are able to run and evaluateoptimization algorithms. We also take into account the diversity of energy devices. Unlike asimulation study, there are many challenges in a testbed environment. For instance, it is nottrivial to install EV charging stations on a testbed because of both technical problems andadministrative issues. Even if installed, we may not obtain ample information mainly dueto low penetration of EVs in the real world. The MP as an energy management system ina microgrid must be able to communicate with external systems such as a demand responseserver. For evaluation, we must consider what external signals are delivered into the microgridbecause these signals directly affect performance of scheduling and control algorithms. This paperdesigns the deployment of the prototype and connected energy devices by taking into accountall the major factors. As a result, we build two real-world testbeds of microgrid including theMP prototype.
A primary issue in the evaluation is about how to design and run scheduling algorithms.Unlike simulations, each microgrid testbed has intrinsic properties, and thus a specifically-designedalgorithm may not operate well in every microgrid configuration. To address this challenge, we developa generic system model of a microgrid and formulate the energy scheduling and demand response asoptimization problems. The next question is about how well a generic model works in a real-worldenvironment. Does the model require to customize itself to every testbed? Does the model work wellin a specific configuration and bad in other ones? How different would experimental results be fromsimulation ones? While this paper may not answer all the questions this time, we try to design andrun experiments step-by-step in order to disclose clues to the answers. In particular, we discuss whatwe learned from our evaluation about the difference between experimental results and those fromsimulations in Section 4.2.
The rest of the paper is organized as follows. Section 2 reviews the functionalities of a microgridEMS and addresses its design issues. Section 3 shows our implementation of the MP in details.In Section 4, we deploy our MP prototype to two microgrid testbeds and conduct experiments.Section 5 concludes this paper.
2. Design of a Microgrid Energy Management System
In this section, we discuss two categories of design issues—functional requirements andengineering challenges—which are necessary for an EMS to work properly on an emerging microgridenvironment. Figure 1 illustrates an overview of a microgrid EMS system for our discussion; internalboxes denote its roles. We refer to [2] for details.

Sustainability 2016, 8, 1143 4 of 19
Forecast
Microgrid EMS
Inte
rface
Inte
rfa
ce
Customer side
PV
WT
CHP
Diesel
Battery
EV
......
Grid side
Utility
3rd
party
service
provider
Weather
forcast
.....
Optimization
HMIData analysis
Figure 1. An illustration of a microgrid energy management system.
2.1. Functional Requirements
2.1.1. Forecasting Energy Activities
As generation, storage, and consumption of energy in a microgrid become more dynamicand complex, it is critical to predict such activities accurately for the purpose of energy balance.Forecasting is preformed on different time scales (e.g., hour-ahead, day-ahead, etc.) and predicteddata is fed into an optimization process for microgrid operations. Forecasting has been challengingin a microgrid setting because of operational properties—inherent intermittency and variability inDERs and spatiotemporal uncertainty in controllable loads (e.g., electric vehicles). Previous studiesfocused on developing various forecast models of high accuracy given this randomness. They usevarious types of data sources, from historical data to mathematical models, weather data, and othersocietal data [11,12]. Zhu et al. run demand forecast and solar generation forecast from history data,and then develop a battery (dis)charging scheduling algorithm [13]. Huang et al. propose a hybridmathematical model that takes weather forecasts and history data to improve the prediction accuracyof a solar panel [11].
2.1.2. Optimization: Making a Control Decision for Optimal Operations
An EMS must be able to make control decisions to optimize the power flows by adjustingthe power imported/exported from/to the grid, the controllable loads, and the dispatchable DERs.Different optimization decisions are made for different applications (e.g., demand response andenergy/power management) that are typically formulated as non-linear optimization problems withdifferent objectives. Extensive algorithms have been proposed for them [7,8]. Given EV owners’charging profiles and real-time power price, Mal et al. developed a V2G scheduling algorithm workingat a large scale EV charging structure [14].
2.1.3. Analysis on Energy Data
An EMS collects a huge amount of data from DERs, energy loads, and energy market.Data collected must be analyzed properly, providing insights to better understand the characteristicsof energy activities. This can be further used to improve the performance of the forecast and theoptimization models. Bellala et al. analyze time series data of energy usage in a commercial campus [15].Then, they detect anomalous usage periods representing unusual power consumption. Detecting andcorrecting the anomaly can save on the electricity bill. The Monitoring-Based Commissioning (MBCx)project exploits the measurement data and diagnostic tools in order to perform commissioning. on 24non-residential buildings throughout the state of California [16].
2.1.4. Human–Machine Interface
An EMS must provide a Human–Machine Interface (HMI) for real-time monitoring and controlsof a microgrid. The HMI allows a microgrid operator to interact with other modules inside a microgrid
Sustainability 2016, 8, 1143 5 of 19
system. It must be able to provide useful information and knowledge rather than raw data by meansof visualization and archiving [17]. The HMI is expected to allow active customer interactions [2].
2.2. Engineering Challenges in Communications
A microgrid is a distributed system consisting of heterogeneous types of energy resources[3], in which an EMS is responsible for interacting with the resources in an interoperable manner.The EMS may adopt standard specifications for seamless interoperation, such as IEC 61850(http://www.iec.ch/smartgrid/standards/), IEEE1574 (http://grouper.ieee.org/groups/scc21/1547/1547_index.html), OPC Unified Architecture (https://www.opcfoundation.org/UA), open BuildingInformation eXchange (oBIX) (http://www.obix.org), Facility Smart Grid Information Model (FSGIM)(http://spc201.ashraepcs.org/standards.html). In academia, research has developed programmableAPIs that allow us to access energy resources in a unified manner [18,19]. Dawson-Haggerty et al.leverage SensorML [20] and define a data model that fits to tiny sensor devices embedded into energyresources [21].
A microgrid EMS is also responsible for communicating with external systems outside themicrogrid; it translates data and signals transmitted from external systems to internal protocols andsemantics. Energy services instantiate such interoperation. Two pieces of literature presented use casesof energy services [22,23], and we classify the services into two categories: facility service and gridservice. In the facility service, a customer facility such as a commercial building and a communitymicrogrid provides service data to external systems sitting on a national grid, whereas it receives andconsumes service data delivered from the grid in the grid service. The EMS must be able to supportboth services.
The communication interface in the microgrid EMS must be extensible. New energy applicationsand innovative algorithms will be continuously added to the microgrid, and they do not necessarilyreside in a single system. It is essential that the EMS is able to connect to them seamlessly, and suchnew connection must not affect the operations of existing functionalities.
3. Microgrid Platform
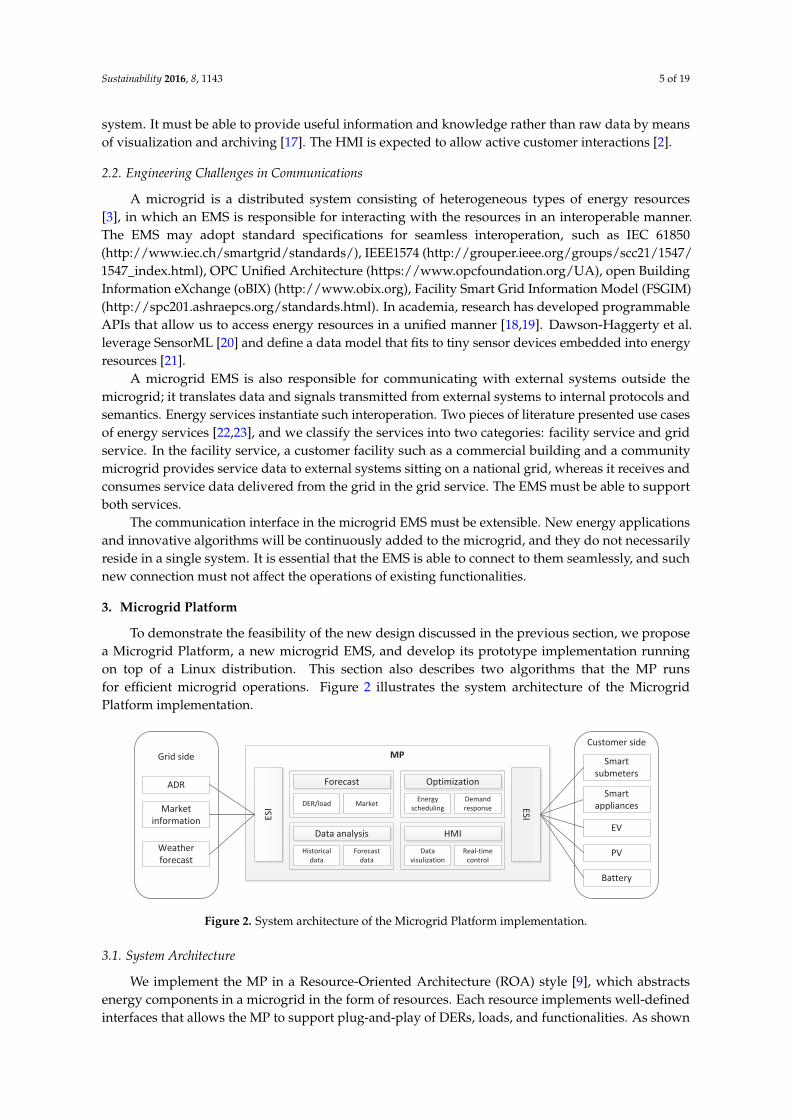
To demonstrate the feasibility of the new design discussed in the previous section, we proposea Microgrid Platform, a new microgrid EMS, and develop its prototype implementation runningon top of a Linux distribution. This section also describes two algorithms that the MP runsfor efficient microgrid operations. Figure 2 illustrates the system architecture of the MicrogridPlatform implementation.
MP
ES
I
Grid side
ADR
Market
information
Weather
forecast
ES
I
Customer side
Smart
submeters
EV
PV
Battery
Smart
appliances
Data
visulization
Real-time
control
HMI
Energy
scheduling
Demand
response
Optimization
DER/load Market
Forecast
Historical
data
Forecast
data
Data analysis
Figure 2. System architecture of the Microgrid Platform implementation.
3.1. System Architecture
We implement the MP in a Resource-Oriented Architecture (ROA) style [9], which abstractsenergy components in a microgrid in the form of resources. Each resource implements well-definedinterfaces that allows the MP to support plug-and-play of DERs, loads, and functionalities. As shown

Sustainability 2016, 8, 1143 6 of 19
in previous works [3–6], the ROA has advantages over a Service-Oriented Architecture. It fits best for“linking and referring” to energy resources, thus maximizing the interactivity efficiency in the EMS.The ROA is more lightweight without complicated interface description.
3.1.1. Interoperation—Energy Services from the Facility
The MP provides energy services to the grid, which makes the microgrid play an energy serviceprovider role in the smart grid. In addition to basic energy services, it realizes the facility-sideforecasting that helps the grid understand the facility’s energy behaviors accurately.
Energy Services
The MP provides fundamental data services that most EMSs can do. These include (1) historicalenergy data for individual resource as well as for the aggregated one; (2) real-time measurement onresources’ status, their energy activities (consumption, generation, and storage), and power quality;(3) the MP also accepts command messages from the grid that eventually control the internal energyresources. This corresponds to a Direct Load Control (DLC) service on the grid side. In addition, the MPprovides various types of future forecasting services including demand and generation forecasts.
Energy Service Interface
The MP develops the ESIs using the existing implementation model [10]. That is, the servicedata is represented via the open Building Information Exchange (oBIX) specification [24] and isthen exchanged via the Web Service model with Representational State Transfer (RESTful) style [9].Our security algorithm carries out access control on action levels (i.e., Read, Write, and Invoke) [25].In addition to the oBIX, we extend the IEC 61850 specification [26] to represent data from our solarpanels and energy battery.
3.1.2. Interoperation—Energy Services from the Grid
In addition to basic DLC services, our testbed implements two Facility-centric Load Control (FLC)type of services in which the microgrid is interested most—Automated Demand Response (ADR)service and Real-Time Pricing (RTP) service.
Open Automated Demand Response
We deploy an OpenADR 1.0 server [27] that provides the ADR service by exploiting the opensource [28]. The server issues an EventState signal (All the XML schemas for data used in OpenADRare available at http://openadr.lbl.gov/src/1.) to initiate a new demand response event. It is able tocommunicate with both smart and simple clients. A smart client can interpret the EventInfo informationwithin the EventState signal. Included in SmartClientDREventData entity, the EventInfo containsevent details. For example, the eventInfoTypeID denotes an event type and takes one value out ofPRICE_ ABSOLUTE, PRICE_RELATIVE, LOAD_AMOUNT, etc. To communicate with a simple OpenADR client,the server translates the EventInfo information into a simpler form, named SimpleClientEventData. Theentity contains two variables to describe the event state. The EventStatus element denotes the temporalstate of the event (FAR, NEAR, or ACTIVE). The OperationModeValue indicates the operational state of theenergy loads in the event (NORMAL, MODERATE, or HIGH). MP implements a Message AuthenticationCode (MAC) addressing the message integrity to address the security issue in the OpenADR. Followingthe NISTIR (National Institute of Standards and Technology, Internal/Interagency Reports) 7628guideline [29], our testbed takes a hash-based MAC (HMAC) with SHA-256.
Real-Time Pricing for Retail Energy Market
To assess the feasibility of the RTP service, our testbed implements an RTP server that providesprice forecast for a retail energy market. The server, in the absence of an RTP model in the

Sustainability 2016, 8, 1143 7 of 19
real world, exploits the wholesale market price provided by California Independent System Operator(CAISO) (http://oasis.caiso.com/mrioasis/). More specifically, it obtains three types of price forecastsfrom CAISO—Day-Ahead Market (DAM); Hour-Ahead Scheduling Process (HASP); and Real-TimeMarket (RTM). The DAM provides an estimated power price of every hour for 24 h ahead. The HASPand RTM provide an hour-ahead/10-min-ahead price estimation of every 12/5 min, respectively.Since CAISO does not provide the price forecast for the location of our campus, the server takes theprice value for the city of Long Beach. The RTP server also takes inputs of demand forecast andweather forecast from CAISO, and then eventually determines three types of price forecasts (DAM,HASP, and RTM) for the retail energy market.
Consuming the Service Data
The MP implements communication counterparts of the above two energy servicesfor interoperations. With respect to the ADR service, it implements both smart and simple clients thatperiodically “pull” the EventState message from the server. This PULL mode is often preferred overa PUSH mode since the OpenADR client has more control over the communications, e.g., firewalls.It, then, identifies when the event starts and ends and other event contexts. The MP also pulls theprice forecast from the RTP server periodically. Different applications may use three types of forecastsdifferently. Our testbed primarily fetches the HASP and RTM forecasts every hour and 10 min andexecutes scheduling algorithms according to the price changes.
3.1.3. Communication Model
The MP communicates with the energy resources via Ethernet, RS-485 serial, and IEEE 802.15.4.It supports various application protocols such as Modbus, IEC 61850, IEC DLMS, BACnet, SEP 1.0(Modbus-http://www.modbus.org/; BACnet-http://www.bacnet.org; SEP-http://www.zigbee.org/Standards/ZigBeeSmartEnergy; DLMS-http://www.dlms.com/), and several proprietary protocols.The MP collects and stores both power-related measurements and status information from the energyresources every 5 min on average. In addition, it maintains meaningful meta data regarding eachresource. For instance, each mini submeter is managed with a load type, location, and the load’spriority. A resource owner configures the meta data, and thus the data keeps reflecting physicalcharacteristics of the plugged load and user contexts. The MP provides basic scheduling functionsthrough which a user pre-schedules the operations of energy resources. The dimmable LED lights arenow reserved to be ON only during office hours, while a user can still turn them on/off any time.
3.1.4. User Interface
The MP implements a web-based user interface (UI), as shown in Figure 3, for real-time monitoringand control of the microgrid. The UI also allows users to interact with the MP and eventually withenergy components in a microgrid. The MP allows real-time data to flow and provides control serviceswith which users can read real-time measurements and send control messages to the DERs andthe loads. The UI includes a variety of data visualization tools such as interactive graphs and tablesthat illustrate energy data and derived knowledge (e.g., historical or forecast data of DERs and loads)at a glance.
3.2. Microgrid Control
We implement two algorithms in the MP that support optimal operations in a microgrid:An energy scheduling algorithm and a Demand Response (DR) algorithm. The MP also implementsforecast services for optimization. In particular, it adopts three different models for forecasting:A persistence model, an auto regressive moving average (ARMA) model, and a machine learningmodel for load forecasting, PV forecasting [11], and EV forecasting [12], respectively. The MP uses theCAISO’s forecast data to provide market forecast services. Note that the algorithms here are designed

Sustainability 2016, 8, 1143 8 of 19
based on the configuration of the two testbeds. Other algorithms [30,31] can also be implemented inthe MP for different applications.
Figure 3. Web interface showing the overview of the microgrid.
3.2.1. System Model
We present the system model of a microgrid and formulate the energy scheduling and demandresponse as optimization problems.
Let us consider a microgrid consisting of a set of Distributed Generation (DG) units denoted byG := {g1, g2, . . . , gG}, Distributed Storage (DS) units denoted by B := {b1, b2, . . . , bB} and controllableloads denoted by L := {l1, l2, . . . , lL}. We use a discrete time model with a finite horizon in this paper.We consider a time period or namely a scheduling horizon which is divided into T equal intervals ∆t,denoted by T := {0, 1, . . . , T − 1}, where t0 is the start time.
DG Model: For each DG unit g ∈ G, we assume that there is an upper bound and a lower boundon its power:
pming (t) ≤ pg(t) ≤ pmax
g (t), ∀t ∈ T , (1)
where pming (t) and pmax
g (t) are the minimum and maximum output power, respectively. Typical DGincludes PV, WT, diesel, and CHP. We note that we do not consider specific generation models fordifferent types of DG. They can be easily incorporated into the optimization framework. If the DG unitis dispatchable (e.g., diesel), the output power pg(t) is a variable. If the DG unit is non-dispatchable(e.g., PVs and WTs), the output power pg(t) cannot vary and its value is equal to the forecasted value
(i.e., pming (t) = pmax
g (t) = p fg(t) where p f
g(t) is the forecasted power at time t).We denote the generation cost of a DG unit g ∈ G by Cg(pg(t)). We assume that the cost function
is strictly convex. For renewable DG units such as PVs and WTs, the generation cost is zero.

Sustainability 2016, 8, 1143 9 of 19
DS Model: We consider batteries as the DS units in the microgrid. Given a battery b ∈ B, we assumeits output power pb(t) is positive when charging and negative when discharging. Let Eb(t) denote theenergy stored in the battery at time t. The battery can be modeled by the following constraints:
pminb ≤ pb(t) ≤ pmax
b , ∀t ∈ T , (2)
Eb(t + 1) = ηbEb(t) + pb(t)∆t, ∀t ∈ T , (3)
Eminb ≤ Eb(t) ≤ Emax
b , ∀t ∈ T , (4)
Eb(T) ≥ Eeb, (5)
where pmaxb is the maximum charging rate, ηb ∈ (0, 1] captures the battery efficiency, −pmin
b is themaximum discharging rate, Emin
b and Emaxb are the minimum and maximum allowed energy stored in
the battery, respectively, and Eeb is the minimum energy that the battery should maintain at the end of
the scheduling horizon.We use a cost function to capture the damages to the battery by the charging and discharging
operations. Three types of damages are considered: fast charging, frequent switches between chargingand discharging, and deep discharging. We model the cost of operating a given battery b as [32]:
Cb(pb) , αb ∑t∈T
pb(t)2 − βb
T−2
∑t=0
pb(t + 1)pb(t)
+ γb ∑t∈T
(min(Eb(t)− δbEmaxb , 0))2 + cb,
(6)
where pb is the charging/discharging vector pb , (pb(t), t ∈ T ) , αb, βb, γb, δb, and cb arepositive constants.
The above function is convex when αb > βb. This cost function captures the damages to thebattery by the charging and discharging operations. The three terms in the function penalize the fastcharging, the charging/discharging cycles, and the deep discharging, respectively. We choose δb = 0.2.
Load Model: For each load, the demand is constrained by a minimum and a maximum powerdenoted by pmin
l (t) and pmaxl (t), respectively:
pminl (t) ≤ pl(t) ≤ pmax
l (t), ∀t ∈ T . (7)
For deferrable loads such as EVs, the cumulative energy consumption of the loads must exceed acertain threshold in order to finish their tasks before deadlines. Let Emin
l and Emaxl denote the minimum
and maximum total energy that the load is required to consume, respectively. The constraint on thetotal energy consumed by a deferrable load is given by:
Eminl ≤ ∑
t∈Tpl(t)∆t ≤ Emax
l . (8)
We use a cost function to capture customer loss of comfort in the scheduling. The cost functionCl(pl) quantifies a customer’s loss or discomfort obtained by the load l ∈ L using the demand vectorpl , (pl(t), t ∈ T ). We assume the cost function is a convex function.
Supply–Demand Matching: The net demand of the microgrid is equal to the total demand minusthe total generation:
P(t) = ∑l∈L
pl(t) + ∑b∈B
pb(t)− ∑g∈G
pg(t), ∀t ∈ T . (9)
If the microgrid is operated in islanded mode, then P(t) = 0. If the microgrid is operated ingrid-connected mode, then P(t) is the power traded between the microgrid and the main grid. We notethat islanded mode also involves other control and operational issues [33]. We model the cost ofenergy purchase from the main grid as C0(t, P(t)) , ρ(t)P(t)∆t, where ρ(t) is the market energy price.

Sustainability 2016, 8, 1143 10 of 19
Note that P(t) can have a negative meaning that the microgrid can sell its surplus power to the maingrid (We assume that the selling price is the same as the purchasing price. Depending on the marketpricing scheme, the two prices may be different in reality).
3.2.2. Energy Scheduling
The objective of the energy scheduling is to schedule the day-ahead operation of the DERs andthe loads in a way that (i) the total costs of generation, energy storage, load, and energy purchaseare minimized; and (ii) the DER constraints, the load constraints, and the supply–demand matchingconstraint are satisfied. The scheduling horizon T in this problem is one day.
We define pg , (pg(t), t ∈ T ), pb , (pb(t), t ∈ T ), pl , (pl(t), t ∈ T ), and Cg(pg) ,
∑t∈T Cg(pg(t)). The energy scheduling in the microgrid can be formulated as a convex optimizationproblem [34]:
minpg ,pb ,pl
ξg ∑g∈G
Cg(pg) + ξb ∑b∈B
Cb(pb) + ξl ∑l∈L
Cl(pl)
+ξ0 ∑t∈T
C0(t, P(t))
s.t. (1)–(9),
where ξl , ξg, ξb, and ξ0 are the parameters to trade off among the utility maximization and thecost minimizations.
Solving the problem gives the optimal schedules including the generation schedules pg, the batteryschedules pb, and the load schedules pl .
3.2.3. Demand Response
Upon receiving DR event signals from the utility, the microgrid EMS responds by coordinatingthe operation of energy devices in the microgrid properly.
A DR event is characterized by a time schedule T that specifies the start time and the end timeand a demand limit Pmax(t) that is determined from the event information. The DR constraint on thenet demand of the microgrid is given by:
P(t) ≤ Pmax(t), ∀t ∈ T . (10)
Similar to the day-ahead scheduling problem, the DR problem can be formulated as a convexoptimization problem:
minpg ,pb ,pl
ξg ∑g∈G
Cg(pg) + ξb ∑b∈B
Cb(pb) + ξl ∑l∈L
Ul(pl)
s.t. (1)–(10).
In the above problems, the control variables are assumed to be all continuous. However, some ofthem may be discrete in reality (e.g., on/off). A two-stage approach [35] can be used to solve thisissue. In the first stage, a solution is obtained assuming that all the control variables are continuous.Then, the discrete variables are rounded to the nearest discrete levels and treated as constants in thesecond-stage solution.
4. Testbeds and Experiments
This section describes two microgrid testbeds in which we deploy various types of energyresources. For experiments, we also develop several external energy services. On top of the testbeds,we run experiments of microgrid operations. We note that this paper omits basic experimental results,i.e., measurement of energy usage and direct resource control. Instead, our experiments focus on the

Sustainability 2016, 8, 1143 11 of 19
optimal energy scheduling and DR operations in the KIER and UCLA SMERC testbed, respectively.We refer to [10] for our previous results.
4.1. Microgrid Testbeds
4.1.1. UCLA Site
The energy resources in the UCLA SMERC testbed include smart submeters, office/homeappliances, smart equipments, electric vehicle charging stations, and photovoltaics. Figure 4 presentssome of them.
* 4-‐CH EV charging station
* Mini submeter
* Power strip
* Multi-‐submeter in a panel
* Solar panel
Figure 4. Energy resource devices used in the testbed at UCLA Smart Grid Energy Research Center.
Smart Submeter
Unlike a conventional smart meter that measures aggregated energy usage, a smart submeterprovides fine-grained measurement and control. Our testbed deploys two types of submeters.We instrument a panel-level multi-submeter that simultaneously connects up to 36 single phasecircuits within a panel (http://www.satec-global.com/eng/products.aspx?product=42). Using it,we monitor two groups of energy loads—the lightings and power outlets at an office. We alsoinstall mini submeters that are instrumented to single power lines (http://www.bspower.co.kr/en/smartmeter.do). For instance, it can directly connect to a light switch that turns on/off a setof fluorescent lights. These submeters use current transformers to convert current to voltage, andan embedded microcontroller calculates the real, reactive, and apparent powers and energy usage.They are with relays, and the microcontroller switches the power upon requests.
Office Appliance with Plug-Load Meter
As the plug-loads including all the office appliances account for more than one third of the totalpower consumption in a building [36], it is necessary to manage them carefully. To this end, we deploytwo types of plug-load meters: smart plugs and smart power strips. Office appliances are plugged intothem: computers, monitors, desk lamps, and network switches. The plug-load meter is functionallythe same as the submeter, i.e., energy measurement and control. It communicates with the MP using aZigBee [37] module.
Smart Equipment
Smart equipment represents such energy resources that must be accessed directly.Recent programmable thermostats and LED lights fall into this category. Each piece of equipmenthas its own operation cycles beyond a simple on/off control and is able to adjust the operationsupon external requests. Our testbed deploys dimmable LED panel lights that adjust their brightness

Sustainability 2016, 8, 1143 12 of 19
and color temperature in eight steps. Each light uses a ZigBee module to transmit its status and toaccept control commands to/from the MP. For scalable experiments, we additionally develop a lightemulator that creates 200 LEDs, each of which operates exactly the same as the real device (brightness,temperature, and energy consumption).
Smart Home Appliance
The home appliances are functionally the same as the smart equipment. Each manages its ownoperation cycles and must be accessed directly. The MP connects to two types of appliances via theEthernet: a clothes dryer and a refrigerator (http://smartgrid.ucla.edu/projects_adr.html). It is able tochange the strength of the heat (high, low, or no heat) as well as turn on/off the operation by sendingsignals to the dryer. The refrigerator adjusts the operating cycles of compressor, defrost, and fan.To measure energy usage, the mini submeters are instrumented to their input power cables.
EV Charging Station
UCLA has instrumented a number of charging stations at campus parking structures [38].Each station powers several EVs via J1772 connectors (http://smartgrid.ucla.edu/projects_evgrid.html) simultaneously and supports multiple charging levels (http://standards.sae.org/j1772_201210).It is capable of measuring charging capacity as well as charging rate. Each station sends thecharging data in real-time to a management server in our laboratory that controls the stations basedon subscribers’ profiles and preference. The MP communicates with the stations via the server.Because of low penetration of EVs, however, we could not collect enough data for experiments. As acomplementary work, we simulate charging activities based on measurements and obtain an ampleamount of data.
Solar Panel and Battery
The MP is connected to a photovoltaic panel and a Battery Management System(BMS) that performs the whole monitoring function of battery system (voltage/electiccurrent/SoC/SoH/temperature). A 50 kW PV system is being installed on the roof and a 25 kWh BMSin the lab. Table 1 describes the parameters in BMS. The current version of testbed implements thePV and the BMS simulations where data is generated from the real devices. The PV and BMS alsoimplements the IEC 61850 standard to communicate with the MP. The details of the simulators can befound in our previous research [39].
Table 1. Parameters of battery management system in the testbed.
Parameters Description Set Value
B Capacity of BMS 25 kWhBi Initial state of charge in BMS 25 kWhγ Charging/discharging rate 80%
b− Maximum state of charge in BMS 22.5 kWhb_ Minimum state of charge in BMS 2.5 kWh
4.1.2. KIER Site
KIER is a research organization that focuses on improving energy efficiency and supportingenergy policy in terms of technological development. It has built an entire building-level testbedhaving a peak demand of 300 kW that is mainly consumed by computers, air conditioners, lighting,and EVs. Figure 5 shows the system model of the testbed including two subsystems—a powerhardware-in-the-loop simulation (PHILS) and real hardware—that our experiments use. The PHILSprovides a real-time digital simulation of a hybrid power system with power hardware that canproduce kW—level electrical power. It allows a flexible modeling of DERs, such as PVs, EVs, and

Sustainability 2016, 8, 1143 13 of 19
ESS, and a real DC–AC inverter, and is expected to effectively fill the gap between the analyticalsimulation and practical implementation. The PHILS is built with Regatron’s Integrated bidirectionalpower supply TopCon TC.GSS and family TC.G (http://www.regatron.com/en/products-topcon/bidirectional-power-supply-gss), and Figure 6 pictures the PHILS testbed system. The other subsystemin the testbed is a real hardware system that includes three types of DERs connected: PVs, EVs, andESS. The real hardware DER system is partially under development.
Microgrid Platform (EMS)
IEC61850 GW1 IEC61850 GW2 Commercial GW
PV simulator
ESS simulator
Quick EV simulator
Slow EV 1
Slow EV 2
200 LEDs
MMS protocol REST/oBIX
Figure 5. A system model of the entire testbed in Korea Institute of Energy Research.
Figure 6. A capture of the power hardware-in-the-loop simulation testbed.
Our experiments use the real-time power hardware-in-the-loop PV/ESS simulation systems forDERs and real-hardware slow/quick EV charging systems for controllable loads. The PHILS system isalso used to verify the operation of the microgrid. Figure 7 illustrates the architecture of our testbed,and Table 2 shows the specification details of energy devices used in the testbed.
Table 2. Specification details of energy devices used in the testbed.
Device Capacity Power Max/Min Energy Max/Min
PV simulator 64 kW - -ESS simulator 64 kW 10 kW/−10 kW 50 kWh/5 kWh
Quick EV simulator 64 kW 64 kW/0 kW [18 kWh, 23 kWh]/[13 kWh, 18 kWh]Slow EV1 system 2.5 kW 2.5 kW/0 kW [18 kWh, 23 kWh]/[13 kWh, 18 kWh]Slow EV2 system 2.5 kW 2.5 kW/0 kW [18 kWh, 23 kWh]/[13 kWh, 18 kWh]
200 LEDs 12.6 kW 12.6 kW/0 kW -
PV: Photovoltaic ESS: Energy storage system EV: Electric vehicle LED: Light-emitting diode

Sustainability 2016, 8, 1143 14 of 19
Figure 7. KIER real-time hardware-in-the-loop testbed.
The testbed adopts IEC 61850 as the communication and control interface. The devices areall connected to two IEC 61850 gateways and one commercial gateway supporting also the IEC61850 standard. The MP communicates with the gateways using the manufacturing messagespecification (MMS) as well as REST/oBIX.
4.2. Energy Scheduling
The devices in the KIER testbed considered in the energy scheduling include a 16 kW PV, a 5 kWESS, a 16 kW quick charging EV system, two 2.5 kW slow charging EV systems, and two hundred63 W dimmable LEDs. The maximum energy allowed to be stored in the battery Emax
b is 50 kWh, andwe set Emin
b = 5 kWh. We set Eb(0) = Eeb = 12.5 kWh. The parameters in the battery cost function
are chosen to be αb = 1, βb = 0.75, and γb = 0.5. We choose Cl(pl(t)) := ∑t∈T ηl(pl(t)− p fl (t))
2 for
the LEDs and Cl(pl(t)) := ηl(∑t∈T pl(t)∆t−∑t∈T p fl (t)∆t) for the EVs, where p f
l (t) is the forecastedload and ηl is the priority of the load given by the customer. The higher the priority is, the moreimportant the load is to the customer. Our experiment assumes that the LEDs can be shedded and the
EVs can be shifted. The maximum shedding precentage of the LEDs Emaxl −Emin
lEmax
lis assumed to be 30%.
The energy upper bound of the EVs Emaxl is chosen randomly from [18 kWh, 23 kWh] and the energy
lower bound of the EVs Eminl is chosen randomly from [13 kWh, 18 kWh]. Perfect forecasting of the
DERs and loads is assumed. We use the Korean time-of-use (TOU) price in the experiment as shown inFigure 8. The parameters in the algorithm are chosen as ξl = 1, ξg = 1, ξb = 0.01, and ξ0 = 1.
Figure 9a shows the forecast of the devices, serving as the baseline consumption. We then runthe algorithm in Matlab (v8.x, MathWorks, Natick, MA, U.S.) to produce the optimized schedules asshown in Figure 9b. Comparing Figure 9b with Figure 9a, we observe the battery charging/dischargingcycles: the battery is charged when the energy price decreases and discharged when the price increases.We can also observe load shedding and load shifting from the results: the LEDs are shedded, the EVsare shifted to the time when the price is low, and the total charging energy of the EVs is also reduced.The total operational cost of the testbed using the optimized schedule is 12, 424 KRW, compared with7899 KRW without scheduling, saving the cost by 12,424−7899
12,424 = 36.43%.Next, we use the schedule produced by the algorithm to control the hardware-in-the-loop
simulators in the testbed in order to validate the simulation in real-hardware settings. The experimentalresults are presented in Figure 10. Compared with the simulation results in Figure 9b, the result ofusing the real-time hardware simulators roughly follows the optimized schedule obtained from the

Sustainability 2016, 8, 1143 15 of 19
simulation. The main cause of the differences between them lies in the resolution of the inputs for thehardware simulators. The hardware simulators are not able to accept inputs of any precision. The effectof communication delay can be also observed in the LED control: the total power of the LEDs changeslinearly in time. This is because we have 200 LEDs, and it takes time to control all of them and wait forthem to respond to the control signals. Both the input resolution and the communication delay need tobe considered for optimal energy scheduling in a real microgrid system.
0 1 2 3 4 5 6 7 8 9 10 11 12 13 14 15 16 17 18 19 20 21 22 23 2450
60
70
80
90
100
110
120
Time
Pric
e (K
RW
/kW
h)
Figure 8. Time-of-use (TOU) price.
0 1 2 3 4 5 6 7 8 9 10 11 12 13 14 15 16 17 18 19 20 21 22 23 24−6
−4
−2
0
2
4
6
8
10
12
14
16
18
20
22
Time
Pow
er (
kW)
PVLEDSlow EV 1Slow EV 2Quick EV
(a)
0 1 2 3 4 5 6 7 8 9 10 11 12 13 14 15 16 17 18 19 20 21 22 23 24−6
−4
−2
0
2
4
6
8
10
12
14
16
18
20
22
Time
Pow
er (
kW)
PVESSLEDSlow EV 1Slow EV 2Quick EV
(b)
Figure 9. Power consumption. (a) forecasted; and (b) simulated schedule.
0 1 2 3 4 5 6 7 8 9 10 11 12 13 14 15 16 17 18 19 20 21 22 23 24−6
−4
−2
0
2
4
6
8
10
12
14
16
18
20
22
Time
Pow
er (
kW)
PVESSQuick EVSlow EV 1Slow EV 2LED
Figure 10. Real-time hardware-in-the-loop result.

Sustainability 2016, 8, 1143 16 of 19
4.3. Demand Response Algorithm
In the experimental scenario, the MP changes the demand in response to the change of real-timeenergy prices. In order to highlight the DR effect, the dimmable LEDs only participate in theDR—that is, they respond to the price changes. The DR optimization is then simplified as a problem tobe solved at each time t:
minpl(t)
∑l∈L
ηl(pl(t)− p fl (t))
2
s.t. pminl (t) ≤ pl(t) ≤ pmax
l (t), ∀l ∈ L
∑l∈L
pl(t) ≤ Pmax(t),
where L includes only the LEDs and p fl (t) corresponds to the brightness preferred by the customer.
In our DR experiment, Pmax(t) is defined as a linear piecewise function that translates the real-timeprice ρ(t) from the CAISO to the maximum allowed total power:
Pmax(t) =
∑l∈L p f
l (t), ρ(t) < 6 ¢/kWh,
0.8 ∑l∈L p fl (t), 6 ¢/kWh ≤ ρ(t) ≤ 10 ¢/kWh,
0.7 ∑l∈L p fl (t), 10 ¢/kWh < ρ(t) ≤ 14 ¢/kWh,
0.6 ∑l∈L p fl (t), otherwise.
(11)
The LEDs are assumed to be equally deployed in four offices with different priorities(ηl = 5, 10, 15, 20). The brightness is dimmed in the range [0, 100]. The minimum, maximum, andpreferred brightness are set to 20, 100, and 80, respectively. We implement the DR algorithm as a webservice using JOptimizer (http://www.joptimizer.com/). Upon receiving DR signals from a DRAS(Demand Response Automation Server), the MP sends control commands to the LEDs.
Figure 11 shows the changes of the real-time price, the total power consumption, and the powerconsumption grouped by priority. The figure also observes that the total power consumption reduces asthe price changes. A demand reduction rule uses priority—that is, the devices having lower prioritiesreduce more power consumption than those with higher priorities.
Figure 11. Demand response (DR) experimental result.

Sustainability 2016, 8, 1143 17 of 19
5. Conclusions
This paper proposes a Microgrid Platform, an EMS for a microgrid, by taking into account boththe functional requirements and the engineering challenges. The MP is flexible and extensible inthe sense that it supports plug-and-play of DER devices, loads, and functionalities by adopting theresource-oriented architecture style. The MP fulfills interoperability via energy service interfaces.We develop and deploy a prototype system both in the UCLA and KIER testbeds and runexperiments to show the feasibility of the microgrid management and control in real-world settings.Our experimental results demonstrate that the MP is able to (i) manage various devices inthe testbed; (ii) interact with external systems; and (iii) perform efficient energy management.Integral parts of our future works include conducting more experiments for statistical analysis andimplementing/evaluating various control algorithms. We note that this work has extended ourprevious research [40].
Acknowledgments: We thank anonymous reviewers for their comments that helped improve the paper.This work was supported in part by the Incheon National University Research Grant in 2015.
Author Contributions: Eun-Kyu Lee conceived and designed the experiments; Wenbo Shi and Rajit Gadhperformed the experiments; Wenbo Shi and Wooseong Kim analyzed the data; and all authors wrote the paper.
Conflicts of Interest: The authors declare no conflict of interest.
Abbreviations
The following abbreviations are used in this manuscript:
ADR Automated Demand ResponseDER Distributed Energy ResourceDG Distributed GenerationDR Demand ResponseDS Distributed StorageEV Electric VehicleEMS Energy Management SystemESI Energy Service InterfaceESS Energy Storage SystemHMI Human–Machine InterfaceHVAC Heating, Ventilation, and Air ConditioningMP Microgrid PlatformPV PhotovoltaicsROA Resource-Oriented ArchitectureRTP Real-Time PricingSOA Service-Oriented ArchitectureV2G Vehicle-to-GridWT Wind Turbine
References
1. Katiraei, F.; Iravani, R.; Hatziargyriou, N.; Dimeas, A. Microgrids management. IEEE Power Energy Mag.2008, 6, 54–65.
2. Su, W.; Wang, J. Energy Management Systems in Microgrid Operations. Electr. J. 2012, 25, 45–60.3. Vaccaro, A.; Popov, M.; Villacci, D.; Terzija, V.V. An Integrated Framework for Smart Microgrids Modeling,
Monitoring, Control, Communication, and Verification. Proc. IEEE 2011, 99, 119–132.4. Chen, Q.; Ghenniwa, H.; Shen, W. Web-services infrastructure for information integration in power
systems. In Proceedings of the IEEE Power Engineering Society General Meeting, Montreal, QC, Canada,18–22 June 2006.
5. Yang, G.H.; Li, V.O. Energy management system and pervasive service-oriented networks. In Proceedignsof the First IEEE International Conference on Smart Gird Communications, Gaithersburg, MD, USA,4–6 October 2010.
6. Mercurio, A.; Di Giorgio, A.; Cioci, P. Open-Source Implementation of Monitoring and Controlling Servicesfor EMS/SCADA Systems by Means of Web Services. IEEE Trans. Power Deliv. 2009, 24, 1148–1153.

Sustainability 2016, 8, 1143 18 of 19
7. Fang, X.; Misra, S.; Xue, G.; Yang, D. Smart Grid—The New and Improved Power Grid: A Survey.IEEE Commun. Surv. Tutor. 2012, 14, 944–980.
8. Shi, W.; Li, N.; Xie, X.; Chu, C.C.; Gadh, R. Optimal Residential Demand Response in Distribution Networks.IEEE J. Sel. Areas Commun. 2014, 32, 1441–1450.
9. Fielding, R.; Taylor, R. Principled Design of the Modern Web Architecture. ACM Trans. Internet Technol. 2002,2, 115–150.
10. Lee, E.K.; Gadh, R.; Gerla, M. Energy Service Interface: Accessing to Customer Energy Resources for SmartGrid Interoperation. IEEE J. Sel. Areas Commun. 2013, 31, 1195–1204.
11. Huang, R.; Huang, T.; Gadh, R.; Li, N. Solar Generation Prediction using the ARMA Model in aLaboratory-level Micro-grid. In Proceedigns of the Third IEEE International Conference on Smart GirdCommunications, Tainan City, Taiwan, 5–8 November 2012.
12. Majidpour, M.; Qiu, C.; Chu, P.; Gadh, R.; Pota, H.R. Fast Demand Forecast of Electric Vehicle ChargingStations for Cell Phone Application. In Proceedings of the IEEE Power & Energy Society General Meeting,Natiional Harbor, MD, USA, 27–31 July 2014.
13. Zhu, T.; Mishra, A.K.; Irwin, D.; Sharma, N.; Shenoy, P.; Towsley, D. The Case for Efficient Renewable EnergyManagement in Smart Homes. In Proceedigns of the 3rd ACM Workshop On Embedded Sensing Systemsfor Energy-Efficiency in Buildings, Seattle, WA, USA, 1 November 2011.
14. Mal, S.; Chattopadhyay, A.; Yang, A.; Gadh, R. Electric vehicle smart charging and vehicle-to-grid operation.Int. J. Parallel Emerg. Distrib. Syst. 2012, 27, 249–265.
15. Bellala, G.; Marwah, M.; Arlitt, M.; Lyon, G.; Bash, C. Towards an understanding of campus-scalepower consumption. In Proceedigns of the 3rd ACM Workshop On Embedded Sensing Systems forEnergy-Efficiency in Buildings, Seattle, WA, USA, 1 November 2011.
16. Mills, E.; Mathew, P. Monitoring-Based Commissioning: Benchmarking Analysis of 24 UC/CSU/IOU Projects;Technical Report LBNL-1972E; Lawrence Berkeley National Laboratory: Berkeley, CA, USA, 2009.
17. Zhang, P.; Li, F.; Bhatt, N. Next-Generation Monitoring, Analysis, and Control for the Future Smart ControlCenter. IEEE Trans. Smart Grid 2010, 1, 186–192.
18. Krioukov, A.; Fierro, G.; Kitaev, N.; Culler, D. Building Application Stack (BAS). In Proceedigns of the 3rdACM Workshop On Embedded Sensing Systems for Energy-Efficiency in Buildings, Toronto, ON, Canada,6 November 2012.
19. Agarwal, Y.; Gupta, R.; Komaki, D.; Weng, T. BuildingDepot: An Extensible and Distributed Architecturefor Building Data Storage, Access and Sharing. In Proceedigns of the 3rd ACM Workshop On EmbeddedSensing Systems for Energy-Efficiency in Buildings, Toronto, ON, Canada, 6 November 2012.
20. Botts, M.; Robin, A. OpenGIS Sensor Model Language (SensorML) Implementation Specification v1.0.0;Open Geospatial Consortium Inc.: Wayland, MA, USA, 2007.
21. Dawson-Haggerty, S.; Jiang, X.; Tolle, G.; Ortiz, J.; Culler, D. sMAP-a Simple Measurement and ActuationProfile for Physical Information. In Proceedigns of the 8th ACM Conference on Embedded NetworkedSensor Systems, Zurich, Switzerland, 3–5 November 2010.
22. EIS (Energy Information Standards) Alliance. Customer Domain Use Cases v3.01. Available online:https://www.linkedin.com/company/energy-information-standards-alliance (accessed on 6 October 2016).
23. Hardin, D. Customer Energy Services Interface White Paper. In Proceedigns of the Sixth Annual Grid-InteropForum, Phoenix, AZ, USA, 5–8 December 2011.
24. Advancing open standards for the information society (OASIS). Open Building Information Exchange v1.0.Available online: http://www.oasis-open.org/committees/obix (accessed on 6 October 2016).
25. Lee, E.K.; Gadh, R.; Gerla, M. Resource Centric Security to Protect Customer Energy Information in theSmart Grid. In Proceedigns of the Third IEEE International Conference on Smart Gird Communications,Tainan City, Taiwan, 5–8 November 2012.
26. International Electrotechnical Commission (IEC). IEC 61850 Communication Networks and Systemsin Substations. Available online: http://www.abb.com/cawp/seitp202/5a2f05a756741714c1256e5c00429c4e.aspx (accessed on 6 October 2016).
27. Piette, M.A.; Ghatikar, G.; Kiliccote, S.; Koch, E.; Hennage, D.; Palensky, P.; McParland, C.Open Automated Demand Response Communications Specification v1.0. Available online:https://drrc.lbl.gov/publications/open-automated-demand-response-2 (accessed on 6 October 2016).

Sustainability 2016, 8, 1143 19 of 19
28. McParland, C. OpenADR Open Source Toolkit: Developing Open Source Software for the Smart Grid, LBNL-5064E;Technical Report; Lawrence Berkeley National Laboratory: Berkeley, CA, USA, 2011.
29. Introduction to NISTIR 7628 Guidelines for Smart Grid Cyber Security. Smart Grid InteroperabilityPanel—Cyber Security Working Group. Available online: http://dx.doi.org/10.6028/NIST.IR.7628r1(accessed on 6 October 2016).
30. Bracco, S.; Brignone, M.; Delfino, F.; Procopio, R. An Energy Management System for the Savona CampusSmart Polygeneration Microgrid. IEEE Syst. J. 2015, doi:10.1109/JSYST.2015.2419273.
31. Bonfiglio, A.; Brignone, M.; Delfino, F.; Girdinio, P.; Pampararo, F.; Procopio, R. An Energy ManagementSystem for the Savona Campus Smart Polygeneration Microgrid. In Proceedigns of the IEEE 15thInternational Conference on Environment and Electrical Engineering (EEEIC), Rome, Italy, 10–13 June 2015.
32. Shi, W.; Xie, X.; Chu, C.C.; Gadh, R. Distributed Optimal Energy Management in Microgrids. IEEE Trans.Smart Grid 2015, 6, 1137–1146.
33. Lopes, J.A.P.; Moreira, C.L.; Madureira, A.G. Defining control strategies for MicroGrids islanded operation.IEEE Trans. Power Syst. 2006, 21, 916–924.
34. Boyd, S.; Vandenberghe, L. Convex Optimization; Cambridge University Press: Cambridge, UK, 2004.35. Cecati, C.; Citro, C.; Siano, P. Combined Operations of Renewable Energy Systems and Responsive Demand
in a Smart Grid. IEEE Trans. Sustain. Energy 2011, 2, 468–476.36. Agarwal, Y.; Weng, T.; Gupta, R.K. The Energy Dashboard: Improving the Visibility of Energy Consumption
at a Campus-Wide Scale. In Proceedigns of the First ACM Workshop on Embedded Sensing Systems forEnergy Efficiency in Buildings (BuildSys), Berkeley, CA, USA, 3 November 2009.
37. ZigBee Alliance. Smart Energy Profile 2—Application Protocol Standard. Available online: http://www.zigbee.org/ (accessed on 6 October 2016).
38. Chung, C.Y.; Chu, P.; Gadh, R. Design of Smart Charging Infrastructure Hardware And Firmware Design ofThe Various Current Multiplexing Charging System. In Proceedigns of the 3rd Global Conference on PowerControl & Optimization, Gold Coast, Australia, 2–4 February 2013.
39. Huang, R.; Lee, E.K.; Chu, C.C.; Gadh, R. Integration of IEC 61850 into a Distributed Energy ResourcesSystem in a Smart Green Building. In Proceedings of the IEEE Power & Energy Society General Meeting,Natiional Harbor, MD, USA, 27–31 July 2014.
40. Shi, W.; Lee, E.K.; Yao, D.; Huang, R.; Chu, C.C.; Gadh, R. Evaluating Microgrid Management and Controlwith an Implementable Energy Management System. In Proceedigns of the 5th IEEE International Conferenceon Smart Grid Communications (SmartGridComm), Venice, Italy, 3–6 November 2014.
c© 2016 by the authors; licensee MDPI, Basel, Switzerland. This article is an open accessarticle distributed under the terms and conditions of the Creative Commons Attribution(CC-BY) license (http://creativecommons.org/licenses/by/4.0/).