Embed Size (px)
Citation preview
DESIGN AND IMPLEMENTATION OF A FREE PISTON COMPRESSOR
By
José A. Riofrío
Thesis
Submitted to the Faculty of the
Graduate School of Vanderbilt University
in partial fulfillment of the requirements
for the degree of
MASTER OF SCIENCE
in
Mechanical Engineering
December, 2005
Nashville, Tennessee
Approved:
Professor Eric J. Barth
Professor Robert W. Pitz
Professor Michael Goldfarb
ii
ACKNOWLEDGMENTS
First and foremost I would like to express my most sincere gratitude and appreciation
to my advisor, Dr. Eric Barth, for giving me this opportunity. His constant guidance
throughout this work was both challenging and inspiring. I am also grateful for all the
help provided by Dr. Michael Goldfarb, Dr. Kevin Fite, Dr. Bobby Shields, and Dr.
Robert Pitz, who patiently shared their expertise in various aspects relating to this work.
My learning experience at Vanderbilt has been greatly influenced by professors,
peers, and staff members. Special thanks go to Dr. Ken Frampton, Dr. Nilanjan Sarkar,
Yong Zhu, Dr. Navneet Gulatti, Joshua Schultz, Mark Adams, Tyler Li, Amit Bohara,
Xiangrong Xen, Peter Schmidt, Chakradhar Byreddy, Bibhrajid Halder, Steve Williams,
Jason Mitchell, Myrtle Daniels, Jean Miller, and Walt Bieschke.
Finally, I’d like to especially thank the Vanderbilt University Discover Grant for its
financial contribution.
iii
TABLE OF CONTENTS
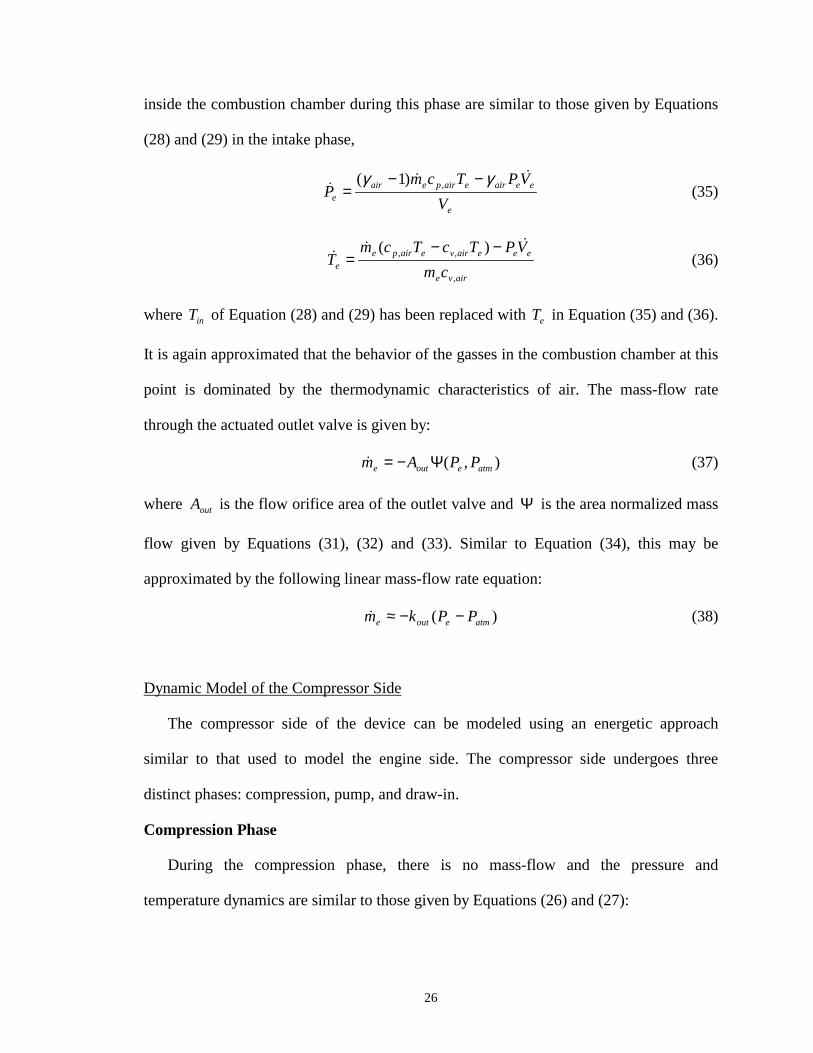
ACKNOWLEDGEMENTS ……………………………………………………... LIST OF FIGURES …………………………………………………………….. LIST OF TABLES ………………………………………………………………. Chapter
I. INTRODUCTION AND BACKGROUND ………….…………. Introduction ……………………………………………….… Previous Work ……………………………………………… Contribution ………………………………………………… Overview …………………………………………………… References ………………………………………………….. II. Manuscript 1: DYNAMIC CHARACTERISTICS
OF A FREE PISTON COMPRESSOR ………………………… Abstract ……………………………………………………. Introduction ………………………………………………... The Free Piston Compressor ………………………………. Thermodynamic Model ……………………………………. Engine Side ………………………………………... Compressor Side and Reservoir …………………… Mass Investment …………………………………... System Efficiency …………………………………. Dynamic Model …………………………………………… Engine Side ………………………………………... Work Phase ………………………………... Intake Phase …………………….…………. Exhaust Phase ……………………………... Compressor Side …………………………………... Compression Phase ………………………... Pump Phase ………………………………... Draw-in Phase ……………………………... Inertial Dynamics ………………………………….. Dynamic Simulation ………………………………. Conclusions ………………………………………………... References ………………………………………………….
Page
ii
vi
xiii 1 1 3 3 4 7 8 9 9 11 12 12 15 19 20 21 22 23 23 25 26 26 27 28 28 29 32 33
iv
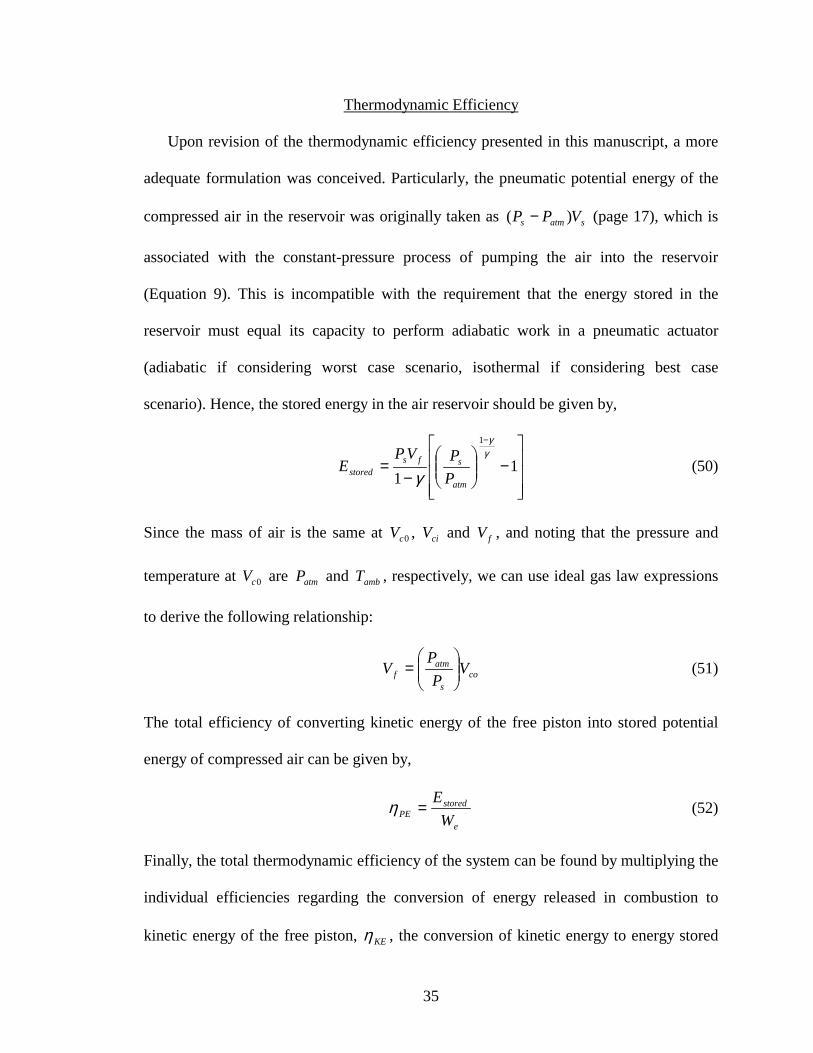
Manuscript 1: ADDENDUM ……………………………………. Thermodynamic Efficiency ………………………………..
III. Manuscript 2: DESIGN OF A FREE PISTON
PNEUMATIC COMPRESSOR AS A MOBILE ROBOT POWER SUPPLY ……………….………….
Abstract ……………………………………………………. Introduction ………………………………….…………….. The Free Piston Compressor ………………………………. Features ……………………………………………. Design ………………………………………………….….. Additional Design Considerations ………………………… Experimental Evaluation and Results ………………….….. Conclusions ………………………………….…………….. Acknowledgements ………………………….…………….. References …………………………………………………. Manuscript 2: ADDENDUM ……………………………………. Notes on Efficiency ………………………………………... IV. Manuscript 3: EXPERIMENTAL OPERATION
AND CHARACTERIZATION OF A FREE PISTON COMPRESSOR ………………………………... Abstract ……………………………………………………. Introduction ………………………………….…………….. New Version of FPC ………………………………………. Design ………………………………………………….….. Measuring Mass of Propane …………….…………. Adjusting Mixture While Pumping ………………... Experimental Results and Evaluation ………………….….. Conclusions ………………………………….…………….. References …………………………………………………. Manuscript 3: ADDENDUM ……………………………………. Pneumatic Stored Energy …………………………………. Mass of Propane Used for Combustion …………….……...
V. Manuscript 4: A FREE PISTON PNEUMATIC COMPRESSOR AS A MOBILE ROBOT POWER SUPPLY: DESIGN, CHARACTERIZATION AND EXPERIMENTAL OPERATION ………………………...
34
35
37
38 38 40 42 45 51 52 55 56 57
58
59
60
61 61 65 68 70 72 74 80 82
83
84 84
86
v
Abstract ……………………………………………………. Introduction ………………………………….…………….. The Free Piston Compressor ………………………………. Theoretical Predictions ……………………………………. Engine Side……………………………….……….. Compressor Side and Reservoir …………………… Mass Investment …………………………………...
System Efficiency …………………………………………. Dynamic Model of the Engine Side ………………………..
Design and Implementation ………………….……………. Injection Pressure ……………….………………….
Mixture Quality ……………………………………. Measuring the Mass of Propane …………………… Adjusting Mixture While Pumping ………………... Experimental Results and Evaluation ………………….….. Conclusions ………………………………….…………….. References ………………………………………………….
Appendix …………………………………………………………………………..
A. SIMULINK DIAGRAMS ………………………………………...
B. MATLAB CODE …………………………………………………
C. ADDITIONAL EXPERIMENTAL DATA FROM MANUSCRIPT 2 …………………………………………………
D. ADDITIONAL EXPERIMENTAL DATA FROM
MANUSCRIPT 3 …………………………………………………
87 87 91 94 94 95 97 97 99 102 106 107 108 109 111 118 121
123
123
135
146
152
vi
LIST OF FIGURES
Figure
1.1 Schematic of the Free Piston Compressor System ………………….. 1.2 Schematic and Picture of 'Pump on Return' FPC Prototype ………… 1.3 Schematic and Picture of New Version of FPC …………………….. 2.1 Schematic of the Free Piston Compressor System ………………….. 2.2 The efficiency of converting energy of combustion into kinetic
energy of the free piston as a function of the initial combustion pressure ………………………………………………………………
2.3 The efficiency of converting kinetic energy of the free piston into
stored energy in the reservoir as a function of the reservoir pressure ….…………………………………………………
2.4 The efficiency associated with the investment of reservoir air for the
combustion of propane as a function of the initial combustion pressure (and with Ps = 653 kPa) ………………………………….…
2.5 The overall system efficiency as a function of the initial combustion
pressure (and with Ps = 653 kPa) ……….…………………………… 2.6 Pressure in the Engine Side …………………………………………. 2.7 Temperature in the Engine Side …………………………………….. 2.8 Pressure in the Compressor Side …………………………………….. 2.9 Temperature in the Compressor Side ………………………………... 2.10 The overall system efficiency as a function of the initial
combustion pressure(for various values of Ps) ……………………… 3.1 Schematic of the Free Piston Compressor …………………………... 3.2 P-V diagram of FPC cycle superimposed on a P-V diagram of the
Otto cycle ………………………………………………………….…
Page
4 5 6
12
14
18
20
21
30
30
31
31
36
40
43
vii
3.1 Picture of Free Piston Compressor …………………………………..
3.2 Exploded view of FPC hardware ……………………………………. 3.3 Removal of left piston seals and end caps …………………………...
3.4 P-V curve in the combustion chamber ……………………………….
3.5 Pressure in the combustion chamber ………………………………… 3.6 Position of the free piston …………………………………………… 3.7 Velocity of the free piston …………………………………………… 4.1 Schematic of Old Version of FPC …………………………………... 4.2 Schematic of New Version of FPC …………………………………. 4.3 Picture of New FPC ………………………………………………… 4.4 Close-up Picture of Cylinder ………………………………………... 4.5 Fuel Masses and Combustion Pressures …………………………….. 4.6 Pressure in the Combustion Chamber ……………………………….. 4.7 Pressure in the Air Reservoir ………………………………………... 4.8 Position of the Free Piston …………………………………………... 4.9 Velocity of the Free Piston ………………………………………….. 4.10 Pressure in the Combustion Chamber ……………………………….. 4.11 Pressure in the Air Reservoir ………………………………………... 4.12 Position of the Free Piston ………………………………………….. 4.13 Velocity of the Free Piston ………………………………………….. 5.1 Schematic of the free piston compressor system ……………………. 5.2 P-V diagram of FPC cycle superimposed on a P-V diagram of the
Otto cycle …………………………………………………………….
46
46
49
50
54
54
55
66
67
69
69
73
75
75
76
76
78
78
79
79
91
93
viii
5.3 Figure 5-3: The overall system efficiency as a function of the initial combustion pressure (for various values of Ps).……………………..
5.4 Pressure drop in engine side right after combustion ………………… 5.5 Schematic of hardware version of FPC ……………………………... 5.6 Picture of FPC Prototype ……………………………………………. 5.7 Close-up Picture of Cylinder …………………………………….….. 5.8 Fuel Masses and Combustion Pressures …………………………….. 5.9 Pressure in the Combustion Chamber ……………………………….. 5.10 Pressure in the Air Reservoir ………………………………………... 5.11 Position of the Free Piston …………………………………………... 5.12 Velocity of the Free Piston ………………………………………….. 5.13 P-V curve in the combustion chamber ………………………………. 5.14 Pressure in the Combustion Chamber for Efficient Firing…….…….. 5.15 Pressure in the Air Reservoir ………………………………………... 5.16 Position of the Free Piston …………………………………………... 5.17 Velocity of the Free Piston ………………………………………….. A-1 Block diagram of FPC simulation used in Manuscript 1 ……………. A-2 Contents of sub-block "Breathe in/out." (Manuscript 1) ……………. A-3 Contents of sub-block "Cp, Cv, R, Gamma Calculations."
(Manuscript 1) ……………………………………………………….. A-4 Contents of sub-block "Engine Parameters." (Manuscript 1) ……….. A-5 Contents of sub-block "Inertial Dynamics Parameters."
(Manuscript 1) ……………………………………………………….. A-6 Contents of sub-block "Pump / Breathe in." (Manuscript 1) ………... A-7 Contents of sub-block "Pump Parameters." (Manuscript 1) …………
98
102
103
105
105
110
112
112
112
113
114
115
116
116
116
124
125
125
126
127
127
128
ix
A-8 Block diagram of 'Pump-On-Return' simulation used in Manuscript 2 ………………………………………………………… A-9 Contents of sub-block "Breathe in / Pump." (Manuscript 2) ………... A-10 Contents of sub-block "Temperature Dynamics." (Manuscript 2) ….. A-11 Contents of sub-block "Pressure Dynamics." (Manuscript 2) ………. A-12 Contents of sub-block "Inertial Dynamics Parameters." (Manuscript 2) ……………………………………………………….. A-13 Block diagram of Real Time Workshop implementation for
Manuscript 2 ………………………………………………………… A-14 Block diagram of Real Time Workshop implementation for
Manuscript 3 ………………………………………………………… C-1 Combustion Pressure with 95 ms air valve opening time, 13 ms fuel
valve opening time, and 50 PSIG air supply. (run090804_v2.mat) ..... C-2 Position of free piston with 95 ms air valve opening time, 13 ms fuel
valve opening time, and 50 PSIG air supply. (run090804_v2.mat) …. C-3 Up-close view of combustion sample, from Figure C-1.
(run090804_v2.mat) …………………………………………………. C-4 Up-close view of position profile, from Figure C-2.
(run090804_v2.mat) …………………………………………………. C-5 Combustion Pressure with 100 ms air valve opening time, 13 ms fuel
valve opening time, and 50 PSIG air supply. (run090804_v3.mat) …. C-6 Position of free piston with 100 ms air valve opening time, 13 ms
fuel valve opening time, and 50 PSIG air supply. (run090804_v3.mat) ………………………………………………….
C-7 Up-close view of combustion sample, from Figure C-5.
(run090804_v3.mat) …………………………………………………. C-8 Up-close view of position profile, from Figure C-6.
(run090804_v3.mat) …………………………………………………. C-9 Combustion Pressure with 110 ms air valve opening time, 14 ms fuel
valve opening time, and 50 PSIG air supply. (run091004_v1.mat) ….
129
130
131
131
132
133
134
147
147
147
147
148
148
148
148
149
x
C-10 Position of free piston with 110 ms air valve opening time, 14 ms fuel valve opening time, and 50 PSIG air supply ……………………
C-11 Up-close view of combustion sample, from Figure C-9.
(run091004_v1.mat) …………………………………………………. C-12 Up-close view of position profile, from Figure C-10 ……………….. C-13 Combustion Pressure with 50 ms air valve opening time, 11 ms fuel
valve opening time, and 78 PSIG air supply ………………………… C-14 Position of free piston with 50 ms air valve opening time, 11 ms fuel
valve opening time, and 78 PSIG air supply ………………………… C-15 Up-close view of combustion sample, from Figure C-13 …………… C-16 Up-close view of position profile, from Figure C-10 ……………….. C-17 Combustion Pressure with 45 ms air valve opening time, 9 ms fuel
valve opening time, and 78 PSIG air supply ………………………… C-18 Position of free piston with 45 ms air valve opening time, 9 ms fuel
valve opening time, and 78 PSIG air supply ………………………… C-19 Up-close view of combustion sample, from Figure C-17 …………… C-20 Up-close view of position profile, from Figure C-18 ……………….. D-1 Combustion Pressure with 70 ms air valve opening time, 13 ms fuel
valve opening time, and 78 PSIG air supply ………………………… D-2 Pumping Pressure with 70 ms air valve opening time, 13 ms fuel
valve opening time, and 78 PSIG air supply ………………………… D-3 Position of Free Piston with 70 ms air valve opening time, 13 ms
fuel valve opening time, and 78 PSIG air supply …………………… D-4 Velocity of Free Piston with 70 ms air valve opening time, 13 ms
fuel valve opening time, and 78 PSIG air supply …………………… D-5 Combustion Pressure with 45 ms air valve opening time, 13 ms fuel
valve opening time, and 78 PSIG air supply ………………………… D-6 Pumping Pressure with 45 ms air valve opening time, 13 ms fuel
valve opening time, and 78 PSIG air supply …………………………
149
149
149
150
150
150
150
151
151
151
151
153
153
153
153
154
154
xi
D-7 Position of Free Piston with 45 ms air valve opening time, 13 ms fuel valve opening time, and 78 PSIG air supply ……………………
D-8 Velocity of Free Piston with 45 ms air valve opening time, 13 ms
fuel valve opening time, and 78 PSIG air supply …………………… D-9 Combustion Pressure with 59 ms air valve opening time, 9 ms fuel
valve opening time, and 78 PSIG air supply ………………………… D-10 Pumping Pressure with 59 ms air valve opening time, 9 ms fuel
valve opening time, and 78 PSIG air supply ………………………… D-11 Position of Free Piston with 59 ms air valve opening time, 9 ms fuel
valve opening time, and 78 PSIG air supply ………………………… D-12 Velocity of Free Piston with 59 ms air valve opening time, 9 ms fuel
valve opening time, and 78 PSIG air supply ………………………… D-13 Combustion Pressure with 53 ms air valve opening time, 8 ms fuel
valve opening time, and 78 PSIG air supply ………………………… D-14 Pumping Pressure with 53 ms air valve opening time, 8 ms fuel
valve opening time, and 78 PSIG air supply ………………………… D-15 Position of Free Piston with 53 ms air valve opening time, 8 ms fuel
valve opening time, and 78 PSIG air supply ………………………… D-16 Velocity of Free Piston with 53 ms air valve opening time, 8 ms fuel
valve opening time, and 78 PSIG air supply ………………………… D-17 Combustion Pressure with 53 ms air valve opening time, 8 ms fuel
valve opening time, and 78 PSIG air supply ………………………… D-18 Pumping Pressure with 53 ms air valve opening time, 8 ms fuel
valve opening time, and 78 PSIG air supply ………………………… D-19 Position of Free Piston with 53 ms air valve opening time, 8 ms fuel
valve opening time, and 78 PSIG air supply ………………………… D-20 Velocity of Free Piston with 53 ms air valve opening time, 8 ms fuel
valve opening time, and 78 PSIG air supply ………………………… D-21 Combustion Pressure with 59 ms air valve opening time, 9 ms fuel
valve opening time, and 78 PSIG air supply …………………………
154
154
155
155
155
155
156
156
156
156
157
157
157
157
158
xii
D-22 Pumping Pressure with 59 ms air valve opening time, 9 ms fuel valve opening time, and 78 PSIG air supply …………………………
D-23 Position of Free Piston with 59 ms air valve opening time, 9 ms fuel
valve opening time, and 78 PSIG air supply ………………………… D-24 Velocity of Free Piston with 59 ms air valve opening time, 9 ms fuel
valve opening time, and 78 PSIG air supply ………………………… D-25 Combustion Pressure with 59 ms air valve opening time, 9 ms fuel
valve opening time, and 78 PSIG air supply ………………………… D-26 Pumping Pressure with 59 ms air valve opening time, 9 ms fuel
valve opening time, and 78 PSIG air supply ………………………… D-27 Position of Free Piston with 59 ms air valve opening time, 9 ms fuel
valve opening time, and 78 PSIG air supply ………………………… D-28 Velocity of Free Piston with 59 ms air valve opening time, 9 ms fuel
valve opening time, and 78 PSIG air supply ………………………… D-29 Combustion Pressure with 67 ms air valve opening time, 10 ms fuel
valve opening time, and 78 PSIG air supply ………………………… D-30 Pumping Pressure with 67 ms air valve opening time, 10 ms fuel
valve opening time, and 78 PSIG air supply ………………………… D-31 Position of Free Piston with 67 ms air valve opening time, 10 ms
fuel valve opening time, and 78 PSIG air supply …………………… D-32 Velocity of Free Piston with 67 ms air valve opening time, 10 ms
fuel valve opening time, and 78 PSIG air supply …………………… D-33 Combustion Pressure with 67 ms air valve opening time, 10 ms fuel
valve opening time, and 78 PSIG air supply ………………………… D-34 Pumping Pressure with 67 ms air valve opening time, 10 ms fuel
valve opening time, and 78 PSIG air supply ………………………… D-35 Position of Free Piston with 67 ms air valve opening time, 10 ms
fuel valve opening time, and 78 PSIG air supply …………………… D-36 Velocity of Free Piston with 67 ms air valve opening time, 10 ms
fuel valve opening time, and 78 PSIG air supply ……………………
158
158
158
159
159
159
159
160
160
160
160
161
161
161
161

xiii
LIST OF TABLES
Table
5.1 Energetic Comparison Between FPC system and state of the art rechargeable batteries.………………………………………………...
Page
115
1
CHAPTER I
INTRODUCTION AND BACKGROUND
Introduction
The need for an effective portable power supply for human-scale robots has
increasingly become a matter of interest in robotics research. Current prototypes of
humanoid robots, such as the Honda P3, Honda ASIMO and the Sony QRIO, show
significant limitations in the capacity of their power sources in between charges (the
operation time of the humanoid-size Honda P3, for instance, is only 25 minutes). This
limitation becomes a strong motivation for the development and implementation of a
more adequate source of power. Moreover, the power density of the actuators coupled to
the power source needs to be maximized such that, on a systems level evaluation, the
combined power supply and actuation system is both energy and power dense. Put
simply, state-of-the-art batteries are too heavy for the amount of energy they store, and
electric motors are too heavy for the mechanical power they can deliver, in order to
present a viable combined power supply and actuation system capable of delivering
human-scale mechanical work in a human-scale self contained robot package, for a useful
duration of time. The motivation details are discussed more thoroughly in [4].
The total energetic merit of an untethered power supply and actuation system is a
combined measure of 1) source energy density of the energetic substance being carried,
2) efficiency of conversion to controlled mechanical work, 3) energy converter mass, and
4) power density of the actuators. With regard to a battery powered electric motor
2
actuated system, the efficiency of conversion from stored electrochemical energy to shaft
work after a gear head can be high (~50%) with very little converter mass (e.g. PWM
amplifiers); however, the energy density of batteries is relatively low (about 180 kJ/kg for
NiMH batteries), and the power density of electrical motors is not very high (on the order
of 50 W/kg), rendering the overall system heavy in relation to the mechanical work that it
can output. With regard to the hydrocarbon-pneumatic power supply and actuation
approach presented here relative to the battery/motor system, the converter mass is high
and the total conversion efficiency is shown to be low. However, the energy density of
hydrocarbon fuels, where the oxidizer is obtained from the environment and is therefore
free of its associated mass penalty, is in the neighborhood of 45 MJ/kg, which is more
than 200 times greater than the energy density of state of the art electrical batteries. This
implies that even with poor conversion efficiency (poor but within the same order of
magnitude), the available energy to the actuator per unit mass of the energy source is still
at least one order of magnitude greater than the battery/motor system. Additionally, linear
pneumatic actuators have roughly one order of magnitude greater power density than
state of the art electrical motors. Therefore, the proposed technology yields an increased
energetic merit on an overall systems level.
The free piston compressor (FPC) presented in this work serves the function of
converting chemically stored energy of a hydrocarbon into pneumatic potential energy of
compressed air. More specifically, it extracts the energy by producing combustion of a
stoichiometric mixture of propane and air, and the combustion-driven free piston acts as
an air pump to produce the compressed air.
3
Previous Work
The idea of using a free piston combustion-based device as a pump has been around
since the original free-piston patent by Pescara in 1928 [7]. The automotive industry
conducted a large amount of research in the 1950’s. Ford Motor Company considered the
use of a free piston device as a gasifier in 1954 [5]. General Motors presented the
“Hyprex” engine in 1957 [8]. Such endeavours were aimed at an automotive scale engine
and were largely unsuccessful. In more recent times, the free piston engine concept has
been considered for small-scale power generation. Aichlmayr, et. al. [1, 2] have
considered the use of a free piston device as an electrical power source on the 10 W scale
meant to compete with batteries. Beachley and Fronczak [3], among others, have
considered the design of a free-piston hydraulic pump. McGee, et. al. have considered the
use of a monopropellant-based catalytic reaction as an alternative to combustion, as
applied to a free piston hydraulic pump [6].
Contribution
Even though free piston devices have been studied in the past, none of these previous
designs explicitly featured what is perhaps the main advantage of a free piston, which is
its capability to offer a purely inertial load. The main focus of this work is to exploit the
fact that a free piston can present a purely inertial load to the combustion, and as a result,
desirable operational characteristics can be obtained, such as high efficiency, low noise,
and low temperature operation. Additionally, this work aims to demonstrate that a free
piston compressor stands as a strong candidate for a portable power supply system for
untethered human-scale pneumatic robots.
4
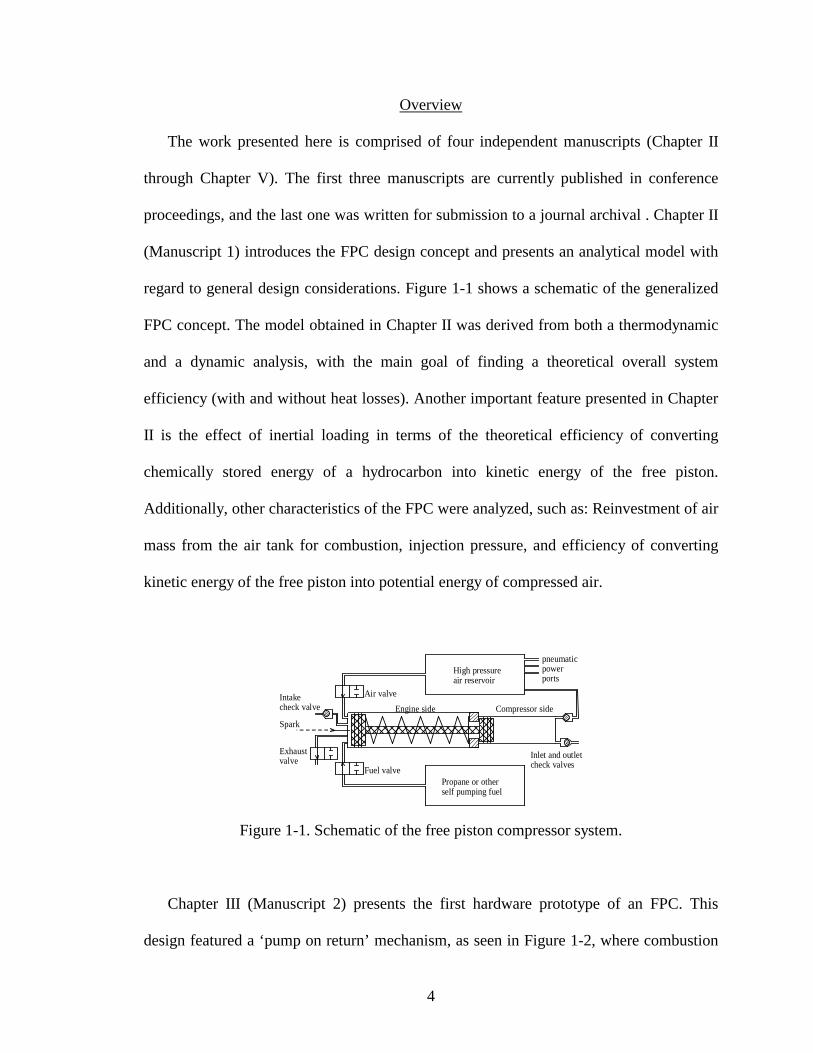
Overview
The work presented here is comprised of four independent manuscripts (Chapter II
through Chapter V). The first three manuscripts are currently published in conference
proceedings, and the last one was written for submission to a journal archival . Chapter II
(Manuscript 1) introduces the FPC design concept and presents an analytical model with
regard to general design considerations. Figure 1-1 shows a schematic of the generalized
FPC concept. The model obtained in Chapter II was derived from both a thermodynamic
and a dynamic analysis, with the main goal of finding a theoretical overall system
efficiency (with and without heat losses). Another important feature presented in Chapter
II is the effect of inertial loading in terms of the theoretical efficiency of converting
chemically stored energy of a hydrocarbon into kinetic energy of the free piston.
Additionally, other characteristics of the FPC were analyzed, such as: Reinvestment of air
mass from the air tank for combustion, injection pressure, and efficiency of converting
kinetic energy of the free piston into potential energy of compressed air.
Intakecheck valve
Spark
Exhaustvalve
Fuel valvePropane or otherself pumping fuel
Air valve
High pressureair reservoir
pneumaticpowerports
Engine side Compressor side
Inlet and outletcheck valves
Figure 1-1. Schematic of the free piston compressor system.
Chapter III (Manuscript 2) presents the first hardware prototype of an FPC. This
design featured a ‘pump on return’ mechanism, as seen in Figure 1-2, where combustion
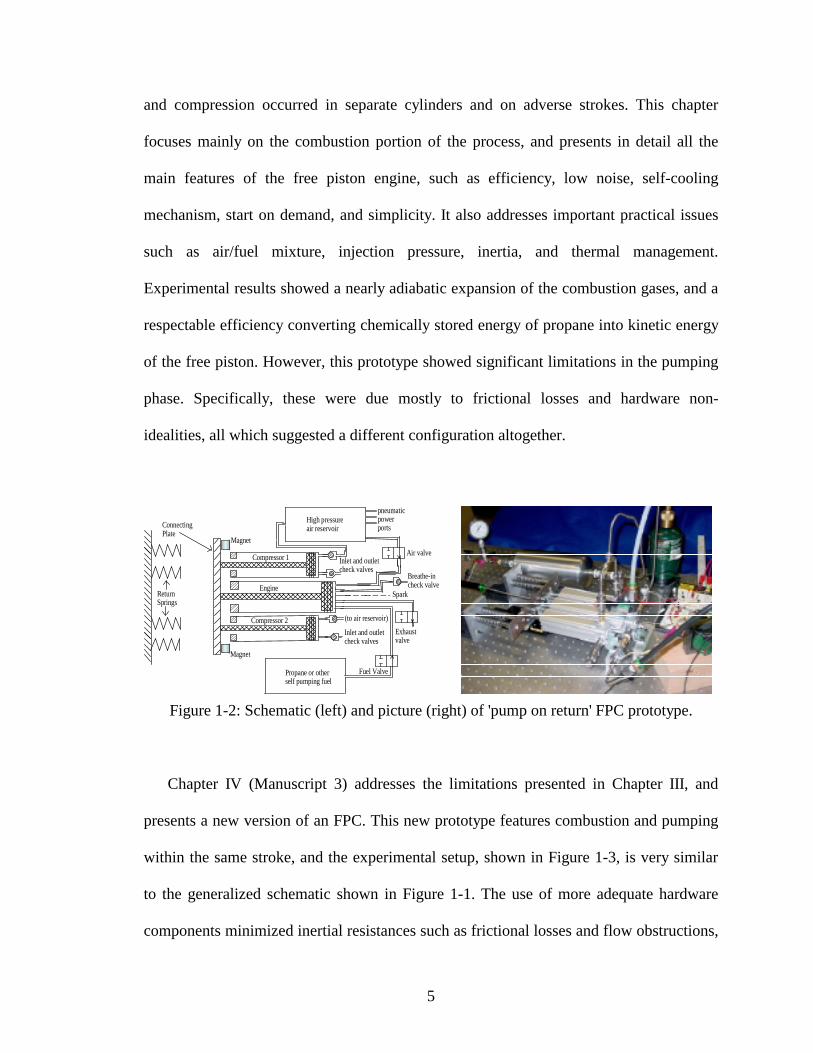
5
and compression occurred in separate cylinders and on adverse strokes. This chapter
focuses mainly on the combustion portion of the process, and presents in detail all the
main features of the free piston engine, such as efficiency, low noise, self-cooling
mechanism, start on demand, and simplicity. It also addresses important practical issues
such as air/fuel mixture, injection pressure, inertia, and thermal management.
Experimental results showed a nearly adiabatic expansion of the combustion gases, and a
respectable efficiency converting chemically stored energy of propane into kinetic energy
of the free piston. However, this prototype showed significant limitations in the pumping
phase. Specifically, these were due mostly to frictional losses and hardware non-
idealities, all which suggested a different configuration altogether.
Figure 1-2: Schematic (left) and picture (right) of 'pump on return' FPC prototype.
Chapter IV (Manuscript 3) addresses the limitations presented in Chapter III, and
presents a new version of an FPC. This new prototype features combustion and pumping
within the same stroke, and the experimental setup, shown in Figure 1-3, is very similar
to the generalized schematic shown in Figure 1-1. The use of more adequate hardware
components minimized inertial resistances such as frictional losses and flow obstructions,
Propane or otherself pumping fuel
Fuel Valve
Spark
Exhaustvalve
Air valve
High pressureair reservoir
pneumaticpowerports
Engine
Compressor 1 Inlet and outletcheck valves
Compressor 2
ReturnSprings
Magnet
Magnet
ConnectingPlate
Inlet and outletcheck valves
(to air reservoir)
Breathe-incheck valve
6
and successful pumping was obtained up to 310 kPa. This chapter also presents a more
effective way of measuring the mass of propane for each combustion cycle, and
experimentally calculates the overall efficiency of the system. Finally, based on the
experimentally obtained efficiency, a numerical analysis comparing the FPC to state-of-
the art systems is presented.
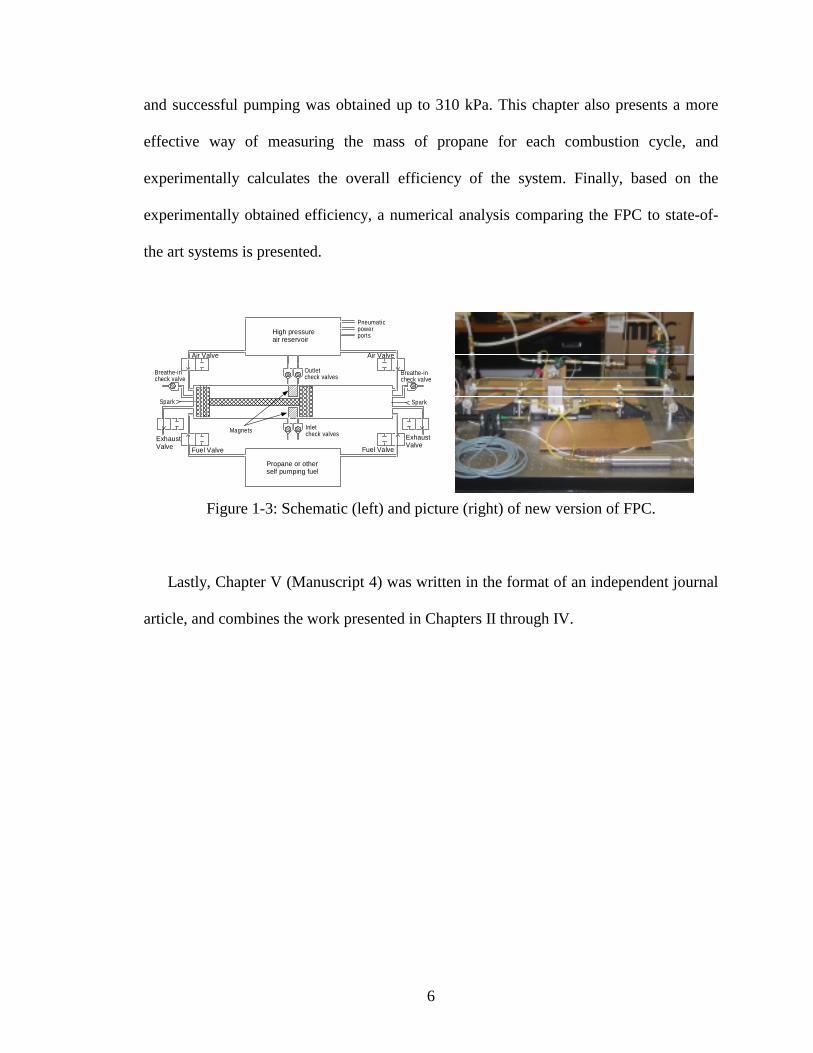
Figure 1-3: Schematic (left) and picture (right) of new version of FPC.
Lastly, Chapter V (Manuscript 4) was written in the format of an independent journal
article, and combines the work presented in Chapters II through IV.
High pressureair reservoir
Propane or otherself pumping fuel
Fuel Valve Fuel Valve
Air Valve Air Valve
ExhaustValve
ExhaustValve
Pneumaticpowerports
Breathe-incheck valve
Breathe-incheck valve
Spark Spark
Outletcheck valves
Inletcheck valvesMagnets
7
References
[1] Aichlmayr, H. T., Kittelson, D. B., and Zachariah, M. R., “Miniature free-piston homogenous charge compression ignition engine-compressor concept – Part I: performance estimation and design considerations unique to small dimensions,” Chemical Engineering Science, 57, pp. 4161-4171, 2002.
[2] Aichlmayr, H. T., Kittelson, D. B., and Zachariah, M. R., “Miniature free-piston
homogenous charge compression ignition engine-compressor concept – Part II: modeling HCCI combustion in small scales with detailed homogeneous gas phase chemical kinetics,” Chemical Engineering Science, 57, pp. 4173-4186, 2002.
[3] Beachley, N. H. and Fronczak, F. J., “Design of a Free-Piston Engine-Pump,” SAE
Technical Paper Series, 921740, pp. 1-8, 1992. [4] Goldfarb, M., Barth, E. J., Gogola, M. A., Wehrmeyer, J. A., “Design and Energetic
Characterization of a Liquid-Propellant-Powered Actuator for Self-Powered Robots”. IEEE/ASME Transactions on Mechatronics, vol. 8, no. 2, pp. 254-262, June 2003.
[5] Klotsch, P., “Ford Free-Piston Engine Development,” SAE Technical Paper Series,
590045, vol. 67, pp. 373-378, 1959. [6] McGee, T. G., Raade, J. W., and Kazerooni, H., “Monopropellant-Driven Free
Piston Hydraulic Pump for Mobile Robotic Systems,” ASME Journal of Dynamic Systems, Measurement, and Control, vol. 126, pp. 75-81, March 2004.
[7] Pescara, R. P., “Motor Compressor Apparatus,” U.S. Patent No. 1,657,641, Jan. 31,
1928. [8] Underwood, A. F., “The GMR 4-4 ‘Hyprex’ Engine: A Concept of the Free-Piston
Engine for Automotive Use,” SAE Technical Paper Series, 570032, vol. 65, pp. 377-391, 1957.
CHAPTER II
MANUSCRIPT 1
DYNAMIC CHARACTERISTICS OF A FREE PISTON COMPRESSOR
Eric J. Barth and José Riofrio
Department of Mechanical Engineering
Vanderbilt University
Nashville, TN 37235
(Accepted by ASME International Mechanical Engineering Congress and Exposition
(IMECE), Anaheim, CA, November 2004)
9
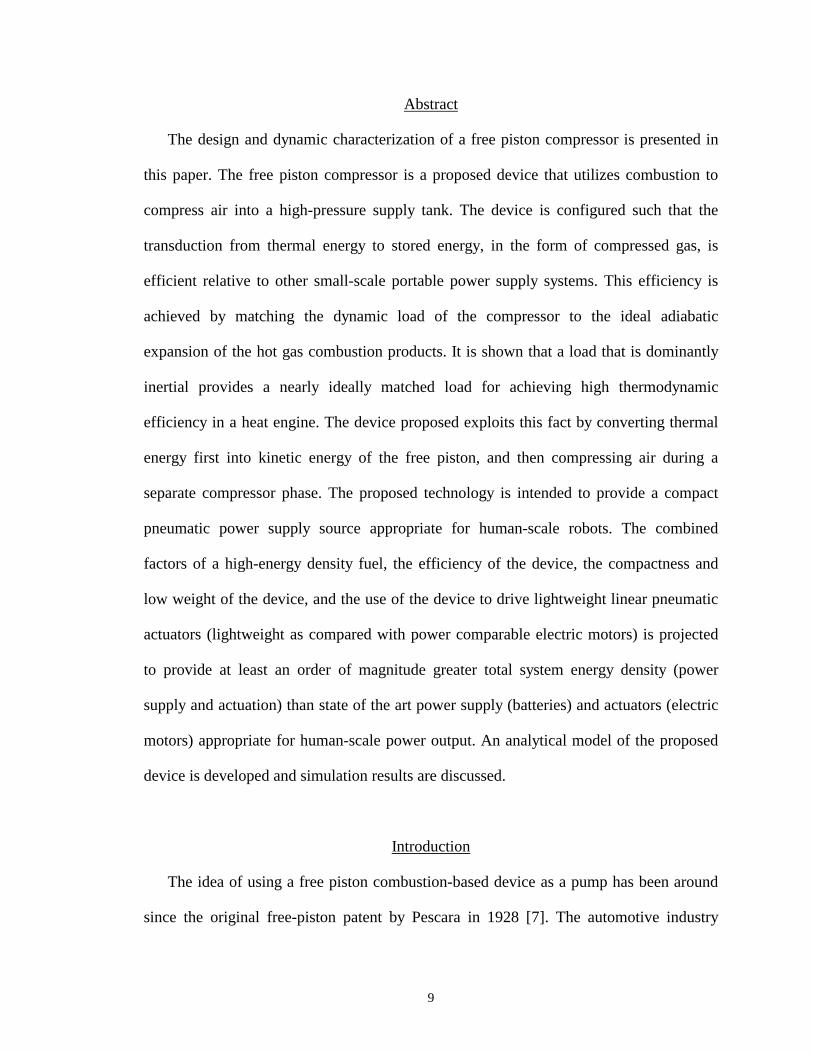
Abstract
The design and dynamic characterization of a free piston compressor is presented in
this paper. The free piston compressor is a proposed device that utilizes combustion to
compress air into a high-pressure supply tank. The device is configured such that the
transduction from thermal energy to stored energy, in the form of compressed gas, is
efficient relative to other small-scale portable power supply systems. This efficiency is
achieved by matching the dynamic load of the compressor to the ideal adiabatic
expansion of the hot gas combustion products. It is shown that a load that is dominantly
inertial provides a nearly ideally matched load for achieving high thermodynamic
efficiency in a heat engine. The device proposed exploits this fact by converting thermal
energy first into kinetic energy of the free piston, and then compressing air during a
separate compressor phase. The proposed technology is intended to provide a compact
pneumatic power supply source appropriate for human-scale robots. The combined
factors of a high-energy density fuel, the efficiency of the device, the compactness and
low weight of the device, and the use of the device to drive lightweight linear pneumatic
actuators (lightweight as compared with power comparable electric motors) is projected
to provide at least an order of magnitude greater total system energy density (power
supply and actuation) than state of the art power supply (batteries) and actuators (electric
motors) appropriate for human-scale power output. An analytical model of the proposed
device is developed and simulation results are discussed.
Introduction
The idea of using a free piston combustion-based device as a pump has been around
since the original free-piston patent by Pescara in 1928 [7]. The automotive industry
10
conducted a large amount of research in the 1950’s. Ford Motor Company considered the
use of a free piston device as a gasifier in 1954 [5]. General Motors presented the
“Hyprex” engine in 1957 [8]. Such endeavors were aimed at an automotive scale engine
and were largely unsuccessful. In more recent times, the free piston engine concept has
been considered for small-scale power generation. Aichlmayr, et. al. [1, 2] have
considered the use of a free piston device as an electrical power source on the 10 W scale
meant to compete with batteries. Beachley and Fronczak [3], among others, have
considered the design of a free-piston hydraulic pump. McGee, et. al. have considered the
use of a monopropellant-based catalytic reaction as an alternative to combustion, as
applied to a free piston hydraulic pump [6].
Following from the motivations outlined in [4], the free piston compressor presented
here is intended as a power supply for a mobile robotic system of human comparable
power, mass and size. In this paper it is shown that the use of a free piston engine as a
direct air compressor offers nearly ideal loading characteristics necessary for high
efficiency, in a simple and small package. Indeed the original patent by Pescara [7]
intended the free piston engine foremost as a compressor. It is additionally shown that
such a device can run at low temperatures and with low noise relative to other internal
combustion devices.
An outline of this paper is as follows. Section 2 describes the proposed device and its
operation. Section 3 presents an idealized thermodynamic analysis of the engine side and
the compressor side separately. This analysis yields a set of relationships that are useful
for design specifications regarding, among other things, the selection of a propellant, the
required mass of combustion gasses, the combustion chamber volume, and the required
compressor chamber volume, for nominal operation at maximum efficiency. Section 4
11
presents a dynamic model of the system that more accurately models the interaction of
the engine side and the compressor side, in addition to providing the capability of
modeling the effects of heat losses, friction, valve losses, and other influences.
The Free Piston Compressor
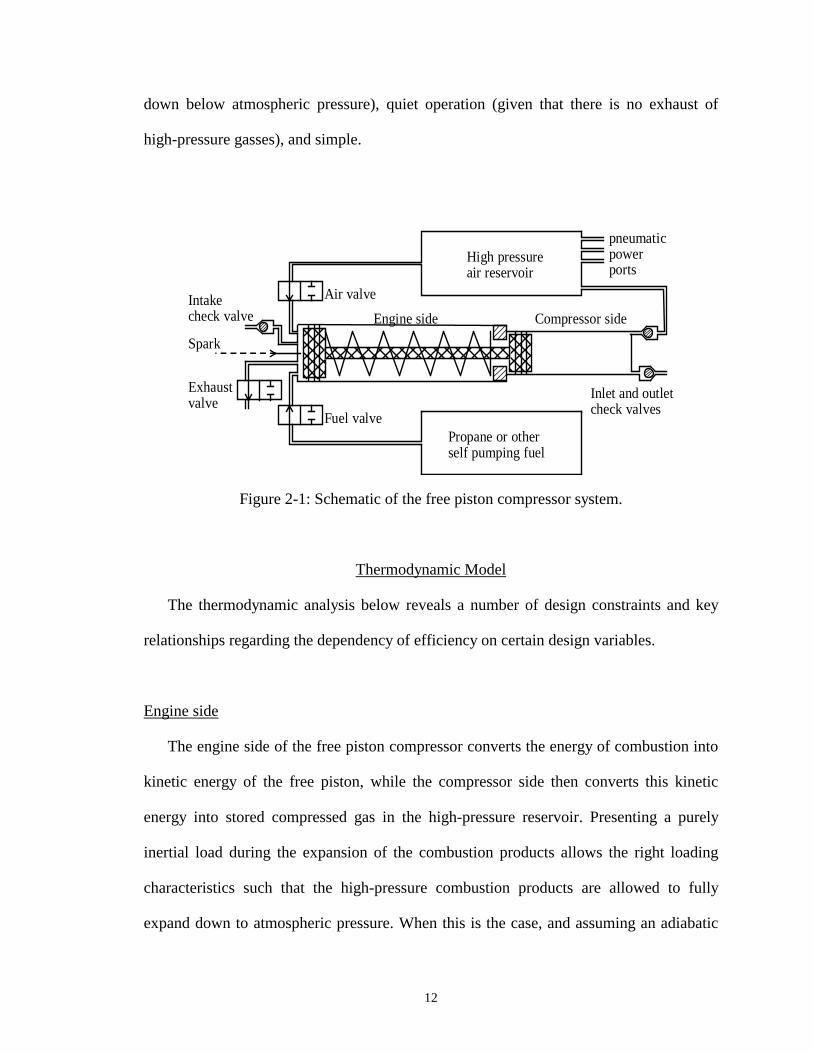
A schematic of the free piston compressor system is shown in Figure 2-1. As shown
in its original position, the device operates by first opening the air and fuel valves to
allow the proper mixture and amount of air and fuel into the combustion chamber of the
engine side. Once the proper air/fuel mixture is inside, the valves close and a spark
initiates the combustion. Upon combustion, the free piston moves to the right as the
combustion gases expand, converting the energy of combustion into kinetic energy of the
free piston. The compressor side of the device is configured such that the piston sees a
negligible compressive force for a distance greater than required for the combustion
chamber to both expand down to atmospheric pressure, and allowed to intake fresh cool
air to cool the exhaust products through the intake check valve. After this point the
kinetic energy of the free piston is converted into the work required to compress and then
pump the gasses in the compressor chamber into the high-pressure reservoir. The cycle is
completed when the light return spring moves the piston to the left pushing out the
diluted exhaust products of the engine side, and refilling the compressor side with air
drawn in through an inlet check valve.
Besides advantages regarding efficiency, the free piston compressor offers on-
demand start and stop (since there is no compression stroke in the engine side), cool
operation (given that the combustion products are greatly diluted with air after expanding
12
down below atmospheric pressure), quiet operation (given that there is no exhaust of
high-pressure gasses), and simple.
Intakecheck valve
Spark
Exhaustvalve
Fuel valvePropane or otherself pumping fuel
Air valve
High pressureair reservoir
pneumaticpowerports
Engine side Compressor side
Inlet and outletcheck valves
Figure 2-1: Schematic of the free piston compressor system.
Thermodynamic Model
The thermodynamic analysis below reveals a number of design constraints and key
relationships regarding the dependency of efficiency on certain design variables.
Engine side
The engine side of the free piston compressor converts the energy of combustion into
kinetic energy of the free piston, while the compressor side then converts this kinetic
energy into stored compressed gas in the high-pressure reservoir. Presenting a purely
inertial load during the expansion of the combustion products allows the right loading
characteristics such that the high-pressure combustion products are allowed to fully
expand down to atmospheric pressure. When this is the case, and assuming an adiabatic
13
process in the combustion chamber, the work done on the inertial load will be equal to
the following,
( ) ( )010
100
1 eefatmeefe
eee VVPVVVPW ee
e
−−−−
= −− γγγ
γ (1)
where 0eP is the initial combustion pressure, 0eV and efV is the initial and final volume of
the combustion chamber respectively, and eγ is the ratio of specific heats of the
combustion gases (products of combustion). Assuming losses associated with friction are
negligible, the kinetic energy of the piston will be equal to the work done eW , when
reaching the position associated with the final volume efV . The combustion chamber
volume required such that the combustion gases are allowed to fully expand down to
atmospheric pressure under adiabatic conditions can be found as:
0
1
0e
atm
eef V
PP
Veγ
= (2)
Taking the initial combustion pressure 0eP as a specifiable quantity (design
specification), the required mass of the fuel/air mixture can be found using the ideal gas
law as,
AFTe
eee TR
VPm 00
0 = (3)
where eR is the average gas constant associated with the combustion products, and AFTT
is the adiabatic flame temperature.
The efficiency of conversion from the energy available in the combustion products to
kinetic energy of the piston is then given by,
−−+−
==−
0
0/)1(/1
0
0 )1()1(
ee
atmeeatmeeAFTe
e
eKE P
PPPPeTR
emW eee
γγγ
ηγγγ
(4)
14
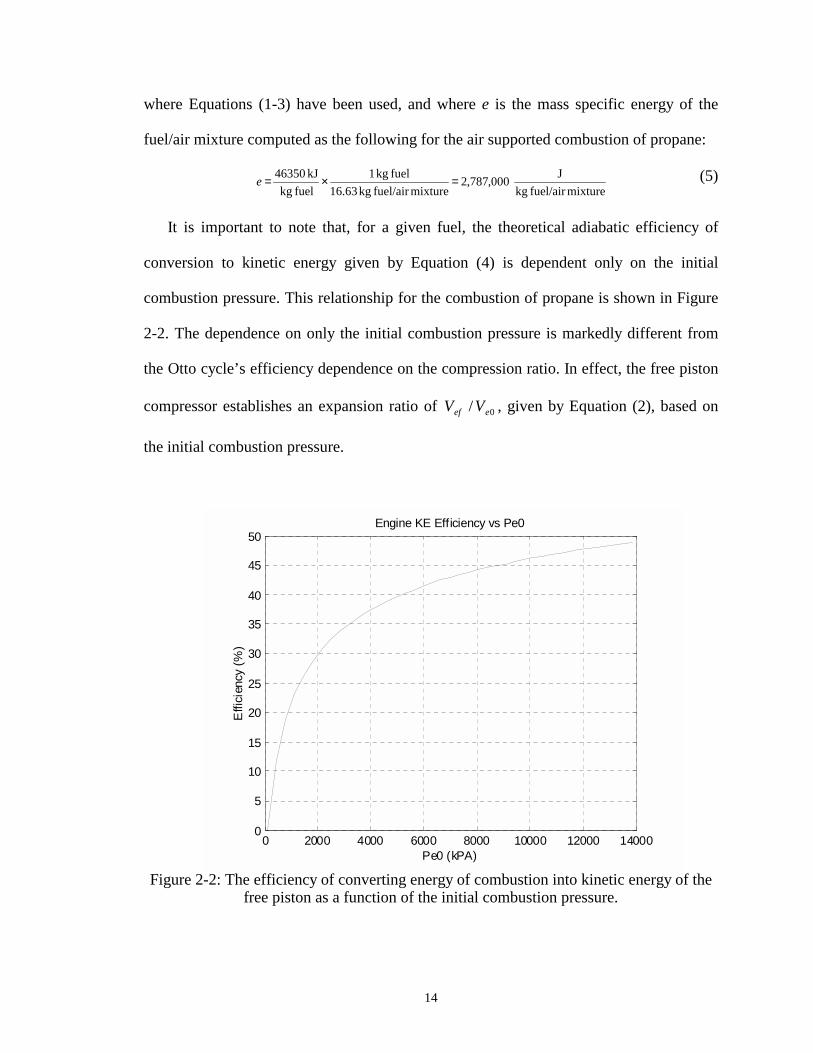
where Equations (1-3) have been used, and where e is the mass specific energy of the
fuel/air mixture computed as the following for the air supported combustion of propane:
mixturefuel/air kg
J 000,787,2mixturefuel/air kg 16.63
fuel kg 1fuel kg
kJ 46350 =×=e (5)
It is important to note that, for a given fuel, the theoretical adiabatic efficiency of
conversion to kinetic energy given by Equation (4) is dependent only on the initial
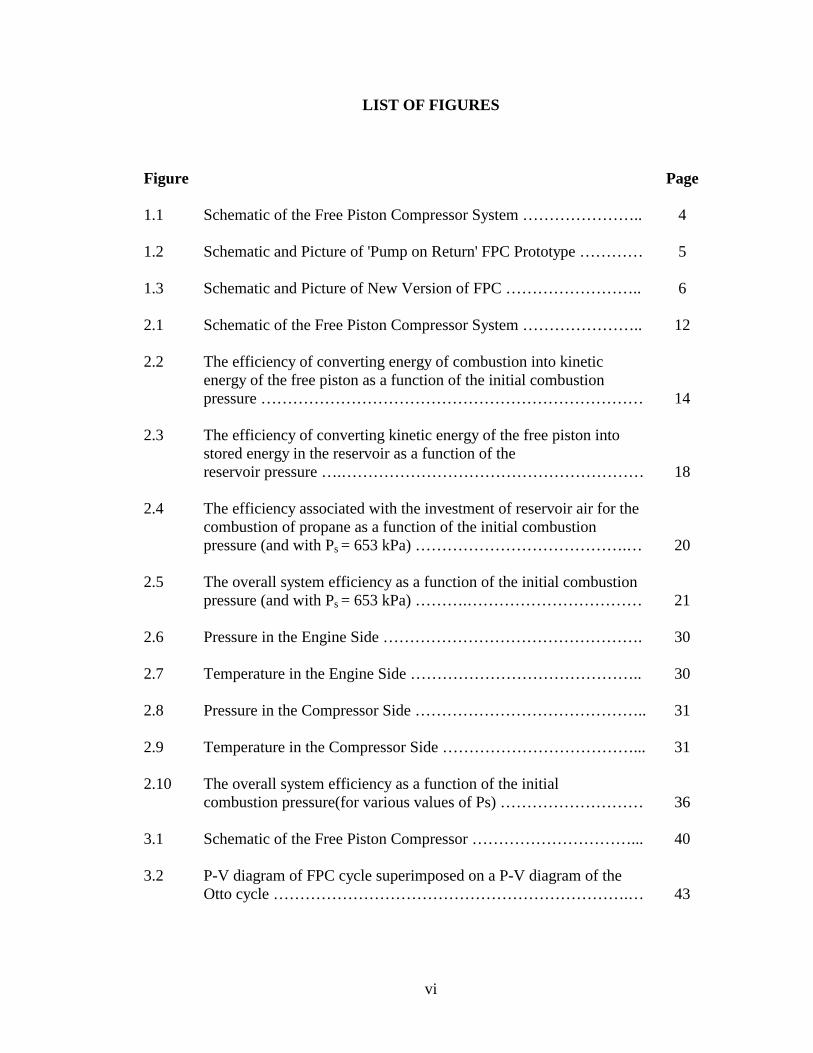
combustion pressure. This relationship for the combustion of propane is shown in Figure
2-2. The dependence on only the initial combustion pressure is markedly different from
the Otto cycle’s efficiency dependence on the compression ratio. In effect, the free piston
compressor establishes an expansion ratio of 0/ eef VV , given by Equation (2), based on
the initial combustion pressure.
0 2000 4000 6000 8000 10000 12000 140000
5
10
15
20
25
30
35
40
45
50
Pe0 (kPA)
Effi
cien
cy (%
)
Engine KE Efficiency vs Pe0
Figure 2-2: The efficiency of converting energy of combustion into kinetic energy of the
free piston as a function of the initial combustion pressure.
15
In order to establish the target initial combustion pressure, the free piston compressor
as proposed requires that both the fuel pressure and pressure of the air reservoir are
adequate enough to inject the fuel and air mixture into the combustion chamber before
combustion occurs. This minimum pressure requirement is given by,
0eAFTe
ambreacinj P
TRTR
P
= (6)
where reacR and ambT is the average gas constant of the reactants and the ambient
temperature, respectively.
Compressor Side and Reservoir
The theoretical operation of the compressor side can be considered as two processes:
firstly, the adiabatic (or polytropic) compression of a gas, and secondly, the constant
pressure process of pumping the gas into the high-pressure air reservoir. The work
required for these two processes will be provided by the kinetic energy of the free piston
as established by the combustion side. Here it is assumed that the length of the device is
such that the pressure in the compressor side is negligible until the pressure has reduced
to atmospheric and the kinetic energy of the free piston has reached its maximum.
The work associated with the adiabatic compression process is given by the
following,
( ) ( )010
101 1 cciatmcci
catmc VVPVVVPW −−−
−= −− γγ
γ
γ (7)
where γ is the ratio of specific heats of air, 0cV and ciV is the initial volume of the
compression chamber where compression begins, and the intermediary volume where
pumping begins, respectively. The analysis can be extended to include heat losses in the
16
compressor by considering a polytropic process whereby γ is reduced but remains
greater than unity. The intermediary volume ciV is given by,
0
1
cs
atmci V
PP
Vγ
= (8)
where sP is the pressure of the high-pressure reservoir. The volume of this air reservoir is
assumed to be large enough such that the pressure does not change appreciably over a
single stroke of the free piston compressor. The work associated with the constant
pressure process of pumping is given by the following:
( )( )cicfatmsc VVPPW −−=2 (9)
where cfV is the final volume of the compressor side (i.e. the dead volume of the cylinder
not able to be pumped out).
For efficient operation of the engine side together with the compressor side, it is
assumed that all of the kinetic energy stored in the free piston as a consequence of the
combustion is utilized to perform the required work on the compressor side:
21 cce WWW −−= (10)
By using Equation (10), and approximating the dead volume of the compressor side
as zero, the following relationship between 0cV and 0eV is obtained:
−+−
−
−
−=
−
−
0
1
0
0
1
0
0
)1(1)1(
1)1(
e
atme
e
atme
e
e
s
atmatm
c
e
PP
PPP
PPP
VV
e
e
γγγ
γγ
γγ
γγ
(11)
17
Effectively, Equation (11) related the initial volume and pressure of the engine side to
the volume and pressure to be compressed and pumped in the compressor side. Using
Equations (1) and (7-11), the efficiency of the compressor can thus be found as:
−
−
−=
−=
−
−
γγ
γγγ
γγη
1
11
2'
1
)1(
s
atm
s
atm
s
atm
e
ccomp
PP
PP
PP
WW (12)
This analysis assumes that the air pumped into the reservoir is at some temperature,
higher than the ambient temperature, reached when the volume in the compressor is
reduced to ciV . Once the air is in the reservoir, and assuming that the reservoir is large, at
constant pressure, and that the residence time of the air is large, this air will cool to the
ambient temperature. This heat loss that occurs in the reservoir has an associated
efficiency since the energy stored reduces from ciatms VPP )( − to satms VPP )( − , where sV
is the final volume the pumped air eventually takes on in the reservoir. Therefore the
efficiency of the initial energy storage to the final is:
ci
amb
ciatms
satmsres T
TVPPVPP
=−−
=)()(η (13)
According to the ideal gas law, the temperature ciT can be found in terms of the mass
pumped cm :
Rm
VPTc
cisci = (14)
where R is the gas constant of air. The mass pumped can in turn be written as:
amb
catmc RT
VPm 0= (15)
18
Substitution of Equations (14), (15) and (8) into (13) yields the following expression
for the efficiency of energy storage of the reservoir:
γ
γ
η
1−
=
s
atmres P
P (16)
The combined efficiency of the compressor converting kinetic energy and the
reservoir storing pneumatic energy is thus:
rescompcomp ηηη '= (17)
The overall efficiency of the compressor is shown in Figure 2-3. It is important to
note that the efficiency is enhanced if heat losses occur in the compressor. This is
intuitive considering the compressor must fight against the heat during the compression
phase from 0cV to ciV . On a design level, this indicates that cooling fins should be placed
on the compressor side of the device to promote as much heat loss as possible.
Figure 2-3: The efficiency of converting kinetic energy of the free piston into stored
energy in the reservoir as a function of the reservoir pressure.
19
Mass Investment
Finally, to complete the cycle, the mass of air utilized from the reservoir to support
the combustion process must be taken into account. Given that the energy stored in the
reservoir is equal to satms VPP )( − , and using the ideal gas law for sV , it can be shown
that the energy stored (relative to atmospheric pressure at ambient temperature) in the
reservoir is equal to the following:
ambcs
atms RTmP
PP )(StoredEnergy
−= (18)
Therefore the energy stored is proportional to the mass in the reservoir. The
investment of air mass needed for the combustion can therefore be expressed as the
following efficiency, for air supported propane combustion:
0
063.1663.15
e
ecinvest m
mm −=η (19)
Using the ideal gas law, this can be expressed as the following:
AFTecatm
ambeeinvest TRVP
RTVP
0
00
63.1663.151−=η (20)
where the functionally constrained volume ratio 00 / ce VV is given by Equation (11). The
efficiency related to the investment of reservoir air mass for the combustion event is
shown in Figure 2-4, for a reservoir pressure of 653 kPa (80 psig), as a function of the
initial combustion pressure 0eP . If heat loss occurs in the compressor chamber, the
efficiency associated with the mass investment is enhanced.
20
0 2000 4000 6000 8000 10000 12000 1400010
20
30
40
50
60
70
80
90
Pe0 (kPA)
Effi
cien
cy (%
)
Mass Investment Efficiency with Ps=80 psig (653 kPa) vs Pe0
Without heat loss in compressor ( γ=1.4) With heat loss in compressor ( γ=1.01)
Figure 2-4: Efficiency associated with the investment of reservoir air for the combustion
of propane as a function of the initial combustion pressure (and with Ps = 653 kPa).
System Efficiency
The overall efficiency of the system can be found by multiplying the individual
efficiencies regarding the conversion of energy released in combustion to kinetic energy
of the free piston, KEη , the conversion of kinetic energy to energy stored in the reservoir
at ambient temperature, compη , and the efficiency related to the required investment of
reservoir air to the combustion event, investη . By multiplying Equations (4), (12), (16) and
(20), the overall system efficiency is found in closed-form shown in Equation (21).
−
−
−
−+
−−
−
= −
−
ambAFTe
s
atm
e
atme
e
atme
es
atmsys RTTR
PP
PP
PP
PP
e
e
e
63.1663.15
1
1)1(
)1()1(11
)1(0
)1(
0
γγ
γγ
γγ
γγγη
(21)
21
Figure 2-5 shows the overall system efficiency as a function of the initial combustion
pressure for a reservoir pressure of 653 kPa (80 psig). It should again be noted that heat
losses, if present, in the compressor chamber enhance the efficiency.
Figure 2-5: The overall system efficiency as a function of the initial combustion pressure
(and with Ps = 653 kPa).
Dynamic Model
The thermodynamic model of the free piston compressor presented above reveals
several fundamental dependencies regarding the efficiency and configuration of the
device. However, the thermodynamic analysis cannot evaluate the effect of several
influences. The effect of the return spring and the effect of diluting the exhaust gasses
and therefore lowering the temperature as the engine side intakes air is not included in the
thermodynamic model above. Other influences capable of being included in a dynamic
22
model can include: the temperature dependence of specific heat, and losses due to check
valves, friction, and leakage, among others. Most importantly, the thermodynamic model
cannot accurately model the interaction between the engine side and the compressor side
(they were modeled separately in Section 3) Lastly, a dynamic model can offer a time-
based evaluation of the system.
Dynamic Model of the Engine Side
Immediately following combustion, the pressure and temperature dynamics in the
combustion side are determined by the following power balance,
eeee WQHU DDDD −+= (22)
where eUD is the rate of internal energy stored in the control volume comprising the
combustion chamber, eHD is the rate of enthalpy crossing the CV boundary, eQD is the
heat flux rate into or out the CV, and eWD is the work rate. Assuming an ideal gas, the rate
of internal energy storage is given by the following two relationships,
)(1
1eeee
eeveeeveee VPVPTcmTcmU DDDDD +
−=+=
γ (23)
where emD is the mass flow rate of gas entering (positive values) or exiting (negative
values) the combustion chamber, vec and eγ are the constant-volume heat capacity and
ratio of specific heats, respectively, of the gas in the combustion chamber, and eP , eV
and eT are the pressure, volume, and temperature, respectively, of the combustion
chamber. The values of vec and eγ must in general be found from the appropriately
weighted average of the temperature dependent values of pc of the species contained
23
within the chamber. The enthalpy rate of energy entering or exiting the control volume is
given by,
outinoutinpee TcmH //,DD = (24)
where outinpc /, is the constant-pressure heat capacity of the gas entering or exiting the
combustion chamber, and outinT / is the temperature of the mass entering or exiting the
chamber. If it is assumed that the engine side is adiabatic, then 0=eQ� . The work rate is
given as:
eee VPW CC = (25)
The operation of the “engine side” of the device can be considered in three phases:
the work phase, the intake phase, and the exhaust phase.
Work Phase
During work phase, no mass flow occurs and Equations (21-25) reduce to the
following relationships regarding the pressure and temperature dynamics inside the
combustion chamber:
e
eeee V
VPPD
Dγ−
= (26)
vee
eee cm
VPT0
DD
−= (27)
The work phase persists while cvdatme PPP −> where cvdP represents the minimum
pressure difference necessary to open the intake check valve.
Intake Phase
If the device is configured such that the free piston is allowed to travel further than
the distance corresponding to a volume of efV as given by Equation (2), and if the
24
combustion chamber is fitted with a check valve, the combustion chamber will draw in
fresh air to cool the combustion products. It is assumed that the check valve selected
offers little resistance to the otherwise free motion of the free piston.
The intake phase is initiated when the pressure in the combustion chamber drops
below cvdatm PP − whereupon the intake check valve opens to allow ambient temperature
air to enter the combustion chamber. The pressure and temperature dynamics are
therefore given by the following relationships,
e
eeairinairpeaire V
VPTcmP
DDD
γγ −−= ,)1(
(28)
airve
eeeairvinairpee cm
VPTcTcmT
,
,, )( DDD
−−= (29)
where the mass flow rate through the check valve is given by the following commonly
accepted mass-flow rate equation:
),( ecvdatmchecke PPPAm −Ψ=D (30)
It is assumed that the check valve opens completely with an orifice area of checkA . The
area normalized mass-flow rate Ψ resides in a choked or unchoked flow regime
according to the following relationship:
−
≤
=Ψ −
(unchoked) otherwise 1
(choked) if
),(,
)1,(),1(
2
1
airair
u
dair
u
d
in
uf
ru
d
in
uf
du
PP
PP
TPCC
CPP
TPCC
PPγ
γγ
(31)
where fC is the discharge coefficient of the check-valve, uP and dP are the upstream
and downstream pressures, respectively, inT is the air temperature, rC is the pressure
ratio that divides the flow regimes into unchoked and choked flow, and 1C and 2C are
constants defined as:
25
)1,()1,(1 )
12( −+
+= airair
airair
air
RC γγ
γγ
(32)
)1(
22 −
=airair
air
RC
γγ
(33)
It should be noted that in Equations (28-33) it has been approximated that once the
intake phase begins, the gas in the combustion chamber behaves as air (with regard to
thermodynamic quantities vc , pc and γ ). This approximation is justified by the
relatively large mass of air drawn in compared the small mass of combustion gases that
exist during the work phase.
Regardless of the actual mechanism of mass-flow through the check valve, Equations
(28) and (29) relate the state variables of interest regarding the operation of the free
piston compressor. Therefore, for purposes of this paper, Equation (30) may be replaced
by the following pressure-difference driven linear mass-flow rate approximation:
)( ecvdatmchecke PPPkm −−≈D (34)
where the coefficient checkk is set such that the mass-flow rate is of a magnitude similar to
that given by Equation (30). It should be noted that the check valve should be selected
with a low minimum pressure to open (the “cracking pressure”) and with a large enough
flow area so as to generate minimal resistive forces on the piston.
Exhaust Phase
The exhaust phase is initiated when the direction of the piston changes and the return
spring pushes it toward the original starting position. This phase needs to be detected by
monitoring the position and/or velocity of the piston such that an actuated valve can be
opened to allow the mixture of combustion gases and air resulting from the intake phase
to leave the combustion chamber. The resulting pressure and temperature dynamics
26
inside the combustion chamber during this phase are similar to those given by Equations
(28) and (29) in the intake phase,
e
eeaireairpeaire V
VPTcmP
DDD
γγ −−= ,)1(
(35)
airve
eeeairveairpee cm
VPTcTcmT
,
,, )( DDD
−−= (36)
where inT of Equation (28) and (29) has been replaced with eT in Equation (35) and (36).
It is again approximated that the behavior of the gasses in the combustion chamber at this
point is dominated by the thermodynamic characteristics of air. The mass-flow rate
through the actuated outlet valve is given by:
),( atmeoute PPAm Ψ−=D (37)
where outA is the flow orifice area of the outlet valve and Ψ is the area normalized mass
flow given by Equations (31), (32) and (33). Similar to Equation (34), this may be
approximated by the following linear mass-flow rate equation:
)( atmeoute PPkm −−≈D (38)
Dynamic Model of the Compressor Side
The compressor side of the device can be modeled using an energetic approach
similar to that used to model the engine side. The compressor side undergoes three
distinct phases: compression, pump, and draw-in.
Compression Phase
During the compression phase, there is no mass-flow and the pressure and
temperature dynamics are similar to those given by Equations (26) and (27):
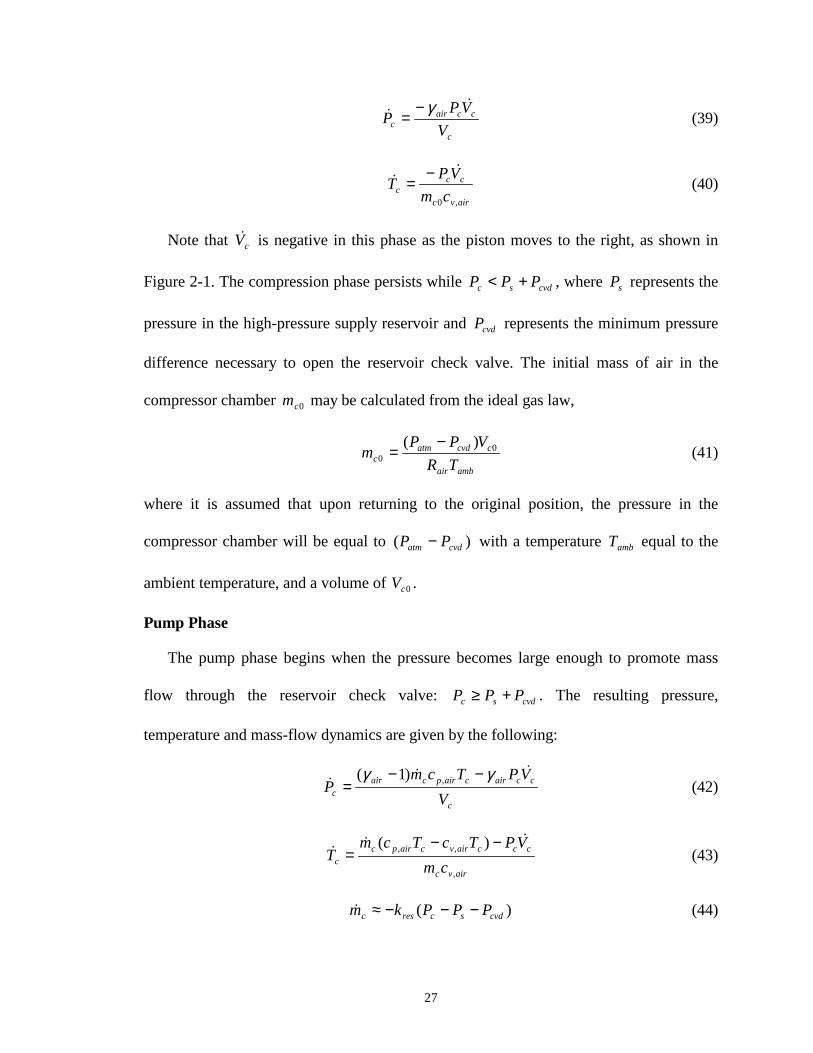
27
c
ccairc V
VPPD
Dγ−
= (39)
airvc
ccc cm
VPT,0
DD
−= (40)
Note that cVD is negative in this phase as the piston moves to the right, as shown in
Figure 2-1. The compression phase persists while cvdsc PPP +< , where sP represents the
pressure in the high-pressure supply reservoir and cvdP represents the minimum pressure
difference necessary to open the reservoir check valve. The initial mass of air in the
compressor chamber 0cm may be calculated from the ideal gas law,
ambair
ccvdatmc TR
VPPm 0
0)( −
= (41)
where it is assumed that upon returning to the original position, the pressure in the
compressor chamber will be equal to )( cvdatm PP − with a temperature ambT equal to the
ambient temperature, and a volume of 0cV .
Pump Phase
The pump phase begins when the pressure becomes large enough to promote mass
flow through the reservoir check valve: cvdsc PPP +≥ . The resulting pressure,
temperature and mass-flow dynamics are given by the following:
c
ccaircairpcairc V
VPTcmP
DDD
γγ −−= ,)1(
(42)
airvc
cccairvcairpcc cm
VPTcTcmT
,
,, )( DDD
−−= (43)
)( cvdscresc PPPkm −−−≈D (44)
28
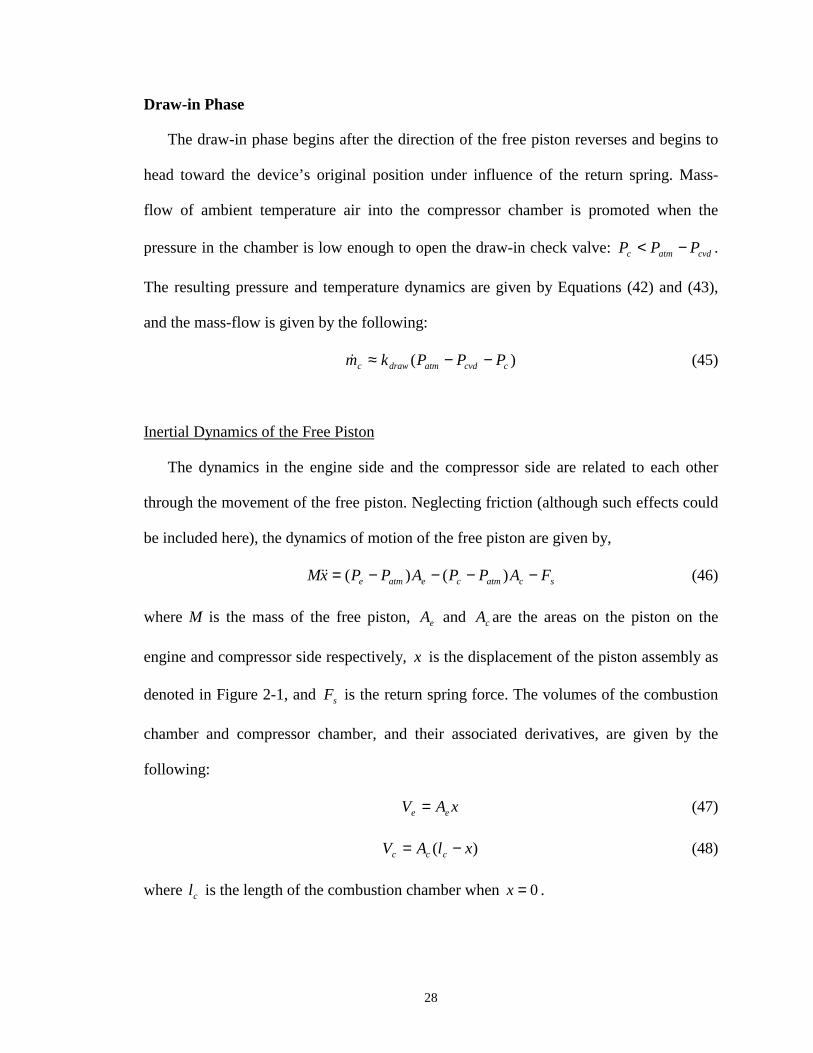
Draw-in Phase
The draw-in phase begins after the direction of the free piston reverses and begins to
head toward the device’s original position under influence of the return spring. Mass-
flow of ambient temperature air into the compressor chamber is promoted when the
pressure in the chamber is low enough to open the draw-in check valve: cvdatmc PPP −< .
The resulting pressure and temperature dynamics are given by Equations (42) and (43),
and the mass-flow is given by the following:
)( ccvdatmdrawc PPPkm −−≈D (45)
Inertial Dynamics of the Free Piston
The dynamics in the engine side and the compressor side are related to each other
through the movement of the free piston. Neglecting friction (although such effects could
be included here), the dynamics of motion of the free piston are given by,
scatmceatme FAPPAPPxM −−−−= )()(DD (46)
where M is the mass of the free piston, eA and cA are the areas on the piston on the
engine and compressor side respectively, x is the displacement of the piston assembly as
denoted in Figure 2-1, and sF is the return spring force. The volumes of the combustion
chamber and compressor chamber, and their associated derivatives, are given by the
following:
xAV ee = (47)
)( xlAV ccc −= (48)
where cl is the length of the combustion chamber when 0=x .
29
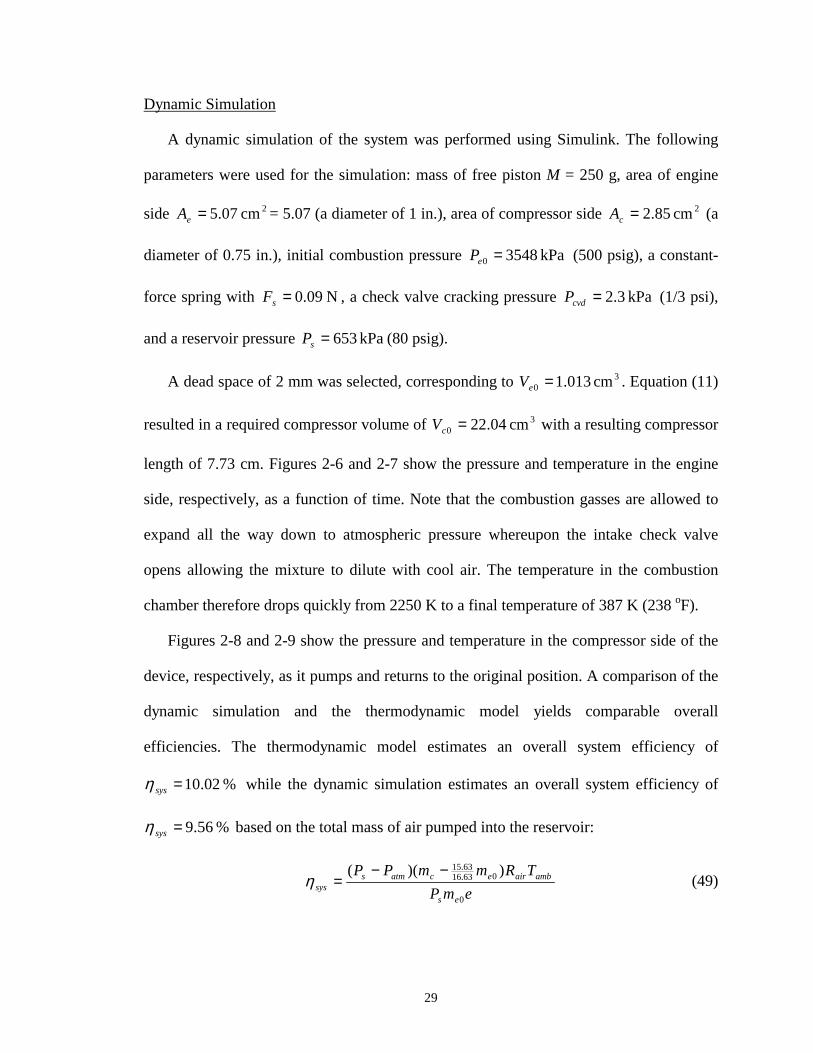
Dynamic Simulation
A dynamic simulation of the system was performed using Simulink. The following
parameters were used for the simulation: mass of free piston M = 250 g, area of engine
side 2cm 07.5=eA = 5.07 (a diameter of 1 in.), area of compressor side 2cm 85.2=cA (a
diameter of 0.75 in.), initial combustion pressure kPa 35480 =eP (500 psig), a constant-
force spring with N 09.0=sF , a check valve cracking pressure kPa 3.2=cvdP (1/3 psi),
and a reservoir pressure kPa 653=sP (80 psig).
A dead space of 2 mm was selected, corresponding to 30 cm 013.1=eV . Equation (11)
resulted in a required compressor volume of 30 cm 04.22=cV with a resulting compressor
length of 7.73 cm. Figures 2-6 and 2-7 show the pressure and temperature in the engine
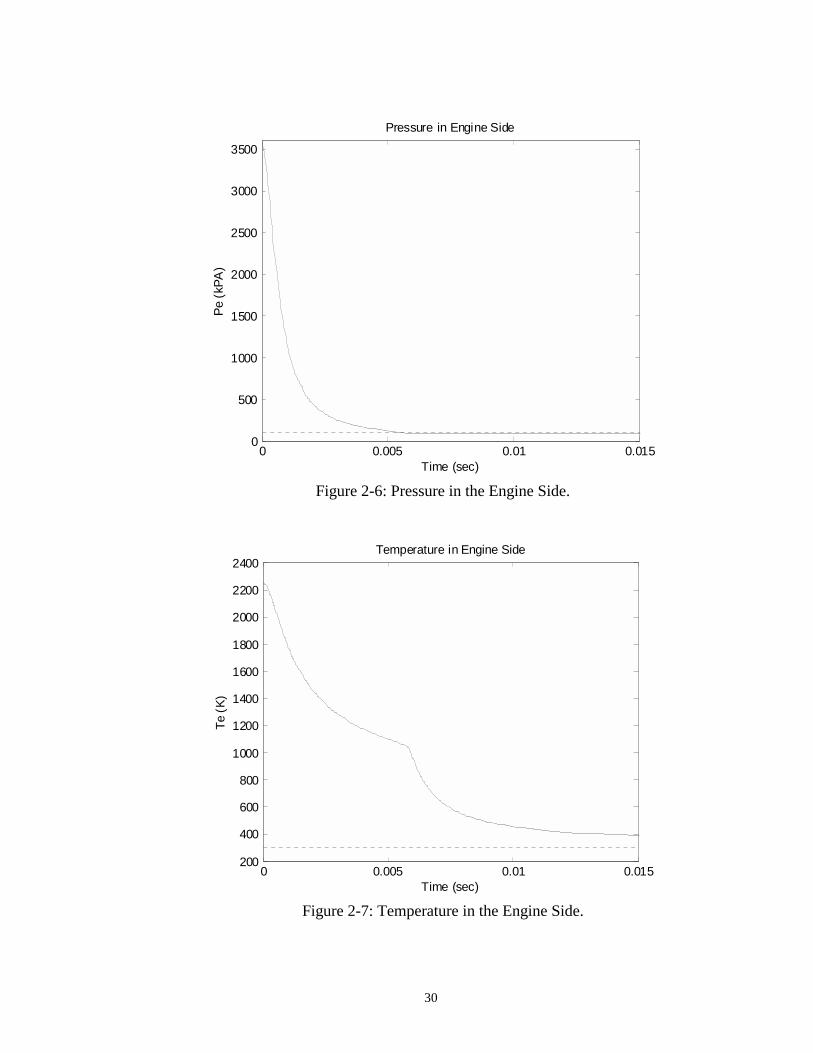
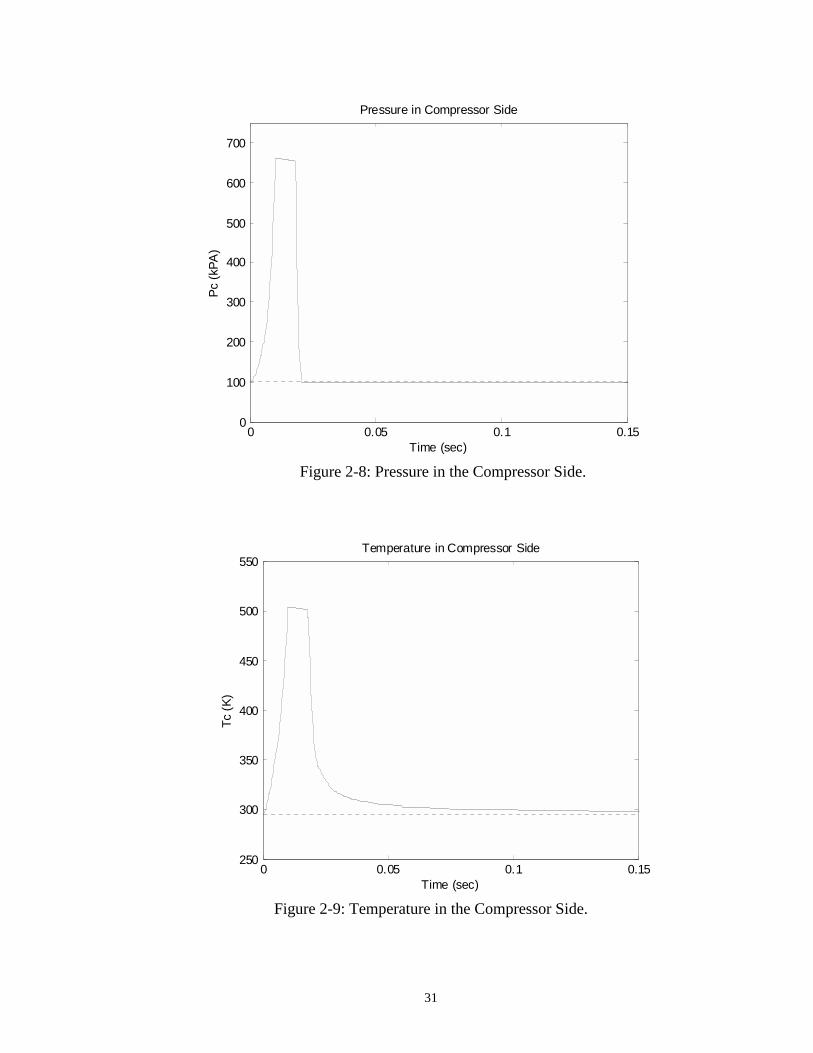
side, respectively, as a function of time. Note that the combustion gasses are allowed to
expand all the way down to atmospheric pressure whereupon the intake check valve
opens allowing the mixture to dilute with cool air. The temperature in the combustion
chamber therefore drops quickly from 2250 K to a final temperature of 387 K (238 oF).
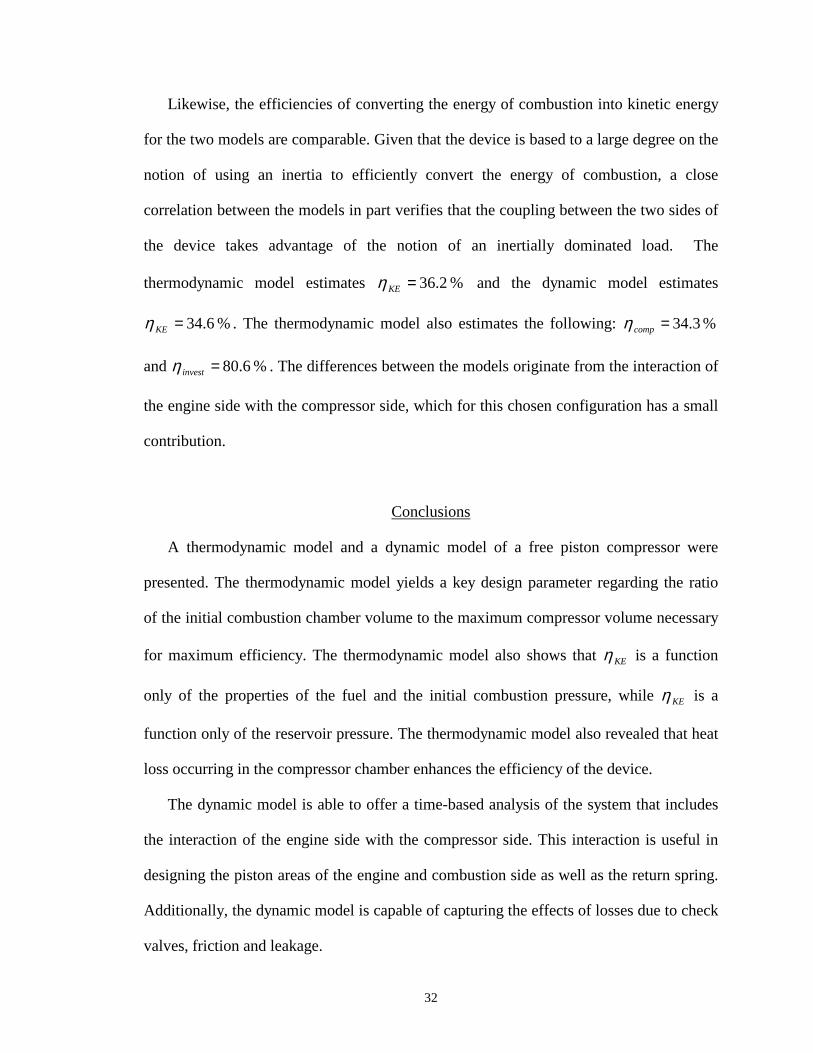
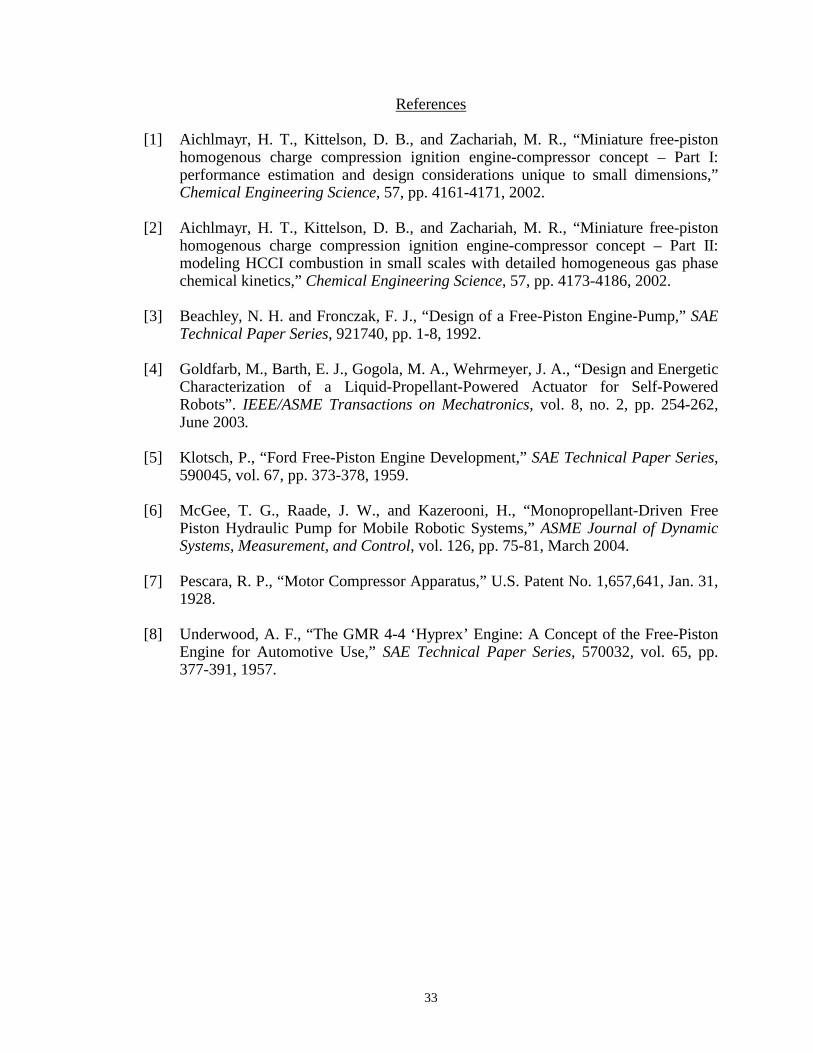
Figures 2-8 and 2-9 show the pressure and temperature in the compressor side of the
device, respectively, as it pumps and returns to the original position. A comparison of the
dynamic simulation and the thermodynamic model yields comparable overall
efficiencies. The thermodynamic model estimates an overall system efficiency of
% 02.10=sysη while the dynamic simulation estimates an overall system efficiency of
% 56.9=sysη based on the total mass of air pumped into the reservoir:
emP
TRmmPP
es
ambairecatmssys
0
063.1663.15 ))(( −−
=η (49)
30
0 0.005 0.01 0.0150
500
1000
1500
2000
2500
3000
3500
Time (sec)
Pe (
kPA
)
Pressure in Engine Side
Figure 2-6: Pressure in the Engine Side.
0 0.005 0.01 0.015200
400
600
800
1000
1200
1400
1600
1800
2000
2200
2400
Time (sec)
Te (
K)
Temperature in Engine Side
Figure 2-7: Temperature in the Engine Side.
31
0 0.05 0.1 0.150
100
200
300
400
500
600
700
Time (sec)
Pc (
kPA
)
Pressure in Compressor Side
Figure 2-8: Pressure in the Compressor Side.
0 0.05 0.1 0.15250
300
350
400
450
500
550
Time (sec)
Tc (
K)
Temperature in Compressor Side
Figure 2-9: Temperature in the Compressor Side.
32
Likewise, the efficiencies of converting the energy of combustion into kinetic energy
for the two models are comparable. Given that the device is based to a large degree on the
notion of using an inertia to efficiently convert the energy of combustion, a close
correlation between the models in part verifies that the coupling between the two sides of
the device takes advantage of the notion of an inertially dominated load. The
thermodynamic model estimates % 2.36=KEη and the dynamic model estimates
% 6.34=KEη . The thermodynamic model also estimates the following: % 3.34=compη
and % 6.80=investη . The differences between the models originate from the interaction of
the engine side with the compressor side, which for this chosen configuration has a small
contribution.
Conclusions
A thermodynamic model and a dynamic model of a free piston compressor were
presented. The thermodynamic model yields a key design parameter regarding the ratio
of the initial combustion chamber volume to the maximum compressor volume necessary
for maximum efficiency. The thermodynamic model also shows that KEη is a function
only of the properties of the fuel and the initial combustion pressure, while KEη is a
function only of the reservoir pressure. The thermodynamic model also revealed that heat
loss occurring in the compressor chamber enhances the efficiency of the device.
The dynamic model is able to offer a time-based analysis of the system that includes
the interaction of the engine side with the compressor side. This interaction is useful in
designing the piston areas of the engine and combustion side as well as the return spring.
Additionally, the dynamic model is capable of capturing the effects of losses due to check
valves, friction and leakage.
33
References
[1] Aichlmayr, H. T., Kittelson, D. B., and Zachariah, M. R., “Miniature free-piston homogenous charge compression ignition engine-compressor concept – Part I: performance estimation and design considerations unique to small dimensions,” Chemical Engineering Science, 57, pp. 4161-4171, 2002.
[2] Aichlmayr, H. T., Kittelson, D. B., and Zachariah, M. R., “Miniature free-piston
homogenous charge compression ignition engine-compressor concept – Part II: modeling HCCI combustion in small scales with detailed homogeneous gas phase chemical kinetics,” Chemical Engineering Science, 57, pp. 4173-4186, 2002.
[3] Beachley, N. H. and Fronczak, F. J., “Design of a Free-Piston Engine-Pump,” SAE
Technical Paper Series, 921740, pp. 1-8, 1992. [4] Goldfarb, M., Barth, E. J., Gogola, M. A., Wehrmeyer, J. A., “Design and Energetic
Characterization of a Liquid-Propellant-Powered Actuator for Self-Powered Robots”. IEEE/ASME Transactions on Mechatronics, vol. 8, no. 2, pp. 254-262, June 2003.
[5] Klotsch, P., “Ford Free-Piston Engine Development,” SAE Technical Paper Series,
590045, vol. 67, pp. 373-378, 1959. [6] McGee, T. G., Raade, J. W., and Kazerooni, H., “Monopropellant-Driven Free
Piston Hydraulic Pump for Mobile Robotic Systems,” ASME Journal of Dynamic Systems, Measurement, and Control, vol. 126, pp. 75-81, March 2004.
[7] Pescara, R. P., “Motor Compressor Apparatus,” U.S. Patent No. 1,657,641, Jan. 31,
1928. [8] Underwood, A. F., “The GMR 4-4 ‘Hyprex’ Engine: A Concept of the Free-Piston
Engine for Automotive Use,” SAE Technical Paper Series, 570032, vol. 65, pp. 377-391, 1957.

CHAPTER II
MANUSCRIPT 1
ADDENDUM
35
Thermodynamic Efficiency Upon revision of the thermodynamic efficiency presented in this manuscript, a more
adequate formulation was conceived. Particularly, the pneumatic potential energy of the
compressed air in the reservoir was originally taken as satms VPP )( − (page 17), which is
associated with the constant-pressure process of pumping the air into the reservoir
(Equation 9). This is incompatible with the requirement that the energy stored in the
reservoir must equal its capacity to perform adiabatic work in a pneumatic actuator
(adiabatic if considering worst case scenario, isothermal if considering best case
scenario). Hence, the stored energy in the air reservoir should be given by,
−
−=
−
11
1γγ
γ atm
sfsstored P
PVPE (50)
Since the mass of air is the same at 0cV , ciV and fV , and noting that the pressure and
temperature at 0cV are atmP and ambT , respectively, we can use ideal gas law expressions
to derive the following relationship:
cos
atmf V
PP
V
= (51)
The total efficiency of converting kinetic energy of the free piston into stored potential
energy of compressed air can be given by,
e
storedPE W
E=η (52)
Finally, the total thermodynamic efficiency of the system can be found by multiplying the
individual efficiencies regarding the conversion of energy released in combustion to
kinetic energy of the free piston, KEη , the conversion of kinetic energy to energy stored
36
in the reservoir at ambient temperature, PEη , and the efficiency related to the required
investment of reservoir air to the combustion event, investη . By multiplying Equations (4),
(51) and (19), and substituting Equations (50), (51) and (11), the overall thermodynamic
system efficiency is found in closed-form as follows:
( )
−
−
−
−+−
−
−
−
=−
−
−
ambair
s
atmatm
e
atme
e
atm
e
atm
ssys TR
PPP
PP
PP
PP
e
e
e
63.1663.15
11
111
1
11
111
0
1
01
γγ
γγ
γγ
γγ
γγ
γη (53)
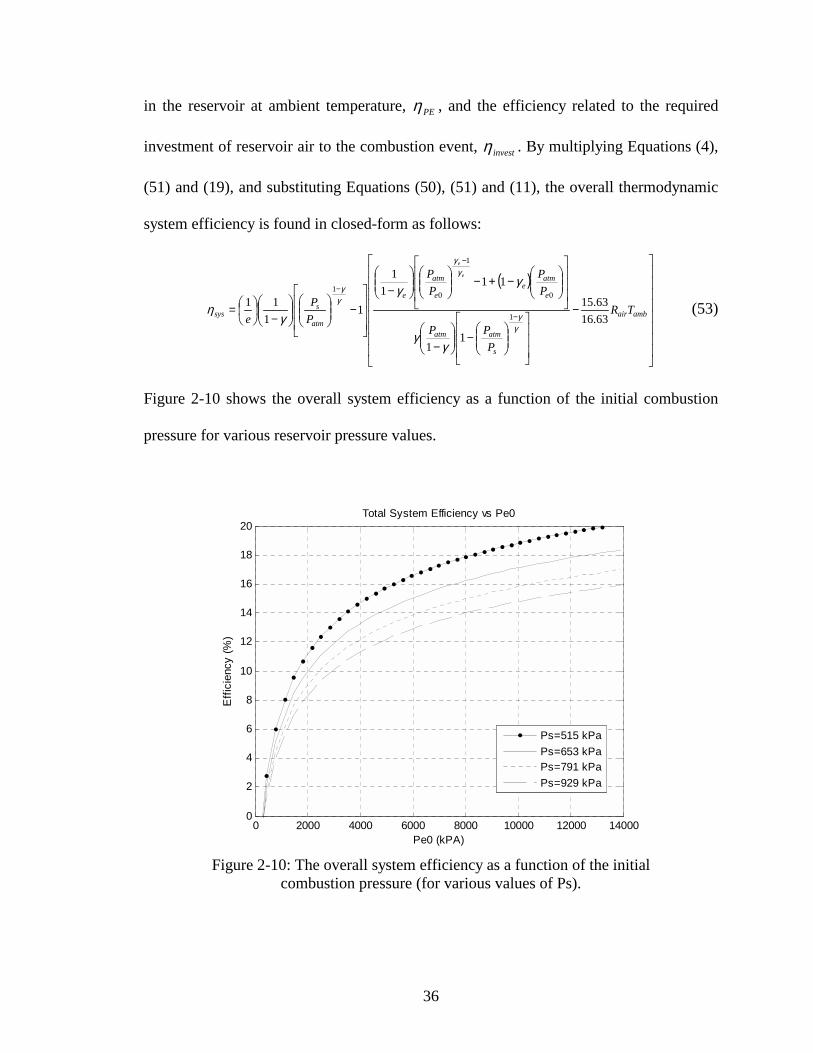
Figure 2-10 shows the overall system efficiency as a function of the initial combustion
pressure for various reservoir pressure values.
0 2000 4000 6000 8000 10000 12000 140000
2
4
6
8
10
12
14
16
18
20
Pe0 (kPA)
Effi
cien
cy (%
)
Total System Efficiency vs Pe0
Ps=515 kPaPs=653 kPaPs=791 kPaPs=929 kPa
Figure 2-10: The overall system efficiency as a function of the initial
combustion pressure (for various values of Ps).
CHAPTER III
MANUSCRIPT 2
DESIGN OF A FREE PISTON PNEUMATIC COMPRESSOR AS A
MOBILE ROBOT POWER SUPPLY
José A. Riofrio and Eric J. Barth
Department of Mechanical Engineering
Vanderbilt University
Nashville, TN 37235
(Accepted by IEEE International Conference on Robotics and Automation (ICRA), Barcelona, Spain, April 2005)
38
Abstract
The design of a free piston compressor (FPC) intended as a pneumatic power
supply for pneumatically actuated autonomous robots is presented in this paper. The
FPC is a proposed device that utilizes combustion to compress air into a high-pressure
supply tank by using the kinetic energy of a free piston. The device is configured such
that the transduction from thermal energy to stored energy, in the form of compressed
gas, is efficient relative to other small-scale portable power supply systems. This
efficiency is achieved by matching the dynamic load of the compressor to the ideal
adiabatic expansion of the hot gas combustion products. The device proposed
exploits this fact by first converting thermal energy into kinetic energy of the free
piston, and then compressing air during a separate compression phase. The proposed
technology is intended to provide a compact pneumatic power supply source
appropriate for human-scale robots. The design and implementation of the FPC is
shown, and preliminary experimental results are presented and discussed with regard
to efficiency and energetic characteristics of the device. Most significantly, the device
is shown to operate nearly adiabatically.
Introduction
The need for an effective portable power supply for human-scale robots has
increasingly become a matter of interest in robotics research. Current prototypes of
humanoid robots, such as the Honda P3, Honda ASIMO and the Sony QRIO, show
significant limitations in the duration of their power sources in between charges (the
operation time of the humanoid-size Honda P3, for instance, is only 25 minutes). This
limitation becomes a strong motivation for the development and implementation of a
more adequate source of power. Moreover, the power density of the actuators coupled
39
to the power source need to maximized such that, on a systems level evaluation, the
combined power supply and actuation system is both energy and power dense. Put
simply, state-of-the-art batteries are too heavy for the amount of energy they store, and
electric motors are too heavy for the mechanical power they can deliver, in order to
present a combined power supply and actuation system that can deliver human-scale
mechanical work in a human-scale self contained robot package. The motivation
details are discussed more thoroughly in [4].
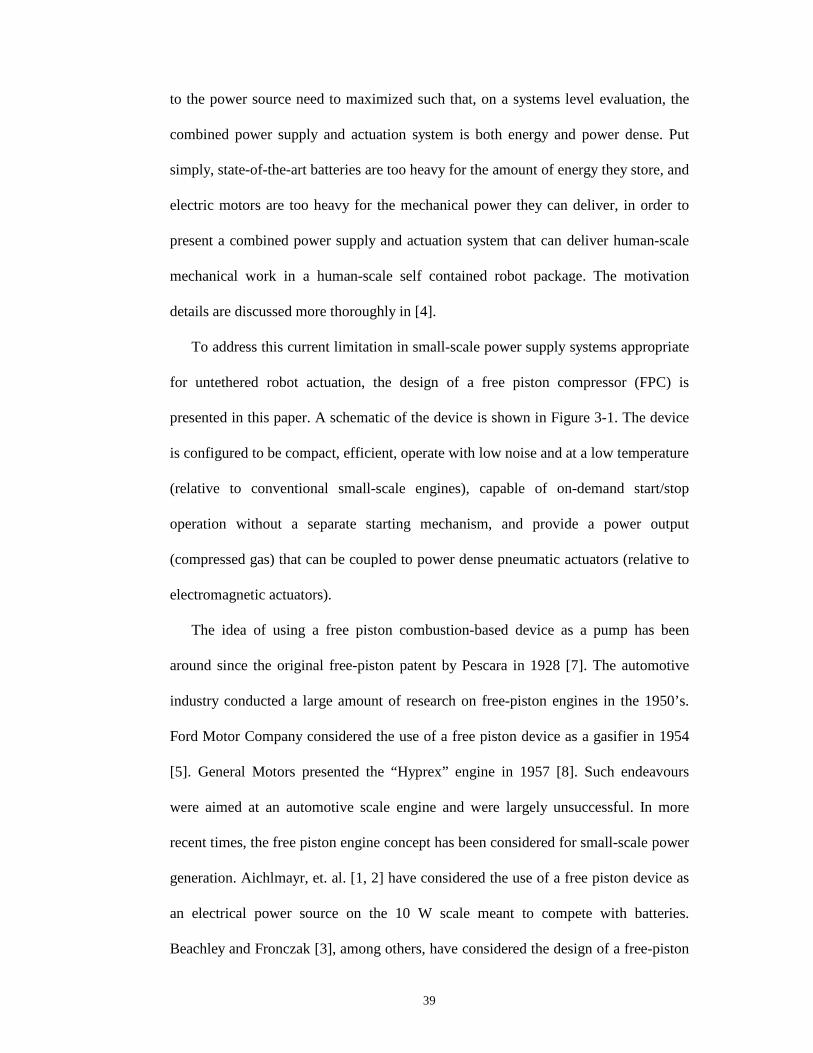
To address this current limitation in small-scale power supply systems appropriate
for untethered robot actuation, the design of a free piston compressor (FPC) is
presented in this paper. A schematic of the device is shown in Figure 3-1. The device
is configured to be compact, efficient, operate with low noise and at a low temperature
(relative to conventional small-scale engines), capable of on-demand start/stop
operation without a separate starting mechanism, and provide a power output
(compressed gas) that can be coupled to power dense pneumatic actuators (relative to
electromagnetic actuators).
The idea of using a free piston combustion-based device as a pump has been
around since the original free-piston patent by Pescara in 1928 [7]. The automotive
industry conducted a large amount of research on free-piston engines in the 1950’s.
Ford Motor Company considered the use of a free piston device as a gasifier in 1954
[5]. General Motors presented the “Hyprex” engine in 1957 [8]. Such endeavours
were aimed at an automotive scale engine and were largely unsuccessful. In more
recent times, the free piston engine concept has been considered for small-scale power
generation. Aichlmayr, et. al. [1, 2] have considered the use of a free piston device as
an electrical power source on the 10 W scale meant to compete with batteries.
Beachley and Fronczak [3], among others, have considered the design of a free-piston
40
hydraulic pump. McGee, et. al. have considered the use of a monopropellant-based
catalytic reaction as an alternative to combustion, as applied to a free piston hydraulic
pump [6].
Propane or otherself pumping fuel
Fuel Valve
Spark
Exhaustvalve
Air valve
High pressureair reservoir
pneumaticpowerports
Engine
Compressor 1 Inlet and outletcheck valves
Compressor 2
ReturnSprings
Magnet
Magnet
ConnectingPlate
Inlet and outletcheck valves
(to air reservoir)
Breathe-incheck valve
Figure 3-1: Schematic of the Free Piston Compressor.
The FPC presented here is intended as a power supply for a mobile pneumatic
robotic system of human comparable power, mass and size. It is shown analytically in
[9] that the use of a free piston engine as a direct air compressor offers nearly ideal
loading characteristics necessary for high efficiency, in a simple and small package.
The Free Piston Compressor
The FPC is an internal combustion engine that uses its mechanical power output to
pump air into a pressurized reservoir. The main idea is that the pressurized air
reservoir will serve as a power supply for pneumatic systems, by using its high
41
pressure for pneumatic actuation. The FPC will automatically turn on and off as
needed, maintaining the reservoir at the desired actuation supply pressure.
A typical 4-stroke engine cycle has a power stroke, exhaust stroke, intake stroke
and compression stroke. A typical 2-stroke engine combines the power and intake
stroke and combines the exhaust and compression stroke. The FPC shares some
aspects of both a 4-stroke engine as well as a 2-stroke engine, but also has aspects
unlike either conventional engine design.
Referring to Figure 3-1, the FPC operates by first opening the air and fuel valves
for the proper durations to allow the proper mixture and amount of air and fuel into
the combustion chamber of the engine cylinder. Using a self-pumping gaseous fuel
such as propane, methane, or butane, and utilizing the high- pressure air in the
reservoir, the injection of air and fuel effectively replaces the functions of the intake
and compression strokes in a 4-cycle engine. Once the proper air/fuel mixture is
inside, the valves close and a spark initiates the combustion. Upon combustion, the
free piston moves to the left as the combustion gases expand, converting the energy of
combustion into kinetic energy of the free piston. The travel of the free piston is
configured such that the combustion products are able to fully expand down to
atmospheric pressure. Once this full expansion has occurred, the kinetic energy stored
in the free piston allows it to continue its motion to the left such that the pressure in
the engine cylinder drops below atmospheric pressure. Given this pressure gradient, a
breathe-in check valve opens and cool air from the outside environment enters the
combustion cylinder to dilute and cool the combustion gasses. Continuing its motion
to the left, the free piston subsequently hits and compresses the return springs, which
will invert its direction of motion without absorbing energy. Upon return, the kinetic
energy of the free piston is then transformed into the work required to compress and
42
then pump the gasses in the compressor chambers into the high-pressure reservoir.
Also upon return, an electrically actuated exhaust valve opens to allow the diluted
combustion gasses to be pushed out of the engine cylinder.
Features
The design and operation of the FPC addresses significant features of critical
importance in IC engine design:
Efficiency
The efficiency of converting thermal energy into mechanical work through the
expansion of a gas in a heat engine is related to the initial pressure of the gas as well
as the amount of PV work that is delivered outside the cycle. The central feature of the
FPC is that it presents an inertial load, due to the fact that the free piston is absent of
any connecting rod, during the expansion of the combustion gasses. An inertial load is
ideal for completely extracting work done by a pressurized gas since the pressure of
the gas can decrease to atmospheric pressure while still still storing the work done as
kinetic energy of the inertia. In the FPC as designed, the energy released at
combustion is converted into kinetic energy of the free piston before the end of its
stroke, leading to no high-pressure exhaust gasses. This avoids the wasteful exhaust of
high pressure gasses typical found in an Otto cycle running at high load and thus
increases the total efficiency of the system (Figure 3-2). The kinetic energy stored by
the free piston will then subsequently provide the total work required to compress and
pump air into a high-pressure reservoir. As configured, the FPC does not immediately
reinvest mechanical work to promote the next cycle as does a conventional engine.
Although a compression “stroke” is not explicitly present, it should be pointed out
that the FPC does reinvest a portion of the work used to pump gas into the reservoir
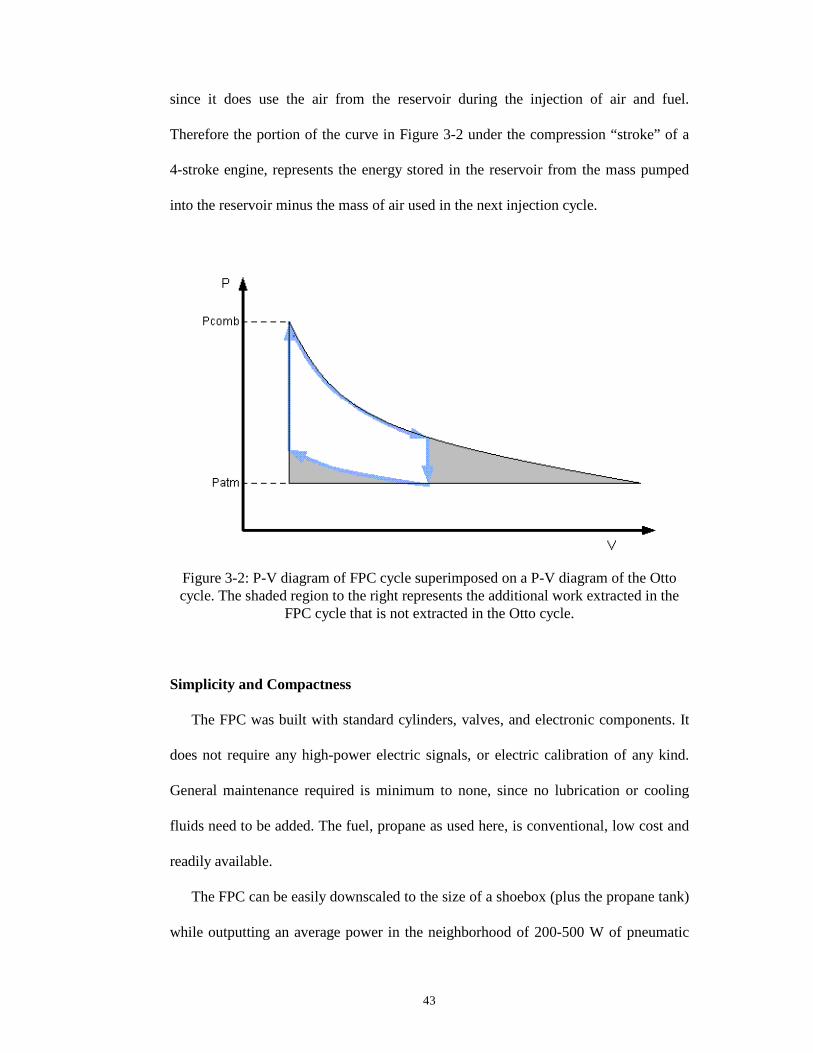
43
since it does use the air from the reservoir during the injection of air and fuel.
Therefore the portion of the curve in Figure 3-2 under the compression “stroke” of a
4-stroke engine, represents the energy stored in the reservoir from the mass pumped
into the reservoir minus the mass of air used in the next injection cycle.
Figure 3-2: P-V diagram of FPC cycle superimposed on a P-V diagram of the Otto cycle. The shaded region to the right represents the additional work extracted in the
FPC cycle that is not extracted in the Otto cycle.
Simplicity and Compactness
The FPC was built with standard cylinders, valves, and electronic components. It
does not require any high-power electric signals, or electric calibration of any kind.
General maintenance required is minimum to none, since no lubrication or cooling
fluids need to be added. The fuel, propane as used here, is conventional, low cost and
readily available.
The FPC can be easily downscaled to the size of a shoebox (plus the propane tank)
while outputting an average power in the neighborhood of 200-500 W of pneumatic

44
power, which would be very appropriate as a portable power supply for human-scale
mobile robots.
Cooling Mechanism
Overheating is a general concern in the design of any internal combustion device.
By exploiting the inertial loading concept, the FPC allows for cool air to be drawn
into the combustion chamber, via a check valve, before the end of the combustion
stroke. This will rapidly cool the inside of the chamber, thus avoiding both the exhaust
of hot gasses to the atmosphere and any significant transfer of heat to other hardware
components through convection.
Start on Demand
Since the intake valves and spark plug are electrically actuated, and the free piston
rods are not rigidly attached to any sort of crankshaft, the FPC does not require the
implementation of a starter. This allows the engine to start on demand, without the
need for a separate starting cycle. The start-on-demand feature highlights the
compatibility between the FPC and a pneumatic robotic system, since they can be tied
together by implementing a simple on/off control loop to regulate the pressure in the
high-pressure pneumatic supply reservoir. The FPC would receive a signal and start
operating as soon as the actuation pressure drops, and likewise turn off once reaching
the desired pressure.
Low Noise
Due to the fact that the combustion pressure drops to atmospheric before the
exhaust cycle, there are no high-pressure exhaust gasses, and therefore no exhaust
noise. Other mechanical noises will be minimal, especially since the FPC will be
enclosed in its respective device. Noises related to asymmetric loads and vibrations
are addressed ahead.
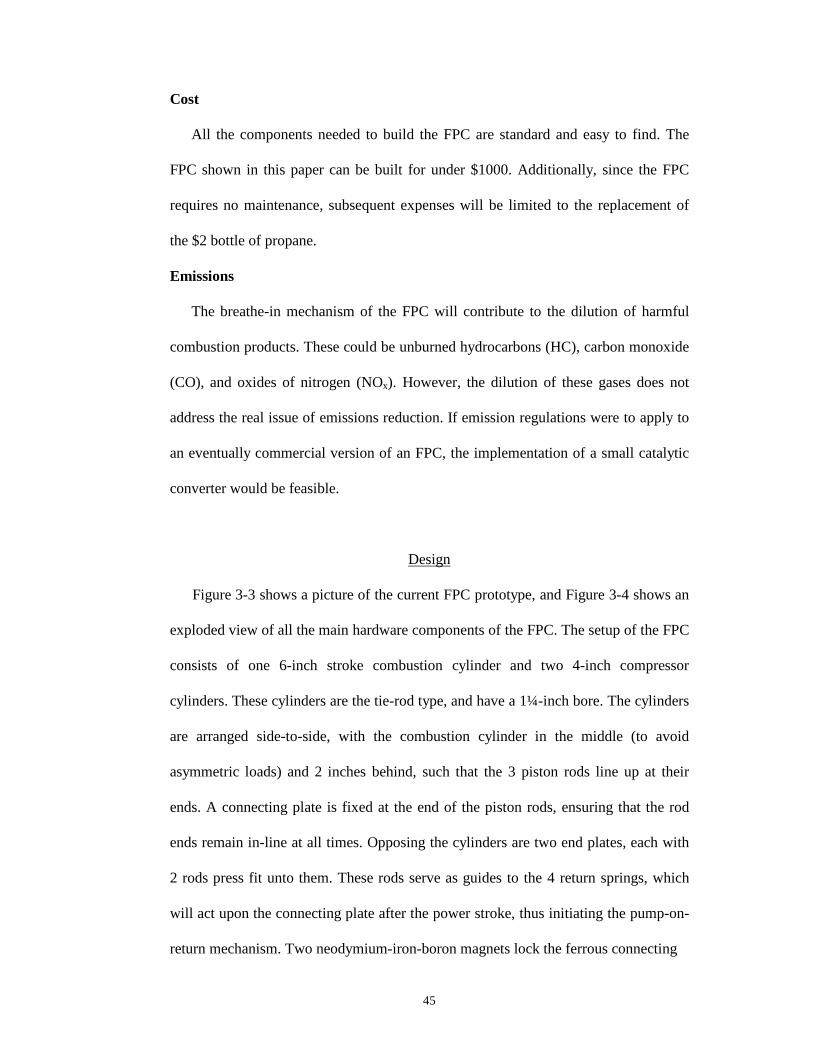
45
Cost
All the components needed to build the FPC are standard and easy to find. The
FPC shown in this paper can be built for under $1000. Additionally, since the FPC
requires no maintenance, subsequent expenses will be limited to the replacement of
the $2 bottle of propane.
Emissions
The breathe-in mechanism of the FPC will contribute to the dilution of harmful
combustion products. These could be unburned hydrocarbons (HC), carbon monoxide
(CO), and oxides of nitrogen (NOx). However, the dilution of these gases does not
address the real issue of emissions reduction. If emission regulations were to apply to
an eventually commercial version of an FPC, the implementation of a small catalytic
converter would be feasible.
Design
Figure 3-3 shows a picture of the current FPC prototype, and Figure 3-4 shows an
exploded view of all the main hardware components of the FPC. The setup of the FPC
consists of one 6-inch stroke combustion cylinder and two 4-inch compressor
cylinders. These cylinders are the tie-rod type, and have a 1¼-inch bore. The cylinders
are arranged side-to-side, with the combustion cylinder in the middle (to avoid
asymmetric loads) and 2 inches behind, such that the 3 piston rods line up at their
ends. A connecting plate is fixed at the end of the piston rods, ensuring that the rod
ends remain in-line at all times. Opposing the cylinders are two end plates, each with
2 rods press fit unto them. These rods serve as guides to the 4 return springs, which
will act upon the connecting plate after the power stroke, thus initiating the pump-on-
return mechanism. Two neodymium-iron-boron magnets lock the ferrous connecting
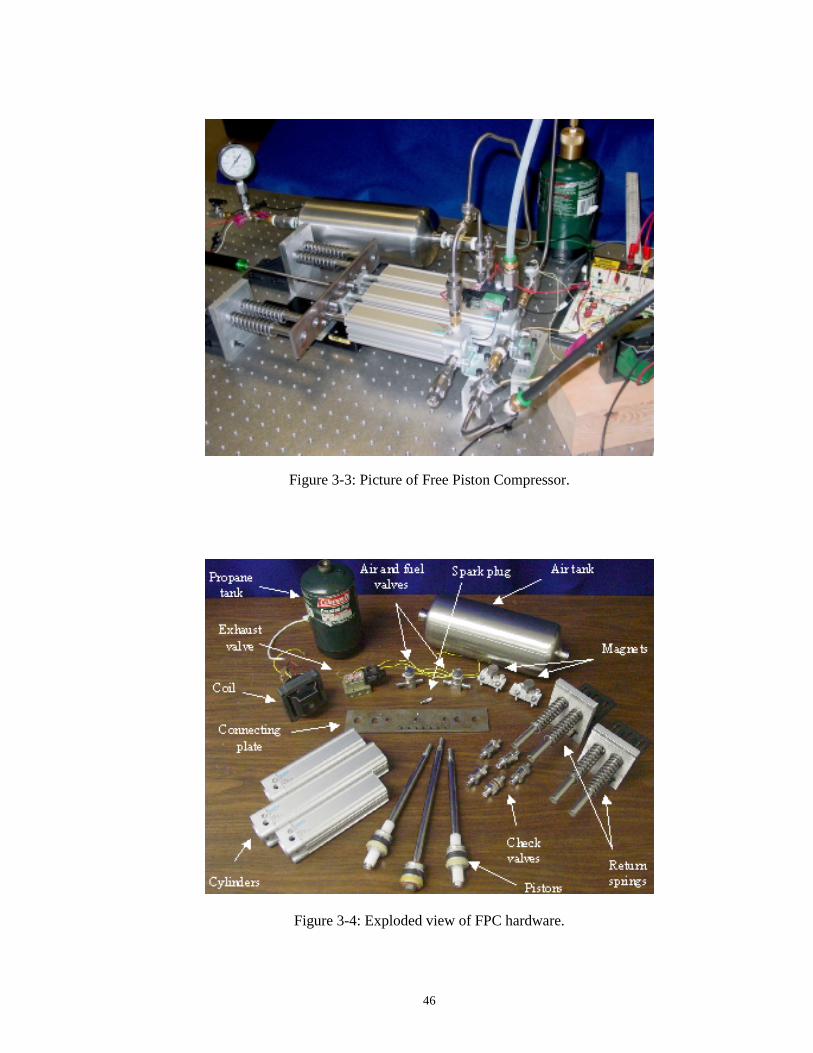
46
Figure 3-3: Picture of Free Piston Compressor.
Figure 3-4: Exploded view of FPC hardware.
47
plate in place while the combustion cylinder is injected with a high-pressure air-fuel
mixture, before combustion. The end caps of the tie-rod cylinders were ported
appropriately to implement all necessary hardware. The combustor end cap needed
ports for air/fuel mixture, exhaust, air breathe-in, pressure sensor, and spark plug;
while the compressor end caps needed ports for breathing in and pumping out. The
fuel in use is a bottle of COLEMAN propane, available at most convenience stores
for very low price. Finally, the spark plug is an NGK ME-8, normally used for model
aircraft.
Several problems had to be overcome through different stages of the design
process. It is mentioned in [9] that the injection pressure of the air/fuel mixture needs
to be adequate enough to achieve the target initial combustion pressure. This
minimum injection pressure requirement is given by,
0eAFTe
ambreacinj P
TRTR
P
= (1)
where reacR and eR are the average gas constants of the reactants and combustion
products, respectively; ambT and AFTT are the ambient temperature and adiabatic flame
temperature, respectively; and 0eP is the initial combustion pressure needed such that
the FPC extracts enough work to pump all the air drawn into the compressor cylinders
into the high-pressure reservoir. In order to obtain the appropriate injection pressure
that corresponds to such an initial combustion pressure, the free piston needs to be
locked in its initial position during injection. A sufficiently stiff spring could serve
this purpose, but would offer so much resistance upon the combustion stroke that the
desired inertial loading would not be easily obtained. To overcome this, two
neodymium-iron-boron magnets were installed to hold the connecting plate at its
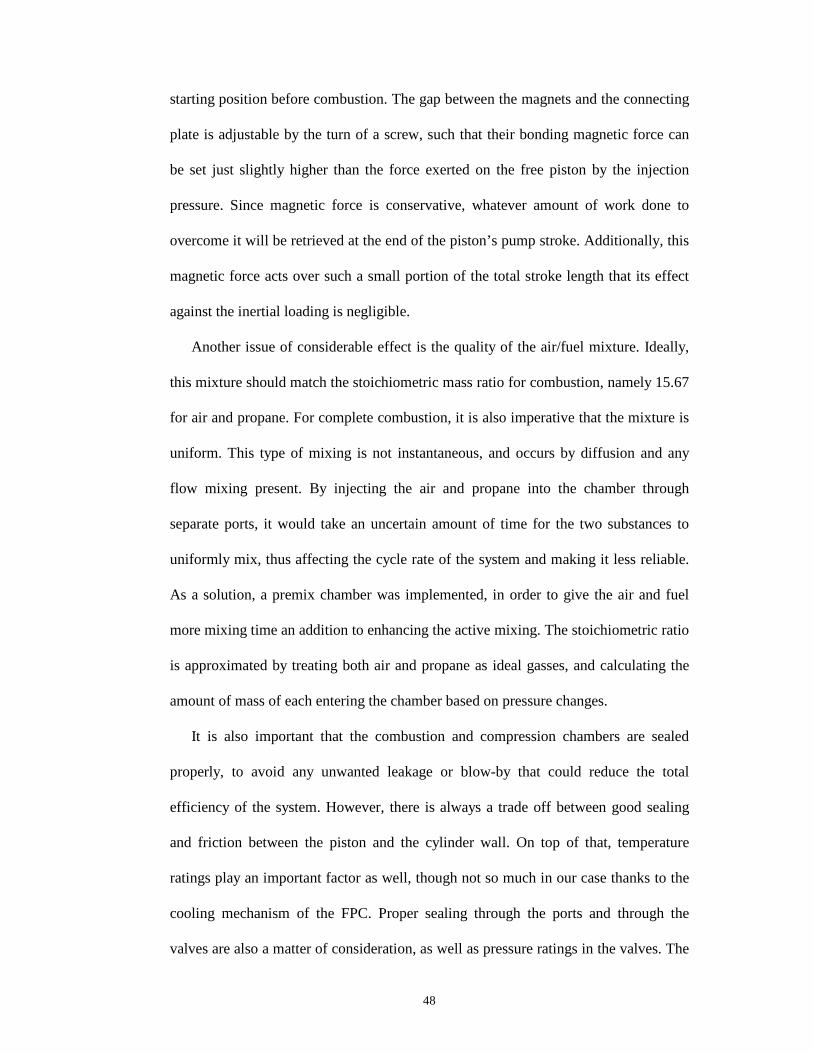
48
starting position before combustion. The gap between the magnets and the connecting
plate is adjustable by the turn of a screw, such that their bonding magnetic force can
be set just slightly higher than the force exerted on the free piston by the injection
pressure. Since magnetic force is conservative, whatever amount of work done to
overcome it will be retrieved at the end of the piston’s pump stroke. Additionally, this
magnetic force acts over such a small portion of the total stroke length that its effect
against the inertial loading is negligible.
Another issue of considerable effect is the quality of the air/fuel mixture. Ideally,
this mixture should match the stoichiometric mass ratio for combustion, namely 15.67
for air and propane. For complete combustion, it is also imperative that the mixture is
uniform. This type of mixing is not instantaneous, and occurs by diffusion and any
flow mixing present. By injecting the air and propane into the chamber through
separate ports, it would take an uncertain amount of time for the two substances to
uniformly mix, thus affecting the cycle rate of the system and making it less reliable.
As a solution, a premix chamber was implemented, in order to give the air and fuel
more mixing time an addition to enhancing the active mixing. The stoichiometric ratio
is approximated by treating both air and propane as ideal gasses, and calculating the
amount of mass of each entering the chamber based on pressure changes.
It is also important that the combustion and compression chambers are sealed
properly, to avoid any unwanted leakage or blow-by that could reduce the total
efficiency of the system. However, there is always a trade off between good sealing
and friction between the piston and the cylinder wall. On top of that, temperature
ratings play an important factor as well, though not so much in our case thanks to the
cooling mechanism of the FPC. Proper sealing through the ports and through the
valves are also a matter of consideration, as well as pressure ratings in the valves. The
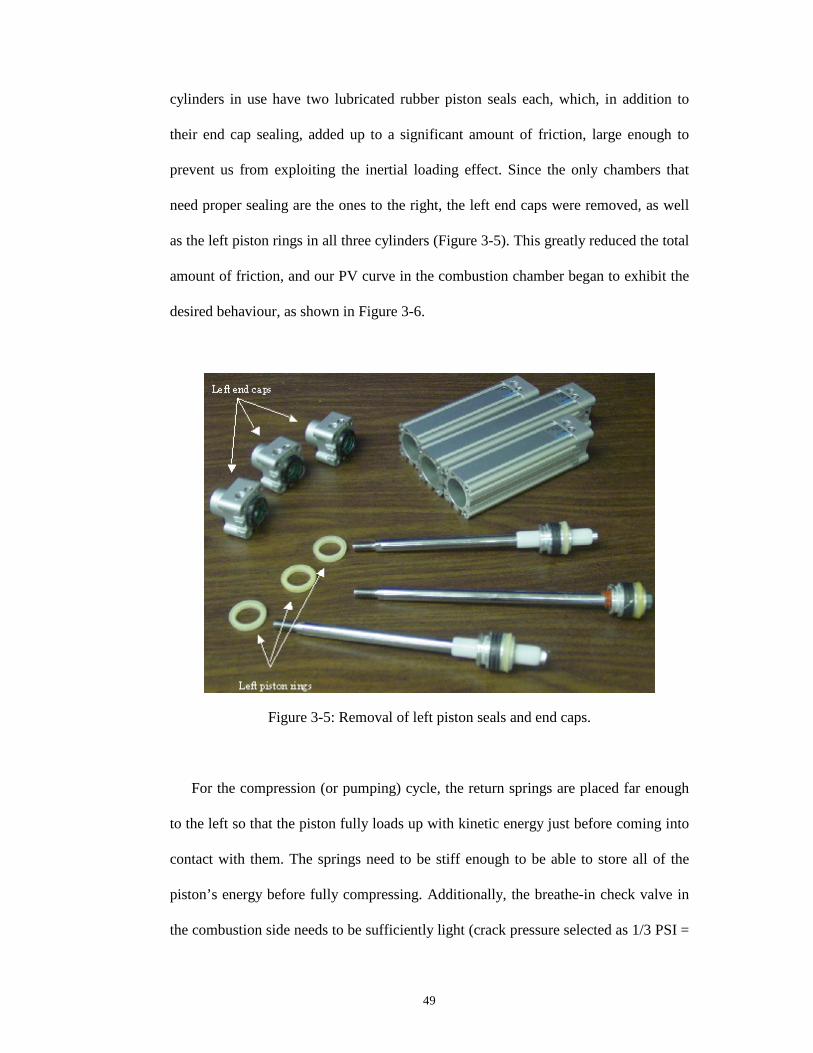
49
cylinders in use have two lubricated rubber piston seals each, which, in addition to
their end cap sealing, added up to a significant amount of friction, large enough to
prevent us from exploiting the inertial loading effect. Since the only chambers that
need proper sealing are the ones to the right, the left end caps were removed, as well
as the left piston rings in all three cylinders (Figure 3-5). This greatly reduced the total
amount of friction, and our PV curve in the combustion chamber began to exhibit the
desired behaviour, as shown in Figure 3-6.
Figure 3-5: Removal of left piston seals and end caps.
For the compression (or pumping) cycle, the return springs are placed far enough
to the left so that the piston fully loads up with kinetic energy just before coming into
contact with them. The springs need to be stiff enough to be able to store all of the
piston’s energy before fully compressing. Additionally, the breathe-in check valve in
the combustion side needs to be sufficiently light (crack pressure selected as 1/3 PSI =
50
2.3 kPa) and large enough to allow for the appropriate breathe-in air flow without
presenting any significant restriction. Due the springs’ efficient energy storage
capacity, the piston will effectively fully regain its kinetic energy, which will become
the work needed for the compression stroke. As the compression stroke reaches
completion, the magnets will return the work done against them (back in the
combustion stroke), and snap the plate back to its initial position while contributing
work to the highest-pressure portion of pumping.
Figure 3-6: P-V curve in the combustion chamber. The solid line shows the
experimentally measured P-V curve, and the dashed line shows the ideal adiabatic P-V curve.
As far as thermal management goes, it is desired to minimize energy losses
through heat in the combustion chamber, and approach an adiabatic expansion of the
hot gasses. Conversely, as shown in [9], heat losses are desired in the compression
chambers to maximize the overall compressor efficiency. This should be intuitive
51
considering the compressors must fight against the heat during the compression phase.
On a design level, this suggests that the walls of the compressor chambers should be
of a high index of heat transfer (such as aluminum), and that cooling fins should be
added to promote as much heat loss as possible.
The current FPC prototype is capable of operating at 2 Hz. Its cycle-rate is limited
by the rate of flow through the valves and by the valves’ opening times. Standard
available valves offer a trade off between precision and flow capacity. Also, higher
flow valves take longer times to open and close. The cycle rate of the FPC could be
increased by implementing higher flow valves, but at the risk of losing air/fuel
mixture consistency, and thus total efficiency.
Additional Design Considerations
The possibility of making the combustion chamber out of glass is currently being
considered. Borosilicate glass has a very low coefficient of heat transfer, which would
be ideal for a close match to an adiabatic expansion of the hot gasses in the
combustion chamber. A thick enough piece of borosilicate glass tubing is capable of
withstanding the peak pressures of the FPC, and can be obtained at low cost.
Additionally, a glass combustion chamber would allow for the spark to be seen, which
would make it very easy to achieve the stoichiometric air/fuel ratio by adjusting the
mixture based on the color of the flame. Finally, with a piston made out of graphite or
ground glass, the energy losses through friction would be greatly reduced, without
sacrificing any significant sealing properties.
Another design consideration suitable for a commercial version of an FPC is to
make it symmetrically dual sided (i.e. two ‘back-to-back’ FPCs). By doing so, the
power-to-mass ratio would increase, since both FPCs would share combustion and
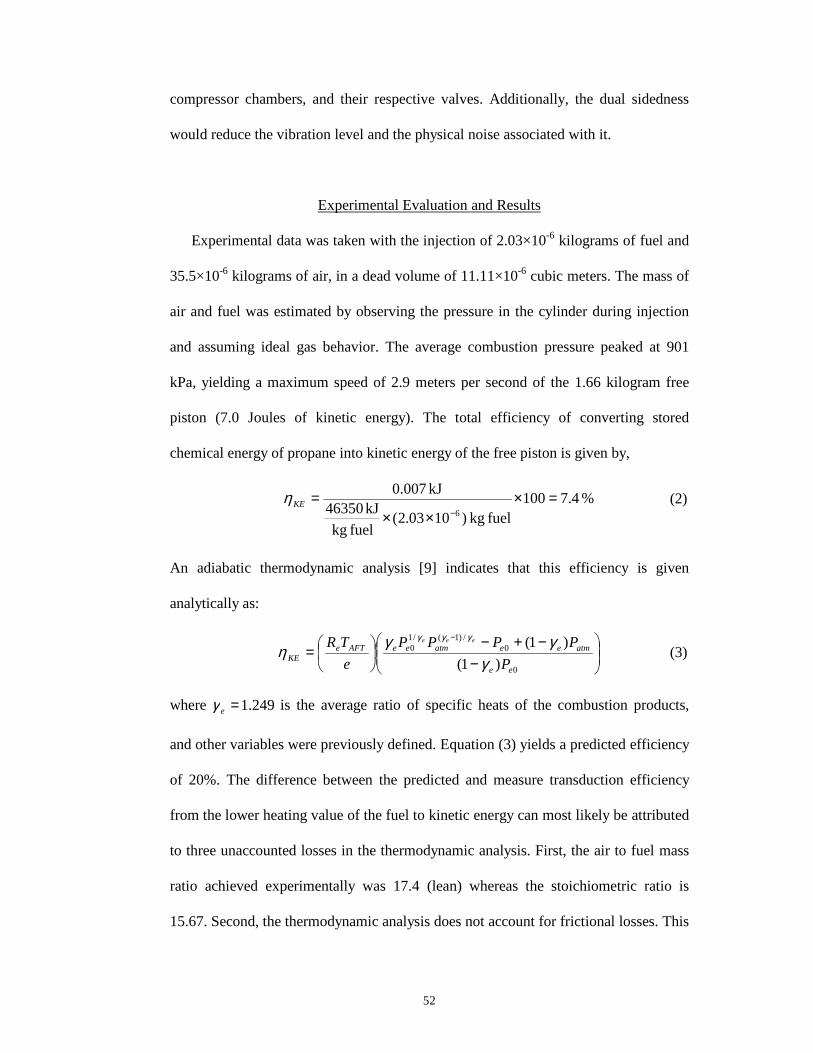
52
compressor chambers, and their respective valves. Additionally, the dual sidedness
would reduce the vibration level and the physical noise associated with it.
Experimental Evaluation and Results
Experimental data was taken with the injection of 2.03×10⁻⁶ kilograms of fuel and
35.5×10⁻⁶ kilograms of air, in a dead volume of 11.11×10⁻⁶ cubic meters. The mass of
air and fuel was estimated by observing the pressure in the cylinder during injection
and assuming ideal gas behavior. The average combustion pressure peaked at 901
kPa, yielding a maximum speed of 2.9 meters per second of the 1.66 kilogram free
piston (7.0 Joules of kinetic energy). The total efficiency of converting stored
chemical energy of propane into kinetic energy of the free piston is given by,
% 4.7100fuel kg )1003.2(
fuel kgkJ 46350
kJ 0.0076
=×××
=−
KEη (2)
An adiabatic thermodynamic analysis [9] indicates that this efficiency is given
analytically as:
−−+−
=−
0
0/)1(/1
0
)1()1(
ee
atmeeatmeeAFTeKE P
PPPPeTR eee
γγγη
γγγ
(3)
where 249.1=eγ is the average ratio of specific heats of the combustion products,
and other variables were previously defined. Equation (3) yields a predicted efficiency
of 20%. The difference between the predicted and measure transduction efficiency
from the lower heating value of the fuel to kinetic energy can most likely be attributed
to three unaccounted losses in the thermodynamic analysis. First, the air to fuel mass
ratio achieved experimentally was 17.4 (lean) whereas the stoichiometric ratio is
15.67. Second, the thermodynamic analysis does not account for frictional losses. This

53
friction was measured to be about 13 N. This loss, if found to be significant, would
serve to further motivate a design change of the cylinder walls to precision glass and
the piston to either graphite or precision ground glass to reduce friction. Third, the
thermodynamic analysis assumed adiabatic conditions. However, an evaluation of the
experimentally obtained P-V curve, shown in Figure 3-6, indicates that the
experimental prototype device exhibits nearly adiabatic behavior of constant=ePV γ .
In fact, the experimentally obtained curve becomes flat at atmospheric pressure as
hoped and indicates that the device is capable of both fully expanding the combustion
products as well as being able to intake cool air from the environment to dilute the
exhaust products. In light of the comparison of the experimentally obtained P-V curve
as compared with the adiabatic P-V curve, heat loss appears to be minimal. It should
be noted that the curve shown is from the device firing the first time when the device
is cold and when heat losses would be at a maximum.
Figures 3-7, 3-8 and 3-9 show the pressure in the combustion chamber, the
position of the free piston, and its velocity as a function of time. Notice in Figure 3-7
that the injection pressure right before ignition is about 267 kPa and requires that the
magnetic holding force is sufficient to prevent motion of the free piston. Figure 3-7
also shows that the combustion pressure quickly rises to about 900 kPa after the spark
occurs at 0 msec (spark not shown in Figure). The shape of the pressure profile after
the peak pressure indicates that the combustion gasses were able to fully expand down
to atmospheric pressure (101 kPa).
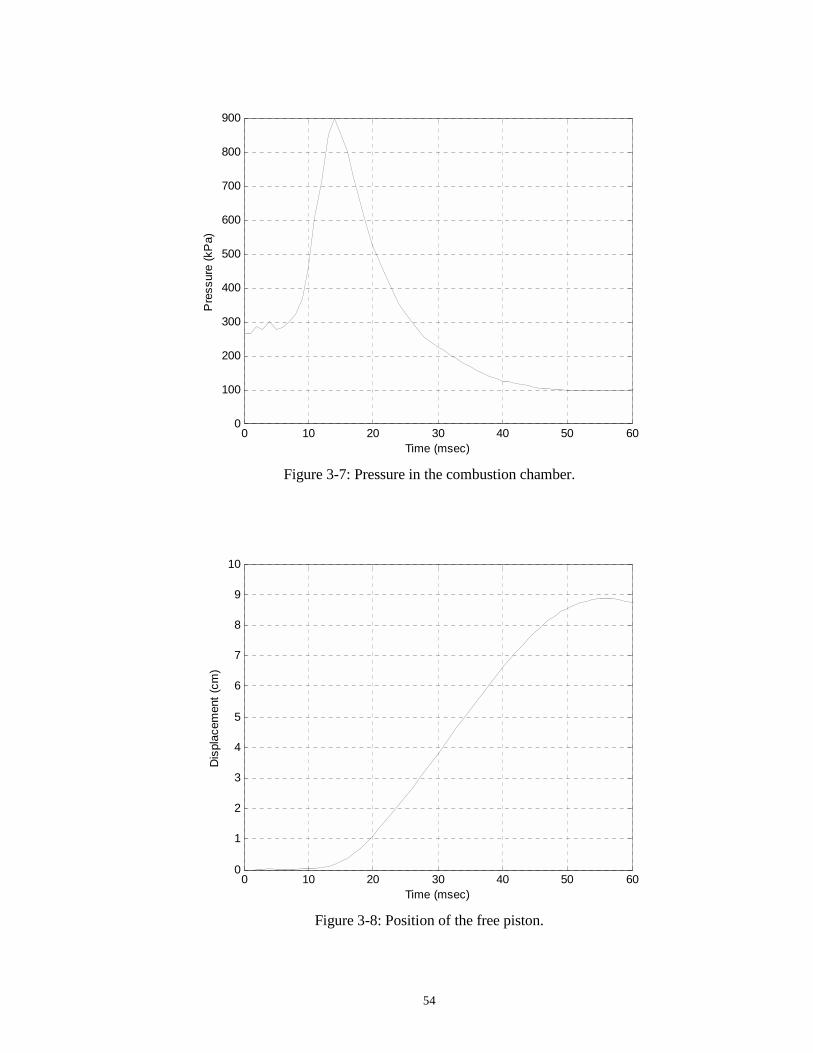
54
0 10 20 30 40 50 600
100
200
300
400
500
600
700
800
900
Time (msec)
Pre
ssur
e (k
Pa)
Figure 3-7: Pressure in the combustion chamber.
0 10 20 30 40 50 600
1
2
3
4
5
6
7
8
9
10
Time (msec)
Dis
plac
emen
t (cm
)
Figure 3-8: Position of the free piston.
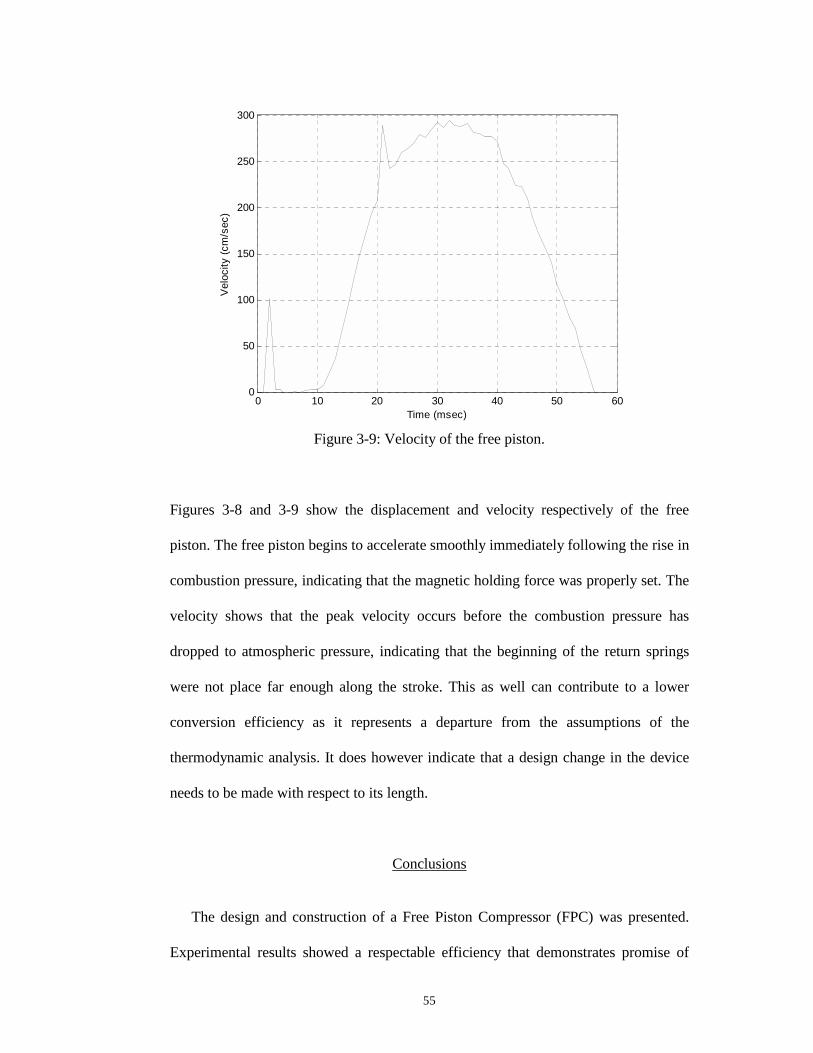
55
0 10 20 30 40 50 600
50
100
150
200
250
300
Time (msec)
Vel
ocity
(cm
/sec
)
Figure 3-9: Velocity of the free piston.
Figures 3-8 and 3-9 show the displacement and velocity respectively of the free
piston. The free piston begins to accelerate smoothly immediately following the rise in
combustion pressure, indicating that the magnetic holding force was properly set. The
velocity shows that the peak velocity occurs before the combustion pressure has
dropped to atmospheric pressure, indicating that the beginning of the return springs
were not place far enough along the stroke. This as well can contribute to a lower
conversion efficiency as it represents a departure from the assumptions of the
thermodynamic analysis. It does however indicate that a design change in the device
needs to be made with respect to its length.
Conclusions
The design and construction of a Free Piston Compressor (FPC) was presented.
Experimental results showed a respectable efficiency that demonstrates promise of
56
such a device as a small scale power supply for untethered pneumatically actuated
robots. The combined factors of a high-energy density fuel, the efficiency of the
device, the compactness and low weight of the device, and the use of the device to
drive lightweight linear pneumatic actuators (lightweight as compared with power
comparable electric motors) is projected to provide at least an order of magnitude
greater total system energy density (power supply and actuation) than state of the art
power supply (batteries) and actuators (electric motors) appropriate for human-scale
power output.
Preliminary experimental results regarding the transduction of thermal energy into
kinetic energy of the free piston demonstrate that the device is capable of fully
expanding the combustion products down to atmospheric pressure as designed and
demonstrates the merits of presenting a purely inertial load in a combustion process.
Such dynamic loading serves to increase efficiency, allows the device to operate with
low noise due to not having a high pressure exhaust “pop”, and allows the combustion
products to be diluted with cool external air to contribute toward a low operating
temperature compared to more conventional internal combustion engines. Most
significantly, the device is shown to operate nearly adiabatically. Experimental results
also demonstrated that the device is capable of start on demand, making it well suited
to a pressure regulation control loop in a portable pneumatic power supply system.
Acknowledgements
This work was supported through the Vanderbilt Discovery Grant program and
gifts in kind from Festo Corporation.
57
References
[1] Aichlmayr, H. T., Kittelson, D. B., and Zachariah, M. R., “Miniature free-piston homogenous charge compression ignition engine-compressor concept – Part I: performance estimation and design considerations unique to small dimensions,” Chemical Engineering Science, 57, pp. 4161-4171, 2002.
[2] Aichlmayr, H. T., Kittelson, D. B., and Zachariah, M. R., “Miniature free-piston
homogenous charge compression ignition engine-compressor concept – Part II: modeling HCCI combustion in small scales with detailed homogeneous gas phase chemical kinetics,” Chemical Engineering Science, 57, pp. 4173-4186, 2002.
[3] Beachley, N. H. and Fronczak, F. J., “Design of a Free-Piston Engine-Pump,”
SAE Technical Paper Series, 921740, pp. 1-8, 1992. [4] Goldfarb, M., Barth, E. J., Gogola, M. A., Wehrmeyer, J. A., “Design and
Energetic Characterization of a Liquid-Propellant-Powered Actuator for Self-Powered Robots”. IEEE/ASME Transactions on Mechatronics, vol. 8, no. 2, pp. 254-262, June 2003.
[5] Klotsch, P., “Ford Free-Piston Engine Development,” SAE Technical Paper
Series, 590045, vol. 67, pp. 373-378, 1959. [6] McGee, T. G., Raade, J. W., and Kazerooni, H., “Monopropellant-Driven Free
Piston Hydraulic Pump for Mobile Robotic Systems,” ASME Journal of Dynamic Systems, Measurement, and Control, vol. 126, pp. 75-81, March 2004.
[7] Pescara, R. P., “Motor Compressor Apparatus,” U.S. Patent No. 1,657,641, Jan.
31, 1928. [8] Underwood, A. F., “The GMR 4-4 ‘Hyprex’ Engine: A Concept of the Free-
Piston Engine for Automotive Use,” SAE Technical Paper Series, 570032, vol. 65, pp. 377-391, 1957.
[9] Barth, E. J., and Riofrio, J., “Dynamic Characteristics of a Free Piston
Compressor,” 2004 ASME International Mechanical Engineering Congress and Exposition (IMECE), IMECE2004-59594, November 13-19, 2004, Anaheim, CA.

CHAPTER III
MANUSCRIPT 2
ADDENDUM
59
Notes on Efficiency
The total efficiency of converting stored chemical energy of propane into kinetic
energy of the free piston, as shown in Equation (2), was estimated by observing the
pressure in the cylinder during injection and assuming ideal gas behavior. It was also
assumed that the temperature in the chamber remained constant at ambient temperature.
A better way to determine the mass of air and fuel used for combustion was devised in
Manuscripts 3 and 4 (Chapters IV and V, respectively).
CHAPTER IV
MANUSCRIPT 3
EXPERIMENTAL OPERATION AND CHARACTERIZATION OF A FREE PISTON COMPRESSOR
José A. Riofrio and Eric J. Barth
Department of Mechanical Engineering
Vanderbilt University
Nashville, TN 37235
(Submitted to ASME International Mechanical Engineering Congress and Exposition
(IMECE), Orlando, FL, November 2005)
61
Abstract
The ongoing design evolution of a free piston compressor (FPC) is presented in this
paper. The FPC is a proposed device that utilizes combustion of a hydrocarbon fuel to
compress air into a high-pressure supply tank. This device is designed to extract
chemically stored energy from the fuel and convert it to potential energy of compressed
air, while achieving high conversion efficiency relative to other small-scale portable
power supply systems. The chemically stored energy of the hydrocarbon fuel is first
converted into kinetic energy of the free piston by the end of the combustion phase.
Subsequently, the moving piston acts as a pump and air compressor during a compression
phase. The proposed technology is intended to provide a compact and efficient pneumatic
power supply source appropriate for human-scale robots. The design and implementation
of this version of the FPC is shown, and experimental results relating all phases
(combustion, expansion and pumping) are discussed. The total efficiency of the system is
experimentally measured and compared to its theoretical prediction.
Introduction
The need for an effective portable power supply for untethered human-scale
robots has increasingly become a matter of interest in robotics research. Current
prototypes of humanoid robots, such as the Honda P3, Honda ASIMO and the Sony
QRIO, show significant limitations in the duration of their power sources in between
charges (the operation time of the Honda P3, for instance, is only 25 minutes). This
becomes a strong motivation for the implementation of a more adequate source of power.
The motivation details are discussed more thoroughly in [1].
62
This paper presents the design of a free piston compressor (FPC) as a power supply
for pneumatically actuated systems. The FPC serves the function of converting
chemically stored energy of a hydrocarbon fuel into pneumatic potential energy of
compressed air. More specifically, it extracts the energy by producing combustion of a
stoichiometric mixture of propane and air, and the combustion-driven free piston acts as
an air pump to produce the compressed air. The FPC, coupled with pneumatic actuators,
is intended as an alternative to electrical batteries coupled with electrical motors. The
main objective of this idea is to exploit the high mass specific energy density of
hydrocarbon fuels and the high mass specific power density of linear pneumatic
actuators, in order to provide at least an order of magnitude greater combined energy and
power density (power supply and actuation) than state of the art electrical power supply
and actuation systems.
Given their inherent penalization for carrying their own mass, the total energetic
merit of an untethered power supply and actuation system is a combined measure of the
source energy density of the energetic substance being carried, the efficiency of
conversion to controlled mechanical work, the energy converter mass, and the power
density of the actuators. With regard to a battery powered electric motor actuated system,
the efficiency of conversion from stored electrochemical energy to shaft work after a gear
head can be high (~ 50% to 80%) with very little converter mass (e.g. PWM amplifiers);
however, the energy density of batteries is relatively low (about 180 kJ/kg for NiMH
batteries), and the power density of electrical motors is not very high (on the order of 50
W/kg) rendering them heavy in relation to the mechanical work that they can output.
With regard to the hydrocarbon-based pneumatic power supply and actuation approach
63
presented here, the converter mass is high relative to a battery/motor system, and the total
conversion efficiency is shown in [2] to be low in relative terms. However, the energy
density of hydrocarbon fuels is in the neighborhood of 45 MJ/kg (where the oxidizer is
obtained from the environment and therefore has no associated mass penalty), which is
more than 200 times greater than the energy density of conventional electrical batteries.
This implies that even with poor conversion efficiency (< 10%), and with only mild
expectations of miniaturizing the energy converter, the available energy to the actuator
per unit mass of the energy source (mass of fuel plus mass of energy converter) is still at
least one order of magnitude greater than the battery/motor system. Additionally, linear
pneumatic actuators have roughly one order of magnitude greater power density than
traditional electrical motors. Therefore, the proposed technology offers the potential of
greatly increased energetic characteristics over state-of-the-art electrical power supply
and actuation systems.
The idea of using a free piston combustion-based device as a pump has been around
since the original free-piston patent by Pescara in 1928 [3]. The automotive industry
conducted a large amount of research in the 1950s. Ford Motor Company considered the
use of a free piston device as a gasifier in 1954 [4]. General Motors presented the
“Hyprex” engine in 1957 [5]. Such endeavours were aimed at an automotive scale engine
and were largely unsuccessful. In more recent times, the free piston engine concept has
been considered for small-scale power generation. Aichlmayr, et. al. [6, 7] have
considered the use of a free piston device as an electrical power source on the 10 W scale
meant to compete with batteries. Beachley and Fronczak [8], among others, have
considered the design of a free-piston hydraulic pump. McGee, et. al. have considered the
64
use of a monopropellant-based catalytic reaction as an alternative to combustion, as
applied to a free piston hydraulic pump [9].
The FPC presented here is intended as a power supply for a mobile pneumatic robotic
system of human comparable power, mass and size. It is shown analytically in [2] that the
use of a free piston engine as a direct air compressor offers nearly ideal loading
characteristics necessary for high efficiency (relative to similar scale combustion based
devices), in a simple and small package.
A first design of the FPC was presented in [10]. In this previous design, particular
emphasis was placed into the combustion portion of the device, and it outlined the main
features of the FPC concept and design considerations of that particular prototype. The
main features should be re-stated here, since they constitute the essence of the FPC idea:
Inertial Loading – The free piston is not rigidly attached to a crankshaft or any timing
linkage alike, so it offers purely inertial loading to the expanding combustion gases. This
allows the free piston to load up with kinetic energy resulting from the work done by the
ideal adiabatic expansion [10] of the combustion gases. The combustion gases are
allowed to expand until they reach atmospheric pressure, all while still contributing to the
inertial loading. This full expansion contributes to a higher efficiency than if full
expansion were not allowed, as is the case with most small-scale IC engines. As an
additional consequence, the FPC has a quiet exhaust, since no high-pressure gases will be
exhausted into the atmosphere.
Breathe-in Mechanism – When the combustion gases reach atmospheric pressure, the
free piston will still be traveling (with maximum kinetic energy), and thus will induce a
drop of pressure in the combustion chamber as the motion continues. This pressure drop
65
will cause an intake check valve to open and allow fresh atmospheric air to enter the
chamber. This fresh air will both cool down and dilute the combustion products. The
breathe-in mechanism ensures a low temperature operation of the device.
Start on Demand – Since the intake valves and spark plug are electrically actuated, and
since high-pressure injection of air and fuel eliminate the need for a conventional intake
and compression stroke, the FPC does not require the implementation of a starter. This
allows the engine to start on demand, without the need for a separate starting cycle. This
feature highlights the compatibility between the FPC and a pneumatic robotic system,
since they can be tied together by implementing a simple control loop to maintain a
particular pressure in a supply reservoir. The FPC would receive a signal and start
operating as soon as the actuation pressure supply drops, and likewise turn off once
reaching the desired pressure.
The features outlined above, among others, are discussed more in detail in [10], and
become the platform for the work presented in this paper. What follows is an introduction
of the new FPC prototype and some new design considerations, a comprehensive analysis
of the design evolution, analysis of new experimental data showing combustion and
pumping, and a calculation of the total efficiency of the system.
New Version of FPC
The previous prototype of the FPC [10] consisted of one combustion cylinder and two
pumping cylinders. The three cylinders were aligned in parallel, with the combustion
cylinder in the center. The pistons were rigidly attached to each other, and their main
functions (combustion and pumping) occurred at the right of the pistons. The combustion
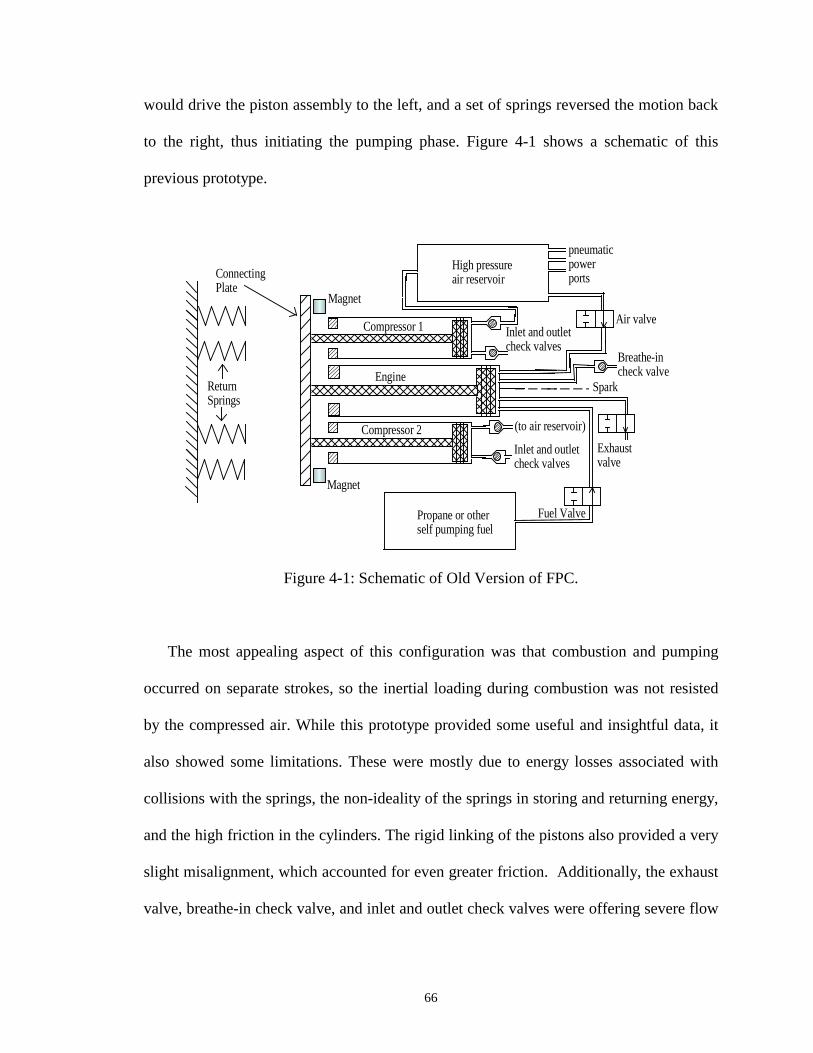
66
would drive the piston assembly to the left, and a set of springs reversed the motion back
to the right, thus initiating the pumping phase. Figure 4-1 shows a schematic of this
previous prototype.
Propane or otherself pumping fuel
Fuel Valve
Spark
Exhaustvalve
Air valve
High pressureair reservoir
pneumaticpowerports
Engine
Compressor 1 Inlet and outletcheck valves
Compressor 2
ReturnSprings
Magnet
Magnet
ConnectingPlate
Inlet and outletcheck valves
(to air reservoir)
Breathe-incheck valve
Figure 4-1: Schematic of Old Version of FPC.
The most appealing aspect of this configuration was that combustion and pumping
occurred on separate strokes, so the inertial loading during combustion was not resisted
by the compressed air. While this prototype provided some useful and insightful data, it
also showed some limitations. These were mostly due to energy losses associated with
collisions with the springs, the non-ideality of the springs in storing and returning energy,
and the high friction in the cylinders. The rigid linking of the pistons also provided a very
slight misalignment, which accounted for even greater friction. Additionally, the exhaust
valve, breathe-in check valve, and inlet and outlet check valves were offering severe flow
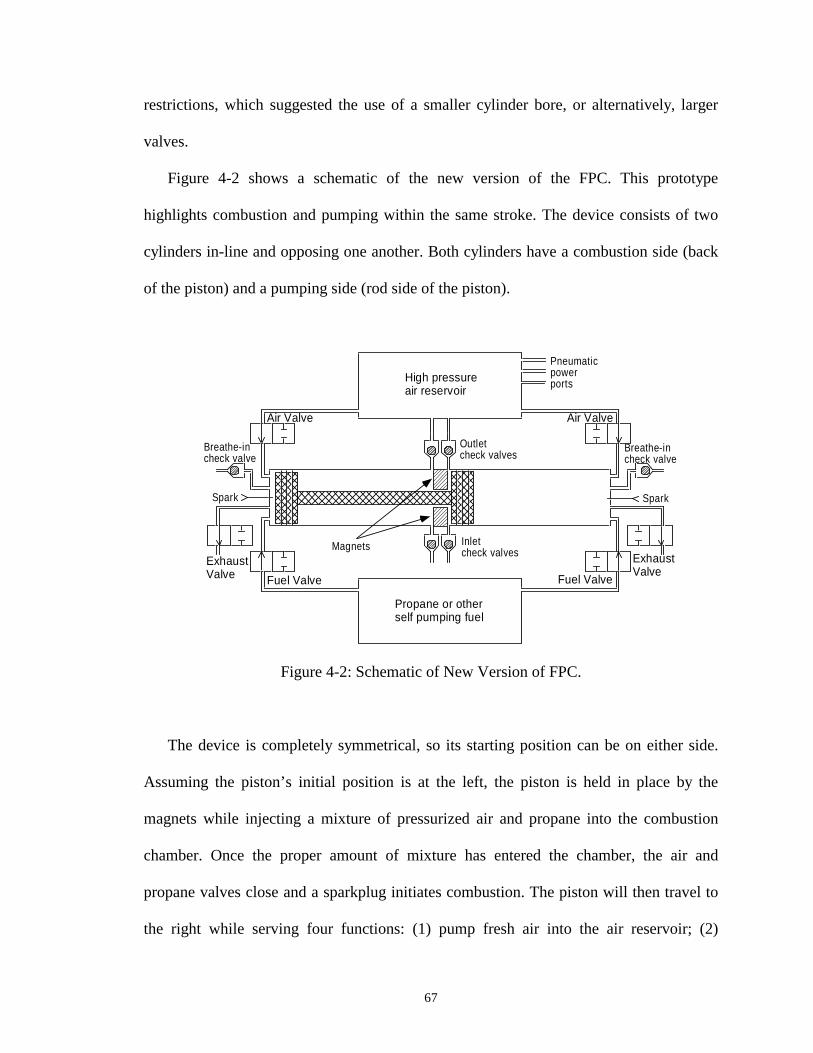
67
restrictions, which suggested the use of a smaller cylinder bore, or alternatively, larger
valves.
Figure 4-2 shows a schematic of the new version of the FPC. This prototype
highlights combustion and pumping within the same stroke. The device consists of two
cylinders in-line and opposing one another. Both cylinders have a combustion side (back
of the piston) and a pumping side (rod side of the piston).
High pressureair reservoir
Propane or otherself pumping fuel
Fuel Valve Fuel Valve
Air Valve Air Valve
ExhaustValve
ExhaustValve
Pneumaticpowerports
Breathe-incheck valve
Breathe-incheck valve
Spark Spark
Outletcheck valves
Inletcheck valvesMagnets
Figure 4-2: Schematic of New Version of FPC.
The device is completely symmetrical, so its starting position can be on either side.
Assuming the piston’s initial position is at the left, the piston is held in place by the
magnets while injecting a mixture of pressurized air and propane into the combustion
chamber. Once the proper amount of mixture has entered the chamber, the air and
propane valves close and a sparkplug initiates combustion. The piston will then travel to
the right while serving four functions: (1) pump fresh air into the air reservoir; (2)
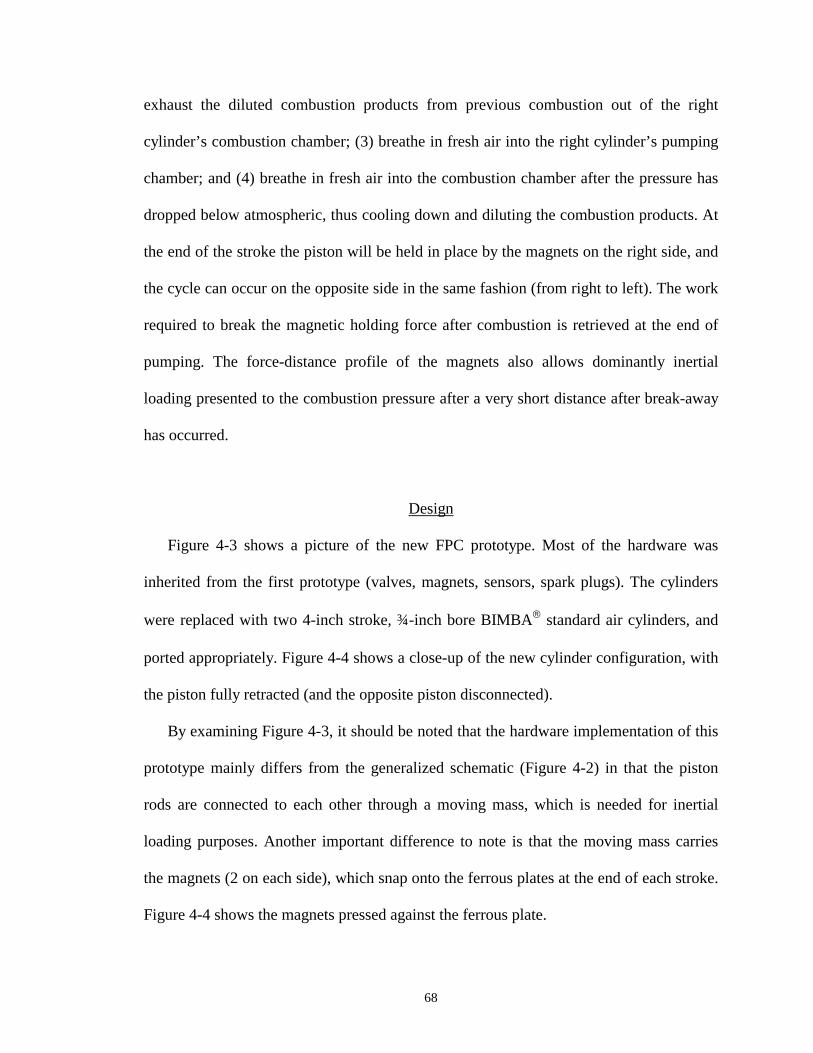
68
exhaust the diluted combustion products from previous combustion out of the right
cylinder’s combustion chamber; (3) breathe in fresh air into the right cylinder’s pumping
chamber; and (4) breathe in fresh air into the combustion chamber after the pressure has
dropped below atmospheric, thus cooling down and diluting the combustion products. At
the end of the stroke the piston will be held in place by the magnets on the right side, and
the cycle can occur on the opposite side in the same fashion (from right to left). The work
required to break the magnetic holding force after combustion is retrieved at the end of
pumping. The force-distance profile of the magnets also allows dominantly inertial
loading presented to the combustion pressure after a very short distance after break-away
has occurred.
Design
Figure 4-3 shows a picture of the new FPC prototype. Most of the hardware was
inherited from the first prototype (valves, magnets, sensors, spark plugs). The cylinders
were replaced with two 4-inch stroke, ¾-inch bore BIMBA standard air cylinders, and
ported appropriately. Figure 4-4 shows a close-up of the new cylinder configuration, with
the piston fully retracted (and the opposite piston disconnected).
By examining Figure 4-3, it should be noted that the hardware implementation of this
prototype mainly differs from the generalized schematic (Figure 4-2) in that the piston
rods are connected to each other through a moving mass, which is needed for inertial
loading purposes. Another important difference to note is that the moving mass carries
the magnets (2 on each side), which snap onto the ferrous plates at the end of each stroke.
Figure 4-4 shows the magnets pressed against the ferrous plate.
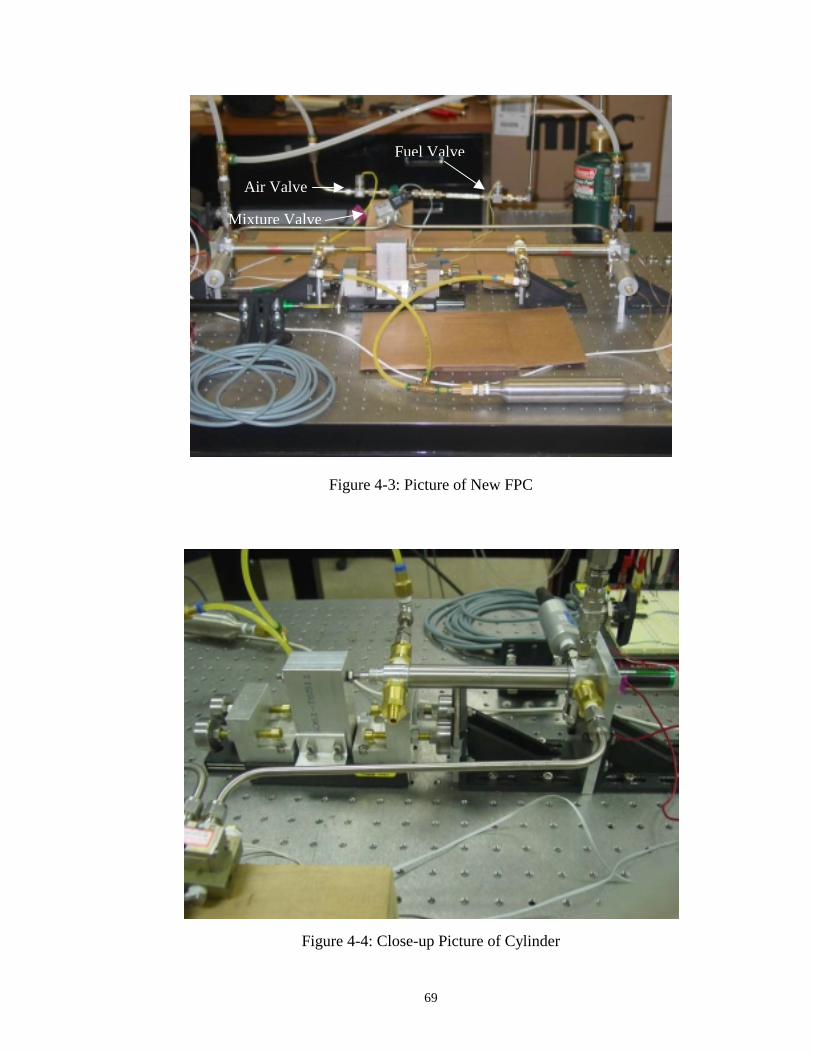
69
Figure 4-3: Picture of New FPC
Figure 4-4: Close-up Picture of Cylinder
Fuel Valve
Air Valve
Mixture Valve
70
This new configuration addresses some of the limitations found in the previous
version of the FPC. The cylinder rods were connected to the moving mass with small
pieces of plastic tubing in order to avoid a purely rigid connection, which would yield
friction due to misalignments. Added to that, the cylinders chosen are much smoother
than the previous ones, so the frictional losses in this system are reduced. The lack of
return springs makes the system quieter and a bit more energy efficient. Also, with these
cylinders’ bore, flow restrictions through valves are no longer contributing noticeable
energetic losses.
Since the main objective of this paper is to show the total efficiency of the system
from stored chemical energy of propane to stored pneumatic potential energy of
compressed air, it is imperative to be as precise as is reasonably possible with all
measurements. The most difficult, yet one of the most important measurements to
determine is the mass of propane used for combustion. Knowing this mass and the energy
density of propane, the total amount of initial energy can be determined and compared to
the potential energy of compressed air in the reservoir. This potential energy is equal to
satms VPP )( − , where sP and sV are the pressure and volume in the reservoir, and atmP is
atmospheric pressure.
Measuring the Mass of Propane
As shown in Figure 4-3, the air/fuel mixture enters the chamber by controlled opening
and closing of the air, fuel and mixture valves. The air and fuel valves are timed such that
a stoichiometric mixture exists within a common mixing line at the exit of both valves.
This mixture is then admitted to one of the two combustion chambers via a three-way
71
mixture valve. The air and fuel valves are Parker Series-9 valves, and operate as two-
way on/off valves. The nominal response time of these valves is 12 ms, while their
commanded opening times for this application will range between 8-12 ms for propane
and 50-80 ms for air. A mass flow meter could not be used to determine the mass of
propane flowing because these are small pulses, and not steady flows. Also, since the
propane valve operates at opening times close to the valve response time, the small pulse
flow dynamics would not be similar to the steady flow dynamics. The mass was instead
calculated by injecting propane into an inverted graduated cylinder on a beaker with
water, and observing the water displacement in the cylinder for various durations of the
commanded opening pulse sent to the fuel valve. This was done for 8, 9, and 10 ms
pulses, and each one was performed several times to obtain an average. The standard
deviation of measured displaced water for each pulse duration was very close to the
readability of the scale. The same was done for the air, in order to find stoichiometric
values based on air and fuel valve opening times. It should be noted that this match of
opening times yields accurate stoichiometric mixtures only if flowing into atmospheric
pressure.
For precise data acquisition purposes, the engine was run only in single fire shots.
Before each fire, the exhaust port and mixture valve was opened, and the fuel and air
valves opened for specific durations previously determined to yield a stoichiometric
mixture. This was done several times such that the entire mixing line would contain a
precise air-fuel ratio. The exhaust port was then closed and some of the stoichiometric
air/fuel mixture remaining in the mixture line was pushed into the combustion chamber,
by opening the mixture valve, until reaching the desired injection pressure. This
72
pressurized mixture can be taken as an ideal gas, so the mass in the chamber can be
calculated as RTPVm = , where P and V are the pressure and volume in the chamber, T is
the temperature of the mixture (approx. room temperature), and R is the gas constant of
the stoichiometric propane/air mixture. Then, with knowledge of a stoichiometric mass
ratio, the mass of propane subject to combustion can be determined.
Adjusting Mixture while Pumping
Ideally, every firing should be strong enough for the piston to just barely make it to
the other side. If combustion is stronger than it needs to be, the piston will carry extra
energy that will not be used for pumping, but dissipated in colliding with the other side.
This is quite wasteful and brings down the total efficiency of the system. Conversely, if
the combustion is weak and the piston carries less kinetic energy than needed to pump a
full stroke, it will not make it to the other side, and some energy would need to be re-
invested (by utilizing the air injection valve and energy stored in the reservoir) to push
the piston to the other side (note that the area of the rod side being less that the piston
side will allow this to occur when both sides are ultimately presented with the reservoir
pressure). Precisely controlling the strength of the combustion for continuous operation
would require more sophisticated equipment and is beyond the scope of this paper.
However, full compression of the air reservoir is achieved here with discrete increases of
valve opening times as needed. It should be noted that due to the low resolution of the
valves at these extremely low mass flows, the combustion pressure increase between any
two valve-opening times is relatively large. Figure 4-5 shows the average amounts of
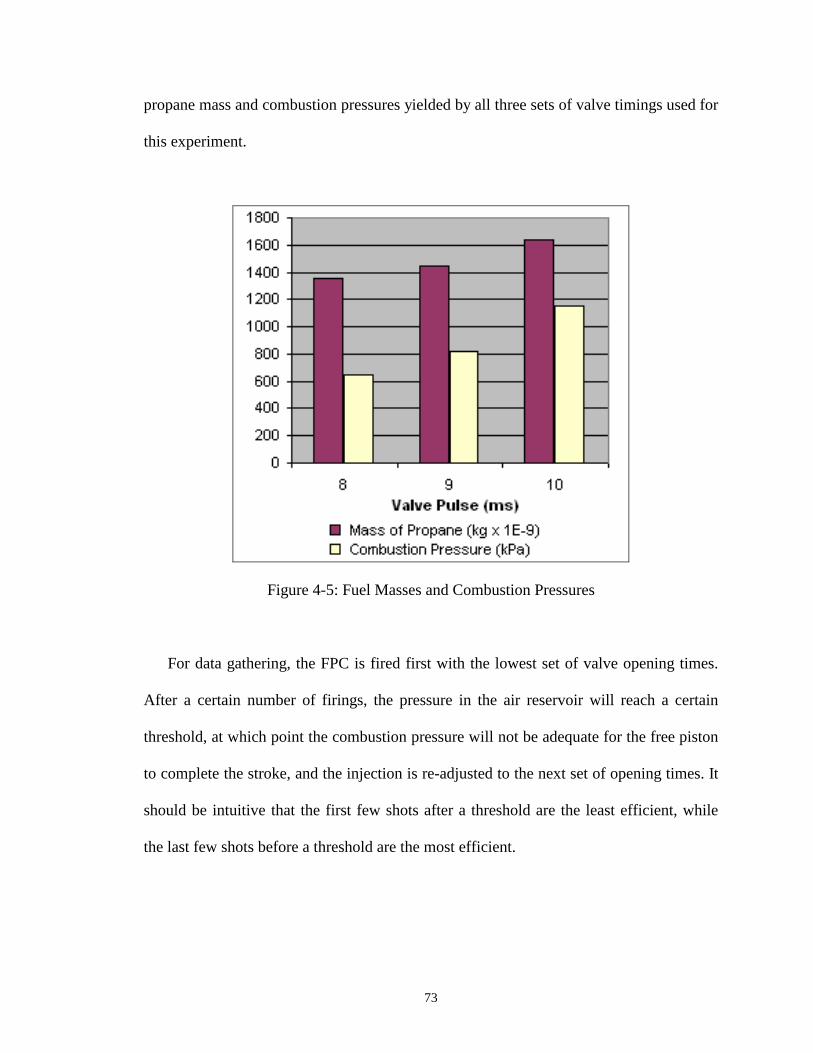
73
propane mass and combustion pressures yielded by all three sets of valve timings used for
this experiment.
Figure 4-5: Fuel Masses and Combustion Pressures
For data gathering, the FPC is fired first with the lowest set of valve opening times.
After a certain number of firings, the pressure in the air reservoir will reach a certain
threshold, at which point the combustion pressure will not be adequate for the free piston
to complete the stroke, and the injection is re-adjusted to the next set of opening times. It
should be intuitive that the first few shots after a threshold are the least efficient, while
the last few shots before a threshold are the most efficient.
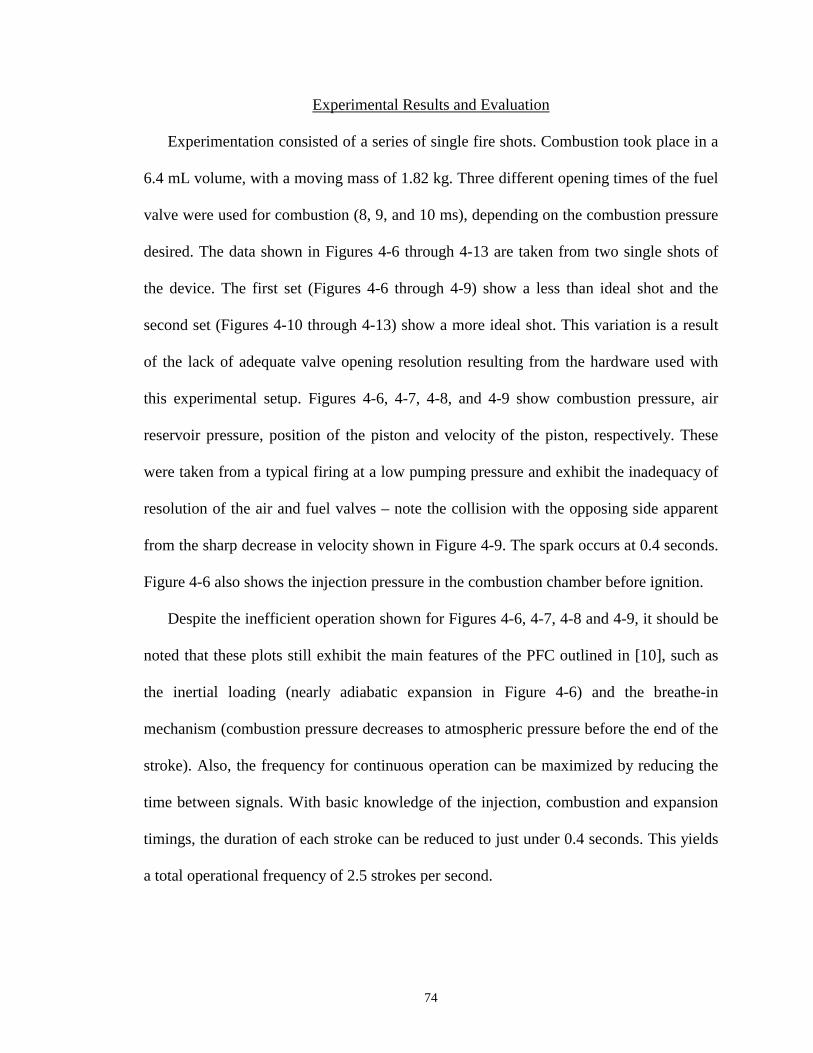
74
Experimental Results and Evaluation
Experimentation consisted of a series of single fire shots. Combustion took place in a
6.4 mL volume, with a moving mass of 1.82 kg. Three different opening times of the fuel
valve were used for combustion (8, 9, and 10 ms), depending on the combustion pressure
desired. The data shown in Figures 4-6 through 4-13 are taken from two single shots of
the device. The first set (Figures 4-6 through 4-9) show a less than ideal shot and the
second set (Figures 4-10 through 4-13) show a more ideal shot. This variation is a result
of the lack of adequate valve opening resolution resulting from the hardware used with
this experimental setup. Figures 4-6, 4-7, 4-8, and 4-9 show combustion pressure, air
reservoir pressure, position of the piston and velocity of the piston, respectively. These
were taken from a typical firing at a low pumping pressure and exhibit the inadequacy of
resolution of the air and fuel valves – note the collision with the opposing side apparent
from the sharp decrease in velocity shown in Figure 4-9. The spark occurs at 0.4 seconds.
Figure 4-6 also shows the injection pressure in the combustion chamber before ignition.
Despite the inefficient operation shown for Figures 4-6, 4-7, 4-8 and 4-9, it should be
noted that these plots still exhibit the main features of the PFC outlined in [10], such as
the inertial loading (nearly adiabatic expansion in Figure 4-6) and the breathe-in
mechanism (combustion pressure decreases to atmospheric pressure before the end of the
stroke). Also, the frequency for continuous operation can be maximized by reducing the
time between signals. With basic knowledge of the injection, combustion and expansion
timings, the duration of each stroke can be reduced to just under 0.4 seconds. This yields
a total operational frequency of 2.5 strokes per second.
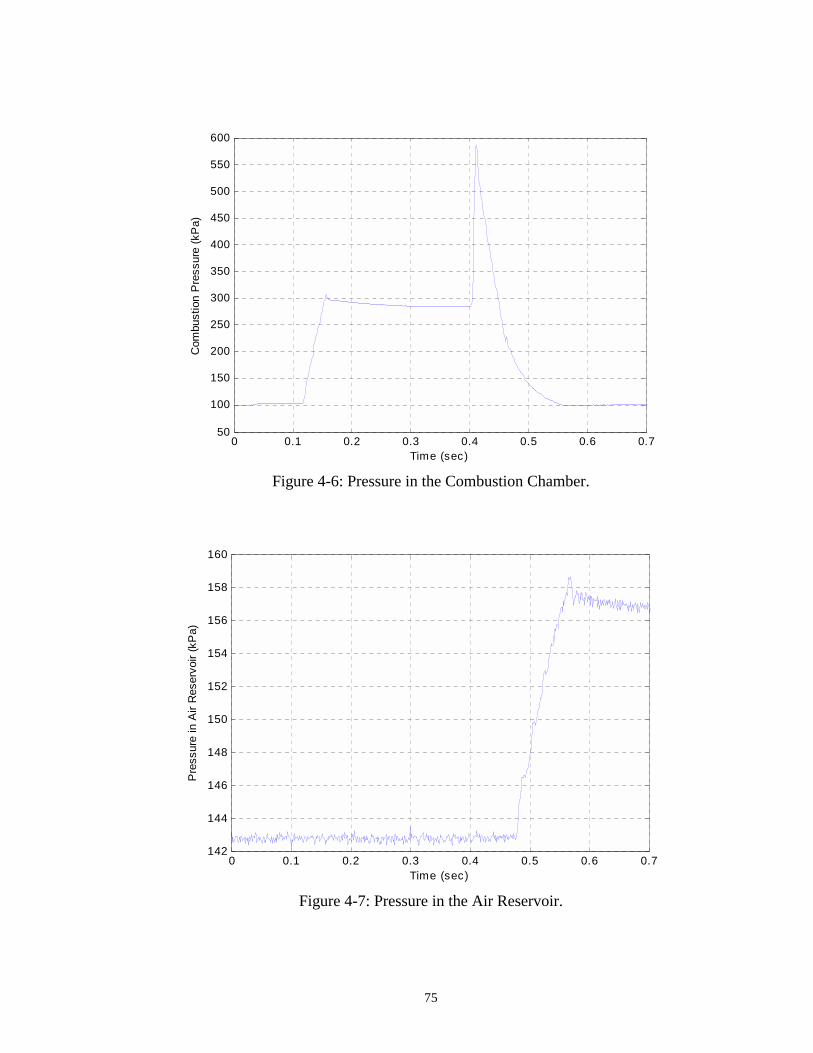
75
0 0.1 0.2 0.3 0.4 0.5 0.6 0.750
100
150
200
250
300
350
400
450
500
550
600
Time (sec)
Com
bust
ion
Pre
ssur
e (k
Pa)
Figure 4-6: Pressure in the Combustion Chamber.
0 0.1 0.2 0.3 0.4 0.5 0.6 0.7142
144
146
148
150
152
154
156
158
160
Time (sec)
Pre
ssur
e in
Air
Res
ervo
ir (k
Pa)
Figure 4-7: Pressure in the Air Reservoir.
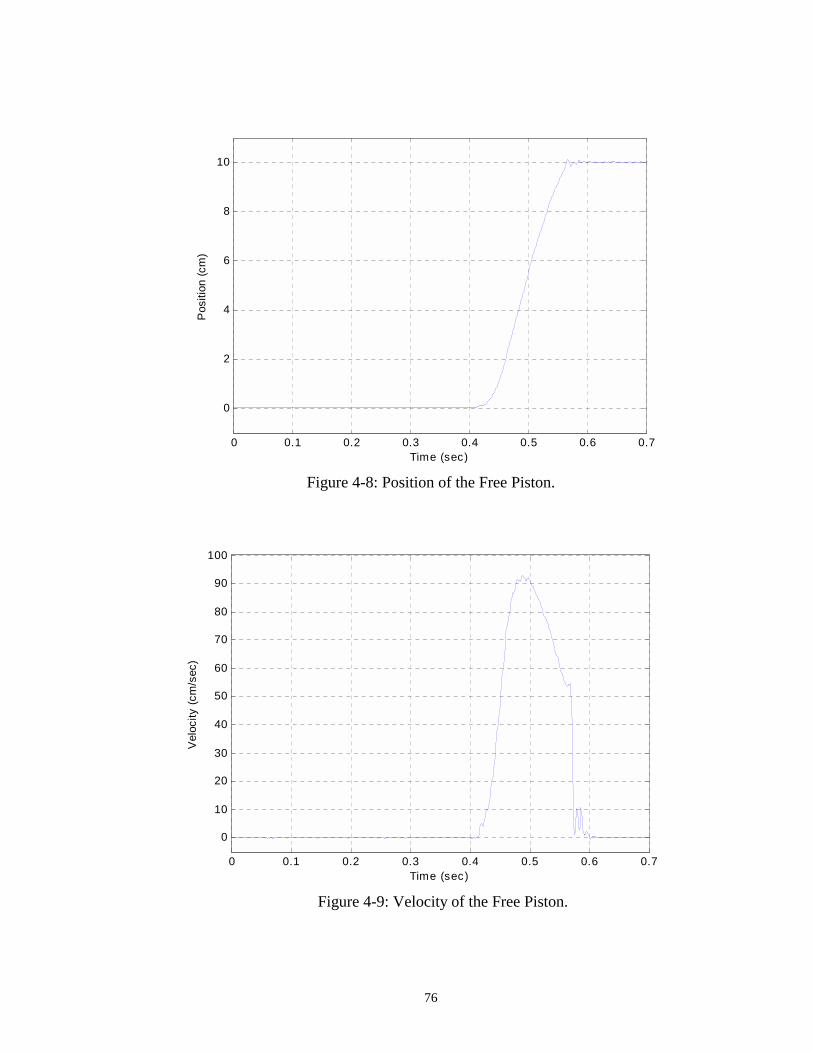
76
0 0.1 0.2 0.3 0.4 0.5 0.6 0.7
0
2
4
6
8
10
Time (sec)
Pos
ition
(cm
)
Figure 4-8: Position of the Free Piston.
0 0.1 0.2 0.3 0.4 0.5 0.6 0.7
0
10
20
30
40
50
60
70
80
90
100
Time (sec)
Vel
ocity
(cm
/sec
)
Figure 4-9: Velocity of the Free Piston.
77
Through single fire shots, the air reservoir was successfully compressed from
atmospheric pressure up to 310 kPa. It took 52 strokes to achieve this pressure, which can
be achieved in 20 seconds of continuous operation (based on the previously described
operational frequency). This compression pressure is limited by the ratio of stroke
volume (engine displacement) over dead volume in the rod (compressing) side of the
chosen cylinders. This dead volume was quite large (about 4.1 mL), and is a nonideality
(as noted in [2]) that should be reduced in future design considerations. This nonideality
presents the main drawback in this version of the FPC.
The total energetic merit of this system is represented by the efficiency of conversion
from chemically stored energy in propane to pneumatic potential energy of compressed
air. As shown analytically in [2], this efficiency also increases for larger combustion
pressures. Experimentally, this efficiency was calculated for a single fire shot in which
the piston just barely made it to the other side – the ideal case which could conceivably
be achieved for every stroke given adequate valve resolution. Figures 4-10, 4-11, 4-12,
and 4-13 show the respective pressures, displacement and velocity for this particular shot.
By looking at the position and velocity in Figures 4-12 and 4-13, it can be observed that
the piston “barely made it” to the other side, with a little help from the magnetic force.
This shot used 1.42×10⁻⁶ kg of propane and resulted in an increase of the pressure in the
air reservoir (a volume of 1.866×10⁻⁴ m3) from 222.75 kPa to 235 kPa, yielding a
pneumatic potential energy increase of 2.29 Joules. The total efficiency of this shot is
calculated as,
%47.3100
fuel kg 10*42.1fuel kg
kJ 46350kJ 0.002286
6=×
×=
−totalη
(1)
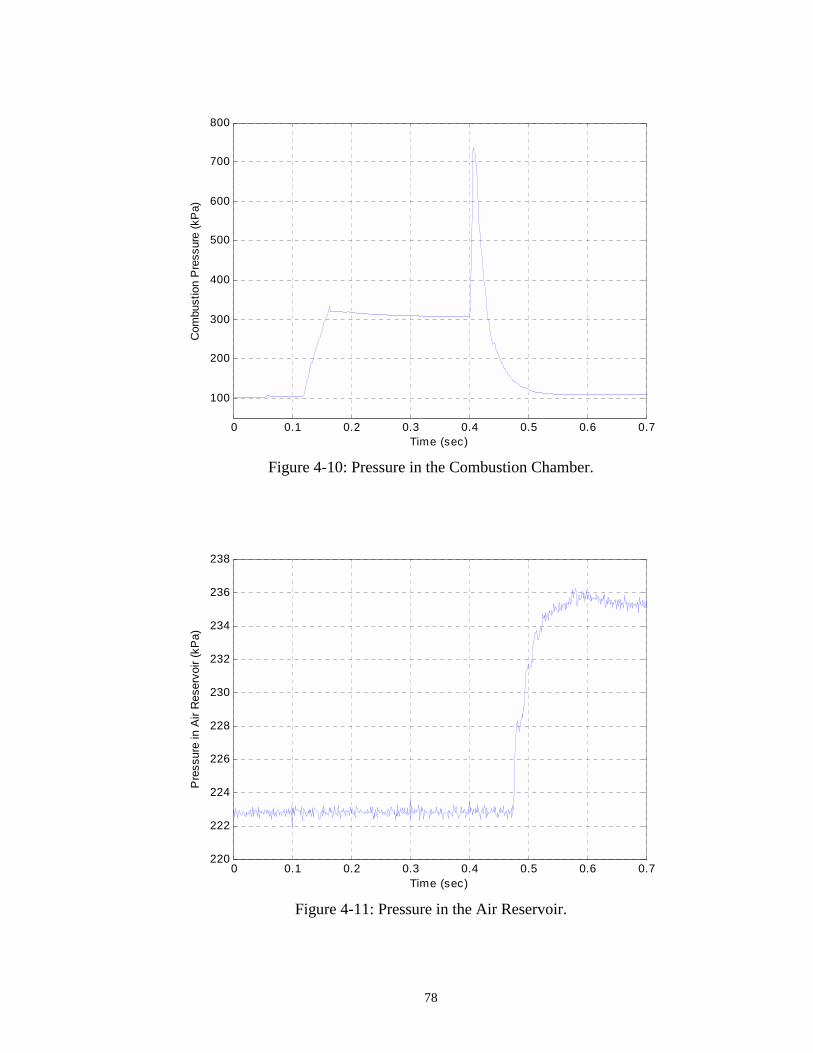
78
0 0.1 0.2 0.3 0.4 0.5 0.6 0.7
100
200
300
400
500
600
700
800
Time (sec)
Com
bust
ion
Pre
ssur
e (k
Pa)
Figure 4-10: Pressure in the Combustion Chamber.
0 0.1 0.2 0.3 0.4 0.5 0.6 0.7220
222
224
226
228
230
232
234
236
238
Time (sec)
Pre
ssur
e in
Air
Res
ervo
ir (k
Pa)
Figure 4-11: Pressure in the Air Reservoir.
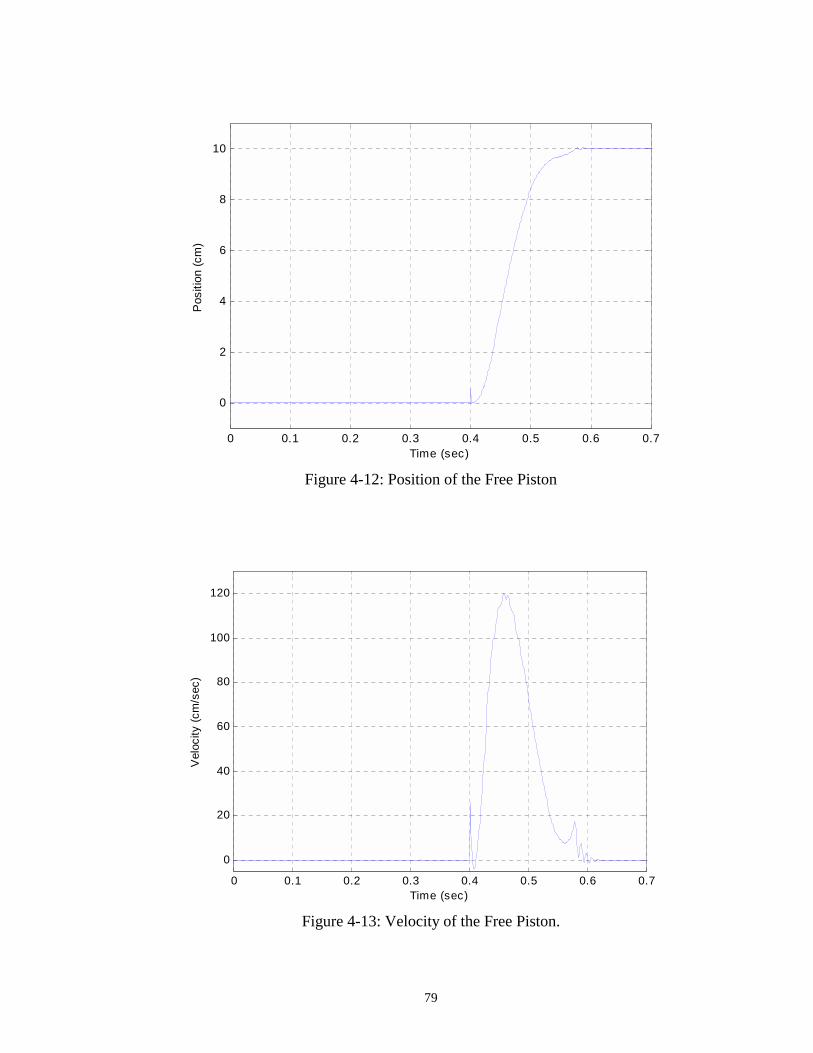
79
0 0.1 0.2 0.3 0.4 0.5 0.6 0.7
0
2
4
6
8
10
Time (sec)
Pos
ition
(cm
)
Figure 4-12: Position of the Free Piston
0 0.1 0.2 0.3 0.4 0.5 0.6 0.7
0
20
40
60
80
100
120
Time (sec)
Vel
ocity
(cm
/sec
)
Figure 4-13: Velocity of the Free Piston.
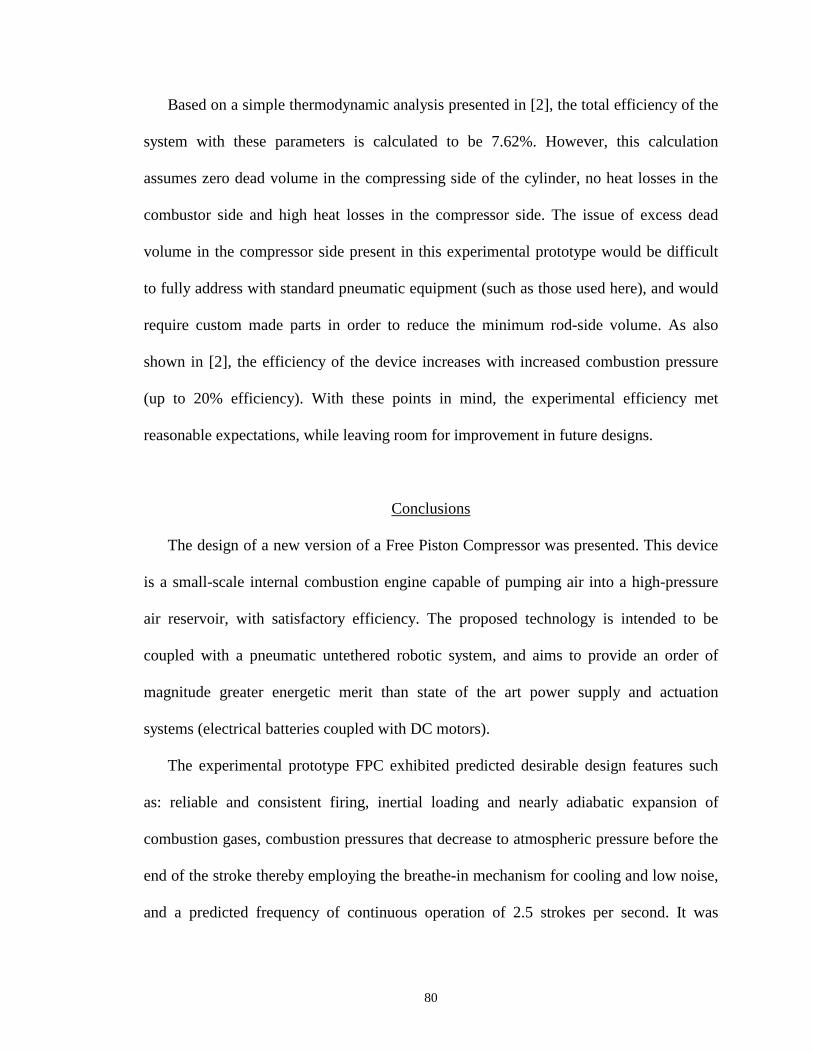
80
Based on a simple thermodynamic analysis presented in [2], the total efficiency of the
system with these parameters is calculated to be 7.62%. However, this calculation
assumes zero dead volume in the compressing side of the cylinder, no heat losses in the
combustor side and high heat losses in the compressor side. The issue of excess dead
volume in the compressor side present in this experimental prototype would be difficult
to fully address with standard pneumatic equipment (such as those used here), and would
require custom made parts in order to reduce the minimum rod-side volume. As also
shown in [2], the efficiency of the device increases with increased combustion pressure
(up to 20% efficiency). With these points in mind, the experimental efficiency met
reasonable expectations, while leaving room for improvement in future designs.
Conclusions
The design of a new version of a Free Piston Compressor was presented. This device
is a small-scale internal combustion engine capable of pumping air into a high-pressure
air reservoir, with satisfactory efficiency. The proposed technology is intended to be
coupled with a pneumatic untethered robotic system, and aims to provide an order of
magnitude greater energetic merit than state of the art power supply and actuation
systems (electrical batteries coupled with DC motors).
The experimental prototype FPC exhibited predicted desirable design features such
as: reliable and consistent firing, inertial loading and nearly adiabatic expansion of
combustion gases, combustion pressures that decrease to atmospheric pressure before the
end of the stroke thereby employing the breathe-in mechanism for cooling and low noise,
and a predicted frequency of continuous operation of 2.5 strokes per second. It was
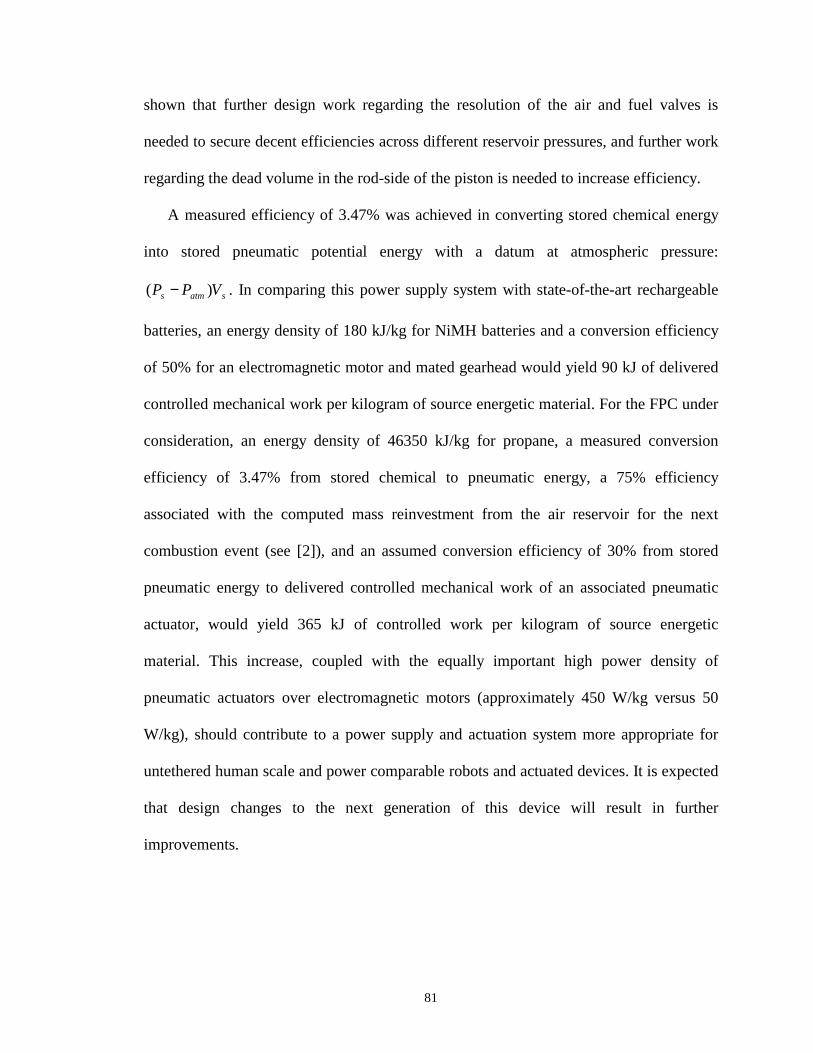
81
shown that further design work regarding the resolution of the air and fuel valves is
needed to secure decent efficiencies across different reservoir pressures, and further work
regarding the dead volume in the rod-side of the piston is needed to increase efficiency.
A measured efficiency of 3.47% was achieved in converting stored chemical energy
into stored pneumatic potential energy with a datum at atmospheric pressure:
satms VPP )( − . In comparing this power supply system with state-of-the-art rechargeable
batteries, an energy density of 180 kJ/kg for NiMH batteries and a conversion efficiency
of 50% for an electromagnetic motor and mated gearhead would yield 90 kJ of delivered
controlled mechanical work per kilogram of source energetic material. For the FPC under
consideration, an energy density of 46350 kJ/kg for propane, a measured conversion
efficiency of 3.47% from stored chemical to pneumatic energy, a 75% efficiency
associated with the computed mass reinvestment from the air reservoir for the next
combustion event (see [2]), and an assumed conversion efficiency of 30% from stored
pneumatic energy to delivered controlled mechanical work of an associated pneumatic
actuator, would yield 365 kJ of controlled work per kilogram of source energetic
material. This increase, coupled with the equally important high power density of
pneumatic actuators over electromagnetic motors (approximately 450 W/kg versus 50
W/kg), should contribute to a power supply and actuation system more appropriate for
untethered human scale and power comparable robots and actuated devices. It is expected
that design changes to the next generation of this device will result in further
improvements.
82
References
[1] Goldfarb, M., Barth, E. J., Gogola, M. A., Wehrmeyer, J. A., “Design and Energetic Characterization of a Liquid-Propellant-Powered Actuator for Self-Powered Robots”. IEEE/ASME Transactions on Mechatronics, vol. 8, no. 2, pp. 254-262, June 2003.
[2] Barth, E. J., and Riofrio, J., “Dynamic Characteristics of a Free Piston
Compressor,” 2004 ASME International Mechanical Engineering Congress and Exposition (IMECE), IMECE2004-59594, November 13-19, 2004, Anaheim, CA.
[3] Pescara, R. P., “Motor Compressor Apparatus,” U.S. Patent No. 1,657,641, Jan. 31,
1928. [4] Klotsch, P., “Ford Free-Piston Engine Development,” SAE Technical Paper Series,
590045, vol. 67, pp. 373-378, 1959. [5] Underwood, A. F., “The GMR 4-4 ‘Hyprex’ Engine: A Concept of the Free-Piston
Engine for Automotive Use,” SAE Technical Paper Series, 570032, vol. 65, pp. 377-391, 1957.
[6] Aichlmayr, H. T., Kittelson, D. B., and Zachariah, M. R., “Miniature free-piston
homogenous charge compression ignition engine-compressor concept – Part I: performance estimation and design considerations unique to small dimensions,” Chemical Engineering Science, 57, pp. 4161-4171, 2002.
[7] Aichlmayr, H. T., Kittelson, D. B., and Zachariah, M. R., “Miniature free-piston
homogenous charge compression ignition engine-compressor concept – Part II: modeling HCCI combustion in small scales with detailed homogeneous gas phase chemical kinetics,” Chemical Engineering Science, 57, pp. 4173-4186, 2002.
[8] Beachley, N. H. and Fronczak, F. J., “Design of a Free-Piston Engine-Pump,” SAE
Technical Paper Series, 921740, pp. 1-8, 1992. [9] McGee, T. G., Raade, J. W., and Kazerooni, H., “Monopropellant-Driven Free
Piston Hydraulic Pump for Mobile Robotic Systems,” ASME Journal of Dynamic Systems, Measurement, and Control, vol. 126, pp. 75-81, March 2004.
[10] Riofrio, J., and Barth, E. J., “Design of a Free Piston Pneumatic Compressor as a
Mobile robot Power Supply,” Proceedings of the 2005 IEEE International Conference on Robotics and Automation (ICRA), pp. 236-241, Barcelona, Spain, April 2005.
[11] Black, William Z., and James G. Hartley, Thermodynamics, Third Edition, New
York: Harper Collins, 1996.

CHAPTER IV
MANUSCRIPT 3
ADDENDUM
84
Pneumatic Stored Energy
The revised thermodynamic efficiency presented in the Addendum of Manuscript 1
(Chapter II) showed a more adequate representation of the pneumatic stored energy in the
air reservoir:
−
−=
−
11
1γγ
γ atm
sfsstored P
PVPE (2)
In calculating the stored energy resulted from one stroke, a change in pressure of 12.25
kPa was measured in the 1.866×10⁻⁴ m3 air reservoir. Applying Equation (2), this energy
is computed as 2.48 Joules.
Mass of Propane used for Combustion
While presenting a effective way to ensuring a stoichiometric air/fuel mixture, this
manuscript overestimated the total mass of fuel used for combustion, since the fuel
injection was assumed an isothermal process instead of an adiabatic process. To account
for this adiabatic compression, we can consider the following relationship:
mixmixeinjlineatm VPVP γγ0= (3)
where atmP is the atmospheric pressure, lineV is the partial volume of the mixture before
entering the combustion chamber, injP is the injection pressure, 0eV is the dead volume in
the combustion chamber, and mixγ is the ratio of specific heats of the air/fuel mixture.
Additionally, by conservation of mass, and assuming an ideal gas, we have:
injmix
einj
ambmix
lineatminj TR
VPTRVPm 0== (4)
85
where injm and mixR are the mass and average gas constant of the fuel mixture,
respectively, and ambT is the ambient temperature and injT is the injection temperature,
previously unaccounted for. Combining Equations (3) and (4), the injected mass of fuel
can be calculated as:
mix
atm
inj
ambmix
atminj P
PTR
Pm
γ1
= (5)
The mass of propane used for efficiency calculations, then, is 9.93×10⁻⁷ kg. The
efficiency of conversion from chemically stored energy in propane to pneumatic potential
energy of compressed air can be re-calculated as:
%10.5100fuel kg 10*05.1
fuel kgkJ 46350
kJ 0.002486
=××
=−
totalη (6)
A more detailed energetic evaluation, including the efficiency obtained from air mass
re-investment, is presented in Manuscript 4 (Chapter V).
CHAPTER V
MANUSCRIPT 4
A FREE PISTON PNEUMATIC COMPRESSOR AS A MOBILE ROBOT POWER SUPPLY: DESIGN, CHARACTERIZATION AND
EXPERIMENTAL OPERATION
José A. Riofrio and Eric J. Barth
Department of Mechanical Engineering
Vanderbilt University
Nashville, TN 37235
(Submitted to the International Journal of Fluid Power)
87
Abstract
The design and dynamic characterization of a free piston compressor (FPC) is
presented in this paper. The FPC is a proposed device that utilizes combustion of a
hydrocarbon fuel to compress air into a high-pressure supply tank, thus serving as a
portable pneumatic power supply. The device is configured such that the transduction
from thermal energy to stored energy, in the form of compressed gas, is efficient relative
to other small-scale portable power supply systems. This efficiency is achieved by
matching the dynamic load of the compressor to the ideal adiabatic expansion of the hot
gas combustion products. It is shown that a load that is dominantly inertial provides a
nearly ideally matched load for achieving high thermodynamic efficiency in a heat
engine. The device proposed exploits this fact by converting thermal energy first into
kinetic energy of the free piston, and then compressing air during a separate compressor
phase. The proposed technology is intended to provide a compact pneumatic power
supply source appropriate for human-scale robots. An analytical model of the proposed
device is developed, and an FPC prototype is designed and built and its yielded
experimental results are compared with theoretical.
Introduction
The need for an effective portable power supply for human-scale robots has
increasingly become a matter of interest in robotics research. Current prototypes of
humanoid robots, such as the Honda P3, Honda ASIMO and the Sony QRIO, show
significant limitations in the capacity of their power sources in between charges (the
operation time of the humanoid-size Honda P3, for instance, is only 25 minutes). This
88
limitation becomes a strong motivation for the development and implementation of a
more adequate source of power. Moreover, the power density of the actuators coupled to
the power source needs to be maximized such that, on a systems level evaluation, the
combined power supply and actuation system is both energy and power dense. Put
simply, state-of-the-art batteries are too heavy for the amount of energy they store, and
electric motors are too heavy for the mechanical power they can deliver, in order to
present a viable combined power supply and actuation system that capable of delivering
human-scale mechanical work in a human-scale self contained robot package, for a useful
duration of time. The motivation details are discussed more thoroughly in [7].
The total energetic merit of an untethered power supply and actuation system is a
combined measure of 1) the source energy density of the energetic substance being
carried, 2) the efficiency of conversion to controlled mechanical work, 3) the energy
converter mass, and 4) the power density of the actuators. With regard to a battery
powered electric motor actuated system, the efficiency of conversion from stored
electrochemical energy to shaft work after a gear head can be high (~50%) with very little
converter mass (e.g. PWM amplifiers); however, the energy density of batteries is
relatively low (about 180 kJ/kg for NiMH batteries), and the power density of electrical
motors is not very high (on the order of 50 W/kg), rendering the overall system heavy in
relation to the mechanical work that it can output. With regard to the hydrocarbon-
pneumatic power supply and actuation approach presented here relative to the
battery/motor system, the converter mass is high and the total conversion efficiency is
shown to be low. However, the energy density of hydrocarbon fuels, where the oxidizer
is obtained from the environment and is therefore free of its associated mass penalty, is in
89
the neighborhood of 45 MJ/kg, which is more than 200 times greater than the energy
density of state of the art electrical batteries. This implies that even with poor conversion
efficiency (poor but within the same order of magnitude), the available energy to the
actuator per unit mass of the energy source is still at least one order of magnitude greater
than the battery/motor system. Additionally, linear pneumatic actuators have roughly one
order of magnitude greater power density than state of the art electrical motors.
Therefore, the combined factors of a high-energy density fuel, the efficiency of the
device, the compactness and low weight of the device, and the use of the device to drive
lightweight linear pneumatic actuators (lightweight as compared with power comparable
electric motors) is projected to provide at least an order of magnitude greater total system
energy density (power supply and actuation) than state of the art power supply (batteries)
and actuators (electric motors) appropriate for human-scale power output.
The FPC presented in this paper serves the function of converting chemically stored
energy of a hydrocarbon into pneumatic potential energy of compressed air. More
specifically, it extracts the energy by producing combustion of a stoichiometric mixture
of propane and air, and the combustion-driven free piston acts as an air pump to produce
the compressed air.
The idea of using a free piston combustion-based device as a pump has been around
since the original free-piston patent by Pescara in 1928 [11]. Junkers developed a free
piston compressor that became widely used by German submarines through World War 2
[10]. The automotive industry conducted a large amount of research in the 1950’s. Ford
Motor Company considered the use of a free piston device as a gasifier in 1954 [8].
General Motors presented the “Hyprex” engine in 1957 [14]. Such endeavors were aimed
90
at an automotive scale engine and were largely unsuccessful. In more recent times, the
free piston engine concept has been considered for small-scale power generation.
Aichlmayr, et. al. [1, 2] have considered the use of a free piston device as an electrical
power source on the 10 W scale meant to compete with batteries. Beachley and Fronczak
[5], among others, have considered the design of a free-piston hydraulic pump. McGee,
et. al. have considered the use of a monopropellant-based catalytic reaction as an
alternative to combustion, as applied to a free piston hydraulic pump [9].
Even though free piston devices have been studied in the past, none of these previous
designs explicitly featured what is perhaps the main advantage of a free piston, which is
its capability to offer a purely inertial load. The main focus of this work is to exploit the
fact that a free piston can present a purely inertial load to the combustion, and as a result,
desirable operational characteristics can be obtained, such as high efficiency, low noise,
and low temperature operation. Additionally, this work aims to demonstrate that a free
piston compressor stands as a strong candidate for a portable power supply system for
untethered human-scale pneumatic robots.
An outline of this paper is as follows. Section 2 describes the proposed device and its
operation, and outlines its main features. Section 3 presents parts of the model and a
simulation of the generalized system, and its yielded theoretical predictions. Section 4
presents the design and implementation of a bench-top laboratory prototype FPC, and its
main design features. Section 5 shows all relevant experimental data along with their
respective analysis and evaluation, and compares experimentally obtained data with
theoretical predictions. Finally, section 6 presents the main conclusions and a discussion
of the FPC’s capability to compete with state-of-the-art power supply technology.
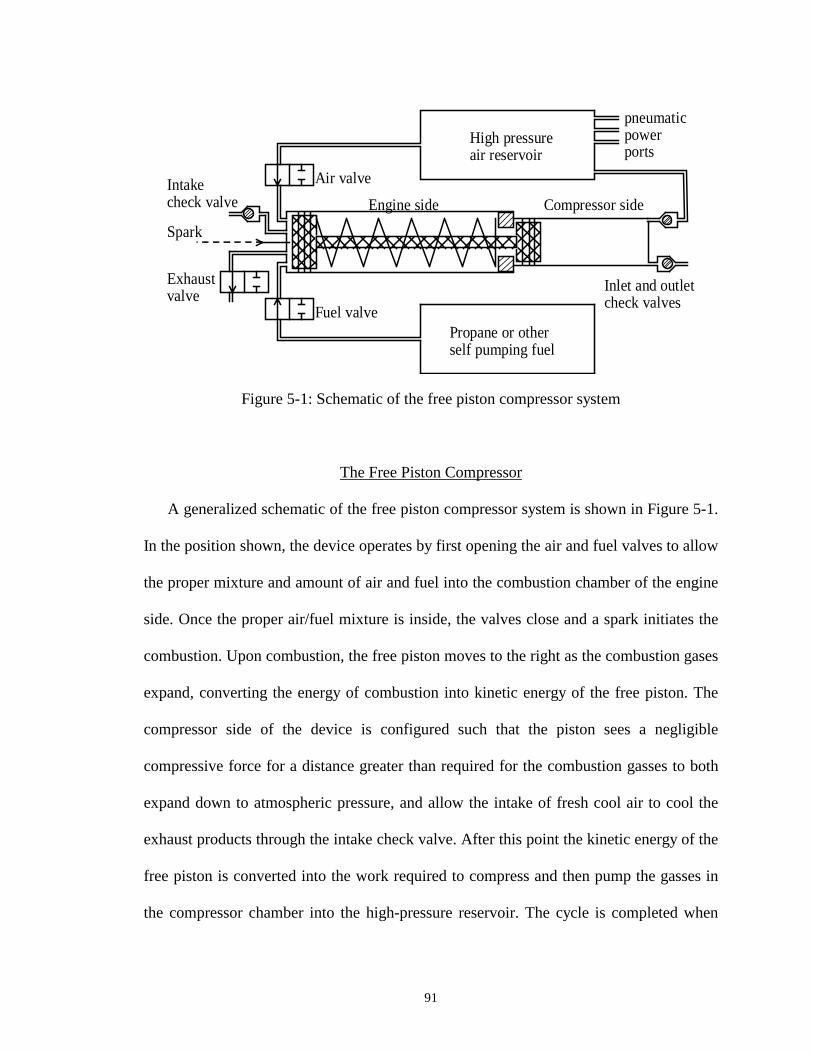
91
Intakecheck valve
Spark
Exhaustvalve
Fuel valvePropane or otherself pumping fuel
Air valve
High pressureair reservoir
pneumaticpowerports
Engine side Compressor side
Inlet and outletcheck valves
Figure 5-1: Schematic of the free piston compressor system
The Free Piston Compressor
A generalized schematic of the free piston compressor system is shown in Figure 5-1.
In the position shown, the device operates by first opening the air and fuel valves to allow
the proper mixture and amount of air and fuel into the combustion chamber of the engine
side. Once the proper air/fuel mixture is inside, the valves close and a spark initiates the
combustion. Upon combustion, the free piston moves to the right as the combustion gases
expand, converting the energy of combustion into kinetic energy of the free piston. The
compressor side of the device is configured such that the piston sees a negligible
compressive force for a distance greater than required for the combustion gasses to both
expand down to atmospheric pressure, and allow the intake of fresh cool air to cool the
exhaust products through the intake check valve. After this point the kinetic energy of the
free piston is converted into the work required to compress and then pump the gasses in
the compressor chamber into the high-pressure reservoir. The cycle is completed when
92
the light return spring moves the piston to the left pushing out the diluted exhaust
products of the engine side, and refilling the compressor side with air drawn in through
an inlet check valve.
Besides advantages regarding efficiency related to inertial loading, the free piston
compressor offers on-demand start and stop (since there is no compression stroke in the
engine side), cool operation (given that the combustion products are greatly diluted with
air after expanding down below atmospheric pressure), quiet operation (given that there
is no exhaust of high-pressure gasses), and simplicity. These characteristics are achieved
due to the following main features of the FPC:
Inertial Loading – The free piston is not rigidly attached to a crankshaft or any timing
linkage alike, so it offers purely inertial loading to the expanding combustion gasses. This
allows the free piston to store as kinetic energy the work done by the ideal adiabatic
expansion of the combustion gasses. The combustion gasses are allowed to expand until
they reach atmospheric pressure, all while still contributing to the inertial loading. This
full expansion contributes to a higher efficiency than if full expansion were not allowed
as is the case with most small-scale IC engines (Figure 5-2). Typical IC engines (large-
scale or small-scale) are required to provide a high immediate output power profile in
their design specifications, so they are concerned only with extracting the higher-power
portion of the combustion curve, while wastefully exhausting the rest. The FPC, on the
other hand, is independent from the main device’s (e.g. robot) output power, since its
function is only to store potential energy, and therefore it can extract the lower-power
portion of the P-V curve as well. As an additional consequence, the FPC has a quiet
exhaust, since no high-pressure gasses will be exhausted into the atmosphere.
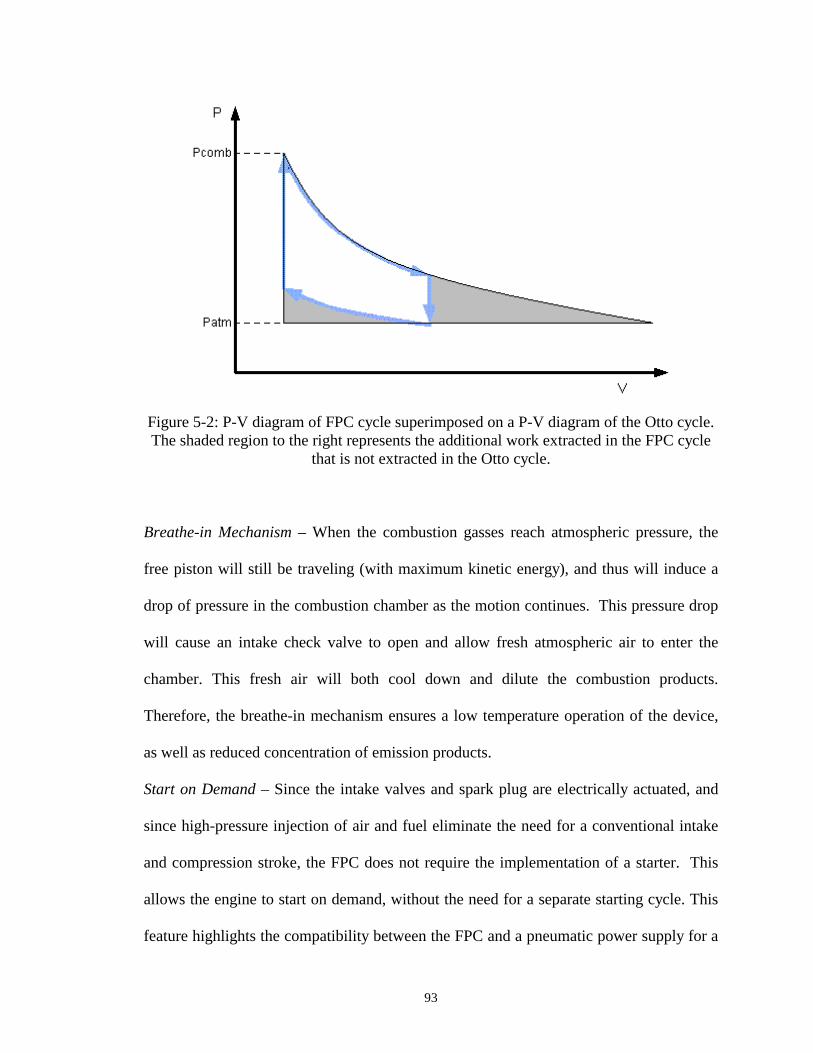
93
Figure 5-2: P-V diagram of FPC cycle superimposed on a P-V diagram of the Otto cycle. The shaded region to the right represents the additional work extracted in the FPC cycle
that is not extracted in the Otto cycle.
Breathe-in Mechanism – When the combustion gasses reach atmospheric pressure, the
free piston will still be traveling (with maximum kinetic energy), and thus will induce a
drop of pressure in the combustion chamber as the motion continues. This pressure drop
will cause an intake check valve to open and allow fresh atmospheric air to enter the
chamber. This fresh air will both cool down and dilute the combustion products.
Therefore, the breathe-in mechanism ensures a low temperature operation of the device,
as well as reduced concentration of emission products.
Start on Demand – Since the intake valves and spark plug are electrically actuated, and
since high-pressure injection of air and fuel eliminate the need for a conventional intake
and compression stroke, the FPC does not require the implementation of a starter. This
allows the engine to start on demand, without the need for a separate starting cycle. This
feature highlights the compatibility between the FPC and a pneumatic power supply for a
94
robotic system, since they can be tied together by implementing a simple control loop to
maintain a particular pressure in the supply reservoir. The FPC would receive a signal
and start operating as soon as the actuation pressure supply drops, and likewise turn off
once reaching the desired pressure.
Theoretical Predictions
Both the thermodynamic and dynamic characteristics of the system were modeled
prior to hardware design. From a thermodynamic analysis, the energetic characteristics of
the FPC are modeled separately by the engine side (combustion) and the pump side
(compression and pumping).
Engine Side
The engine side converts the energy of combustion into kinetic energy of the free
piston, while the compressor side then converts this kinetic energy into stored
compressed gas in the high-pressure reservoir. Presenting a purely inertial load during the
expansion of the combustion products allows the right loading characteristics such that
the high-pressure combustion products are allowed to fully expand down to atmospheric
pressure. When this is the case, and assuming an adiabatic process in the combustion
chamber immediately following combustion, the work done on the inertial load will be
equal to the following,
( ) ( )010
100
1 eefatmeefe
eee VVPVVVPW ee
e
−−−−
= −− γγγ
γ (1)
95
where 0eP is the initial combustion pressure, 0eV and efV are the initial and final volume
of the combustion chamber respectively, eγ is the ratio of specific heats of the
combustion gases (products of combustion), and atmP is the atmospheric pressure.
Assuming losses associated with friction are negligible, the kinetic energy of the piston
will be equal to the work done eW , when reaching the position associated with the final
volume efV . It is shown in [4] that the efficiency of conversion from stored chemical
energy of the fuel to kinetic energy of the free piston is given by,
−−+−
==−
0
0/)1(/1
0
0 )1()1(
ee
atmeeatmeeAFTe
e
eKE P
PPPPeTR
emW eee
γγγη
γγγ
(2)
where 0em is the mass of the fuel/air mixture used for combustion, eR is the average gas
constant of the combustion products, AFTT is the adiabatic flame temperature of
combustion, and e is the mass specific energy of the fuel/air mixture computed as the
following for the air supported combustion of propane:
mixturefuel/air kg
J 000,787,2mixturefuel/air kg 16.63
fuel kg 1fuel kg
kJ 46350 =×=e (3)
Compressor Side and Reservoir The compressor side of the FPC holds two separate processes: firstly, the
adiabatic (or polytropic) compression of air, and secondly, the constant pressure process
of pumping the air into the high-pressure reservoir. As shown in [4], the work associated
with the adiabatic compression process and the constant pressure pumping process are
given by the following,
( ) ( )010
101 1 cciatmcci
catmc VVPVVVPW −−−
−= −− γγ
γ
γ (4a)
96
( )( )cicfatmsc VVPPW −−=2 (4b)
where γ is the ratio of specific heats of air, and 0cV and ciV are the initial volume of the
compression chamber where compression begins, and the intermediary volume where
pumping begins, respectively. cfV is the final volume of the compressor side (i.e. the
dead volume of the cylinder not able to be pumped out), and is approximated as zero. At
the intermediary volume ciV , the air is at a temperature ciT and is being pumped at the
constant pressure sP , which is the pressure in the air reservoir. Once the air is in the
reservoir, and assuming that the reservoir is large, at constant pressure, and that the
residence time of the air is large, this air will cool to the ambient temperature, ambT , and
undertake its final partial volume, fV . At this point, the compressed air will take its final
form as stored pneumatic potential energy, which, if considered to be its capacity to
perform adiabatic work (i.e. in a pneumatic actuator), is given by,
−
−=
−
11
1γγ
γ atm
sfsstored P
PVPE (5)
Since the mass of air is the same at 0cV , ciV and fV , and noting that the pressure and
temperature at 0cV are atmP and ambT , respectively, we can use ideal gas law expressions
to derive the following relationship:
cos
atmf V
PP
V
= (6)
Finally, the efficiency of converting the kinetic energy of the free piston into stored
pneumatic potential energy of compressed air is given by,
97
e
storedPE W
E=η (7)
Mass Investment To complete the cycle, the mass of air utilized from the reservoir to support the
combustion process must be taken into account. Since the energy stored is proportional to
the mass in the reservoir, the investment of air mass needed for the combustion, as shown
in [4], can be expressed as the following efficiency:
AFTecatm
ambee
c
ecinvest TRVP
RTVPm
mm
0
00063.1663.15
63.1663.151−=
−=η (8)
where the functionally constrained volume ratio of initial combustion chamber volume to
initial compressor chamber volume, 00 / ce VV , is shown in [4] to be:
−+−
−
−
−=
−
−
0
1
0
0
1
0
0
)1(1)1(
1)1(
e
atme
e
atme
e
e
s
atmatm
c
e
PP
PPP
PPP
VV
e
e
γγγ
γγ
γγ
γγ
(9)
System Efficiency The overall efficiency of the system can be found by multiplying the individual
efficiencies regarding the conversion of energy released in combustion to kinetic energy
of the free piston, KEη , the conversion of kinetic energy to energy stored in the reservoir
at ambient temperature, PEη , and the efficiency related to the required investment of
reservoir air to the combustion event, investη . By multiplying Equations (2), (7) and (8),
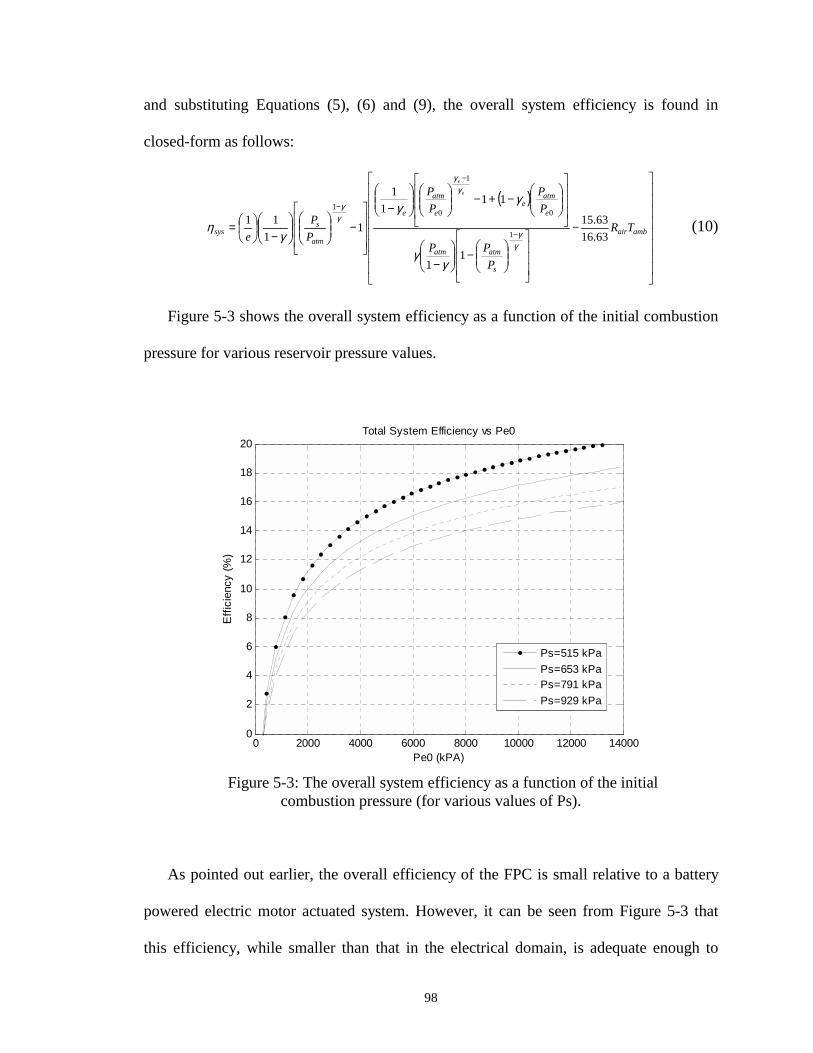
98
and substituting Equations (5), (6) and (9), the overall system efficiency is found in
closed-form as follows:
( )
−
−
−
−+−
−
−
−
=−
−
−
ambair
s
atmatm
e
atme
e
atm
e
atm
ssys TR
PPP
PP
PP
PP
e
e
e
63.1663.15
11
111
1
11
111
0
1
01
γγ
γγ
γγ
γγ
γγ
γη (10)
Figure 5-3 shows the overall system efficiency as a function of the initial combustion
pressure for various reservoir pressure values.
0 2000 4000 6000 8000 10000 12000 140000
2
4
6
8
10
12
14
16
18
20
Pe0 (kPA)
Effi
cien
cy (%
)
Total System Efficiency vs Pe0
Ps=515 kPaPs=653 kPaPs=791 kPaPs=929 kPa
Figure 5-3: The overall system efficiency as a function of the initial
combustion pressure (for various values of Ps).
As pointed out earlier, the overall efficiency of the FPC is small relative to a battery
powered electric motor actuated system. However, it can be seen from Figure 5-3 that
this efficiency, while smaller than that in the electrical domain, is adequate enough to
99
provide at least an order of magnitude greater total system energy density by exploiting
the high energy density of a hydrocarbon fuel.
While a thermodynamic model was developed to model the total system efficiency, a
dynamic model was likewise obtained in order to characterize the time-based behavior of
the system.
Dynamic Model of the Engine Side
Immediately following combustion, the pressure and temperature dynamics in the
combustion side are determined by the following power balance:
eeee WQHU DDDD −+= (11)
where eUD is the rate of internal energy stored in the control volume comprising the
combustion chamber, eHD is the rate of enthalpy crossing the CV boundary, eQD is the heat
flux rate into or out the CV, and eWD is the work rate. Assuming an ideal gas, the rate of
internal energy storage is given by the following two relationships,
)(1
1eeee
eeveeeveee VPVPTcmTcmU DDDDD +
−=+=
γ (12)
where emD is the mass flow rate of gas entering (positive values) or exiting (negative
values) the combustion chamber, vec and eγ are the constant-volume heat capacity and
ratio of specific heats, respectively, of the gas in the combustion chamber, and eP , eV and
eT are the pressure, volume, and temperature, respectively, of the combustion chamber.
The values of vec and eγ must in general be found from the appropriately weighted
100
average of the temperature dependent values of pc of the species contained within the
chamber. The enthalpy rate of energy entering or exiting the control volume is given by,
outinoutinpee TcmH //,DD = (13)
where outinpc /, is the constant-pressure heat capacity of the gas entering or exiting the
combustion chamber, and outinT / is the temperature of the mass entering or exiting the
chamber. If it is assumed that the engine side is adiabatic, then 0=eQC . The work rate is
given as:
eee VPW CC = (14)
The operation of the “engine side” of the device can be considered in three phases:
the work phase (described below), and the intake and exhaust phases (described
thoroughly in [4]).
During the work phase, no mass flow occurs and Equations (1-6) reduce to the
following relationships regarding the pressure and temperature dynamics inside the
combustion chamber:
e
eeee V
VPPD
Dγ−
= (15)
vee
eee cm
VPT0
DD
−= (16)
The work phase persists while cvdatme PPP −> where cvdP represents the minimum
pressure difference necessary to open the intake check valve.
101
The dynamics in the engine side and the compressor side are related to each other
through the movement of the free piston. Neglecting viscous and Coulomb friction, the
dynamics of motion of the free piston are given by,
scatmceatme FAPPAPPxM −−−−= )()(DD (17)
where M is the mass of the free piston, eA and cA are the areas on the piston on the
engine and compressor side respectively, x is the displacement of the piston assembly as
denoted in Figure 5-1, and sF is the return spring force. The volumes of the combustion
chamber and compressor chamber, and their associated derivatives, are given by the
following:
xAV ee = (18)
)( xlAV ccc −= (19)
where cl is the length of the compressor chamber when 0=x .
A dynamic simulation of the system was performed using Simulink. The
following parameters were used for the simulation: mass of free piston M = 250 g, area of
engine side 2cm 07.5=eA = 5.07 (a diameter of 1 in.), area of compressor side
2cm 85.2=cA (a diameter of 0.75 in.), initial combustion pressure kPa 35480 =eP (500
psig), a constant-force spring with N 09.0=sF , a check valve cracking pressure
kPa 3.2=cvdP (1/3 psi), and a reservoir pressure kPa 653=sP (80 psig). The portion of
the simulation relating the work phase in the combustion chamber with the inertial
dynamics of the free piston is sufficient to model the post-combustion pressure profile
(Figure 5-4). This profile shows that the combustion gasses are allowed to adiabatically
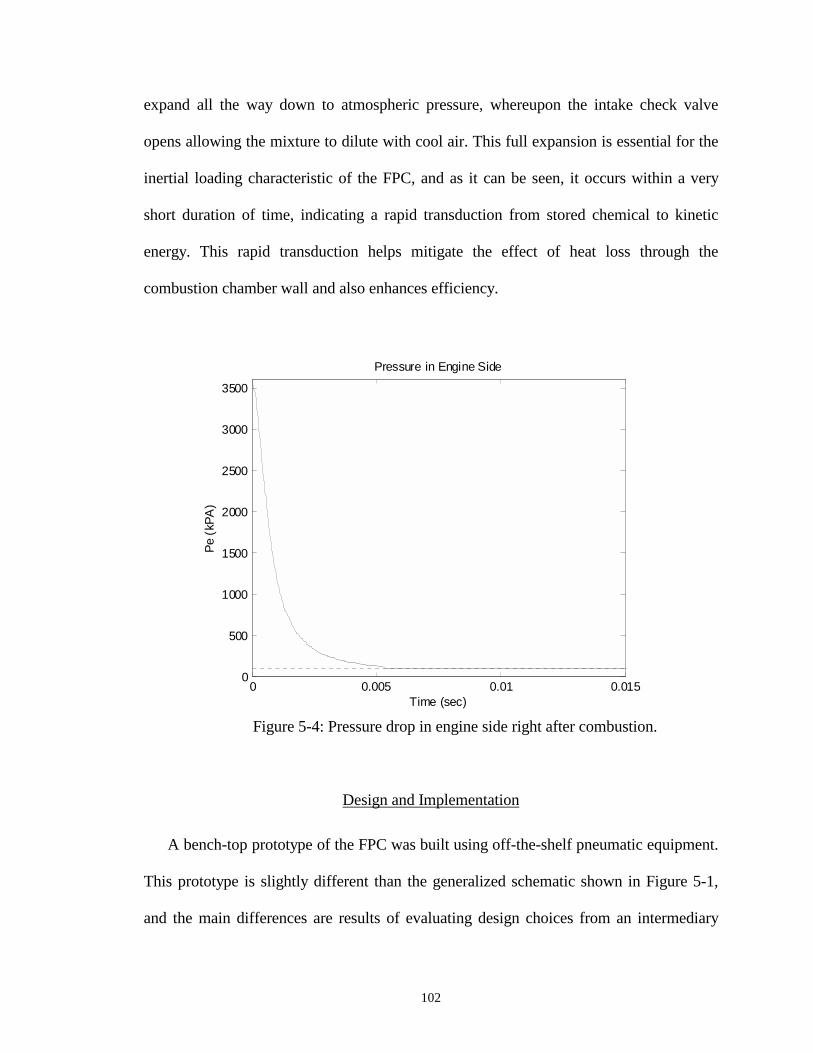
102
expand all the way down to atmospheric pressure, whereupon the intake check valve
opens allowing the mixture to dilute with cool air. This full expansion is essential for the
inertial loading characteristic of the FPC, and as it can be seen, it occurs within a very
short duration of time, indicating a rapid transduction from stored chemical to kinetic
energy. This rapid transduction helps mitigate the effect of heat loss through the
combustion chamber wall and also enhances efficiency.
0 0.005 0.01 0.0150
500
1000
1500
2000
2500
3000
3500
Time (sec)
Pe (
kPA
)
Pressure in Engine Side
Figure 5-4: Pressure drop in engine side right after combustion.
Design and Implementation
A bench-top prototype of the FPC was built using off-the-shelf pneumatic equipment.
This prototype is slightly different than the generalized schematic shown in Figure 5-1,
and the main differences are results of evaluating design choices from an intermediary
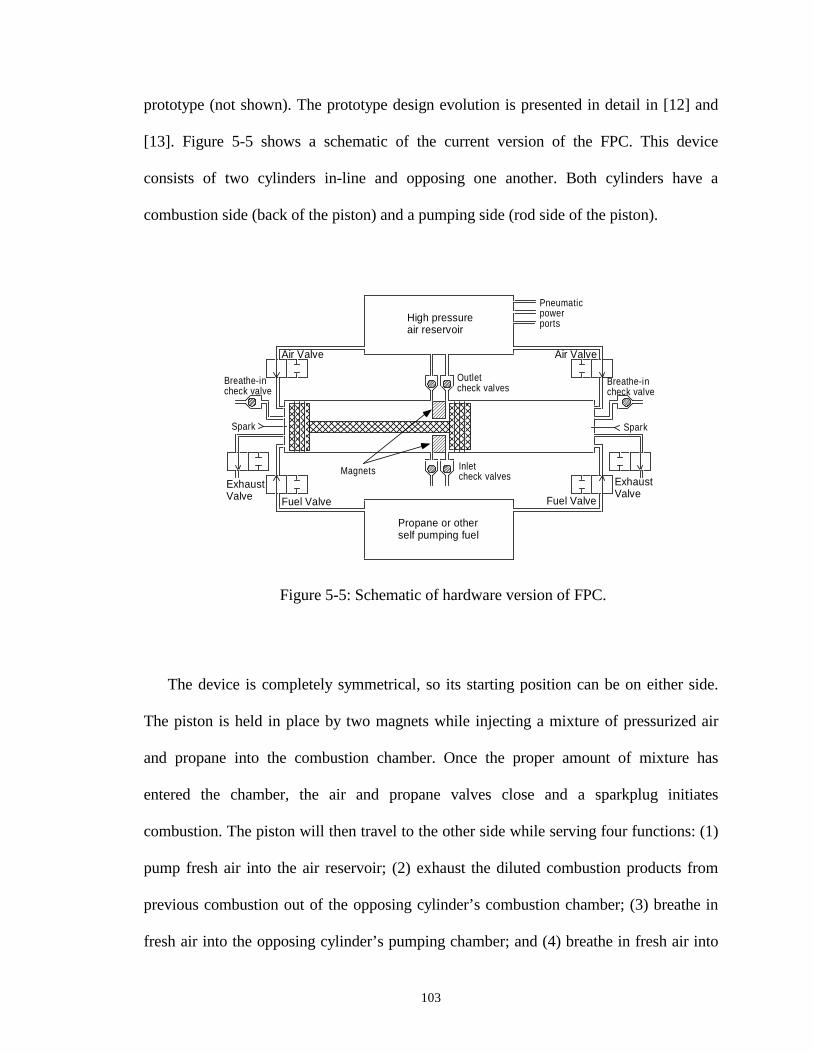
103
prototype (not shown). The prototype design evolution is presented in detail in [12] and
[13]. Figure 5-5 shows a schematic of the current version of the FPC. This device
consists of two cylinders in-line and opposing one another. Both cylinders have a
combustion side (back of the piston) and a pumping side (rod side of the piston).
High pressureair reservoir
Propane or otherself pumping fuel
Fuel Valve Fuel Valve
Air Valve Air Valve
ExhaustValve
ExhaustValve
Pneumaticpowerports
Breathe-incheck valve
Breathe-incheck valve
Spark Spark
Outletcheck valves
Inletcheck valvesMagnets
Figure 5-5: Schematic of hardware version of FPC.
The device is completely symmetrical, so its starting position can be on either side.
The piston is held in place by two magnets while injecting a mixture of pressurized air
and propane into the combustion chamber. Once the proper amount of mixture has
entered the chamber, the air and propane valves close and a sparkplug initiates
combustion. The piston will then travel to the other side while serving four functions: (1)
pump fresh air into the air reservoir; (2) exhaust the diluted combustion products from
previous combustion out of the opposing cylinder’s combustion chamber; (3) breathe in
fresh air into the opposing cylinder’s pumping chamber; and (4) breathe in fresh air into
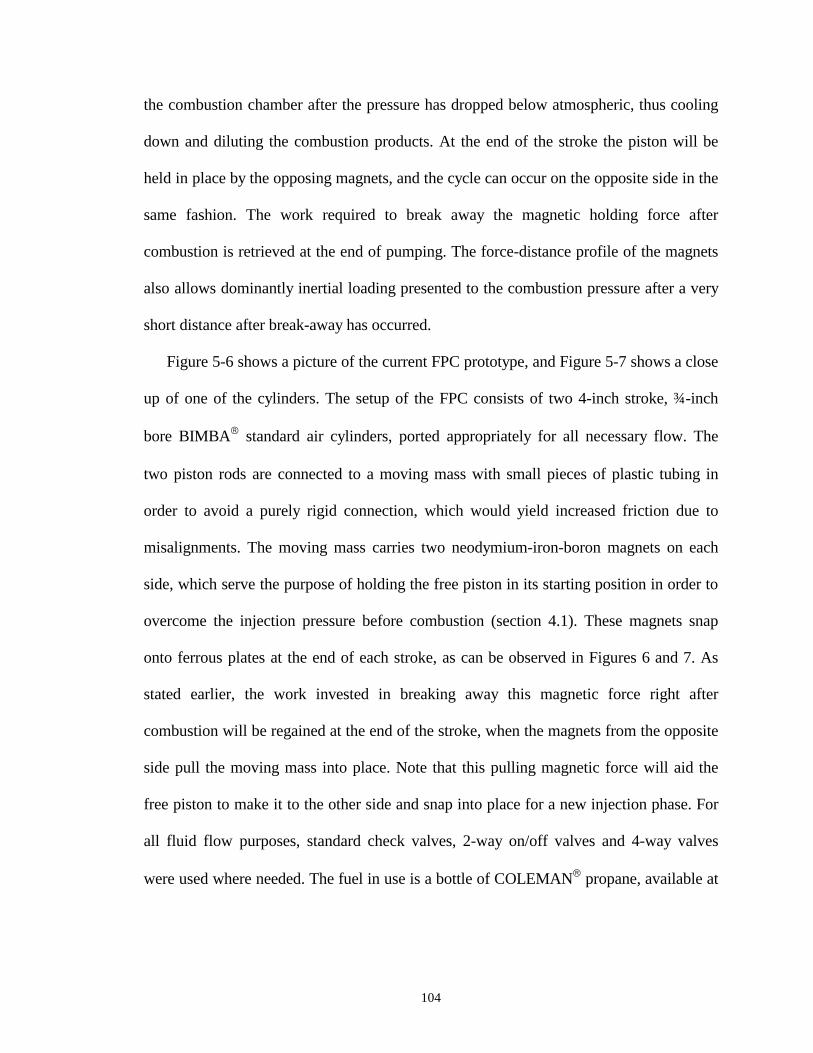
104
the combustion chamber after the pressure has dropped below atmospheric, thus cooling
down and diluting the combustion products. At the end of the stroke the piston will be
held in place by the opposing magnets, and the cycle can occur on the opposite side in the
same fashion. The work required to break away the magnetic holding force after
combustion is retrieved at the end of pumping. The force-distance profile of the magnets
also allows dominantly inertial loading presented to the combustion pressure after a very
short distance after break-away has occurred.
Figure 5-6 shows a picture of the current FPC prototype, and Figure 5-7 shows a close
up of one of the cylinders. The setup of the FPC consists of two 4-inch stroke, ¾-inch
bore BIMBA� standard air cylinders, ported appropriately for all necessary flow. The
two piston rods are connected to a moving mass with small pieces of plastic tubing in
order to avoid a purely rigid connection, which would yield increased friction due to
misalignments. The moving mass carries two neodymium-iron-boron magnets on each
side, which serve the purpose of holding the free piston in its starting position in order to
overcome the injection pressure before combustion (section 4.1). These magnets snap
onto ferrous plates at the end of each stroke, as can be observed in Figures 6 and 7. As
stated earlier, the work invested in breaking away this magnetic force right after
combustion will be regained at the end of the stroke, when the magnets from the opposite
side pull the moving mass into place. Note that this pulling magnetic force will aid the
free piston to make it to the other side and snap into place for a new injection phase. For
all fluid flow purposes, standard check valves, 2-way on/off valves and 4-way valves
were used where needed. The fuel in use is a bottle of COLEMAN� propane, available at
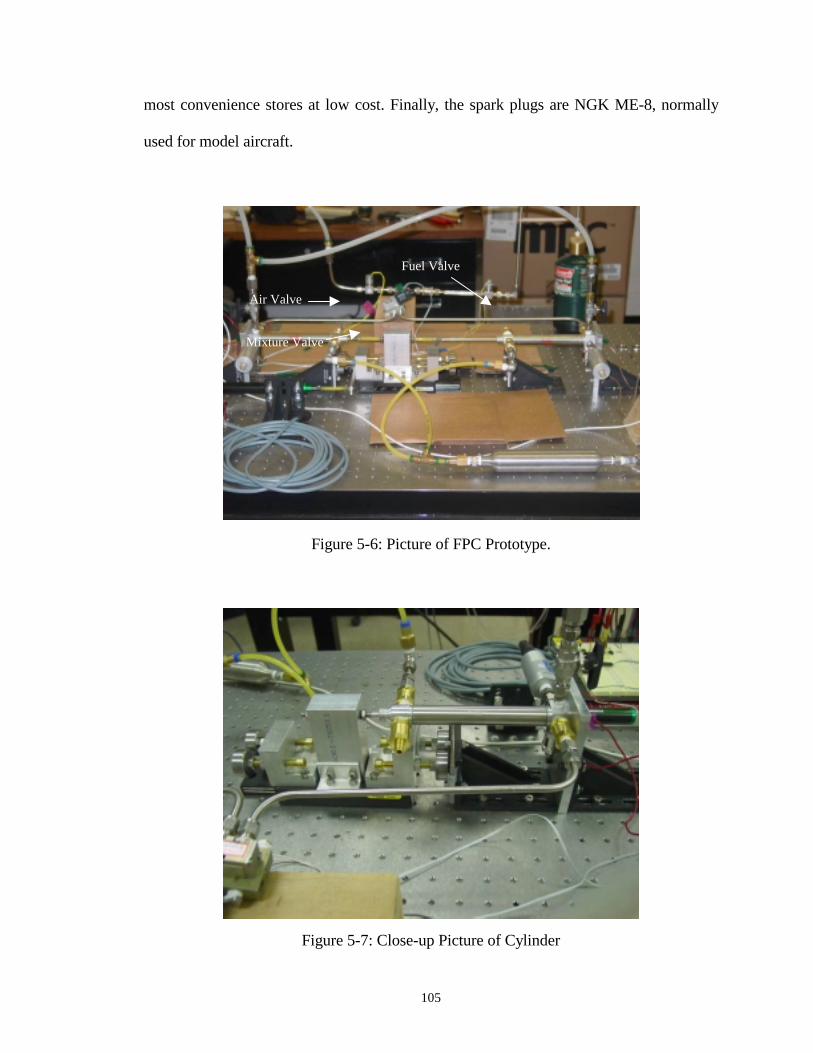
105
most convenience stores at low cost. Finally, the spark plugs are NGK ME-8, normally
used for model aircraft.
Figure 5-6: Picture of FPC Prototype.
Figure 5-7: Close-up Picture of Cylinder
Fuel Valve
Air Valve
Mixture Valve
106
Injection Pressure
In order to obtain desirable combustion characteristics, it is mentioned in [4] that the
injection pressure of the air/fuel mixture needs to be adequate enough to achieve the
target initial combustion pressure. This minimum injection pressure requirement is given
by,
0eAFTe
injreacinj P
TRTR
P
= (20)
where reacR and eR are the average gas constants of the reactants and combustion
products, respectively; injT and AFTT are the temperature immediately preceding
combustion and adiabatic flame temperature, respectively; and 0eP is the initial
combustion pressure needed such that the FPC extracts enough work to pump all the air
drawn into the compressor cylinders into the high-pressure reservoir. In order to obtain
the appropriate injection pressure that corresponds to such an initial combustion pressure,
the free piston needs to be locked in its initial position during injection. A sufficiently
stiff spring could serve this purpose, but would offer so much resistance upon the
combustion stroke that the desired inertial loading would be spoiled. To overcome this,
the four neodymium-iron-boron magnets were installed to hold the free piston in its
starting position before combustion. The magnetic gap is adjustable by the turn of a
screw, such that the bonding magnetic force can be set just slightly higher than the force
exerted on the free piston by the injection pressure. Additionally, this magnetic force acts
over such a small portion of the total stroke length that its effect against the inertial
loading is negligible once the motion of the piston begins. This implementation of
107
magnets replaces what in a conventional IC engine would be both the intake and
compression strokes.
Mixture Quality
Additionally to injection pressure, proper combustion requires good air/fuel mixture
quality. Ideally, this mixture should match the stoichiometric mass ratio for combustion,
namely 15.67 for air and propane. For complete combustion, it is also imperative that the
mixture is uniform. This type of mixing is not instantaneous, and occurs by diffusion and
any flow mixing present. By injecting the air and propane into the chamber through
separate ports, it would take an unacceptable amount of time for the two substances to
uniformly mix, thus affecting the cycle rate of the system and making it less reliable. As a
solution, the air and propane were first injected into a common flow stream, which
enforced a turbulent enough flow such that the mixture was sufficiently uniform upon
reaching the combustion chamber.
Since one of the main objectives of this paper is to show the total efficiency of the
system from stored chemical energy of propane to stored pneumatic potential energy of
compressed air, it is imperative to be as precise as is reasonably possible with all
measurements. The most difficult, yet one of the most important measurements to
determine, is the mass of propane used for combustion. Knowing this mass and the
energy density of propane, the total amount of initial energy can be determined and
compared to the potential energy of compressed air in the reservoir.
108
Measuring the Mass of Propane
As shown in Figure 5-6, the air/fuel mixture enters the chamber by controlled opening
and closing of the air, fuel and mixture valves. The air and fuel valves are timed such that
a stoichiometric mixture exists within a common mixing line at the exit of both valves.
This mixture is then admitted to one of the two combustion chambers via a three-way
mixture valve. The air and fuel valves are Parker� Series-9 valves, and operate as two-
way on/off valves. The nominal response time of these valves is 12 ms, while their
commanded opening times for this application will range between 8-12 ms for propane
and 50-80 ms for air. A mass flow meter could not be used to determine the mass of
propane flowing because these are small pulses, and not steady flows. Also, since the
propane valve operates at opening times close to the valve response time, the small pulse
flow dynamics would not be similar to the steady flow dynamics. The mass was instead
calculated by injecting propane into an inverted graduated cylinder of a beaker with
water, and observing the water displacement in the cylinder for various durations of the
commanded opening pulse sent to the fuel valve. This was done for 8, 9, and 10 ms
pulses, and each one was performed several times to obtain an average. The standard
deviation of measured displaced water for each pulse duration was very close to the
readability of the scale. The same was done for the air, in order to find stoichiometric
values based on air and fuel valve opening times. It should be noted that this match of
opening times yields accurate stoichiometric mixtures only if flowing into atmospheric
pressure. A method to obey this restriction during operation is discussed below.
For precise data acquisition purposes, the engine was run only in single fire shots.
Before each fire, the exhaust port and mixture valve was opened, and the fuel and air
109
valves opened for specific durations previously determined to yield a stoichiometric
mixture. This was done several times such that the entire mixing line would contain a
precise air-fuel ratio. The exhaust port was then closed and some of the stoichiometric
air/fuel mixture remaining in the mixture line was pushed into the combustion chamber,
by opening the mixture valve, until reaching the desired injection pressure. It was ensured
that the mixing line was long enough such that only a portion of the line was required for
injection, and thus maintaining a proper mixture. The fuel injection process can be
considered an adiabatic compression; thus, we can consider the following relationship:
mixmixeinjlineatm VPVP γγ0= (21)
where lineV is the partial volume of the mixture before entering the combustion chamber,
and mixγ is the ratio of specific heats of the air/fuel mixture.
Additionally, by conservation of mass, and assuming an ideal gas, we have:
injmix
einj
ambmix
lineatme TR
VPTRVPm 0
0 == (22)
where 0em and mixR are the mass and average gas constant of the fuel mixture,
respectively, and injT is the injection temperature (immediately preceding combustion).
Combining Equations (21) and (22), the injected mass of fuel can be calculated as:
mix
atm
inj
roommix
atme P
PTR
Pm
γ1
0
= (23)
Adjusting Mixture while Pumping
Ideally, every firing should be strong enough for the piston to just barely make it to
the other side. If combustion is stronger than it needs to be, the piston will carry extra
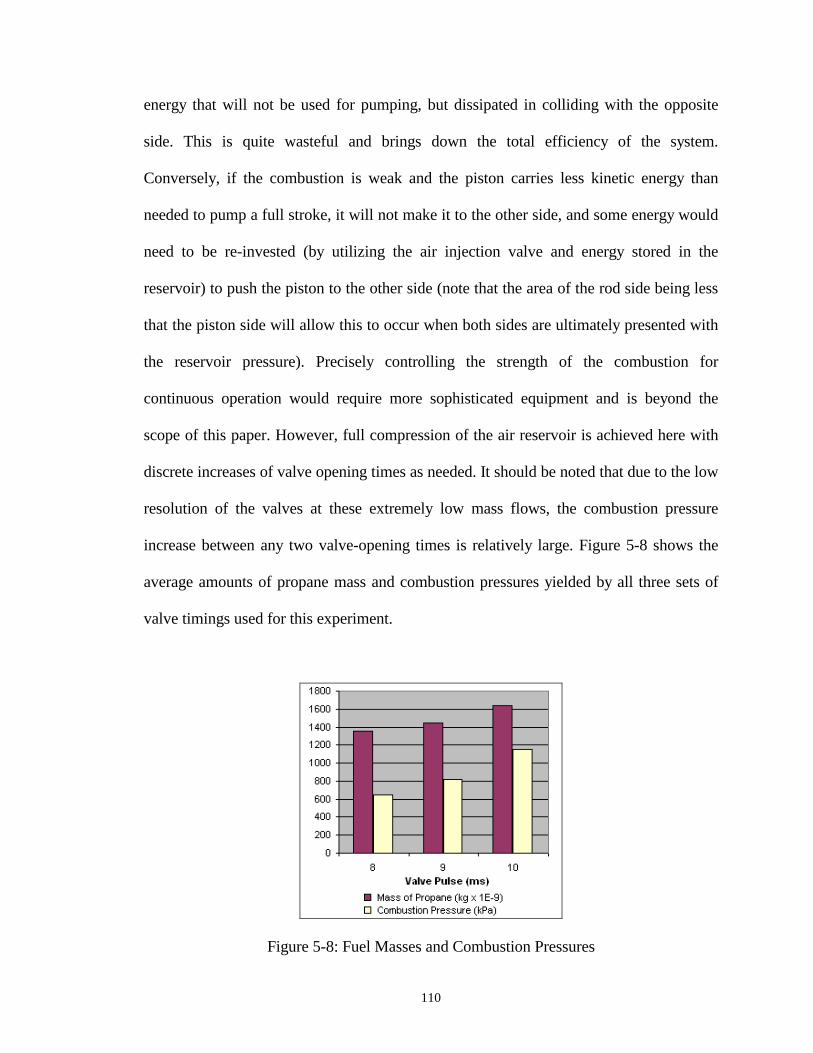
110
energy that will not be used for pumping, but dissipated in colliding with the opposite
side. This is quite wasteful and brings down the total efficiency of the system.
Conversely, if the combustion is weak and the piston carries less kinetic energy than
needed to pump a full stroke, it will not make it to the other side, and some energy would
need to be re-invested (by utilizing the air injection valve and energy stored in the
reservoir) to push the piston to the other side (note that the area of the rod side being less
that the piston side will allow this to occur when both sides are ultimately presented with
the reservoir pressure). Precisely controlling the strength of the combustion for
continuous operation would require more sophisticated equipment and is beyond the
scope of this paper. However, full compression of the air reservoir is achieved here with
discrete increases of valve opening times as needed. It should be noted that due to the low
resolution of the valves at these extremely low mass flows, the combustion pressure
increase between any two valve-opening times is relatively large. Figure 5-8 shows the
average amounts of propane mass and combustion pressures yielded by all three sets of
valve timings used for this experiment.
Figure 5-8: Fuel Masses and Combustion Pressures
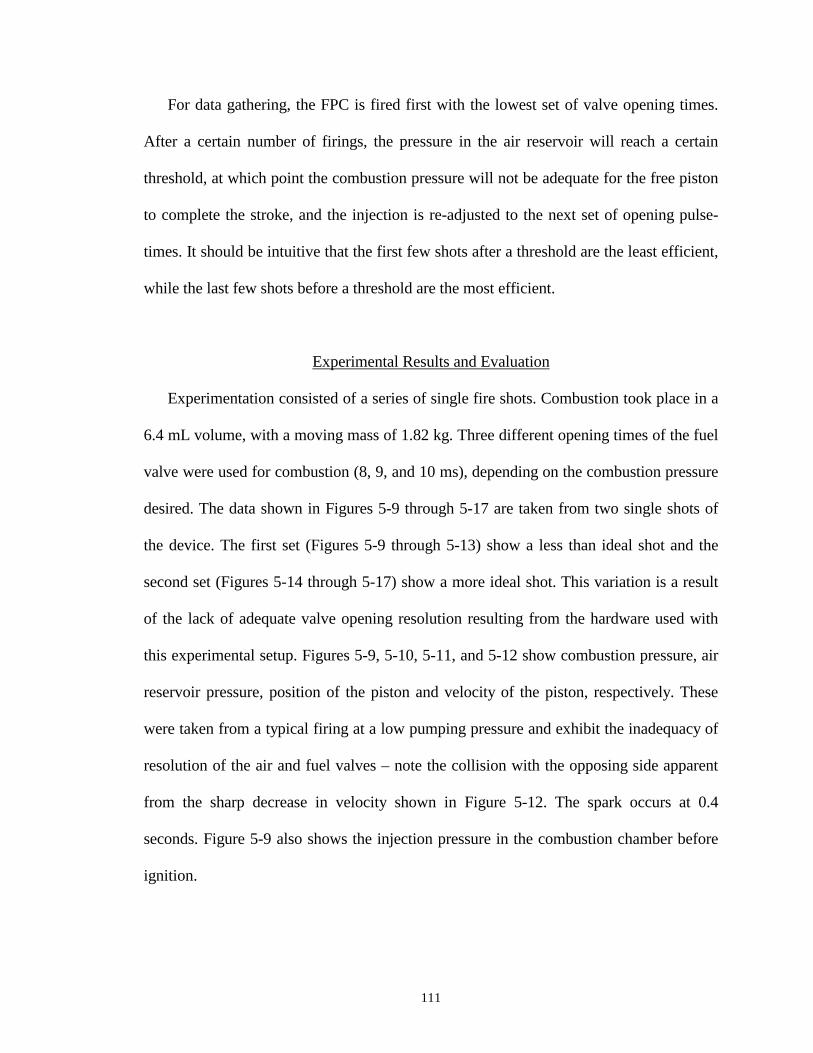
111
For data gathering, the FPC is fired first with the lowest set of valve opening times.
After a certain number of firings, the pressure in the air reservoir will reach a certain
threshold, at which point the combustion pressure will not be adequate for the free piston
to complete the stroke, and the injection is re-adjusted to the next set of opening pulse-
times. It should be intuitive that the first few shots after a threshold are the least efficient,
while the last few shots before a threshold are the most efficient.
Experimental Results and Evaluation
Experimentation consisted of a series of single fire shots. Combustion took place in a
6.4 mL volume, with a moving mass of 1.82 kg. Three different opening times of the fuel
valve were used for combustion (8, 9, and 10 ms), depending on the combustion pressure
desired. The data shown in Figures 5-9 through 5-17 are taken from two single shots of
the device. The first set (Figures 5-9 through 5-13) show a less than ideal shot and the
second set (Figures 5-14 through 5-17) show a more ideal shot. This variation is a result
of the lack of adequate valve opening resolution resulting from the hardware used with
this experimental setup. Figures 5-9, 5-10, 5-11, and 5-12 show combustion pressure, air
reservoir pressure, position of the piston and velocity of the piston, respectively. These
were taken from a typical firing at a low pumping pressure and exhibit the inadequacy of
resolution of the air and fuel valves – note the collision with the opposing side apparent
from the sharp decrease in velocity shown in Figure 5-12. The spark occurs at 0.4
seconds. Figure 5-9 also shows the injection pressure in the combustion chamber before
ignition.
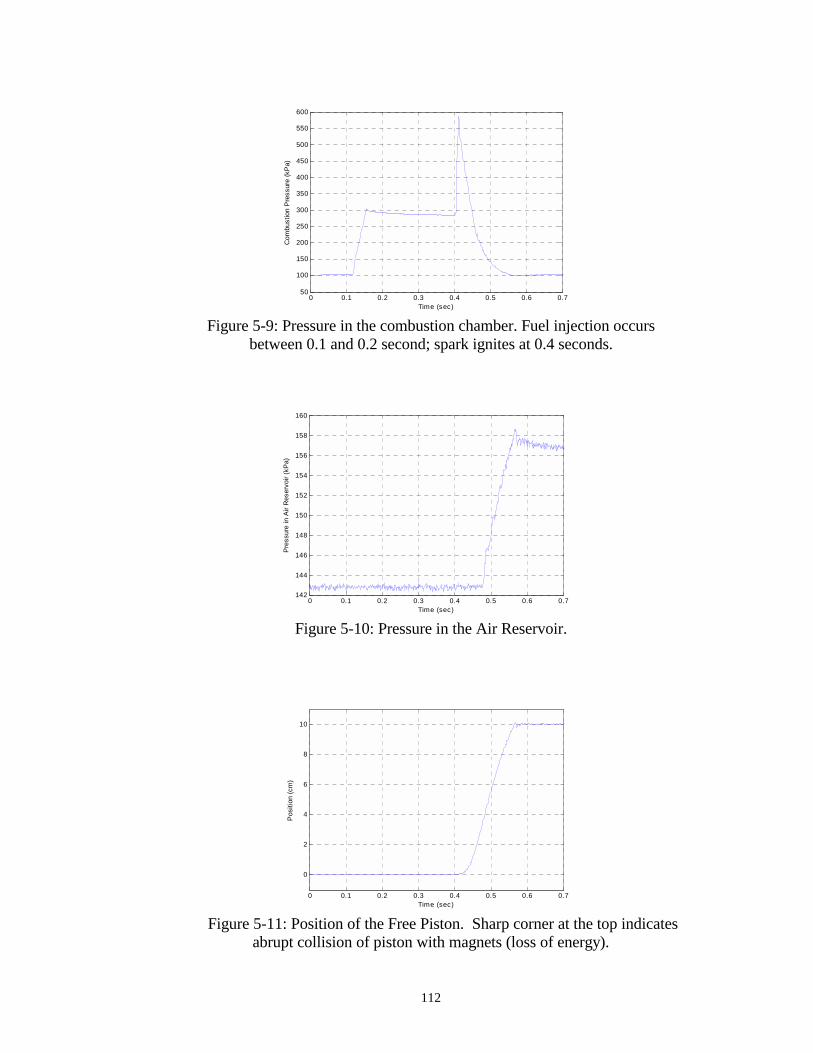
112
0 0.1 0.2 0.3 0.4 0.5 0.6 0.750
100
150
200
250
300
350
400
450
500
550
600
Time (sec)
Com
bust
ion
Pre
ssur
e (k
Pa)
Figure 5-9: Pressure in the combustion chamber. Fuel injection occurs
between 0.1 and 0.2 second; spark ignites at 0.4 seconds.
0 0.1 0.2 0.3 0.4 0.5 0.6 0.7142
144
146
148
150
152
154
156
158
160
Time (sec)
Pre
ssur
e in
Air
Res
ervo
ir (k
Pa)
Figure 5-10: Pressure in the Air Reservoir.
0 0.1 0.2 0.3 0.4 0.5 0.6 0.7
0
2
4
6
8
10
Time (sec)
Pos
ition
(cm
)
Figure 5-11: Position of the Free Piston. Sharp corner at the top indicates
abrupt collision of piston with magnets (loss of energy).
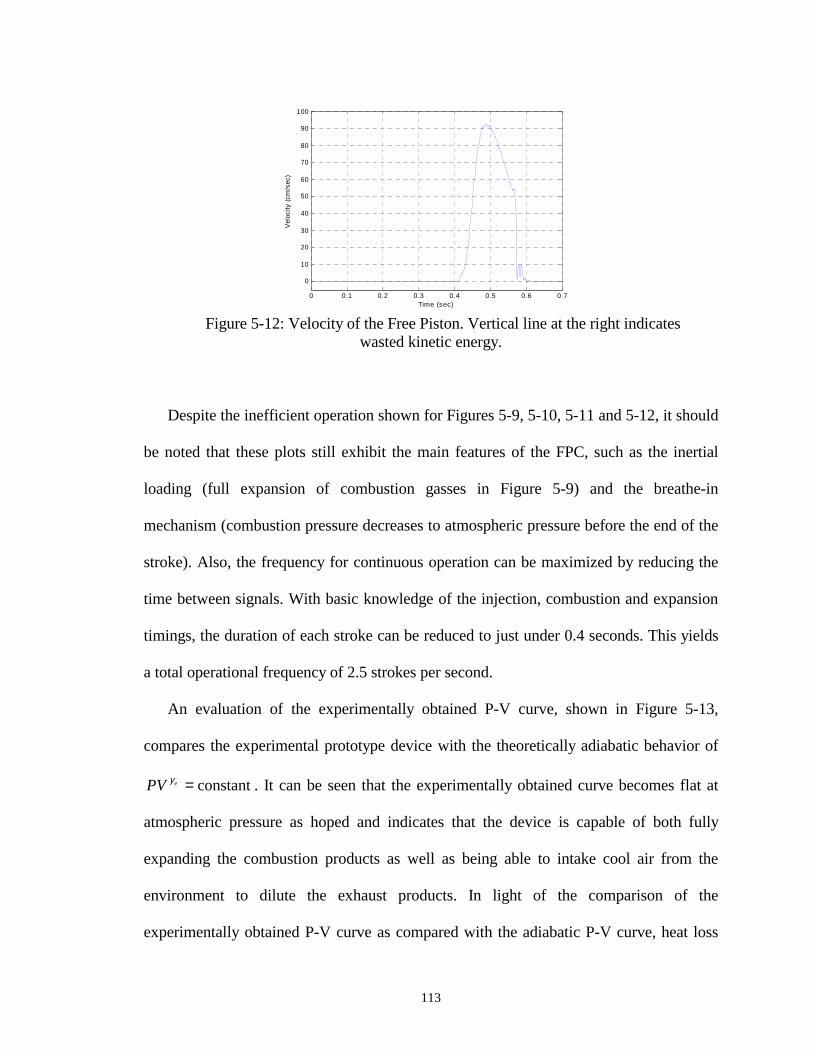
113
0 0.1 0.2 0.3 0.4 0.5 0.6 0.7
0
10
20
30
40
50
60
70
80
90
100
Time (sec)
Vel
ocity
(cm
/sec
)
Figure 5-12: Velocity of the Free Piston. Vertical line at the right indicates
wasted kinetic energy.
Despite the inefficient operation shown for Figures 5-9, 5-10, 5-11 and 5-12, it should
be noted that these plots still exhibit the main features of the FPC, such as the inertial
loading (full expansion of combustion gasses in Figure 5-9) and the breathe-in
mechanism (combustion pressure decreases to atmospheric pressure before the end of the
stroke). Also, the frequency for continuous operation can be maximized by reducing the
time between signals. With basic knowledge of the injection, combustion and expansion
timings, the duration of each stroke can be reduced to just under 0.4 seconds. This yields
a total operational frequency of 2.5 strokes per second.
An evaluation of the experimentally obtained P-V curve, shown in Figure 5-13,
compares the experimental prototype device with the theoretically adiabatic behavior of
constant=ePV γ . It can be seen that the experimentally obtained curve becomes flat at
atmospheric pressure as hoped and indicates that the device is capable of both fully
expanding the combustion products as well as being able to intake cool air from the
environment to dilute the exhaust products. In light of the comparison of the
experimentally obtained P-V curve as compared with the adiabatic P-V curve, heat loss
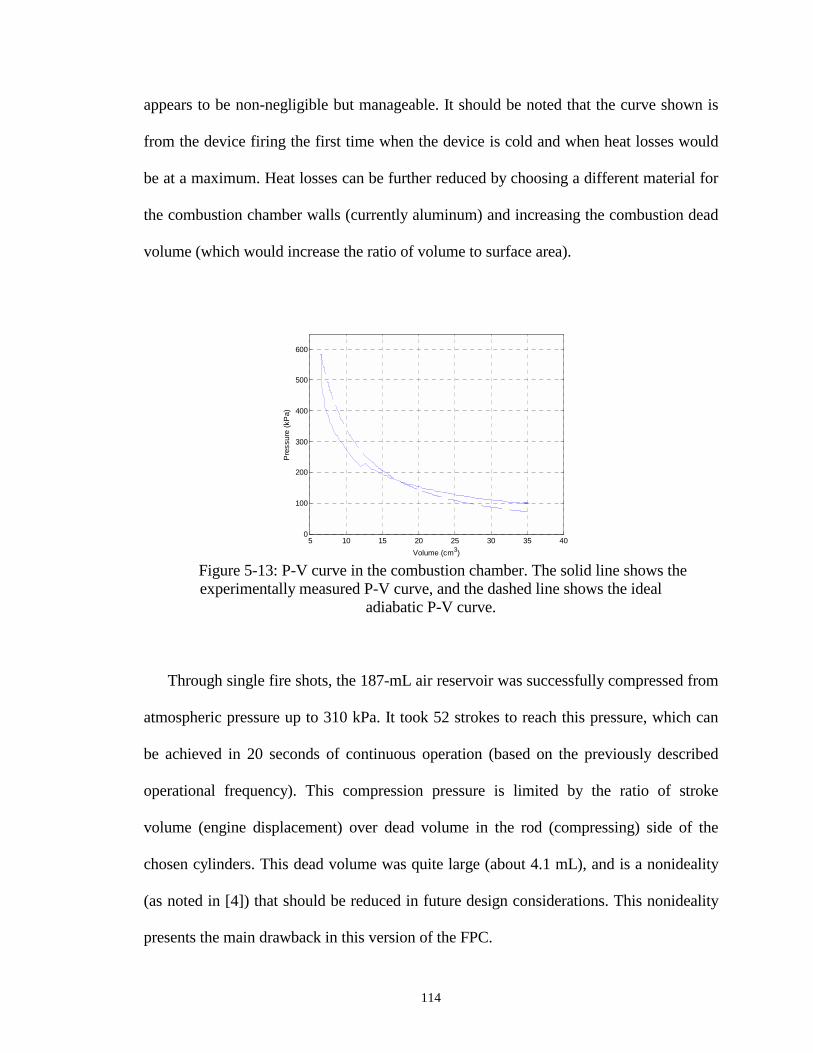
114
appears to be non-negligible but manageable. It should be noted that the curve shown is
from the device firing the first time when the device is cold and when heat losses would
be at a maximum. Heat losses can be further reduced by choosing a different material for
the combustion chamber walls (currently aluminum) and increasing the combustion dead
volume (which would increase the ratio of volume to surface area).
5 10 15 20 25 30 35 400
100
200
300
400
500
600
Volume (cm3)
Pre
ssur
e (k
Pa)
Figure 5-13: P-V curve in the combustion chamber. The solid line shows the experimentally measured P-V curve, and the dashed line shows the ideal
adiabatic P-V curve.
Through single fire shots, the 187-mL air reservoir was successfully compressed from
atmospheric pressure up to 310 kPa. It took 52 strokes to reach this pressure, which can
be achieved in 20 seconds of continuous operation (based on the previously described
operational frequency). This compression pressure is limited by the ratio of stroke
volume (engine displacement) over dead volume in the rod (compressing) side of the
chosen cylinders. This dead volume was quite large (about 4.1 mL), and is a nonideality
(as noted in [4]) that should be reduced in future design considerations. This nonideality
presents the main drawback in this version of the FPC.
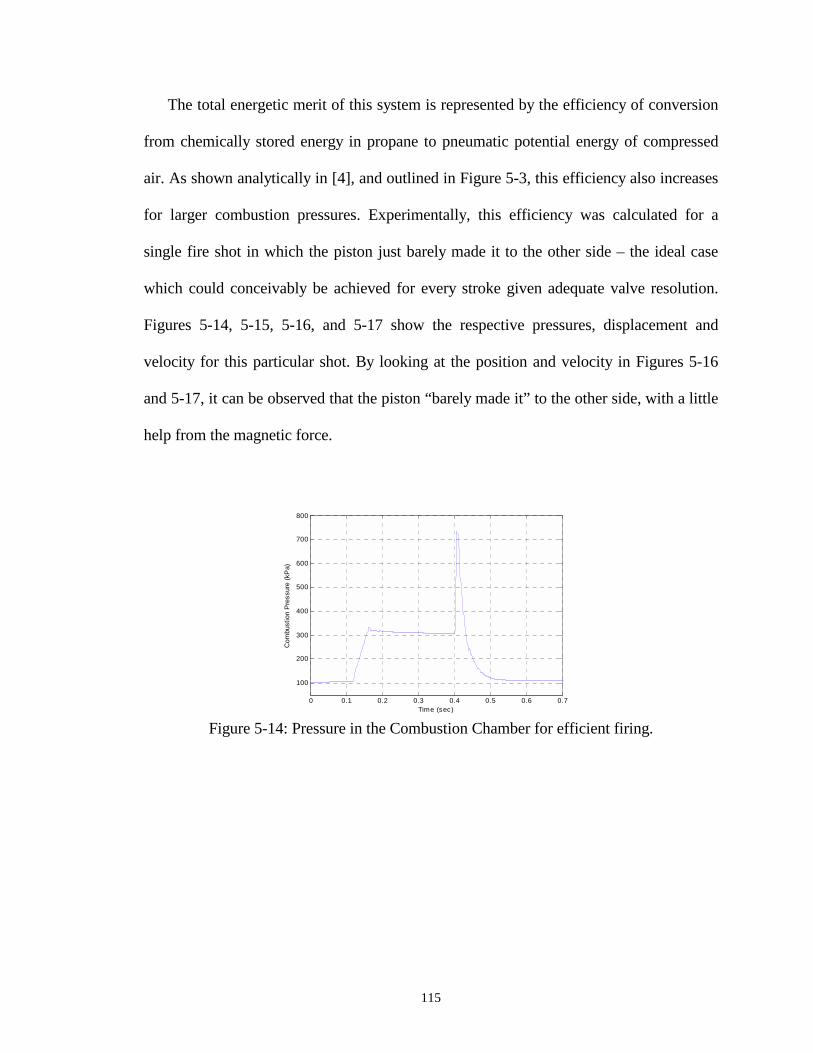
115
The total energetic merit of this system is represented by the efficiency of conversion
from chemically stored energy in propane to pneumatic potential energy of compressed
air. As shown analytically in [4], and outlined in Figure 5-3, this efficiency also increases
for larger combustion pressures. Experimentally, this efficiency was calculated for a
single fire shot in which the piston just barely made it to the other side – the ideal case
which could conceivably be achieved for every stroke given adequate valve resolution.
Figures 5-14, 5-15, 5-16, and 5-17 show the respective pressures, displacement and
velocity for this particular shot. By looking at the position and velocity in Figures 5-16
and 5-17, it can be observed that the piston “barely made it” to the other side, with a little
help from the magnetic force.
0 0.1 0.2 0.3 0.4 0.5 0.6 0.7
100
200
300
400
500
600
700
800
Time (sec)
Com
bust
ion
Pre
ssur
e (k
Pa)
Figure 5-14: Pressure in the Combustion Chamber for efficient firing.
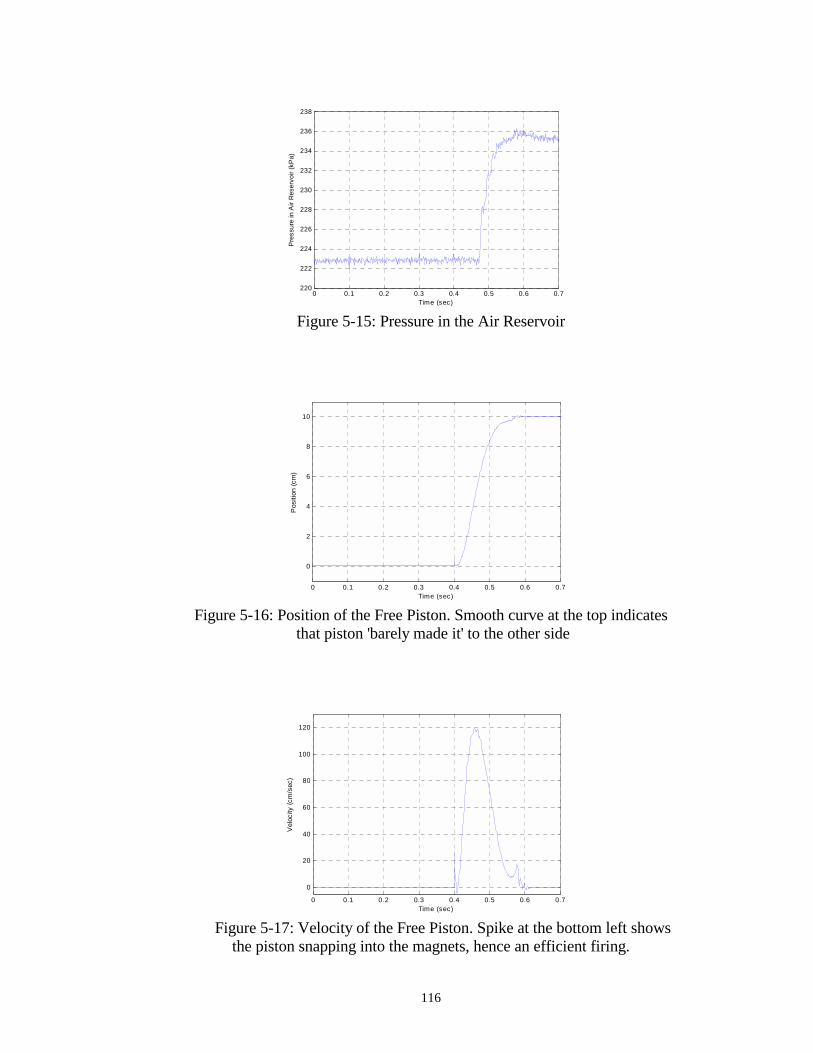
116
0 0.1 0.2 0.3 0.4 0.5 0.6 0.7220
222
224
226
228
230
232
234
236
238
Time (sec)
Pre
ssur
e in
Air
Res
ervo
ir (k
Pa)
Figure 5-15: Pressure in the Air Reservoir
0 0.1 0.2 0.3 0.4 0.5 0.6 0.7
0
2
4
6
8
10
Time (sec)
Pos
ition
(cm
)
Figure 5-16: Position of the Free Piston. Smooth curve at the top indicates
that piston 'barely made it' to the other side
0 0.1 0.2 0.3 0.4 0.5 0.6 0.7
0
20
40
60
80
100
120
Time (sec)
Vel
ocity
(cm
/sec
)
Figure 5-17: Velocity of the Free Piston. Spike at the bottom left shows
the piston snapping into the magnets, hence an efficient firing.
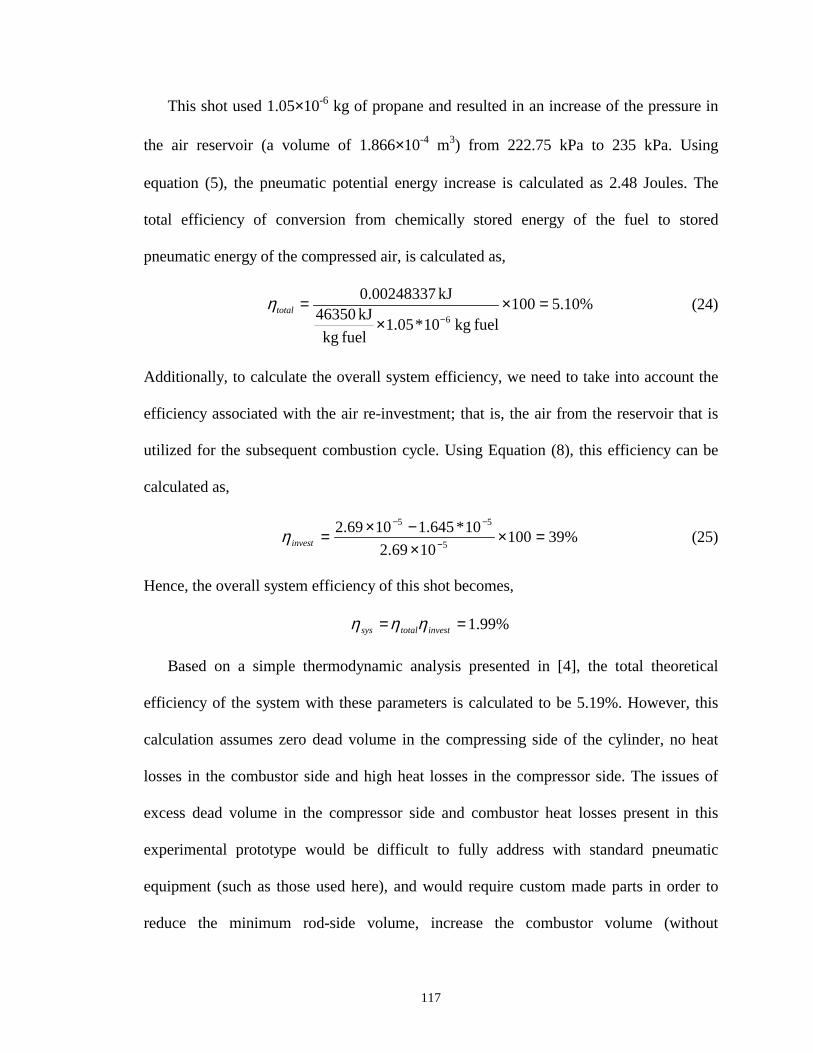
117
This shot used 1.05×10⁻⁶ kg of propane and resulted in an increase of the pressure in
the air reservoir (a volume of 1.866×10⁻⁴ m3) from 222.75 kPa to 235 kPa. Using
equation (5), the pneumatic potential energy increase is calculated as 2.48 Joules. The
total efficiency of conversion from chemically stored energy of the fuel to stored
pneumatic energy of the compressed air, is calculated as,
%10.5100fuel kg 10*05.1
fuel kgkJ 46350
kJ 0.002483376
=××
=−
totalη (24)
Additionally, to calculate the overall system efficiency, we need to take into account the
efficiency associated with the air re-investment; that is, the air from the reservoir that is
utilized for the subsequent combustion cycle. Using Equation (8), this efficiency can be
calculated as,
%391001069.2
10*645.11069.25
55
=××−×= −
−−
investη (25)
Hence, the overall system efficiency of this shot becomes,
%99.1== investtotalsys ηηη
Based on a simple thermodynamic analysis presented in [4], the total theoretical
efficiency of the system with these parameters is calculated to be 5.19%. However, this
calculation assumes zero dead volume in the compressing side of the cylinder, no heat
losses in the combustor side and high heat losses in the compressor side. The issues of
excess dead volume in the compressor side and combustor heat losses present in this
experimental prototype would be difficult to fully address with standard pneumatic
equipment (such as those used here), and would require custom made parts in order to
reduce the minimum rod-side volume, increase the combustor volume (without
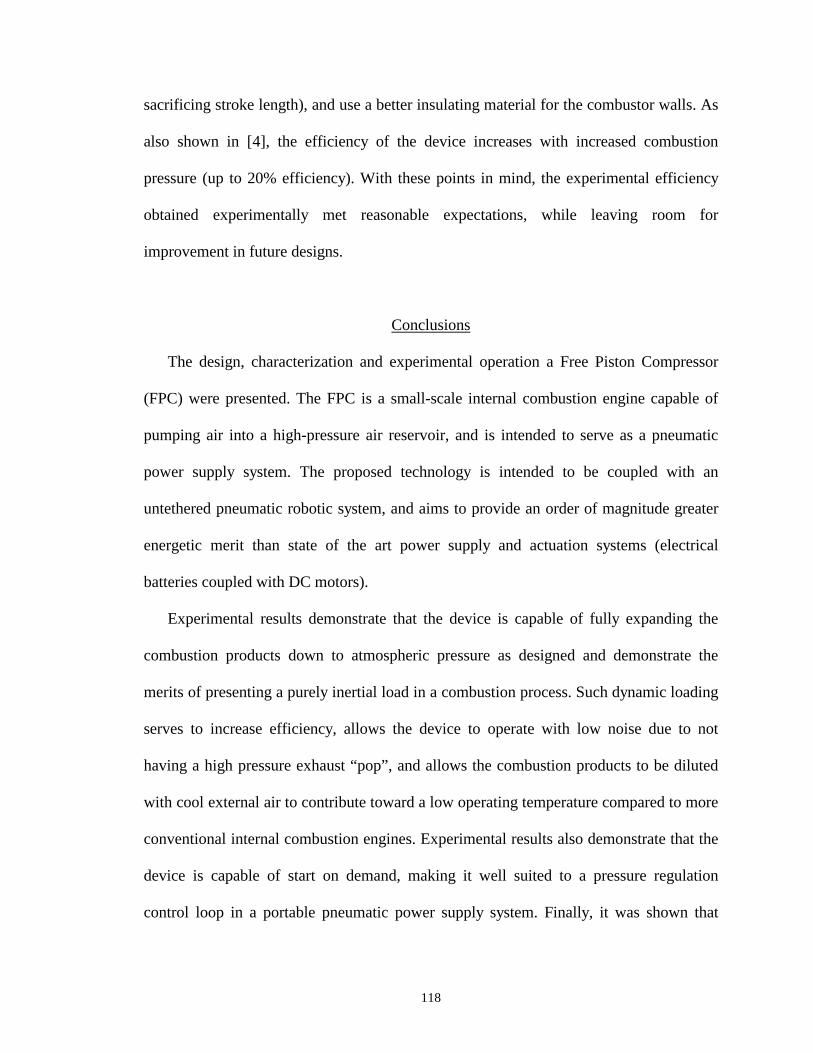
118
sacrificing stroke length), and use a better insulating material for the combustor walls. As
also shown in [4], the efficiency of the device increases with increased combustion
pressure (up to 20% efficiency). With these points in mind, the experimental efficiency
obtained experimentally met reasonable expectations, while leaving room for
improvement in future designs.
Conclusions
The design, characterization and experimental operation a Free Piston Compressor
(FPC) were presented. The FPC is a small-scale internal combustion engine capable of
pumping air into a high-pressure air reservoir, and is intended to serve as a pneumatic
power supply system. The proposed technology is intended to be coupled with an
untethered pneumatic robotic system, and aims to provide an order of magnitude greater
energetic merit than state of the art power supply and actuation systems (electrical
batteries coupled with DC motors).
Experimental results demonstrate that the device is capable of fully expanding the
combustion products down to atmospheric pressure as designed and demonstrate the
merits of presenting a purely inertial load in a combustion process. Such dynamic loading
serves to increase efficiency, allows the device to operate with low noise due to not
having a high pressure exhaust “pop”, and allows the combustion products to be diluted
with cool external air to contribute toward a low operating temperature compared to more
conventional internal combustion engines. Experimental results also demonstrate that the
device is capable of start on demand, making it well suited to a pressure regulation
control loop in a portable pneumatic power supply system. Finally, it was shown that
119
further design work regarding the resolution of the air and fuel valves is needed to secure
decent efficiencies across different reservoir pressures, and further work regarding the
dead volumes in both sides of the piston is needed to increase efficiency.
A measured efficiency of 5.10% was achieved in converting stored chemical energy
of propane into stored pneumatic potential energy. In comparing this power supply
system with state of the art rechargeable batteries, an energy density of 180 kJ/kg for
NiMH batteries and a conversion efficiency of 50% for an electromagnetic motor and
mated gearhead would yield 90 kJ of delivered controlled mechanical work per kilogram
of source energetic material. For the FPC under consideration, an energy density of
46350 kJ/kg for propane, a measured conversion efficiency of 5.10% from stored
chemical to pneumatic energy, a 39% efficiency associated with the computed mass
reinvestment from the air reservoir for the next combustion event, and an assumed
conversion efficiency of 30% from stored pneumatic energy to delivered controlled
mechanical work of an associated pneumatic actuator, would yield 277 kJ of controlled
work per kilogram of source energetic material. This increase, coupled with the equally
important high power density of pneumatic actuators over electromagnetic motors
(approximately 450 W/kg versus 50 W/kg), should contribute to a power supply and
actuation system more appropriate for untethered human scale and power comparable
robots and actuated devices. Table 5-1 below shows an energetic comparison between
conventional rechargeable batteries and the FPC system. It should be noted that the
theoretical conversion efficiency (5.2%) corresponds only to the specific parameters from
the experimental data (combustion pressure and pressure in the air reservoir, namely),
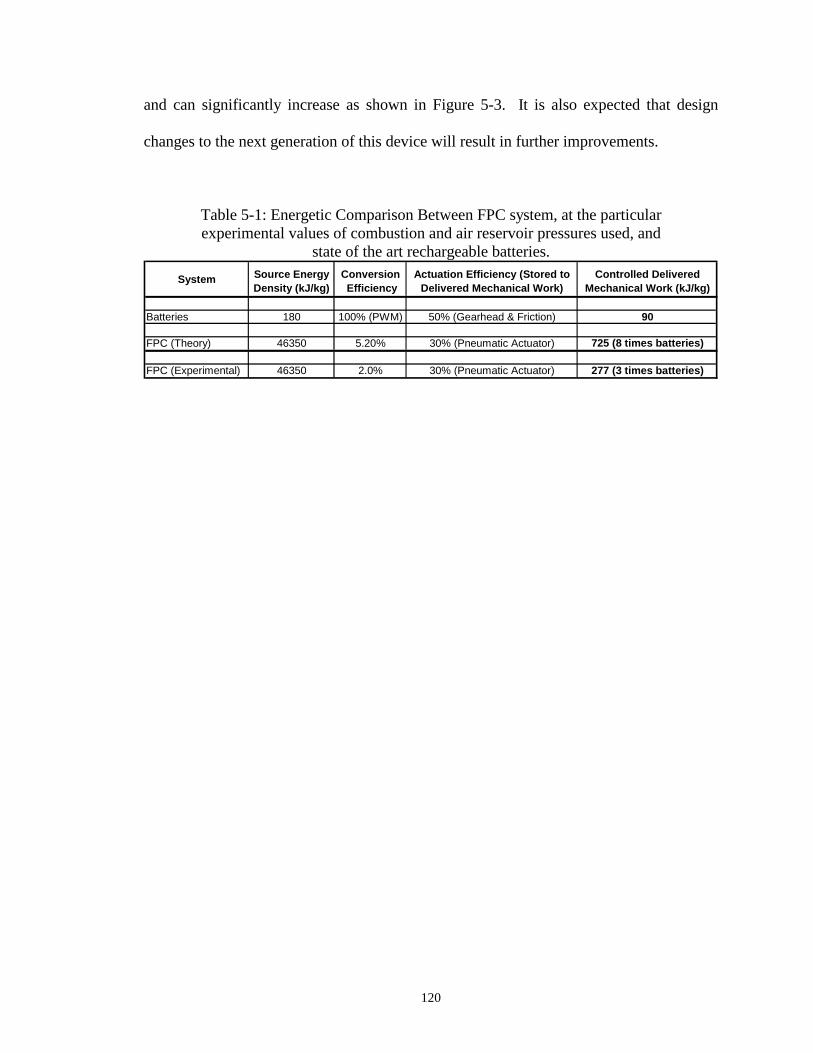
120
and can significantly increase as shown in Figure 5-3. It is also expected that design
changes to the next generation of this device will result in further improvements.
Table 5-1: Energetic Comparison Between FPC system, at the particular experimental values of combustion and air reservoir pressures used, and
state of the art rechargeable batteries.
System Source Energy Density (kJ/kg)
Conversion Efficiency
Actuation Efficiency (Stored to Delivered Mechanical Work)
Controlled Delivered Mechanical Work (kJ/kg)
Batteries 180 100% (PWM) 50% (Gearhead & Friction) 90
FPC (Theory) 46350 5.20% 30% (Pneumatic Actuator) 725 (8 times batteries)
FPC (Experimental) 46350 2.0% 30% (Pneumatic Actuator) 277 (3 times batteries)
121
References
[1] Aichlmayr, H. T., Kittelson, D. B., and Zachariah, M. R., “Miniature free-piston
homogenous charge compression ignition engine-compressor concept – Part I: performance estimation and design considerations unique to small dimensions,” Chemical Engineering Science, 57, pp. 4161-4171, 2002.
[2] Aichlmayr, H. T., Kittelson, D. B., and Zachariah, M. R., “Miniature free-piston
homogenous charge compression ignition engine-compressor concept – Part II: modeling HCCI combustion in small scales with detailed homogeneous gas phase chemical kinetics,” Chemical Engineering Science, 57, pp. 4173-4186, 2002.
[3] Barth, E. J., “Method and System for a Compact Efficient Free Piston Compressor”. Regular U.S. patent application 11/120,128, filed May 2005.
[4] Barth, E. J., and Riofrio, J., “Dynamic Characteristics of a Free Piston Compressor,” 2004 ASME International Mechanical Engineering Congress and Exposition (IMECE), IMECE2004-59594, November 13-19, 2004, Anaheim, CA.
[5] Beachley, N. H. and Fronczak, F. J., “Design of a Free-Piston Engine-Pump,” SAE
Technical Paper Series, 921740, pp. 1-8, 1992. [6] Black, William Z., and James G. Hartley, Thermodynamics, Third Edition, New
York: Harper Collins, 1996. [7] Goldfarb, M., Barth, E. J., Gogola, M. A., Wehrmeyer, J. A., “Design and Energetic
Characterization of a Liquid-Propellant-Powered Actuator for Self-Powered Robots”. IEEE/ASME Transactions on Mechatronics, vol. 8, no. 2, pp. 254-262, June 2003.
[8] Klotsch, P., “Ford Free-Piston Engine Development,” SAE Technical Paper Series,
590045, vol. 67, pp. 373-378, 1959. [9] McGee, T. G., Raade, J. W., and Kazerooni, H., “Monopropellant-Driven Free
Piston Hydraulic Pump for Mobile Robotic Systems,” ASME Journal of Dynamic Systems, Measurement, and Control, vol. 126, pp. 75-81, March 2004.
[10] Nakahara M., Free Piston Kikai-Kouzou to Rekisi, Shinko-Techno Gihou, Vol.13, No.25 & 26 (2001).
[11] Pescara, R. P., “Motor Compressor Apparatus,” U.S. Patent No. 1,657,641, Jan. 31, 1928.
[12] Riofrio, J. A., and Barth, E. J., “Design of a Free Piston Pneumatic Compressor as a
Mobile robot Power Supply,” Proceedings of the 2005 IEEE International
122
Conference on Robotics and Automation (ICRA), pp. 236-241, Barcelona, Spain, April 2005.
[13] Riofrio, J. A., and Barth, E. J., “Experimental Operation and Characterization of a
Free Piston Compressor,” Submitted to the 2005 ASME International Mechanical Engineering Congress and Exposition (IMECE).
[14] Underwood, A. F., “The GMR 4-4 ‘Hyprex’ Engine: A Concept of the Free-Piston
Engine for Automotive Use,” SAE Technical Paper Series, 570032, vol. 65, pp. 377-391, 1957.

APPENDIX A
SIMULINK DIAGRAMS
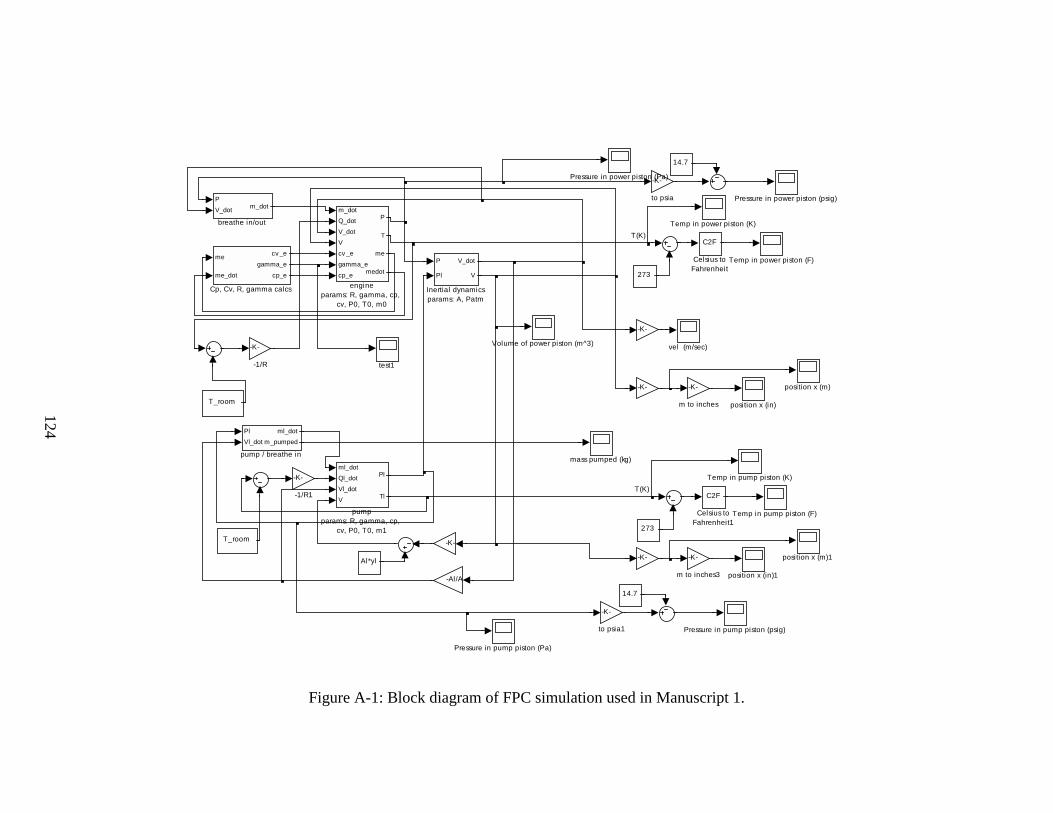
124
Figure A-1: Block diagram of FPC simulation used in Manuscript 1.
T(K)
T(K)
14.7
273
14.7
273
vel (m/sec)
-K-
to psia1
-K-
to psia
test1
Pl
Vl_dot
ml_dot
m_pumped
pump / breathe in
ml_dot
Ql_dot
Vl_dot
V
Pl
Tl
pumpparams: R, gamma, cp,
cv, P0, T0, m1
position x (m)1
position x (m)
position x (in)1
position x (in)
mass pumped (kg)
-K- -K-
m to inches3
-K-
-K- -K-
m to inches
-Al/A
-K-
m_dot
Q_dot
V_dot
V
cv _e
gamma_e
cp_e
P
T
me
medot
engineparams: R, gamma, cp,
cv, P0, T0, m0
P
V_dot m_dot
breathe in/out
Volume of power piston (m^3)
Temp in pump piston (K)
Temp in pump piston (F)
Temp in power piston (K)
Temp in power piston (F)
Pressure in pump piston (psig)
Pressure in pump piston (Pa)
Pressure in power piston (psig)
Pressure in power piston (Pa)
P
Pl
V_dot
V
Inertial dynamicsparams: A, Patm
me
me_dot
cv _e
gamma_e
cp_e
Cp, Cv, R, gamma calcs
T_room
Al*yl
T_room
C2F
Celsius toFahrenheit1
C2F
Celsius toFahrenheit
-K-
-1/R1
-K-
-1/R
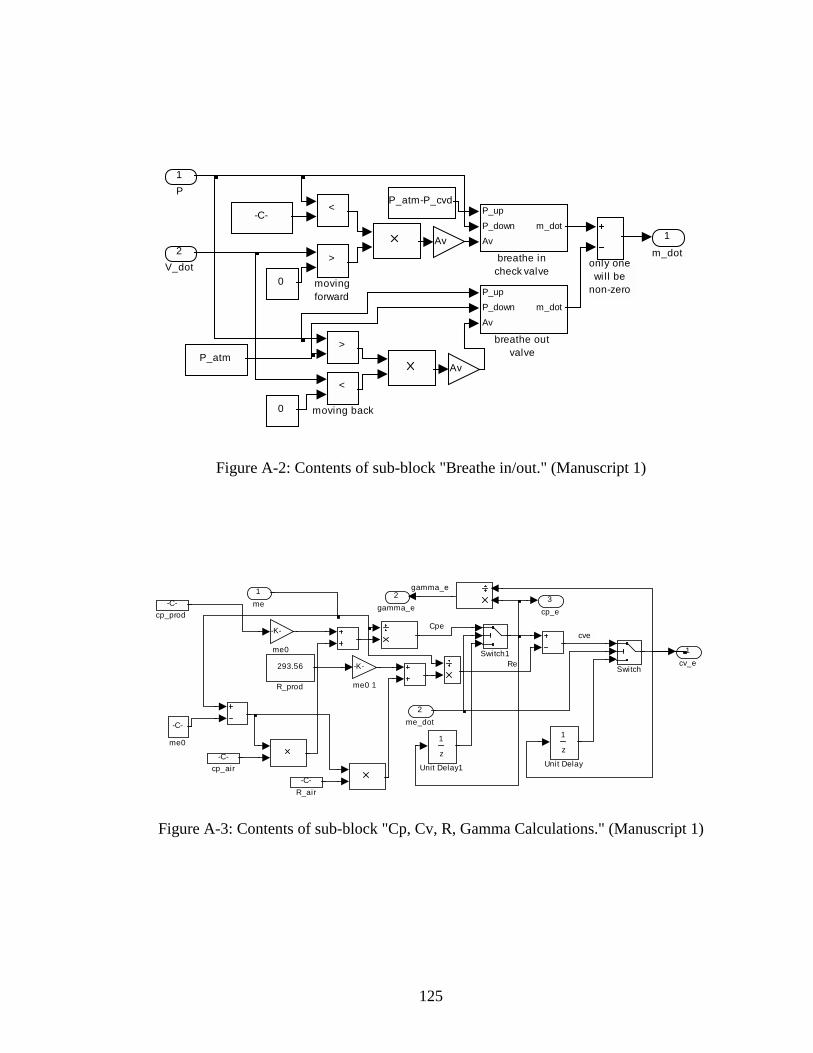
125
only onewill be
non-zero
1
m_dot
<
moving back
>
movingforward
Av
Av
P_upP_down
Av
m_dot
breathe outvalve
P_up
P_downAv
m_dot
breathe incheck valve
>
<
P_atm
0
-C-
0
P_atm-P_cvd
2V_dot
1P
Figure A-2: Contents of sub-block "Breathe in/out." (Manuscript 1)
Cpe
Re
cve
gamma_e3
cp_e
2gamma_e
1cv_e-K-
me0 1
-K-
me0
-C-
me0
-C-cp_prod
-C-cp_air
z
1
Unit Delay1
z
1
Unit Delay
Switch1
Switch293.56
R_prod
-C-R_air
2me_dot
1me
Figure A-3: Contents of sub-block "Cp, Cv, R, Gamma Calculations." (Manuscript 1)
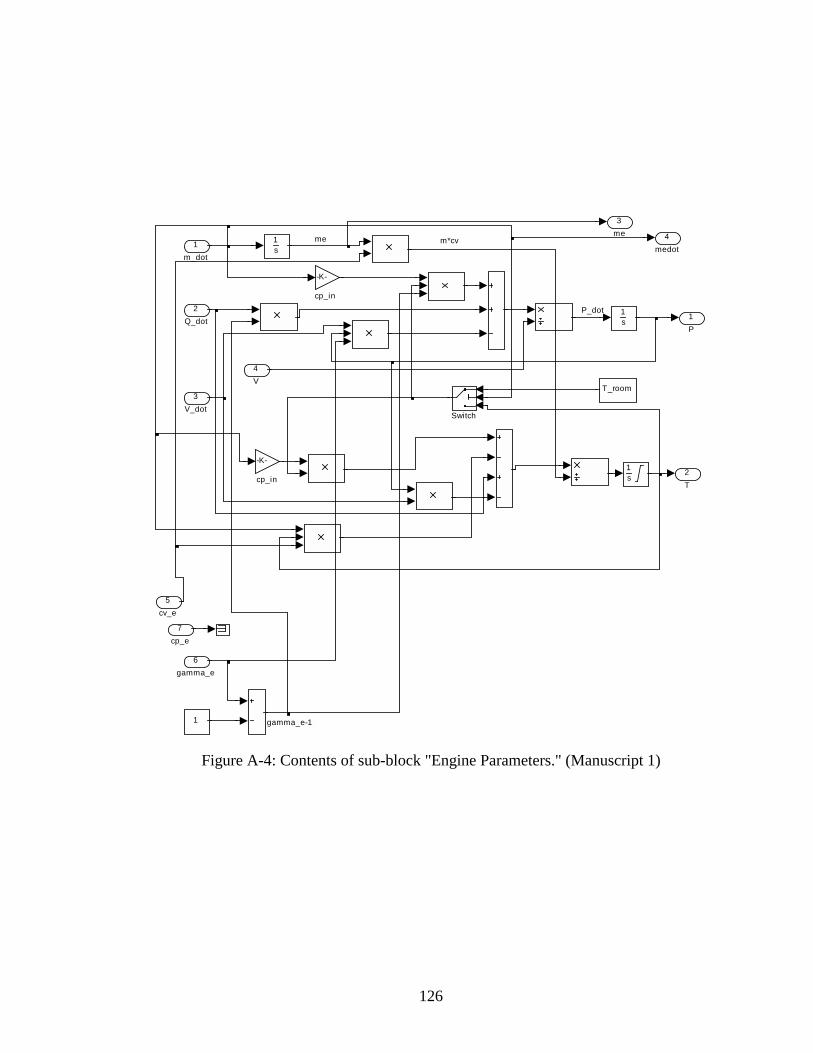
126
me m*cv
P_dot
gamma_e-1
4medot
3me
2T
1P
-K-
cp_in
-K-
cp_in
Switch
1s
1s
1s
T_room
1
7cp_e
6gamma_e
5cv_e
4V
3V_dot
2Q_dot
1m_dot
Figure A-4: Contents of sub-block "Engine Parameters." (Manuscript 1)
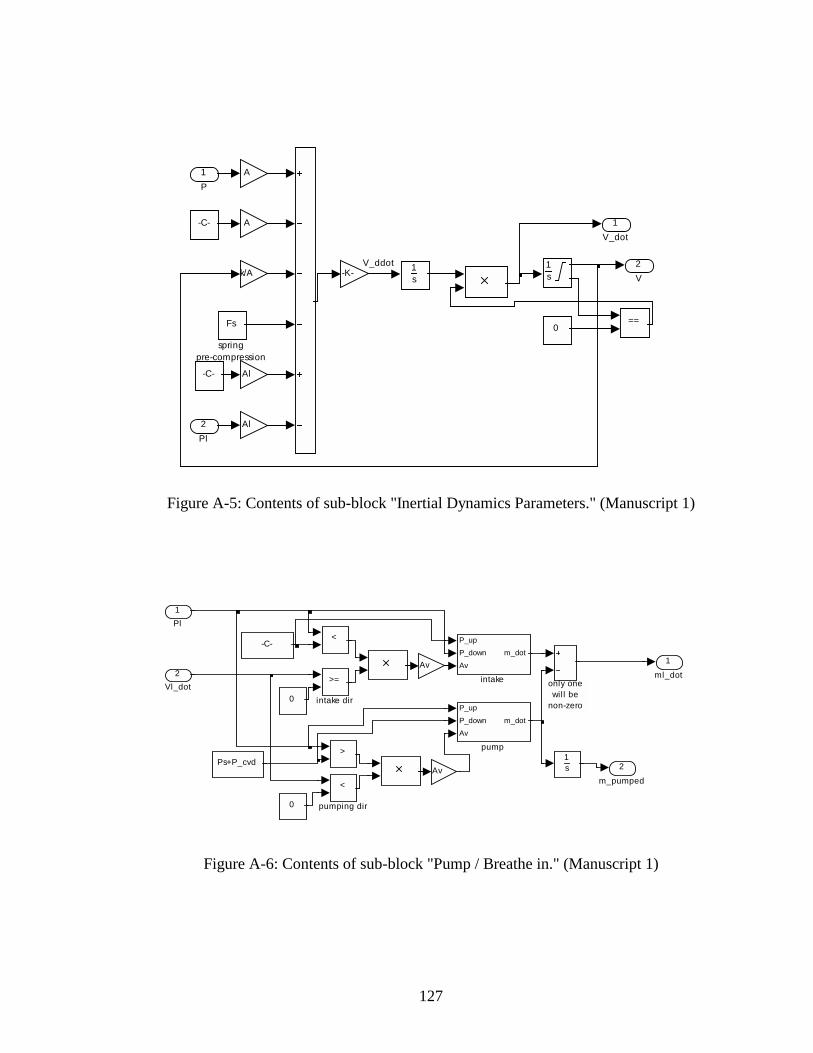
127
V_ddot 2V
1V_dot
Fs
springpre-compression
==
1s
1s
0
-C-
-C-
Al
k/A
A
-K-
Al
A
2Pl
1P
Figure A-5: Contents of sub-block "Inertial Dynamics Parameters." (Manuscript 1)
only onewill be
non-zero
2
m_pumped
1
ml_dot
<
pumping dir
P_up
P_downAv
m_dot
pump
>=
intake dir
P_upP_down
Av
m_dot
intake
Av
Av
>
<
1s
Ps+P_cvd
0
-C-
0
2Vl_dot
1Pl
Figure A-6: Contents of sub-block "Pump / Breathe in." (Manuscript 1)
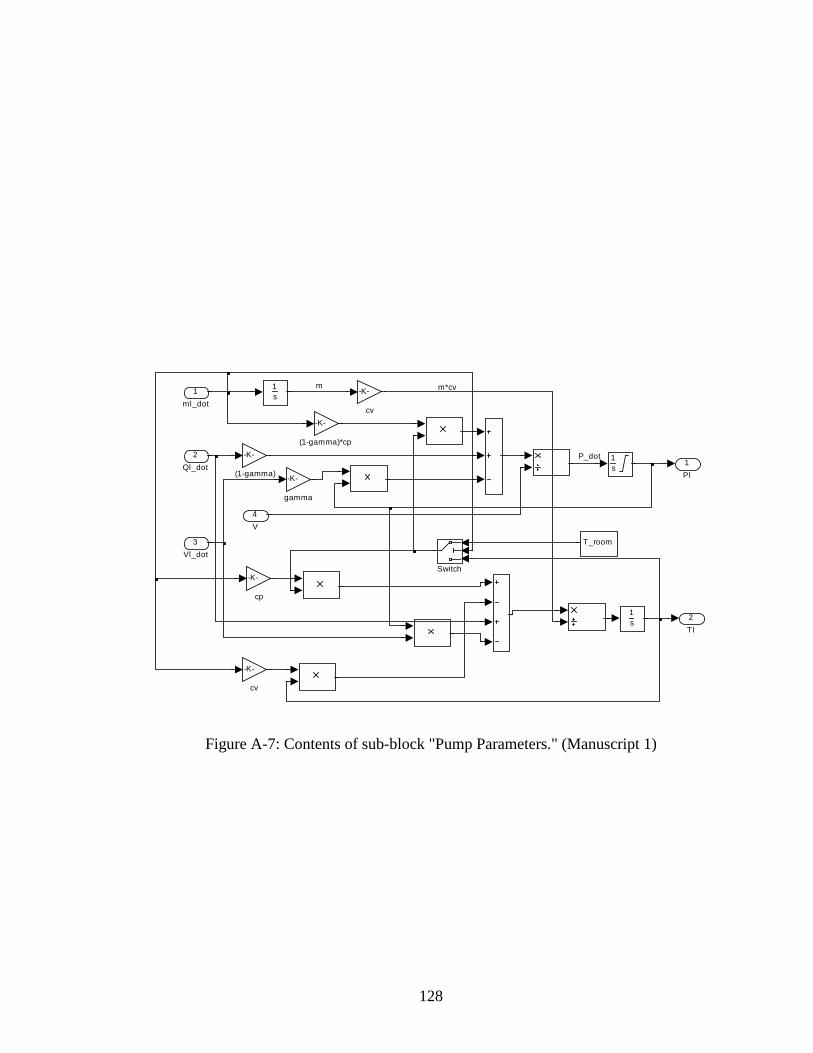
128
P_dot
m*cvm
2Tl
1Pl-K-
gamma
-K-
cv
-K-
cv
-K-
cp
Switch
1s
1s
1s
T_room
-K-
(1-gamma)*cp -K-
(1-gamma)
4V
3Vl_dot
2Ql_dot
1ml_dot
Figure A-7: Contents of sub-block "Pump Parameters." (Manuscript 1)
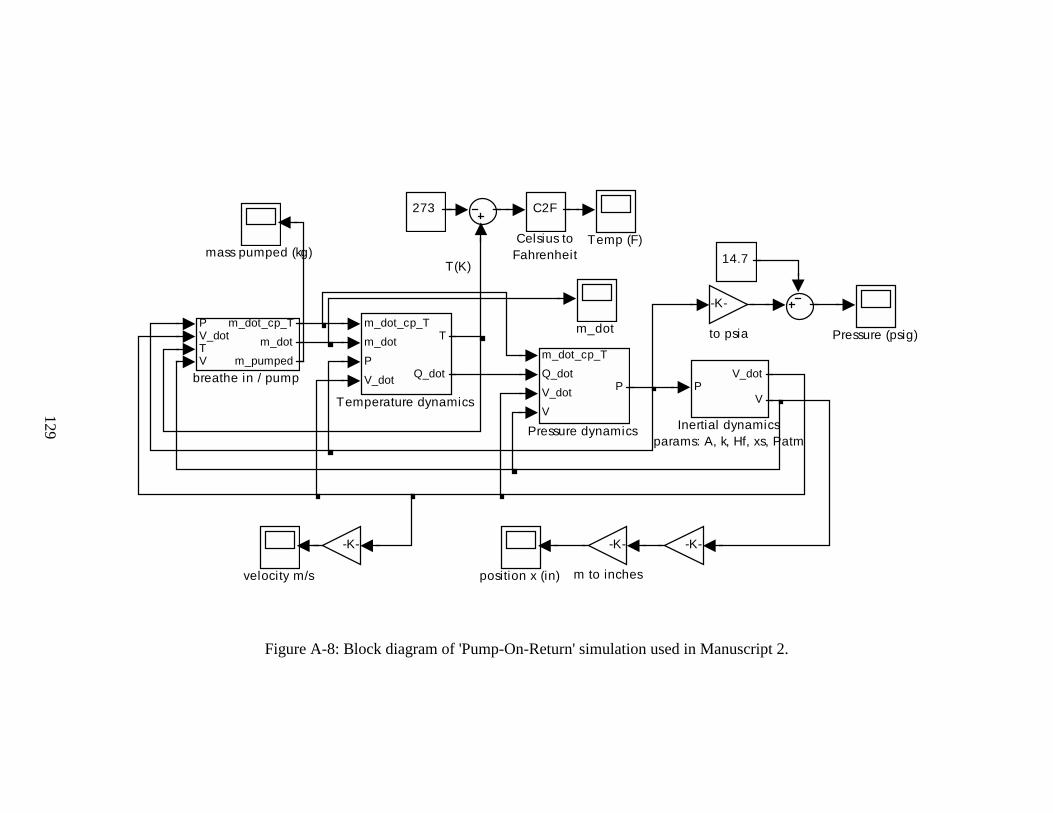
129
T(K) 14.7
273
velocity m/s
-K-
to psia
position x (in)
mass pumped (kg)
m_dot
-K- -K--K-
m to inches
PV_dotTV
m_dot_cp_T
m_dot
m_pumpedbreathe in / pump
m_dot_cp_T
m_dot
P
V_dot
T
Q_dot
Temperature dynamics
Temp (F)
m_dot_cp_T
Q_dot
V_dot
V
P
Pressure dynamics
Pressure (psig)
PV_dot
V
Inertial dynamicsparams: A, k, Hf, xs, Patm
C2F
Celsius toFahrenheit
Figure A-8: Block diagram of 'Pump-On-Return' simulation used in Manuscript 2.
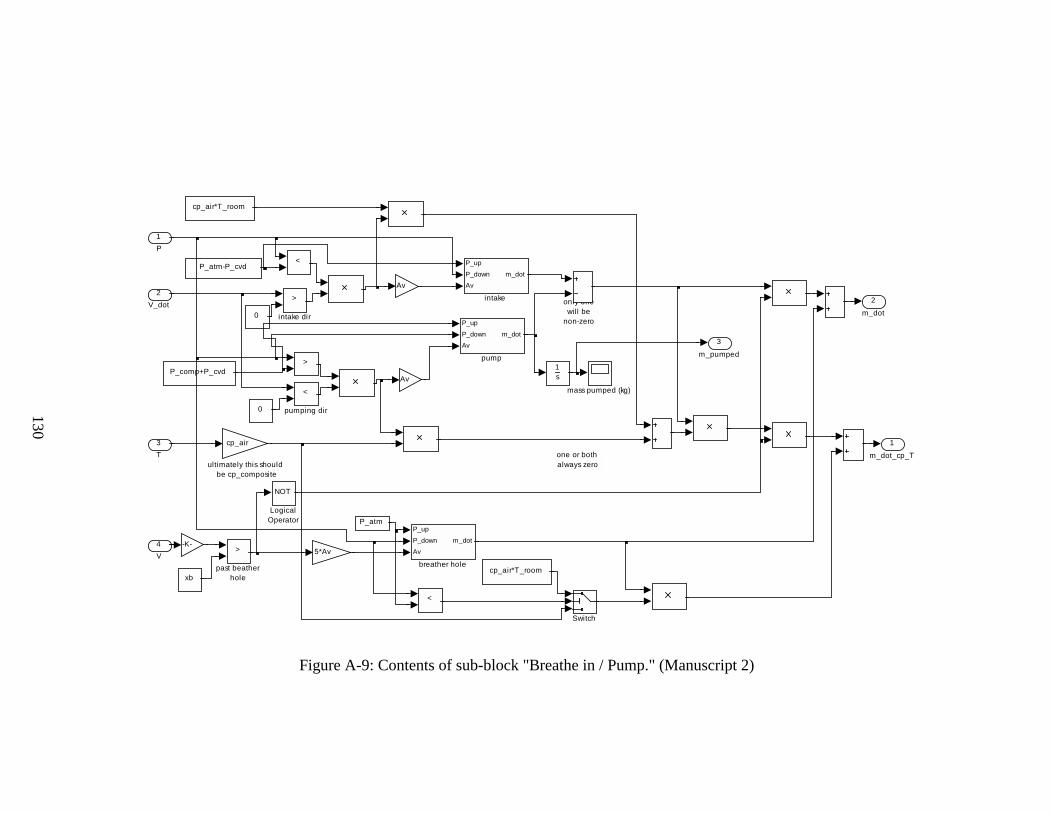
130
only onewill be
non-zero
one or both always zero
3
m_pumped
2
m_dot
1
m_dot_cp_T
cp_air
ultimately this should be cp_composite
<
pumping dir
P_up
P_downAv
m_dot
pump
>
past beatherhole
mass pumped (kg)
>
intake dir
P_up
P_downAv
m_dot
intake
5*Av-K-
Av
Av
P_up
P_downAv
m_dot
breather hole
Switch
<
>
<
NOT
LogicalOperator
1s
cp_air*T_room
P_comp+P_cvd
0
P_atm-P_cvd
0
cp_air*T_room
P_atm
xb
4V
3T
2V_dot
1P
Figure A-9: Contents of sub-block "Breathe in / Pump." (Manuscript 2)
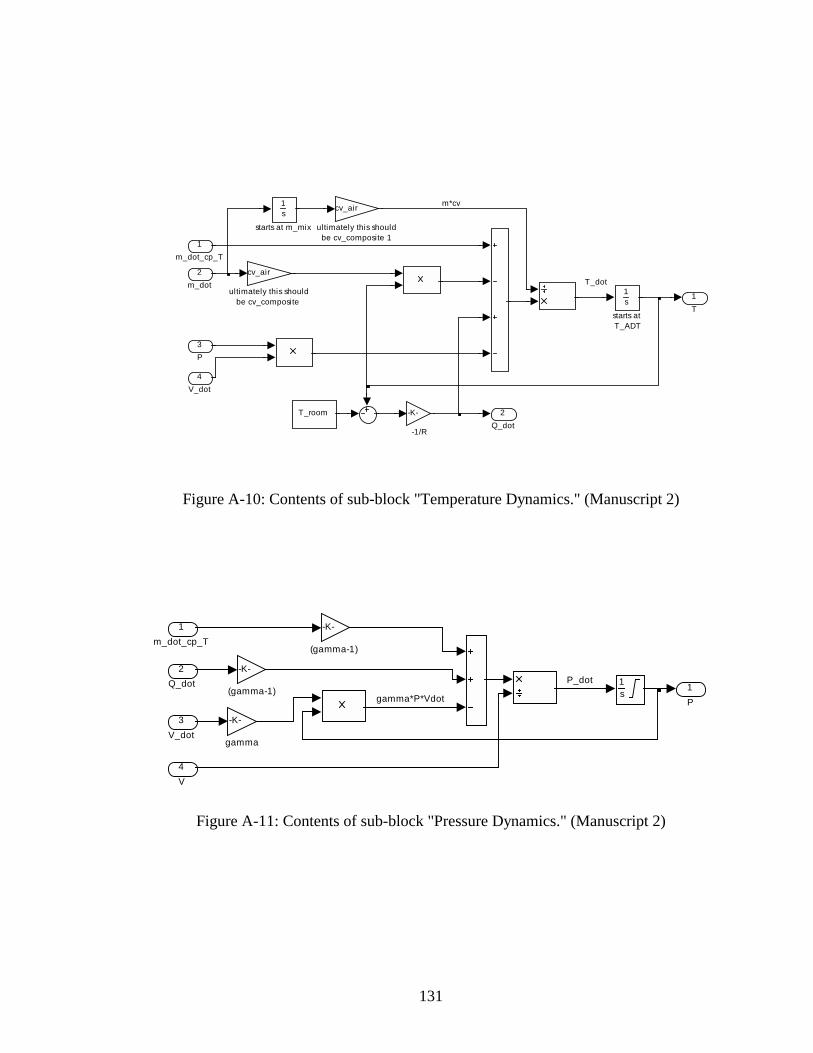
131
T_dot
m*cv
2Q_dot
1T
cv_air
ultimately this shouldbe cv_composite 1
cv_air
ultimately this shouldbe cv_composite
1s
starts at m_mix
1s
starts at T_ADT
T_room -K-
-1/R
4V_dot
3P
2m_dot
1m_dot_cp_T
Figure A-10: Contents of sub-block "Temperature Dynamics." (Manuscript 2)
P_dot
gamma*P*Vdot1P
-K-
gamma
1s
-K-
(gamma-1)
-K-
(gamma-1)
4V
3V_dot
2Q_dot
1m_dot_cp_T
Figure A-11: Contents of sub-block "Pressure Dynamics." (Manuscript 2)
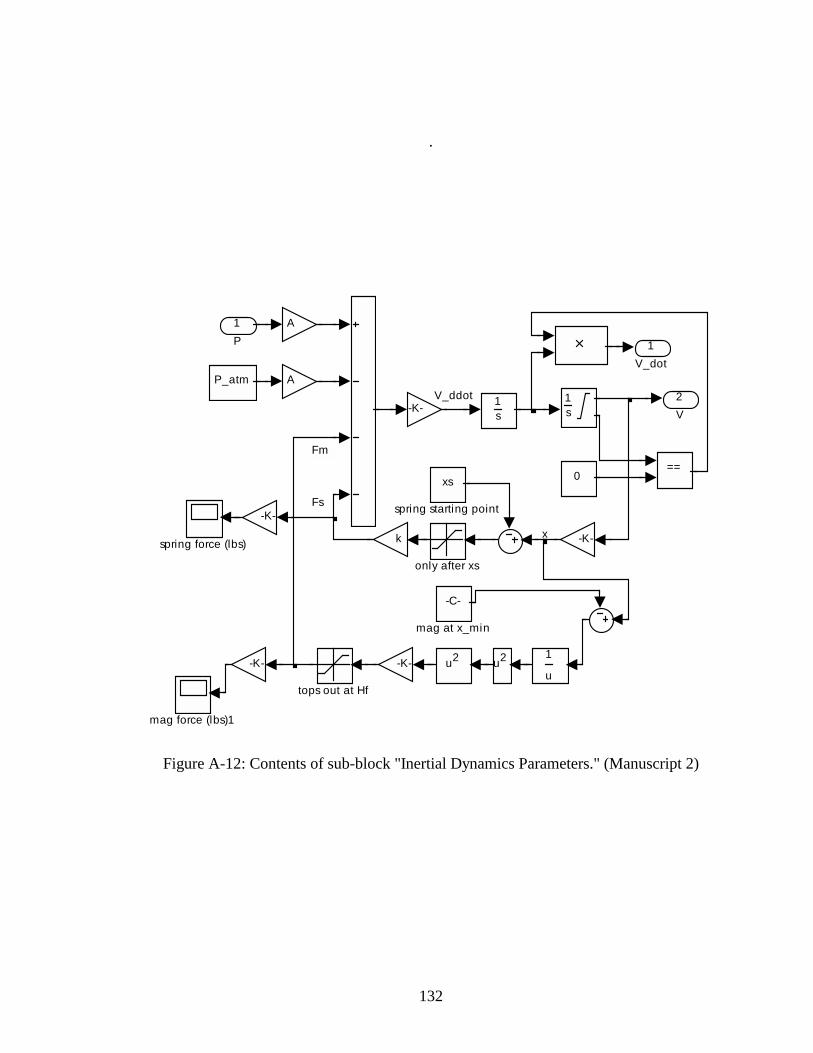
132
.
V_ddot
x
Fs
Fm
2V
1V_dot
tops out at Hf
xs
spring starting point
spring force (lbs)
only after xs
==
mag force (lbs)1
-C-
mag at x_min
u2u2 1
u
1s
1s
0
P_atm
k
-K-
-K-
A
-K-
-K--K-
A1P
Figure A-12: Contents of sub-block "Inertial Dynamics Parameters." (Manuscript 2)

133
-1
15
volts to cm
10
to volts1
1.6
to atm
-K-
to PSIG
10
spark1prevent from opening
in beginning
-K-
prac diff gain
outputs
motion
mandatory open at end
fuel pulse
exhaust
air pulse1
//////////
Velocity
s
den(s)Transfer Fcn
Switch
//////////
Spark Plug
Spark (1 to 0)1
Saturation
Pressure (PSIA)
//////////
Position
//////////
Fuel Valve
Exhaust1
//////////
Exhaust Valve
1
1
14.7
-C-
0
1
0
0
//////////
Combustion Pressure
//////////
Air Valve
Figure A-13: Block diagram of Real Time Workshop implementation for Manuscript 2.
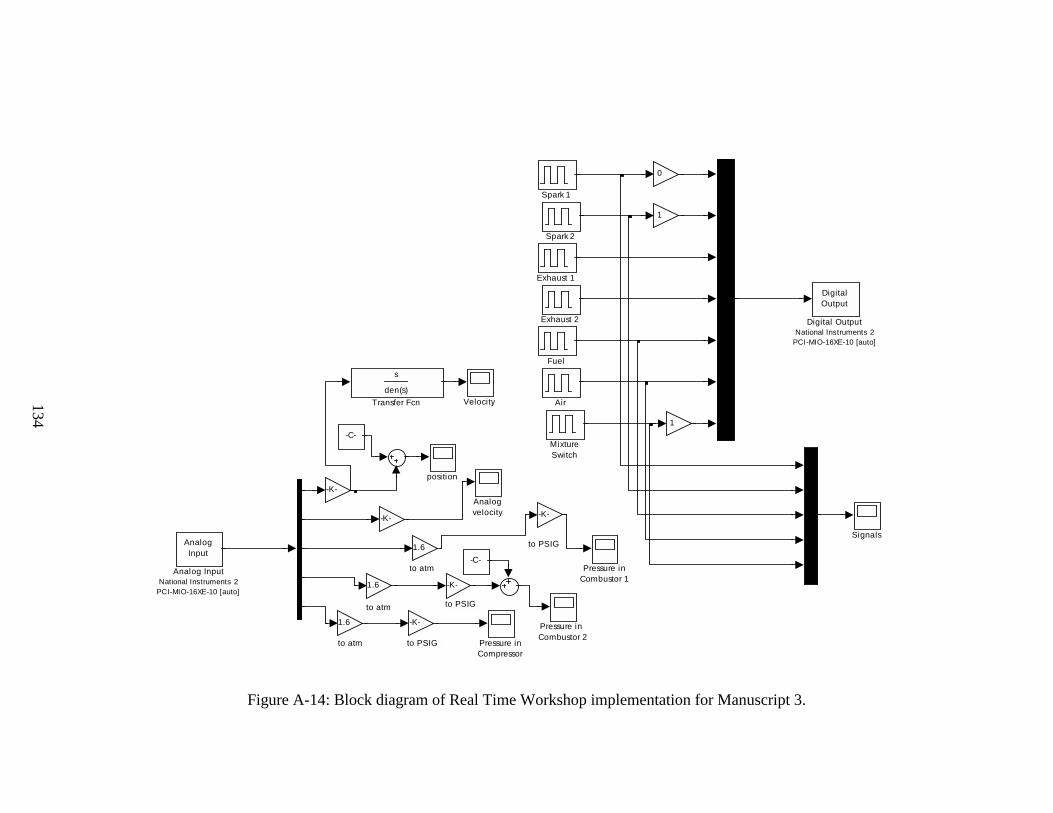
134
to atm
to atm
to atm
to PSIG
to PSIG
to PSIG
position
Velocity
s
den(s)Transfer Fcn
Spark 2
Spark 1
Signals
Pressure in Combustor 2
Pressure inCompressor
Pressure inCombustor 1
MixtureSwitch
0
-K-
-K-
-K-
1.6
1.6
1.6
1
1
-K-
-K-
Fuel
Exhaust 2
Exhaust 1
DigitalOutput
Digital OutputNational Instruments 2
PCI-MIO-16XE-10 [auto]
-C-
-C-
AnalogInput
Analog InputNational Instruments 2
PCI-MIO-16XE-10 [auto]
Analogvelocity
Air
Figure A-14: Block diagram of Real Time Workshop implementation for Manuscript 3.

APPENDIX B
MATLAB CODE
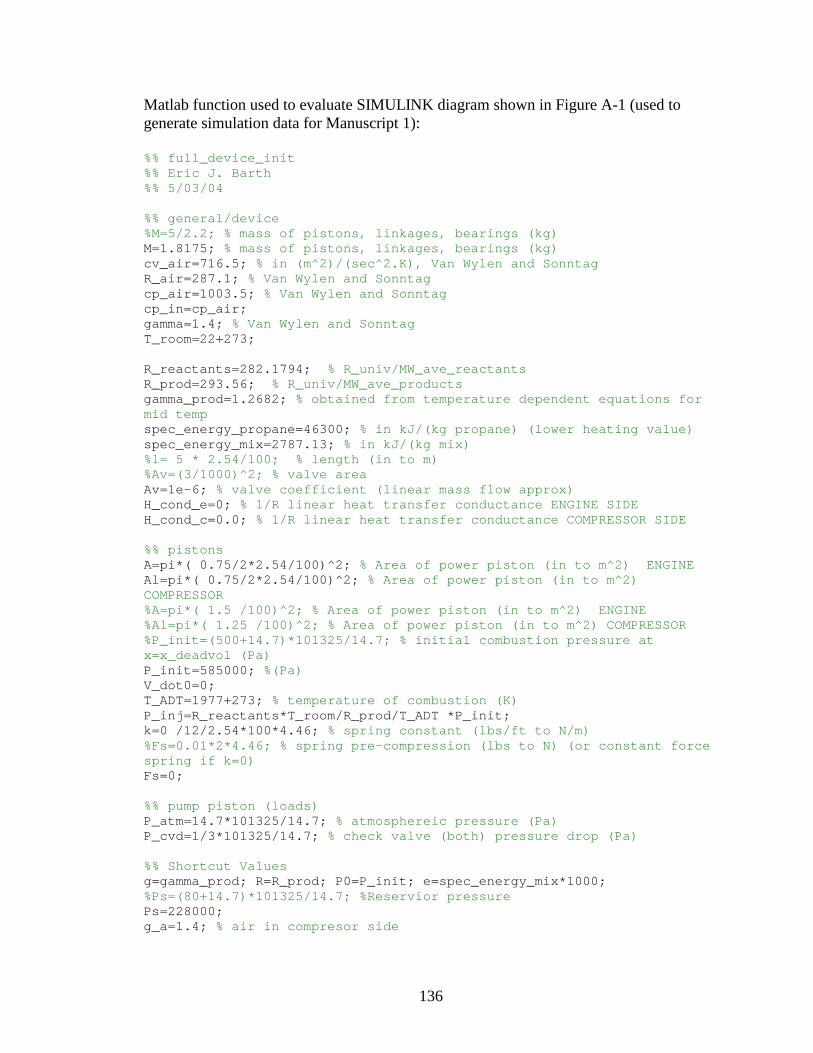
136
Matlab function used to evaluate SIMULINK diagram shown in Figure A-1 (used to generate simulation data for Manuscript 1):
%% full_device_init%% Eric J. Barth%% 5/03/04
%% general/device%M=5/2.2; % mass of pistons, linkages, bearings (kg)M=1.8175; % mass of pistons, linkages, bearings (kg)cv_air=716.5; % in (m^2)/(sec^2.K), Van Wylen and SonntagR_air=287.1; % Van Wylen and Sonntagcp_air=1003.5; % Van Wylen and Sonntagcp_in=cp_air;gamma=1.4; % Van Wylen and SonntagT_room=22+273;
R_reactants=282.1794; % R_univ/MW_ave_reactantsR_prod=293.56; % R_univ/MW_ave_productsgamma_prod=1.2682; % obtained from temperature dependent equations formid tempspec_energy_propane=46300; % in kJ/(kg propane) (lower heating value)spec_energy_mix=2787.13; % in kJ/(kg mix)%l= 5 * 2.54/100; % length (in to m)%Av=(3/1000)^2; % valve areaAv=1e-6; % valve coefficient (linear mass flow approx)H_cond_e=0; % 1/R linear heat transfer conductance ENGINE SIDEH_cond_c=0.0; % 1/R linear heat transfer conductance COMPRESSOR SIDE
%% pistonsA=pi*( 0.75/2*2.54/100)^2; % Area of power piston (in to m^2) ENGINEAl=pi*( 0.75/2*2.54/100)^2; % Area of power piston (in to m^2)COMPRESSOR%A=pi*( 1.5 /100)^2; % Area of power piston (in to m^2) ENGINE%Al=pi*( 1.25 /100)^2; % Area of power piston (in to m^2) COMPRESSOR%P_init=(500+14.7)*101325/14.7; % initial combustion pressure atx=x_deadvol (Pa)P_init=585000; %(Pa)V_dot0=0;T_ADT=1977+273; % temperature of combustion (K)P_inj=R_reactants*T_room/R_prod/T_ADT *P_init;k=0 /12/2.54*100*4.46; % spring constant (lbs/ft to N/m)%Fs=0.01*2*4.46; % spring pre-compression (lbs to N) (or constant forcespring if k=0)Fs=0;
%% pump piston (loads)P_atm=14.7*101325/14.7; % atmosphereic pressure (Pa)P_cvd=1/3*101325/14.7; % check valve (both) pressure drop (Pa)
%% Shortcut Valuesg=gamma_prod; R=R_prod; P0=P_init; e=spec_energy_mix*1000;%Ps=(80+14.7)*101325/14.7; %Reservior pressurePs=228000;g_a=1.4; % air in compresor side
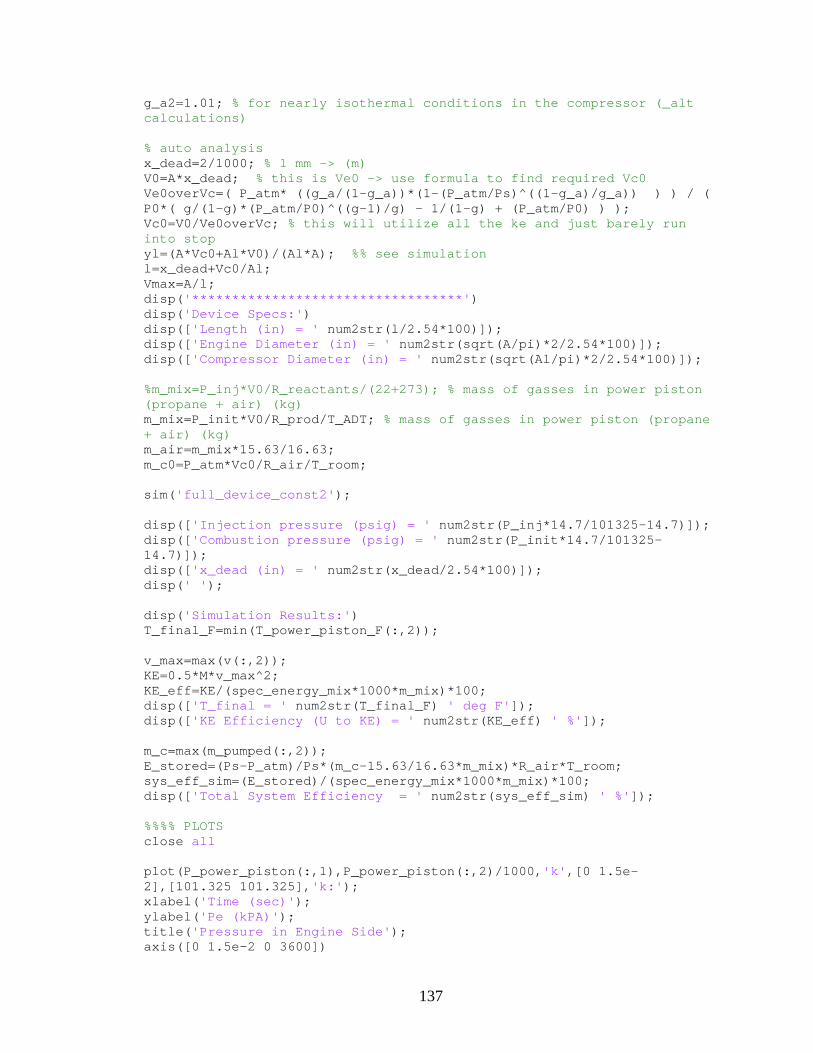
137
g_a2=1.01; % for nearly isothermal conditions in the compressor (_altcalculations)
% auto analysisx_dead=2/1000; % 1 mm -> (m)V0=A*x_dead; % this is Ve0 -> use formula to find required Vc0Ve0overVc=( P_atm* ((g_a/(1-g_a))*(1-(P_atm/Ps)^((1-g_a)/g_a)) ) ) / (P0*( g/(1-g)*(P_atm/P0)^((g-1)/g) - 1/(1-g) + (P_atm/P0) ) );Vc0=V0/Ve0overVc; % this will utilize all the ke and just barely runinto stopyl=(A*Vc0+Al*V0)/(Al*A); %% see simulationl=x_dead+Vc0/Al;Vmax=A/l;disp('**********************************')disp('Device Specs:')disp(['Length (in) = ' num2str(l/2.54*100)]);disp(['Engine Diameter (in) = ' num2str(sqrt(A/pi)*2/2.54*100)]);disp(['Compressor Diameter (in) = ' num2str(sqrt(Al/pi)*2/2.54*100)]);
%m_mix=P_inj*V0/R_reactants/(22+273); % mass of gasses in power piston(propane + air) (kg)m_mix=P_init*V0/R_prod/T_ADT; % mass of gasses in power piston (propane+ air) (kg)m_air=m_mix*15.63/16.63;m_c0=P_atm*Vc0/R_air/T_room;
sim('full_device_const2');
disp(['Injection pressure (psig) = ' num2str(P_inj*14.7/101325-14.7)]);disp(['Combustion pressure (psig) = ' num2str(P_init*14.7/101325-14.7)]);disp(['x_dead (in) = ' num2str(x_dead/2.54*100)]);disp(' ');
disp('Simulation Results:')T_final_F=min(T_power_piston_F(:,2));
v_max=max(v(:,2));KE=0.5*M*v_max^2;KE_eff=KE/(spec_energy_mix*1000*m_mix)*100;disp(['T_final = ' num2str(T_final_F) ' deg F']);disp(['KE Efficiency (U to KE) = ' num2str(KE_eff) ' %']);
m_c=max(m_pumped(:,2));E_stored=(Ps-P_atm)/Ps*(m_c-15.63/16.63*m_mix)*R_air*T_room;sys_eff_sim=(E_stored)/(spec_energy_mix*1000*m_mix)*100;disp(['Total System Efficiency = ' num2str(sys_eff_sim) ' %']);
%%%% PLOTSclose all
plot(P_power_piston(:,1),P_power_piston(:,2)/1000,'k',[0 1.5e-2],[101.325 101.325],'k:');xlabel('Time (sec)');ylabel('Pe (kPA)');title('Pressure in Engine Side');axis([0 1.5e-2 0 3600])
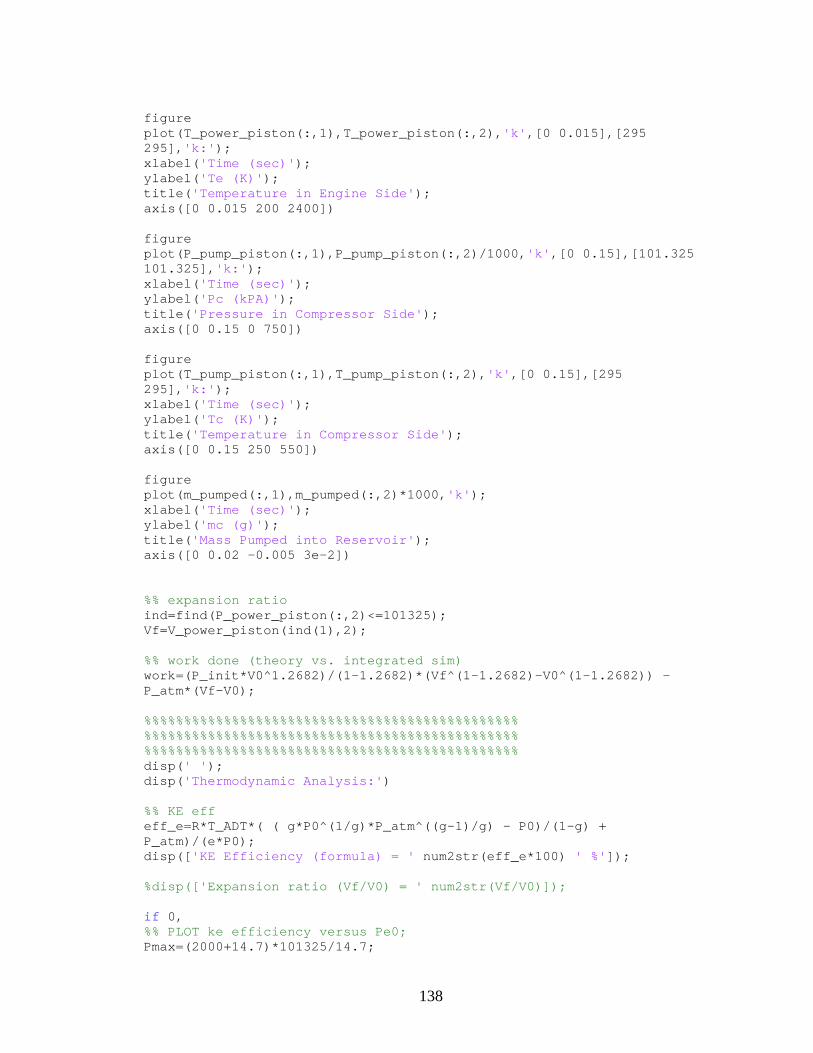
138
figureplot(T_power_piston(:,1),T_power_piston(:,2),'k',[0 0.015],[295295],'k:');xlabel('Time (sec)');ylabel('Te (K)');title('Temperature in Engine Side');axis([0 0.015 200 2400])
figureplot(P_pump_piston(:,1),P_pump_piston(:,2)/1000,'k',[0 0.15],[101.325101.325],'k:');xlabel('Time (sec)');ylabel('Pc (kPA)');title('Pressure in Compressor Side');axis([0 0.15 0 750])
figureplot(T_pump_piston(:,1),T_pump_piston(:,2),'k',[0 0.15],[295295],'k:');xlabel('Time (sec)');ylabel('Tc (K)');title('Temperature in Compressor Side');axis([0 0.15 250 550])
figureplot(m_pumped(:,1),m_pumped(:,2)*1000,'k');xlabel('Time (sec)');ylabel('mc (g)');title('Mass Pumped into Reservoir');axis([0 0.02 -0.005 3e-2])
%% expansion ratioind=find(P_power_piston(:,2)<=101325);Vf=V_power_piston(ind(1),2);
%% work done (theory vs. integrated sim)work=(P_init*V0^1.2682)/(1-1.2682)*(Vf^(1-1.2682)-V0^(1-1.2682)) -P_atm*(Vf-V0);
%%%%%%%%%%%%%%%%%%%%%%%%%%%%%%%%%%%%%%%%%%%%%%%%%%%%%%%%%%%%%%%%%%%%%%%%%%%%%%%%%%%%%%%%%%%%%%%%%%%%%%%%%%%%%%%%%%%%%%%%%%%%%%%%%%%%%%%%%%%%%disp(' ');disp('Thermodynamic Analysis:')
%% KE effeff_e=R*T_ADT*( ( g*P0^(1/g)*P_atm^((g-1)/g) - P0)/(1-g) +P_atm)/(e*P0);disp(['KE Efficiency (formula) = ' num2str(eff_e*100) ' %']);
%disp(['Expansion ratio (Vf/V0) = ' num2str(Vf/V0)]);
if 0,%% PLOT ke efficiency versus Pe0;Pmax=(2000+14.7)*101325/14.7;
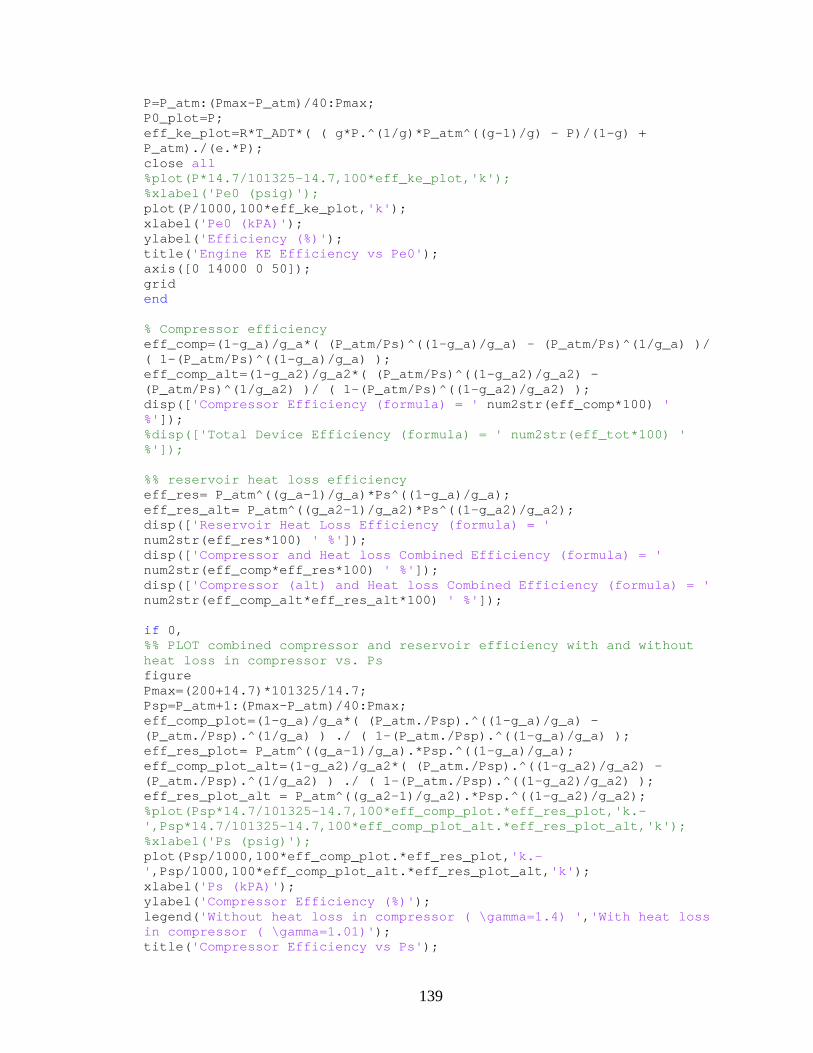
139
P=P_atm:(Pmax-P_atm)/40:Pmax;P0_plot=P;eff_ke_plot=R*T_ADT*( ( g*P.^(1/g)*P_atm^((g-1)/g) - P)/(1-g) +P_atm)./(e.*P);close all%plot(P*14.7/101325-14.7,100*eff_ke_plot,'k');%xlabel('Pe0 (psig)');plot(P/1000,100*eff_ke_plot,'k');xlabel('Pe0 (kPA)');ylabel('Efficiency (%)');title('Engine KE Efficiency vs Pe0');axis([0 14000 0 50]);gridend
% Compressor efficiencyeff_comp=(1-g_a)/g_a*( (P_atm/Ps)^((1-g_a)/g_a) - (P_atm/Ps)^(1/g_a) )/( 1-(P_atm/Ps)^((1-g_a)/g_a) );eff_comp_alt=(1-g_a2)/g_a2*( (P_atm/Ps)^((1-g_a2)/g_a2) -(P_atm/Ps)^(1/g_a2) )/ ( 1-(P_atm/Ps)^((1-g_a2)/g_a2) );disp(['Compressor Efficiency (formula) = ' num2str(eff_comp*100) '%']);%disp(['Total Device Efficiency (formula) = ' num2str(eff_tot*100) '%']);
%% reservoir heat loss efficiencyeff_res= P_atm^((g_a-1)/g_a)*Ps^((1-g_a)/g_a);eff_res_alt= P_atm^((g_a2-1)/g_a2)*Ps^((1-g_a2)/g_a2);disp(['Reservoir Heat Loss Efficiency (formula) = 'num2str(eff_res*100) ' %']);disp(['Compressor and Heat loss Combined Efficiency (formula) = 'num2str(eff_comp*eff_res*100) ' %']);disp(['Compressor (alt) and Heat loss Combined Efficiency (formula) = 'num2str(eff_comp_alt*eff_res_alt*100) ' %']);
if 0,%% PLOT combined compressor and reservoir efficiency with and withoutheat loss in compressor vs. PsfigurePmax=(200+14.7)*101325/14.7;Psp=P_atm+1:(Pmax-P_atm)/40:Pmax;eff_comp_plot=(1-g_a)/g_a*( (P_atm./Psp).^((1-g_a)/g_a) -(P_atm./Psp).^(1/g_a) ) ./ ( 1-(P_atm./Psp).^((1-g_a)/g_a) );eff_res_plot= P_atm^((g_a-1)/g_a).*Psp.^((1-g_a)/g_a);eff_comp_plot_alt=(1-g_a2)/g_a2*( (P_atm./Psp).^((1-g_a2)/g_a2) -(P_atm./Psp).^(1/g_a2) ) ./ ( 1-(P_atm./Psp).^((1-g_a2)/g_a2) );eff_res_plot_alt = P_atm^((g_a2-1)/g_a2).*Psp.^((1-g_a2)/g_a2);%plot(Psp*14.7/101325-14.7,100*eff_comp_plot.*eff_res_plot,'k.-',Psp*14.7/101325-14.7,100*eff_comp_plot_alt.*eff_res_plot_alt,'k');%xlabel('Ps (psig)');plot(Psp/1000,100*eff_comp_plot.*eff_res_plot,'k.-',Psp/1000,100*eff_comp_plot_alt.*eff_res_plot_alt,'k');xlabel('Ps (kPA)');ylabel('Compressor Efficiency (%)');legend('Without heat loss in compressor ( \gamma=1.4) ','With heat lossin compressor ( \gamma=1.01)');title('Compressor Efficiency vs Ps');
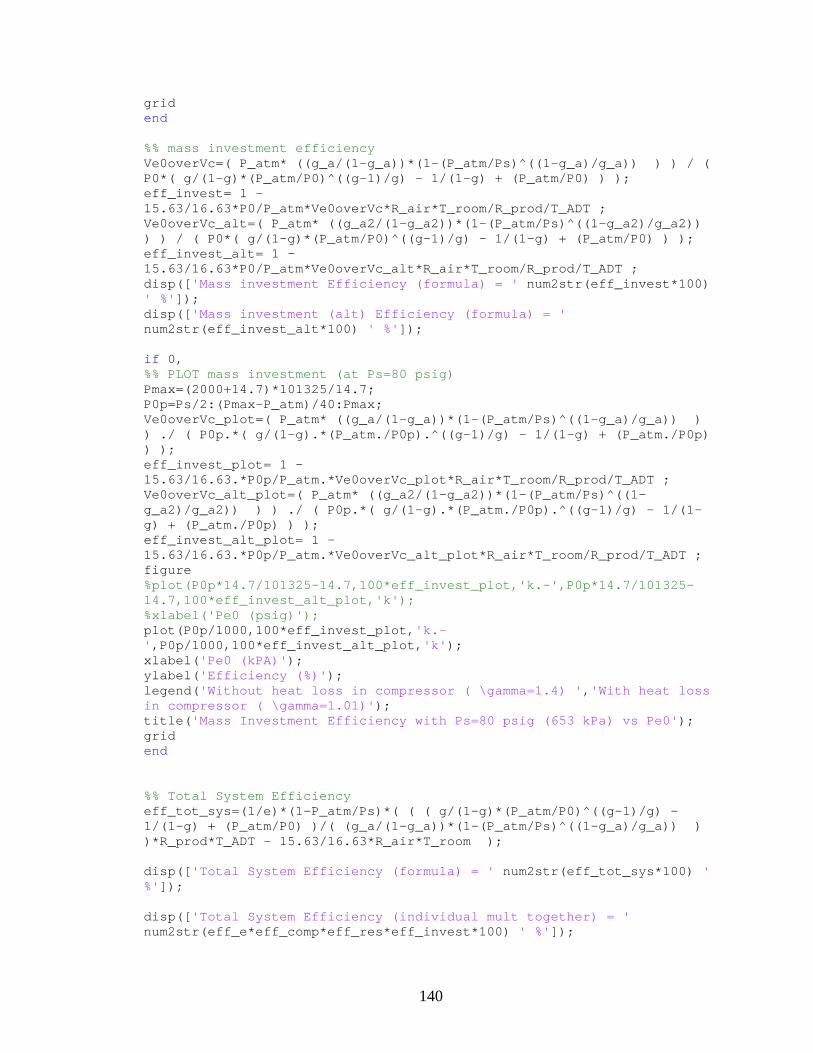
140
gridend
%% mass investment efficiencyVe0overVc=( P_atm* ((g_a/(1-g_a))*(1-(P_atm/Ps)^((1-g_a)/g_a)) ) ) / (P0*( g/(1-g)*(P_atm/P0)^((g-1)/g) - 1/(1-g) + (P_atm/P0) ) );eff_invest= 1 -15.63/16.63*P0/P_atm*Ve0overVc*R_air*T_room/R_prod/T_ADT ;Ve0overVc_alt=( P_atm* ((g_a2/(1-g_a2))*(1-(P_atm/Ps)^((1-g_a2)/g_a2))) ) / ( P0*( g/(1-g)*(P_atm/P0)^((g-1)/g) - 1/(1-g) + (P_atm/P0) ) );eff_invest_alt= 1 -15.63/16.63*P0/P_atm*Ve0overVc_alt*R_air*T_room/R_prod/T_ADT ;disp(['Mass investment Efficiency (formula) = ' num2str(eff_invest*100)' %']);disp(['Mass investment (alt) Efficiency (formula) = 'num2str(eff_invest_alt*100) ' %']);
if 0,%% PLOT mass investment (at Ps=80 psig)Pmax=(2000+14.7)*101325/14.7;P0p=Ps/2:(Pmax-P_atm)/40:Pmax;Ve0overVc_plot=( P_atm* ((g_a/(1-g_a))*(1-(P_atm/Ps)^((1-g_a)/g_a)) )) ./ ( P0p.*( g/(1-g).*(P_atm./P0p).^((g-1)/g) - 1/(1-g) + (P_atm./P0p)) );eff_invest_plot= 1 -15.63/16.63.*P0p/P_atm.*Ve0overVc_plot*R_air*T_room/R_prod/T_ADT ;Ve0overVc_alt_plot=( P_atm* ((g_a2/(1-g_a2))*(1-(P_atm/Ps)^((1-g_a2)/g_a2)) ) ) ./ ( P0p.*( g/(1-g).*(P_atm./P0p).^((g-1)/g) - 1/(1-g) + (P_atm./P0p) ) );eff_invest_alt_plot= 1 -15.63/16.63.*P0p/P_atm.*Ve0overVc_alt_plot*R_air*T_room/R_prod/T_ADT ;figure%plot(P0p*14.7/101325-14.7,100*eff_invest_plot,'k.-',P0p*14.7/101325-14.7,100*eff_invest_alt_plot,'k');%xlabel('Pe0 (psig)');plot(P0p/1000,100*eff_invest_plot,'k.-',P0p/1000,100*eff_invest_alt_plot,'k');xlabel('Pe0 (kPA)');ylabel('Efficiency (%)');legend('Without heat loss in compressor ( \gamma=1.4) ','With heat lossin compressor ( \gamma=1.01)');title('Mass Investment Efficiency with Ps=80 psig (653 kPa) vs Pe0');gridend
%% Total System Efficiencyeff_tot_sys=(1/e)*(1-P_atm/Ps)*( ( ( g/(1-g)*(P_atm/P0)^((g-1)/g) -1/(1-g) + (P_atm/P0) )/( (g_a/(1-g_a))*(1-(P_atm/Ps)^((1-g_a)/g_a)) ))*R_prod*T_ADT - 15.63/16.63*R_air*T_room );
disp(['Total System Efficiency (formula) = ' num2str(eff_tot_sys*100) '%']);
disp(['Total System Efficiency (individual mult together) = 'num2str(eff_e*eff_comp*eff_res*eff_invest*100) ' %']);
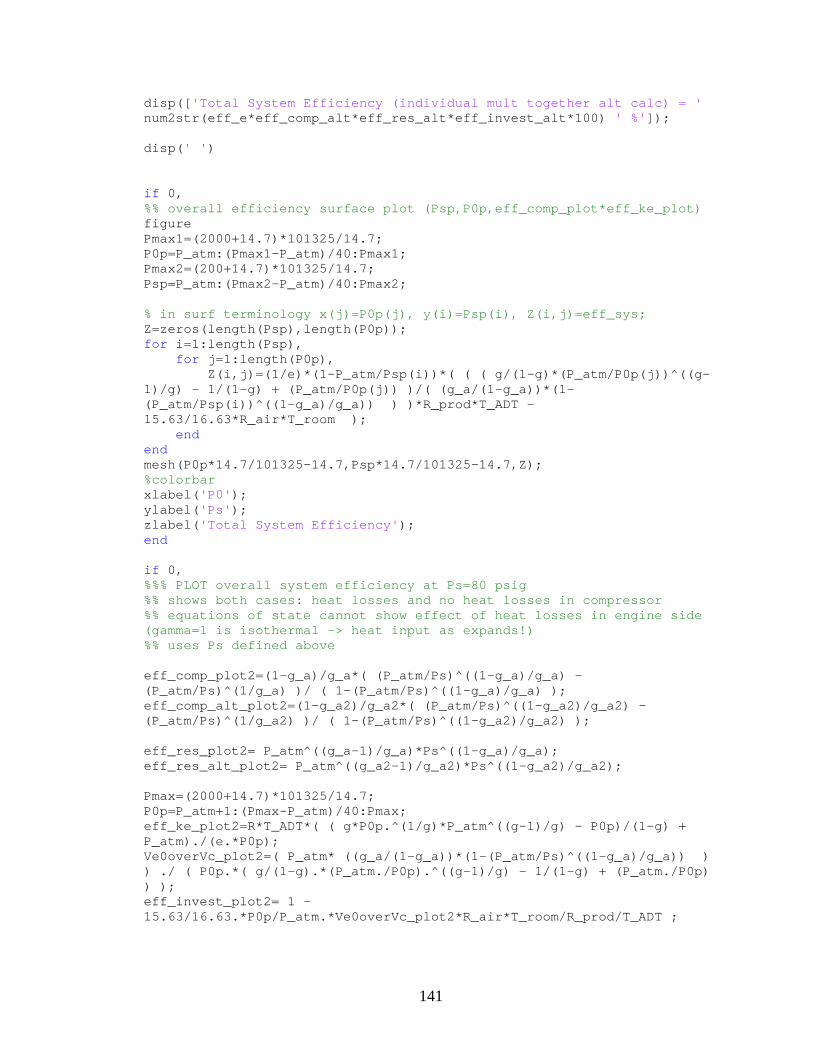
141
disp(['Total System Efficiency (individual mult together alt calc) = 'num2str(eff_e*eff_comp_alt*eff_res_alt*eff_invest_alt*100) ' %']);
disp(' ')
if 0,%% overall efficiency surface plot (Psp,P0p,eff_comp_plot*eff_ke_plot)figurePmax1=(2000+14.7)*101325/14.7;P0p=P_atm:(Pmax1-P_atm)/40:Pmax1;Pmax2=(200+14.7)*101325/14.7;Psp=P_atm:(Pmax2-P_atm)/40:Pmax2;
% in surf terminology x(j)=P0p(j), y(i)=Psp(i), Z(i,j)=eff_sys;Z=zeros(length(Psp),length(P0p));for i=1:length(Psp),
for j=1:length(P0p),Z(i,j)=(1/e)*(1-P_atm/Psp(i))*( ( ( g/(1-g)*(P_atm/P0p(j))^((g-
1)/g) - 1/(1-g) + (P_atm/P0p(j)) )/( (g_a/(1-g_a))*(1-(P_atm/Psp(i))^((1-g_a)/g_a)) ) )*R_prod*T_ADT -15.63/16.63*R_air*T_room );
endendmesh(P0p*14.7/101325-14.7,Psp*14.7/101325-14.7,Z);%colorbarxlabel('P0');ylabel('Ps');zlabel('Total System Efficiency');end
if 0,%%% PLOT overall system efficiency at Ps=80 psig%% shows both cases: heat losses and no heat losses in compressor%% equations of state cannot show effect of heat losses in engine side(gamma=1 is isothermal -> heat input as expands!)%% uses Ps defined above
eff_comp_plot2=(1-g_a)/g_a*( (P_atm/Ps)^((1-g_a)/g_a) -(P_atm/Ps)^(1/g_a) )/ ( 1-(P_atm/Ps)^((1-g_a)/g_a) );eff_comp_alt_plot2=(1-g_a2)/g_a2*( (P_atm/Ps)^((1-g_a2)/g_a2) -(P_atm/Ps)^(1/g_a2) )/ ( 1-(P_atm/Ps)^((1-g_a2)/g_a2) );
eff_res_plot2= P_atm^((g_a-1)/g_a)*Ps^((1-g_a)/g_a);eff_res_alt_plot2= P_atm^((g_a2-1)/g_a2)*Ps^((1-g_a2)/g_a2);
Pmax=(2000+14.7)*101325/14.7;P0p=P_atm+1:(Pmax-P_atm)/40:Pmax;eff_ke_plot2=R*T_ADT*( ( g*P0p.^(1/g)*P_atm^((g-1)/g) - P0p)/(1-g) +P_atm)./(e.*P0p);Ve0overVc_plot2=( P_atm* ((g_a/(1-g_a))*(1-(P_atm/Ps)^((1-g_a)/g_a)) )) ./ ( P0p.*( g/(1-g).*(P_atm./P0p).^((g-1)/g) - 1/(1-g) + (P_atm./P0p)) );eff_invest_plot2= 1 -15.63/16.63.*P0p/P_atm.*Ve0overVc_plot2*R_air*T_room/R_prod/T_ADT ;
142
Ve0overVc_alt_plot2=( P_atm* ((g_a2/(1-g_a2))*(1-(P_atm/Ps)^((1-g_a2)/g_a2)) ) ) ./ ( P0p.*( g/(1-g).*(P_atm./P0p).^((g-1)/g) - 1/(1-g) + (P_atm./P0p) ) );eff_invest_alt_plot2= 1 -15.63/16.63.*P0p/P_atm.*Ve0overVc_alt_plot2*R_air*T_room/R_prod/T_ADT ;figure%plot(P0p*14.7/101325-14.7,100*eff_ke_plot2.*eff_comp_plot2.*eff_res_plot2.*eff_invest_plot2,'k.-',P0p*14.7/101325-14.7,100*eff_ke_plot2.*eff_comp_alt_plot2.*eff_res_alt_plot2.*eff_invest_alt_plot2,'k');%xlabel('P0 (psig)');plot(P0p/1000,100*eff_ke_plot2.*eff_comp_plot2.*eff_res_plot2.*eff_invest_plot2,'k.-',P0p/1000,100*eff_ke_plot2.*eff_comp_alt_plot2.*eff_res_alt_plot2.*eff_invest_alt_plot2,'k');xlabel('Pe0 (kPA)');ylabel('Efficiency (%)');legend('Without heat loss in compressor ( \gamma=1.4) ','With heat lossin compressor ( \gamma=1.01)');title('Total System Efficiency with Ps=80 psig (653 kPa) vs Pe0');gridend
% garbage
%% entire efficiency (engine*pump) & compressor efficiency
%num=( ( g*P0^(1/g)*P_atm^((g-1)/g) - P0)/(1-g) + P_atm); % needsgamma=g%den1=P_atm/(1-g_a)* ( 1-(P_atm/Ps)^((1-g_a)/g_a) ) + P_atm* ((P_atm/Ps)^(1/g_a)-1 ); % needs gamma_air=g_a%den2=(Ps^((g_a-1)/g_a)*P_atm^(1/g_a)-Ps^(-1/g_a)*P_atm^((g_a+1)/g_a));% needs gamma_air=g_a%Vc0overV0=num/(den1+den2);%Vc0=(Vc0overV0)*V0; % compressor area (max vol) - will be a large multof V0!!%eff_comp= (Vc0/V0) * (Ps^((g_a-1)/g_a)*P_atm^(1/g_a)-Ps^(-1/g_a)*P_atm^((g_a+1)/g_a)) / ( ( g*P0^(1/g)*P_atm^((g-1)/g) - P0)/(1-g) + P_atm);%eff_comp1= Vc0overV0 * (Ps^((g_a-1)/g_a)*P_atm^(1/g_a)-Ps^(-1/g_a)*P_atm^((g_a+1)/g_a)) / ( ( g*P0^(1/g)*P_atm^((g-1)/g) - P0)/(1-g) + P_atm);% disp(['Compressor Efficiency (formula1) = ' num2str(eff_comp*100) '%']);
%eff_tot=(R*T_ADT/e) * (Vc0/V0) * (Ps^((g_a-1)/g_a)*P_atm^(1/g_a)-Ps^(-1/g_a)*P_atm^((g_a+1)/g_a))/P0;
disp(['Combustion chamber intial volume Ve0 = ' num2str(V0*100^3) 'cm^3']);disp(['Required compressor volume Vc0 = ' num2str(V0/Ve0overVc*100^3) 'cm^3']);disp(['Combustion chamber final volume Vef (down to Patm) = 'num2str(((P_init*V0^g/P_atm)^(1/g))*100^3) ' cm^3']);
143
Matlab function used to evaluate SIMULINK diagram shown in Figure A-8 (used to generate simulation data for Manuscript 2): %% Eric J. Barth%% 8/10/04
%% general/deviceM=2/2.2; % mass of pistons, linkages, bearings (kg)cv_air=717.75; % in (m^2)/(sec^2.K)R_air=287.1;cp_air=cv_air+R_air;gamma=1.4;cv_mix=656.75; % mix=air+propane stoichiometricR_mix=262.7;cp_mix=cv_mix+R_mix;P_atm=14.7*101000/14.7; % atmosphereic pressure (Pa)spec_energy_propane=46300; % in kJ/(kg propane) (lower heating value)spec_energy_mix=2787.13; % in kJ/(kg mix)l=4*2.54/100; % length (m)%Av=(3/1000)^2; % valve areaAv=1e-5; % valve coefficient (linear mass flow approx)H_cond=0*1; % 1/R linear heat transfer conductance
%% power pistonA=pi*( 1.25 /2*2.54/100)^2; % Area of power piston (in to m^2)P_init=(650+14.7)*101000/14.7; % initial combustion pressure atx=x_deadvol (Pa)Vmax=A*l;V_dot0=0;T_ADT=1900+273; % temperature of combustion (K)P_inj=P_init*(22+273)/T_ADT;Fs=2*P_inj*A; % hold against injection pressure (or constant forcespring if k=0)k= 700 /12/2.54*100*4.46; % spring constant (lbs/ft to N/m) - starts atVfcx_dead=0.149*2.54/100; % dead space giving volume of initial combustion(m)V0=A*x_dead;x_mag=1/1000; % magnetic gap (m)k_mag=Fs*x_mag^2; % required constant to provide Fs at x_magVfc=(P_init*(V0^gamma)/P_atm)^(1/gamma); % volume where combustionpressure gets down to atmospheric pressurem_mix=P_inj*(x_dead*A)/R_mix/(22+273); % mass of gasses in power piston(propane + air) (kg)m_air=m_mix*15.63/16.63;
%% pump piston (loads)Al=pi*( 1.25 /2*2.54/100)^2; % Area of pump piston (m^2)y_dead=0.01*2.54/100; % for dead volume of pump (in to m)Vl0=Al*y_dead;Vlmax=Al*l;Vl_holes=1*Vlmax; % where side holes are on pump pistonP_comp=(80+14.7)*101000/14.7; % compressor tank pressure (Pa)P_cvd=1/3*101000/14.7; % check valve (both) pressure drop (Pa)m_gas_pump=(P_atm-P_cvd)*Vl0/287.1/(22+273); % mass of gasses in pumppiston (air) (kg)
144
T_room=22+273;T_pump_init=22+273;
% auto analysissim('folded_fpc_mag');go=0;while go,
%disp(x_dead/2.54*100);V0=A*x_dead;m_mix=P_inj*(x_dead*A)/R_mix/(22+273); % mass of gasses in power
piston (propane + air) (kg)m_air=m_mix*15.63/16.63;sim('folded_fpc_mag');x_max=max(x(:,2));if ((l-x_max)<=l/100)*((l-x_max)>l/1000),
go=0;elseif x_max<l,
x_dead=(1+(l-x_max)/l)*x_dead;else
x_dead=0.5*x_dead;end
end
disp(['Injection pressure (psig) = ' num2str(P_inj*14.7/101000-14.7)]);disp(['x_dead (in) = ' num2str(x_dead/2.54*100)]);dum=length(m_pumped(:,2));mp=m_pumped(dum,2);% pot energy stored in res after all coming to room temp:energy_in_res=(mp-m_air)*R_air*T_room; % also accounts for mass of airneeded for combustionT_final_F=min(T_power_piston_F(:,2));
%t_final_index=length(P_power_piston(:,1));%dum=find(P_pump_piston(:,2)>=(P_comp+P_cvd-0.01*101000/14.7));%if (isempty(dum)),% disp('Piston did not pump');%else% dum=find(P_power_piston(:,2)==P_power_piston(t_final_index,2));% t_index=dum(1);% x_open=x(t_index,2);% T_open=T_power_piston(t_index,2);% T_final=(x_open-x_dead)*(T_open)/(l-x_dead)+(l-x_open)*(22+273)/(l-x_dead);% T_final_F=(T_final-273)*9/5-32;% dum=find(P_pump_piston(:,2)>=(P_comp+P_cvd-0.01*101000/14.7));% t_index2=dum(1);% x_start_pump=x(t_index2,2);% y_pump=max(x(:,2))-x(t_index2,2);% y_pump_in=y_pump*100/2.54;% T_high=T_power_piston(1,2);% T_low=T_open;% eff=(T_high-T_low)/T_high*100;% %adiabatic_energy_stored=energy_stored(t_final_index,2);%%tot_adia_eff=adiabatic_energy_stored/(spec_energy_mix*1000*m_mix)*100;% % isothermal_energy_stored=y_pump*Al*P_comp; % wrong

145
% % tot_iso_eff=isothermal_energy_stored/(13000*1000*m_gas)*100; %wrong% dum=find(x(:,2)<=x_dead);% dum2=find(dum>50);%% t_cycle=x(dum(dum2(1)),1);% % res stored energy after heat loss down to room temp (see p.49)% V1=Al*(yl-x_dead);% m1=(P_atm-P_cvd)*V1/R_air/T_room;% T2=(P_comp+P_cvd)*Al*(yl-x_start_pump)/m1/R_air;% V2=Al*(yl-max(x(:,2)));% m2=(P_comp+P_cvd)*V2/R_air/T2;% V_res=(m1-m2-m_air)*R_air*T_room/P_comp; % also accounts for massof air needed for combustion% energy_in_res=P_comp*V_res;res_iso_eff=energy_in_res/(spec_energy_mix*1000*m_mix)*100;disp(['T_final = ' num2str(T_final_F) ' deg F']);disp(['Total Efficiency (inside res cool) = ' num2str(res_iso_eff) '%']);% disp(['Specific Work of engine = 'num2str(spec_energy_propane*eff/100) ' kJ/kg']);disp(['Total Specific Work (once inside res) = 'num2str(spec_energy_propane*res_iso_eff/100) ' kJ/kg']);dum=find(x(:,2)<=x_dead);dum2=find(dum>50);if ~isempty(dum2),
t_cycle=x(dum(dum2(1)),1);disp(['Device cycle time = ' num2str(t_cycle) ' sec']);disp(['Device power output (res) = ' num2str(energy_in_res/t_cycle)
' Watts']);disp(['Device frequency = ' num2str(1/t_cycle) ' Hz']);disp(' ')
end
APPENDIX C
ADDITIONAL EXPERIMENTAL DATA FROM MANUSCRIPT 2 ('Pump-on-Return' Version of FPC)
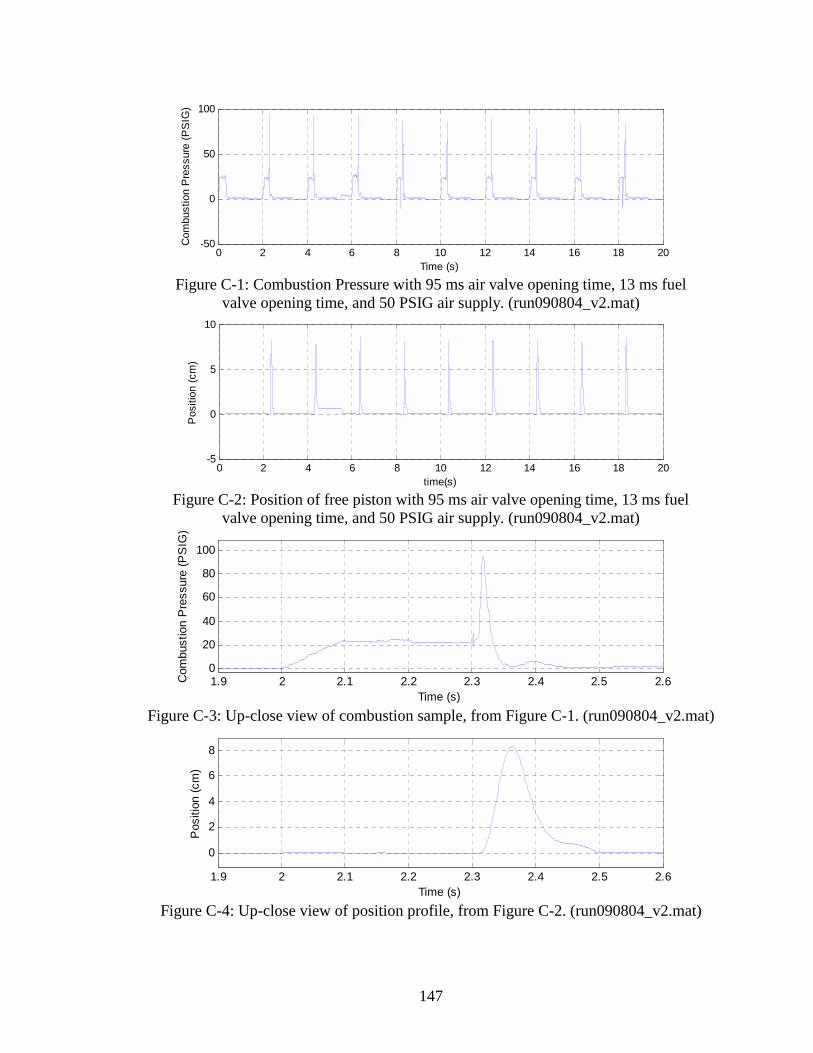
147
0 2 4 6 8 10 12 14 16 18 20-50
0
50
100
Time (s)
Com
bust
ion
Pre
ssur
e (P
SIG
)
Figure C-1: Combustion Pressure with 95 ms air valve opening time, 13 ms fuel
valve opening time, and 50 PSIG air supply. (run090804_v2.mat)
0 2 4 6 8 10 12 14 16 18 20-5
0
5
10
time(s)
Pos
ition
(cm
)
Figure C-2: Position of free piston with 95 ms air valve opening time, 13 ms fuel
valve opening time, and 50 PSIG air supply. (run090804_v2.mat)
1.9 2 2.1 2.2 2.3 2.4 2.5 2.60
20
40
60
80
100
Time (s)
Com
bust
ion
Pre
ssur
e (P
SIG
)
Figure C-3: Up-close view of combustion sample, from Figure C-1. (run090804_v2.mat)
1.9 2 2.1 2.2 2.3 2.4 2.5 2.6
0
2
4
6
8
Time (s)
Pos
ition
(cm
)
Figure C-4: Up-close view of position profile, from Figure C-2. (run090804_v2.mat)
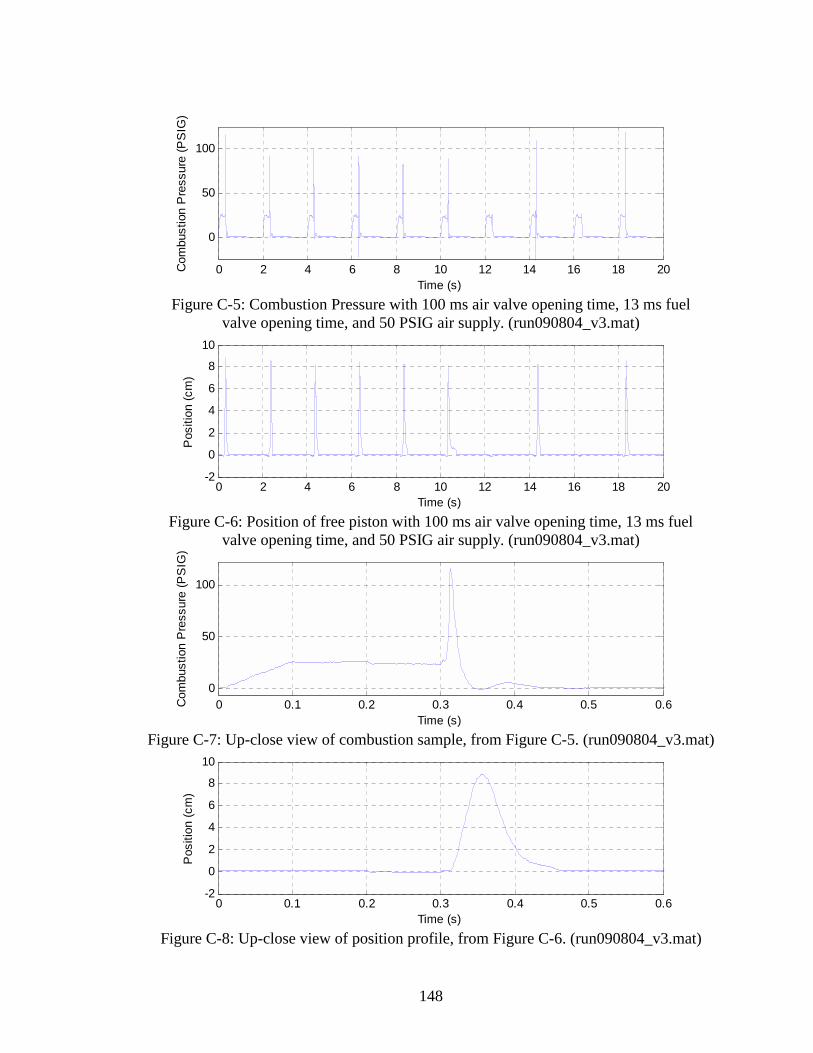
148
0 2 4 6 8 10 12 14 16 18 20
0
50
100
Time (s)
Com
bust
ion
Pre
ssur
e (P
SIG
)
Figure C-5: Combustion Pressure with 100 ms air valve opening time, 13 ms fuel
valve opening time, and 50 PSIG air supply. (run090804_v3.mat)
0 2 4 6 8 10 12 14 16 18 20-2
0
2
4
6
8
10
Time (s)
Pos
ition
(cm
)
Figure C-6: Position of free piston with 100 ms air valve opening time, 13 ms fuel
valve opening time, and 50 PSIG air supply. (run090804_v3.mat)
0 0.1 0.2 0.3 0.4 0.5 0.60
50
100
Time (s)
Com
bust
ion
Pre
ssur
e (P
SIG
)
Figure C-7: Up-close view of combustion sample, from Figure C-5. (run090804_v3.mat)
0 0.1 0.2 0.3 0.4 0.5 0.6-2
0
2
4
6
8
10
Time (s)
Pos
ition
(cm
)
Figure C-8: Up-close view of position profile, from Figure C-6. (run090804_v3.mat)
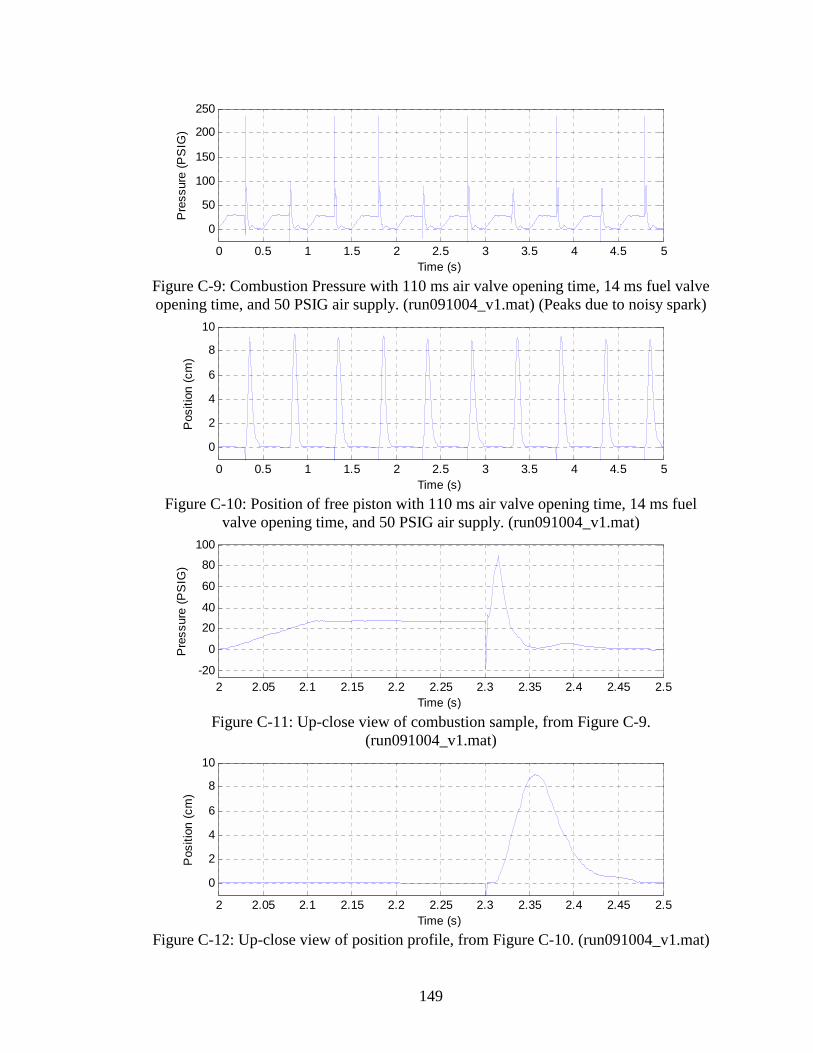
149
0 0.5 1 1.5 2 2.5 3 3.5 4 4.5 5
0
50
100
150
200
250
Time (s)
Pre
ssur
e (P
SIG
)
Figure C-9: Combustion Pressure with 110 ms air valve opening time, 14 ms fuel valve opening time, and 50 PSIG air supply. (run091004_v1.mat) (Peaks due to noisy spark)
0 0.5 1 1.5 2 2.5 3 3.5 4 4.5 5
0
2
4
6
8
10
Time (s)
Pos
ition
(cm
)
Figure C-10: Position of free piston with 110 ms air valve opening time, 14 ms fuel
valve opening time, and 50 PSIG air supply. (run091004_v1.mat)
2 2.05 2.1 2.15 2.2 2.25 2.3 2.35 2.4 2.45 2.5-20
0
20
40
60
80
100
Time (s)
Pre
ssur
e (P
SIG
)
Figure C-11: Up-close view of combustion sample, from Figure C-9.
(run091004_v1.mat)
2 2.05 2.1 2.15 2.2 2.25 2.3 2.35 2.4 2.45 2.5
0
2
4
6
8
10
Time (s)
Pos
ition
(cm
)
Figure C-12: Up-close view of position profile, from Figure C-10. (run091004_v1.mat)
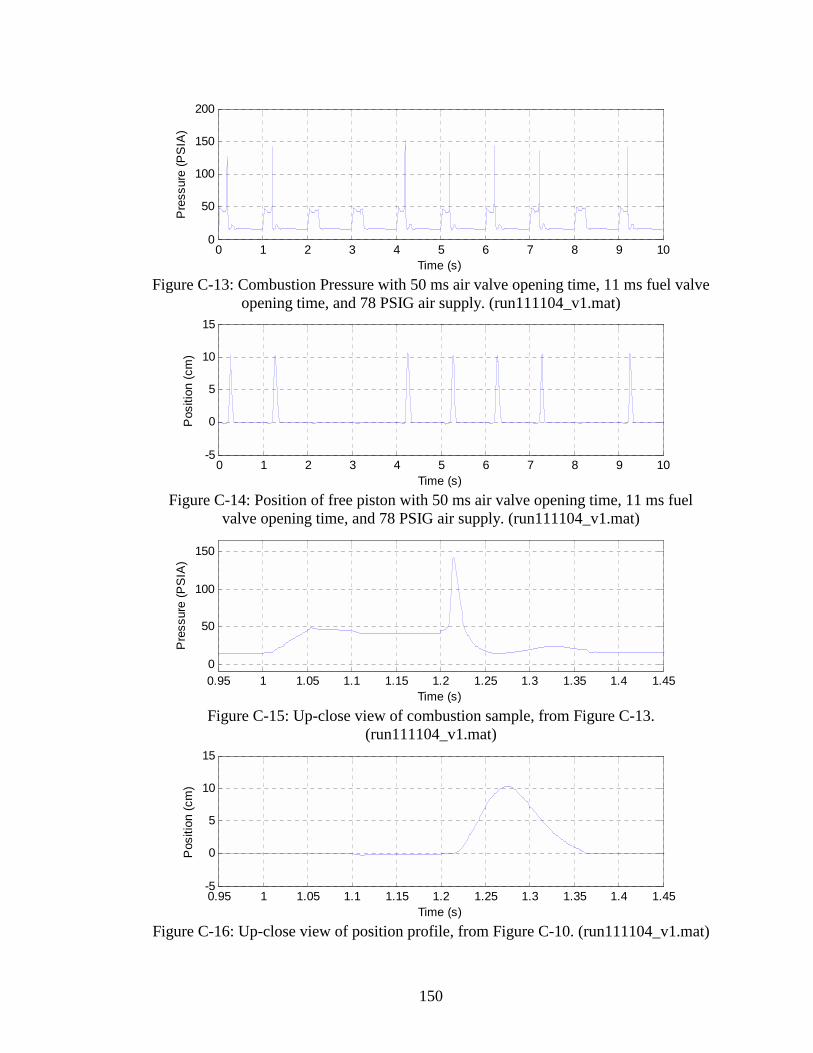
150
0 1 2 3 4 5 6 7 8 9 100
50
100
150
200
Time (s)
Pre
ssur
e (P
SIA
)
Figure C-13: Combustion Pressure with 50 ms air valve opening time, 11 ms fuel valve
opening time, and 78 PSIG air supply. (run111104_v1.mat)
0 1 2 3 4 5 6 7 8 9 10-5
0
5
10
15
Time (s)
Pos
ition
(cm
)
Figure C-14: Position of free piston with 50 ms air valve opening time, 11 ms fuel
valve opening time, and 78 PSIG air supply. (run111104_v1.mat)
0.95 1 1.05 1.1 1.15 1.2 1.25 1.3 1.35 1.4 1.450
50
100
150
Time (s)
Pre
ssur
e (P
SIA
)
Figure C-15: Up-close view of combustion sample, from Figure C-13.
(run111104_v1.mat)
0.95 1 1.05 1.1 1.15 1.2 1.25 1.3 1.35 1.4 1.45-5
0
5
10
15
Time (s)
Pos
ition
(cm
)
Figure C-16: Up-close view of position profile, from Figure C-10. (run111104_v1.mat)
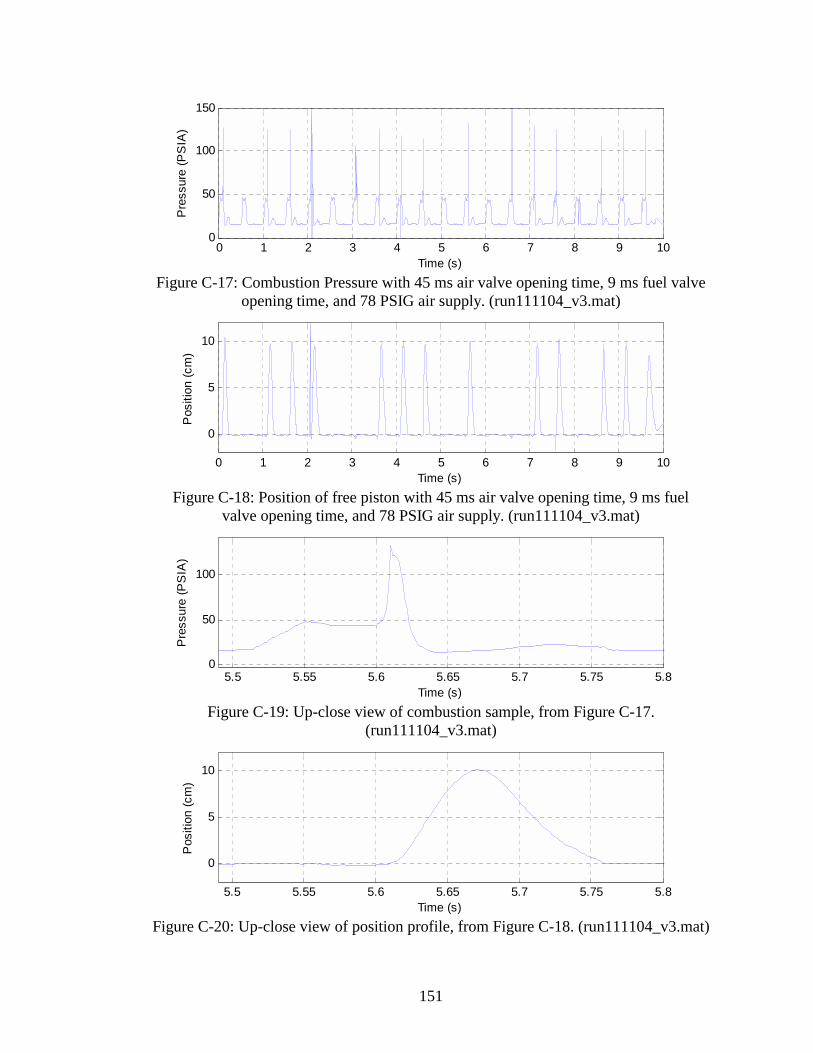
151
0 1 2 3 4 5 6 7 8 9 100
50
100
150
Time (s)
Pre
ssur
e (P
SIA
)
Figure C-17: Combustion Pressure with 45 ms air valve opening time, 9 ms fuel valve
opening time, and 78 PSIG air supply. (run111104_v3.mat)
0 1 2 3 4 5 6 7 8 9 10
0
5
10
Time (s)
Pos
ition
(cm
)
Figure C-18: Position of free piston with 45 ms air valve opening time, 9 ms fuel
valve opening time, and 78 PSIG air supply. (run111104_v3.mat)
5.5 5.55 5.6 5.65 5.7 5.75 5.80
50
100
Time (s)
Pre
ssur
e (P
SIA
)
Figure C-19: Up-close view of combustion sample, from Figure C-17.
(run111104_v3.mat)
5.5 5.55 5.6 5.65 5.7 5.75 5.8
0
5
10
Time (s)
Pos
ition
(cm
)
Figure C-20: Up-close view of position profile, from Figure C-18. (run111104_v3.mat)
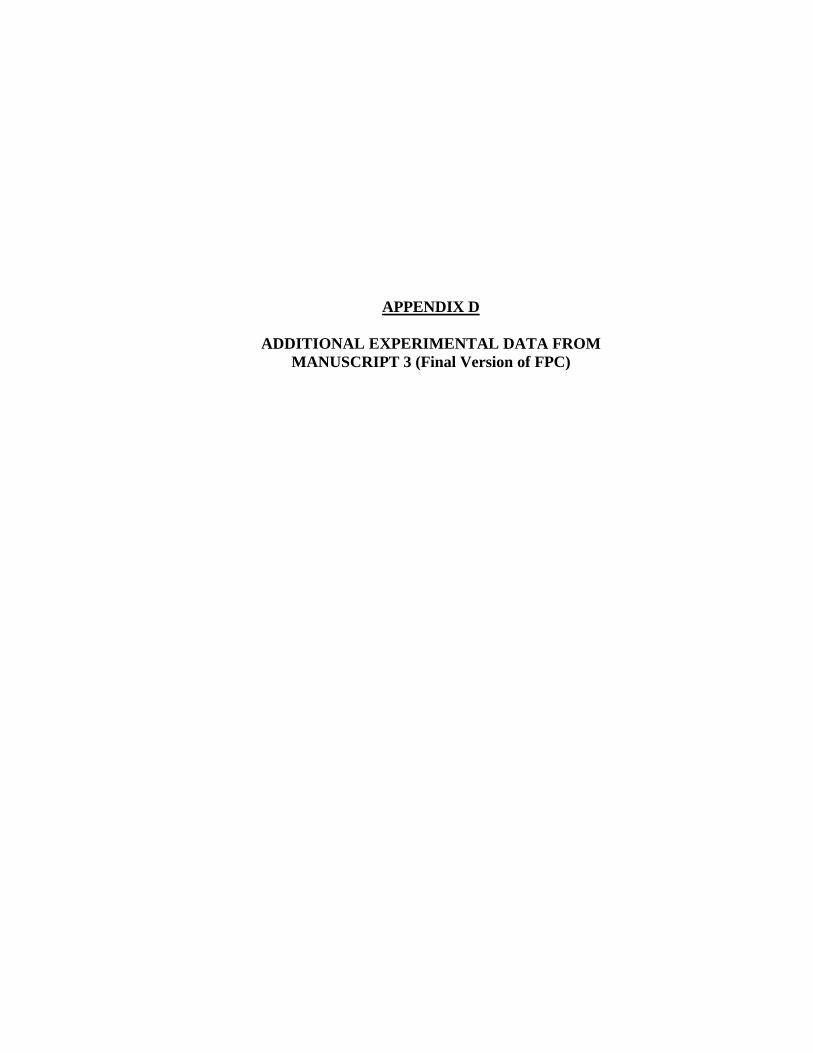
APPENDIX D
ADDITIONAL EXPERIMENTAL DATA FROM MANUSCRIPT 3 (Final Version of FPC)
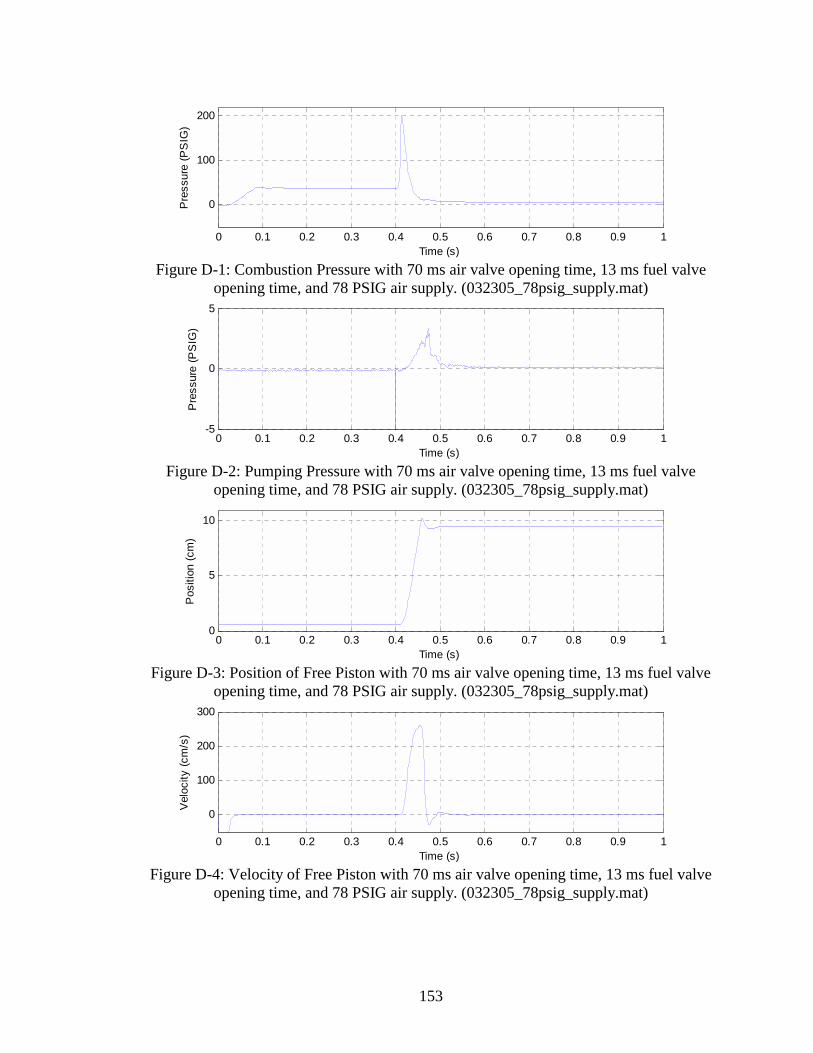
153
0 0.1 0.2 0.3 0.4 0.5 0.6 0.7 0.8 0.9 1
0
100
200
Time (s)
Pre
ssur
e (P
SIG
)
Figure D-1: Combustion Pressure with 70 ms air valve opening time, 13 ms fuel valve
opening time, and 78 PSIG air supply. (032305_78psig_supply.mat)
0 0.1 0.2 0.3 0.4 0.5 0.6 0.7 0.8 0.9 1-5
0
5
Time (s)
Pre
ssur
e (P
SIG
)
Figure D-2: Pumping Pressure with 70 ms air valve opening time, 13 ms fuel valve
opening time, and 78 PSIG air supply. (032305_78psig_supply.mat)
0 0.1 0.2 0.3 0.4 0.5 0.6 0.7 0.8 0.9 10
5
10
Time (s)
Pos
ition
(cm
)
Figure D-3: Position of Free Piston with 70 ms air valve opening time, 13 ms fuel valve
opening time, and 78 PSIG air supply. (032305_78psig_supply.mat)
0 0.1 0.2 0.3 0.4 0.5 0.6 0.7 0.8 0.9 1
0
100
200
300
Time (s)
Vel
ocity
(cm
/s)
Figure D-4: Velocity of Free Piston with 70 ms air valve opening time, 13 ms fuel valve
opening time, and 78 PSIG air supply. (032305_78psig_supply.mat)
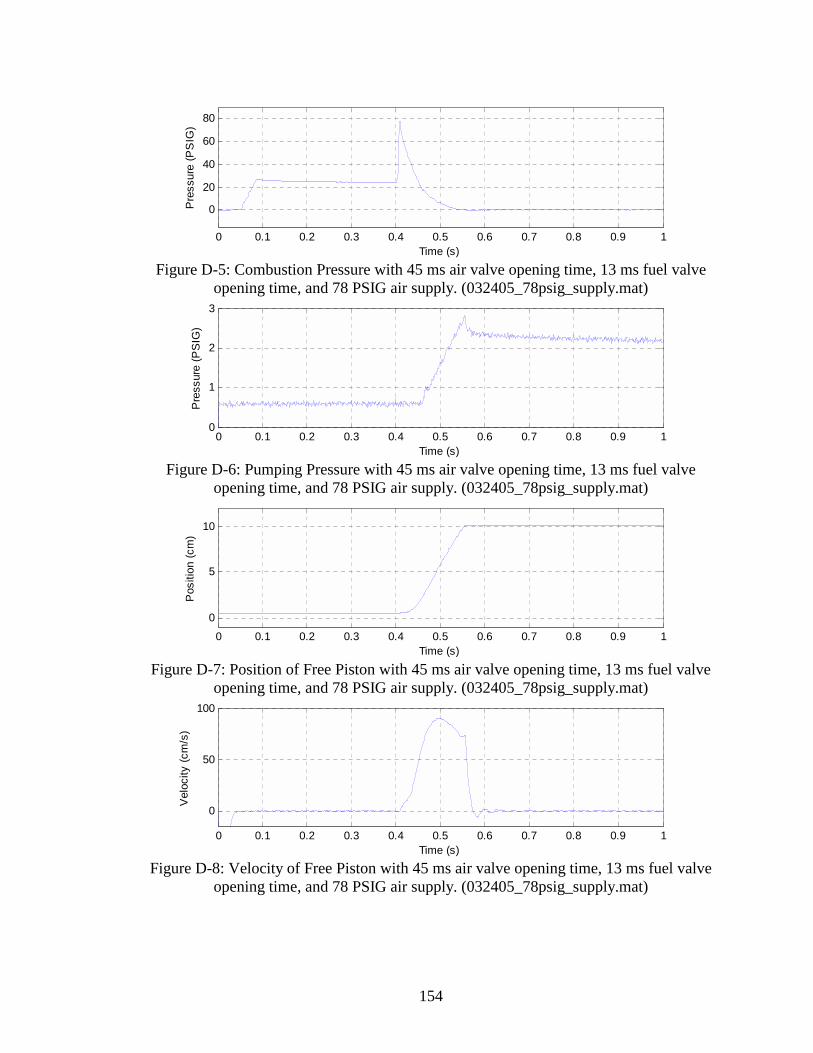
154
0 0.1 0.2 0.3 0.4 0.5 0.6 0.7 0.8 0.9 1
0
20
40
60
80
Time (s)
Pre
ssur
e (P
SIG
)
Figure D-5: Combustion Pressure with 45 ms air valve opening time, 13 ms fuel valve
opening time, and 78 PSIG air supply. (032405_78psig_supply.mat)
0 0.1 0.2 0.3 0.4 0.5 0.6 0.7 0.8 0.9 10
1
2
3
Time (s)
Pre
ssur
e (P
SIG
)
Figure D-6: Pumping Pressure with 45 ms air valve opening time, 13 ms fuel valve
opening time, and 78 PSIG air supply. (032405_78psig_supply.mat)
0 0.1 0.2 0.3 0.4 0.5 0.6 0.7 0.8 0.9 1
0
5
10
Time (s)
Pos
ition
(cm
)
Figure D-7: Position of Free Piston with 45 ms air valve opening time, 13 ms fuel valve
opening time, and 78 PSIG air supply. (032405_78psig_supply.mat)
0 0.1 0.2 0.3 0.4 0.5 0.6 0.7 0.8 0.9 1
0
50
100
Time (s)
Vel
ocity
(cm
/s)
Figure D-8: Velocity of Free Piston with 45 ms air valve opening time, 13 ms fuel valve
opening time, and 78 PSIG air supply. (032405_78psig_supply.mat)
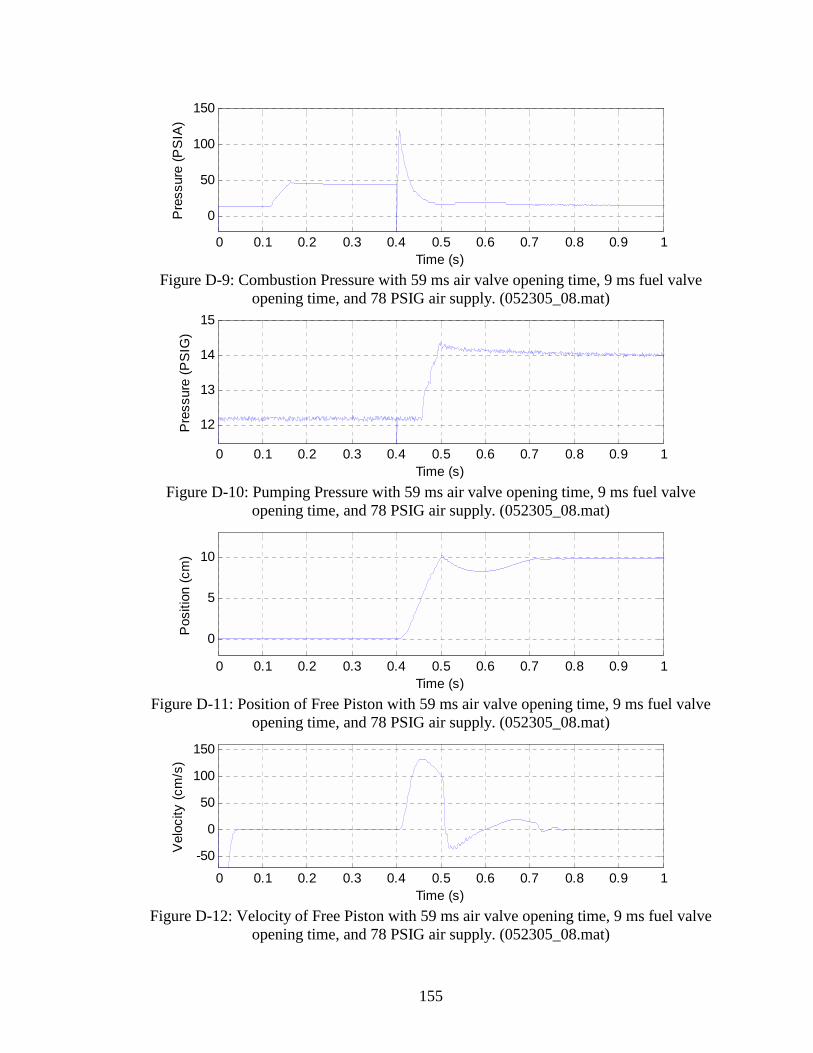
155
0 0.1 0.2 0.3 0.4 0.5 0.6 0.7 0.8 0.9 1
0
50
100
150
Time (s)
Pre
ssur
e (P
SIA
)
Figure D-9: Combustion Pressure with 59 ms air valve opening time, 9 ms fuel valve
opening time, and 78 PSIG air supply. (052305_08.mat)
0 0.1 0.2 0.3 0.4 0.5 0.6 0.7 0.8 0.9 1
12
13
14
15
Time (s)
Pre
ssur
e (P
SIG
)
Figure D-10: Pumping Pressure with 59 ms air valve opening time, 9 ms fuel valve
opening time, and 78 PSIG air supply. (052305_08.mat)
0 0.1 0.2 0.3 0.4 0.5 0.6 0.7 0.8 0.9 1
0
5
10
Time (s)
Pos
ition
(cm
)
Figure D-11: Position of Free Piston with 59 ms air valve opening time, 9 ms fuel valve
opening time, and 78 PSIG air supply. (052305_08.mat)
0 0.1 0.2 0.3 0.4 0.5 0.6 0.7 0.8 0.9 1
-50
0
50
100
150
Time (s)
Vel
ocity
(cm
/s)
Figure D-12: Velocity of Free Piston with 59 ms air valve opening time, 9 ms fuel valve
opening time, and 78 PSIG air supply. (052305_08.mat)
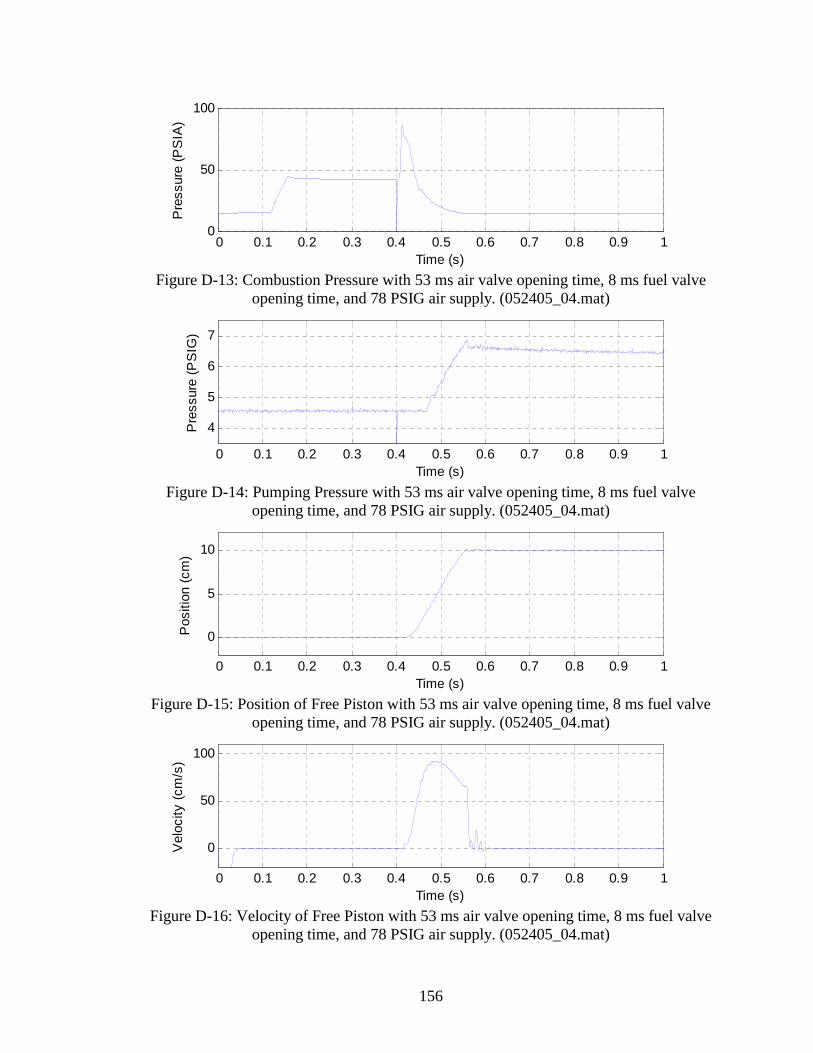
156
0 0.1 0.2 0.3 0.4 0.5 0.6 0.7 0.8 0.9 10
50
100
Time (s)
Pre
ssur
e (P
SIA
)
Figure D-13: Combustion Pressure with 53 ms air valve opening time, 8 ms fuel valve
opening time, and 78 PSIG air supply. (052405_04.mat)
0 0.1 0.2 0.3 0.4 0.5 0.6 0.7 0.8 0.9 1
4
5
6
7
Time (s)
Pre
ssur
e (P
SIG
)
Figure D-14: Pumping Pressure with 53 ms air valve opening time, 8 ms fuel valve
opening time, and 78 PSIG air supply. (052405_04.mat)
0 0.1 0.2 0.3 0.4 0.5 0.6 0.7 0.8 0.9 1
0
5
10
Time (s)
Pos
ition
(cm
)
Figure D-15: Position of Free Piston with 53 ms air valve opening time, 8 ms fuel valve
opening time, and 78 PSIG air supply. (052405_04.mat)
0 0.1 0.2 0.3 0.4 0.5 0.6 0.7 0.8 0.9 1
0
50
100
Time (s)
Vel
ocity
(cm
/s)
Figure D-16: Velocity of Free Piston with 53 ms air valve opening time, 8 ms fuel valve
opening time, and 78 PSIG air supply. (052405_04.mat)
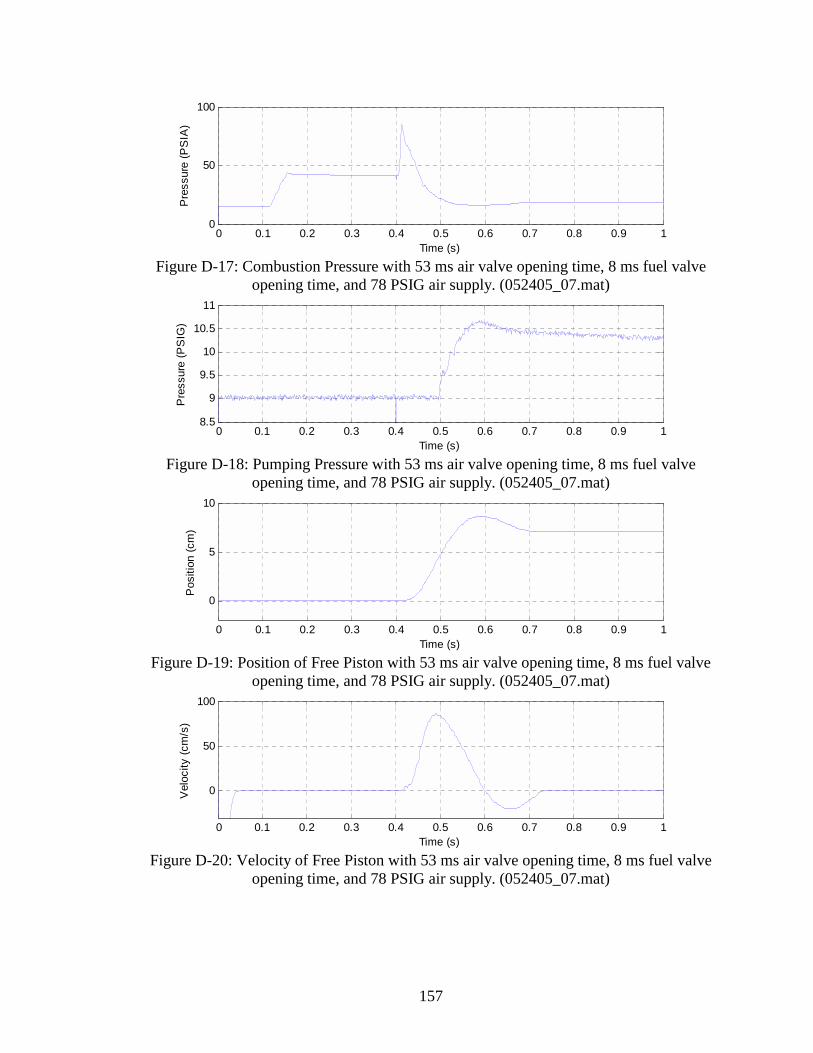
157
0 0.1 0.2 0.3 0.4 0.5 0.6 0.7 0.8 0.9 10
50
100
Time (s)
Pre
ssur
e (P
SIA
)
Figure D-17: Combustion Pressure with 53 ms air valve opening time, 8 ms fuel valve
opening time, and 78 PSIG air supply. (052405_07.mat)
0 0.1 0.2 0.3 0.4 0.5 0.6 0.7 0.8 0.9 18.5
9
9.5
10
10.5
11
Time (s)
Pre
ssur
e (P
SIG
)
Figure D-18: Pumping Pressure with 53 ms air valve opening time, 8 ms fuel valve
opening time, and 78 PSIG air supply. (052405_07.mat)
0 0.1 0.2 0.3 0.4 0.5 0.6 0.7 0.8 0.9 1
0
5
10
Time (s)
Pos
ition
(cm
)
Figure D-19: Position of Free Piston with 53 ms air valve opening time, 8 ms fuel valve
opening time, and 78 PSIG air supply. (052405_07.mat)
0 0.1 0.2 0.3 0.4 0.5 0.6 0.7 0.8 0.9 1
0
50
100
Time (s)
Vel
ocity
(cm
/s)
Figure D-20: Velocity of Free Piston with 53 ms air valve opening time, 8 ms fuel valve
opening time, and 78 PSIG air supply. (052405_07.mat)
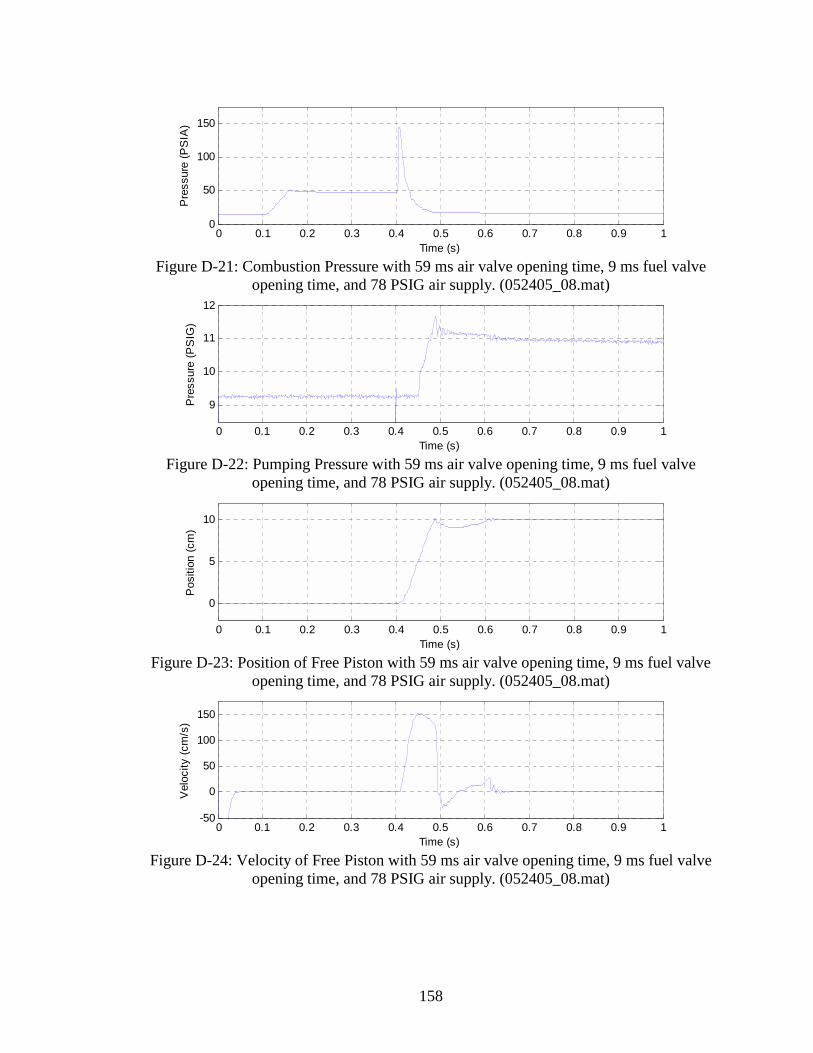
158
0 0.1 0.2 0.3 0.4 0.5 0.6 0.7 0.8 0.9 10
50
100
150
Time (s)
Pre
ssur
e (P
SIA
)
Figure D-21: Combustion Pressure with 59 ms air valve opening time, 9 ms fuel valve
opening time, and 78 PSIG air supply. (052405_08.mat)
0 0.1 0.2 0.3 0.4 0.5 0.6 0.7 0.8 0.9 1
9
10
11
12
Time (s)
Pre
ssur
e (P
SIG
)
Figure D-22: Pumping Pressure with 59 ms air valve opening time, 9 ms fuel valve
opening time, and 78 PSIG air supply. (052405_08.mat)
0 0.1 0.2 0.3 0.4 0.5 0.6 0.7 0.8 0.9 1
0
5
10
Time (s)
Pos
ition
(cm
)
Figure D-23: Position of Free Piston with 59 ms air valve opening time, 9 ms fuel valve
opening time, and 78 PSIG air supply. (052405_08.mat)
0 0.1 0.2 0.3 0.4 0.5 0.6 0.7 0.8 0.9 1-50
0
50
100
150
Time (s)
Vel
ocity
(cm
/s)
Figure D-24: Velocity of Free Piston with 59 ms air valve opening time, 9 ms fuel valve
opening time, and 78 PSIG air supply. (052405_08.mat)
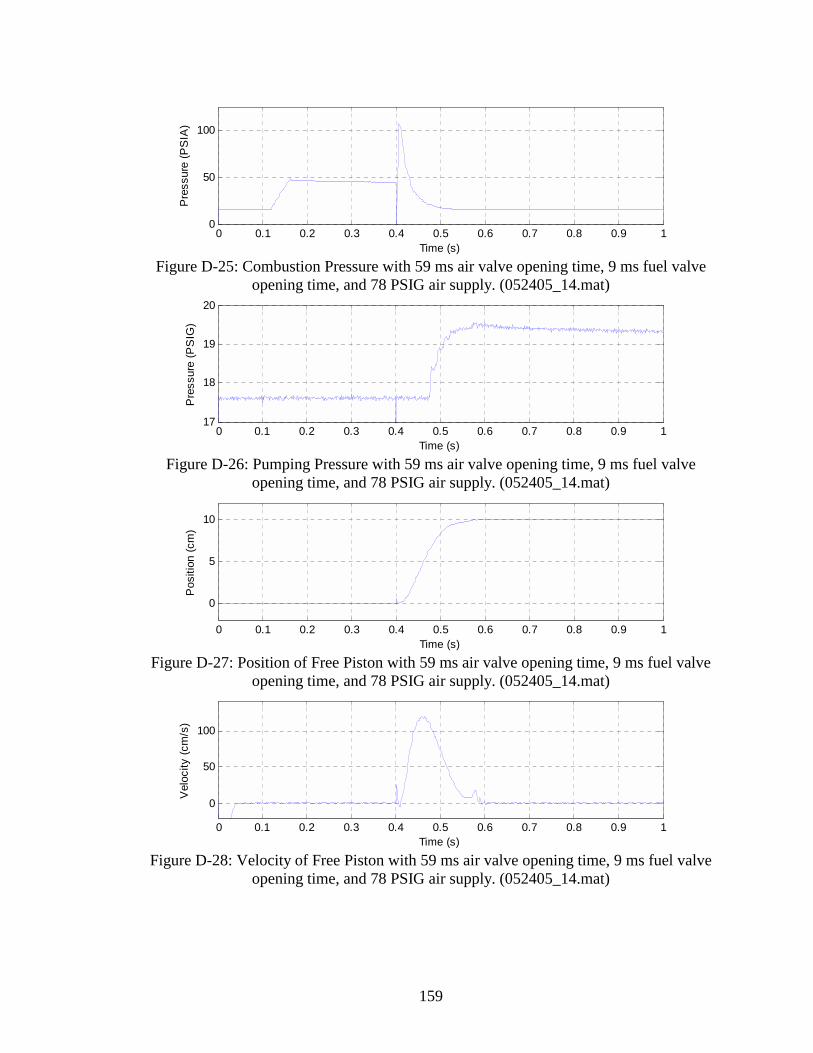
159
0 0.1 0.2 0.3 0.4 0.5 0.6 0.7 0.8 0.9 10
50
100
Time (s)
Pre
ssur
e (P
SIA
)
Figure D-25: Combustion Pressure with 59 ms air valve opening time, 9 ms fuel valve
opening time, and 78 PSIG air supply. (052405_14.mat)
0 0.1 0.2 0.3 0.4 0.5 0.6 0.7 0.8 0.9 117
18
19
20
Time (s)
Pre
ssur
e (P
SIG
)
Figure D-26: Pumping Pressure with 59 ms air valve opening time, 9 ms fuel valve
opening time, and 78 PSIG air supply. (052405_14.mat)
0 0.1 0.2 0.3 0.4 0.5 0.6 0.7 0.8 0.9 1
0
5
10
Time (s)
Pos
ition
(cm
)
Figure D-27: Position of Free Piston with 59 ms air valve opening time, 9 ms fuel valve
opening time, and 78 PSIG air supply. (052405_14.mat)
0 0.1 0.2 0.3 0.4 0.5 0.6 0.7 0.8 0.9 1
0
50
100
Time (s)
Vel
ocity
(cm
/s)
Figure D-28: Velocity of Free Piston with 59 ms air valve opening time, 9 ms fuel valve
opening time, and 78 PSIG air supply. (052405_14.mat)
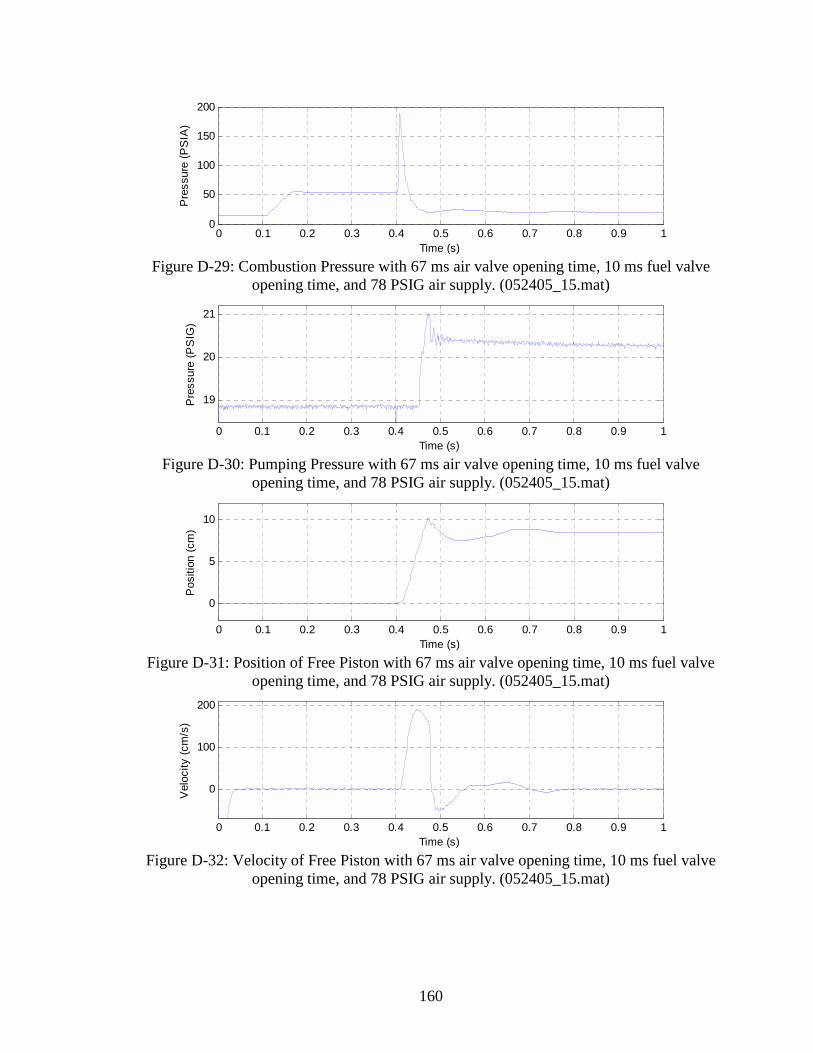
160
0 0.1 0.2 0.3 0.4 0.5 0.6 0.7 0.8 0.9 10
50
100
150
200
Time (s)
Pre
ssur
e (P
SIA
)
Figure D-29: Combustion Pressure with 67 ms air valve opening time, 10 ms fuel valve
opening time, and 78 PSIG air supply. (052405_15.mat)
0 0.1 0.2 0.3 0.4 0.5 0.6 0.7 0.8 0.9 1
19
20
21
Time (s)
Pre
ssur
e (P
SIG
)
Figure D-30: Pumping Pressure with 67 ms air valve opening time, 10 ms fuel valve
opening time, and 78 PSIG air supply. (052405_15.mat)
0 0.1 0.2 0.3 0.4 0.5 0.6 0.7 0.8 0.9 1
0
5
10
Time (s)
Pos
ition
(cm
)
Figure D-31: Position of Free Piston with 67 ms air valve opening time, 10 ms fuel valve
opening time, and 78 PSIG air supply. (052405_15.mat)
0 0.1 0.2 0.3 0.4 0.5 0.6 0.7 0.8 0.9 1
0
100
200
Time (s)
Vel
ocity
(cm
/s)
Figure D-32: Velocity of Free Piston with 67 ms air valve opening time, 10 ms fuel valve
opening time, and 78 PSIG air supply. (052405_15.mat)
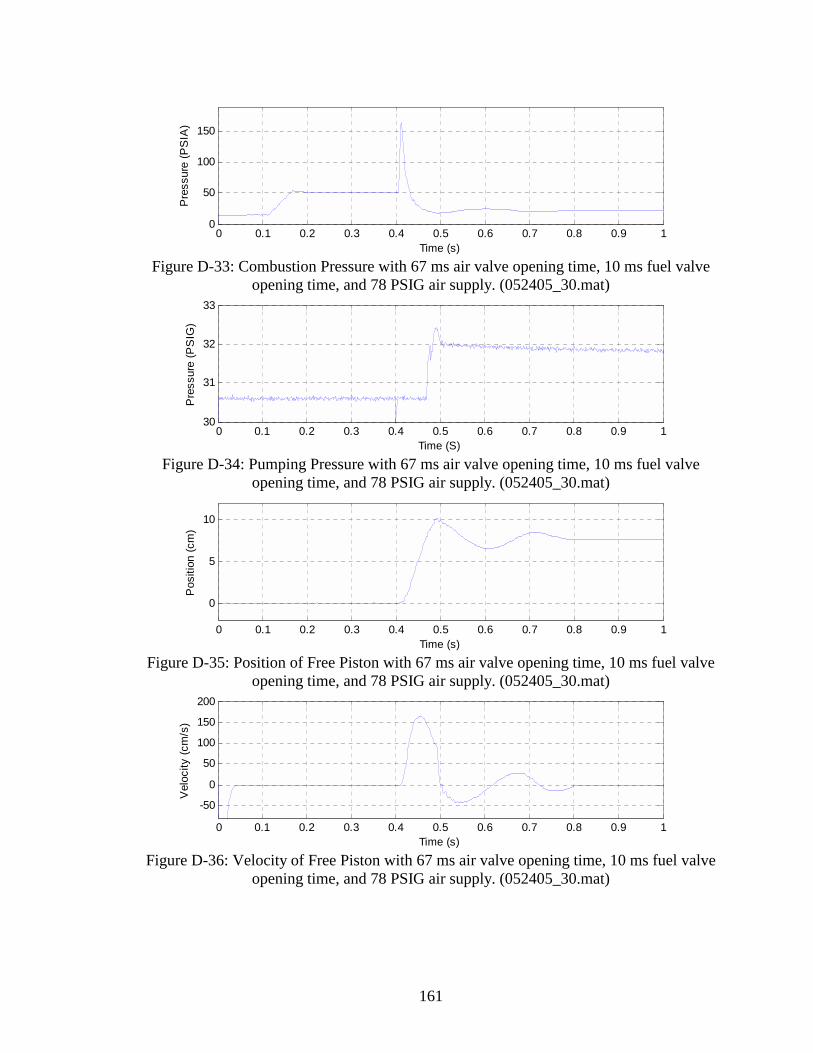
161
0 0.1 0.2 0.3 0.4 0.5 0.6 0.7 0.8 0.9 10
50
100
150
Time (s)
Pre
ssur
e (P
SIA
)
Figure D-33: Combustion Pressure with 67 ms air valve opening time, 10 ms fuel valve
opening time, and 78 PSIG air supply. (052405_30.mat)
0 0.1 0.2 0.3 0.4 0.5 0.6 0.7 0.8 0.9 130
31
32
33
Time (S)
Pre
ssur
e (P
SIG
)
Figure D-34: Pumping Pressure with 67 ms air valve opening time, 10 ms fuel valve
opening time, and 78 PSIG air supply. (052405_30.mat)
0 0.1 0.2 0.3 0.4 0.5 0.6 0.7 0.8 0.9 1
0
5
10
Time (s)
Pos
ition
(cm
)
Figure D-35: Position of Free Piston with 67 ms air valve opening time, 10 ms fuel valve
opening time, and 78 PSIG air supply. (052405_30.mat)
0 0.1 0.2 0.3 0.4 0.5 0.6 0.7 0.8 0.9 1
-50
0
50
100
150
200
Time (s)
Vel
ocity
(cm
/s)
Figure D-36: Velocity of Free Piston with 67 ms air valve opening time, 10 ms fuel valve
opening time, and 78 PSIG air supply. (052405_30.mat)