Embed Size (px)
DESCRIPTION
Journal of Telecommunications, ISSN 2042-8839, Volume 27, Issue 1, September 2014 www.journaloftelecommunications.co.uk
Citation preview
JOURNAL OF TELECOMMUNICATIONS, VOLUME 27, ISSUE 1, SEPTEMBER 2014
9
Design and Implementation a Real Time Healthcare System Based on WSN
Murtadha G. Kadhim, Samir J. Mohammed, and Ali Al-Sherbaz
Abstract— The development of monitoring systems of healthcare on the basis of WSN has seen a significant increase on a
large scale in previous years. These systems are more prevalent because of the importance of human life and the provision of
appropriate technologies to be applied. Therefore it must be appropriate to the requirements of healthcare. In this paper, a real-
time healthcare monitoring system based on WSN is designed. The system senses and displays ECG, SPO2, Heart Rate (HR),
Breathing, respiratory rate, Blood pressure and temperature of a patient. A new algorithm is developed in this paper to measure
a respiratory rate from breathing (Airflow sensor). The system features a friendly GUI in base station which is easy to use, and
very simple to administer by a specialist doctor. The network technology, which is used in the system is a star topology with
wireless ZigBee protocol. In base station, LabVIEW software and Visual studio 2012 are used to do tasks such as a processing,
monitoring, graphical user interface, reporting, and alarming. The aim of this paper is to design a real time healthcare monitoring
and alarming system using WSN for sensing breathing, ECG, temperature, SPO2, and blood pressure through Zigbee protocol.
Index Terms— E-health, Healthcare monitoring, Respiratory rate, Wireless sensor network
—————————— ——————————
1 INTRODUCTION
he medical applications of wireless sensor networks aim to improve the existing healthcare and monitor-ing services especially for the elderly, children and
chronically ill people. The application of WSNs to health has attracted a significant amount of interest . When ap-plied to biomedical applications they are often referred to as wireless biomedical sensor networks (WBSNs). A wide range of health relevant values, including electrocardio-gram(ECG), blood pressure, physical rehabilitation, pulse, respiration, blood oxygen saturation, skin temperature, and CO2 can be measured and processed by WBSNs [1].
WSN consists of individual nodes that are able to inte-ract with their environment by sensing or controlling physical parameters; these nodes have to collaborate to fulfill their tasks as, usually, a single node is incapable of doing so; and they use wireless communication to enable this collaboration [2]. The WSNs features are high reliabil-ity, low cost, low data rate, low power, and real-time. All these features make the WSN suitable for healthcare ap-plications. The sensors used in healthcare are Medical Sensors that combine transducers for detecting electrical, thermal, optical, chemical, genetic, and other signals to indicate the patient health status [3].
Healthcare systems are developed by researchers in the last decade, and the monitoring of health status of
patients deployed by wireless technologies. However, most of these systems are used to sense a few number of vital signs from limited number of patients and using one or two technologies to transfer data from patients to the destination. The main motivations to design the proposed system are: Design healthcare system to monitor larger number of patients, and extract more vital signs than sim-ilar previous works.
2 RELATED WORK
There are many projects in the healthcare field but they differ among them in many things such as number of sen-sors and type of them, type of base station, vital signs that the project is implemented to extract them, and the protocol of communication. So some of projects will be described depending on this important points as follows.
In CodeBlue [4], There are three sensors which are a pulse oximeter, two-lead electrocardiogram (EKG), and a specialized motion-analysis sensor by using RF-based localization system, every one of these sensors is attached to one node, these nodes connect to coordinator by pub-lish/subscribe multihop routing, and a simple query in-terface . Multipatient monitoring environments based on the ZigBee compliant MicaZ and Telos motes. The CodeB-lue prototype provides a Java-based graphical user inter-face (GUI) on a computer that is intended to be easy for medical personnel to use and which provides enough detail on patient status, sensors readings and location to identify trends, so the base station in CodeBlue is the computer.
While HealthGear [5] is a system to measure blood oxygen level (SpO2) only and send the measured value to smart phone via Bluetooth to display values of oxygen level in blood and heart rate. But in [6], There are three sensors is used which are a three-lead EKG, oxygen satu-
————————————————
Murtadha G. kadhim had B.Sc. Degree in in electrical engineering and is currently M.Sc. student in Electronic and Communication Engineering in the department of electrical engineering, university of Babylon, Hilla, Iraq
Samir J. Mohammed has Ph.D. degree in electrical engineering and profes-sor with the department of electrical engineering, university of Babylon, Hilla, Iraq.
Ali Al-Sherbaz is currently a Senior Lecturer in School of Science and technology and skilled Research Engineer in university of Northampton with a PhD in Wireless Communications and Network Security , and MSc in Electronic and Communication Engineering
T
10
ration and pulse rate, and temperature which is per-formed with the temperature sensor thermistor. All sen-sors is connected to one node called TelosB, Data trans-mission is handled by a ZigBee-compliant (IEEE 802.15.4) 2.4-GHz transceiver to gateway and then to base station( as laptop).
In the papers which are mentioned previously, we note that the number of sensors does not exceed three and they are often separated (each sensor is associated with node independently), and this the most important points present in the research that is mentioned and many of the recent research. As in [7], the micro sensor worn by the user starts to operate when powered on, sending connec-tion request to the smart phone via Bluetooth. The smart phone accepts the request from the micro sensor and sends a connection request to the remote IOCP main server. This project depends Bluetooth protocol to trans-mit data but the Bluetooth framework is often found to be vulnerable to possible attacks and risks [8], so it is not preferred to use. And in [9] there are two sensors which are ECG and temperature, every two of these sensors are connected to one node to collect three vital signs (ECG, heart rate, temperature), Three node in star topology con-nected by Zigbee protocol with the base station to dis-play the data on the GUI.
At last the health monitoring model [10] is based on the measurement of the Oxygen saturation SpO2, Heart rate and perfusion index with a non-invasive device. The critical data related to patient via respiratory rate, and urine concentration are collected from the hospitals in ‘csv’ data format for interfacing it with the LabVIEW pro-gram in base staion.
When the number of sensors which are used in the healthcare system are a few, it certainly leads to that the number of vital signs which are extracted from the patient a few also and this makes the monitoring of the patient's health is not sufficient, therefore it must be the increasing in number of sensors and find Algorithm to calculate more vital signs from the same sensor, and this is what happened in the healthcare system located in this paper. Many sensors are used in the projects which are stated previously such as ECG, blood pressure, temperature, respiratory rate, and SPO2 sensors .
The most commonly employed wireless communica-tion standards in BANs are IEEE 802.15.1 (Bluetooth) and 802.15.4 (widely referred to as Zigbee), The Zigbee stan-dard targets low-cost, low data-rate solutions with mul-timonth-to-multiyear battery life, and very low complexi-ty [8]. So Zigbee protocol will be depended in the pro-posed system for transmitting the vital signs from pa-tients nodes to the base station.
Labview is a suitable program with reliable GUI and easy for use, so this program will be depended in the de-signing and implementation the base station in the pro-posed system, in addition to use Labview program, it will be supported by visual studio 2012 to be more reliable and flexible.
3 RESEARCH METHOD
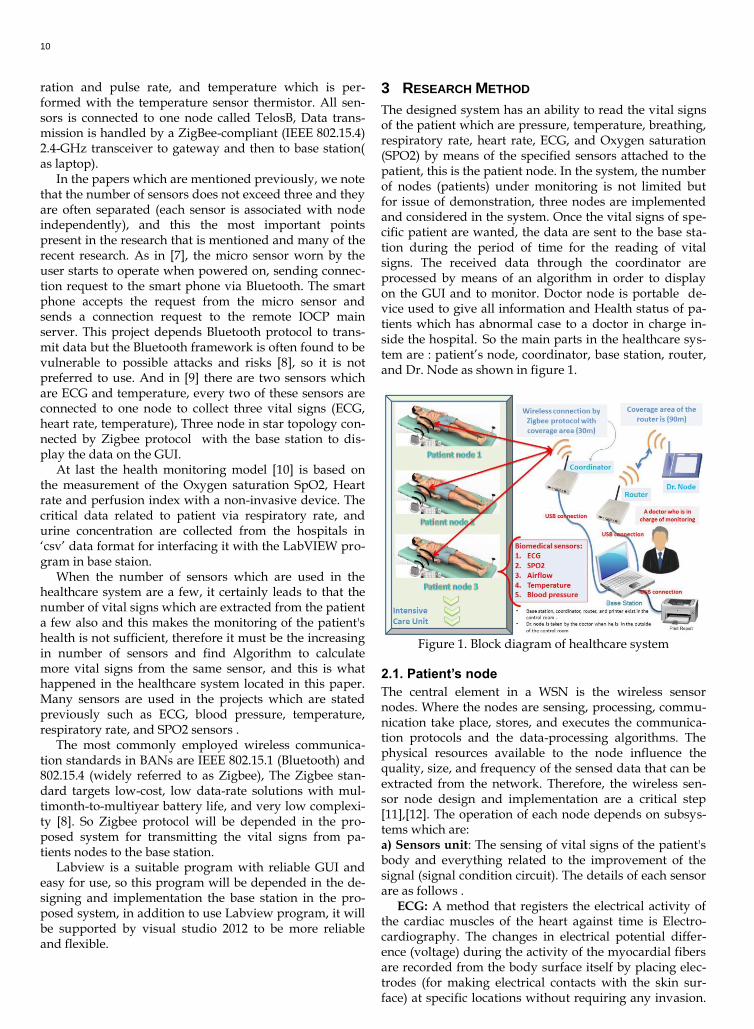
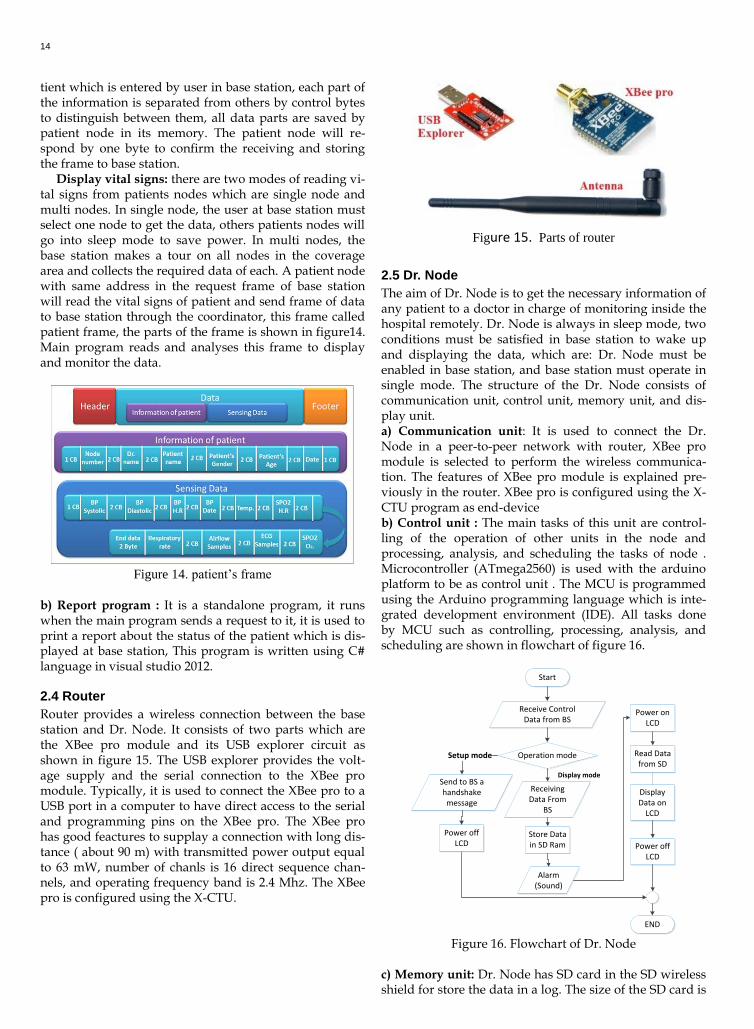
The designed system has an ability to read the vital signs of the patient which are pressure, temperature, breathing, respiratory rate, heart rate, ECG, and Oxygen saturation (SPO2) by means of the specified sensors attached to the patient, this is the patient node. In the system, the number of nodes (patients) under monitoring is not limited but for issue of demonstration, three nodes are implemented and considered in the system. Once the vital signs of spe-cific patient are wanted, the data are sent to the base sta-tion during the period of time for the reading of vital signs. The received data through the coordinator are processed by means of an algorithm in order to display on the GUI and to monitor. Doctor node is portable de-vice used to give all information and Health status of pa-tients which has abnormal case to a doctor in charge in-side the hospital. So the main parts in the healthcare sys-tem are : patient’s node, coordinator, base station, router, and Dr. Node as shown in figure 1.
Figure 1. Block diagram of healthcare system
2.1. Patient’s node
The central element in a WSN is the wireless sensor nodes. Where the nodes are sensing, processing, commu-nication take place, stores, and executes the communica-tion protocols and the data-processing algorithms. The physical resources available to the node influence the quality, size, and frequency of the sensed data that can be extracted from the network. Therefore, the wireless sen-sor node design and implementation are a critical step [11],[12]. The operation of each node depends on subsys-tems which are: a) Sensors unit: The sensing of vital signs of the patient's body and everything related to the improvement of the signal (signal condition circuit). The details of each sensor are as follows .
ECG: A method that registers the electrical activity of the cardiac muscles of the heart against time is Electro-cardiography. The changes in electrical potential differ-ence (voltage) during the activity of the myocardial fibers are recorded from the body surface itself by placing elec-trodes (for making electrical contacts with the skin sur-face) at specific locations without requiring any invasion.
11
The contractile cardiac muscle cells are the source of the electrical potentials. The ECG waveform is either printed on paper or shown on a computer screen [13], [14].
Operation's voltage of the sensor is 5 V which is sup-plied from main shield of e-health. The signal of the elec-trical activity of a heart passes in various hardware stages to get the final form of the ECG signal. Figure 2 shows a block diagram of this stages. The voltage of signal is small and may contain noise, so it is necessary to amplify and filter the signal. So the second stage is an amplifier with adequate gain in order to obtain an output voltage be-tween 0-5 V. The aim of the fourth stage is just isolate the previous stages and the next stages ( LPF and control unit). The last stage is the stage of filtration to reject the unwanted signals, especially that carry frequency of 50 Hz. The circuit of the all stages are shown in figure 3.
Figure 2. Block diagram of Electrocardiogram's stages
Figure 3. Implementation circuit of Electrocardiogram
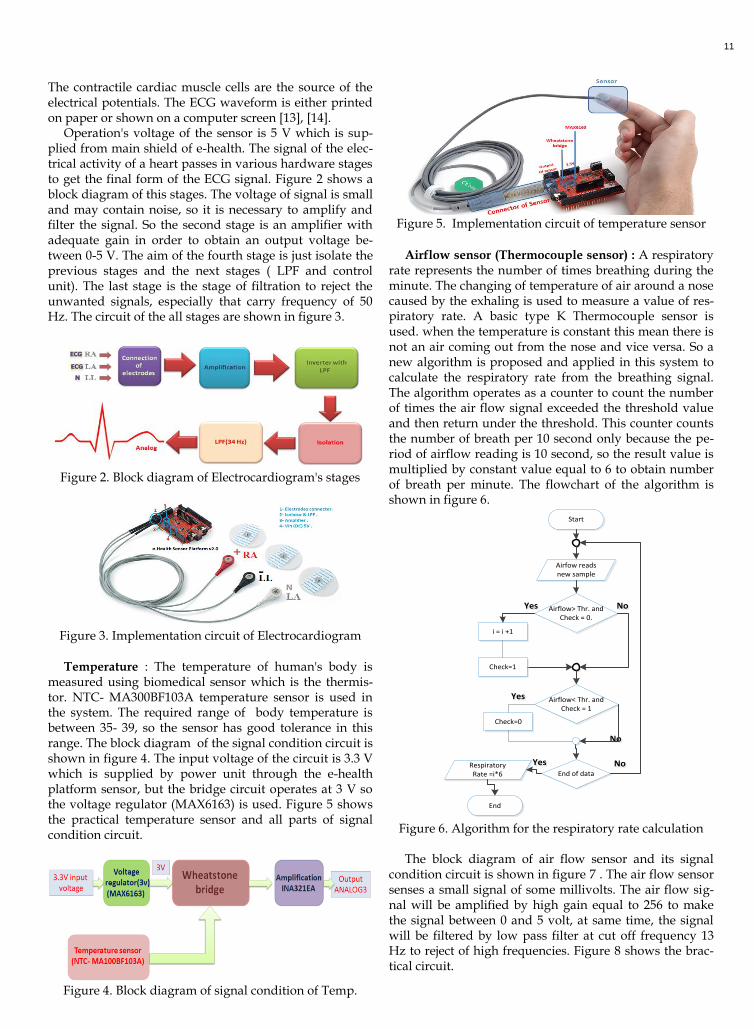
Temperature : The temperature of human's body is measured using biomedical sensor which is the thermis-tor. NTC- MA300BF103A temperature sensor is used in the system. The required range of body temperature is between 35- 39, so the sensor has good tolerance in this range. The block diagram of the signal condition circuit is shown in figure 4. The input voltage of the circuit is 3.3 V which is supplied by power unit through the e-health platform sensor, but the bridge circuit operates at 3 V so the voltage regulator (MAX6163) is used. Figure 5 shows the practical temperature sensor and all parts of signal condition circuit.
Figure 4. Block diagram of signal condition of Temp.
Figure 5. Implementation circuit of temperature sensor
Airflow sensor (Thermocouple sensor) : A respiratory
rate represents the number of times breathing during the minute. The changing of temperature of air around a nose caused by the exhaling is used to measure a value of res-piratory rate. A basic type K Thermocouple sensor is used. when the temperature is constant this mean there is not an air coming out from the nose and vice versa. So a new algorithm is proposed and applied in this system to calculate the respiratory rate from the breathing signal. The algorithm operates as a counter to count the number of times the air flow signal exceeded the threshold value and then return under the threshold. This counter counts the number of breath per 10 second only because the pe-riod of airflow reading is 10 second, so the result value is multiplied by constant value equal to 6 to obtain number of breath per minute. The flowchart of the algorithm is shown in figure 6.
Start
Airfow reads new sample
Airflow> Thr. andCheck = 0.
YesYes NoNo
End of data
i = i +1
NoNo
Respiratory Rate =i*6
End
YesYes
Check=1
Airflow< Thr. andCheck = 1
Check=0
YesYes
NoNo
Figure 6. Algorithm for the respiratory rate calculation
The block diagram of air flow sensor and its signal
condition circuit is shown in figure 7 . The air flow sensor senses a small signal of some millivolts. The air flow sig-nal will be amplified by high gain equal to 256 to make the signal between 0 and 5 volt, at same time, the signal will be filtered by low pass filter at cut off frequency 13 Hz to reject of high frequencies. Figure 8 shows the brac-tical circuit.
12
Figure 7. Block diagram of signal condition of airflow
Figure 8. Implementation circuit of air flow sensor
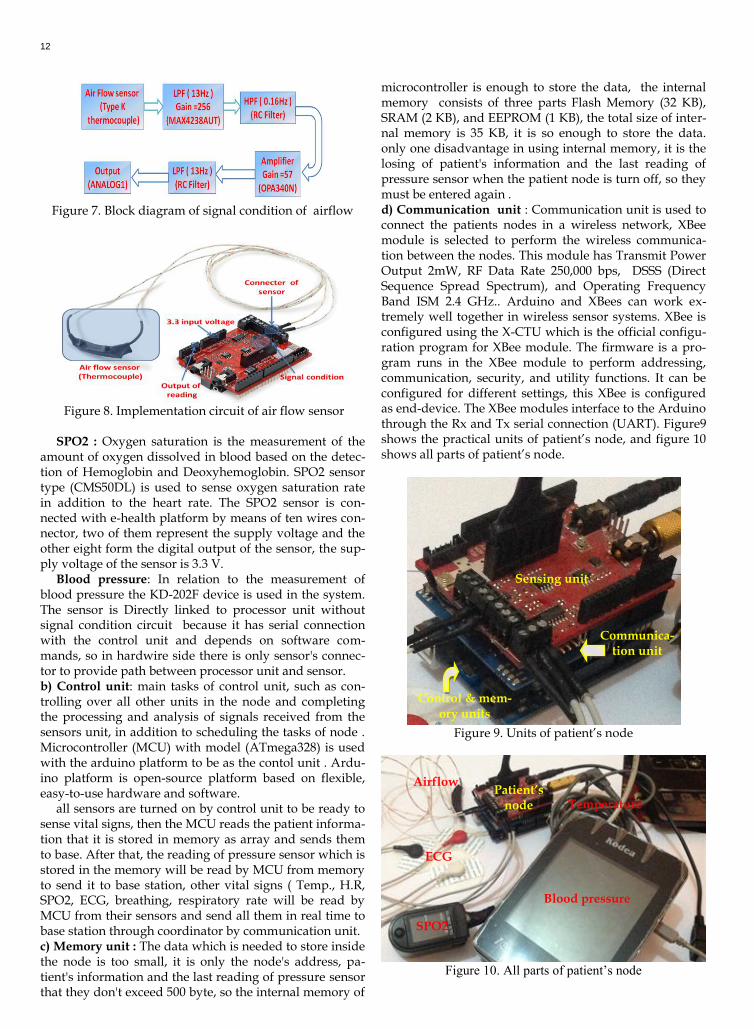
SPO2 : Oxygen saturation is the measurement of the amount of oxygen dissolved in blood based on the detec-tion of Hemoglobin and Deoxyhemoglobin. SPO2 sensor type (CMS50DL) is used to sense oxygen saturation rate in addition to the heart rate. The SPO2 sensor is con-nected with e-health platform by means of ten wires con-nector, two of them represent the supply voltage and the other eight form the digital output of the sensor, the sup-ply voltage of the sensor is 3.3 V.
Blood pressure: In relation to the measurement of blood pressure the KD-202F device is used in the system. The sensor is Directly linked to processor unit without signal condition circuit because it has serial connection with the control unit and depends on software com-mands, so in hardwire side there is only sensor's connec-tor to provide path between processor unit and sensor. b) Control unit: main tasks of control unit, such as con-trolling over all other units in the node and completing the processing and analysis of signals received from the sensors unit, in addition to scheduling the tasks of node . Microcontroller (MCU) with model (ATmega328) is used with the arduino platform to be as the contol unit . Ardu-ino platform is open-source platform based on flexible, easy-to-use hardware and software.
all sensors are turned on by control unit to be ready to sense vital signs, then the MCU reads the patient informa-tion that it is stored in memory as array and sends them to base. After that, the reading of pressure sensor which is stored in the memory will be read by MCU from memory to send it to base station, other vital signs ( Temp., H.R, SPO2, ECG, breathing, respiratory rate will be read by MCU from their sensors and send all them in real time to base station through coordinator by communication unit. c) Memory unit : The data which is needed to store inside the node is too small, it is only the node's address, pa-tient's information and the last reading of pressure sensor that they don't exceed 500 byte, so the internal memory of
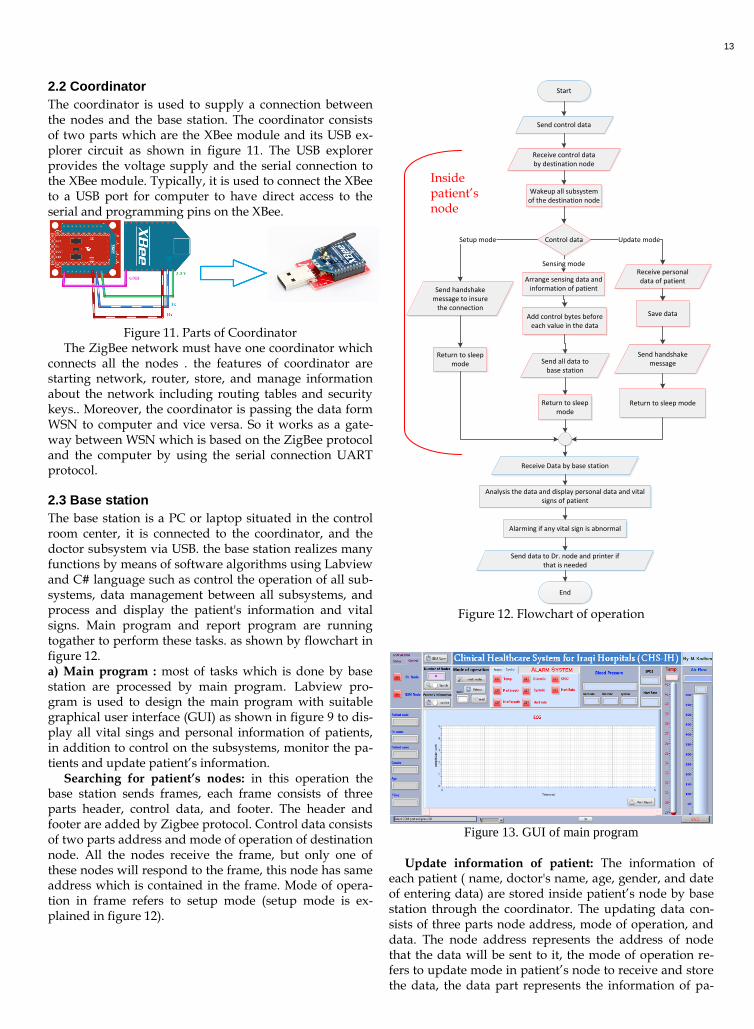
microcontroller is enough to store the data, the internal memory consists of three parts Flash Memory (32 KB), SRAM (2 KB), and EEPROM (1 KB), the total size of inter-nal memory is 35 KB, it is so enough to store the data. only one disadvantage in using internal memory, it is the losing of patient's information and the last reading of pressure sensor when the patient node is turn off, so they must be entered again . d) Communication unit : Communication unit is used to connect the patients nodes in a wireless network, XBee module is selected to perform the wireless communica-tion between the nodes. This module has Transmit Power Output 2mW, RF Data Rate 250,000 bps, DSSS (Direct Sequence Spread Spectrum), and Operating Frequency Band ISM 2.4 GHz.. Arduino and XBees can work ex-tremely well together in wireless sensor systems. XBee is configured using the X-CTU which is the official configu-ration program for XBee module. The firmware is a pro-gram runs in the XBee module to perform addressing, communication, security, and utility functions. It can be configured for different settings, this XBee is configured as end-device. The XBee modules interface to the Arduino through the Rx and Tx serial connection (UART). Figure9 shows the practical units of patient’s node, and figure 10 shows all parts of patient’s node.
Figure 9. Units of patient’s node
Figure 10. All parts of patient’s node
Sensing unit
Communica-tion unit
Control & mem-ory units
SPO2
Blood pressure
Temperature Patient’s
node
Airflow
ECG
13
2.2 Coordinator
The coordinator is used to supply a connection between the nodes and the base station. The coordinator consists of two parts which are the XBee module and its USB ex-plorer circuit as shown in figure 11. The USB explorer provides the voltage supply and the serial connection to the XBee module. Typically, it is used to connect the XBee to a USB port for computer to have direct access to the serial and programming pins on the XBee.
Figure 11. Parts of Coordinator
The ZigBee network must have one coordinator which connects all the nodes . the features of coordinator are starting network, router, store, and manage information about the network including routing tables and security keys.. Moreover, the coordinator is passing the data form WSN to computer and vice versa. So it works as a gate-way between WSN which is based on the ZigBee protocol and the computer by using the serial connection UART protocol.
2.3 Base station
The base station is a PC or laptop situated in the control room center, it is connected to the coordinator, and the doctor subsystem via USB. the base station realizes many functions by means of software algorithms using Labview and C# language such as control the operation of all sub-systems, data management between all subsystems, and process and display the patient's information and vital signs. Main program and report program are running togather to perform these tasks. as shown by flowchart in figure 12. a) Main program : most of tasks which is done by base station are processed by main program. Labview pro-gram is used to design the main program with suitable graphical user interface (GUI) as shown in figure 9 to dis-play all vital sings and personal information of patients, in addition to control on the subsystems, monitor the pa-tients and update patient’s information.
Searching for patient’s nodes: in this operation the base station sends frames, each frame consists of three parts header, control data, and footer. The header and footer are added by Zigbee protocol. Control data consists of two parts address and mode of operation of destination node. All the nodes receive the frame, but only one of these nodes will respond to the frame, this node has same address which is contained in the frame. Mode of opera-tion in frame refers to setup mode (setup mode is ex-plained in figure 12).
Start
Send control data
Receive control data by destination node
Control data
Arrange sensing data and information of patient
Sensing mode
Wakeup all subsystem of the destination node
Add control bytes before each value in the data
Send all data to base station
Return to sleep mode
Send handshake message to insure
the connection
Setup mode
Return to sleep mode
Receive personal data of patient
Update mode
Save data
Return to sleep mode
Receive Data by base station
Send handshake message
Analysis the data and display personal data and vital signs of patient
Alarming if any vital sign is abnormal
Send data to Dr. node and printer if that is needed
End
Figure 12. Flowchart of operation
Figure 13. GUI of main program
Update information of patient: The information of
each patient ( name, doctor's name, age, gender, and date of entering data) are stored inside patient’s node by base station through the coordinator. The updating data con-sists of three parts node address, mode of operation, and data. The node address represents the address of node that the data will be sent to it, the mode of operation re-fers to update mode in patient’s node to receive and store the data, the data part represents the information of pa-
Inside patient’s node
14
tient which is entered by user in base station, each part of the information is separated from others by control bytes to distinguish between them, all data parts are saved by patient node in its memory. The patient node will re-spond by one byte to confirm the receiving and storing the frame to base station.
Display vital signs: there are two modes of reading vi-tal signs from patients nodes which are single node and multi nodes. In single node, the user at base station must select one node to get the data, others patients nodes will go into sleep mode to save power. In multi nodes, the base station makes a tour on all nodes in the coverage area and collects the required data of each. A patient node with same address in the request frame of base station will read the vital signs of patient and send frame of data to base station through the coordinator, this frame called patient frame, the parts of the frame is shown in figure14. Main program reads and analyses this frame to display and monitor the data.
Figure 14. patient’s frame
b) Report program : It is a standalone program, it runs when the main program sends a request to it, it is used to print a report about the status of the patient which is dis-played at base station, This program is written using C# language in visual studio 2012. 2.4 Router
Router provides a wireless connection between the base station and Dr. Node. It consists of two parts which are the XBee pro module and its USB explorer circuit as shown in figure 15. The USB explorer provides the volt-age supply and the serial connection to the XBee pro module. Typically, it is used to connect the XBee pro to a USB port in a computer to have direct access to the serial and programming pins on the XBee pro. The XBee pro has good feactures to supplay a connection with long dis-tance ( about 90 m) with transmitted power output equal to 63 mW, number of chanls is 16 direct sequence chan-nels, and operating frequency band is 2.4 Mhz. The XBee pro is configured using the X-CTU.
Figure 15. Parts of router
2.5 Dr. Node
The aim of Dr. Node is to get the necessary information of any patient to a doctor in charge of monitoring inside the hospital remotely. Dr. Node is always in sleep mode, two conditions must be satisfied in base station to wake up and displaying the data, which are: Dr. Node must be enabled in base station, and base station must operate in single mode. The structure of the Dr. Node consists of communication unit, control unit, memory unit, and dis-play unit. a) Communication unit: It is used to connect the Dr. Node in a peer-to-peer network with router, XBee pro module is selected to perform the wireless communica-tion. The features of XBee pro module is explained pre-viously in the router. XBee pro is configured using the X-CTU program as end-device b) Control unit : The main tasks of this unit are control-ling of the operation of other units in the node and processing, analysis, and scheduling the tasks of node . Microcontroller (ATmega2560) is used with the arduino platform to be as control unit . The MCU is programmed using the Arduino programming language which is inte-grated development environment (IDE). All tasks done by MCU such as controlling, processing, analysis, and scheduling are shown in flowchart of figure 16.
Start
Receive Control Data from BS
Operation mode
Send to BS a handshake message
Display mode
Receiving Data From
BS
Store Data in SD Ram
Power on LCD
Alarm (Sound)
Read Data from SD
Display Data on
LCD
Power off LCD
END
Setup mode
Power off LCD
Figure 16. Flowchart of Dr. Node
c) Memory unit: Dr. Node has SD card in the SD wireless shield for store the data in a log. The size of the SD card is
15
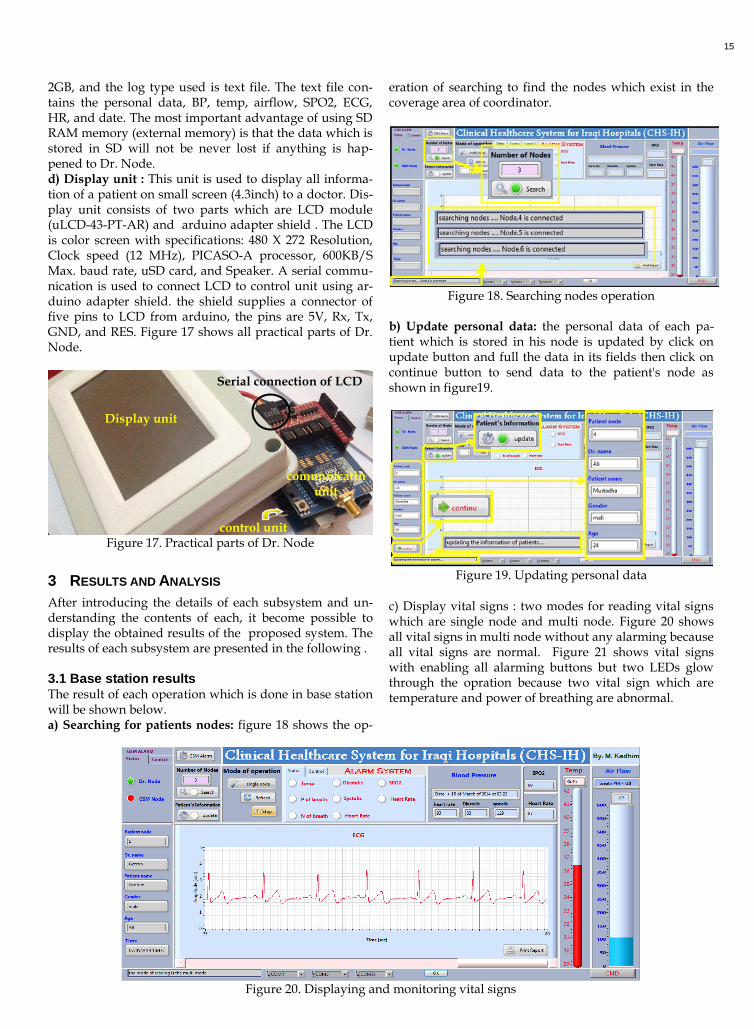
2GB, and the log type used is text file. The text file con-tains the personal data, BP, temp, airflow, SPO2, ECG, HR, and date. The most important advantage of using SD RAM memory (external memory) is that the data which is stored in SD will not be never lost if anything is hap-pened to Dr. Node. d) Display unit : This unit is used to display all informa-tion of a patient on small screen (4.3inch) to a doctor. Dis-play unit consists of two parts which are LCD module (uLCD-43-PT-AR) and arduino adapter shield . The LCD is color screen with specifications: 480 X 272 Resolution, Clock speed (12 MHz), PICASO-A processor, 600KB/S Max. baud rate, uSD card, and Speaker. A serial commu-nication is used to connect LCD to control unit using ar-duino adapter shield. the shield supplies a connector of five pins to LCD from arduino, the pins are 5V, Rx, Tx, GND, and RES. Figure 17 shows all practical parts of Dr. Node.
Figure 17. Practical parts of Dr. Node
3 RESULTS AND ANALYSIS
After introducing the details of each subsystem and un-derstanding the contents of each, it become possible to display the obtained results of the proposed system. The results of each subsystem are presented in the following .
3.1 Base station results The result of each operation which is done in base station will be shown below. a) Searching for patients nodes: figure 18 shows the op-
eration of searching to find the nodes which exist in the coverage area of coordinator.
Figure 18. Searching nodes operation
b) Update personal data: the personal data of each pa-tient which is stored in his node is updated by click on update button and full the data in its fields then click on continue button to send data to the patient's node as shown in figure19.
Figure 19. Updating personal data
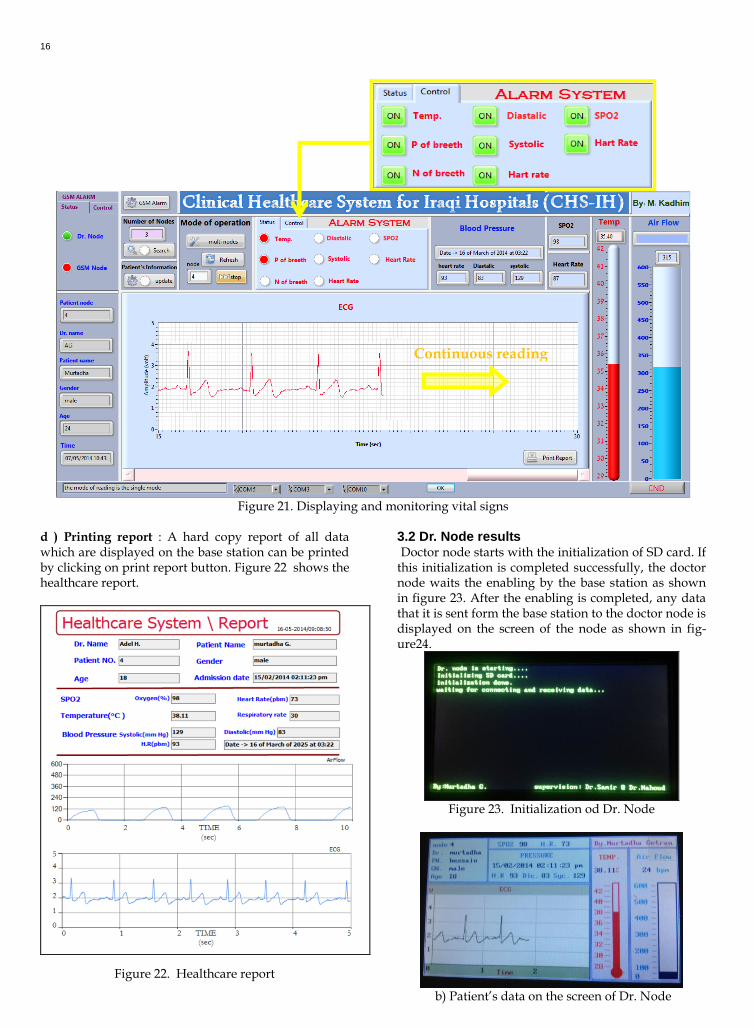
c) Display vital signs : two modes for reading vital signs which are single node and multi node. Figure 20 shows all vital signs in multi node without any alarming because all vital signs are normal. Figure 21 shows vital signs with enabling all alarming buttons but two LEDs glow through the opration because two vital sign which are temperature and power of breathing are abnormal.
Figure 20. Displaying and monitoring vital signs
Display unit
comunnicatin unit
control unit
Serial connection of LCD
16
Figure 21. Displaying and monitoring vital signs
d ) Printing report : A hard copy report of all data which are displayed on the base station can be printed by clicking on print report button. Figure 22 shows the healthcare report.
Figure 22. Healthcare report
3.2 Dr. Node results Doctor node starts with the initialization of SD card. If this initialization is completed successfully, the doctor node waits the enabling by the base station as shown in figure 23. After the enabling is completed, any data that it is sent form the base station to the doctor node is displayed on the screen of the node as shown in fig-ure24.
Figure 23. Initialization od Dr. Node
b) Patient’s data on the screen of Dr. Node
Continuous reading
17
4 SYSTEM FEATURES
The system has the following features as follows: Real time system. Number of patients under the monitoring is
not limited. Each node compines between five types of
sensor. The system can easily integrate with any other
network including the internet. The system is flexible and can be develop ac-
cording to the new requirements. Auto detection for any new nodes. Alarm system in base station. High resolution ECG monitoring. Display system status for all operations Free patient movement. Friendly user interface.
5 DISCUSSION
The doctor in charge of monitoring the patients inside the hospital can monitor patients through the Dr. Node that offers high reliability of displaying information and all the patient's vital signs which are displayed at the base station without the need to go to the base sta-tion. The designed system is compared with other sys-tems ( see section 1 ) And found the most important points: This is the first system can combine five hard-ware sensors in each node to sense the nine vital signs from each patient and Small colored screen in portable device is carried with a doctor to show him all data of patients.
The measurement of respiratory rate uses a new approach, which provides more comfortable for the patients. In addition, the patient's breathing is under monitoring through the period of calculating the respi-ratory rate. Moreever, a doctor who is in charge of monitoring can control with high reliability all subsys-tems through the GUI of main program in the base station, in addition to monitor the nine vital signs on same GUI. The nine vital signs which are sensed from each patient, in addition to the personal information of the patient, are displayed on the GUI in real time without any problem.
6 CONCLUSION
The monitoring for the vital signs of patients in real time wirelessly is a simple and accurate and makes the patient under the continuous care. The number of pa-tients’ nodes are partially unlimited, but a node time management could be applied to reach maximum ca-pacity based on the hospital’s environment . A new patient node is detected and put in the monitoring automatically. The system is flexible for any new re-quirements and amendments such as adding new sen-sors, changing the network topology, or updating the GUI. The coverage area of the coordinator is about 30 meters and that is enough for ICU, and The coverage area of the router to Dr. Node is about 90 meters. In
order to increase the coverage area is simply done by changing the transceiver (XBee).
The implemented system can be improved by applying some points: The development of the base station to operate intelligently, therefore base station could make most of the decisions. Base station can be developed by adding a database containing a data for each patient entered the hospital to build history data of patients.
REFERENCES [1] Dishongh, Terrance J. and McGrath, Michael . Wireless
Sensor Networks for Healthcare Applications. Norwood : Intel., 2010. ISBN-13: 978-1-59693-305-7.
[2] Karl, Holger and Willig, Andreas . PROTOCOLS AND ARCHITECTURES FOR WIRELESS SENSOR NETWORKS. England : John Wiley & Sons, 2005.
[3] Ko, JeongGil, et al., et al. Wireless Sensor Networks for Healthcare. s.l. : IEEE, 2010.
[4] Shnayder, Victor , et al., et al. Sensor Networks for Medical Care. s.l. : Division of Engineering and Applied Sciences, Harvard University, 2005. TR-08-05.
[5] Oliver, Nuria and Flores-Mangas, Fernando. HealthGear: A Real-time Wearable System for Monitoring and Analyzing Physiological Signals. s.l. : ieee, 2006.
[6] Farshchi, Shahin , et al., et al. Bi-Fi: An Embedded Sensor/System Architecture for Remote Biological Monitoring. s.l. : IEEE TRANSACTIONS ON INFORMATION TECHNOLOGY IN BIOMEDICINE,, 2007.
[7] Chen, Surong, et al., et al. A Framework for Massive Data Transmission in a Remote Real-Time Health Monitoring System. Leicestershire, UK : Automation & Computing, Loughborough University, 2012.
[8] Pantelopoulos , Alexandros and Bourbakis, Nikolaos G. A Survey on Wearable Sensor-Based Systems for Health Monitoring and Prognosis. s.l. : IEEE TRANSACTIONS ON SYSTEMS, 2010.
[9] Shaker, Mahmoud, Jasim, Samir and Khalaf, Akram Jaddoa. Healthcare Monitoring based on Wireless Sensor Network with New Features. s.l. : JOURNAL OF TELECOMMUNICATIONS, 2013.
[10] Ranjan, Rajesh , et al., et al. Design and Development of a Networked Health Monitoring and Control System. s.l. : ieee, 2014.
[11] Waltenegus Dargie Christian و Poellabauer .
FUNDAMENTALS OF WIRELESS SENSOR NETWORKS THEORY AND PRACTICE .Chennai, India : .John Wiley &
Sons Ltd . ،2010 . ISBN 978-0-470-99765-9 (cloth.)
[12] Mahmoud Shaker ،Samir Jasim , and Akram Jaddoa
Khalaf .Healthcare Monitoring based on Wireless Sensor Network with New Features .JOURNAL OF TELECOMMUNICATIONS ،2013.
[13] Subhasis Chaudhuri ،Tanmay D .Pawar Siddhartha و
Duttagupta .Ambulation Analysis in Wearable ECG .
Springer Science+Business Media ،2009 . ISBN 978-1-4419-0723-3.
[14] Adam Gacek Witold و Pedrycz .ECG Signal Processing, Classification and Interpretation .London : Springer ،2012 .
ISBN 978-0-85729-867-6.