Embed Size (px)
Citation preview

Purdue UniversityPurdue e-Pubs
Open Access Theses Theses and Dissertations
Spring 2015
Design and heat transfer analysis of acceleratingdistributed combustion systemYashovardhan U. WaghPurdue University
Follow this and additional works at: https://docs.lib.purdue.edu/open_access_theses
Part of the Mechanical Engineering Commons
This document has been made available through Purdue e-Pubs, a service of the Purdue University Libraries. Please contact [email protected] foradditional information.
Recommended CitationWagh, Yashovardhan U., "Design and heat transfer analysis of accelerating distributed combustion system" (2015). Open Access Theses.623.https://docs.lib.purdue.edu/open_access_theses/623

Graduate School Form 30 Updated 1/15/2015
PURDUE UNIVERSITY GRADUATE SCHOOL
Thesis/Dissertation Acceptance This is to certify that the thesis/dissertation prepared By Entitled For the degree of Is approved by the final examining committee:
To the best of my knowledge and as understood by the student in the Thesis/Dissertation Agreement, Publication Delay, and Certification Disclaimer (Graduate School Form 32), this thesis/dissertation adheres to the provisions of Purdue University’s “Policy of Integrity in Research” and the use of copyright material.
Approved by Major Professor(s): Approved by:
Head of the Departmental Graduate Program Date
Yashovardhan U Wagh
DESIGN AND HEAT TRANSFER ANALYSIS OF ACCELERATING DISTRIBUTED COMBUSTION SYSTEM
Master of Science in Mechanical Engineering
Dr. Robert LuchtChair
Dr. Hukam Mongia
Dr. Sameer Naik
Dr. Robert Lucht
Dr. Ganesh Subbarayan 4/10/2015


i
i
DESIGN AND HEAT TRANSFER ANALYSIS OF
ACCELERATING DISTRIBUTED COMBUSTION SYSTEM
A Thesis
Submitted to the Faculty
of
Purdue University
by
Yashovardhan U. Wagh
In Partial Fulfillment of the
Requirements for the Degree
of
Master of Science in Mechanical Engineering
May 2015
Purdue University
West Lafayette, Indiana

ii
ii
Dedicated to my mother, Varsha, for without her support, encouragement, and
sacrifices I would not have achieved anything. A special thanks and undying gratitude to
my advisors Dr. Robert Lucht and Dr. Sameer Naik for guiding me in the right direction at
every step of my Purdue life.

iii
iii
ACKNOWLEDGEMENTS
I would like to thank Dr. Lucht for giving me an opportunity to work under his
guidance and for providing financial support. I also thank Dr. Naik and Dr. Mongia for their
encouragement and help.
This entire work has been done in collaboration with Pratikash Panda and his
guidance and help have been exemplary. I would like to thank Mario Roa, Scott Meyer,
and the entire Gas Turbine Combustion Facility research team at Zucrow Laboratories for
their inputs and help. I would also like to acknowledge the role of all machinists at various
places who have helped us manufacture and put together our rig in a timely fashion.
I would like to thank my friends Joey, Riaz, Karthik, Tom, Matt, Sagar, Shardul and
Purval for all the wonderful experiences at Purdue. Last but not the least I would like to
thank Anchalika who has motivated me in my work and been with me throughout my
time at Purdue.
This research program was funded by Siemens Power Generation and was ably
managed by Walter R. Laster.

iv
iv
TABLE OF CONTENTS
Page
LIST OF TABLES .................................................................................................................... vi LIST OF FIGURES ................................................................................................................. vii ABSTRACT .......................................................................................................................... viii CHAPTER 1. INTRODUCTION……………………………………………………………………………………..1
1.1 Motivation ........................................................................................................ 1
1.2 Objective ........................................................................................................... 3
1.3 Overview ........................................................................................................... 3
CHAPTER 2. LITERATURE REVIEW ................................................................................. 5
2.1 Distributed Combustion System (DCS) ............................................................. 5
2.2 Constant Area DCS ............................................................................................ 6
2.3 Accelerating DCS ............................................................................................... 7
CHAPTER 3. DESIGN AND HEAT TRANSFER ANALYSIS .................................................. 9
3.1 Existing Constant Area DCS .............................................................................. 9
3.2 Design ............................................................................................................. 10
3.2.1 Mach Number Calculations and Variations ................................................ 11
3.2.2 Area Calculations ........................................................................................ 12
3.2.3 Design and Material Specifications ............................................................. 13
3.2.3.1 Film Cooling Louvre Design ..................................................................... 13
3.2.3.2 Windows Configuration .......................................................................... 14
3.2.3.3 Nozzle Location ....................................................................................... 15
3.2.3.4 Thermocouple Location .......................................................................... 16
3.2.3.5 Expansion Section and Quenching .......................................................... 16
3.2.4 Final Design ................................................................................................. 173.3 Heat Transfer Analysis .................................................................................... 19
3.3.1 Main Combustion Zone ............................................................................... 21
3.3.2 Accelerating Passage (Secondary Combustion Zone) ................................. 23
CHAPTER 4. CONCLUSIONS AND FUTURE WORK ........................................................ 26
4.1 Conclusion ...................................................................................................... 26
4.2 Future Work .................................................................................................... 26
4.2.1 High Repetition Rate Planar Laser-Induced Flourescence (PLIF) ................ 27
4.2.2 High Repetition Rate Particle Image Velocimetry (PIV) .............................. 27
4.2.3 Emissions Sampling ..................................................................................... 28
4.3 Future Modifications ...................................................................................... 28
LIST OF REFERENCES ......................................................................................................... 30

v
v
Page
APPENDICES Appendix A ................................................................................................................... 31
Appendix B ................................................................................................................... 44

vi
vi
LIST OF TABLES
Table ...............................................................................................................................Page
Table 3.1: Operating conditions for accelerating DCS. ..................................................... 11
Table 3.2: Exit area and length calculations corresponding to different Mach numbers. 13
Table 3.3: Deflection angles for 283 nm and 532 nm laser beams. ................................. 14
vii
vii
LIST OF FIGURES
Figure .............................................................................................................................Page
Figure 1.1: Projected Global Temperature Change [1]. ...................................................... 1
Figure 1.2: 2000 Years of Heat-Trapping Gas Levels [1]. .................................................... 2
Figure 2.1: Cross Section views of two first-generation DCS [3, 4]. ................................... 6
Figure 2.2: Cross-sectional view of constant area DCS at Purdue [5, 6]. ............................ 7
Figure 2.3: Comparison of NOx levels from ASP flame holders with other LDI and GEA HSR Combustors [7]………………………………………………………………………………………8 Figure 3.1: Overview of existing experimental rig [8]. ..................................................... 10
Figure 3.2: Overall schematic of proposed accelerating DCS. .......................................... 11
Figure 3.3: Variation of Mach number as a function of cube length for various Convergence angles……………………………………………………………………………………12 Figure 3.4: Film cooling louvre design for accelerating DCS………………………………………….14 Figure 3.5: Window location in the accelerating DCS....................................................... 15
Figure 3.6: Location of nozzle with respect to optical windows in accelerating DCS. ..... 15
Figure 3.7: Thermocouple locations in the accelerating DCS. .......................................... 16
Figure 3.8: Expansion Section in the accelerating DCS. .................................................... 17
Figure 3.9: CAD representation of final design. ................................................................ 18
Figure 3.10: Cross-section view of the final design. ......................................................... 18
Figure 3.11: Schematic diagram of the heat transfer model. ........................................... 19
Figure 3.12: Ignition temperatures for the main combustion zone. ................................ 22
Figure 3.13: Steady state temperatures for the main combustion zone. ........................ 22
Figure 3.14: Water cooling ports for the main combustion zone. ................................... 23
Figure 3.15: Ignition temperatures for the secondary combustion zone. ....................... 24
Figure 3.16: Steady state temperatures for the secondary combustion zone. ................ 24
Figure 3.17: Cooling channels in the SCZ of accelerating DCS. ......................................... 25
Figure 4.1: High repetition rate PLIF arrangement. .......................................................... 27
Figure 4.2: High repetition rate PIV arrangement. ........................................................... 28
Figure 4.3: Multiple injector locations. ............................................................................. 29

viii
viii
ABSTRACT
Wagh, Yashovardhan U. M.S.M.E., Purdue University, May 2015. Design and Heat Transfer Analysis of Accelerating Distributed Combustion System. Major Professor: Dr. Robert Lucht, School of Mechanical Engineering.
Over the past few decades, there has been a significant increase in greenhouse
gases such as CO2, N2O, and CH4 produced from gas turbine engines. Keeping this in mind,
current research work is being carried out for reducing NOx produced from combustors.
The objective of this research is to determine the feasibility of Distributed Combustion
Systems (DCS) for increasing efficiency and reducing NOx emissions.
A DCS has a main combustion zone (MCZ) where 90% of the fuel is burned and is followed
by a secondary combustion zone (SCZ) in which jets carrying fuel are injected into the
vitiated crossflow from the MCZ. This fuel jet auto-ignites under the influence of the high
temperature vitiated crossflow. A new type of accelerating distributed combustion
system has been designed in this project. In the current design, higher Mach numbers of
the main flow can be obtained at the jet exit after reducing the exit area of secondary
combustion zone by about five times compared to the inlet. Along with the design, a
detailed one-dimensional heat transfer analysis has been performed. A Matlab code was
used to determine whether final temperatures of the thermal barrier coating (TBC)

ix
ix
and cooling water fall within acceptable design constraints. Conduction, convection, and
radiation at steady state were used for determining heat transfer relationships between
different materials. Water and nitrogen flow rates as well as the dimensions of cooling
water channels were varied parametrically to find ideal conditions. Based on the heat
transfer calculations, 8.5 gpm water are needed to cool the secondary combustion zone
to maintain temperature within material property limits.
Various laser-based measurement techniques such as Planar Laser-Induced
Flourescence (PLIF), Particle Image Velocimetry (PIV), and Coherent Anti-Stokes Raman
Spectroscopy (CARS) will be performed to study the combustion in the accelerating flow
channel. Emissions sampling will be performed downstream of combustion zone using a
water-cooled sampling probe. These measurements will provide insight into the various
physical phenomena associated with NOx production.

1
1
CHAPTER 1. INTRODUCTION
1.1 Motivation
The Third National Climate Assessment report [1] details how climate change
impacts the United States and the rest of the world. There is evidence and theory which
projects a temperature change of 5oF over the next century. This temperature change is
likely to have disastrous effects such as melting of glaciers, global weather changes,
extreme precipitation variations, changes in sea levels, and decrease in natural flora and
fauna.
Figure 1.1: Projected Global Temperature Change [1].
In Fig 1.1, the lines represent a central estimate of global average temperature rise.
Model A2 assumes continued increase in emissions whereas the model B1 assumes
significant reduction in emissions. These temperature changes have been mainly

2
2
associated with increase in atmospheric concentration of greenhouse gases such as CO2,
N2O, and CH4. Concentration of nitrous oxide has increased approximately by 20% [1]
compared to the pre-industrial era. Figure 1.2 below shows the increasing levels of heat
trapping gases like carbon dioxide, methane, and nitrous oxide over the last 2000 years.
Figure 1.2: 2000 Years of Heat-Trapping Gas Levels [1].
One of the major sources contributing to increase in greenhouse gases is burning of
fossil fuels. Power generation using fossil fuels serves as a major chunk of the energy pie
of developing countries as well as industrially developed nations. In order to reduce
dependence on traditional fuels, many countries are moving towards natural-gas-
powered turbines due to their low installation costs along with shorter construction times.
Many companies are conducting research to reduce NOx levels in combustors operating
with natural gas.

3
3
1.2 Objective
The primary objective of this thesis is to provide critical information for successful
manufacturing of an accelerating distributed combustion system. Following are the
specific objectives of this work:
(a) To conceptualize the initial design considering the effect of combustor geometry
on Mach number variations of the gases flowing through it. The length of
combustor determines the angles of contraction and expansion for gases.
(b) To make the design compatible with the current rig at the Gas Turbine Combustion
Facility at Zucrow. The new design must consider flow constraints for fuel, air, and
cooling water.
(c) To perform heat transfer analysis using one-dimensional heat transfer model to
determine appropriate cooling for the rig. Material constraints and properties for
stainless steel, thermal barrier coating, and water have to be considered.
1.3 Overview
Chapter 2 includes a summary of prior research related to distributed combustion
systems and previous work regarding the use of staged combustion systems to improve
thermal efficiency by increasing the temperature. Recent research in constant area
distributed combustion system and initial conceptualization of the proposed accelerated
combustion system are discussed.
Chapter 3 presents the design of the experimental system including design
specifications and detailed aspects related to the main combustion zone, secondary
combustion zone, optical windows, water cooling channels, and other instrumentation.

4
4
Chapter 3 also describes a one-dimensional heat transfer analysis of the main combustion
zone and secondary combustion zone in order to test the longevity and survival of the
experimental rig.
Chapter 4 lists immediate future planned work using laser diagnostic techniques
in the proposed new design. Also, changes in nozzle position which can enable
visualization of jet in cross flow at different Mach numbers has been proposed for further
in-depth studies.

5
5
CHAPTER 2. LITERATURE REVIEW
2.1 Distributed Combustion System (DCS)
In 1970s, NASA’s Experimental Clean Combustor Program (ECCP) [2] proposed a
staged combustion or distributed combustion system as an effective technology for
reducing NOx emissions. Since then, secondary injection of fuel is being investigated by
many gas turbine manufacturers and power generation companies as an effective way of
reducing NOx emissions and simultaneously increasing the efficiency and power output
of the engines. Figure 2.1 shows two staged combustion engines, viz. General Electric (GE)
LM2500 and International Aero Engines (IAE) V2500 [3, 4].

6
6
Figure 2.1: Cross Section views of two first-generation DCS [3, 4].
The main combustion zone, labelled as the pilot zone, in Fig. 2.1(b) provides rise in
temperature needed for idle conditions. Eventually as the engine power increases, the
main combustion zone acts like a pilot providing heat to aid rapid combustion in the
secondary combustion zone, labelled as the main zone, in Fig 2.1(b).
2.2 Constant Area DCS
A constant area distributed combustion system was designed, fabricated, and
studied over the last six years [5, 6]. A variety of measurements such as emission sampling,
CH* chemiluminescense, particle image velocimetry, OH planar laser induced
fluorescence and dual-pump coherent anti-Stokes Raman scattering have been
performed. A schematic of this system is shown in Fig 2.2.

7
7
Figure 2.2: Cross-sectional view of constant area DCS at Purdue [5, 6].
One of the major outcomes from the constant area distributed combustion system
experimentation was the demonstration of sub-10ppm NOx levels despite an increase in
the exit temperature of combustion gases. The reduction in NOx formation is a result of
the decrease in residence time at high temperature and the reduction in oxygen content.
2.3 Accelerating DCS
An accelerating passage secondary combustion zone has the potential to decrease
NOx emissions further with additional decrease in residence time while maintaining high
gas temperatures essential for higher engine efficiencies. With the accelerating DCS, an
increase in the flow Mach number of gases combusting in the secondary combustion zone
is expected. A decrease in static temperature of the flow results by increasing the gas flow
velocity. Both these factors are favorable for NOx reduction. However, complete chemical
reaction of injected fuel in the secondary combustion zone is also critical for decreasing
fuel consumption and unburned hydrocarbons. Figure 2.3 shows that NOx levels
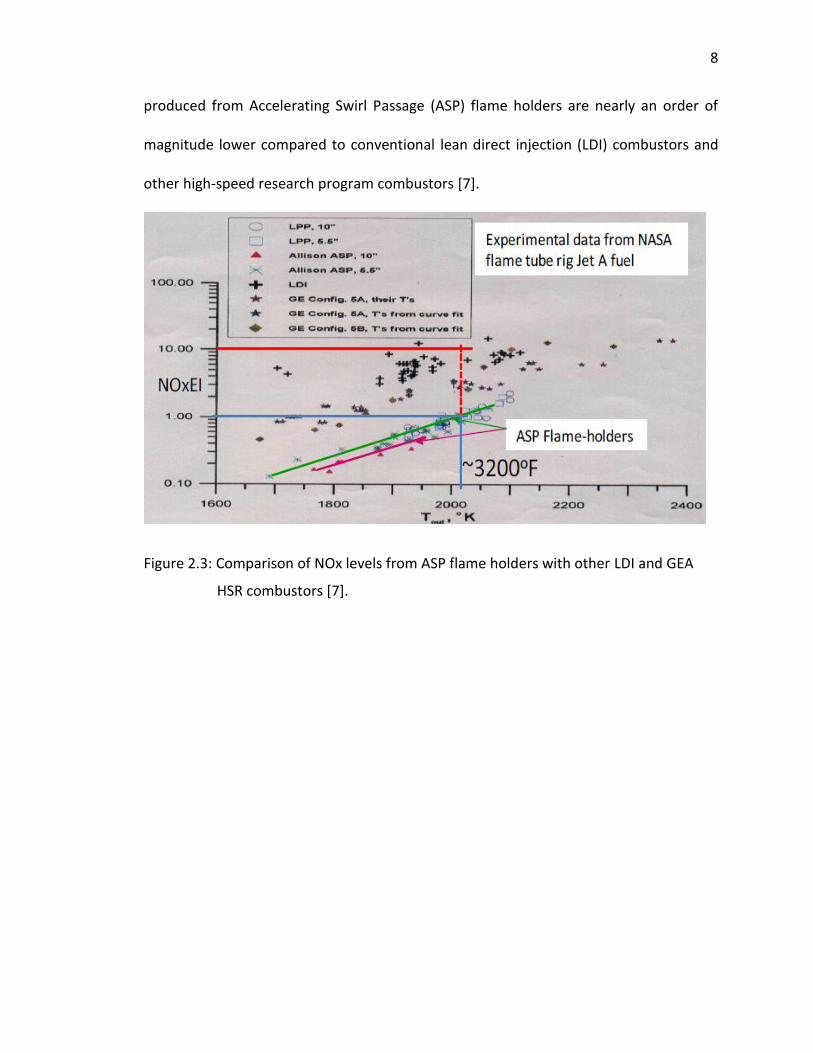
8
8
produced from Accelerating Swirl Passage (ASP) flame holders are nearly an order of
magnitude lower compared to conventional lean direct injection (LDI) combustors and
other high-speed research program combustors [7].
Figure 2.3: Comparison of NOx levels from ASP flame holders with other LDI and GEA
HSR combustors [7].

9
9
CHAPTER 3. DESIGN AND HEAT TRANSFER ANALYSIS
3.1 Existing Constant Area DCS
The existing constant area DCS has an optical viewing area of 7742 mm2 with
window dimensions of 101.6 mm × 76.2 mm. Figure 3.1 shows a schematic diagram of the
existing test rig [8].
Dividing the current design section by section for further understanding:
(a) Section 1.0 provides the inlet for heated air along with fuel from a fuel peg. The
fuel peg has four 1.3 mm diameter holes. The holes are arranged such that two
point towards the heated air and the other two are perpendicular to them. Four
cylindrical bluff bodies are welded in series downstream of the fuel peg in order
to ensure fuel and air mixing.
(b) Section 2.0 has a low swirl burner consisting of 16 axial vanes at an angle of 45o
and a series of small holes in the center. The burner has a swirl number of 0.5.
(c) Section 3.0 is the main combustion zone (MCZ) where the premixed flow enters
the head end of the combustor having a diameter of 100 mm. Here the mixture is
ignited and burned.
(d) Section 4.0 is the region in which flow cross-section changes from circular to
square

10
10
(e) Sections 5.0 and 5.5 are the secondary combustion zone (SCZ), where secondary
fuel is injected and reacting jet flow studies are performed using laser diagnostics
since optical windows allow laser access.
(f) Section 6.0 is the combustion reaction quenching area where water at 1 gpm is
injected to freeze NOx formation and destruction reactions.
(g) Section 7.0 is the region in which flow cross-section changes from square to
circular.
(h) Section 8.0 allows uniform mixing of exhaust gases and emissions sampling is
performed at the downstream end with the help of a water cooled probe.
(i) Section 9.0 enables further cooling of gases below 700 K before being exhausted
into the atmosphere.
Figure 3.1: Overview of existing experimental rig [8].
3.2 Design
Figure 3.2 shows an overall schematic diagram of the proposed accelerating DCS.
The incoming flow to the MCZ is composed of natural gas and air pressurized to 5.5 atm
and maintained at an equivalence ratio of 0.5. The air entering the MCZ is heated to a
temperature of 723 K and the flow rate will vary between 0.8 kg/s to 2.0 kg/s depending
on the flow Mach number to be tested.

11
11
Figure 3.2: Overall schematic of proposed accelerating DCS.
Some of the operating conditions used for the rig are listed in Table 3.1
Table 3.1: Operating conditions for accelerating DCS.
Operating Pressure (atm) 5.5
Operating Temperature (K) 723
MCZ Air Flow Rate Range (kg/s) 0.8 – 2.0
MCZ Equivalence Ratio, ɸmain = 0.5 0.5
3.2.1 Mach Number Calculations and Variations
A converging length of 10” followed by a straight section of 2” is chosen for the
accelerating passage window combustor. We can visualize jets injected from the
proposed location of the nozzle into the main flow at a Mach number of 0.3. Figure 3.3
shows the variation of Mach number for various convergence angles (θ). It is critical to
note here the steep increase in Mach number towards the downstream end of the
combustor, due to which a convergence angle ϴ = 17.35o and converging length of 10” is

12
12
chosen so that it easily matches the existing rig length and also enables visualization at
different Mach numbers.
Figure 3.3: Variation of Mach number as a function of cube length for various
convergence angles.
3.2.2 Area Calculations
Table 3.2 shows area calculations corresponding to increasing Mach numbers.
These were performed to determine the exit area of the accelerating flow chamber. It
was critical to maintain exit area such that the exit velocity is below sonic levels and at
the same time maintain machinability for fabricating the combustor.
0
0.1
0.2
0.3
0.4
0.5
0.6
0.7
0.8
0.9
0 5 10 15
Ma
ch N
um
ber
Length of the Cube (in)
L = 12 in ; theta = 15.7 deg"
L = 11 in ; theta = 17.2 deg"
L = 10 in ; theta = 18.8 deg"
L = 8 in; theta = 23.4 deg"

13
13
Table 3.2: Exit area and length calculations corresponding to different Mach numbers.
Mach Number
Exit Area (in2)
Exit Contracting Side (in)
0.113 17.6 4.2
0.2 10.67 2.5
0.3 7.32 1.7
0.4 5.71 1.4
0.5 4.8 1.1
0.6 4.25 1.0
0.7 3.91 0.9
0.8 3.7 0.880
3.2.3 Design and Material Specifications
The test rig is subjected to high temperatures, in the range of 700 K to 1150 K.
Along with high temperatures, the rig also undergoes high pressure operation.
Considering cost effectiveness and machinability, Stainless Steel 347 was chosen as the
material for the manufacturing of accelerating distributed combustion system.
3.2.3.1 Film Cooling Louvre Design
A special film cooling louvre has been designed to equally distribute nitrogen, thus
giving it appropriate momentum and direction. Nitrogen flows parallel to the optical
windows, providing them with requisite cooling in order to avoid thermal stresses and
also contributes towards maintaining appropriate mass flow rates. In Fig. 3.4, the arrow
points towards the end of the louvre from where heated nitrogen will flow.

14
14
Figure 3.4: Film cooling louvre design for accelerating DCS.
3.2.3.2 Windows Configuration
The windows are aligned such that the distance between nozzle and opposing wall
remains constant thus keeping the window opposite the nozzle parallel to it. The other
two windows are at a gradient as seen in Fig. 3.6. All windows are double paned: the inner
window experiences thermal load whereas the outer window experiences pressure load.
Beam deflection angles were calculated using software TracePro and the results are
tabulated in Table 3.3. The beam deflects towards the normal by a relatively small
distance compared to the cavity dimensions, and should not cause any significant loss of
viewing area.
Table 3.3: Deflection angles for 283 nm and 532 nm laser beams.
Beam Wavelength Deflection Angle
283 nm 6.3o
532 nm 6.4o
Film cooling louvre exit

15
15
Figure 3.5: Window location in the accelerating DCS.
3.2.3.3 Nozzle Location
The proposed nozzle is at a distance of six inches from the inlet of the secondary
combustion zone, enabling visualization of secondary fuel jet at Mach number of 0.3 for
the main flow. Fig. 3.5 shows the proposed location of the nozzle with respect to the
optical windows. The design allows various kinds of nozzles such as flush mounted or
extended nozzles to be used during experimentation.
Figure 3.6: Location of nozzle with respect to optical windows in accelerating DCS.

16
16
3.2.3.4 Thermocouple Location
Thermocouples are located downstream of the nozzle as seen in Fig 3.7. The
distance between the thermocouple tip and the combustion cavity is 5 mm; thus enabling
accurate temperature measurements. They will be used for monitoring the temperatures
near the throat where highest temperatures occur and for acquiring temperature data
required for calculating heat loss from the rig.
Figure 3.7: Thermocouple locations in the accelerating DCS.
3.2.3.5 Expansion Section and Quenching
The expansion section has been designed to expand high-temperature gases back
to the original cross-sectional area. The expansion angle of 13.9o is gradual compared to
contraction angle of 17.3o in the secondary combustion zone in order to avoid flow
separation and shock formation. Figure 3.8 shows the expansion section having an exit
Thermocouples
W

17
17
area equal to the inlet area of secondary combustion zone but longer in length due to
gradual contraction angle.
Figure 3.8: Expansion Section in the accelerating DCS.
3.2.4 Final Design
The CAD model and major dimensions of the final assembly of accelerated
distribution combustion system are depicted below in Fig 3.9 and Fig 3.10.
Expansion Section

18
18
Figure 3.9: CAD representation of final design.
Figure 3.10: Cross-section view of the final design.

19
19
3.3 Heat Transfer Analysis
Design iterations were performed in order to meet the following design constraints:
(a) Maximum Stainless Steel 347 wall temperature of 1150 K
(b) Maximum cooling water temperature of 373 K
(c) Maximum thermal barrier coating (TBC) service temperature of 1550 K
(d) Maximum water flow rate of 10 gpm
Figure 3.11 depicts a schematic diagram of the heat transfer model used in the
analysis. Heat flux from the combustion gases to the TBC liner is due to radiation (R1) and
convection (C1). The heat flux across the TBC liner and SS347 metal is due to conduction
(K), whereas the heat flux from SS347 metal to the water is due to convection (C2).
Figure 3.11: Schematic diagram of the heat transfer model.

20
20
At steady state, using the first law of thermodynamics, heat transfer into the
combustor wall with internal surface area 𝐴𝑤𝑔 must be equal to heat transfer out of gases.
An important assumption of negligible “stray” heat transfer is considered for estimating
the safest rig operation parameters.
(𝐶1 + 𝑅1)𝐴𝑤𝑔 = 𝐾𝑤𝑔−𝑡𝑏𝑐𝐴𝑤𝑔 = 𝐾𝑡𝑏𝑐−𝑤𝑙𝐴𝑡𝑏𝑐−𝑤𝑙 = 𝐶2𝐴𝑤𝑙 (3.1)
In Eqn. (3.1), 𝑅1 is the radiative heat flux from the combustion gas, 𝐶1 is the
convective heat flux from the combustion gas, 𝐾 is the conductive heat flux through the
combustor wall, and 𝐶2 is the convection heat flux to the cooling water. The subscripts of
(wg – tbc) and (tbc – wl) refer to the conduction across the TBC and stainless steel wall
respectively.
The heat flux from the hot combustion gases to the combustor liner was calculated
using the following relationships [9]
𝐶1 = 0.017𝑘𝑔
𝐷𝐿0.2 (
�̇�
𝐴𝐿𝜇𝑔)
0.8
(𝑇𝑟 − 𝑇𝜔𝑔) (3.2)
𝑅1 = 0.5𝜎(1 +∈𝜔)𝜖𝑔𝑇𝑔1.5(𝑇𝑔
2.5 − 𝑇𝜔𝑔2.5) (3.3)
𝑞′′ = 𝑅1 + 𝐶1 (3.4)
𝑇𝑟 = 𝑇𝑠𝑡𝑎𝑡𝑖𝑐 [1 + (𝛾−1
2) Pr
1
3𝑀2] (3.5)
In Eqns. (3.2), (3.3), (3.4), and (3.5), 𝑘𝑔 is the thermal conductivity of the exhaust gases,
𝑇𝜔𝑔 is the gas side wall temperature, 𝐷𝐿is the combustor liner diameter, �̇� is the mass
flow rate of combustion gases, 𝐴𝐿 is the combustor cross-sectional area, 𝜇𝑔 is the
dynamic viscosity of exhaust gases, 𝜎 is the Stefan-Boltzmann constant, ∈𝜔 is the wall

21
21
emissivity, 𝜖𝑔 is the emissivity of the combustion gases, 𝑇𝑟 is the recovery temperature, 𝛾
is isentropic exponent, Pr is the Prandtl number, and M is the Mach number.
The following relationships were used for the conductive heat transfer across the
TBC liner and SS 347:
𝑞′′ = 𝑘𝑡𝑏𝑐
𝑡𝑡𝑏𝑐(𝑇𝜔𝑔 − 𝑇𝑡𝑏𝑐) (3.6)
𝑞′′ = 𝑘𝜔
𝑡𝜔(𝑇𝑡𝑏𝑐 − 𝑇𝜔𝑙) (3.7)
In Equations (3.6) and (3.7), 𝑇𝑡𝑏𝑐 is the temperature at the backside of TBC in contact with
the stainless steel and 𝑇𝜔𝑙 is the wall temperature at the backside of the stainless steel
which is in contact with liquid cooling water.
Finally, the heat flux across the cooling water was calculated according to the
following forced convection relationship [9]:
ℎ𝑙 = 0.027𝑘𝑙
𝐷ℎ𝑅𝑒𝑙
4 5⁄𝑃𝑟𝑙
1 3⁄(
𝜇
𝜇𝜔𝑙)
0.14
(3.8)
𝐶2 = ℎ𝑙(𝑇𝜔𝑙 − 𝑇𝑙) (3.9)
In Eqns. (3.8) and (3.9), 𝐷ℎ represents the hydraulic diameter of the water cooling
passage, 𝜇 is the dynamic viscosity, and Re is the Reynolds number.
3.3.1 Main Combustion Zone
Calculations were performed in order to determine cooling water flow rates. In
the main combustion zone, the trends in Figs. 3.12 and 3.13 show the temperatures
experienced by TBC at ignition and steady state respectively. High pressure water at 5.5
bar with a volumetric flow rate of 9.5 gpm is passed through the 72 ports shown in Fig.
3.14. Results show that the water temperature will stay below 320 K, thus allowing

22
22
suitable safety margin from the boiling point. The equilibrium and frozen lines represent
infinitely fast chemical reactions and infinitely slow (frozen) chemical reactions
respectively.
Figure 3.12: Ignition temperatures for the main combustion zone.
Figure 3.13: Steady state temperatures for the main combustion zone.

23
23
Figure 3.14: Water cooling ports for the main combustion zone.
3.3.2 Accelerating Passage (Secondary Combustion Zone)
In the secondary combustion zone, Figs. 3.15 and 3.16 show the temperatures
scales experienced by thermal barrier coating at ignition and steady state respectively.
Low-pressure water at 8.5 gpm will be passed through 12 channels as shown in Fig. 3.17.
The trends depict that the water temperature will remain below 335 K, thus allowing a
suitable safety margin compared to the boiling point.

24
24
Figure 3.15: Ignition temperatures for the secondary combustion zone.
Figure 3.16: Steady state temperatures for the secondary combustion zone.

25
25
Figure 3.17: Cooling channels in the SCZ of accelerating DCS.
26
26
CHAPTER 4. CONCLUSIONS AND FUTURE WORK
4.1 Conclusion
A conceptual and detailed design of an accelerating distributed combustion system
has been presented. Jets injected into the main flow which is at a Mach number of 0.3
can be visualized. A converging length of 10” followed by a straight passage of 2” was
chosen for this design which will be fabricated out of Stainless Steel 347. Salient design
features of windows, thermocouples, expansion section, and film cooling louvre have
been discussed.
Along with the design a detailed one-dimensional heat transfer analysis was
performed in order to determine cooling water flow rate of 9.5 gpm in the main
combustion zone and 8.5 gpm in the secondary combustion zone. Conduction, convection,
and radiation at steady state were used for determining heat transfer relationships
between different materials.
Various laser diagnostic techniques such as PLIF, PIV, CARS along with emissions
sampling will be performed in the future for studying combustion.
4.2 Future Work
Non-intrusive laser diagnostic techniques will be used for gathering temperature,
species, and mixture fraction data in the secondary combustion zone. Emissions sampling

27
27
will be performed downstream of secondary combustion zone for measuring NOx and CO
levels along with other gases.
4.2.1 High Repetition Rate Planar Laser-Induced Flourescence (PLIF)
PLIF will be used to map the reaction zone of the secondary jet. A schematic
representation of the experimental arrangement is shown in Fig. 4.1.
Figure 4.1: High repetition rate PLIF arrangement.
4.2.2 High Repetition Rate Particle Image Velocimetry (PIV)
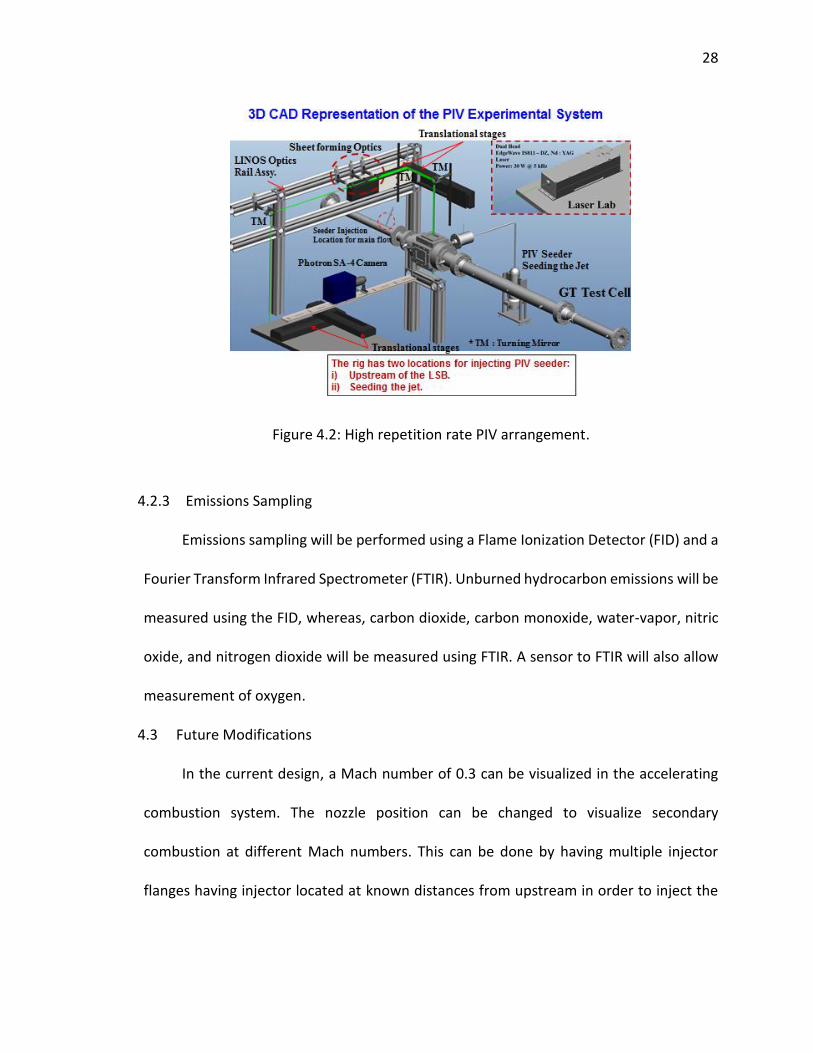
High repetition rate PIV will be performed to obtain length scale and time scale
data of turbulent reacting flows. A CAD representation of the experimental system is
shown in Fig. 4.2.
28
28
Figure 4.2: High repetition rate PIV arrangement.
4.2.3 Emissions Sampling
Emissions sampling will be performed using a Flame Ionization Detector (FID) and a
Fourier Transform Infrared Spectrometer (FTIR). Unburned hydrocarbon emissions will be
measured using the FID, whereas, carbon dioxide, carbon monoxide, water-vapor, nitric
oxide, and nitrogen dioxide will be measured using FTIR. A sensor to FTIR will also allow
measurement of oxygen.
4.3 Future Modifications
In the current design, a Mach number of 0.3 can be visualized in the accelerating
combustion system. The nozzle position can be changed to visualize secondary
combustion at different Mach numbers. This can be done by having multiple injector
flanges having injector located at known distances from upstream in order to inject the

29
29
secondary fuel at different Mach numbers. In Fig. 4.3, various positions of injector nozzle
are shown.
Figure 4.3: Multiple injector locations.

30
30
LIST OF REFERENCES
30
30
LIST OF REFERENCES
[1] J. Melillo, T. Richmond, and G. Yohe. Highlights of Climate Change Impacts in the United States: The Third National Climate Assessment. U.S. Global Change Research Program, 2014
[2] R. Jones. Advanced technology for reducing aircraft engine pollution. In American Society of Mechanical Engineers, Winter Annual Meeting, Detroit, Michigan, NASA-sponsored research, volume 96, 1973.
[3] GE Energy. 7FA Heavy Duty Gas Turbine, 2011. [4] Siemens Energy. Siemens Gas Turbine SGT6-5000F, 2011. [5] W. Lamont. Experimental study of a staged combustion system for stationary gas
turbine applications. PhD Thesis, Purdue University, 2012. [6] M. Roa. Investigation of reacting jet injected into vitiated crossflow using CARS, high
repetition rate OH-PLIF, and high repetition rate PIV. PhD Thesis, Purdue University, 2014
[7] H. Mongia. Engineering aspects of complex gas turbine combustion mixers part III:
30 OPR. In 9th Annual International Energy Conversion Engineering Conference, San Diego, California, 2011.
[8] W. Lamont, M. Roa, S. Meyer, and R. Lucht. Emission Measurements and CH
Chemiluminescence of a Staged Combustion Rig for Stationary Gas Turbine Applications. Journal of Engineering for Gas Turbines and Power, 134(8):081502, 2012.
[9] A. Lefebvre. Gas Turbine Combustion. Taylor & Francis, 2nd edition, 1999.

31
APPENDICES

31
31
Appendix A
% MATLAB code for heat transfer analysis when the rocket chamber and
nozzle are cooled using turbine exhaust gases. % Originally written by Warren Lamont, modified by Yashovardhan Wagh
and % Pratikash Panda for new design clear all; close all; tic
disp(sprintf('\n phi = 0.5, 5 bar, nominal, head end case, See
\CEA\siemens.out for CEA %s\n')); disp(sprintf('\n Starting Calculation... %s\n'));
% To = 1792; %was 1964 %stagnation
temperature K (adiabatic ~ 2000 K) P = 550000; %static pressure
(Pa) % rho = 1.0478; %kg/m^3 % % V = mg/(rho*pi*R^2); %gas
velocity m/s % ag = 816.6; %speed of
sound m/s MUG = 0.000064895; %kg/sm gamma = 1.2667; %in the
combustion chamber R_g = 287; Rgas = 287; % M = V/ag; %mach number
of exhaust gas % Reg = rho*M*ag*2*R/MUG; %gaseous
reynolds number % Po = (1+(gamma-1)/2*M^2)^(gamma/(gamma-1))*P; %stagnation
pressure;
%Intialization nmax = 250 To = 1800; %SCZ Inlet temperature in K. Pcomb = 550000; %Combustion operating Pressure Pa. mdot_main = 1.25; %MCZ+SCZ+N2 Film Cooling mass flow rate in kg/s.
mdotl = 1.2; % Mass flow rate of cooling water kg/s 9.5 gpm conversion
kg/s = 60/3.8 gpm M_exit = 0.8; %Exit Mach # 0.8. x = zeros(nmax,1); y = zeros(nmax,1); A = zeros(nmax,1); %Cross-Section of the combustor

32
32
Pstatic = zeros(nmax,1); Tstatic = zeros(nmax,1); rho = zeros(nmax,1); M = zeros(nmax,1); %Mach Number C = zeros(nmax,1); %Speed of Sound V = zeros(nmax,1); %Velocity of Exhaust Gas Prcomb = zeros(nmax,1); %Combustor Perimeter Dhy = zeros(nmax,1); %Comb hydrualic diameter H_inlet = 0.1067; %Inlet Height of the combustor H = 4.2 in.
H_exit = 0.022; % ** Exit Height of the combustor H = 0.88 in %check and change as per the length and convergence
angle
D_comb = 0.1067; %SCZ Depth D = 4.2 in, injector to wall distance kept
constant. % L_conv = 0.2032; %Length of the convergin section L= 8 in. % L_strgt = 0.1016; %Length of the convergin section L= 4 in. L_conv = 0.254; %Length of the convergin section L= 10 in. L_strgt = 0.0508; %Length of the convergin section L= 2 in. L_tot = 0.3048; %Total Length of Combustor, L = 12 in. % theta_conv = 11.7*pi()/180; %Convergence Half Angle 11.7 degree. theta_conv = 9.5*pi()/180; %Changing the half angle to 9.8 degree. % nmax = 1000; delta = L_tot/nmax;
% Contour of the Window Combustor. for i=1:nmax x(i)=i*delta; if x(i)<=L_conv y(i)= H_inlet - 2*tan(theta_conv)*(x(i)); A(i)=y(i)*D_comb; Prcomb(i)=2*(y(i)+D_comb); Dhy(i) = 4*A(i)/Prcomb(i); else y(i)=H_exit; A(i)=y(i)*D_comb; Prcomb(i)=2*(y(i)+D_comb); Dhy(i) = 4*A(i)/Prcomb(i); end end
%SCZ Inlet Condition Calculation A_inlet = H_inlet*D_comb; rho_inlet = Pcomb/Rgas/To; V_inlet = mdot_main/rho_inlet/A_inlet; C_inlet = sqrt(gamma*Rgas*To); M_inlet = V_inlet/C_inlet;
Po=Pcomb*(1+((gamma-1)/2)*M_inlet^2)^((gamma)/(gamma-1)); %Area Calculation at all the converging stations. % del_Mach = ((M_exit-M_inlet)/(nmax*(L_tot-L_strgt)/L_tot)); Lconv_exit = (L_tot-L_strgt)/L_tot; M_guess = 0.1;

33
33
for i=1:nmax
if i<nmax*Lconv_exit M(i)= M_guess; for j=1:100
Pstatic(i)=Po/(1+((gamma-1)/2)*(M(i))^2)^((gamma)/(gamma-
1)); Tstatic(i)=To/(1+((gamma-1)/2)*(M(i))^2); rho(i)=Pstatic(i)/(Rgas*Tstatic(i)); C(i)=sqrt(gamma*Rgas*Tstatic(i)); V(i)=M(i)*C(i); A(i)=mdot_main/rho(i)/V(i); y2=A(i)/D_comb; err=y2-y(i); if err < 0.01 M(i)=M(i); break; else M(i)=M(i)+0.01; end end
else M(i)=0.8; Pstatic(i)=Po/(1+((gamma-1)/2)*(M(i))^2)^((gamma)/(gamma-1)); Tstatic(i)=To/(1+((gamma-1)/2)*(M(i))^2); rho(i)=Pstatic(i)/(Rgas*Tstatic(i)); C(i)=sqrt(gamma*Rgas*Tstatic(i)); V(i)=M(i)*C(i); % A(i)=mdot_main/rho(i)/V(i); % y(i)=A(i)/2/D_comb; end
end
% figure() % subplot(2,2,1) % plot(x/0.0254,y/2/0.0254); % hold on; % plot(x/0.0254,-y/2/0.0254); % xlabel('X (in)'); % ylabel('Hcomb (in)'); % grid; % subplot(2,2,2) % plot(x/0.0254,M); % xlabel('X (in)'); % ylabel('Ma #'); % grid; % subplot(2,2,3) % plot(x/0.0254,rho); % xlabel('X (in)'); % ylabel('Gas Density (kg/m^3)'); % grid;

34
34
% subplot(2,2,4) % plot(x/0.0254,V); % xlabel('X (in)'); % ylabel('Velocity (m/s)'); % grid;
%Plotting Variables % Create figure figure1 = figure('Color',[1 1 1]);
% Create subplot subplot1 =
subplot(2,2,1,'Parent',figure1,'FontWeight','bold','FontSize',20,... 'FontName','Times New Roman'); box(subplot1,'on'); grid(subplot1,'on'); hold(subplot1,'all');
% Create multiple lines using matrix input to plot plot(x/0.0254,y/2/0.0254,'Parent',subplot1,'LineWidth',4); hold on; plot(x/0.0254,-y/2/0.0254,'Parent',subplot1,'LineWidth',4); % Create xlabel xlabel('X (in)','FontWeight','bold','FontSize',20,... 'FontName','Times New Roman');
% Create ylabel ylabel('Hcomb (in)','FontWeight','bold','FontSize',20,... 'FontName','Times New Roman');
% Create subplot subplot2 =
subplot(2,2,2,'Parent',figure1,'FontWeight','bold','FontSize',20,... 'FontName','Times'); box(subplot2,'on'); grid(subplot2,'on'); hold(subplot2,'all');
% Create plot plot(x/0.0254,M,'Parent',subplot2,'LineWidth',4);
% Create xlabel xlabel('X (in)','FontWeight','bold','FontSize',20,... 'FontName','Times New Roman');
% Create ylabel ylabel('Ma #','FontWeight','bold','FontSize',20,... 'FontName','Times New Roman');
% Create subplot subplot3 =
subplot(2,2,3,'Parent',figure1,'FontSize',20,'FontName','Times');
35
35
box(subplot3,'on'); grid(subplot3,'on'); hold(subplot3,'all');
% Create plot plot(x/0.0254,rho,'Parent',subplot3,'LineWidth',4);
% Create xlabel xlabel('X (in)','FontWeight','bold','FontSize',20,... 'FontName','Times New Roman');
% Create ylabel ylabel('Gas Density (kg/m^3)','FontWeight','bold','FontSize',20,... 'FontName','Times New Roman');
% Create subplot subplot4 =
subplot(2,2,4,'Parent',figure1,'FontSize',20,'FontName','Times'); box(subplot4,'on'); grid(subplot4,'on'); hold(subplot4,'all');
% Create plot plot(x/0.0254,V,'Parent',subplot4,'LineWidth',4);
% Create xlabel xlabel('X (in)','FontWeight','bold','FontSize',20,... 'FontName','Times New Roman');
% Create ylabel ylabel('Velocity (m/s)','FontWeight','bold','FontSize',20,... 'FontName','Times New Roman');
%exhaust gas fluid properites: % To = 1800; % Temperature coming into window
combustor assuming head end of 0.55 equi ratio 1964; %stagnation
temperature K (adiabatic ~ 2000 K) % P = 550000; %static
pressure (Pa) % rho = 1.0268; %kg/m^3 % V = mg/(rho*pi*R^2); %gas velocity
m/s % ag = 824; %speed of sound
m/s % MUG = 0.000065769; %kg/sm % gamma = 1.2530; %in the
combustion chamber % M = V/ag; %mach number
of exhaust gas

36
36
% Reg = rho*M*ag*2*R/MUG; %gaseous
reynolds number % Po = (1+(gamma-1)/2*M^2)^(gamma/(gamma-1))*P; %stagnation
pressure;
Eg = 0.26; %gas emissivity from calculations in black
book for non luminous exhaust gas Ew = 0.984; %Emissivity for 8YSZ TBC %wall emissivity
from Lefebvre page 278 for SS 0.8 SB = 5.67e-8; %Stefan-Boltzmann Constant W/m^2K^2 Ess = 0.8; %** Look up for SS 347. emissivity of
Stainless Steel 316/SS 347.
%wall conductivity SS316 @ 800 K [incropera & dewitt] %** Look Up wall conductivity SS347 @ 800 K [incropera & dewitt] kw = 21.3; %W/mK tw = 6e-3; %[m] wall thickness ** Can change upto 10 mm. Tl(1) = 298; %[K] manifold temperature % Ta(1) = 240; %[K] N2 comes in cold because of expansion.
%properties of TBC (assumed) ttbc = 0.0005; %m (500 um) 100um bond coat and 400 um TBC layer ktbc = 1.2; %W/mK from Anand Kulkarni
%Nitrogen properties (annulus) ka = 0.0259; %W/mK conductivity for N2 at 300 K Dan = 2*0.000965;%508; %for an annular chamber page 282 from
Lefebvre % man = 0.025675; %kg/s N2 flow. 10% of bulk flow man = 0.75/2.2; %kg/s N2 flow. 10% of bulk flow Aan = 3.09*10^(-4); %area required to match velocities mua = 178.2*10^-7; %Ns/m^2 viscosity at 300 K cpa = 1.041*1000; %J/kgK
% %coolant is water and assumed constant properties (no phase change) cpl = 4180; %J/kgK kl = 0.58; %W/mK mul = 0.000548; %kg/ms rhol = 988; %kg/m^3 Cc = 12; % Number of cooling passages. % Perl = ((0.0625+2*0.09375)+pi*0.0625/2)*0.0254; %perimeter
of one cooling channel m % Al = ((0.0625*0.09375)+pi/8*0.0652^2)*0.0254^2; %area of one
cooling channel m^2 dl = 0.6*0.0254; %Size of cooling passage 0.5" Perl = 2*pi*dl; %perimeter of one cooling channel m Al = pi/4*dl^2; %area of one cooling channel m^2 Dh = 4*Al/Perl; Rel = 4*(mdotl/Cc)/Perl/mul; Prl = mul*cpl/kl; %%
%Expansion conditions designator (1= equilibrium, 2= frozen);

37
37
% for eqfz=1:2; % % if eqfz == 1 %eq'm % Kg=1.2633; %W/mk; % PRg=0.7349; % elseif eqfz==2 % Kg=1.2102; %W/mk % PRg=0.7399; % else % break % end % for i=1:nmax % % %
% end % end
%%
last = nmax; for eqfz=1:2;
if eqfz == 1 %eq'm Kg=1.2633; %W/mk; PRg=0.7349; elseif eqfz==2 Kg=1.2102; %W/mk PRg=0.7399; else break end for ind=1:nmax qdot1(ind)=1e30; qdot2(ind)=1; i(ind)=1; increment=0.1; limit=20000; err = 5000;
%Recovery Temperature for HTC calculation % Tr(ind) = To/(1+(gamma-1)/2*PRg^(1/3)*M(ind)^2); Tr(ind) = Tstatic(ind)*(1+(gamma-
1)/2*PRg^(1/3)*M(ind)^2);
% %internal convection from Lefebvre: hg(ind) =
0.017*Kg/((Dhy(ind))^0.2)*(mdot_main/(A(ind)*MUG))^0.8;

38
38
Twg(ind)=700; %guess while abs(qdot1(ind)-qdot2(ind))>err && i(ind)<limit qdot1(ind)=hg(ind)*(Tr(ind)-
Twg(ind))+0.5*SB*(1+Ew)*Eg*To^1.5*(To^2.5-Twg(ind)^2.5); Ti(ind)=Twg(ind)-qdot1(ind)*ttbc/ktbc; Twl(ind)=Ti(ind)-qdot1(ind)*tw/kw; [muwl]= propliq(Twl(ind)); %Sieder and Tate for large proper variation in turbulent tubes
hl(ind)=kl/(4*Al/Perl)*0.027*(Rel)^0.8*Prl^(1/3)*(mul/muwl)^0.14; if ind ==1 qdot2(ind)=hl(ind)*(Twl(ind)-Tl(ind)); else qdot2(ind)=hl(ind)*(Twl(ind)-Tl(ind-1)); end Twg(ind)=Twg(ind)+increment; i(ind)=i(ind)+1; error(ind)=abs(qdot1(ind)-qdot2(ind)); end X=L_tot/nmax; %calculate Tli from Tl-1 if ind==1 %do nothing assumed the first point uses the manifold
temperature elseif ind == last Tl(ind)=Tl(ind-
1)+1/(mdotl/Cc*cpl)*(X/2)*qdot2(ind)*((Prcomb(ind))/Cc); %72 cooling
channels else Tl(ind)=Tl(ind-
1)+1/(mdotl/Cc*cpl)*(X)*qdot2(ind)*((Prcomb(ind))/Cc); end
end %%
% %determine presure drop % Pl(1)=413685.44; %pressure [pa] in manifold 60 psi % q=(mdotl/Cc)^2/(2*rhol*(Al)^2); % f=0.0014+0.125/Rel^0.32; % for ind=2:(last) % Pl(ind)=Pl(ind-1)-(4*f*X/(4*Al/Perl)*(q)); % end
%P=P/6894.7573; %convert pressure to PSI %q=q/6894.7573; %convert dynamic pressure to psi %exporting part ii % C(1,:)={'Segment','X [m]', 'r [m]','S [m]', 'M', 'P [psi]', 'T [K]'}; % cellwrite('output.txt',C); % for y=1:length(X) % B(y,:)={y,X(y),R(y),S(y),M(y),P(y),T(y)}; % end % cellwrite('output.txt',B);
39
39
% %Pl=Pl/6894.7573; %convert liquid pressure drop to PSI % %exporting2 part iii % D(1,:)={'Segment','X [m]', 'r [m]','$P_l$ [Pa]',
'$\dot{q}$ [W/$m^2$]','$h_g$ [W/$m^2$K]','$h_l$ [W/$m^2$K]',
'$T_l$ [K]', '$T_{wg}$ [K]'}; % cellwrite('output2.txt',D); % for y=1:length(X) % E(y,:)={y,X(y),R(y),Pl(y),qdot1(y),hg(y),hl(y),Tl(y),Twg(y)}; % end % cellwrite('output2.txt',E); % QDOT(:,eqfz)=qdot1; HG1(:,eqfz)=hg; %HL1(:,eqfz)=hl; TL(:,eqfz)=Tl; TWG(:,eqfz)=Twg; TWL(:,eqfz)=Twl; I(:,eqfz)= i; TI(:,eqfz) = Ti; ERROR(:,eqfz)=error; %PL1(:,eqfz)=Pl; % end % % % (PL1(1,1)-PL1(last,1))/6894.7573 % (PL1(1,2)-PL1(last,2))/6894.7573 % %% tplot(1,:)=['equilibrium','frozen']; color(1,:)='b- '; color(2,:)='r- '; % color(3,:)='r-.'; % color(4,:)='c--';
% figure(1) % for v=1:2 % plot(S,PL1(:,v),color(v,:),'LineWidth',2); % hold on; % end % legend('Equilibrium','Frozen','Location','Best'); % xlabel('X (m)'); % ylabel('Pl (Pa)'); % grid;
% figure(2) for v=1:2 plot(x/0.0254,QDOT(:,v),color(v,:),'LineWidth',2); hold on; end legend('Equilibrium','Frozen','Location','Best'); xlabel('X (in)'); ylabel('qdot (W/m^2)');

40
40
grid; % % figure(3) % for v=1:2 % plot(X,HG1(:,v),color(v,:),'LineWidth',2); % hold on; % end % legend('Equilibrium','Frozen','Location','Best'); % xlabel('X (m)'); % ylabel('h_g (W/m^2K)'); % grid; % % figure(4) % for v=1:2 % plot(X,HL1(:,v),color(v,:),'LineWidth',2); % hold on; % end % legend('Equilibrium','Frozen','Location','Best'); % xlabel('X (m)'); % ylabel('h_l (W/m^2K)'); % grid; % figure(5) for v=1:2 plot(x/0.0254,TL(:,v),color(v,:),'LineWidth',2); hold on; end legend('Equilibrium','Frozen','Location','Best'); xlabel('X (in)'); ylabel('Tl (K)'); grid; % figure(6) for v=1:2 plot(x/0.0254,TWG(:,v),color(v,:),'LineWidth',2); hold on; end legend('Equilibrium','Frozen','Location','Best'); xlabel('X (in)'); ylabel('T_{wg} (K)'); grid;
figure(7) for v=1:2 plot(x/0.0254,TWL(:,v),color(v,:),'LineWidth',2); hold on; end legend('Equilibrium','Frozen','Location','Best'); xlabel('X (in)'); ylabel('T_{wl} (K)'); grid;
figure(8) for v=1:2 plot(x/0.0254,TI(:,v),color(v,:),'LineWidth',2);

41
41
hold on; end legend('Equilibrium','Frozen','Location','Best'); xlabel('X (in)'); ylabel('T_{TBC} (K)'); grid; figure1 = figure('Color',[1 1 1]);
for i=1:2 % Create axes axes1 = axes('Parent',figure1,'FontWeight','bold','FontSize',20,... 'FontName','Times'); box(axes1,'on'); grid(axes1,'on'); hold(axes1,'all');
% Create multiple lines using matrix input to plot plot1(i) =
plot(x/0.0254,TI(:,v),color(v,:),'Parent',axes1,'LineWidth',4); set(plot1(1),'Color',[0 0 1],'DisplayName','Equilibrium'); set(plot1(2),'Color',[1 0 0],'DisplayName','Frozen');
% Create xlabel xlabel('X (in)','FontWeight','bold','FontSize',20,'FontName','Times');
% Create ylabel ylabel('qdot
(W/m^2)','FontWeight','bold','FontSize',20,'FontName','Times');
% Create legend legend1 = legend(axes1,'show'); set(legend1,'Location','Best'); end % % figure(7) % plot(X,RHOL) % xlabel('X (m)'); % ylabel('\rho_l (kg/m^3)'); % grid; % % figure(8) % plot(X,MUL) % xlabel('X (m)'); % ylabel('\mu_l (kg/ms)'); % grid;
%subplot(3,2,1) % figure (3) % plot(X,R, 'o'); % xlabel('X [m]','FontSize',10) % ylabel('R [m]','FontSize',10) % grid on; % % subplot(3,2,2)

42
42
% plot(X,Twg); % xlabel('X [m]','FontSize',10) % ylabel('Twg [K]','FontSize',10) % grid on; % % subplot(3,2,3) % plot(X,i, 'o') % xlabel('X [m]','FontSize',10) % ylabel('# of iterations for convergence','FontSize',10) % grid on; % % subplot(3,2,4) % plot(X,Pl) % xlabel('X [m]','FontSize',10) % ylabel('Pl [psi]','FontSize',10) % grid on; % % subplot(3,2,5) % plot(X,M) % xlabel('X [m]','FontSize',10) % ylabel('M','FontSize',10) % grid on; % % subplot(3,2,6) % plot(X,Tl) % xlabel('X [m]','FontSize',10) % ylabel('Tl','FontSize',10) % grid on;
% subplot(3,2,2) % plot(t,F) % xlabel('time [s]','FontSize',10) % ylabel('Thrust [N]','FontSize',10) % grid on % subplot(3,2,3) % plot(t,Cf) % xlabel('time [s]','FontSize',10) % ylabel('Cf','FontSize',10) % grid on % subplot
% color(1,:)='b- '; % color(2,:)='g: '; % color(3,:)='r-.'; % color(4,:)='c--'; % figure(1) % for q=1:length(tplot) % plot(x,Tw(tind(q),:),color(q,:),'LineWidth',2); % hold on; % char(q,:)=num2str(tplot(q),'%12.3g'); % LGD(q,:)=['t=',char(q,:),'s']; % end % xlabel('Wall Location (m)'); % ylabel('Temperature (K)');

43
43
% legend(LGD); % grid; % % for n=1:length(Tw(:,1)) % t2(n,1)=t(1,n); % end % % figure(2) % plot(t2,Tw(:,1)); % xlabel('Time (s)'); % ylabel('Wall Surface Temperature (K)'); % grid; disp(sprintf('\n Finished.%s\n')); toc

44
44
Appendix B
%Siemens HT code with pressure drop %"It is better to live one day as a lion, than a thousand years as a
lamb." %W. Lamont % Originally written by Warren Lamont, modified by Yashovardhan Wagh
and % Pratikash Panda for new design
%Head end using CEA properties from \CEA\siemens.out (NOMINAL)
%Adapting to 4" window combustor with Louvre. This calculates the wall %temperature of the Louvre. N2 cooling in annulus (C2). tic clear all close all clc
disp(sprintf('\n phi = 0.6, 5 bar, nominal, louvre, See
\CEA\siemens.out for CEA %s\n')); disp(sprintf('\n Starting Calculation... %s\n')); %% %read in data and convert to SI units m, m^2: L = 0.098; %length in m R = 0.11/2; %hydraulic radius m Dh = 4A/P N = 100; %number of segments X = L/N; %length of each segment mg = 1.0; %mdot of exhaust gas kg/s % mg = 1.25; %mdot of exhaust gas kg/s mdotl = 0.37; %mdot of water coolant ~ 4gpm (0.25 kg/s) Cc = 72; %Number of cooling Channels %%
S(1,1)=X/2; for i =2:(N-1) S(i,1)=S(i-1)+X; i=i+1; end S(N)=S(N-1)+X/2;
%% %exhaust gas fluid properites:
To = 1900; % Temperature coming into window
combustor assuming head end of 0.55 equi ratio 1964; %stagnation
temperature K (adiabatic ~ 2000 K) P = 550000; %static pressure
(Pa) rho = 1.0268; %kg/m^3

45
45
V = mg/(rho*pi*R^2); %gas velocity
m/s ag = 824; %speed of sound
m/s MUG = 0.000065769; %kg/sm gamma = 1.2530; %in the
combustion chamber M = V/ag; %mach number of
exhaust gas Reg = rho*M*ag*2*R/MUG; %gaseous
reynolds number Po = (1+(gamma-1)/2*M^2)^(gamma/(gamma-1))*P; %stagnation
pressure;
Eg = 0.26; %gas emissivity from calculations in black
book for non luminous exhaust gas Ew = 0.984; %Emissivity for 8YSZ TBC %wall emissivity
from Lefebvre page 278 for SS 0.8 SB = 5.67e-8; %Stefan-Boltzmann Constant W/m^2K^2 Ess = 0.8; %emissivity of Stainless Steel 316. Tstatic=To/(1+((gamma-1)/2)*(M)^2); %wall conductivity SS316 @ 800 K [incropera & dewitt] kw = 21.3; %W/mK tw = 6e-3; %[m] wall thickness %Tl(1) = 298; %[K] manifold temperature Ta(1) = 240; %[K] N2 comes in cold because of expansion.
%properties of TBC (assumed) ttbc = 0.0005; %m (500 um) 100um bond coat and 400 um TBC layer ktbc = 1.2; %W/mK from Anand Kulkarni
%Nitrogen properties (annulus) ka = 0.0259; %W/mK conductivity for N2 at 300 K Dan = 2*0.000965;%508; %for an annular chamber page 282 from
Lefebvre % man = 0.025675/2; %kg/s N2 flow. 10% of bulk flow man = 0.25; % 20% for Ma = 0.3 % Aan = 2.122*10^(-4); %area required to match velocities Aan = 2.09*10^(-4); %area required to match velocities mua = 178.2*10^-7; %Ns/m^2 viscosity at 300 K cpa = 1.041*1000; %J/kgK
% %coolant is water and assumed constant properties (no phase change) % cpl = 4180; %J/kgK % kl = 0.58; %W/mK % mul = 0.000548; %kg/ms % rhol = 988; %kg/m^3 % Perl = ((0.0625+2*0.09375)+pi*0.0625/2)*0.0254; %perimeter
of one cooling channel m % Al = ((0.0625*0.09375)+pi/8*0.0652^2)*0.0254^2; %area of one
cooling channel m^2 % Dh = 4*Al/Perl; % Rel = 4*(mdotl/Cc)/Perl/mul; % Prl = mul*cpl/kl;

46
46
%%
%Expansion conditions designator (1= equilibrium, 2= frozen); for eqfz=1:2;
if eqfz == 1 %eq'm Kg=1.2633; %W/mk; PRg=0.7349; elseif eqfz==2 Kg=1.2102; %W/mk PRg=0.7399; else break end
Tr = Tstatic*(1+(gamma-1)/2*PRg^(1/3)*M^2);
%internal convection from Lefebvre: hg = 0.017*Kg/(R*2)^0.2*(mg/(pi*R^2*MUG))^0.8;
last = length(S);
%% for ind=1:length(S) qdot1(ind)=1e30; qdot2(ind)=1; i(ind)=1; increment=0.1; limit=20000; err = 10000;
Twg(ind)=700; %guess while abs(qdot1(ind)-qdot2(ind))>err && i(ind)<limit qdot1(ind)=hg*(Tr-Twg(ind))+0.5*SB*(1+Ew)*Eg*To^1.5*(To^2.5-
Twg(ind)^2.5); Ti(ind)=Twg(ind)-qdot1(ind)*ttbc/ktbc; Twl(ind)=Ti(ind)-qdot1(ind)*tw/kw; %backside of Louvre
wall %[muwl]= propliq(Twl(ind)); %Sieder and Tate for large proper variation in turbulent tubes %hl(ind)=kl/(4*Al/Perl)*0.027*(Rel)^0.8*Prl^(1/3)*(mul/muwl)^0.
14; h2(ind) = 0.020*ka/(Dan^0.2)*(man/(Aan*mua))^0.8; %from
Lefebvre equation 8-23. Rad(ind) = SB*Ew*Ess/(Ew+Ess*(1-Ew)); %from
Lefebvre equation 8-17. %Liner
Emissivity is SS (backside). Casing Emissivity is TBC if ind ==1 qdot2(ind)=h2(ind)*(Twl(ind)-Ta(ind))+Rad(ind)*(Twl(ind)^4
- Ta(ind)^4); else qdot2(ind)=h2(ind)*(Twl(ind)-Ta(ind-
1))+Rad(ind)*(Twl(ind)^4 - Ta(ind-1)^4);

47
47
end Twg(ind)=Twg(ind)+increment; i(ind)=i(ind)+1; error(ind)=abs(qdot1(ind)-qdot2(ind)); end
%calculate Tli from Tl-1 if ind==1 %do nothing assumed the first point uses the manifold
temperature elseif ind == last Ta(ind)=Ta(ind-1)+1/(man*cpa)*(X/2)*qdot2(ind)*(2*pi*R); %72
cooling channels else Ta(ind)=Ta(ind-1)+1/(man*cpa)*(X)*qdot2(ind)*(2*pi*R); end
end %%
% %determine presure drop % Pl(1)=413685.44; %pressure [pa] in manifold 60 psi % q=(mdotl/Cc)^2/(2*rhol*(Al)^2); % f=0.0014+0.125/Rel^0.32; % for ind=2:(last) % Pl(ind)=Pl(ind-1)-(4*f*X/(4*Al/Perl)*(q)); % end
%P=P/6894.7573; %convert pressure to PSI %q=q/6894.7573; %convert dynamic pressure to psi %exporting part ii % C(1,:)={'Segment','X [m]', 'r [m]','S [m]', 'M', 'P [psi]', 'T [K]'}; % cellwrite('output.txt',C); % for y=1:length(X) % B(y,:)={y,X(y),R(y),S(y),M(y),P(y),T(y)}; % end % cellwrite('output.txt',B); % %Pl=Pl/6894.7573; %convert liquid pressure drop to PSI % %exporting2 part iii % D(1,:)={'Segment','X [m]', 'r [m]','$P_l$ [Pa]',
'$\dot{q}$ [W/$m^2$]','$h_g$ [W/$m^2$K]','$h_l$ [W/$m^2$K]',
'$T_l$ [K]', '$T_{wg}$ [K]'}; % cellwrite('output2.txt',D); % for y=1:length(X) % E(y,:)={y,X(y),R(y),Pl(y),qdot1(y),hg(y),hl(y),Tl(y),Twg(y)}; % end % cellwrite('output2.txt',E); % QDOT(:,eqfz)=qdot1; HG1(:,eqfz)=hg; %HL1(:,eqfz)=hl; TA1(:,eqfz)=Ta;

48
48
TWG(:,eqfz)=Twg; TWL(:,eqfz)=Twl; I(:,eqfz)= i; TI(:,eqfz) = Ti; ERROR(:,eqfz)=error; %PL1(:,eqfz)=Pl; % end % % % (PL1(1,1)-PL1(last,1))/6894.7573 % (PL1(1,2)-PL1(last,2))/6894.7573 % % tplot(1,:)=['equilibrium','frozen']; color(1,:)='b- '; color(2,:)='r- '; % color(3,:)='r-.'; % color(4,:)='c--';
% figure(1) % for v=1:2 % plot(S,PL1(:,v),color(v,:),'LineWidth',2); % hold on; % end % legend('Equilibrium','Frozen','Location','Best'); % xlabel('X (m)'); % ylabel('Pl (Pa)'); % grid;
% figure(2) for v=1:2 plot(S,QDOT(:,v),color(v,:),'LineWidth',2); hold on; end legend('Equilibrium','Frozen','Location','Best'); xlabel('X (m)'); ylabel('qdot (W/m^2)'); grid; % % figure(3) % for v=1:2 % plot(X,HG1(:,v),color(v,:),'LineWidth',2); % hold on; % end % legend('Equilibrium','Frozen','Location','Best'); % xlabel('X (m)'); % ylabel('h_g (W/m^2K)'); % grid; % % figure(4) % for v=1:2 % plot(X,HL1(:,v),color(v,:),'LineWidth',2); % hold on;

49
49
% end % legend('Equilibrium','Frozen','Location','Best'); % xlabel('X (m)'); % ylabel('h_l (W/m^2K)'); % grid; % figure(5) for v=1:2 plot(S,TA1(:,v),color(v,:),'LineWidth',2); hold on; end legend('Equilibrium','Frozen','Location','Best'); xlabel('X (m)'); ylabel('T_A (K)'); grid; % figure(6) for v=1:2 plot(S,TWG(:,v),color(v,:),'LineWidth',2); hold on; end legend('Equilibrium','Frozen','Location','Best'); xlabel('X (m)'); ylabel('T_{wg} (K)'); grid;
figure(7) for v=1:2 plot(S,TWL(:,v),color(v,:),'LineWidth',2); hold on; end legend('Equilibrium','Frozen','Location','Best'); xlabel('X (m)'); ylabel('T_{wl} (K)'); grid;
figure(8) for v=1:2 plot(S,TI(:,v),color(v,:),'LineWidth',2); hold on; end legend('Equilibrium','Frozen','Location','Best'); xlabel('X (m)'); ylabel('T_{TBC} (K)'); grid;
% % figure(7) % plot(X,RHOL) % xlabel('X (m)'); % ylabel('\rho_l (kg/m^3)'); % grid; % % figure(8) % plot(X,MUL)

50
50
% xlabel('X (m)'); % ylabel('\mu_l (kg/ms)'); % grid;
%subplot(3,2,1) % figure (3) % plot(X,R, 'o'); % xlabel('X [m]','FontSize',10) % ylabel('R [m]','FontSize',10) % grid on; % % subplot(3,2,2) % plot(X,Twg); % xlabel('X [m]','FontSize',10) % ylabel('Twg [K]','FontSize',10) % grid on; % % subplot(3,2,3) % plot(X,i, 'o') % xlabel('X [m]','FontSize',10) % ylabel('# of iterations for convergence','FontSize',10) % grid on; % % subplot(3,2,4) % plot(X,Pl) % xlabel('X [m]','FontSize',10) % ylabel('Pl [psi]','FontSize',10) % grid on; % % subplot(3,2,5) % plot(X,M) % xlabel('X [m]','FontSize',10) % ylabel('M','FontSize',10) % grid on; % % subplot(3,2,6) % plot(X,Tl) % xlabel('X [m]','FontSize',10) % ylabel('Tl','FontSize',10) % grid on;
% subplot(3,2,2) % plot(t,F) % xlabel('time [s]','FontSize',10) % ylabel('Thrust [N]','FontSize',10) % grid on % subplot(3,2,3) % plot(t,Cf) % xlabel('time [s]','FontSize',10) % ylabel('Cf','FontSize',10) % grid on % subplot

51
51
% color(1,:)='b- '; % color(2,:)='g: '; % color(3,:)='r-.'; % color(4,:)='c--'; % figure(1) % for q=1:length(tplot) % plot(x,Tw(tind(q),:),color(q,:),'LineWidth',2); % hold on; % char(q,:)=num2str(tplot(q),'%12.3g'); % LGD(q,:)=['t=',char(q,:),'s']; % end % xlabel('Wall Location (m)'); % ylabel('Temperature (K)'); % legend(LGD); % grid; % % for n=1:length(Tw(:,1)) % t2(n,1)=t(1,n); % end % % figure(2) % plot(t2,Tw(:,1)); % xlabel('Time (s)'); % ylabel('Wall Surface Temperature (K)'); % grid; disp(sprintf('\n Finished.%s\n'));