Embed Size (px)
Citation preview
THE TRANSPORT AND CHEMICAL EVOLUTION OVER THE PACIFIC (TRACE-P) AIRCRAFT MISSION: DESIGN, EXECUTION, AND FIRST RESULTS
Daniel J. Jacob1, James H. Crawford2, Mary M. Kleb2, Vickie E. Connors2, Richard J. Bendura2, James L. Raper2, Glen W. Sachse2, John C. Gille3, Louisa Emmons3, and Colette L. Heald1
1Harvard University, Cambridge, MA ([email protected]) 2NASA/Langley Research Center, Hampton, VA 3National Center for Atmospheric Research, Boulder, CO
submitted to JGR – Atmospheres (TRACE-P special section): December 2, 2002
Revised: March 13, 2003
ABSTRACT
The NASA Transport and Chemical Evolution over the Pacific (TRACE-P) aircraft mission was conducted in February-April 2001 over the NW Pacific to (1) characterize the Asian chemical outflow and relate it quantitatively to its sources; (2) determine its chemical evolution. It used two aircraft, a DC-8 and a P-3B, operating out of Hong Kong and Yokota Air Force Base (near Tokyo), with secondary sites in Hawaii, Wake Island, Guam, Okinawa, and Midway. The aircraft carried instrumentation for measurements of long-lived greenhouse gases, ozone and its precursors, aerosols and their precursors, related species, and chemical tracers. Five chemical transport models (CTMs) were used for chemical forecasting. Customized bottom-up emission inventories for East Asia were generated prior to the mission to support chemical forecasting and to serve as a priori for evaluation with the aircraft data. Validation flights were conducted for the MOPITT satellite instrument and revealed little bias (6±2%) in the MOPITT measurements of CO columns. A major event of transpacific Asian pollution was characterized through combined analysis of TRACE-P and MOPITT data. The TRACE-P observations showed that cold fronts sweeping across East Asia and the associated warm conveyor belts (WCBs) are the dominant pathway for Asian outflow to the Pacific in spring. The WCBs lift both anthropogenic and biomass burning (SE Asia) effluents to the free troposphere, resulting in complex chemical signatures. The TRACE-P data are in general consistent with a priori emission inventories, lending confidence in our ability to quantify Asian emissions from socioeconomic data and emission factors. However, the residential combustion source in rural China was found to be much larger than the a priori, and there were also unexplained chemical enhancements (HCN, CH3Cl, OCS, alkylnitrates) in Chinese urban plumes. The Asian source of CCl4 was found to be much higher than government estimates. Measurements of HCN and CH3CN indicated a dominant biomass burning source and ocean sink for both gases. Large fractions of sulfate and nitrate were found to be present in dust aerosols. Photochemical activity in the Asian outflow was strongly reduced by aerosol attenuation of UV radiation, with major implications for the concentrations of HOx radicals. New particle formation, apparently from ternary nucleation involving NH3, was observed in Chinese urban plumes.
1
1. INTRODUCTION
The Transport and Chemical Evolution over the Pacific (TRACE-P) aircraft mission was
conducted in February-April 2001 by the NASA Global Tropospheric Experiment (GTE) to observe the chemical outflow from Asia to the Pacific and relate it quantiatively to its sources. It used two aircraft, a DC-8 and a P-3B, based in Hong Kong and at Yokota Air Force Base (AFB) near Tokyo. It was the latest in a 20-year series of GTE aircraft missions focused on the chemistry of the global troposphere [McNeal et al., 1998]. Industrialization of the Asian continent is expected to be a major driver of future global change in atmospheric composition [Intergovernmental Panel on Climate Change (IPCC), 2001]. Most of the outflow from the Asian continent is to the Pacific. GTE had previously conducted a series of Pacific Exploratory Missions (PEM) including PEM-West A and B (Aug-Sep 1991 and Feb-Mar 1994) over the NW Pacific [Hoell et al., 1996, 1997], and PEM-Tropics A and B (Sep-Oct 1996 and Mar-Apr 1999) over the tropical and South Pacific [Hoell et al., 1999; Raper et al., 2001]. The PEM-West missions offered a first characterization of Asian outflow to the Pacific. The task of TRACE- P was to go beyond PEM-West in providing a quantitative understanding of the outflow, its origin, and its evolution.
TRACE-P was organized around two objectives. The first was “to determine the chemical composition of the Asian outflow over the western Pacific in spring in order to understand and quantify the export of chemically and radiatively important gases and aerosols, and their precursors, from the Asian continent”. This objective defined a broad chemical scope for the mission encompassing long-lived greenhouse gases, aerosols and their precursors, and oxidants and their precursors. It responded to the need for an integrated multi-species approach towards addressing climate change and global air pollution issues [Hansen et al., 2000]. It also aimed to take advantage of the improved constraints on sources offered by concurrent measurements of a large number of chemical species with overlapping origins.
The second objective of TRACE-P was ”to determine the chemical evolution of the Asian outflow over the western Pacific in spring and to understand the ensemble of processes that control this evolution”. This objective recognized the importance of near-field chemical aging in determinining global Asian influence on ozone, aerosols, and other relatively short-lived species. It responded to the need to improve understanding of radical chemistry and aerosol dynamics in the complex Asian outflow characterized by high concentrations of aerosols [Dentener et al., 1996; Zhang and Carmichael, 1999], mixing of fossil fuel, biofuel, and biomass burning influences [Bey et al., 2001], and interweaving of polluted and stratospheric air [Carmichael et al., 1998].
Three-dimensional chemical transport models (CTMs) played a central role in guiding the design and execution of TRACE-P. This represented a major departure from previous GTE missions, whose objectives were more exploratory. It was recognized at the outset of TRACE-P that CTMs would play a critical role in addressing quantitatively the mission objectives. We wished to optimize the value of the data set for constraining and evaluating these models. Several CTMs were engaged during mission design to predict the dominant source regions and processes contributing to chemical outflow to the Pacific. These predictions guided the selection of operational sites and flight plans. The same CTMs were then engaged during the mission to provide daily chemical forecasts, which were used together with meteorological forecasts for
2
day-to-day flight planning. Customized “bottom-up” emission inventories for East Asia in 2000, based on best available knowledge of socioeconomic data and emission factors, were generated by Streets et al. [this issue] as input to the CTMs for the above exercises. These inventories were then used after the mission as a priori knowledge to be tested with the “top-down” constraints provided by the aircraft observations.
Another distinguishing element of TRACE-P was the extensive linkage with observations from other platforms. Joint flights were conducted with the ACE-Asia aircraft mission based out of Iwakuni (Japan) and focused on characterizing the chemical and radiative properties of Asian aerosols over the western Pacific [Clarke et al., this issue; Huebert et al., 2003]. Joint CTM forecasts were used to support the PHOBEA-II aircraft mission based out of Seattle (U.S. west coast) and focused on transpacific transport of pollution [Jaeglé et al., this issue; Price et al., this issue]. The TRACE-P aircraft data were integrated with satellite observations, in particular the MOPITT measurements of carbon monoxide (CO), for improved characterization of Asian outflow [Heald et al., this issue(b)]. Validation profiles for MOPITT were conducted as part of TRACE-P and results are below. 2. DESIGN
2.1 Seasonal timing The early spring timing of TRACE-P was motivated by several reasons. Early spring is
the season of strongest outflow from Asia to the western Pacific, due to frequent wave cyclones and associated cold fronts and warm conveyor belts (WCBs) that lift Asian air to the free troposphere where it is then picked up by the prevailing westerlies [Yienger et al., 2000; Bey et al., 2001; Stohl, 2001]. In winter, lifting to the free troposphere is suppressed by the Siberian High and the Asian outflow is directed south (winter monsoon). In summer, the outflow is dominated by deep convection (summer monsoon) and is often above the ceiling of conventional aircraft. In addition, part of that upper tropospheric outflow in summer is transported west towards the Middle East rather than east towards the Pacific [Liu et al., 2002]. Fronts in the fall are further south than in spring, with less entrainment of the outflow into the midlatitude westerly circulation [Liu et al., this issue].
A second factor for the choice of early spring was the timing of the biomass burning season in southeast Asia. The season typically lasts from February to April and peaks in March [Chan et al., 2002; Duncan et al., 2003]. Burning extends from northeast India to southern China, and is strongest in Burma and Thailand. Prior to TRACE-P, only fragmentary information on biomass burning outflow from Asia was available. Ozonesonde profiles over Hong Kong had shown a seasonal enhancement from biomass burning [Chan et al., 1998; Liu et al., 1999]. Strong biomass burning influence had been found in Asian combustion plumes over the northeast Pacific during PEM-Tropics B [Blake et al., 2001; Staudt et al., 2001]. Biomass burning had received little attention during PEM-West B (February-March 1994), although a CTM analysis by Bey et al. [2001] suggests that it made a large contribution to Asian outflow of CO and ozone during that mission. Better understanding of the biomass burning component of the Asian outflow was a high priority for TRACE-P.
Additional factors contributed to the selection of early spring. Photochemistry in Asian outflow is already active in that season, as previously demonstrated by PEM-West B [Crawford et al., 1998]. Stratospheric intrusions are at their seasonal maximum and are particularly
3
frequent along the Asian Pacific rim due to cyclogenesis and the unusually strong jet stream over Japan (“Japan jet”) [Austin and Midgley, 1994; Stohl, 2001]. Carmichael et al. [1998] had previously found that these intrusions lead to complicated interleaving of stratospheric and pollution influences in the Asian outflow. Finally, spring is the dust season in eastern Asia, and there was strong interest in better understanding the chemical modification of the Asian outflow due to reactions on dust particles [Dentener et al., 1996; Zhang and Carmichael, 1999]. 2.2 Aircraft payloads
The characteristics of the DC-8 and P-3B aircraft are listed in Table 1. The general
strategy in deploying the two aircraft was to maximize the geographical coverage of Asian outflow. The DC-8 had a higher ceiling (12 km) than the P-3B (7 km), a greater range, and a greater payload capacity. Because of overheating, it could not operate below 3 km altitude for more than about one hour before having to climb to above 8 km altitude to cool off. The P-3B was the platform of choice for sampling of the lower troposphere, although the DC-8 also provided frequent vertical profile information down to 0.15 km altitude.
The aircraft payloads are shown in Figure 1 and the instruments are listed in Table 2. There was much commonality between the two aircraft but also some differences. The DC-8 included remote sensing of ozone and aerosols (both zenith and nadir) with the Differential Absorption Lidar (DIAL) [Browell et al., this issue]. It included measurements of peroxides, carbonyls, and other oxygenated organics that were not aboard the P-3B. The P-3B included a more extensive payload for aerosol microphysics, and a fast 3-D air motion sensing system for vertical flux measurements [Thornhill et al., this issue].
New to the GTE program were measurements of oxygenated organics aboard the DC-8 by Gas Chromatography and Mass Spectroscopy (GC-MS) [Apel et al., this issue], mea-surements of HCHO aboard the DC-8 by Tunable Diode Laser Spectroscopy (TDLS) [Fried et al., this issue], measurements of peroxy radicals aboard the P-3B by Chemical Ionization Mass Spectroscopy (PerCIMS) [Cantrell et al., this issue], fast measurements of bulk aerosol composition aboard the P-3B by the Particle-Into-Liquid Sampler (PILS) [Ma et al., this issue], fast measurements of SO2 by Atmospheric Pressure Ionization Mass Spectrometry (APIMS) [Tu et al., this issue], and measurements of PAN by GC-MS aboard the P-3B (F. Flocke). New capabilities were also added to existing instruments, e.g., GC measurements of HCN and CH3CN [Singh et al., this issue] and CIMS measurements of HNO3 [Zondlo et al., this issue].
Intercomparison of measurements aboard the two aircraft was conducted on three flight legs over the course of the mission with the aircraft flying side by side. Results from these intercomparisons are presented by Eisele et al. [this issue].
2.3 Operational sites
The two main operational bases were Hong Kong (22N, 114E) for the first half of the
mission (until March 16) and Yokota Air Force Base in Fussa, a Tokyo suburb (36N, 140E) for the second half (Figure 2). These two sites were chosen to enable sampling of a wide range of pathways for Asian outflow. No overflights of the Asian continent were authorized except for Japan. Okinawa (26N, 128E) was also considered as an operational site but did not have the facilities necessary. It was used as an overnight site. Kona, Hawaii (19N, 156W) and Guam (13N, 145E) were transit sites for both the DC-8 and the P-3B, and Kona was also used for a
4
DC-8 sortie. Additional transit sites for the P-3B were Palmdale, California (35N, 118W), Wake Island (19N, 167E), and Midway Island (28N, 178W). A P-3B sortie was conducted out of Midway. The aircraft home bases were Dryden Flight Research Center (DFRC), California (35N, 118W) for the DC-8 and Wallops Flight Facility (WFF), Virginia (38N, 75W) for the P-3B.
2.4 Ancillary observations and forecasts
Supporting observations during TRACE-P included ozonesonde profiles from a number of sites (Figure 2): Trinidad Head, California (40N, 124W); Hilo, Hawaii (20N, 1552); Sapporo, Japan; (43N, 141E), Tateno, Japan (36N, 140E); Cheju Island, South Korea (34N, 127E); Kagoshima, Japan (32N, 131E); , Naha, Japan (26N, 128E); Taipei, Taiwan (25N, 121E); Hong Kong, China (22N, 1114E). Lin’an, China (30N, 120E), and Kunming, China (25N, 103E). Ozonesonde launches were generally made 1 to 3 times a week. Daily measurements were made at Lin’an and Kunming from March 3 to 13 [Chan et al., this issue]. Continuous column measurements of CO, C2H2, C2H6, and HCN by solar IR absorption were made by M. Koike (U. Tokyo) at three sites in Japan: Moshiri (44N, 142E), Rikubetsu (43N, 144E), and Tateno.
Table 3 lists the ensemble of forecast products used during the mission to guide day-to-day flight planning. Five different CTMs (two global, three regional), driven by different meteorological products, delivered chemical forecasts continuously during the mission to supplement the more standard meteorological forecasts. These same CTMs had been used previously in the mission design stage, through simulation of earlier meteorological years, to identify the dominant Asian outflow pathways to be sampled in TRACE-P. The CTM forecasts used anthropogenic Asian emission inventories compiled by Streets et al. [this issue] for spring 2000. Biomass burning emissions were climatological estimates and varied between the models. Most models focused on forecasts of CO as a tracer of Asian pollution outflow; real-time observations of CO were available aboard the aircraft to check the quality of the forecasts during flight. The LaRC forecast also included a stratospheric ozone tracer and the CFORS forecast included a large suite of chemical and aerosol tracers [Carmichael et al., this issue (a)].
Several satellite instruments provided near real-time data during the TRACE-P mission to guide flight planning. CO column data from MOPITT were produced by the MOPITT Science Team specifically for TRACE-P operations and were delivered as imagery within 48 hours of data collection. Other satellite products included TOMS (tropospheric ozone, absorbing aerosols), AVHRR (fire counts), and LIS (lightning). The TOMS and LIS products were combined with forecast forward trajectories to predict the spatial distributions of dust, biomass burning, and lightning influences on a day-to-day basis (Table 3).
2.5 Bottom-up Asian emission inventories
Streets et al. [this issue] used best available knowledge of socioeconomic data and emission factors to generate “bottom-up” gridded emission inventories of Asian emissions for 2000 in support of TRACE-P. Preliminary versions of these inventories were used during the mission as input to the CTM chemical forecasts. The inventories provide gridded emissions of long-lived greenhouse gases (CO2, CH4), ozone precursors (NOx, reactive organic gases, CO), and aerosols and their precursors (black carbon, organic carbon, SO2, NH3), all treated in a
5
consistent manner (i.e., on the basis of the same data). They include uncertainty estimates, for each species and source region, in order to assess consistency with the “top-down” constraints from the TRACE-P aircraft observations and in particular to provide the error characterization needed for inverse modeling of sources.
Anthropogenic emissions in East Asia include a large contribution from residential combustion sources, in particular from biofuels. Biofuel emissions of CO for China in the Streets et al. [this issue] inventory are 45±32 Tg yr-1, as compared to 64±27 Tg yr-1 for fossil fuel emissions. Streets et al. [this issue] estimated a factor of 2 seasonal variation in residential energy use in China with a peak in January and a minimum in June. March-April values are near the annual mean.
One issue in TRACE-P planning was to determine what changes to expect relative to the 1994 PEM-West B mission, conducted in the same region and roughly in the same season (February-March). Streets et al. [this issue] estimated that anthropogenic emissions in East Asia had changed from 1994 to 2000 by –17% for SO2, +12% for NOx, +11% for nonmethane volatile organic compounds (NMVOCs), +16% for NH3, +1.1% for CO2, +6.4% for CH4, and –26% for black carbon (BC), largely determined by trends in China. The large decrease in BC emissions was attributed to reduction in residential coal use. The relatively small changes for other species implied that no major emission-driven change in the chemical composition of the outflow would be expected between the PEM-West B and TRACE-P data sets. 3. EXECUTION 3.1 Meteorological conditions
Fuelberg et al. [this issue] give an overview of the meteorological environment during TRACE-P, and Liu et al. [this issue] describe the outflow pathways for Asian pollution. These two papers also put the mission in a seasonal and interannual context. The mission took place during a transition period from weak cold to neutral ENSO conditions. Deep convection over SE Asia was stronger than normal and cold fronts were more frequent than normal. There were no major anomalies in the mean flow and precipitation patterns over the North Pacific [Fuelberg et al., this issue; Price et al., this issue].
Cold fronts swept across East Asia every six days on average during TRACE-P [Liu et al., this issue]. These fronts extended southward from wave cyclones forming in the area around northern Japan and following the storm tracks towards the Aleutians [Fuelberg et al., this issue]. The movement of the fronts followed a northwesterly track across China and the Pacific rim. As the fronts progressed south to ~20N over the Pacific their orientation gradually changed from SW-NE to W-E, and they became indistinct as they merged into the tropical air. Asian outflow to the Pacific associated with the cold fronts took place (1) ahead of the front in southwesterly WCBs lifting boundary layer air to the free troposphere, and (2) behind the front in boundary layer advection capped at 1-2 km altitude by dry subsiding air. Two detailed case studies are presented by Hannan et al. [this issue].
Deep convection during TRACE-P was largely confined to southeast Asia, although it migrated northward towards China as the mission progressed [Fuelberg et al., this issue; Miyazaki et al., this issue]. The convective plumes in the upper troposphere were carried by westerlies over the NW Pacific and were sampled on several flights.
6
Cho et al. [this issue] examined the turbulent flow characteristics during TRACE-P using the fast vertical wind measurements aboard the P-3B. They found that the free troposphere was usually stable, and that most of the instability there was the result of wind shear. In the MBL, the air was less stable and convection was a more important source of turbulence. They found large vertical gradients of water vapor in the MBL even under unstable conditions, suggesting fast vertical transport by shallow convective cells. 3.2 Flight tracks and air masses sampled
Individual flights for each aircraft are listed in Table 4 and the corresponding flight tracks are shown in Figure 3 (the ensemble of flight tracks is shown in Figure 2). The DC-8 and P-3B conducted 17 and 21 research flights, respectively, in addition to three test flights (numbered 1-3) at the beginning of the mission. The flights lasted typically 8-10 hours for the DC-8 and 7-8 hours for the P-3B. Take-off was usually between 9 and 11 local time, so that observations were during sunlit hours. Two flights, one each for the DC-8 (flight 16) and the P-3B (flight 22), were “sunrise” flights with take-off well before dawn. Prominent features of each flight are identified in Table 4, and papers using particular flights as case studies are referenced there.
The transit flights across the Pacific (DC-8 flights 4-5 and 18-20, P-3B flights 4-7 and 20-23) had two objectives: (1) observe the transpacific transport of Asian pollution plumes, and (2) characterize the background air composition over the North Pacific against which to reference the perturbation from Asian outflow. The outbound transit flights, from California to Kona and from Kona to Wake Island and Guam, observed extensive Asian pollution layers with CO concentrations approaching 300 ppbv and ozone approaching 80 ppbv [Heald et al., this issue (b); Newell et al., this issue]. The return flights sampled a major WCB outflow event over the NW Pacific (DC-8 flight 18 and P-3B flight 20; Hannan et al. [this issue]), and then background air further east as a blocking ridge over the central Pacific deflected Asian outflow to the Arctic.
The sorties out of Hong Kong focused principally on frontal outflow [Browell et al., this issue] and the chemical aging of Asian air masses. Deep convective continental outflow was also sampled on several DC-8 flights (Table 4). Frontal outflow flights typically sampled (1) the clean marine air ahead of the front, (2) the WCB within the front, and (3) the boundary layer outflow behind the front. Chemical aging flights ( DC-8 flights 8 and 10, P-3B flight 10) revisited continental air masses in the lower troposphere after they had evolved for a few days over the Pacific behind decaying fronts.
The move of the aircraft to Japan on March 17 for the second half of the mission signaled a change in the outflow regimes sampled by the aircraft, as discussed by Fuelberg et al. [this issue]. Less priority was given to frontal outflow, which was still present but had been sampled extensively out of Hong Kong. Operations out of Japan were closer to the center of cyclonic activity [Fuelberg et al., this issue]. They afforded more opportunity to examine the WCBs associated with these cyclones [Hannan et al., this issue]. This was a major theme of two of the flights (DC-8 flight 13, P-3B flight 19). Convective outflow in the upper troposphere was also sampled more frequently than in the flights out of Hong Kong due to the building summer monsoon [Miyazaki et al., this issue]. Stratospheric intrusions were frequently sampled, and the DC-8 aircraft flew occasional long legs in the stratosphere (e.g., flight 13). Identifiable dust plumes were sampled on DC-8 flights 12 and 13, although the largest Asian dust plumes in the spring of 2001 actually occurred after the end of the TRACE-P mission and were sampled by the
7
ACE-Asia and PHOBEA-II missions [Huebert et al., 2003; Price et al., this issue]. The volcanic plume from the Miyake-jima volcano in southern Japan was sampled on DC-8 flight 17 and P-3B flight 17 [Carmichael, this issue (a)]. This volcano was a major source of SO2 to the NW Pacific during the TRACE-P mission, comparable to that from China [Tang et al., this issue].
The WCB outflow was typically sampled at 2-6 km altitude in the flights out of Hong Kong, and occasionally at higher altitudes in the flights out of Japan [Carmichael et al., this issue (a); Hannan et al., this issue; Liu et al., this issue; Singh et al., this issue]. The WCBs typically originated from SE Asia and southern China [Miyazaki et al., this issue] and had chemical signatures from both anthropogenic pollution and biomass burning. WCBs were also found in some instances to lift clean maritime tropical air to the free troposphere and dilute the continental outflow [Mari et al., this issue]. Boundary layer outflow behind the cold fronts generally contained high levels of anthropogenic pollution and was devoid of biomass burning influence [Carmichael et al., this issue (a); Liu et al., this issue]. Convective outflow plumes sampled in the upper troposphere during the Hong Kong flights were affected by biomass burning in SE Asia but were largely devoid of anthropogenic influence [Li et al., this issue; Russo et al., this issue].
Chinese urban plumes sampled in the boundary layer outflow behind cold fronts, typically 1-2 days downwind of their sources and strongly capped by subsidence inversions based at 1-2 km altitude, contained the highest pollutant concentrations observed during TRACE-P. Such plumes were observed over the Yellow Sea (DC-8 flight 9, P-3B flight 14), in the Formosa Strait (DC-8 flight 12), and downwind of Shanghai (DC-8 flights 13 and 16) and Seoul (P-3B flight 19). The highest pollution levels were observed in the ~18-hour old Shanghai plume sampled on DC-8 flight 13; CO and O3 concentrations exceeded 1.2 ppmv and 140 ppbv respectively. Discussions of the chemical composition of these plumes, and their relations to sources, can be found for example in Carmichael et al. [this issue (b)], Ma et al. [this issue], Russo et al. [this issue], Simpson et al. [this issue], and Singh et al. [this issue].
No evident European anthropogenic plumes or African biomass burning plumes were observed during TRACE-P, although these sources obviously contributed to the background. Fuelberg et al. [this issue] point out that back-trajectories calculated along the aircraft flight tracks almost never had a direct European origin. A CTM analysis by Liu et al. [this issue] shows weak European pollution plumes (∆CO ~ 50 ppbv) in the boundary layer outflow over the Pacific Rim north of 35N, but these would be masked by the larger outflow of Asian pollution taking place under the same meteorological conditions. The same analysis shows African biomass burning influence in the upper troposphere south of 25N but the corresponding structure (∆CO ~ 10 ppbv) would be too weak to be detected from the aircraft.
Three in-flight intercomparisons between the DC-8 and the P-3B were conducted during TRACE-P (Table 4; Eisele et al. [this issue]). Extensive collaboration with ACE-Asia had been planned prior to the mission, but mechanical problems delayed the deployment of the ACE-Asia aircraft and restricted collaborative flights to the last two TRACE-P sorties out of Japan. The P-3B aircraft conducted two joint flights (flights 18 and 19) with the ACE-Asia C-130 aircraft, allowing intercomparison of measurements aboard the two aircraft [Clarke et al., this issue; Thornhill et al., this issue]. The DC-8 aircraft (flight 17) provided overhead aerosol DIAL data for the ACE-Asia Twin Otter as the latter conducted a column radiative closure experiment offshore of southern Japan.
3.3 MOPITT validation
8
Observations of CO from MOPITT offered continuous mapping of Asian outflow during
TRACE-P [Heald et al., this issue (b)]. The MOPITT instrument [Drummond, 1992; Edwards et al., 1999] flies on the Terra satellite in a sun-synchronous orbit with local overpass times of 1045 and 2245. The instrument measures upwelling radiation around the CO absorption band at 4.6 µm. The instrument field of view is 22x22 km2, with cross-track scanning extending 320 km on each side of the orbit track, resulting in quasi-global coverage of the Earth every 3 days excluding cloudy scenes. MOPITT reports CO concentrations for seven vertical levels, but there is in fact little more than one independent piece of information in the MOPITT retrieval (Heald et al. [this issue (b)]; also see averaging kernels in Figure 4). MOPITT thus effectively provides a column measurement of CO weighted towards the middle and upper troposphere.
A goal of TRACE-P was to enable integrated analysis of the aircraft and MOPITT data towards characterization of the Asian outflow. Aircraft validation of the MOPITT data was an essential step towards that goal. Vertical profiles for MOPITT validation were conducted on seven DC-8 aircraft flights (Figure 4). The profiles exhibited a variety of structures. Some featured large Asian plumes in the free troposphere (flights 4, 5, 14), while others were more representative of background but still had substantial structure (flights 11, 13, 16, 19). The profiles were conducted as spirals at precisely the location and time of the satellite overpass. The spirals extended from 0.15 km altitude up to the aircraft ceiling, and used a spiral diameter of 20 km matching the MOPITT field of view. Because of the mid-morning timing of the satellite overpass, most validation profiles were conducted early in the flights, and fuel load limited the DC-8 ceiling to 9-11 km altitude. In addition to the vertical profiles, a 1600 km curtain was conducted on DC-8 flight 19 along the satellite orbit track to validate the horizontal gradients observed by MOPITT.
Decision on whether or not to conduct a MOPITT validation profile on a given DC-8 flight was made on the day before the flight by considering the location of the MOPITT orbit in relation to the flight objectives and the cloud forecasts. Favorable conditions were found on about half the flights, and decision to conduct a validation profile was made on half of those. Satellite cloud maps were consulted just before take-off to adjust the location of the validation spiral; the broad cross-track swath of MOPITT made it easier to find clear areas. Five of the validation profiles were made under clear-sky or scattered-cloud conditions, while two (flights 4 and 19) were made deliberately over solid stratus decks. The validation curtain on DC-8 flight 19 was conducted in a subsiding air mass northeast of Hawaii and began with a vertical spiral at (21N, 140W), coincident with the MOPITT overpass, followed by continuous in-progress descents and ascents along the MOPITT orbit track to (37N, 136W).
All validation profiles were done in temporal coincidence with the satellite overpass. Some temporal mismatch was unavoidable because MOPITT measures the profiles essentially instantaneously, while the DC-8 spirals take about 20 minutes to complete. To demonstrate that this 20-minute mismatch does not introduce significant representation error, we conducted two of the validation profiles (flights 4 and 11) as double spirals at the satellite overpass point. The first spiral was initiated 20 minutes before the satellite overpass time, was completed close to the overpass time, and was immediately followed by a reverse spiral over the same point. We found that the vertical profiles on the two successive spirals were highly reproducible, even in the presence of substantial structure, as shown in Figure 4. Vertical structures have sufficient persistence in the troposphere, at least outside strongly convective regions, that satisfactory temporal coincidence between satellite and aircraft can be effectively achieved.
9
Comparisons with the MOPITT retrievals for four of the seven validation profiles are shown in Figure 4. Retrievals for the other three profiles (flights 4, 14, 19) have not been attempted yet because the algorithm is not equipped to deal with cloud albedos. The MOPITT retrievals use the maximum likelihood technique, which incorporates a priori information on the CO profile [Pan et al., 1998]. A single a priori profile is used for all retrievals with concentrations decreasing monotonically from 120 ppbv at the surface to 80 ppbv at 10 km and 50 ppbv at 16 km [Deeter et al., 2003]. The retrieved CO vertical profiles (concentration vector
) are a weighted average of the true profile (x) and the a priori profile (xx̂ a):
(1) ˆ ( ) a= + − +x Ax I A x Gε where A is the averaging kernel matrix (Figure 4), I is the identity matrix, and Gε is the retrieval error [Rodgers, 2000]. We show in Figure 4 the original aircraft profiles and the profiles smoothed by the MOPITT averaging kernels, using equation (1) with Gε = 0 (most likely value) and applying the a priori concentrations above the aircraft ceiling. As would be expected, essentially all of the vertical structure is lost in the smoothing. We choose therefore to focus the comparison on the CO columns obtained by integrating the vertical profiles over the depth of the atmosphere [Rodgers and Connor, 2003]. Results are shown in Figure 5. We find that MOPITT reproduces the absolute values and variability of the aircraft CO columns measured on the four validation profiles with a mean positive bias of 6 ± 2% and R2 > 0.99. The accuracy of the aircraft data is 1%, as determined by NOAA/CMDL standards. Mean columns and standard deviations for the four profiles are 2.25 ± 0.19x10¹⁸ molecules cm-2 in the MOPITT data and 2.12 ± 0.23x10¹⁸ molecules cm-2 in the aircraft data with the averaging kernels applied. To demonstrate that this close agreement does not reflect bias introduced by application of the MOPITT averaging kernels to the aircraft data, we also show in Figure 5 the actual 950-300 hPa aircraft columns with no averaging kernels applied. The mean and standard deviation for these aircraft columns is 1.58 ± 0.19x10¹⁸ molecules cm-2 s-1, and the correlation with the MOPITT columns is R2 = 0.98. At least for these four validation profiles, we see that MOPITT preserves the variability in the original CO columns and does not induce significant bias or dampening of variability through the averaging kernels.
4. OVERVIEW OF FIRST RESULTS
We present here a brief overview and synthesis of the results presented in the first collection of TRACE-P papers assembled in this special section of Journal of Geophysical Research. The reader is referred to the specific papers for more information. 4.1 Instrument and model intercomparisons
Eisele et al. [this issue] present the ensemble of in-flight instrument intercomparisons conducted during the mission. Intercomparisons between the two aircraft showed agreement within 1-2% for ozone, CO, CO2, CH4, and photolysis frequencies; those measurements were made on board both aircraft by the same instrument and investigator team. Agreement within 10-20% was found for NO, PAN, and HNO3; Zondlo et al. [this issue] give a detailed discussion of the HNO3 intercomparison. Measurements of NOx, PAN, and HNO3 aboard the P-3B
10
accounted together for 86% of concurrently measured NOy, indicating good closure for the NOy chemical family [Miyazaki et al., this issue]. Poorer agreement, but within stated instrument accuracies (~50%), was found for OH and HO2. Yet poorer agreement, with discrepancies outside stated instrument accuracies and unsatisfactory correlations, were found for NO2, SO2, PPN, and oxygenated organics. As Eisele et al. [this issue] point out, the discrepancies between the OH, HO2, HCHO, and NO2 measurements aboard the two aircraft represent a significant gap in our ability to test models of HOx and NOx chemistry. Fried et al. [this issue] find that better agreement is found in the HCHO intercomparison when ensemble means rather than individual measurements are used.
Thornhill et al. [this issue] intercompared the fast 3-D air motion systems aboard the P-3B and the ACE-Asia NCAR C-130 aircraft during a wingtip-to-wingtip formation flight from 0.3 to 3 km altitude (P-3B flight 19). This was the first ever such intercomparison between air motion systems. Results show good agreement in the variances and spectra of 3-D winds and temperature, and in the associated covariances, lending confidence in the ability of these systems to measure micrometeorological and chemical vertical fluxes.
Kiley et al. [this issue] intercompared results from seven different CTMs (four global, three regional) applied to the simulation of TRACE-P CO observations. All models used the same anthropogenic and biomass burning sources of CO. Large differences were found between the simulations, particularly in the free troposphere. Simulation of boundary layer outflow was more consistent between models, but there was general difficulty in reproducing the locations and strengths of pollution plumes. Model skill, as quantified by the correlation coefficient r between simulated and observed CO concentrations, was similar for all models (r = 0.5-0.7).
4.2 Asian outflow pathways
TRACE-P demonstrated that wave cyclones and the associated cold fronts and WCBs are the principal mechanism for export of Asian pollution to the Pacific in spring. Convective outflow was less important and mainly restricted to SE Asia [Miyazaki et al., this issue]. Hannan et al. [this issue] present a detailed analysis of the mechanisms by which the wave cyclones ventilated Asian pollution to the troposphere during TRACE-P. The general mechanism involves (1) lifting of air ahead of the cold front in a southeasterly WCB, and (2) boundary layer outflow behind the front capped at about 2 km by a strong subsidence inversion [Carmichael et al., this issue (a); Liu et al., this issue]. The WCB lifting during TRACE-P took place mostly over SE Asia and China, spanning a wide range of latitudes from 15 to 42N, and leading to ventilation of both biomass burning and anthropogenic effluents [Miyazaki et al., this issue]. Mountainous terrain in SE Asia and southern China played an important role in facilitating the lifting [Carmichael et al., this issue (a); Liu et al., this issue]. The WCB outflow was associated with considerable cloudiness, and Crawford et al. [this issue] showed that CO concentrations in cloudy air masses during TRACE-P were on average 30% higher than in clear sky. Occasional WCBs were found to originate offshore over the NW Pacific, and Mari et al. [this issue] showed that these injections of marine air led to dilution and fragmentation of the continental outflow in the free troposphere. However, Hannan et al. [this issue] found that the air lifted in these marine WCBs could also be heavily polluted by post-frontal boundary layer outflow from the previous cyclone. Downwelling of stratospheric air on the back side of the cyclones was observed [Browell et al., this issue; Miyazaki et al., this issue]. Such interleaving of air masses of different
11
origins in the free troposphere resulted in great complexity in interpreting the observed relationships between species [Talbot et al., this issue].
Pervasive mixing of urban, biofuel, and agricultural or forest biomass burning influences was found in the continental WCBs sampled in TRACE-P. This mixing was manifest from observations of the biofuel and biomass burning tracers HCN, CH3CN, CH3Cl, C2O4
2-, and K+, in combination with the urban tracers C2Cl4 and sulfate [Dibb et al., this issue; Ma et al., this issue; Miyazaki et al., this issue; Singh et al., this issue]. It was reproduced in CTM simulations of the TRACE-P data [Carmichael et al., this issue (a); Liu et al., this issue]. Ma et al. [this issue] used observed K+/sulfate ratios to infer that 30% of total aerosol mass in Asian pollution plumes was of biofuel or biomass burning origin.Biofuel and biomass burning influences were difficult to separate on the basis of chemical tracers, although there was some indication that CH3CN is more specific for biomass burning [Li et al., this issue]. The best separation was on a geographical basis, as boundary layer outflow below 2 km was essentially devoid of biomass burning influence [Liu et al., this issue] but yet contained biofuel influence mixed with other anthropogenic effluents.
Koike et al. [this issue] estimated export efficiencies of NOy and SOx from Asia to the western Pacific by using observed correlations with CO and comparing to NOx/CO and SO2/CO emission ratios from Streets et al. [this issue]. They found export efficiencies to the marine boundary layer and to the free troposphere respectively of 20-40% and 15% for NOy, and 25-45% and 10-20% for SOx. Most of the NOy enhancement in the outflow was as PAN (only 0.5% as NOx) and most of the SOx was as sulfate. A focused analysis of WCB outflow by Miyazaki et al. [this issue] found similar NOx and NOy export efficiencies. The measurements of NOy and SOx did not include coarse nitrate and sulfate particles, possibly causing a low bias in the estimated export efficiencies particularly for SOx.
Heald et al. [this issue (b)] combined analyses of TRACE-P and MOPITT data with back-trajectories and a global CTM simulation to investigate the transpacific transport of Asian pollution. They found that the Asian pollution layers sampled on the outbound transit DC-8 flights 4 and 5, over a 22o range of latitude (18N to 40N), were the remnants of a single Asian plume lifted in a WCB over East Asia four days earlier and split by a blocking High over the central Pacific. The northern plume continued its transport to North America and was sampled on flight 4, while the southern plume subsided over the tropical Pacific and was sampled on flight 5. Chemical tracer data in both plumes indicated a mixture of fossil fuel, biofuel, and biomass burning influences [Blake et al., this issue]. Most of NOy in the northern plume was present as PAN, consistent with the Asian outflow observations of Koike et al. [this issue] and no significant ozone enhancement was observed in that plume. In the southern plume, by contrast, PAN decomposition in the subsiding tropical environment led to a large ozone enhancement. Heald et al. [this issue (b)] found that MOPITT observations successfully tracked this transpacific pollution transport event. They went on to identify three other major events of transpacific transport of Asian pollution observed by MOPITT during the TRACE-P period. The other events were sampled over the west coast of the United States during the PHOBEA-II aircraft mission or at the Cheeka Peak ground station [Jaffe et al., 2002; Jaeglé et al., this issue].
4.3 Quantification of Asian sources
Several papers discuss the top-down constraints provided by the TRACE-P observations
on anthropogenic sources in East Asia. The a priori bottom-up inventory of Streets et al. [this
12
issue] is an important starting point for that purpose. Emission estimates from that inventory were evaluated with the TRACE-P data for a number of species by Carmichael et al. [this issue (ab)] using a regional CTM simulation and by Russo et al. [this issue] using species-species correlations. An inverse model analysis by Palmer et al. [this issue (a)] combined the bottom-up inventory and the top-down constraints from the TRACE-P data, with their errors, to derive an optimized emission inventory for CO.
Overall, the TRACE-P data indicate remarkable consistency with the Streets et al. [this issue] inventory for hydrocarbons, NOx, and SO2. However, Carmichael et al. [this issue (a)] find that CO, black carbon (BC), and other combustion gases (ethane, acetylene) are underestimated in boundary layer outflow originating from central regions of China. They attribute this underestimate to emissions from the domestic combustion sector in rural China, in particular residential coal use, and find that an increase in Chinese domestic combustion emissions by a factor of 3-5 from the bottom-up estimates would be needed to reconcile model results with observations. Palmer et al. [this issue (a)] find from their inverse model that total anthropogenic CO emissions from China in the Streets et al. [this issue] inventory are too low by 30%. A global CTM simulation of CO conducted with Chinese anthropogenic emissions 66% higher than Streets et al. [this issue] shows no significant bias when compared with TRACE-P, MOPITT , or PHOBEA-II data [Heald et al., this issue (b); Jaeglé et al., this issue; Li et al., this issue]. Previous inverse model analyses using sparse surface observations from the NOAA-CMDL network had suggested even higher anthropogenic CO emissions from East Asia [Kasibhatla et al., 2002; Pétron et al., 2003]. As discussed by Palmer et al. [this issue (a)], it appears from the TRACE-P observations that these previous estimates (in particular the very high value of Pétron et al. [2003]) are too high.
Relating the biomass burning influence observed in TRACE-P to bottom-up emission estimates requires time-specific information on fires. Heald et al. [this issue (a)] constructed a daily global biomass burning inventory for the TRACE-P period by using AVHRR satellite fire data to scale the Duncan et al. [2003] climatological biomass burning inventory. Biomass burning emissions during TRACE-P were highest in Thailand, Cambodia, and northeast India. There was little burning in China and all of it was confined to the southern end of the country. Burning in SE Asia in February-April 2001 was close to the climatological average defined by the TOMS Aerosol Index. CTM smulations of the TRACE-P and MOPITT data using the Duncan et al. [2003] climatological inventory with diurnal scaling from Heald et al. [this issue (a)] indicate that SE Asian biomass burning emissions of CO in that inventory are overestimated, perhaps by 50% or more [Heald et al., this issue (b); Palmer et al., this issue (a)].
Palmer et al. [this issue (b)] used the halocarbon-CO correlations measured in TRACE-P, combined with back-trajectories, to infer the sources of different halocarbons from East Asian countries. They derived an East Asian source of CCl4 of 18.5 Gg yr-1, considerably larger than government estimates [UNEP, 2002]. Sources of CH3CCl3 were mainly from central China and the Seoul area and were consistent with government estimates. Halon-1211 had a strong source from the Shangai area and no apparent sources from elsewhere. Blake et al. [this issue] identified large point sources of CH3Br from Seoul and Tokyo.
TRACE-P provided extensive data on the Asian outflow of CO2 and CH4. Vay et al. [this issue] found that the Asian continent was a net source of CO2 during TRACE-P, as would be expected for that season. By combining the observed CO2 enhancements and vector winds, they derived a net CO2 source from the Asian continent of 14 Tg d-1 for the period. The Streets et al. [this issue] inventory estimates a corresponding Asian source of CO2 of 6 Tg d-1 from
13
anthropogenic activities and biomass burning, and Vay et al. [this issue] attributed the remaining 8 Tg d-1 to respiration. Bartlett et al. [this issue] examined the constraints offered by the TRACE-P data on the Asian sources of CH4. Livestock and rice paddies provide the principal source in current inventories [Streets et al., 2001], but TRACE-P was conducted in the rice planting season when that source is minimum. Bartlett et al. [this issue] found that CH4 in TRACE-P had a strong and consistent relationship with C2H6, and to a lesser extent with CO, suggesting a dominant urban source (possibly from fossil fuel use or landfills) which might however be correlated with livestock.
Singh et al. [this issue] and Li et al. [this issue] used the TRACE-P HCN and CH3CN measurements aboard the DC-8 to constrain sources and sinks for these two gases. These were the first in situ HCN measurements in the troposphere, and were shown by Singh et al. [this issue] to be consistent with previous spectroscopic measurements of HCN columns at Japanese sites. The TRACE-P data demonstrated a dominant biomass burning source and ocean sink (lifetime of 5-6 months) for both gases. Urban air masses sampled in southern California during test and transit flights showed no enhancements, confirming previous laboratory findings that the sources from fossil fuel combustion are negligible. However, Chinese urban plumes showed large HCN enhancements without concurrent CH3CN enhancements, an observation that Singh et al. [this issue] attributed tentatively to residential combustion. A global CTM budget analysis by Li et al. [this issue] shows that a combination of biomass burning and residential combustion sources, together with an ocean sink, allow a good simulation of the HCN and CH3CN observations in TRACE-P, of their correlations with CO, and also of previous HCN column and CH3CN aircraft measurements.
4.4 Aerosol outflow
Aerosol outflow from Asia during TRACE-P was mostly below 2 km altitude, although
there were also major Asian aerosol influences in the middle troposphere [Browell et al., this issue; Jordan et al., this issue (b). The largest aerosol enhancements were associated with post-frontal boundary layer outflow from China. Soot accounted on average for 2% of total aerosol mass in Chinese outflow and 12% in outflow from SE Asia [Jordan et al., this issue (b)].
Even though no major Asian dust events occurred during TRACE-P, Dibb et al. [this issue] found that Ca2+ (a dust tracer) was a major contributor to the total cation loading in Asian outflow, and Jordan et al. [this issue (b)] found that dust accounted for 77% of total aerosol mass in the low-altitude Chinese outflow. Clarke et al. [this issue] and Jordan et al. [this issue (a)] showed that the dust was generally mixed with pollution and that a large fraction of sulfate and nitrate was taken up by dust particles, presumably through displacement of carbonate. Sulfate was typically in excess of ammonium but the high dust concentrations kept the total aerosol in a near-neutral state [Dibb et al., this issue]. Dust led to NO3
-/HNO3(g) ratios in excess of unity in Chinese outflow, in contrast to much lower ratios in background air [Jordan et al., this issue (a)]. Clarke et al. [this issue] point out that dust reduces the radiative effects of anthropogenic Asian aerosols by promoting their collection and the condensation of aerosol precursors on the large dust particles.
Weber et al. [this issue] found that new particle formation took place in Chinese and Korean urban plumes sampled during TRACE-P, but not in biomass burning and volcanic plumes. They show evidence that ternary NH3-H2SO4-H2O nucleation was responsible for the new particle formation in urban plumes. The submicron aerosol in these plumes was principally
14
a neutralized H2SO4-HNO3-NH3-H2O mixture, implying the presence of gas-phase NH3 to drive the ternary nucleation process. 4.5 Chemical evolution of Asian outflow
Better understanding of radical photochemistry in the Asian outflow was a major objective of TRACE-P. Cantrell et al. [this issue] compared their peroxy radical measurements aboard the P-3B to standard photochemical model calculations constrained with the ensemble of aircraft observations including photolysis frequencies. They found good agreement over the range of conditions encountered in the mission. There were no apparent discrepancies associated with concentrated plumes or high aerosol levels. The good agreement extended to relationships of the peroxy radicals with their precursors, in particular NOx. Fried et al. [this issue] found general agreement between their HCHO measurements and photochemical model calculations, although there were some major disagreements for portions of the data set and also some apparent difficulties in the simulation of CH3OOH concentrations under low-NOx conditions. Fried et al. [this issue] also found evidence of significant uptake of HCHO by clouds.
The above results offer some encouragement that standard photochemical models may be used for describing HOx and NOx chemistry in Asian outflow. However, a persistent concern for model evaluation is the disagreement between HOx and HCHO measurements by different instruments (section 4.1). In addition, Lefer et al. [this issue] and Tang et al. [this issue (a)] show that proper accounting of the optical effects of clouds and aerosols is essential. Aerosol extinction coefficients at 550 nm during TRACE-P were typically ~10-4 m-1 in the boundary layer, dropping to ~10-6 m-1 in the upper troposphere, and the corresponding total aerosol optical depths in the Asian outflow were typically in the range 0.2-0.6. Mean single-scattering albedos were 0.76 in dust events, 0.80 in outflow from SE Asia, and 0.84-0.93 in air masses of other origins [Clarke et al., this issue; Jordan et al., this issue (b)]. The aerosol was sufficiently absorbing that it decreased photolysis frequencies on average by 35-40% near the surface and by about 20% in the free troposphere relative to aerosol-free conditions [Lefer et al., this issue]. The radiative effects of aerosols caused significant decreases in HOx concentrations (OH down by 40% in the boundary layer) relative to model calculations assuming aerosol-free conditions [Tang et al., this issue (a)].
The TRACE-P observations indicate fast chemical aging of NOx and reactive organic gases in the Asian outflow. Talbot et al. [this issue] found that NOx concentrations in Chinese urban plumes sampled 1-2 days downwind of their sources were generally less than 100 pptv, and NOx/NOy concentration ratios were typically less than 10%. Rapid depletion of NOx was also observed in the WCB outflows, with NOx amounting to only 3% of NOy on average [Koike et al., this issue; Miyazaki et al., this issue]. Even in the fresh Shanghai plume (~18 hours old) sampled on DC-8 flight 13, NOx accounted for only 15% of total NOy [Talbot et al., this issue]. Simpson et al. [this issue] found that ethylnitrate/ethane and 2-propylnitrate/propane concentration ratios were much higher than would be expected from ethane and propane chemistry, with no such discrepancy found for other alkylnitrates. Oxygenated organic emissions missing from current inventories might be responsible the missing sources of ethylnitrate and 2-propylnitrate; such emissions could possibly have important implications for explaining the high concentrations of acetaldehyde and acetone previously reported in the remote troposphere by Singh et al. [2001].
15
Rapid ozone production was observed in the SE Asian biomass burning plumes sampled during TRACE-P [Tang et al., this issue (b)]. This biomass burning enhancement was also apparent in the Chinese ozonesonde data from Hong Kong and Kunming [Chan et al., this issue] and in the ensemble of TRACE-P DIAL ozone data south of 28N [Browell et al., this issue]. High ozone (up to 140 ppbv) was observed in the Shangai urban plume [Russo et al., this issue]. However, boundary layer outflow from China, Korea, and Japan was found in general not to be associated with elevated ozone, presumably because of weak UV fluxes at that time of year. Dibb et al. [this issue] saw little correlation between ozone and either 7Be or 210Pb, suggesting that neither the stratosphere nor regional photochemistry over Asia were major sources of ozone in the Asian outflow. It appears that the overall ozone budget during TRACE-P mostly reflected the hemispheric-scale build-up of tropospheric ozone during spring, rather than processes taking place on the regional scale. A CTM simulation by Pierce et al. [this issue] reproduces the observed seasonal build-up in the TRACE-P region and attributes it to increasing photochemical production, but finds little net outflow of ozone from the region.
Considerable structure was found for ozone in the free troposphere during TRACE-P [Wild et al., this issue]. An analysis of the high-ozone layers by Newell et al. [this issue] indicates two principal sources: Asian outflow lifted in low-latitude WCBs and stratospheric influence on the back side of cyclones. Ozonesonde observations at Lin’an show strong stratospheric influence in the upper troposphere, in contrast to Kunming or Hong Kong which show no such influence [Chan et al., this issue]. A CTM simulation by Wild et al. [this issue] reproduces many features of the observed stratospheric influence on ozone in the upper troposphere.
4.6 Comparison to PEM-West B
Comparisons of the TRACE-P observations with those from PEM-West B, conducted in the same region in Feb-Mar 1994, are presented in several papers. The bottom-up inventory of Streets et al. [this issue] indicates little difference between 1994 and 2001 anthropogenic emissions in East Asia (section 2.5), reflecting the leveling off of emissions in the late 1990s due to the Chinese economic downturn, industrial restructuring, and environmental controls [Streets et al., 2001]. Springtime biomass burning emissions in SE Asia were of comparable magnitude in 1994 and 2001 according to the TOMS Aerosol Index [Heald et al., this issue (a)]. PEM-West B was conducted under warm-phase ENSO (El Nino) conditions, whereas TRACE-P was conducted under cold-phase to neutral ENSO conditions. Liu et al. [this issue] report a much greater frequency of cold frontal passages during TRACE-P than during PEM-West B, reflecting the difference in ENSO phase. Weather in Hong Kong was sunnier and drier in TRACE-P than in PEM-West B [Wang et al., this issue]. Another factor of difference for photochemically active species is the seasonal phase lag, as TRACE-P was shifted ~3 weeks later in spring than PEM-West B. Finally, differences in flight strategies between the two missions could be a complicating factor. PEM-West B had other objectives besides the characterization of Asian outflow, and this affected in particular the tropical flights; however, the priority for the extratropical flights was the sampling of Asian outflow (D.D. Davis, personal communication, 2002).
Blake et al. [this issue] and Davis et al. [this issue] found no significant difference in CO concentrations between PEM-West B and TRACE-P, suggesting that the two missions indeed provided similar general characterizations of the Asian outflow. They found lower
16
concentrations of C2-C6 hydrocarbons in TRACE-P; relative differences correlated with species lifetimes and could thus be explained by the seasonal phase lag between the two missions. Ozone concentrations were on average 15 ppbv higher in TRACE-P, a large trend that Davis et al. [this issue] investigated in detail through comparative analysis with ozonesonde records and DIAL observations, and concluded could be explained by the seasonal phase lag. Wang et al. [this issue] also found a 14 ppbv increase in ozone at Hong Kong between the PEM-West B and TRACE-P sampling periods. Browell et al. [this issue] found a large increase in potential vorticity over the NW Pacific between PEM-West B and TRACE-P, and concluded that both increased stratosphere-troposphere exchange and photochemical production contributed to the higher ozone in TRACE-P.
Blake et al. [this issue] and Russo et al. [this issue] reported a decline in the concentrations of most halocarbons between PEM-West B and TRACE-P, qualitatively consistent with the expected decline in anthropogenic emissions. Halon-1211, a gas used in fire-fighting equipment and for whom China is thought to account for 90% of global production, increased by 50% from PEM-West B to TRACE-P and was a useful marker for air masses of Chinese origin [Blake et al., this issue]. No significant trend was found for CH3Cl, which has a dominant source from biofuels and biomass burning [Blake et al., this issue]. Methane concentrations in TRACE-P were higher than in PEM-West B, reflecting the trend in the background, but a detailed analysis by Bartlett et al. [this issue] indicates that the Asian enhancement over background was similar in both missions, implying no detectable change in Asian emissions.
The largest differences between PEM-West B and TRACE-P were found for aerosols and soluble gases in the boundary layer. Comparisons of DIAL vertical cross-sections indicated much stronger boundary layer aerosol outflow in TRACE-P than in PEM-West B [Browell et al., this issue]. In situ measurements indicated much higher dust influence in TRACE-P [Dibb et al., this issue]. Dibb et al. [this issue], O’Sullivan et al. [this issue], and Talbot et al. [this issue] found that concentrations of NOy species, SO2, and water-soluble aerosol in the Asian boundary layer outflow were 2-5 times higher in TRACE-P than in PEM-West B. These results are consistent with a greater frequency of frontal passages in TRACE-P [Liu et al., this issue], delivering polluted Asian air to the marine boundary layer in the post-frontal outflow with minimal scavenging. Concentrations of H2O2 were 2.5 times lower in TRACE-P than in PEM-West B, possibly because of stronger outflow of SO2 in TRACE-P providing a sink for H2O2 through reaction in clouds [O’Sullivan et al., this issue].
5. CONCLUSIONS
The NASA TRACE-P two-aircraft mission in February-April 2001 was designed to observe the Asian outflow of environmentally important gases and aerosols to the Pacific, to relate this outflow quantitatively to its sources, and to understand its near-field chemical evolution over the Pacific. Quantifying the contributions from large geopolitical source regions to global atmospheric composition is presently a major issue for atmospheric chemistry research. A priori information from bottom-up emission inventories must be tested and improved using top-down constraints from atmospheric observations. In the case of short-lived species (ozone, aerosols, and their precursors), the role of continental boundary layer processing in determining the outflow must be understood. It is increasingly recognized that an integrated observational
17
strategy is needed involving satellites, aircraft, ground stations, and chemical transport models (CTMs). TRACE-P aimed to contribute to the development of such a strategy.
The aircraft payload in TRACE-P included extensive instrumentation for measurements of greenhouse gases, ozone and its precursors, aerosols and their precursors, related species, and chemical tracers. Planning prior to the mission identified the major Asian outflow pathways and chemical signatures to be expected and investigated. This planning involved the construction of a customized a priori emission inventory for East Asia in 2000 based on socioeconomic data and emission factors, and the use of five different CTMs to provide hindcasts of Asian chemical outflow for previous meteorological years. During the mission, the same CTMs provided chemical forecasts to guide the aircraft towards regions of outflow and thus provide the best data for testing both the a priori emission inventories and the models of chemical evolution. After the mission, results from the CTMs were intercompared to quantify the range of model error. A biomass burning inventory with daily resolution was constructed from satellite fire counts to provide further constraints on emissions.
The mission thus provided a detailed characterization of the pathways for Asian outflow to the Pacific. It showed that wave cyclones and the associated cold fronts are the principal mechanism for export of Asian pollution to the Pacific in spring. This mechanism involves both warm conveyor belts (WCBs) rising in the free troposphere ahead of the fronts and post-frontal boundary layer outflow capped at ~2 km by strong subsidence inversions. Frontal passages were unusually frequent in spring 2001. Fuel and industrial pollution from East Asia, biomass burning effluents from Southeast Asia, and tropical maritime air were mixed in the WCB outflow and resulted in complicated chemical signatures. In contrast, the post-frontal boundary layer outflow was dominated by fuel and industrial pollution and contained the highest concentrations observed in the mission (up to 1.4 ppmv CO and 140 ppbv O3 in the Shanghai plume). Deep convection during TRACE-P was largely confined to Southeast Asia and the associated upper tropospheric plumes had dominant biomass burning influences. Long-range transport of European and African (biomass burning) effluents did not produce detectable enhancements in the Asian outflow. Export efficiencies of NOy and SOx from the Asian continent to the free troposphere were estimated to be 10-20%.
The observations from TRACE-P generally confirmed the high quality of the a priori inventories of Asian anthropogenic emissions generated by Streets et al. [this issue]. These inventories cover a wide range of species including CO2, CO, CH4, higher hydrocarbons, reactive nitrogen species, sulfur oxides, and carbonaceous aerosols. The largest discrepancies appeared to reflect domestic emissions in rural China (notably residential coal combustion) , with the TRACE-P observations implying much higher values than the a priori estimates. Previous top-down estimates of CO emissions from East Asia, obtained by inverse modeling of surface observations from the NOAA/CMDL network, appear to be too high in light of the TRACE-P observations. Current biomass burning emission inventories for SE Asia also appear to be too high. The TRACE-P observations in Chinese urban plumes indicate high concentrations of a number of compounds (including CH3Cl, COS, HCN) that are not normally found in urban plumes of the developed world. They could possibly originate from domestic combustion sources but more information is needed. Halocarbon-CO correlations measured in TRACE-P indicate that the CCl4 source from East Asia is much higher than government estimates. Large sources of halon-1211 (China) and CH3Br (Japan, Korea) were also identified. Observations of HCN and CH3CN demonstrated a dominant biomass burning source and ocean sink for both.
18
Intercomparison of measurements of HOx radicals and HCHO aboard the TRACE-P aircraft indicated some major discrepancies that limit the extent to which photochemical model calculations can be evaluated. Within these uncertainties, it was found that current photochemical models can reproduce the HOx chemistry observed in Asian outflow, although proper consideration of aerosol attenuation of UV radiation is critical. Aerosol optical depths in Asian outflow during TRACE-P were typically in the range 0.2-0.6, and single-scattering albedos were relatively low, resulting in major attenuation of photolysis frequencies by aerosols. Both dust and soot contributed to aerosol absorption.
Photochemical ozone enhancements in TRACE-P were observed in biomass burning plumes and occasionally in urban plumes but were otherwise weak, reflecting the early spring timing of the mission. Significant build-up of ozone over the course of the TRACE-P mission appeared to reflect the general behavior of tropospheric ozone at extratropical northern latitudes, rather than regional production. TRACE-P observations on the outbound transit flights indicated no significant ozone production in Asian pollution plumes transported across the Pacific at northern midlatitudes. However, large ozone production driven by PAN decomposition was observed in subsiding plumes transported to the tropics. Considerable layering of ozone was observed in the upper troposphere in association with stratospheric intrusions.
Although no major dust events were sampled during TRACE-P, dust was a pervasive component of the aerosol in Asian outflow.A large fraction of total sulfate and nitrate in the outflow was associated with dust particles. New particle formation during TRACE-P was found to take place in urban plumes but not in biomass burning or volcanic plumes. The submicron aerosol in urban plumes was found to consist principally of ammonium sulfate and ammonium nitrate, and the formation of new particles was ascribed to ternary NH3-H2SO4-H2O nucleation.
Comparison of observations from TRACE-P and PEM-West B (Feb-Mar 1994) indicated similar CO concentrations, and trends in ozone and hydrocarbons consistent with the seasonal phase lag between the two missions. The Streets et al. [this issue] inventory reports only small trends (< 20%) in Asian anthropogenic emissions between 1994 and 2001; the TRACE-P data are consistent with this view. Concentrations of most halocarbons decreased from PEM-West B to TRACE-P, consistent with the reductions mandated by the Montreal Protocol. However, concentrations of aerosols and water-soluble gases (SO2, NOy) sampled in the lower troposphere were several-fold higher in TRACE-P than in PEM-West B. This could possibly reflect the greater frontal activity in TRACE-P, with post-frontal boundary layer transport delivering water-soluble species over the western Pacific with minimum scavenging.
Satellite observations are becoming increasingly important as a source of information for tropospheric chemistry, and TRACE-P provided a testbed to explore the integration of aircraft and satellite observations towards addressing mission objectives. Of particular interest were the MOPITT measurements of CO aboard theTerra polar-orbiting satellite. Validation profiles for MOPITT were conducted on several TRACE-P flights, taking advantage of the high ceiling of the DC-8 aircraft. Comparison of CO columns measured on four of these profiles indicates high correlation between TRACE-P and MOPITT (R2 >0.99, n =4) and only a small high bias (6±2%) in the MOPITT data. The MOPITT data support the TRACE-P findings that a priori estimates of anthropogenic emissions from CO were too low while biomass burning emissions were too high. Extensive transpacific transport of Asian pollution encountered on the TRACE-P outbound transit flights was also observed by MOPITT.
The TRACE-P observations provide a remarkably rich data set for investigating chemical outflow from the Asian continent. The results presented in this special TRACE-P section of the
19
Journal of Geophysical Research represent only a first pass at mining the data. We look forward to further analyses of the data by the atmospheric chemistry research community over the coming years. The data are available at http://www-gte.larc.nasa.gov.
Acknowledgments. The TRACE-P mission was funded by the NASA Global Tropospheric Chemistry Program. We are grateful for the support from the MOPITT Science Team including in particular Dan Ziskin and Jarmei Chen. 6. REFERENCES
Apel, E.C., A.J. Hills, R. Lueb, S. Zindel, S. Eisele, and D.D. Riemer, A fast GC/MS system to measure C2
to C5 carbonyls, methanol and ethanol aboard aircraft, J. Geophys. Res., this issue. Austin, J.F., and R.P. Midgley, The climatology of the jet stream and stratospheric intrusions of ozone
over Japan, Atmos. Environ, 28, 39-52, 1994., Bartlett, K.B., G.W. Sachse, T. Slate, C. Harward, and D.R. Blake, Large-scale distribution of CH4 in the
western Pacific: sources and transport from the Asian continent, J. Geophys. Res., this issue. Bey I., D. J. Jacob, J. A. Logan, and R. M. Yantosca, Asian chemical outflow to the Pacific: origins,
pathways and budgets, J. Geophys. Res., 106, 23,097-23,114, 2001. Blake, N. J., et al, Large-scale latitudinal and vertical distributions of NMHCs and selected halocarbons in
the troposphere over the Pacific Ocean during the March-April 1998 Pacific Exploratory Mission (PEM-Tropics B), J. Geophys. Res, 106, 32,627-32,644, 2001.
Blake, N.J., and 15 others, NMHCs and halocarbons in Asian continental outflow during TRACE-P: comparison to PEM-West B, J. Geophys. Res., this issue.
Browell, E.V., and 23 others, Large-scale ozone and aerosol distributions, air mass characteristics, and ozone fluxes over the western Pacific Ocean in late-winter/early-spring, J. Geophys. Res., this issue.
Cantrell, C.A., and 31 others, Peroxy radical behavior during TRACE-P as measured aboard the NASA P-3B aircraft, J. Geophys. Res., this issue.
Carmichael, G.R., I. Uno, M.J. Phadnis, Y. Zhang, and Y. Sunwoo, Tropospheric ozone production and transport in the springtime in east Asia, J. Geophys. Res., 103, 10,649-10,671, 1998.
Carmichael, G.R., et al., Regional-scale chemical transport modeling in support of intensive field experiments: overview and analysis of the TRACE-P observations, J. Geophys. Res., this issue (a)
Carmichael, G.R.., et al., Evaluating regional emission estimates using the TRACE-P observations, J. Geophys. Res., this issue (b).
Chan, C.Y., L.Y. Chan, J.M. Harris, S.J. Oltmans, and D.R. Blake, Characteristics of biomass burning emission sources, transport and chemical speciation of enhanced springtime ozone profiles over the troposphere of Hong Kong area, J. Geophys. Res., 108(0) ,doc: 10.1029/2001Jd001555, 2002.
Chan, C.Y., L.Y. Chan, W.L. Chang, Y.G. Zheng, H, Cui, X.D. Zheng, Y. Qin, and Y.S. Li, Characteristics of tropospheric ozone profile and implications on the origin of ozone over subtropical China in spring 2001, J. Geophys. Res., this issue.
Chan, L.Y., H.Y. Liu, K.S. Lam, T. Wang, S.J. Oltmans, and J.M.Harris, Analysis of the seasonal behavior of tropospheric ozone at Hong Kong, Atmos. Environ., 32, 159-168, 1998.
Cho, J.Y.N., R.E. Newell, B.E. Anderson, J.D.W. Barrich, and K. L. Thornill, Characterizations of tropospheric turbulence and stability layers from aircraft observations, J. Geophys. Res., this issue.
Clarke, A.D., and 12 others, Size-distributions and mixtures of black carbon and dust aerosol in Asian outflow: physico-chemistry, optical properties, and implications for CCN, J. Geophys. Res., this issue.
Crawford, J., et al., An assessment of ozone photochemistry in the extratropical western North Pacific: impact of continental outflow during the late winter / early spring, J. Geophys. Res., 102, 28,469-28,488, 1998.
Crawford, J., and 27 others, Clouds and trace gas distributions during TRACE-P, J. Geophys. Res., this issue.
Davis, D.D., and 23 others, Trend in western North Pacific ozone photochemistry as defined by observations from NASA’s PEM-West B (1994) and TRACE-P (2001) field studies, J. Geophys. Res., this issue.
20
Deeter, M.N., et al., Operational carbon monoxide algorithm and selected results for the MOPITT instrument, submitted to J. Geophys. Res., 2003.
Dentener, F.J., G.R. Carmichael, Y. Zhang, J. Lelieveld, and P.J. Crutzen, Role of mineral dust as a reactive surface in the global troposphere, J. Geophys. Res., 101, 22,869-22,889, 1996.
Dibb, J.E., R.W. Talbot, E. Scheuer, G. Seid, M. Avery, and H. Singh, Aerosol chemical composition in Asian continental outflow during TRACE-P: comparison to PEM-West B, J. Geophys. Res., this issue.
Drummond, J.R., Measurements of Pollution in the Troposphere (MOPITT), in The Use of EOS for Studies of Atmospheric Physics, North-Holland, Amsterdam, pp. 1269-1284, 1992.
Duncan, B.N., R.V. Martin, A.C. Staudt, R. Yevich, J.A. Logan, Interannual and Seasonal Variability of Biomass Burning Emissions Constrained by Satellite Observations, J. Geophys. Res., 108, 4040, 10.1029/2002JD002378, 2003.
Edwards, D.P., C.M. Halvorson, and J.C. Gille, Radiative transfer modeling for the EOS Terra satellite Measurement of Pollution in the Troposphere (MOPITT) instrument, J. Geophys. Res., 104, 16755, 1999.
Eisele, F.L., and 26 others, Summary of measurement intercomparisons during TRACE-P, J. Geophys. Res., this issue.
Fried, A., and 24 others, Airborne tunable diode laser measurements of formaldehyde during TRACE-P: distributions and box-model comparisons, J. Geophys. Res., this issue.
Fuelberg, H.E., C.M. Kiley, J. R. Hannan, D.J. Westberg, M.A. Avery, and R.E. Newell, Atmospheric transport during the Transport and Chemical Evolution over the Pacific (TRACE-P) experiment, J. Geophys. Res., this issue.
Hannan, J.R., H.E. Fuelberg, J.H. Crawford, G.W. Sachse, and D.R. Blake, The role of wave cyclones in transporting boundary layer air during the spring 2001 NASA/TRACE-P experiment, J. Geophys. Res., this issue.
Hansen, J., M. Sato, R. Ruedy, A. Lacis, and V. Oinas, Global warming in the twenty-first century: An alternative scenario. Proc. Natl. Acad. Sci., 97, 9875-9880, 2000.
Heald, C.L., et al., Biomass burning emissions with daily resolution: application to aircraft observations in Asian outflow, J. Geophys. Res., this issue (a)
Heald, C.L., D.J. Jacob, L. Emmons, J.C. Gille, G.W. Sachse, E.V. Browell, M.A. Avery, and S.A. Vay, Transpacific transport and chemical evolution of Asian pollution observed from satellite and aircraft, J. Geophys. Res., this issue (b)
Hoell, J.M., D.D. Davis, S.C. Liu, R. Newell, M. Shipham, H. Akimoto, R.J. McNeal, R.J. Bendura, and J.W. Drewry, Pacific Exploratory Mission-West A (PEM-West A): September-October 1991, J. Geophys. Res., 101, 1641-1653, 1996.
Hoell, J.M., D.D. Davis, S.C. Liu, R.E. Newell, H. Akimoto, R.J. McNeal, and R.J. Bendura, The Pacific Exploratory Mission-West Phase B: February-March, 1994, J. Geophys. Res., 102, 28,223-28,239,. 1997.
Hoell, J.M., D.D. Davis, D.J. Jacob, M.O. Rodgers, R.E. Newell, H.E. Fuelberg, R.J. McNeal, J.L. Raper, and R.J. Bendura, The Pacific Exploratory Mission in the tropical Pacific: PEM-Tropics A, August-September 1996, J. Geophys. Res., 104, 5567-5584, 1999.
Huebert, B., T. Bates, P. Russell, G. Shi, Y.J. Kim, K. Kawamura, G. Carmichael, and T. Nakajima, , An overview of ACE-Asia: strategies for quantifying the relationships between Asian aerosols and their climatic impacts., submitted to J. Geophys. Res., 2003.
IPCC 2001, Climate Change 2001: The Scientific Basis, J. T. Houghton et al. (eds.), Cambridge University Press, UK. 2001.
Jaeglé, L., D. Jaffe, H.U. Price, P. Weiss, P.I. Palmer, M.J. Evans, D.J. Jacob, and I. Bey, Sources and budgets for CO and O3 in the northeastern Pacific during the spring of 2001: results from the PHOBEA-II experiment, J. Geophys. Res., this issue.
Jaffe, D., I. McKendry, T. Anderson, and H. Price, Six ‘new’ episodes of trans-Pacific transport of air pollutants, Atmos. Environ., 37, 391-404, 2003.
Jordan, C.E., J.E. Dibb, B.E. Anderson, and H.E. Fuelberg, Uptake of nitrate and sulfate on dust aerosols during TRACE-P, J. Geophys. Res., this issue (a).
Jordan, C.E., and 11 others, Chemical and physical properties of bulk aerosols within four sectors observed during TRACE-P, J. Geophys. Res., this issue (b).
Koike, M., and 17 others, Export of anthropogenic reactive nitrogen and sulfur compounds from the East Asia region in spring, this issue.
Kiley, C.M., H.E. Fuelberg, D. Allen, G.R. Carmichael, D.J. Jacob, C. Mari, P.I. Palmer, B. Pierce, K. Pickering, Y. Tang, O. Wild, T.D. Fairlie, J. A. Logan, and D.R. Streets, Intercomparison and validation of aircraft-
21
derived and simulated CO from seven chemical transport models during the TRACE-P experiment, J. Geophys. Res., this issue.
Lefer, B., R. Shetter, S. Hall, J. Crawford, and J. Olson, Impact of clouds and aerosols on photolysis frequencies and photochemistry during TRACE-P, Part I: analysis using radiative transfer and photochemical box models, J. Geophys. Res., this issue.
Li, Q., D.J. Jacob, R.M. Yantosca, C.L. Heald, H.B. Singh, M. Koike, Y. Zhao, G.W. Sachse, and D.G. Streets, A global 3-D model evaluation of the atmospheric budgets of HCN and CH3CN: constraints from aircraft measurements over the western Pacific, J. Geophys. Res., this issue.
Liu, H., W.L. Chang, S..J. Oltmans, L.Y. Chan, and J.M. Harris, On springtime high ozone events in the lower troposphere from southeast Asian biomass burning, Atmos. Environ., 33, 2403-2410, 1999.
Liu, H., D.J. Jacob, L.Y. Chan, S.J. Oltmans, I. Bey, R.M. Yantosca, J.M. Harris, B.N. Duncan, and R.V. Martin, Sources of tropospheric ozone along the Asian Pacific Rim: An analysis of ozonesonde observations, J. Geophys. Res., in press, 2003.
Liu, H., D.J. Jacob, I. Bey, R.M. Yantosca, B.N. Duncan, and G.W. Sachse, Transport pathways for Asian combustion outflow over the Pacific: interannual and seasonal variations, J. Geophys. Res., this issue.
Ma, Y.., and 13 others, The characteristics and influence of biomass burning aerosols on fine particle ionic composition measured in Asian outflow during TRACE-P, J. Geophys. Res., this issue.
Mari, C., M.J. Evans, P.I. Palmer, D.J. Jacob, G.W. Sachse, J. Escobar, and D. Gazen, The effect of clean warm conveyor belts on the export of pollution from East Asia, J. Geophys. Res., this issue.
McNeal, J.R., D.J. Jacob, D.D. Davis, and S.C. Liu, The NASA Global Tropospheric Experiment: recent accomplishments and future plans, IGACtivties Newsletter, June 1998.
Miyazaki, Y., and 15 others, Synoptic-scale transport of reactive nitrogen over the western Pacific in spring, J. Geophys. Res., this issue.
Newell, R.E., Y. Hu, V. Thouret, E.V. Browell, M.A. Fenn, and D.J. Westberg, Following potential vorticity and pollution across the Pacific – spring 2001. Part I: Mainly layers in pollution, J. Geophys. Res., this issue.
O’Sullivan, D.W., B.G. Heikes, J. Snow, P. Burrow, M. Avery, D.R. Blake, G.W. Sachse, and R.W. Talbot, Long-term and seasonal variations in the levels of hydrogen peroxide, methylhydroperoxide, and selected compounds over the Pacific Ocean, J. Geophys. Res., this issue.
Palmer, P.I., D.J. Jacob, D.B.A. Jones, C.L. Heald, R.M. Yantosca, J.A. Logan, G.W. Sachse, and D.G. Streets, Inverting for emissions of carbon monoxide from Asia using aircraft observations over the western Pacific, J. Geophys. Res., this issue (a)
Palmer, P.I., D.J. Jacob, L.J. Mickley, D.R. Blake, G.W. Sachse, H.E. Fuelberg, and C.M. Kiley, Eastern Asian emissions of anthropogenic halocarbons deduced from aircraft concentration data, J. Geophys. Res.,. this issue (b).
Pan, L., J. Gille, D. Edwards, P. Bailey, C. Rodgers, Retrieval of carbon monoxide for the MOPITT instrument, J. Geophys. Res., 103, 32,277-32,290, 1998.
Pierce, R.B., and 19 others, Regional Air Quality Modeling System (RAQMS) predictions of the tropospheric ozone budget over East Asia, J. Geophys. Res., this issue.
Price, H.U., D.A. Jaffe, P.V. Doskey, I. McKendry, and T.L. Anderson, Vertical profiles of ozone, aerosols, CO, and NMHCs in the Northeast Pacific during the TRACE-P and ACE-Asia experiments, J. Geophys. Res., this issue.
Raper, J.L., M.M. Kleb, D.J. Jacob, D.D. Davis, R.E. Newell, H.E. Fuelberg, R.J. Bendura, J.M. Hoell, and R.J. McNeal, Pacific Exploratory Mission in the tropical Pacific: PEM-Tropics B, March-April 1999, J. Geophys. Res., 106, 32,401-32,425, 2001.
Rodgers, C.D., Inverse Methods for Atmospheric Sounding: Theory and Practice, World Scientific, Singapore, 2000.
Rodgers, C.D., and B.J. Connor, Intercomparison of remote sounding instruments, J. Geophys. Res., 108, 10.1029/2002JD002299, 2003.
Russo, R., and 18 others, Chemical composition of Asian continental outflow over the western Pacific: results from TRACE-P, J. Geophys. Res., this issue.
Simpson, I.J., N.J. Blake, E. Atlas, F. Flocke, J.H. Crawford, H.E. Fuelberg, C.M. Kiley, F.S. Rowland, and D.R. Blake, Photochemical production of selected C2-C5 alkyl nitrates in tropospheric air influenced by Asian outflow, J. Geophys. Res., this issue.
22
Singh. H.B., L. Salas, D. Herlth, E. Czech, W. Viezee, Q. Li, D.J. Jacob, D. Blake, G. Sachse, C.N. Hayward, H. Fuelberg, C.M. Kiley, et al., In-situ measurements of HCN and CH3CN in the Pacific troposphere: sources, sinks, and intercomparisons with spectroscopic observations, J. Geophys. Res.,this issue.
Staudt, A. C., D. J. Jacob, J. A. Logan, D. Bachiochi, T. N. Krishnamurti, and G. W. Sachse, Continental sources, transoceanic transport, and interhemispheric exchange of carbon monoxide over the Pacific, J. Geophys. Res., 106 , 32,571-32,590, 2001.
Stohl, A., A 1-year Lagrangian ‘climatology’ of airstreams in the Northern hemisphere troposphere and lowermost stratosphere, J. Geophys. Res., 106, 7263-7279, 2001.
Streets, D.G., K. Jiang, X. Hu, J.E. Sinton, X.-Q. Zhang, D. Xu, M.Z. Jacobson, and J.E. Hansen, Recent reductions in China’s greenhouse gas emissions, Science, 294, 1835-1837, 2001.
Streets, D.G., T.C. Bond, G.R. Carmichael, S.D. Fernandes, Q. Fu, D. He, Z. Klimont, S.M. Nelson, N.Y. Tsai, M.Q. Wang, J.-H. Woo, and K.F. Yarber, An inventory of gaseous and primary aerosol emissions in Asia in the year 2000, J. Geophys. Res., this issue.
Talbot, R., J. Dibb, E. Scheuer, G. Seid, R. Russo, S. Sandholm, D. Tan, H. Singh, D. Blake, N. Blake, E. Atlas, G. Sachse, and M. Avery, Reactive nitrogen in Asian continental outflow over the western Pacific: results from the NASA TRACE-P airborne mission, J. Geophys. Res., this issue.
Tang, Y., G.R. Carmichael, I. Uno, J.-H. Woo, G. Kurata, B. Lefer, R.E. Shetter, H. Huang, B.E. Anderson, M.A. Avery, A.D. Clarke, and D.R. Blake, Impacts of aerosols and clouds on photolysis frequencies and photochemistry during TRACE-P, Part II: Three-dimensional study using a regional chemical transport model, J. Geophys. Res., this issue (a).
Tang, Y., and 11 others, The influences of biomass burning during TRACE-P experiment identified by the regional chemical transport model, J. Geophys. Res., this issue (b).
Thornhill, K.L., B.E. Anderson, J.D. Barrick, D.R. Bagwell, R. Friesen, and D.H. Lenschow, Air motion intercomparison during TRACE-P/ACE-ASIA, J. Geophys. Res., this issue.
Tu, F.H., D.C. Thornton, A.R. Bandy, M.-S. Kim, G. Carmichael, Y. Tang, L. Thornhill, and G. Sachse, Dynamics and transport of sulfur dioxide over the Yellow Sea during TRACE-P, J. Geophys. Res., this issue.
UNEP, Production and consumption of ozone depleting substances under the Montreal protocol: 1986-2001, Tech. Rep., United Nations Environmental Program, 2002.
Vay, S.A., et al., The influence of regional-scale anthropogenic activity on CO2 distributions over the western North Pacific, J. Geophys. Res., this issue.
Wang, T., A.J. Ding, D.R. Blake, W. Zahorowski, C.N. Poon, and Y.S. Li, Chemical characterization of the boundary layer outflow of air pollution to the South China coast during February-April 2001, J. Geophys. Res., this issue.
Weber, R.J., and 14 others, New particle formation in anthropogenic plumes advecting from Asia observed during TRACE-P, J. Geophys. Res., this issue.
Wild, O., J.K. Sundet, M.J. Prather, I.S.A. Isaksen, H. Akimoto, E.V. Browell, and S.J. Oltmans, CTM ozone simulations for spring 2001 over the western Pacific: comparisons with TRACE-P lidar, ozonesondes and TOMS columns, J. Geophys. Res., this issue.
Yienger, J.J., et al., The episodic nature of air pollution transport from Asia to North America, J. Geophys.Res., 105, 26,931-26,945, 2000.
Zhang, Y., and G.R. Carmichael, The role of mineral aerosol in tropospheric chemistry in East Asia – a model study, J. Appl. Met., 38, 353-366, 1999.
Zondlo, M.A., R.L. Mauldin, E. Kosciuch, C.A. Cantrell, and F.L. Eisele, Development and characterization of an airborne-based instrument used to measure nitric acid during the NASA TRACE-P field experiment, J. Geophys. Res., this issue.
23
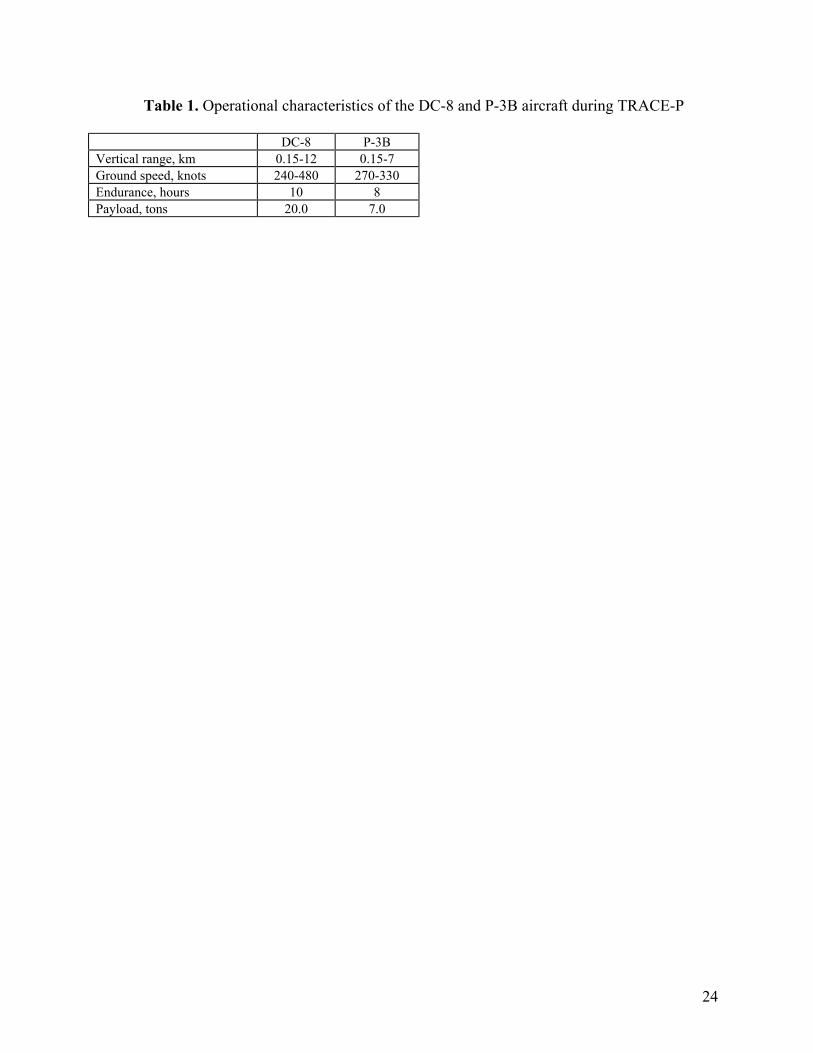
Table 1. Operational characteristics of the DC-8 and P-3B aircraft during TRACE-P DC-8 P-3B Vertical range, km 0.15-12 0.15-7 Ground speed, knots 240-480 270-330 Endurance, hours 10 8 Payload, tons 20.0 7.0
24
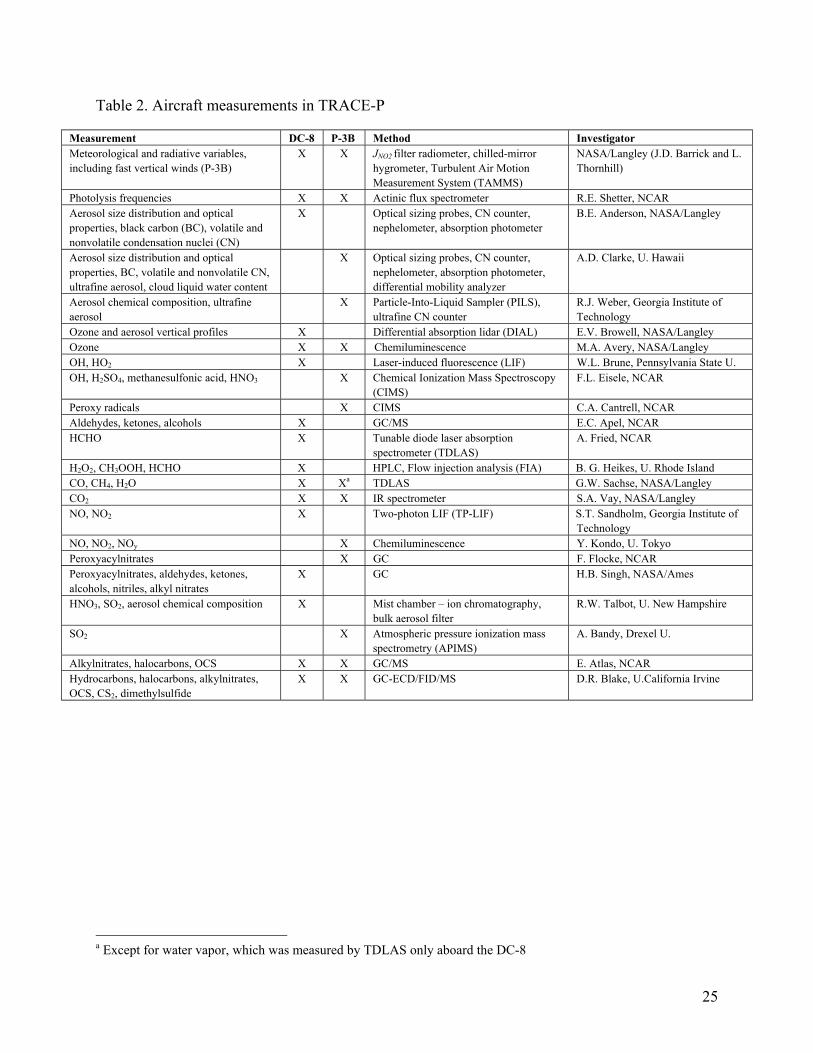
Table 2. Aircraft measurements in TRACE-P
Measurement DC-8 P-3B Method Investigator Meteorological and radiative variables, including fast vertical winds (P-3B)
X X JNO2 filter radiometer, chilled-mirror hygrometer, Turbulent Air Motion Measurement System (TAMMS)
NASA/Langley (J.D. Barrick and L. Thornhill)
Photolysis frequencies X X Actinic flux spectrometer R.E. Shetter, NCAR Aerosol size distribution and optical properties, black carbon (BC), volatile and nonvolatile condensation nuclei (CN)
X Optical sizing probes, CN counter, nephelometer, absorption photometer
B.E. Anderson, NASA/Langley
Aerosol size distribution and optical properties, BC, volatile and nonvolatile CN, ultrafine aerosol, cloud liquid water content
X Optical sizing probes, CN counter, nephelometer, absorption photometer, differential mobility analyzer
A.D. Clarke, U. Hawaii
Aerosol chemical composition, ultrafine aerosol
X Particle-Into-Liquid Sampler (PILS), ultrafine CN counter
R.J. Weber, Georgia Institute of Technology
Ozone and aerosol vertical profiles X Differential absorption lidar (DIAL) E.V. Browell, NASA/Langley
Ozone X X Chemiluminescence M.A. Avery, NASA/Langley OH, HO2 X Laser-induced fluorescence (LIF) W.L. Brune, Pennsylvania State U. OH, H2SO4, methanesulfonic acid, HNO3 X Chemical Ionization Mass Spectroscopy
(CIMS) F.L. Eisele, NCAR
Peroxy radicals X CIMS C.A. Cantrell, NCAR Aldehydes, ketones, alcohols X GC/MS E.C. Apel, NCAR HCHO X Tunable diode laser absorption
spectrometer (TDLAS) A. Fried, NCAR
H2O2, CH3OOH, HCHO X HPLC, Flow injection analysis (FIA) B. G. Heikes, U. Rhode Island CO, CH4, H2O X Xa TDLAS G.W. Sachse, NASA/Langley CO2 X X IR spectrometer S.A. Vay, NASA/Langley NO, NO2 X Two-photon LIF (TP-LIF) S.T. Sandholm, Georgia Institute of
Technology NO, NO2, NOy X Chemiluminescence Y. Kondo, U. Tokyo Peroxyacylnitrates X GC F. Flocke, NCAR Peroxyacylnitrates, aldehydes, ketones, alcohols, nitriles, alkyl nitrates
X GC H.B. Singh, NASA/Ames
HNO3, SO2, aerosol chemical composition X Mist chamber – ion chromatography, bulk aerosol filter
R.W. Talbot, U. New Hampshire
SO2 X Atmospheric pressure ionization mass spectrometry (APIMS)
A. Bandy, Drexel U.
Alkylnitrates, halocarbons, OCS X X GC/MS E. Atlas, NCAR Hydrocarbons, halocarbons, alkylnitrates, OCS, CS2, dimethylsulfide
X X GC-ECD/FID/MS D.R. Blake, U.California Irvine
a Except for water vapor, which was measured by TDLAS only aboard the DC-8
25
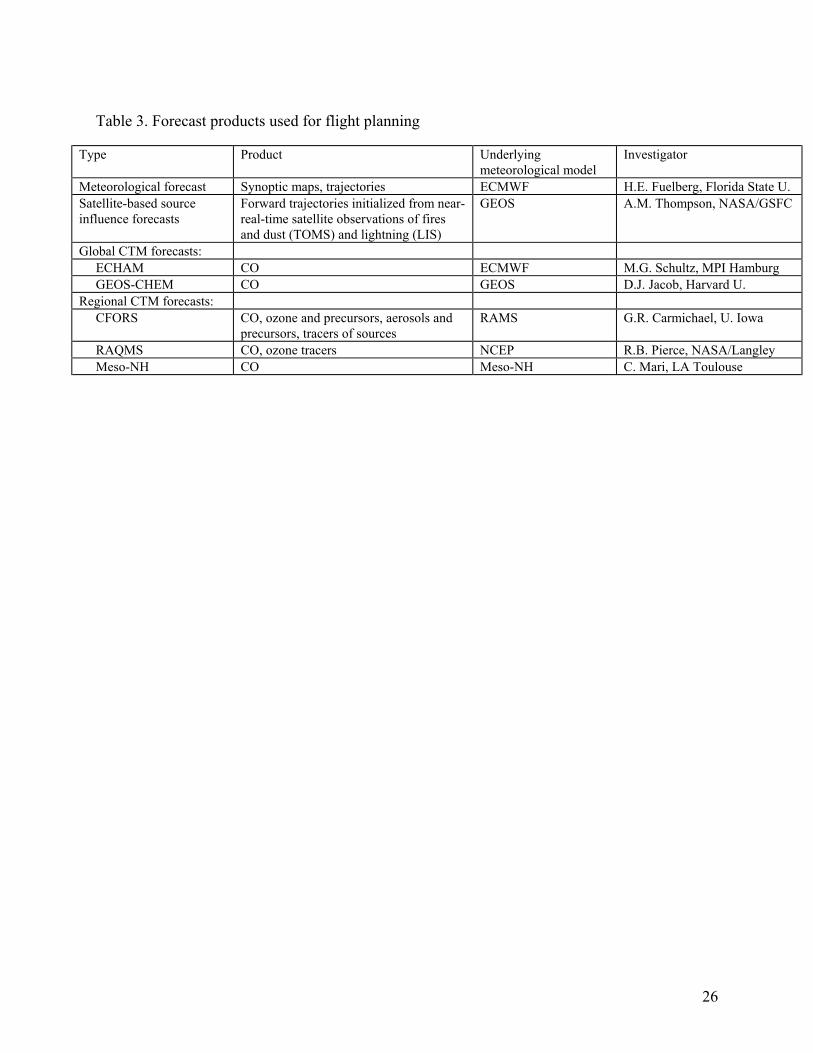
Table 3. Forecast products used for flight planning
Type Product Underlying meteorological model
Investigator
Meteorological forecast Synoptic maps, trajectories ECMWF H.E. Fuelberg, Florida State U. Satellite-based source influence forecasts
Forward trajectories initialized from near-real-time satellite observations of fires and dust (TOMS) and lightning (LIS)
GEOS A.M. Thompson, NASA/GSFC
Global CTM forecasts: ECHAM CO ECMWF M.G. Schultz, MPI Hamburg GEOS-CHEM CO GEOS D.J. Jacob, Harvard U. Regional CTM forecasts: CFORS CO, ozone and precursors, aerosols and
precursors, tracers of sources RAMS G.R. Carmichael, U. Iowa
RAQMS CO, ozone tracers NCEP R.B. Pierce, NASA/Langley Meso-NH CO Meso-NH C. Mari, LA Toulouse
26
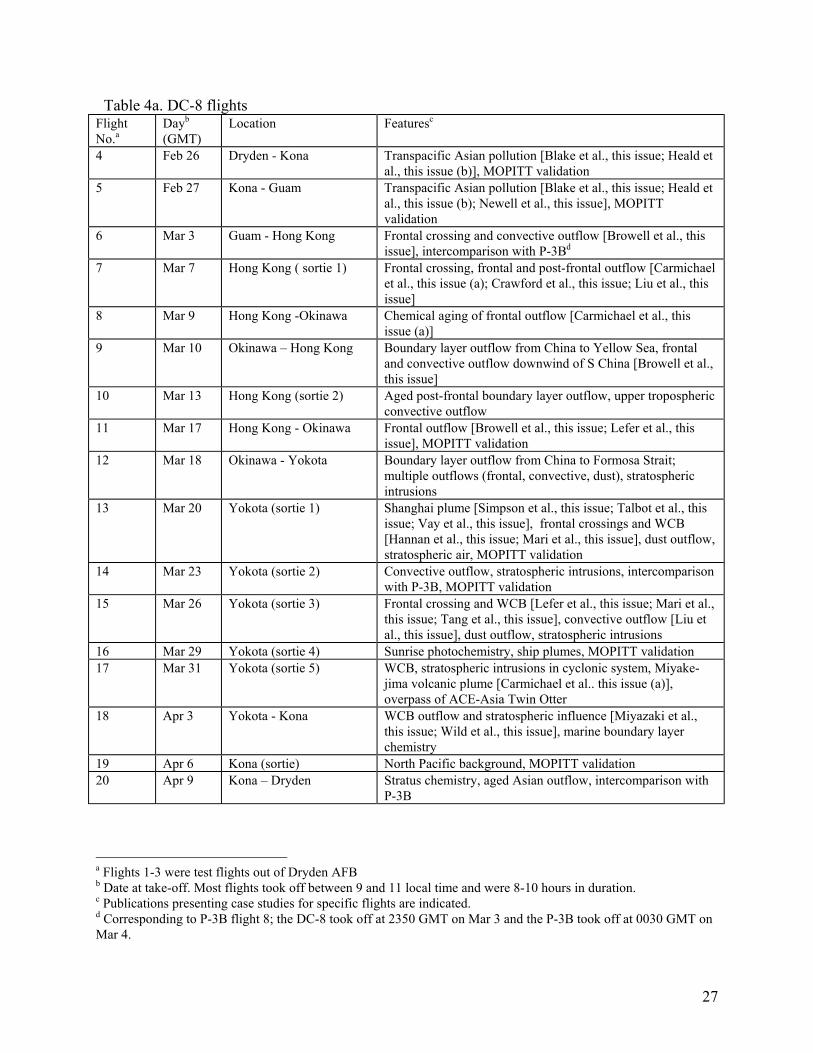
Table 4a. DC-8 flights Flight No.a
Dayb (GMT)
Location Featuresc
4 Feb 26 Dryden - Kona Transpacific Asian pollution [Blake et al., this issue; Heald et al., this issue (b)], MOPITT validation
5 Feb 27 Kona - Guam Transpacific Asian pollution [Blake et al., this issue; Heald et al., this issue (b); Newell et al., this issue], MOPITT validation
6 Mar 3 Guam - Hong Kong Frontal crossing and convective outflow [Browell et al., this issue], intercomparison with P-3Bd
7 Mar 7 Hong Kong ( sortie 1) Frontal crossing, frontal and post-frontal outflow [Carmichael et al., this issue (a); Crawford et al., this issue; Liu et al., this issue]
8 Mar 9 Hong Kong -Okinawa Chemical aging of frontal outflow [Carmichael et al., this issue (a)]
9 Mar 10 Okinawa – Hong Kong Boundary layer outflow from China to Yellow Sea, frontal and convective outflow downwind of S China [Browell et al., this issue]
10 Mar 13 Hong Kong (sortie 2) Aged post-frontal boundary layer outflow, upper tropospheric convective outflow
11 Mar 17 Hong Kong - Okinawa Frontal outflow [Browell et al., this issue; Lefer et al., this issue], MOPITT validation
12 Mar 18 Okinawa - Yokota Boundary layer outflow from China to Formosa Strait; multiple outflows (frontal, convective, dust), stratospheric intrusions
13 Mar 20 Yokota (sortie 1) Shanghai plume [Simpson et al., this issue; Talbot et al., this issue; Vay et al., this issue], frontal crossings and WCB [Hannan et al., this issue; Mari et al., this issue], dust outflow, stratospheric air, MOPITT validation
14 Mar 23 Yokota (sortie 2) Convective outflow, stratospheric intrusions, intercomparison with P-3B, MOPITT validation
15 Mar 26 Yokota (sortie 3) Frontal crossing and WCB [Lefer et al., this issue; Mari et al., this issue; Tang et al., this issue], convective outflow [Liu et al., this issue], dust outflow, stratospheric intrusions
16 Mar 29 Yokota (sortie 4) Sunrise photochemistry, ship plumes, MOPITT validation 17 Mar 31 Yokota (sortie 5) WCB, stratospheric intrusions in cyclonic system, Miyake-
jima volcanic plume [Carmichael et al.. this issue (a)], overpass of ACE-Asia Twin Otter
18 Apr 3 Yokota - Kona WCB outflow and stratospheric influence [Miyazaki et al., this issue; Wild et al., this issue], marine boundary layer chemistry
19 Apr 6 Kona (sortie) North Pacific background, MOPITT validation 20 Apr 9 Kona – Dryden Stratus chemistry, aged Asian outflow, intercomparison with
P-3B
a Flights 1-3 were test flights out of Dryden AFB b Date at take-off. Most flights took off between 9 and 11 local time and were 8-10 hours in duration. c Publications presenting case studies for specific flights are indicated. d Corresponding to P-3B flight 8; the DC-8 took off at 2350 GMT on Mar 3 and the P-3B took off at 0030 GMT on Mar 4.
27
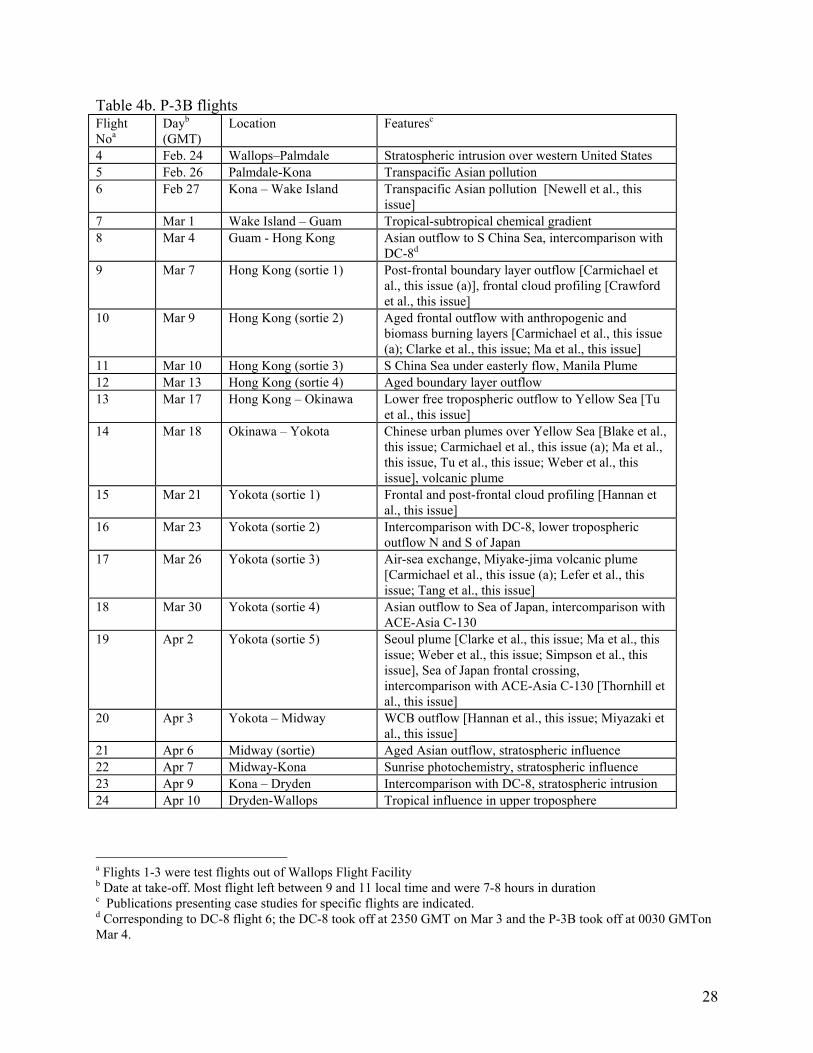
Table 4b. P-3B flights Flight Noa
Dayb (GMT)
Location Featuresc
4 Feb. 24 Wallops–Palmdale Stratospheric intrusion over western United States 5 Feb. 26 Palmdale-Kona Transpacific Asian pollution 6 Feb 27 Kona – Wake Island Transpacific Asian pollution [Newell et al., this
issue] 7 Mar 1 Wake Island – Guam Tropical-subtropical chemical gradient 8 Mar 4 Guam - Hong Kong Asian outflow to S China Sea, intercomparison with
DC-8d 9 Mar 7 Hong Kong (sortie 1) Post-frontal boundary layer outflow [Carmichael et
al., this issue (a)], frontal cloud profiling [Crawford et al., this issue]
10 Mar 9 Hong Kong (sortie 2) Aged frontal outflow with anthropogenic and biomass burning layers [Carmichael et al., this issue (a); Clarke et al., this issue; Ma et al., this issue]
11 Mar 10 Hong Kong (sortie 3) S China Sea under easterly flow, Manila Plume 12 Mar 13 Hong Kong (sortie 4) Aged boundary layer outflow 13 Mar 17 Hong Kong – Okinawa Lower free tropospheric outflow to Yellow Sea [Tu
et al., this issue] 14 Mar 18 Okinawa – Yokota Chinese urban plumes over Yellow Sea [Blake et al.,
this issue; Carmichael et al., this issue (a); Ma et al., this issue, Tu et al., this issue; Weber et al., this issue], volcanic plume
15 Mar 21 Yokota (sortie 1) Frontal and post-frontal cloud profiling [Hannan et al., this issue]
16 Mar 23 Yokota (sortie 2) Intercomparison with DC-8, lower tropospheric outflow N and S of Japan
17 Mar 26 Yokota (sortie 3) Air-sea exchange, Miyake-jima volcanic plume [Carmichael et al., this issue (a); Lefer et al., this issue; Tang et al., this issue]
18 Mar 30 Yokota (sortie 4) Asian outflow to Sea of Japan, intercomparison with ACE-Asia C-130
19 Apr 2 Yokota (sortie 5) Seoul plume [Clarke et al., this issue; Ma et al., this issue; Weber et al., this issue; Simpson et al., this issue], Sea of Japan frontal crossing, intercomparison with ACE-Asia C-130 [Thornhill et al., this issue]
20 Apr 3 Yokota – Midway WCB outflow [Hannan et al., this issue; Miyazaki et al., this issue]
21 Apr 6 Midway (sortie) Aged Asian outflow, stratospheric influence 22 Apr 7 Midway-Kona Sunrise photochemistry, stratospheric influence 23 Apr 9 Kona – Dryden Intercomparison with DC-8, stratospheric intrusion 24 Apr 10 Dryden-Wallops Tropical influence in upper troposphere
a Flights 1-3 were test flights out of Wallops Flight Facility b Date at take-off. Most flight left between 9 and 11 local time and were 7-8 hours in duration c Publications presenting case studies for specific flights are indicated. d Corresponding to DC-8 flight 6; the DC-8 took off at 2350 GMT on Mar 3 and the P-3B took off at 0030 GMTon Mar 4.
28
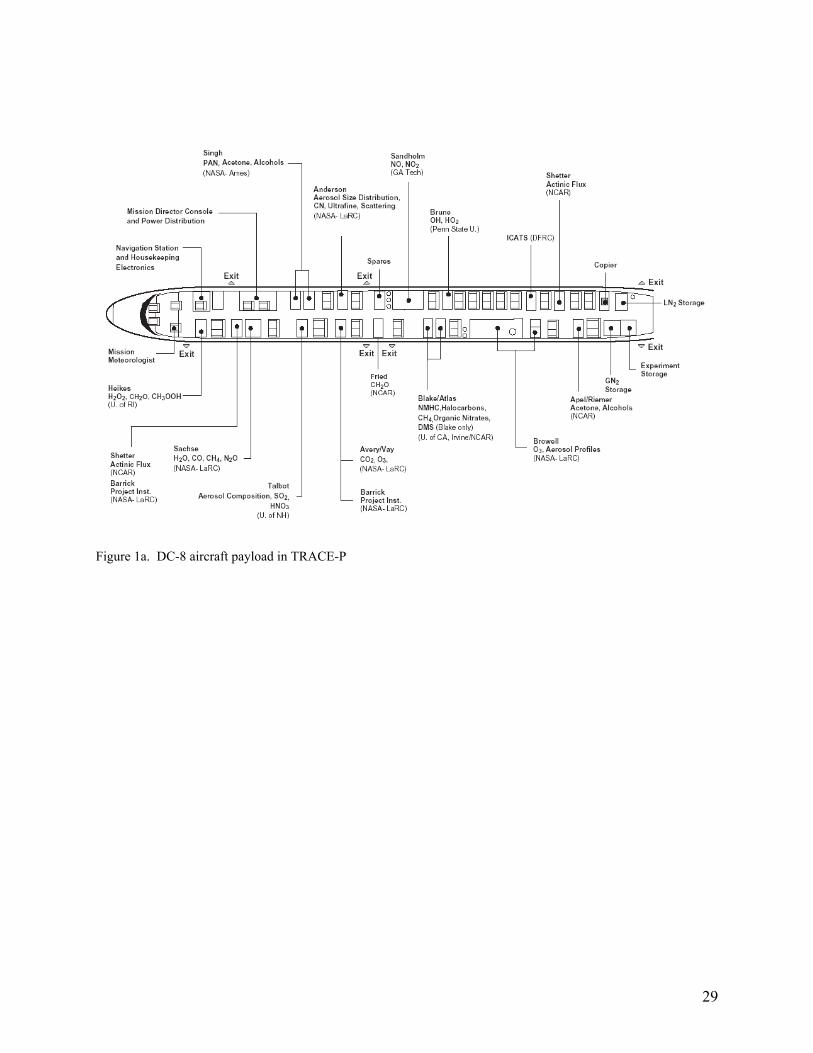
Figure 1a. DC-8 aircraft payload in TRACE-P
29
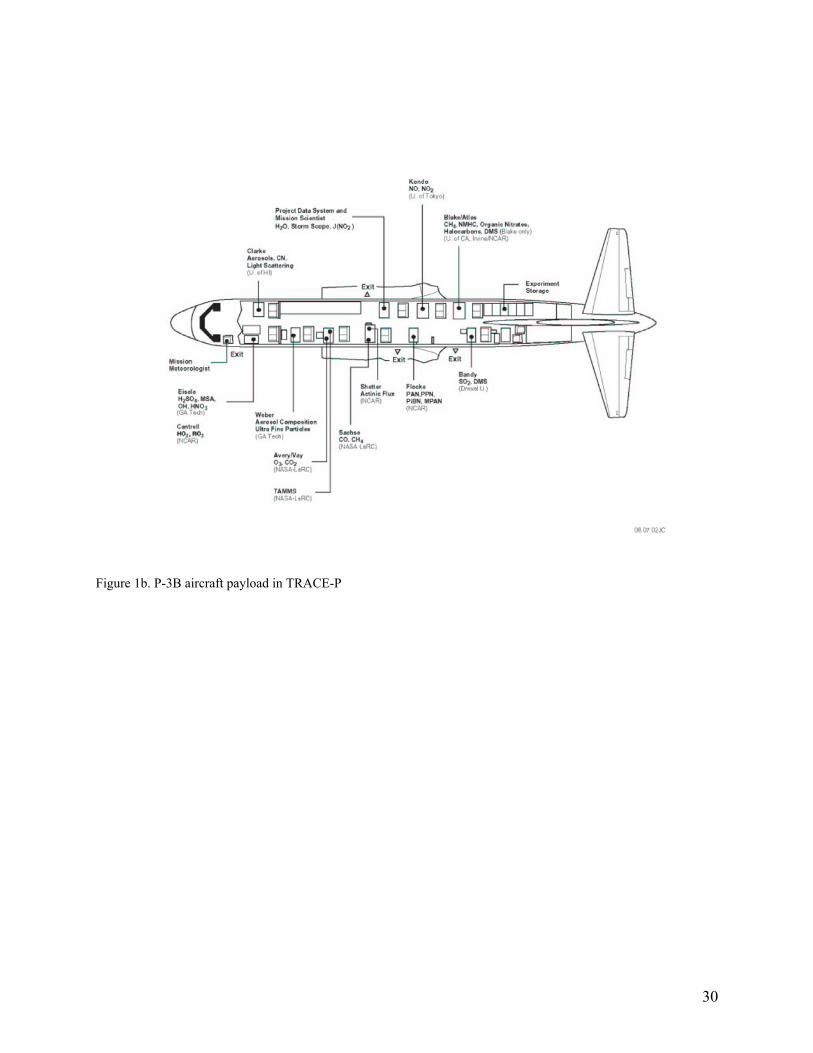
Figure 1b. P-3B aircraft payload in TRACE-P
30
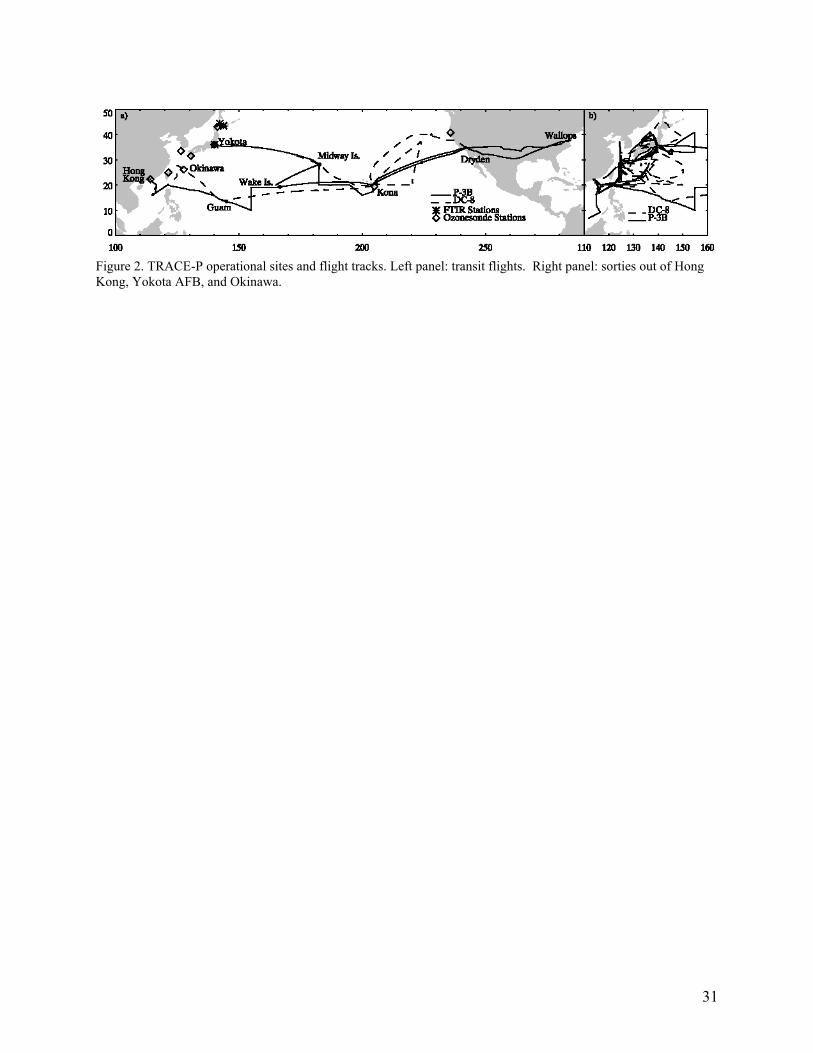
Figure 2. TRACE-P operational sites and flight tracks. Left panel: transit flights. Right panel: sorties out of Hong Kong, Yokota AFB, and Okinawa.
31
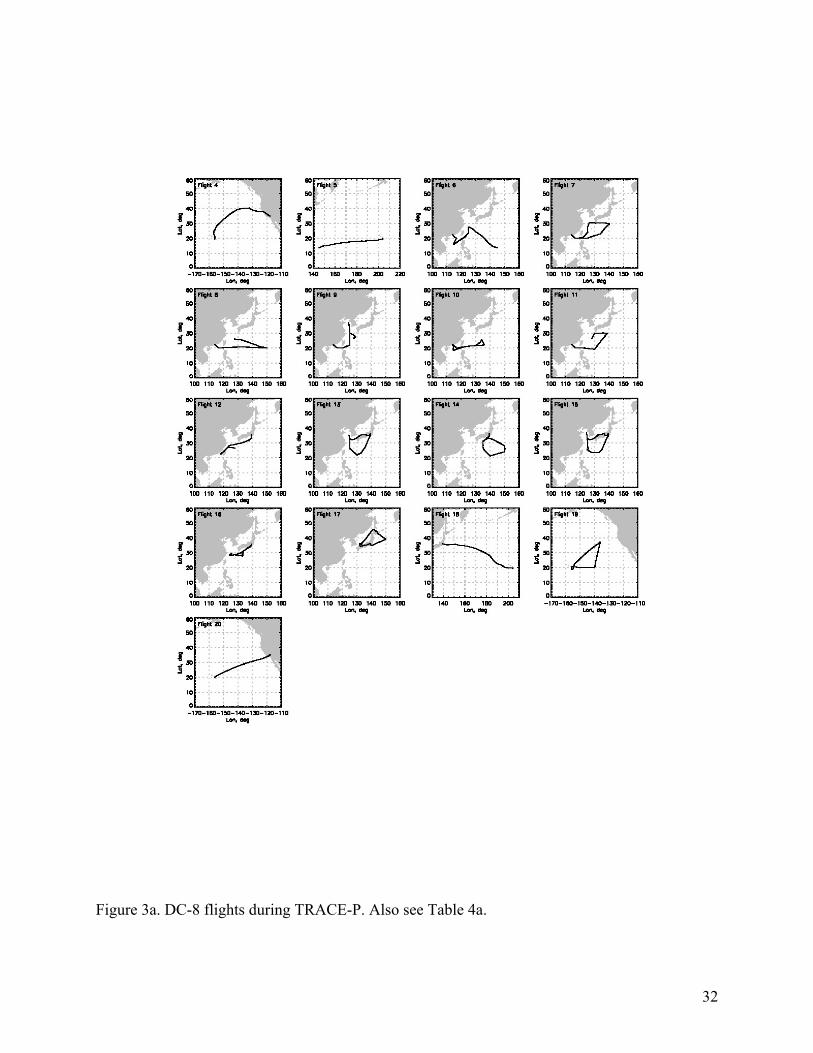
Figure 3a. DC-8 flights during TRACE-P. Also see Table 4a.
32
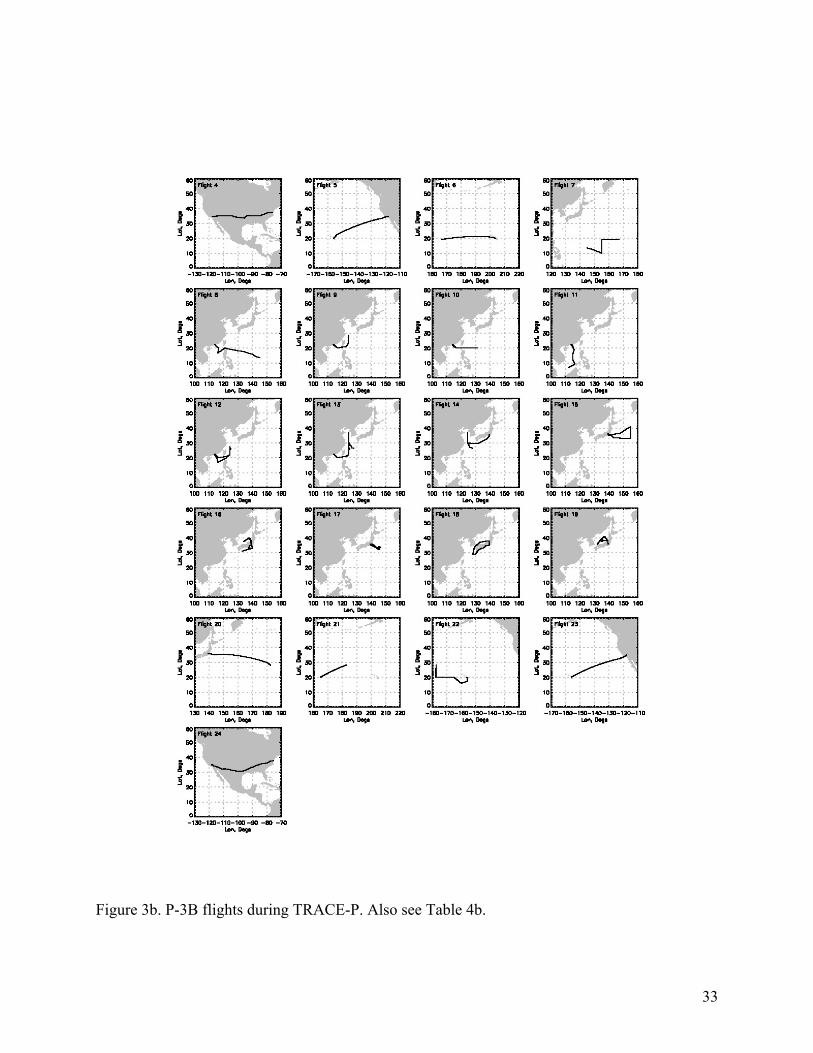
Figure 3b. P-3B flights during TRACE-P. Also see Table 4b.
33
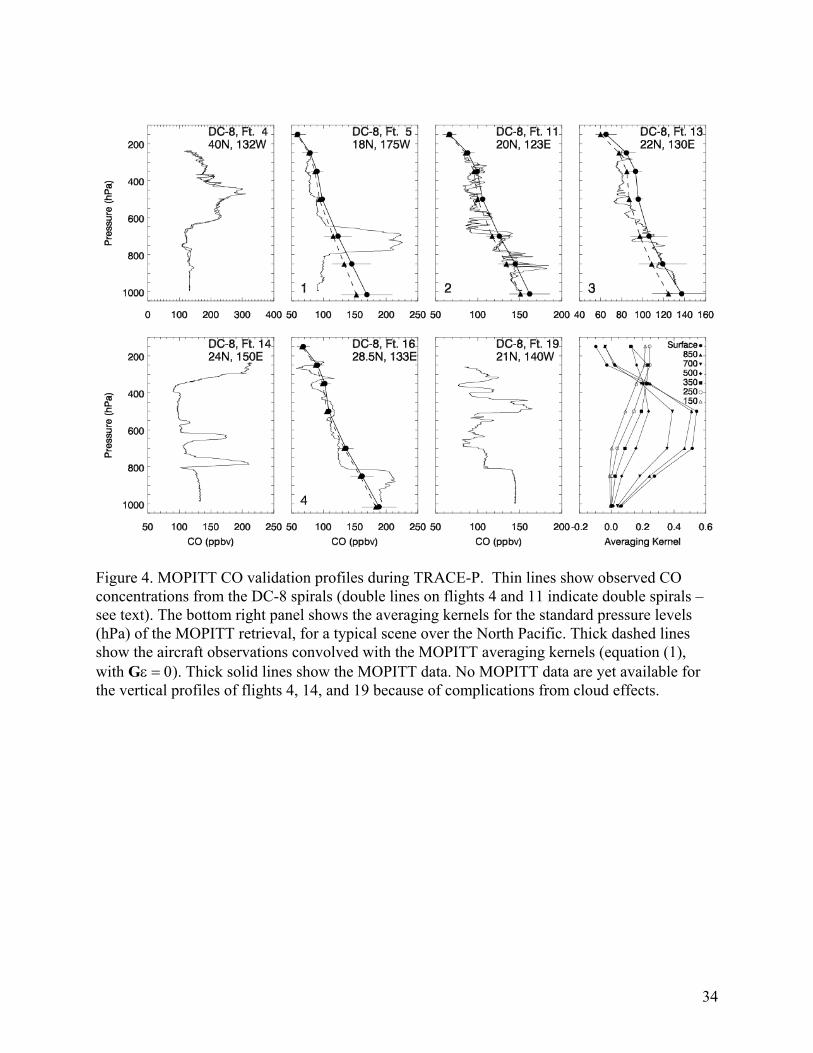
Figure 4. MOPITT CO validation profiles during TRACE-P. Thin lines show observed CO concentrations from the DC-8 spirals (double lines on flights 4 and 11 indicate double spirals – see text). The bottom right panel shows the averaging kernels for the standard pressure levels (hPa) of the MOPITT retrieval, for a typical scene over the North Pacific. Thick dashed lines show the aircraft observations convolved with the MOPITT averaging kernels (equation (1), with Gε = 0). Thick solid lines show the MOPITT data. No MOPITT data are yet available for the vertical profiles of flights 4, 14, and 19 because of complications from cloud effects.
34

Figure 5. Scatterplot of MOPITT vs. TRACE-P aircraft CO columns for the four numbered validation profiles of Figure 4. Results are shown for the aircraft data with MOPITT averaging kernels applied (pluses) and for the aircraft 950-300 hPa columns with no averaging kernels applied (triangles). The latter columns are lower because they do not include CO below 950 hPa or above 300 hPa.
35