Embed Size (px)
Citation preview

DOE/NASA/0345-1
NASA CR-174898
Design and Evaluation of Fluidized Bed Heat
Recovery for Diesel Engine System
J.R. Hamm, R.A. Newby, E.J. Vidt, and T.E. LippertWestinghouse Electric Corporation
July 1985
Prepared for
National Aeronautics and Space AdministrationLewis Research Center
Cleveland, Ohio 44135
Under Contract DEN 3-345
for
U.S. DEPARTMENT OF ENERGY
Conservation and Renewable EnergyOffice of Vehicle and Engine R&DWashington, D.C. 20585
Under Interagency Agreement DE-AI01-80CS50194


DESIGN AND EVALUATION OF FLUIDIZED BED HEAT RECOVERYFOR DIESEL ENGINE SYSTEMS
Prepared By
Westinghouse Electric Corporation
Research and Development Center
1310 Beulah Road, Pittsburgh, PA 15235
Principal Investigators
J. R. Hamm, R. A. Newby, E. J. Vidt and T. E. Lippert
Prepared For
National Aeronautics and Space AdministrationLewis Research Center
Under Contract DEN 3-345

ACKNOWLEDGEMENTS
This work was conducted for NASA under the technical direction
of Mr. Murray Bailey whose many suggestions and contributions are
recognized.

CONTENTS
ACKNOWLEDGEMENTS............................................. i
I. SUMMARYANDCONCLUSIONS...................................... I-I
2. INTRODUCTION................................................. 2-I
3. BACKGROUND................................................... 3-I
3.1 Diesel Engine Application With Heat Recovery............ 3-I3.2 Fluidized Bed Characteristics in Heat
Recovery Applications ................................... 3-2
4. COMPOUNDENGINECONFIGURATIONSCREENING...................... 4-I
4.1 Organic Rankine Cycle ................................... 4-I
4.1.1 FLUORINAL-85(F-85) Working Fluid ................ 4-I
4.1.2 RC-I - Working Fluid ............................. 4-54.2 Steam Rankine Cycle ..................................... 4-9
4.3 TurbocompoundEngine With Steam Injection ............... 4-9
4.4 OpenBrayton Cycle ............................. ......... 4-16
4.5 Closed Brayton Cycle .................................... 4-23
4.6 Stifling Engine......................................... 4-344.7 Analysis of Screening Evaluations ....................... 4-42
5. EVALUATIONOFSELECTEDSYSTEMS............................... 5-I
5.1 Organic Rankine Cycle ................................... 5-I
5.1.1 Truck Applications ............................... 5-I
5.1.2 Locomotive Application ........................... 5-4
5.1.3 Marine Application ............................... 5-45.2 Steam Injection Cycle ................................... 5-4
5.2.1 Truck Application ................................ 5-13
5.2.2 Locomotive and Marine Applications ............... 5-13
ii

5.3 Stirling Engine......................................... 5-135.3.1 Truck Application ................................ 5-22
5.3.2 Locomotive and Marine Applications ............... 5-24
5.4 Performance of Selected Systems......................... 5-24
6. PRELIMINARYDESIGNANDCOSTSOFFLUIDIZEDBEDHEATEXCHANGERSFORSELECTEDSYSTESM............................. 6-I
6.1 Conceptual Description of the Heat Recovery Unit ........ 6-I
6.2 Design Procedure........................................ 6-36.4 Organic Rankine Cycle ................................... 6-7
6.5 Steam Injection Cycle ................................... 6-7
6.6 Stirling Engine Cycle ................................... 6-11
6.7 Fluid Bed Heat Exchanger Cost Estimate .................. 6-16
7. SYSTEM DESCRIPTION AND ARRANGEMENT ........................... 7-I
7.1 Truck Application ....................................... 7-I
7.1.1 Organic Rankine Cycle ............................ 7-I
7.1.2 Steam Injection Cycle ............................ 7-4
7.1.3 Stifling Engine .................................. 7-4
7.2 Locomotive Application .................................. 7-7
7.2.1 Organic Rankine Cycle ............................ 7-7
7.2.2 Steam Injection Cycle ............................ 7-11
7.2.3 Stirling Engine .................................. 7-11
7.3 Marine Application ...................................... 7-15
7.3.1 Organic Rankine Cycle ............................ 7-15
7.3.2 Steam Injection Cycle ............................ 7-15
7.3.3 Stifling Engf,ne System ........................... 7-18
8. SYSTEM COSTS AND ECONOMIC ASSESSMENT ......................... 8-I
8.1 System Component Weights and Costs ...................... 8-I
8.1.1 Rankine Cycle System * ............................ 8-I
8.1.2 Steam Injection Cycle System ..................... 8-I
8.1.3 Stirling Engine System ........................... 8-11
8.2 Comparison of System Weights ............................ 8-11
8.2.1 Truck Application ................................ 8-11
8.2.2 Locomotive Applications .......................... 8-11
iii

8.2.3 Marine Application ............................... 8-12
8.3 Economic Assessmentof TurbocompoundDieselEngine Systems.......................................... 8-12
9. REFERENCES................................................... 9-I
APPENDIXA....................................................... A-I
APPENDIXB....................................................... B-I
APPENDIXC....................................................... C-I
APPENDIXD....................................................... D-I
APPENDIXE....................................................... E-I
APPENDIXF........ : .............................................. F-I
APPENDIXG....................................................... G-I
iv
LIST OF FIGURES
4.1
4.2
4.3
4.4
4.5
4.6
4.7
4.8
4.9
4.10
4.11
4.12
4.13
4.14
4.15
_.16
4.17
Turbocharged diesel with subposed organic Rankine cycle
Turbocompound diesel with subposed organic Rankine cyle
Fluidized Bed Heat Exchanger Temperature Profile,
organic Rankine cycle with regenerative feed heating
Fluidlzed Bed Heat Exchanger Temperature Profile,
organic Rankine cycle with regenerative feed heating
Fluidized Bed Heat Exchanger Temperature Profile,
organic Rankine cycle
Turbocharged diesel with subposed steam Rankine cycle
Turbocompound diesel with subposed steam Rankine cycle
Fluidized Bed Heat Exchanger Temperature Profile,
steam Rankine cycle
Turbocompound diesel with steam injection between
compressor drive expander and power expander
Fluidized Bed Heat Exchanger Temperature Profile.
Turbocompound engine with steam injection between
compressor drive and power expanders
Turbocompound diesel with steam injection ahead of
compressor drive expander
ATCPD/A Model for Steam Injection System
Turbocharged diesel with subposed open Brayton cycle
Turbocharged diesel with subposed intercooled open
Brayton cycle
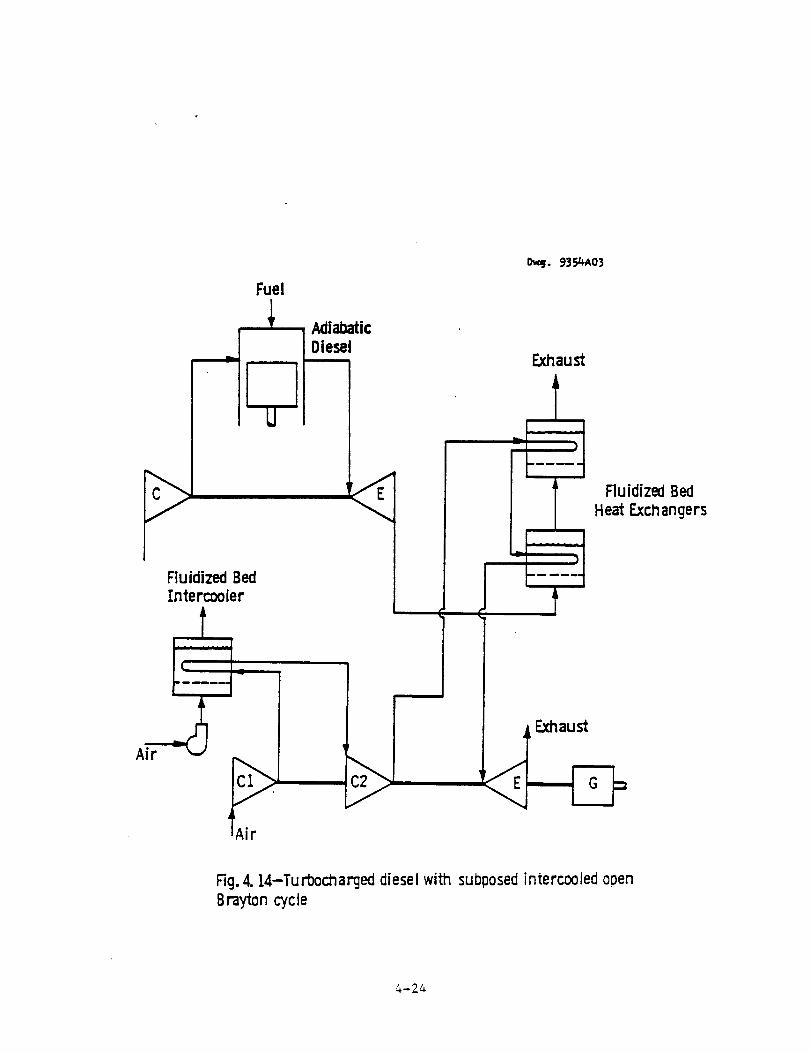
Turbocharged diesel with subposed recuperated open
Brayton cycle
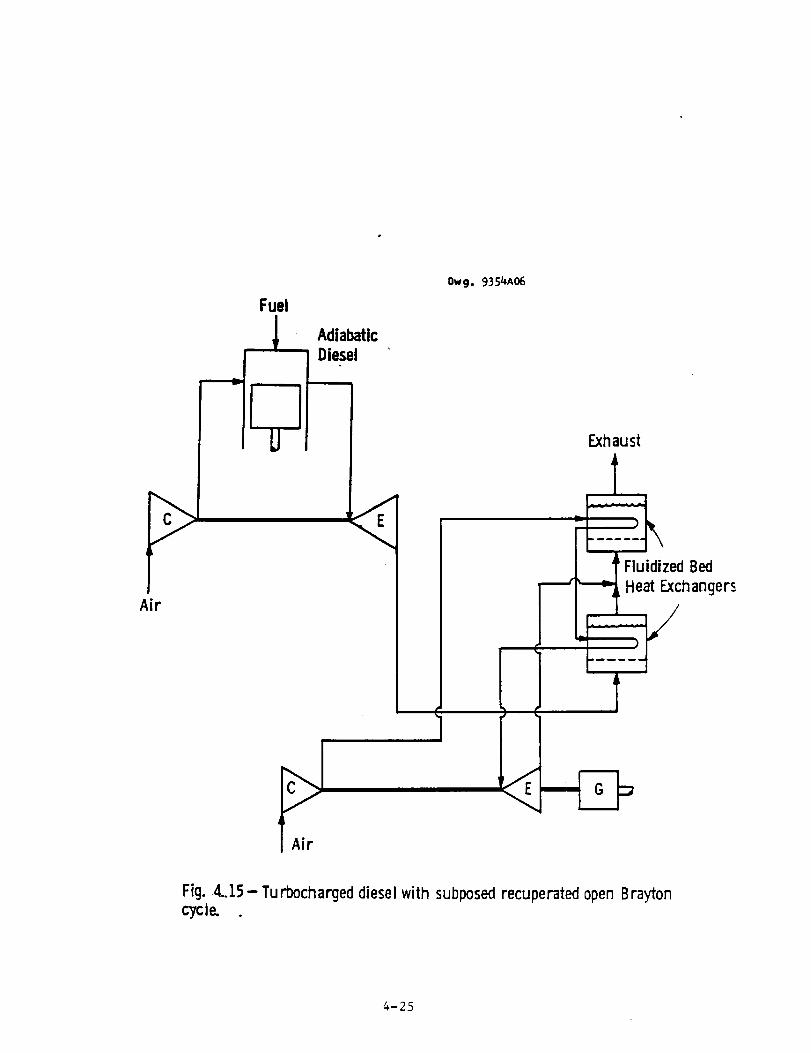
Fluidized Bed Heat Exchanger Temperature Profile
intercooled open Brayton cycle
Turbocharged diesel with subposed closed Brayton cycle
Page
4-2
4-3
4-6
4-7
4-8
4-10
4-11
4-13
4-14
4-17
4-18
4-19
4-21
4-24
4-25

4.18
4.19
4.20
4.21
4.22
4.23
4.24
4.25
5.3
5.4
5.5
5.6
6.1
6.2
Fluidized Bed Heat Exchanger Temperature Profiles for
closed Brayton cycle 4-29
Adiabatic diesel engine with subposed closed Brayton
cycle 4-30
Adiabatic diesel engine with subposed closed Brayton
bottoming cycle 4-31
Adiabatic diesel engine with subposed closed Brayton
bottoming cycle 4-32
Adiabatic diesel engine with subposed Stirling cycle 4-35
Temperature profile of fluidized bed heat exchanger
for Stirling engine subsystem with intermediate heat
transfer loop 4-36
Single stage FBHX heater integrated with Stirling
engine 4-39
Adiabatic diesel engine with subposed Stirling
engine using heat pipes 4-40
Turbocharged diesel with subposed organic Rankine cycle 5-2
Turbocompound diesel with steam injection ahead of
compressor drive expander 5-11
Fluidized bed heat exchanger temperature profile.
Turbocompound engine with steam injection ahead of
compressor drive expander 5-12
Adiabatic diesel with suposed Stirling engines using
heat pipes 5-20
Fluidized bed heat exchanger temperature profile,
Stirling engine 5-21
Basic Mod-I Stirling engine 5-23
Fluid bed heat recovery unit schematic 6-2
Fluid bed heat exchanger for organic Rankine
bottoming cycle 6-8
Fluid bed heat exchanger for steam injection 6-12
Fluid bed heat exchanger for Stirling injection 6-15
Vi
7.3
7.4
7.5
7.6
7.7
7.8
7.9
7.10
7.11
7.12
7.13
7.14
BI
B2
C1
C2
C3
D1
Heavy duty long haul truck tractor
Typical truck installation of organic Rankine
cycle system
Typical truck installation of steam injection cycle
Water tank for steam injection cycle on truck
Heat pipe system for suposed Stirling engine
Typical truck installation of Stirling engine units
General Electric 3600 hp C36-7 Diesel-ElectricLocomotive
Arrangement for organic Rankine cycle system inlocomotive
Arrangement for steam injection system in locomotive
Arrangement of Stirling engine system in locomotive
RBC/Vessel Installation
Installation of RC-I organic Rankine cycle system
on deck of push-pull boat for inland river service
Installation of steam injection cycle system on deck
of push-pull boat for inland river service
Stirling engine system arrangement for marineapplication
Compressor drive expander dimensions for steam
injection cyclePower expander and gearbox dimensions for steam
injection cycle
Beal number as a functio of heater temperature
(after Waiter, 1979)
Conventional V-belt accessory drive
Beal number as a function of heater temperatureshowing Stirling engine design parameters
TECCO reference system power conversion unit (PCU)
7-2
7-3
7-5
7-6
7-8
7-9
7-10
7-12
7-13
7-14
7-16
7-17
7-19
7-20
vii

Table
2.3
4.1
4.2
4.3
4.4
4.5
4.6
4.7
4.8
4.9
4.10
4.11
5.1
LIST OF TABLES
Adiabatic Diesel Engine Design Point Data
Exhaust Pressure Corrections for EnginePerformance
Candidate Bottoming Cycles Evaluated in
Task I Screening
Performance Summary of Adiabatic Diesel Engine with
Organic Rankine Bottoming Cycle
Performance Summary of Adiabatic Diesel Engine with
Steam Rankine Bottoming Cycle
Performance Summary of Adiabatic Turbocompound
Diesel Engine with Steam Injection Between
Compressor Drive and Power Expanders
Performance Summary of Adiabatic Turbocompound
Diesel Engine with Steam Injection Ahead of the
Power Expander
Performance Summary of Adiabatic Diesel Engin e
with Subposed Open Brayton Cycle
Performance Summary of Adiabatic Diesel Engine
with Subposed Open Brayton Cycle
Conditions for Maximum Performance of Closed
Brayton Bottoming Cycle for Adiabatic Diesel
Engine
Performance Summary of Adiabatic Diesel Engine
with Subposed Stirling Cycle
Performance Summary of Adiabatic Diesel Engine
with Subposed Stirling Cycle
Performance Summary of Adiabatic Diesel Engine
with Subposed Stirling Cycle
Evaluation of Candidate Bottoming Cycles
ATCD with Organic Rankine Cycle Using RC-I
Reference Conditions Truck Application)
2-2
2-3
4-4
4-12
4-15
4-20
4-22
4-27
4-33
4-37
4-38
4-41
4-42
5-3
viii
5.2
5.3
5.4
5.5
5.6
5.7
5.8
5.9
5.10
5.11
5.12
5.13
5.14
5.15
5.16
ATCD with Organic Rankine Cycle Using RC-I
(High Temperature Conditions-Truck Application)
ATCD with Organic Rankine Cycle Using RC-I
(Low Temperature Conditions - Truck Application)
Adiabatic Diesel Exhaust Gas Temperature Sensitivity
Analysis for the Turbocharged Engine with Organic
Rankine Bottoming Cycle
ATCD with Organic Rankine Cycle Using RC-I(Reference Conditions-Locomotive Application)
ATCD with Organic Rankine Cycle Using RC-I
(Reference Conditions-Marine Application)
Performance of RC-I Organic Rankine Cyclein Marine Application
ATCPD/A with Steam Injection (Reference Case)
for Truck Application
ATCPD/A with Steam Injection (High Temperature
Case) for Truck Application
ATCPD/A with Steam Injection (Low TemperatureCase) for Truck Application
Adiabatic Diesel Exhaust Gas Temperature Sensitivity
Analysis for the Turbocompound Engine with SteamInjection Ahead of Compressor-Drive Expander
ATCPD/A with Steam Injection (Reference Case)for Marine Application
ATCPD/A with Steam Injection ((Reference Case)
for Marine Application
Mass and Energy Balance for ATCD with Dual Stirling
Engines Using Heat Pipes (Reference Case for Truck
Application)
Mass and Energy Balance for ATCD with Dual Stifling
Engines Using Heat Pipes (High Temperature Case forTruck Application)
Mass and Energy Balance for ATCD with Dual StiflingEngines Using Heat Pipes (Low Temperature Case for
Truck Application)
5-5
5-6
5-7
5-8
5-9
5-10
5-14
5-15
5-16
5-17
5-18
5-19
5-26
5-27
5-28
ix
5.17
5.18
5.19
5.20
5.21
5.22
6.1
6.2
6.3
6.4
6.5
6.6
6.7
6.8
6.9
6.10
Stifling Engine Performance Summary for
Truck Application
Performance of System with Subposed Stirling
Engines for Truck Application
Mass and Energy Balance for ATCD with Stifling
Engines Using Heat Pipes (Reference Case for
Locomotive Application)
Mass and Energy Balance for ATCD with Dual Stirling
Engines Using Heat Pipes (Reference Case for Marine
Application)
Performance of System with Subposed Stirling
Engines for Marine Application
Performance of Selected Systems for Three
Applications
Summary Table Diesel Heat Recovery UnitCharacteristics
Common Organic Rankine Cycle Heat Recovery UnitOverall Characteristics
Common Organic Rankine Cycle Heat Recovery UnitStage Characteristics
Common Steam Injection Cycle Heat Recovery UnitOverall Characteristics
Common Steam Injection Cycle Heat Recovery Unit
Stage Characteristics
Common Stirling Cycle Heat Recovery Unit
Recovery Unit Overall Characteristics
Common Stirling Cycle Heat Recovery Unit
Stage Characteristics
Estimated Price for Heat Recovery Fluid Bed
Organic Rankine
Estimated Price for Heat Recovery Fluid Bed
Steam Injection
Estimated Price for Heat Recovery Fluid Bed
Stirling Engine
5-29
5-30
5-31
5-32
5-33
5-34
6-6
6-9
6-10
6-13
6-14
6-17
6-18
6-19
6-20
6-21
8.1
8.2
8.3
8.4
8.5
8.6
8.7
8.8
8.9
8.10
8.11
8.12
8.13
8.14
8.15
Summary of Rankine Bottoming Cycle Component Costsfor Adiabatic Diesel-Heavy Duty Truck Application
Summary of Rankine Bottoming Cycle Component Costs
for Adiabatic Diesel - Locomotive Application
Summary of Rankine Bottoming Cycle Component Costs
for Adiabatic Diesel - Marine Application
Summary of Steam Injection Cycle Component Costs
for Adiabatic Diesel - Heavy Duty Truck Application
Summary of Steam Injection Cycle Component Costs
for Adiabatic Diesel - Locomotive Application
Summary of Steam Injection Cycle Component Costs
for Adiabatic Diesel - Marine Application
Summary of Stirling Engine Cycle Component Costs
for Adiabatic Diesel - Heavy Duty Truck Application
Summary of Stirling Engine Cycle Component Costs
for Adiabatic Diesel - Locomotive Application
Summary of Stirling Engine Cycle Component Costs
for Adiabatic Diesel - Marine Application
NASA Reference Economic/Operational Data
Diesel Engines
NASA Reference Simple Payback Period Turbocharged +
RC-I Bottoming vs Turbocompound-Aftercooled
Truck Application
NASA Reference Simple Payback Period Turbocharged +
Steam Injection vs Turbocompound-AftercooledTruck Application
NASA Reference Simple Payback Period Turbocharged +
Stifling Engine vs Turbocompound-Aftercooled
Truck Application
NASA Reference Simple Payback Period Turbocharged +
RC-I Bottoming vs Turbocompound-Aftercooled
Locomotive Application
NASA Reference Simple Payback Period Turbocharged ÷
Steam Injection vs Turbocompound-Aftercooled
Locomotive Application
8-2
8-3
8-4
8-5
8-6
8-7
8-8
8-9
8-10
8-13
8-14
8-15
8-16
8-17
8-18
xi
8.16
8.17
8.18
8.19
8.20
BI
B2
FI
F2
GI
G2
NASA Reference Simple Payback Period Turbocharged +
Stirling vs Turbocompound-Aftercooled
Locomotive Application
NASA Reference Simple Payback Period Turbocharged +
RC-I Bottoming vs Turbocompound-Aftercooled
Marine Application
NASA Reference Simple Payback Period Turbocharged +
Steam Injection vs Turbocompound-Aftercooled
Marine Application
NASA Reference Simple Payback Period Turbocharged +
Stirling Engine vs Turbocompound-Aftercooled
Marine Application
Summary of Simple Payback Period (Yrs)
Turboexpander Data for Steam Injection Cycle
Planetary Gearboxes for Steam Injection System
Turbine Data for Organic Rankine Cycle with RC-I
Planetary Gearbox Data for Organic Rankine Cyclewith RC-I
Scaling of Stirling Engines
Planetary Gearboxes for Stirling Engines
8-19
8-20
8-21
8-22
8-23
B-_
B-5
F2
F3
G2
G3
xii

I. SUMMARYANDCONCLUSIONS
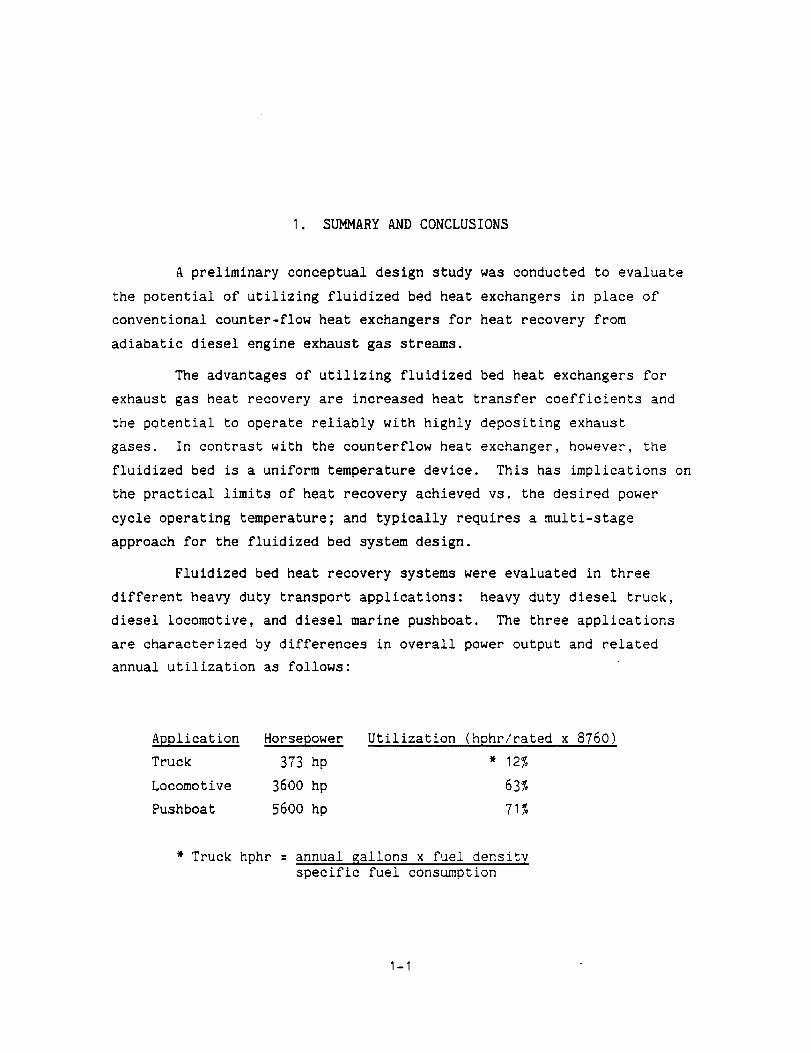
A preliminary conceptual design study was conducted to evaluate
the potential of utilizing fluidized bed heat exchangers in place ofconventional counter-flow heat exchangers for heat recovery from
adiabatic diesel engine exhaust gas streams.
The advantages of utilizing fluidized bed heat exchangers for
exhaust gas heat recovery are increased heat transfer coefficients and
the potential to operate reliably with highly depositing exhaust
gases. In contrast with the counterflow heat exchanger, however, thefluidized bed is a uniform temperature device. This has implications on
the practical limits of heat recovery achieved vs. the desired power
cycle operating temperature; and typically requires a multi-stageapproach for the fluidized bed system design.
Fluidized bed heat recovery systems were evaluated in three
different heavy duty transport applications: heavy duty diesel truck,diesel locomotive, and diesel marine pushboat. The three applications
are characterized by differences in overall power output and relatedannual utilization as follows:
Application Horsepower Utilization (hphr/rated x 8760)
Truck 373 hp * 12%
Locomotive 3600 hp 63%
Pushboat 5600 hp 71%
* Truck hphr = annual _allons x fuel density
specific fuel consumption
I-I

For each application, the exhaust gas source is a turbocharged-
adiabatic diesel core. Representative subposed exhaust gas heat
utilization power cycles were selected for conceptual design efforts
including design layouts and performance estimates for the fluidized bed
heat recovery heat exchangers. The selected power cycles were: Organic
Rankine with RC-I working fluid, Turbocompound Power Turbine with Steam
Injection, and Stlrling Engine.
In general, the heat recovery heat exchanger designs consist of
two stages of fluidized beds with in-bed and above-bed tubes, followed
by a final convective heat exchanger stage. The diesel exhaust gases
enter the first fluid bed stage such that a mode of turbulent fluidiza-
tion is maintained and at a temperature sufficiently high to minimize
sticky soot particle deposits. The second stage fluid bed operates at
lower gas temperature and removal of deposits formed on the heat
exchanger tubes and bed particles is promoted by the churning and
circulating motion of the bed particles. For the maximum heat recovery
desired in power cycle applications, a finned-tube convective section is
needed above the low temperature fluid bed and serves as the final heat
recovery stage.
The subposed Rankine power cycle consisted of a closed loop
system with the RC-I working fluid vaporized in the heat recovery heat
exchanger and expanded through an auxiliary turbine unit that is geared
to the diesel output shaft. The expanded vapor is condensed in a heat
rejection heat exchanger (condenser).
The Turbocompound Power Turbine with Steam Injection power cycle
was an open cycle system with steam generated in the heat recovery heat
exchanger and then injected (mixed) into the exhaust gas stream for
expansion through both the turbocharger turbine and the downstream
turbocompound power turbine. The power turbine is geared to the diesel
output shaft. The power output of both turbines is increased due to the
increased mass flow rate.
I-2

The Stirling Engine power cycle is unique in that the heat
recovery heat exchanger does not include any convective section. Heat
is recovered in a series of two fluidized bed stages; each stage being
coupled to its own dedicated Stirling engine via a heat pipe. The
operating temperature of the two Stirling engines differs according tothe series arrangement of the fluid beds.
For the truck and locomotive applications, the heat rejectionrequired for the Rankine and Stirling systems is accomplished via aircooled heat exchangers (radiators). The considerable amount of water
required for the TurbocompoundPowerTurbine with Steam Injection cycle
is carried in an onboard tank. In the marine pushboat application,river water is utilized to meet cycle cooling requirements as well as
the water supply needs of the steam injection cycle.
The study results indicate that use of an exhaust gas heat
recovery power cycle produces a 5 to 11 percent improvement in specificfuel consumption over that of a reference turbocompound/aftercooled
engine system. The magnitude of the improvement depends on the
particular power cycle configuration.
The fuel economyresults were used in conjunction with capital
cost estimates and fuel price data to determine payback times for the
various cases. These were based on simple payback assumptions withoutconsiderations of maintenance burdens or the cost of money. The results
showa wide range of payback times (1.2 to 15.4 years) depending on the
power cycle and application. For all power cycles, payback was faster
in the marine and locomotive applications than in the truck application.
For the truck application, a specific comparison was madeof the
multi-stage fluidized bed heat recovery system including final convec-
tive stage vs. a conventional counterflow heat exchanger. For equalheat transfer duty, the fluidized bed system was approximately one-thirdlarger, heavier, and more costly. A review of the cost estimatesindicated that approximately two-thirds of the overall cost in the
fluidized bed approach is associated with the final convective stage.
1-3
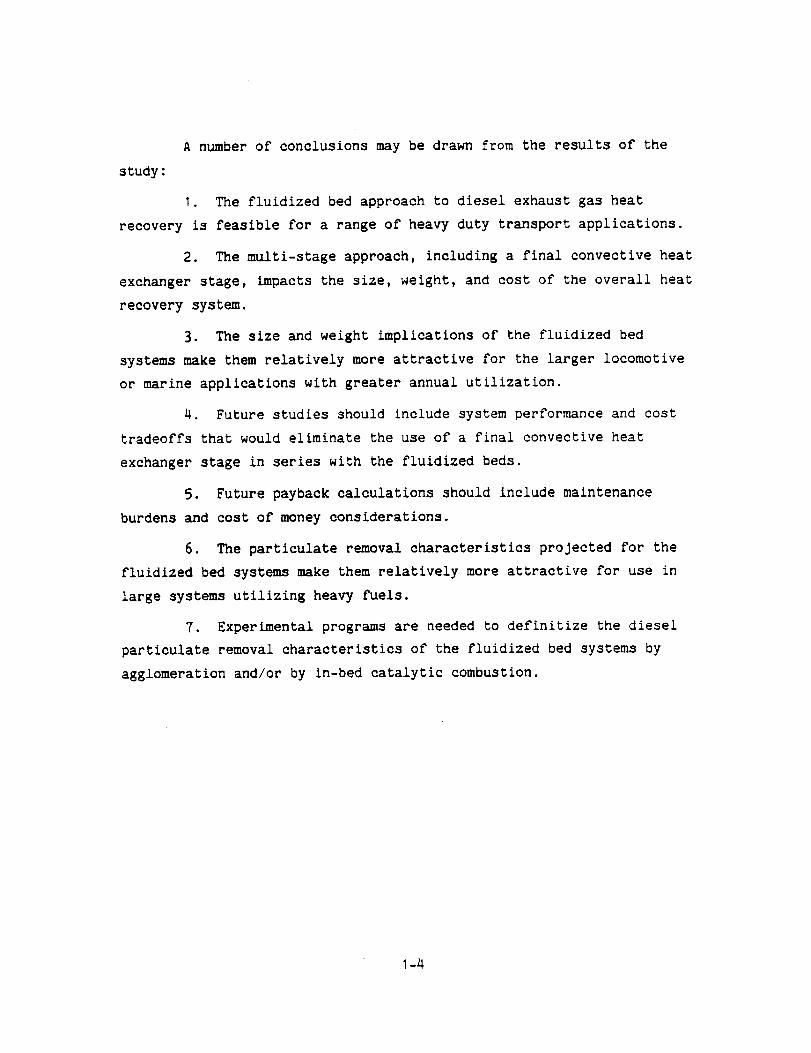
A number of conclusions may be drawn from the results of the
study:
I. The fluidized bed approach to diesel exhaust gas heat
recovery is feasible for a range of heavy duty transport applications.
2. The multi-stage approach, including a final convective heat
exchanger stage, impacts the size, weight, and cost of the overall heat
recovery system.
3. The size and weight implications of the fluidized bed
syste_ make them relatively more attractive for the larger locomotive
or urine applications with greater annual utilization.
4. Future studies should include system performance and cost
tradeoffs that would eliminate the use of a final convective heat
exchanger stage in series with the fluidized beds.
5. Future payback calculations should include maintenance
burdens and cost of money considerations.
6. The particulate removal characteristics projected for the
fluidized bed systenLs make them relatively more attractive for use in
large systems utilizing heavy fuels.
7. Experimental prograa_s are needed to definitize the diesel
particulate removal characteristics of the fluidized bed systems by
agglomeration and/or by in-bed catalytic combustion.
I-4

2. INTRODUCTION
Over the past decade, spurred by significantly increased fuel
costs, the Department of Energy has supported technology efforts fordevelopment of efficient engine systems for heavy duty transport. The
adiabatic diesel engine concept offers substantial improvements inengine efficiency through reduced heat loss. Characteristic of the
adiabatic diesel is an increased exhaust gas temperature that also
affords the opportunity for engine turbocharging and turbocompounding
coupled with exhaust gas heat recovery to further improve fuel economy.Cost effective systems for heat recovery are required however to realize
any commercial benefits of the compoundengine systems.
The purpose of this study is to evaluate the application of a
fluid bed heat exchanger for heat recovery from adiabatic diesel engines.
Various thermodynamic cycles for convecting heat recovered to work are
explored and defined for three specific diesel engine applications; heavy
duty truck, railroad locomotive and marine vessel. For each applicationthree different compoundengine configurations are defined that include
the primary adiabatic diesel coupled with a selected subposed cycle that
utilizes a fluid bed heat exchanger system. The design and operating
parameters of the primary diesel engines (heavy duty truck) were provided
by NASALewis, Table 2.1. NASAalso provided the basis for correctingthe diesel engine performance for changes in exhaust pressure associated
with the application of the subposed cycle, Table 2.2.
Preliminary thermodynamic screening evaluations were conducted
to define attractive candidate subposed cycle configurations, Table 2.3.From these studies and in consultation with cognizant NASAtechnical
personnel, three specific heat recovery systems (Organic Rankine, Steam
Injection and Stirling Engine) were selected for conceptual design and
2-I
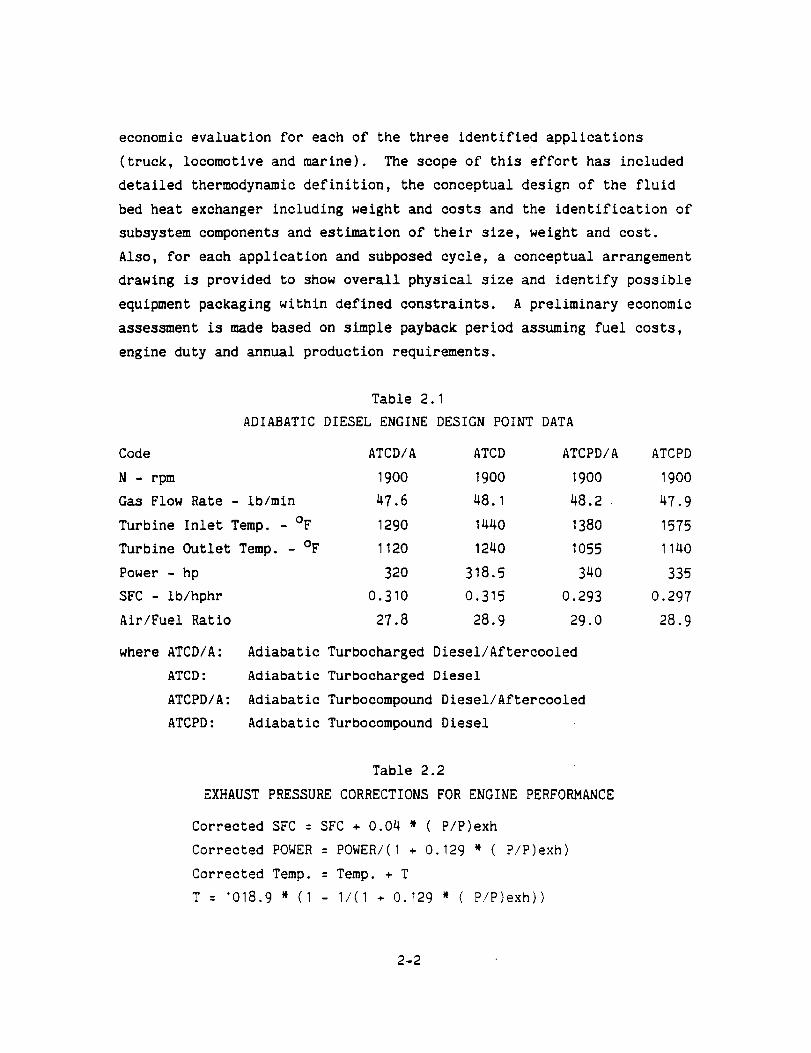
economic evaluation for each of the three identified applications
(truck, locomotive and marine). The scope of this effort has included
detailed thermodynamic definition, the conceptual design of the fluid
bed heat exchanger including weight and costs and the identification of
subsystem components and estimation of their size, weight and cost.
Also, for each application and subposed cycle, a conceptual arrangement
drawing is provided to show overall physical size and identify possible
equipment packaging within defined constraints. A preliminary economic
assessment is made based on simple payback period assuming fuel costs,
engine duty and annual production requirements.
Table 2.1
ADIABATIC DIESEL ENGINE DESIGN POINT DATA
Code ATCD/A ATCD
N - rpm 1900 1900
Gas Flow Rate - ib/min 47.6 48.1
Turbine Inlet Temp. - OF 1290 1440
Turbine Outlet Temp. - OF 1120 1240
Power - hp 320 318.5
SFC - ib/hphr 0.310 0.315
Air/Fuel Ratio 27.8 28.9
where ATCD/A: Adiabatic Turbocharged Diesel/Aftercooled
ATCD: Adiabatic Turbocharged Diesel
ATCPD/A: Adiabatic Turbocompound Diesel/Aftercooled
ATCPD: Adiabatic Turbocompound Diesel
ATCPD/A
1900
48.2
1380
1055
340
0.293
29.0
ATCPD
1900
47.9
1575
1140
335
0.297
28.9
Table 2.2
EXHAUST PRESSURE CORRECTIONS FOR ENGINE PERFORMANCE
Corrected SFC = SFC + 0.04 * ( P/P)exh
Corrected POWER = POWER/(I ÷ 0.129 * (P/P)exh)
Corrected Temp. = Temp. + T
T = 1018.9 * (I - I/(I ÷ 0.129 * (P/P)exh))
2-2
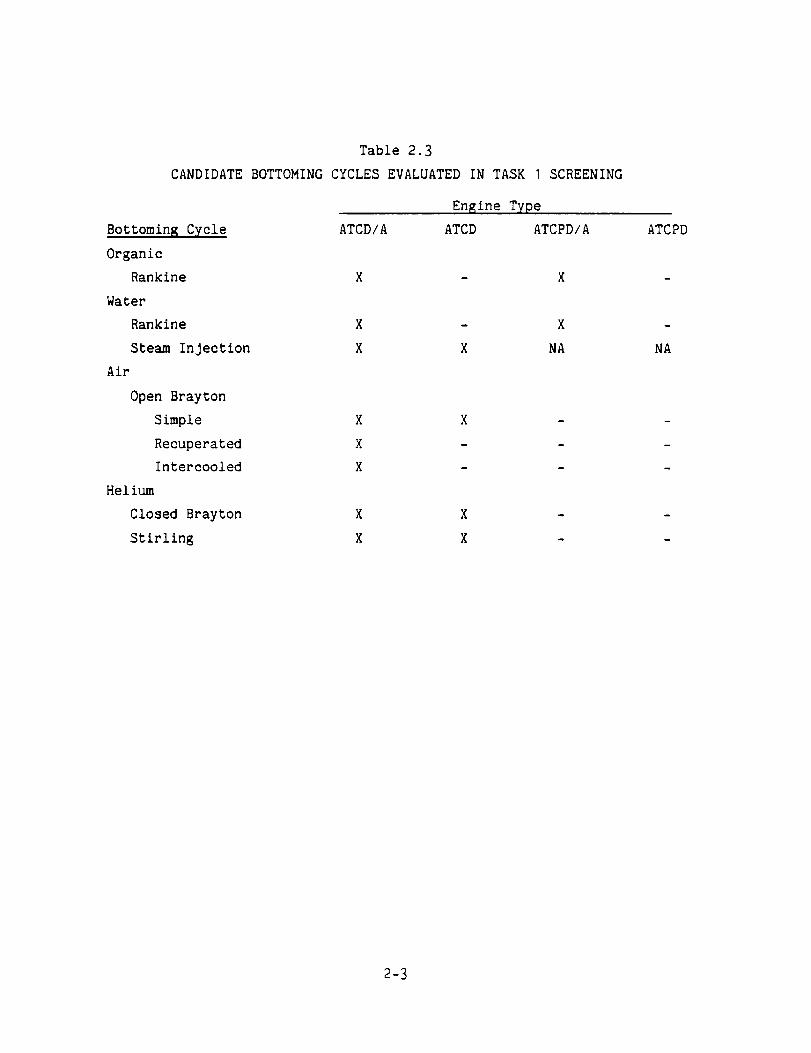
Table 2.3CANDIDATEBOTTOMINGCYCLESEVALUATEDIN TASKI SCREENING
Engine TFpe
Bottoming Cycle ATCD/A ATCD ATCPD/A
Organic
Rankine X -
Water
Rankine X -
Steam Injection X X
Air
Open Brayton
Simple X X
Recuperated X -
Intercooled X -
Helium
Closed Brayton X X
Stirling X X
ATCPD
X
X
NA NA
2-3

3. BACKGROUND
3.1 Diesel Engine Application With Heat Recovery
The application of engine compounding with the adiabatic truck
diesel has been studied for some limited subposed cycles. The Thermo
Electron Corporation(1) has evaluated the organic Rankine cycle using an
RC-I (60 mole percent pentafluorobenzene and 40 mole percent
hexafluorobenzene) working fluid. Their work has included stability
studies of the RC-I fluid at cycle conditions and system design and
economic analysis premised on a 300 horsepower reference diesel engine.
The heat recovery unit consisted of a separate vapor generator and
condenser-regenerator modules. Subsystem components including the feed
pump, turbine expander, filters, boost pump and gearbox were identified,
sized and costed. This study has served as a primary reference and
comparison where the vapor generator is replaced with the fluid bed heat
exchanger unit. Reference 2 summarizes the economic findings from
current program studies that featured subposing Rankine and Brayton
cycles with the reference truck diesel engine but using other than fluid
bed heat exchanger systems. These screening studies indicate that
improved fuel economy can be realized but that these power cycles may
not be competitive on an economic payback basis.
Most of the railroad locomotives used in the United States today
are powered by turbocharged Diesel engines. Reference 3 is a study
evaluating alternative fuels and engines for railroad locomotives. As
part of this study, two diesel base engines of 3000 hp are evaluated for
costs and fuel economy. These reference engines are compared with other
diesel alternatives including two adiabatic engine cases with
turbocompounding that used either the Stirling or Rankine subposed cycle
heat recovery. It is concluded that if the adiabatic diesel engine can
3-I
be adapted to locomotive service, the fuel savings will be impressive
{26%) and that the addition of the bottoming cycle further enhances fuel
economy. Annualized life cycle cost comparisons were made but involved
alternative fuels that did not permit a direct comparison with the
standard locomotive diesel engine.
A third study (Reference 4) used as a primary reference in the
current work describes the application of a Rankine bottoming cycle to a
5600 hp marine diesel engine. The study includes a preliminary design
of the bottoming cycle, performance projections, diesel engine interface
and power coupling options, component and system costs, preliminary
economics and market assessment and a demonstration program plan. This
study projects significant economic and fuel saving benefits utilizing
the Rankine Bottoming Cycle (RBC) in marine push-tow boat industry. It
was identified that the only major obstacles to RBC implementation on
some ships are its large weight and space requirements.
3.2 Fluidized Bed Characteristics in Heat Recovery Applications
Fluidized beds display several characteristics making them
uniquely suitable for dirty, corrosive, high-temperature, fouling gas
heat recovery applications:
(I) fluidized beds promote very high heat transfer coefficients
to heat transfer surfaces i_ersed in them
(2) their high rates of thermal mixing protect tube materials
from excessively high metal temperatures experienced at the hot end of
many high-temperature heat recovery applications
(3) proper selection of particle characteristics and operating
conditions can result in a self-cleaning behavior for tube deposits
(4) some depositing gases, diesel exhausts being prime
examples, will form flaky deposits on bed particles and tubes that drop
off, retaining a relatively large, agglomerated form suitable for
efficient downstream collection
3-2

(5) gas cleaning functions can be integrated into the fluid bed
heat recovery by the addition of appropriate sorbents, getters andcatalyst particles or other reactants to the bed
(6) their high rates of thermal mixing means that in some
applications where the working fluid temperature approaches the hot gastemperature either staging of the fluid bed or the use of a convective
heat recovery section is required
(7) fluid beds can be arranged in a variety of staged
configurations yielding efficient heat recovery.
The physics of fluidization has been a topic of great academicand industrial activity over the past 50 years and much fundamental andpractical information is now available. The nature of fluidized beds
has been closely related to the behavior of gas voids passing throughthe bed and the motion that these voids impart to the particles in the
bed. The high rates of particle mixing, the high rates of heat transfer
to objects immersedin a fluid bed, the nature of gas and particle
contacting, particle elutriation, particle attrition, and manyother
features of fluidized beds have been correlated to the bubbling nature
of the bed. In turn, the bubbling nature relates directly to the
properties of the particles and the gas, and, to a smaller extent, tothe vessel and its internals design. Nonetheless, the design of
industrial fluidized beds, a technology widespread in the process
industries, is still largely empirical and is hindered by a variety ofuncertainties. The greatest uncertainties relate to the scaleup of
fluid bed processes from laboratory scale equipment to commercial scaleequipment. In the diesel heat recovery application under consideration
in this program the scaling factor for the available design basis isquite small and scaleup is not a major problem.
In the specific area of heat recovery, fluidized beds have been
under consideration for manyapplications, and somecommercial fluid bed
heat recovery systems are being marketed. Applications for stationary
waste heat recovery, waste heat disposal, thermal energy storage, and
3-3
solids heating or cooling have been proposed or are under development.
For example, highly fouling liquid fluidized bed heat exchangers have
been successfully applied and look promising for many difficult
applications. (5)
High-temperature, stationary fluid bed heat recovery development
has been proceeding under DOE support of both the Thermal Electron
Corporation and Aerojet Liquid Rocket Company. The Thermal Electron
Corporation fluid bed concept uses two very shallow fluid bed stages,
one to remove high-temperature heat from the waste stream and the other
to preheat combustion air. (6) The fluid bed particles are mechanically
circulated between the two beds and no internal heat transfer surfaces
are placed in the beds. The AeroJet fluid bed heat recovery system uses
a relatively deep bed containing a row of horizontal finned tubes. (6,7)
A brush system is used to clean the underside of the distributor plate
of deposits, as in the commercial Stone-Platt technology. The largest
technical hurdle for both of these high-temperature applications seems
to be the fabrication of an economical distributor plate for the high-
temperature environment.
A two-stage, shallow fluid bed heat recovery unit (a Stone-Plait
unit) was evaluated for use with diesel engine exhaust gases by the
United Technologies Research Center under DOE sponsorship. (8,9) _o
testing was performed under actuaidiesel exhaust conditions.
Commercially, the Stone-Platt Fluidfire Company (UK) appears to be the
world leader in fluid bed heat recovery. (I0,11) Two U.S. companies,
Granco Equipment Company, Grand Rapids, Michigan and Fennell Corporation,
Harvey, Illinois are licensees for the technology. The Fluidfire units
are stationary units of multiple shallow bed design with internal heat
transfer surface. The Econo-Therm Corporation also markets a fluid bed
heat recovery unit based on raining fluid bed technology, requiring no
heat transfer surface, but requiring continuous circulation of solids
between two vessels. (12) Related technology development in fluidized
bed combustion and other fluidized bed heat transfer applications have
3-4
provided somevaluable input for stationary heat recovery systemdevelopment.
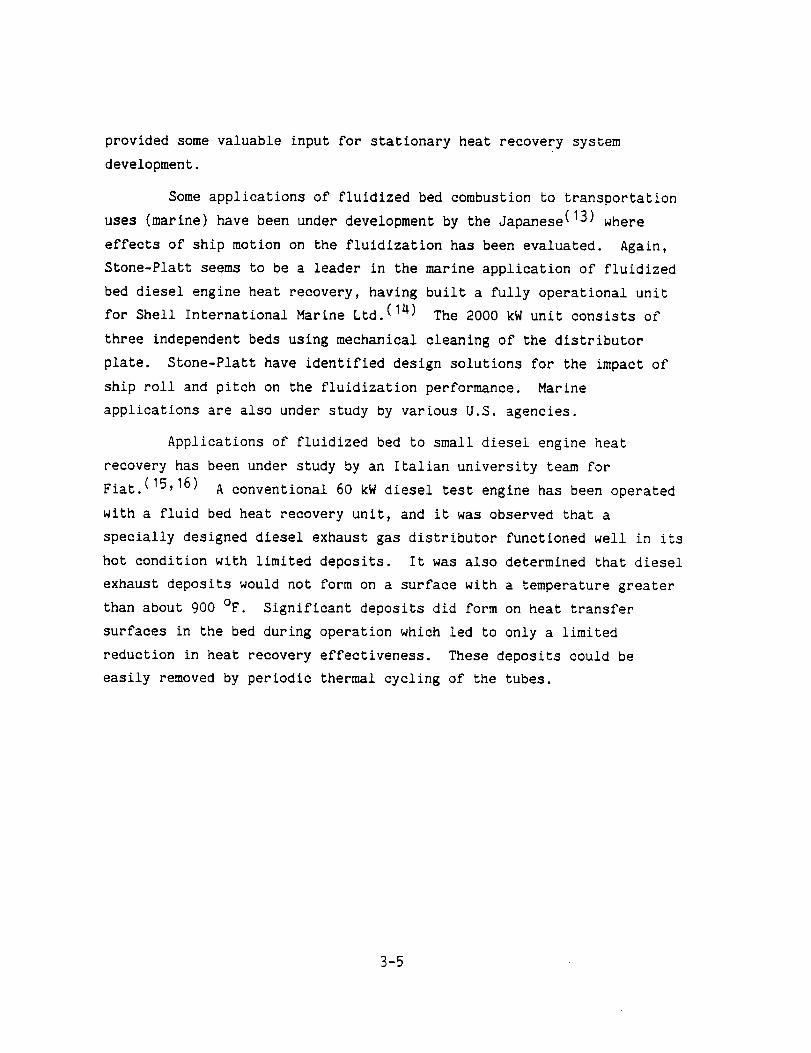
Someapplications of fluidized bed combustion to transportationuses (marine) have been under development by the Japanese(13) where
effects of ship motion on the fluidization has been evaluated. Again,Stone-Platt seems to be a leader in the marine application of fluidized
bed diesel engine heat recovery, having built a fully operational unitfor Shell International Marine Ltd. (14) The 2000 kWunit consists of
three independent beds using mechanical cleaning of the distributor
plate. Stone-Platt have identified design solutions for the impact of
ship roll and pitch on the fluidization performance. Marine
applications are also under study by various U.S. agencies.
Applications of fluidized bed to small diesel engine heat
recovery has been under study by an Italian university team forFiat. (15,16) A conventional 60 kWdiesel test engine has been operated
with a fluid bed heat recovery unit, and it was observed that a
specially designed diesel exhaust gas distributor functioned well in its
hot condition with limited deposits. It was also determined that diesel
exhaust deposits would not form on a surface with a temperature greaterthan about 900 oF. Significant deposits did form on heat transfer
surfaces in the bed during operation which led to only a limited
reduction in heat recovery effectiveness. These deposits could beeasily removedby periodic thermal cycling of the tubes.
3-5


4. COMPOUND ENGINE CONFIGURATION SCREENING
Cycle screening evaluations were carried out on the following
adiabatic diesel compound engine configurations
o Organic Rankine cycle
o Steam Rankine cycle
o Turbocompound with steam injection
o Open Brayton cycle
o Closed Brayton cycle
o Stifling engine
The results of these screening tests are presented in the following
text.
4.1 Organic Rankine Cycle
4.1.1 FLUORINAL-85 (F-85) Working Fluid
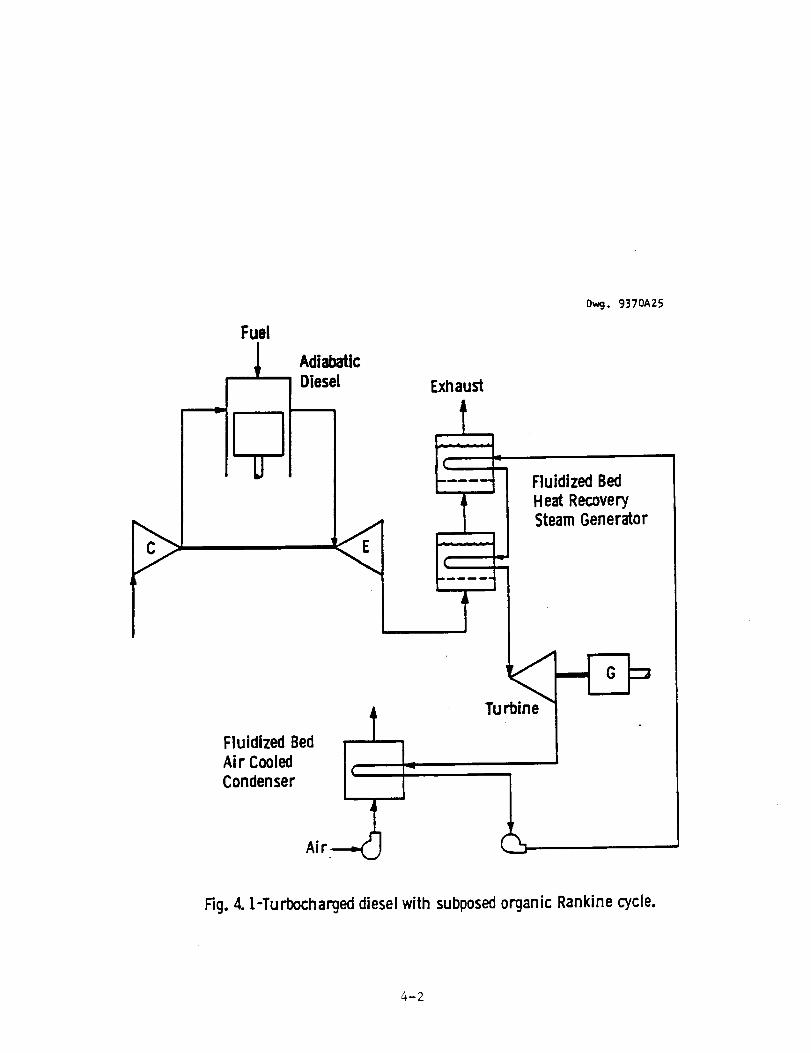
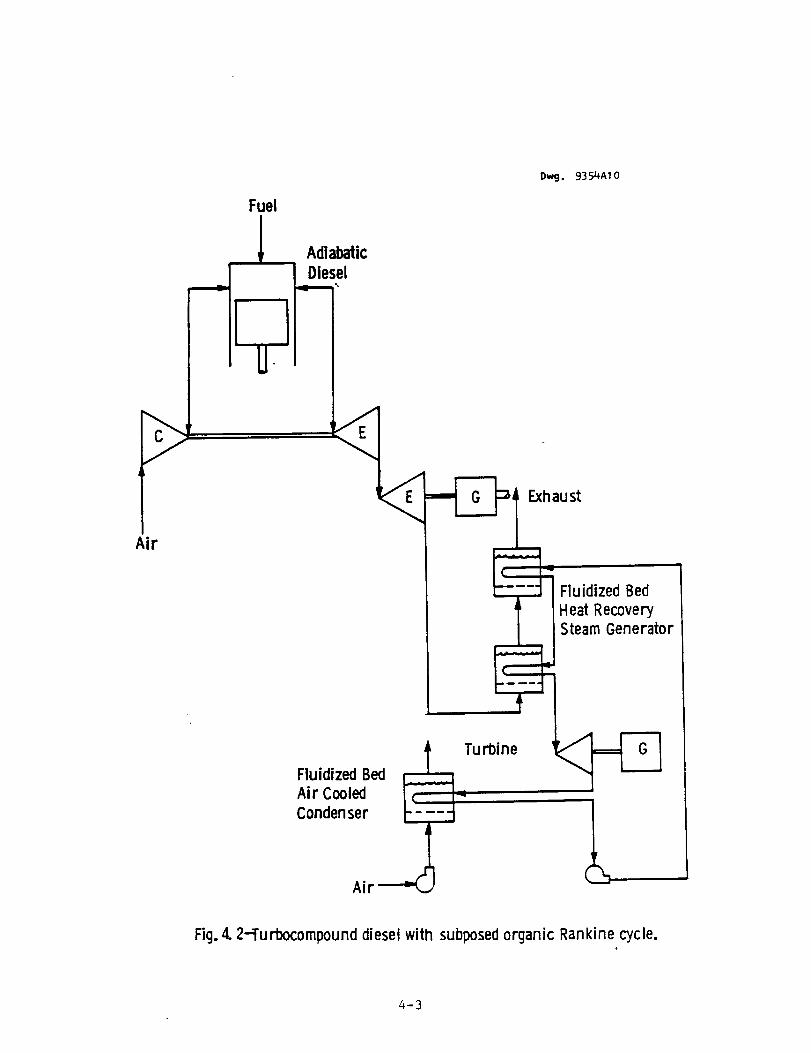
A series of preliminary performance calculations were made for
organic Rankine bottoming cycles to determine the effect of throttle
conditions, regenerative feedheating, and adiabatic engine configuration
with FLUORINAL-85 (F-85) as the working fluid. Figures 4.1 and 4.2 show
cycle schematics. The results of these calculations are summarized by
the first four cases given in Table 4.1. These results indicate that
the ATCPD/A engine configuration (Case 4) with throttle conditions
corresponding to the maximum recommended working temperature of F-85,
i.e. 600°F, and regenerative feedheating would give the best system
performance.
4-I
Fuel
AdiabaticDiesel
Fluidized Bed
Air Cooled
Condenser
Air-_
Dwg. 9370A25
Exhaust
Fluidized Bed
Heat RecoverySteam Generator
Fig. 4. 1-Turbocharged diesel with subposed organic Rankine cycle.
_-2
Air
Dwg. 93 54A1 0
Fuel
1
II
U
Adiabatic
Diesel
' IHeat Recovery r
Condenser _
Air -_'_-/
Fig. 4. 2-Turbocompound diesel with subposed organic Rankine cycle.
4-3
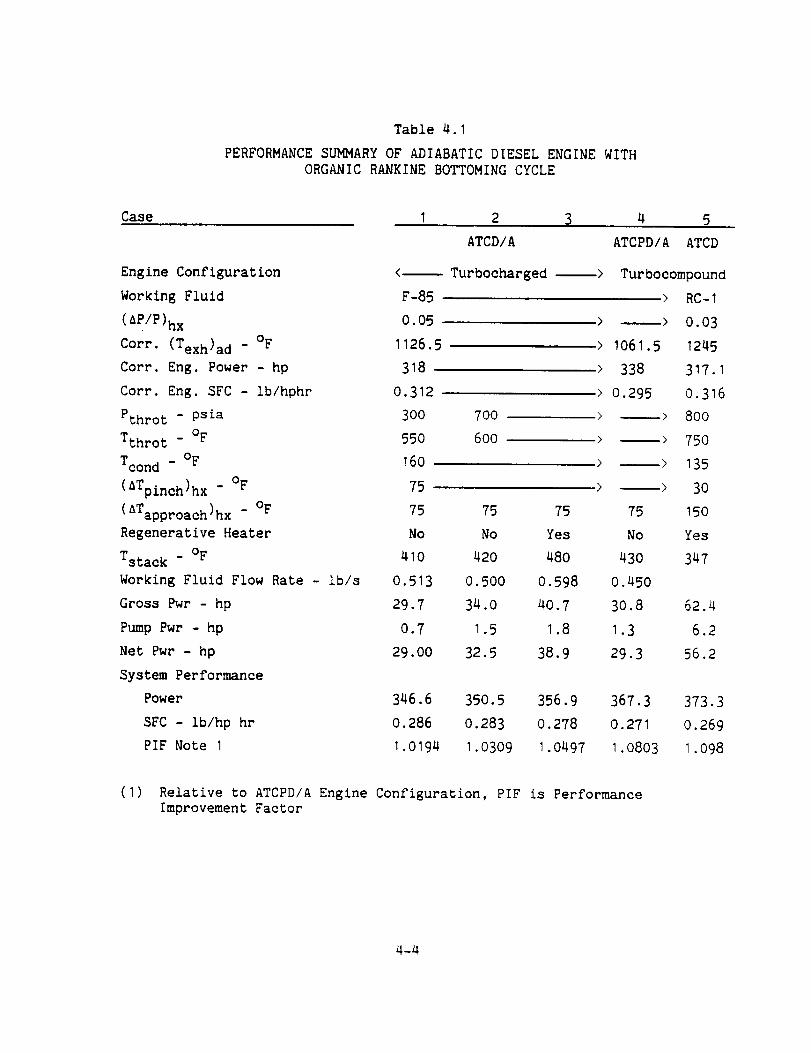
Table 4.1
PERFORMANCE SUGARY OF ADIABATIC DIESEL ENGINE WITHORGANIC RANKINE BOTTOMING CYCLE
Case I 2 3 4 5
Engine Configuration
Working Fluid
(_P/P)hx 0.05
Corr. (Texh)ad - OF 1126.5
Corr. Eng. Power - hp 318
Corr. Eng. SFC - Ib/hphr 0.312
Pthrot - psia 300 700
oFTthro t - 550 600
Tcond - OF 160
(ATpinch)hx - OF 75
(ATapproach)hx - OF 75
Regenerative Heater No
Tstac k - OF 410
Working Fluid Flow Rate - ib/s 0.513
Gross Pwr - hp 29.7
Pump Pwr - hp 0.7
Net Pwr - hp 29.00
System Performance
Power
SFC - ib/hp hr
PIF Note I
ATCD/A
<-- Turbocharged -->
F-85
75 75
No Yes
42O 48O
o.5oo o.598
34.0 4O. 7
I.5 I.8
32.5 38.9
ATCPD/A ATCD
Turbocompound
> RC- I
> --> 0.03
> 1061.5 1245
> 338 317. I
> 0.295 0.316
> --> 800
> --> 750
> --> 135
> --> 30
75 15O
No Yes
430 347
o.45o
30.8 62.4
I.3 6.2
29.3 56.2
346.6 350.5 356.9 367.3 373.3
0.286 0.283 0.278 0.271 0.269
1.0194 1.0309 1.0497 1.0803 1.098
(I) Relative to ATCPD/A Engine Configuration, PIF is PerformanceImprovement Factor
4-4

In all of these four cases, two stages of fluidized bed were
used. As indicated in Section 3, deposition problems in the distributor
plate of the second bed are expected to be minimized if the temperature
of the first bed is maintained equal to or greater than 900°F. The
temperature profile for the Case 3 cycle conditions with a first stage
bed temperature of 900°F (AT approach = 300°F) and a ATpinc h = 75 is
shown in Figure 4.3. This gives a stack temperature of 530°F. The
actual Case 3 temperature profile is shown in Figure 4.4 where no
constraint is placed on the first bed temperature and the ATpinc h and
ATapproach are both 75°F. The resultant stack gas temperature is
480°F. This shows that the organic Rankine subposed cycle system
performance is significantly affected by the e 900°F constraint on the
first bed temperature.
4.1.2 RC-I - Working Fluid
Performance calculations were also made for a subposed organic
Rankine cycle using RC-I (60 mole percent pentafluorobenzene and 40 mole
percent hexafluorobenzene) as the working fluid. RC-I, which has a
maximum recommended working temperature of 750°F, was used by the Thermo
Electron Corporation in Reference I. In addition it was determined that
the use of a convective third stage in the heat exchanger would
eliminate the performance penalty imposed by the _900°F constraint on
the temperature of the first bed in the two stage design.
The design conditions and the performance of the RC-I cycle with
two fluidized bed stages a_d a convective third stage are shown in Case 5
of Table 4.1. The profile of the heat exchanger is shown in Figure 4.5.
The ATCD engine configuration was used to match the conditions used by
TECO in Reference I. The performance which results is only slightly
better than Case 4 with engine configuration ATCPD/A and no regenerative
feedheater. This indicates that the performance with F-85 working
fluid, engine configuration ATCPD/A, a regenerative feedheater, and a
two-stage fluidized bed heat exchanger with the first stage bed
temperature equal to 900°F might be competitive with RC-I working fluid,
4-5

14oo
1200
I000iJ_0
-,= 8OO
_- 600
4OO
3O5
200
00
I I
Pthrot =700 psia
Tthrot = 600°F
Tcond= 160OF
ATpinch =75='FHighTemp. BedTemp.
Jf
f
440.50F
LT. Bed
LMTD = 128
I I0.2 0.4
= _OOF
H.T.Bed
LMTD: 334° F
0.6 0.8Fraction HeatTransferred
1.0
Fig. 4. 3-Fluidized bedheat exchangertemperature profile, organic Rankinecycle wffh regenerative feedheating
"-6
Curve 7491 01-A
1400
1200
IOO0
800
6OO
4OO
3O5
2OO
00
Pthrot = 700psi
Tthrot = 6OO°F
Tcond = 160OF
L_Tpinch =750FApproach = 75°F
4zlO.5OF
6750F
LT. Bed
125=,F
H.T.Bed
LMTD = 181OF
0.2 0.4 0.6 0.8Fraction HeatTransferred
1.0
Fig. 4. 4-Fluidized bedheat exchangertemperature profile, organic Rankinecycle with regenerative feed heating
1126.5°F
6OOOF
_-7

tJ_O
L.
L_
EI--
1400-
1200-
I000-
80O
600
I I I
Engine Conf. - ATCDWorking Fluid - RC-1
TStack = _4"/°F
ATpinch = _PF
ATApproach = 150°F
//
//
// 587°F
Curve 7b,91 O3-A
I
II
/I /I /
/I /I /
I//
1244.5°F
900°F
750°F
4O0
317
2OO
00
I
I
IConv. HX J
"D= I79OFi
]
0.2
IIII
L.T. Bed ILMTD=79°F I
II!1
0.4 0.6
H.T. BedI.MTD= 233OF
Fraction HeatTransferred
10.8 LO
Fig. 4. 5---F1uidizedbedheat exchangertemperature profile, organic Rankine cycle
:+-8
engine configuration ATCD, a regenerative feedheater, and the three
stage heat exchanger.
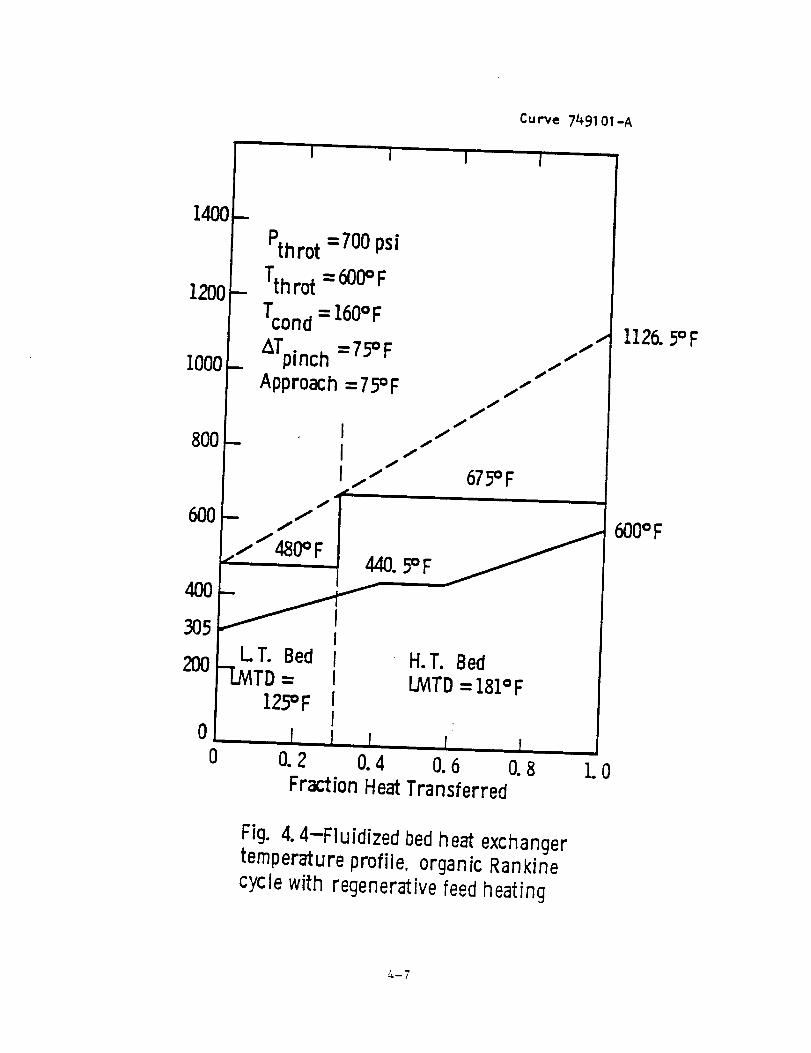
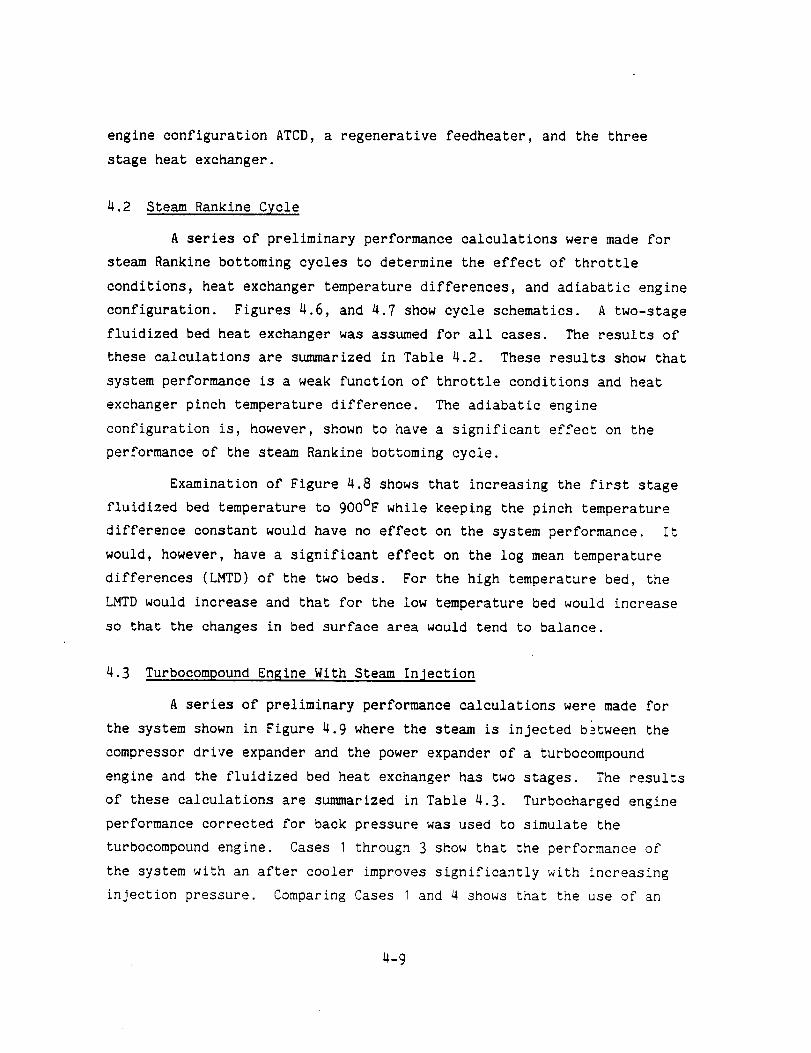
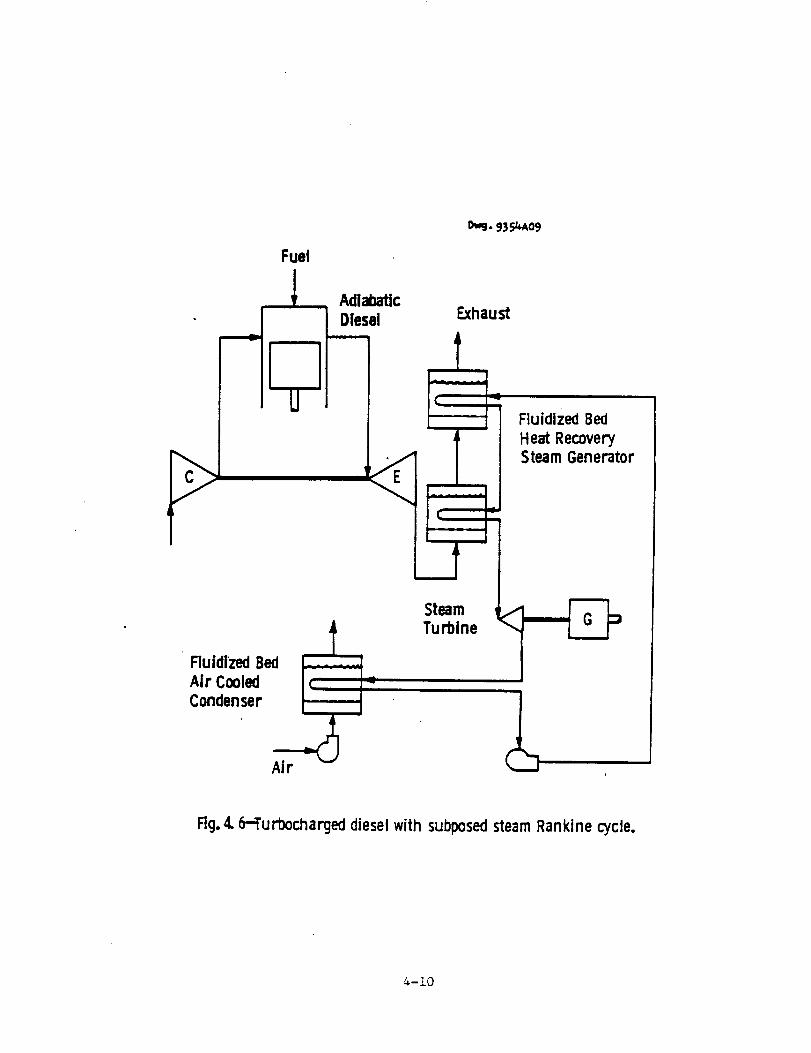
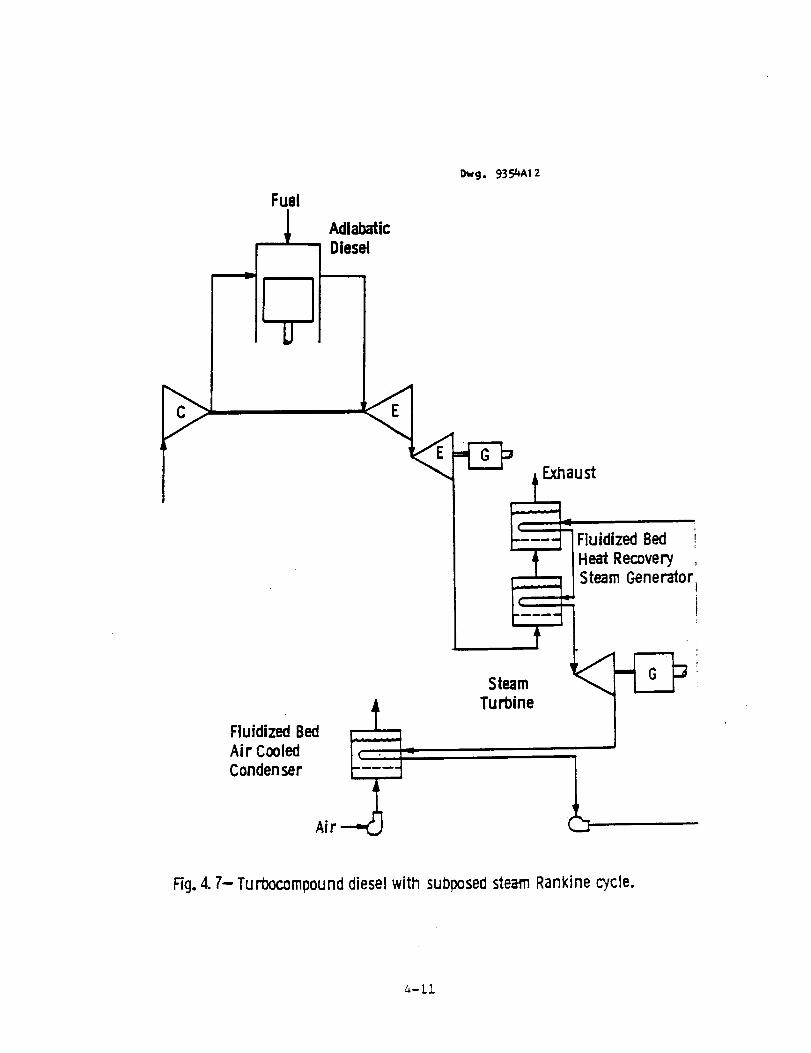
4.2 Steam Rankine Cycle
A series of preliminary performance calculations were made for
steam Rankine bottoming cycles to determine the effect of throttle
conditions, heat exchanger temperature differences, and adiabatic engine
configuration. Figures 4.6, and 4.7 show cycle schematics. A two-stage
fluidized bed heat exchanger was assumed for all cases. The results of
these calculations are summarized in Table 4.2. These results show that
system performance is a weak function of throttle conditions and heat
exchanger pinch temperature difference. The adiabatic engine
configuration is, however, shown to have a significant effect on the
performance of the steam Rankine bottoming cycle.
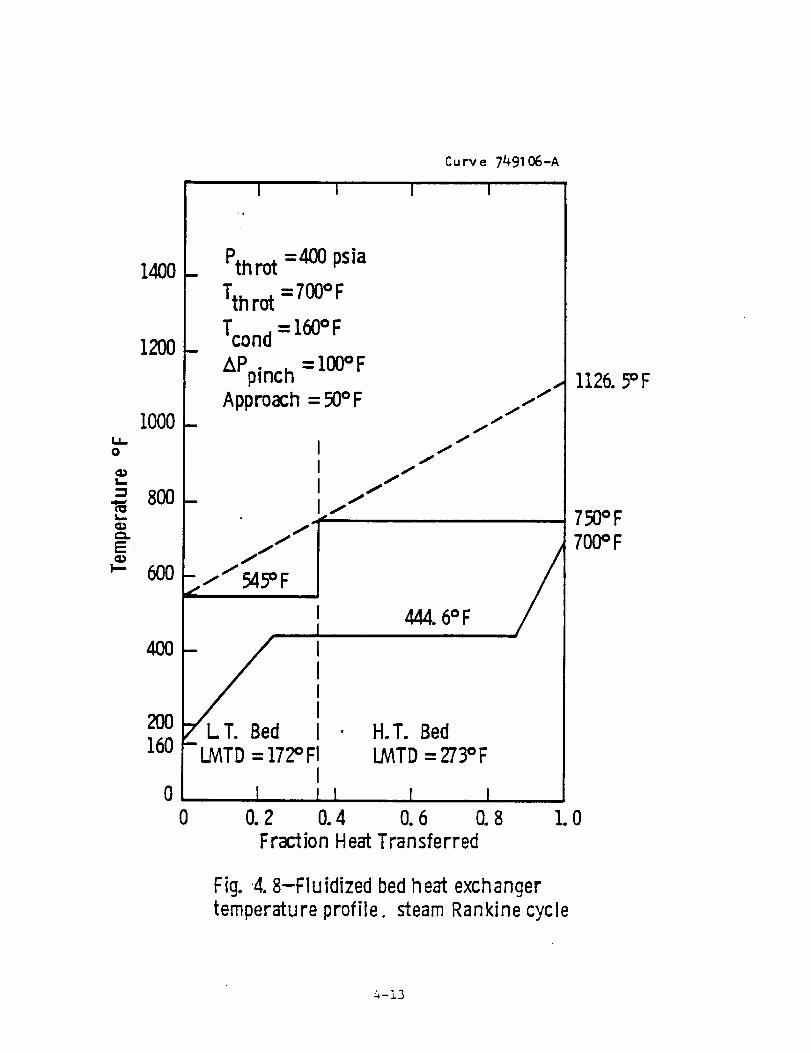
Examination of Figure 4.8 shows that increasing the first stage
fluidized bed temperature to 9OO°F while keeping the pinch temperature
difference constant would have no effect on the system performance. It
would, however, have a significant effect on the log mean temperature
differences (LMTD) of the two beds. For the high temperature bed, the
LMTD would increase and that for the low temperature bed would increase
so that the changes in bed surface area would tend to balance.
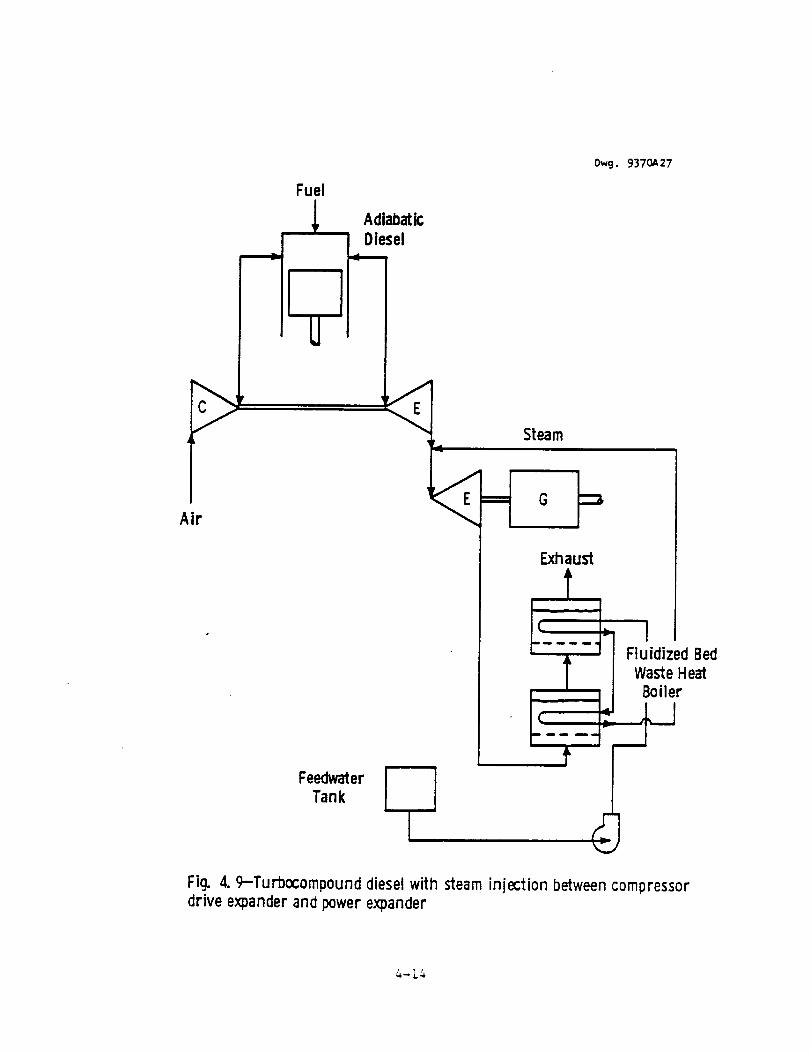
4.3 Turbocompound Engine With Steam Injection
A series of preliminary performance calculations were made for
the system shown in Figure 4.9 where the steam is injected b_tween the
compressor drive expander and the power expander of a turbocompound
engine and the fluidized bed heat exchanger has two stages. The results
of these calculations are summarized in Table 4.3. Turbocharged engine
performance corrected for back pressure was used to simulate the
turbocompound engine. Cases I through 3 show that the performance of
the system with an after cooler improves significantly with increasing
injection pressure. Comparing Cases I and 4 shows that the use of an
4-9
D_j. 935_A09
Fuel
Adiabatic
Diesel Exhaust
SteamTurbine
Fluidized Bed
AI_cooi_ I_
Condenser _.___
Air
Fluidized Bed
Heat RecoverySteam Generator
Rg. 4. 6-Turbocharged diesel with subposed steam Rankine cycle.
4-10
Fuel
Fiuidized Bed
Air CooledCondenser
Air
OwcJ. 93._A1 2
AdiabaticDiesel
Exhaust
_ FH]eUiatdil_ecoBveedr
--2Ficj. 4. 7- Turbocompound diesel with subposed steam Rankine cycle.
4-11

Table 4.2
PERFORMANCE SUMMARY OF ADIABATIC DIESEL ENGINE WITH
STEAM RANKINE BOTTOMING CYCLE
Case
Engine Confirguation
(nP/P)hx
(Texh)ad - oF
Corr. Eng. Power - hp
Corr. Eng. SFC - ib/hp hr
Pthrot - psia
Tthro t - oF
Tcond - oF
(ATpinch)hx - oF
Approach - OF
Tstac k - oF
Steam Flow Rate - ib/s
Gross Power - hp
Pump Power - hp
Net Power - hp
System Performance
Power - hp
SFC - ib/hp hr
PIF, Note I
I 2 3 4 5
ATCD/A > > > ATCPD/A
0.05 > > > >
1126.5 > > > 1061.5
318.0 > > > 338.0
0.312 > > > 0.295
200 300 > 400 300
900 800 > 700 800
160 160 > > >
150 150 100 > 150
50 > > > >
532 567 517 545 567
O.0934 O.0933 0.0998 0. I000 0.0819
33.5 33. I 35.4 34.8 29. I
0.2 0.2 0.2 0.3 0.2
33.3 32.9 35.2 34.5 28.9
351.3 350.9 353.2 352.5 366.0
0.282 0.283 0.281 0.282 0.272
1.105 1.104 1.111 1.109 1.0792
(I) Relative to ATCPD/A Engine C_nfiguration, PIF is Performance ImprovementFactor
4-12
EL_O
L.
E
I---
1400 -
1200-
i000 -
800-
6OO
4OO
2OO160
00
I I I
Curve 7491 06-A
I
Pthrot =400 psia
Tthro t =7OO°F
Tcond = 160OF
Appinc h =100°F
Approach = 50°F
f
f
I 444.6:F
III
IL T. Bed I • H.T. Bed
I..MTD= 172° Fi LMTD = 273°FIII 1 I
0.2 0.4 0.6 0.8FractionHeatTransferred
J
1126. _'F
750°F700°F
1.0
Fig. 4. 8-Fluidized bed heat exchangertemperature profile, steam Rankine cycle
4-13
Adiabatic
Diesel
Owg. 9370A27
A ir
P_
Steam
Exhaust
Ftuidized BedWaste Heat
Boiler
FeedwaterTank
Fig. 4. 9---Turbocompound diesel with steam injection between compressordrive expander and power expander
4-14
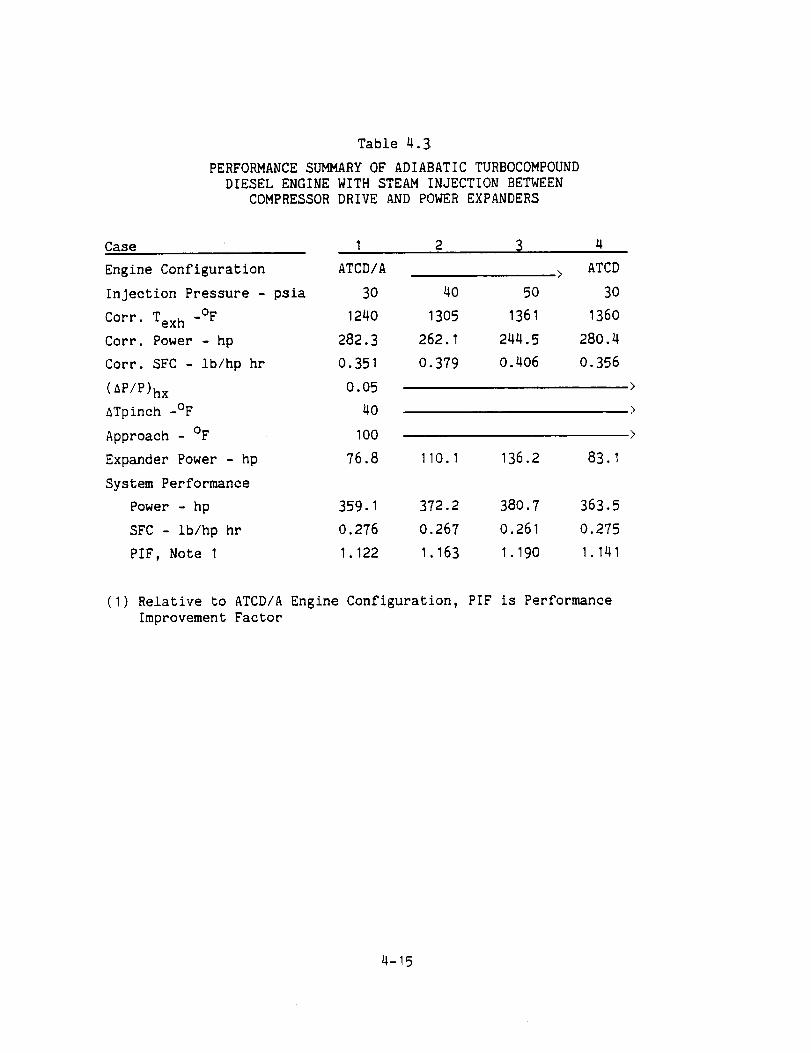
Table 4.3
PERFORMANCE SUMMARY OF ADIABATIC TURBOCOMPOUND
DIESEL ENGINE WITH STEAM INJECTION BETWEEN
COMPRESSOR DRIVE AND POWER EXPANDERS
Case I 2 3 4
Engine Configuration ATCD/A
Injection Pressure - psia 30 40 50
Corr. Tex h -OF 1240 1305 1361
Corr. Power - hp 282.3 262.1 244.5
Corr. SFC - ib/hp hr 0.351 0.379 0.406
(AP/P)hx 0.05
ATpinch -OF 40
Approach - OF 100
Expander Power - hp 76.8 110.1 136.2
System Performance
Power - hp 359.1 372.2 380.7
SFC - Ib/hp hr 0.276 0.267 0.261
PIF, Note I 1.122 1.163 1.190
> ATCD
3O
1360
280.4
0.356
83. I
363.5
0.275
1.141
(I) Relative to ATCD/A Engine Configuration, PIF is Performance
Improvement Factor
2-15

after cooler on the turbocompoundengine has a negligible effect on theperformance.
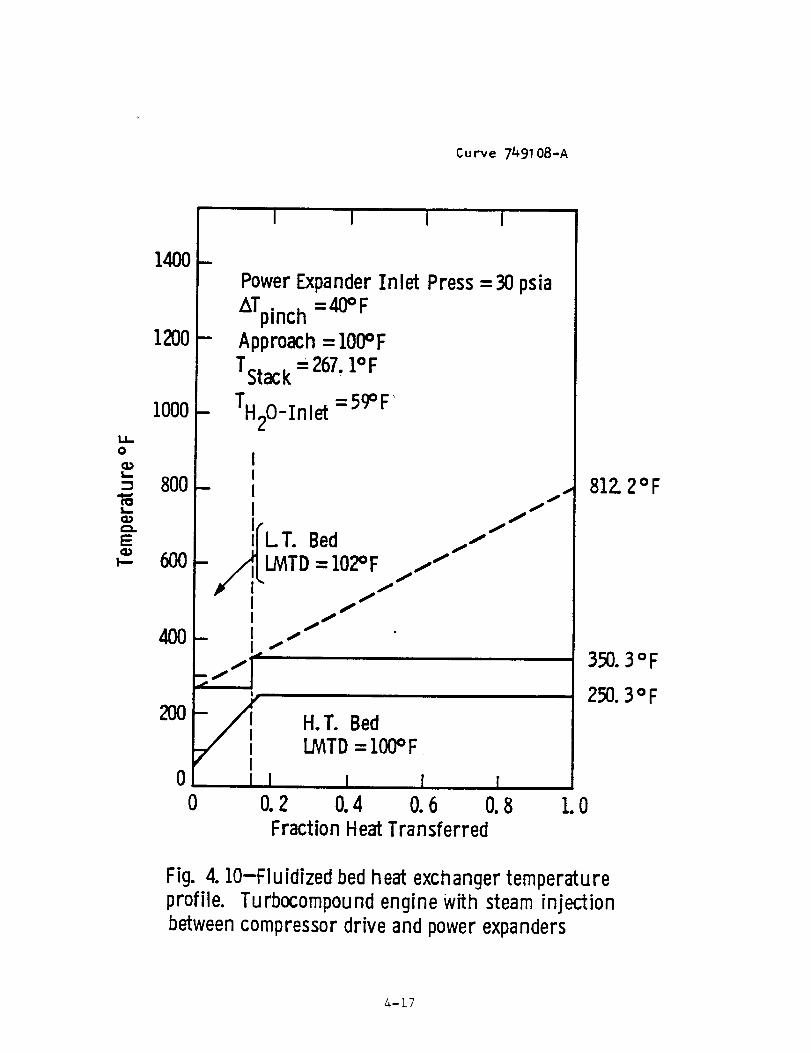
The heat exchanger temperature distribution for Case I is shown
in Figure 4.10. It should be noted that the exhaust temperature fromthe power expander is somewhatbelow the recommended minimum value
(9OO°F) for the first fluidized bed and the first bed temperature is
substantially below that value. It was found, however, that the system
performance was not significantly affected by either the At pinch or the
At approach of the heat exchanger.
A series of calculations were also made for the system shown in
Figure 4.11 where the steam is injected ahead of the compressor drive
expander of the turbocompound engine. The performance model of the
turbocompound engine without steam injection shown in Figure 4.12 was
used as the basis for these calculations. The exhaust conditions from
the adiabatic diesel cylinder were held constant and the compressor
drive expander outlet pressure was varied to match the compressor power
requirements. The results of these calculations are summarized in
Table 4.4. Comparison of Cases i and 2 show that the system performance
is a moderate function of the compressor-drive and power expander's
efficiency. Comparing Cases 1 and 3 shows that the performance is a
weak function of the At pinch.
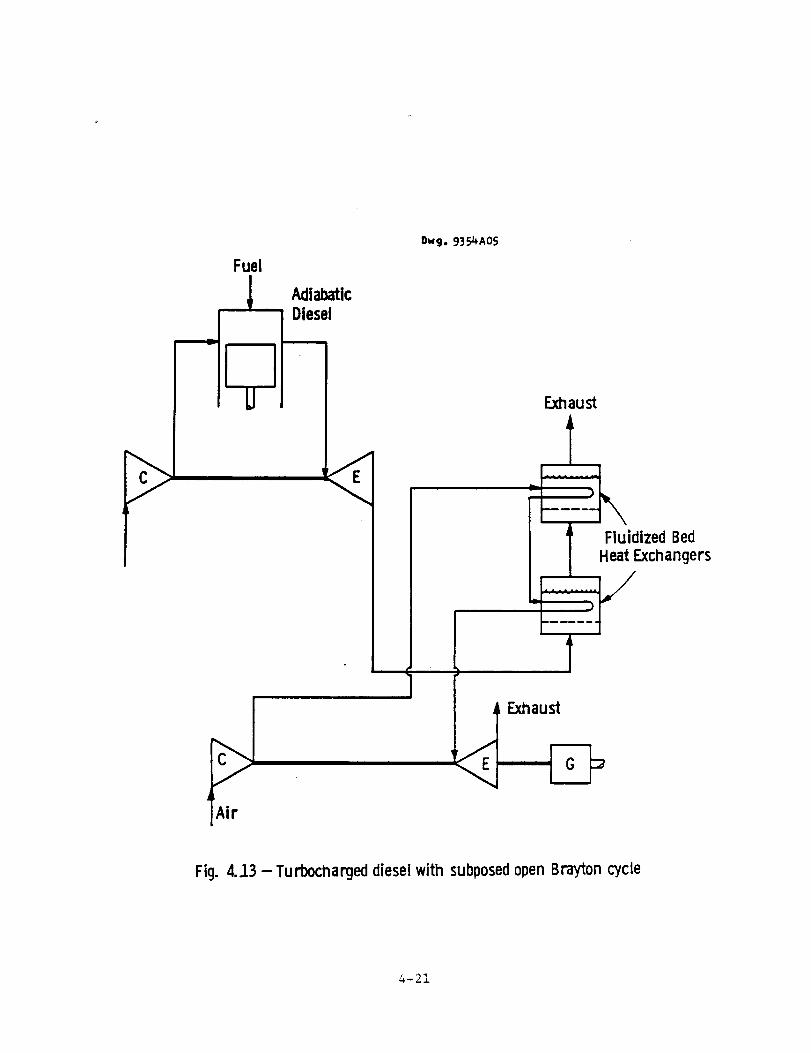
4.4 Open Brayton Cycle
A series of preliminary performance calculations were made for a
variety of open Brayton bottoming cycle configurations. Figure 4.13
shows the simple open Brayton cycle without intercooling or recuperation
and Table 4.5 summarizes its performance. Parameters evaluated include
compressor pressure ratio, expander inlet temperature, adiabatic engine
configuration, and heat'exchanger temperature differences. None of
these parameters over the range evaluated were found to have significant
effects on performance.
4-16
Curve 7491 08-A
ILO
(Dt_
!,..
E
1400-
1200-
1000-
800 -
II
400- tL
|
20O -/
0 I0
I I 1 I
PowerExpander Inlet Press = 30 psia
ATpinch =40°F
Approach= 100°F
Tstack= 267.I°F
TH20_inlet =ScPF'
f
LT. Bed 11 1
I./VITD= 102°F 111
II
H.T.BedI.AATD= 100°F
I I I I0.2 0.4 0.6 0.8 1.0
Fraction HeatTransferred
812.2°F
Fig. 4. lO-Fluidized bedheat exchanger temperatureprofile. Turbocompound engine With steam injectionbetweencompressor drive and power expanders
4-17

D_,_.9370A26
Fuel
Diesel
Exhaust
,,,? fi
FeedwaterTank @
@
®
Fluidized BedWaste HeatBoiler
, _wh=l
J
Fig. 4. ll-Turbocompound diesel with steam injection ahead ofcompressor drive expander
4-18
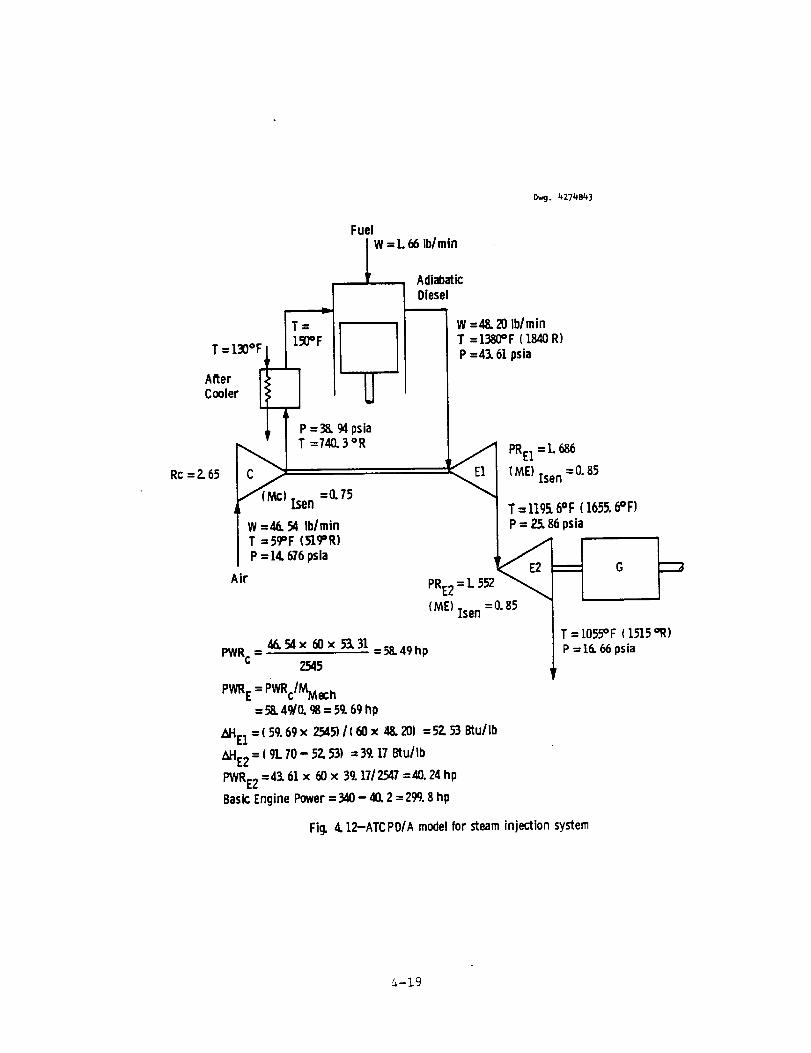
0_. 427_3
Fuel
W =L 66Ib/min
T=----T =130°F_ 150=F
Alter F_--] II
C=,e, J UJr T P=38"°Apsia
_,,_1 T =740"3°R
Rc =Z65 /_(_i isen =0.75
W =46. 54 Ib/minT =SCPF(b'I.CPR)P =14, 676psia
Air
AdiabaticDiesel
W =48. 20 Ib/minT =1380=F ( 1840R)P=43. 61psia
PRE1=1. 686IME) Isen=0.85
T =U95.6°F (1655.6°F]
P= 7.5.86psia
PRE2= L 552 ""_ I
(ME) Isen =0.85
G
PWRc= 46.54 x 60x 53.31 =58.49hp2545
PWRE= PWRc/MMech
= 58.49/0. 98= 59.69hp
AHEl-(59.69x 2545)/(60x 48.20) =52.53 Btu/Ib
bilE2= ( 91.70- 5?.53) =39. 17Btu/Ib
I>WRE2=43. 61 x 60x 39.1712547=40. 24hp
BasicEnginePower= 340- 40.2 = 299.8hp
T = 1055°F ( 1515_)
P= 16.66psia
Fig. 4. 12-ATCPD/A modelfor steaminjectionsystem
4-19
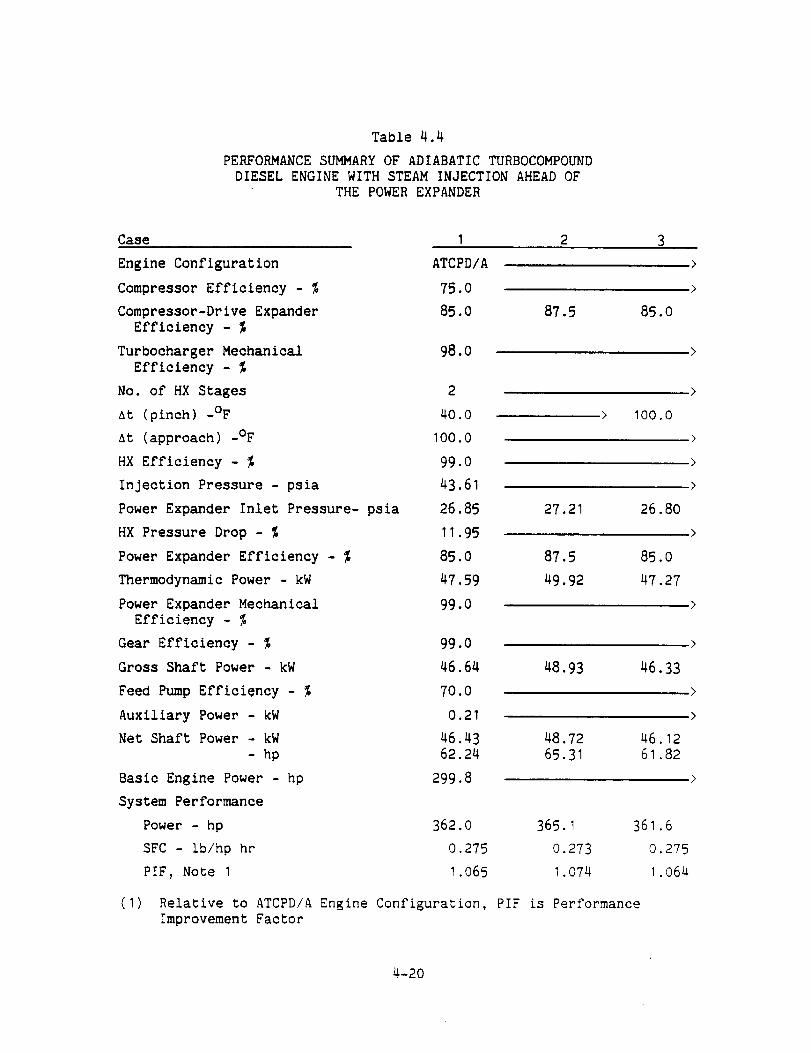
Table 4.4
PERFORMANCESUMMARYOFADIABATICTURBOCOMPOUNDDIESELENGINEWITHSTEAMINJECTIONAHEADOF
THEPOWEREXPANDER
Case 1 2 3
Engine Configuration
Compressor Efficiency - %
Compressor-Drive Expander
Efficiency - %
Turbocharger Mechanical 98.0
Efficiency - %
No. of HX Stages 2
At (pinch) -OF 40.0
at (approach) -OF 100.0
HX Efficiency - % 99.0
Injection Pressure - psia 43.61
Power Expander Inlet Pressure- psia 26.85
HX Pressure Drop - % 11.95
Power Expander Efficiency - % 85.0
Thermodynamic Power - kW 47.59
Power Expander Mechanical 99.0
Efficiency - %
Gear Efficiency - % 99.0
Gross Shaft Power - kW 46.64
Feed Pump Efficiency - % 70.0
Auxiliary Power - kW 0.21
Net Shaft Power - kW 46.43
- hp 62.24
Basic Engine Power - hp 299.8
System Perfor_nce
Power - hp 362.0
SFC - Ib/hp hr 0.275
PIF, Note I 1.065
(1)
ATCPD/A
75.0
85.0 87.5 85.0
> 1OO.0
27.21 26.80
87.5
49.92
85.0
47.27
48.93 46.33
48.72
65.31
46.12
61.82
365.1
0.273
1.074
Relative to ATCPD/A Engine Configuration, PIF is Performance
Improvement Factor
361.6
0.275
1.064
4-20
Fuel
AdiabaticDiesel
l)Wgo 9354A05
i
Exhaust
_; _xZedaBneders
_ Exhaust
Fig. 4.J.3 -Turbocharged diesel with subposedopen Brayton cycle
4-21
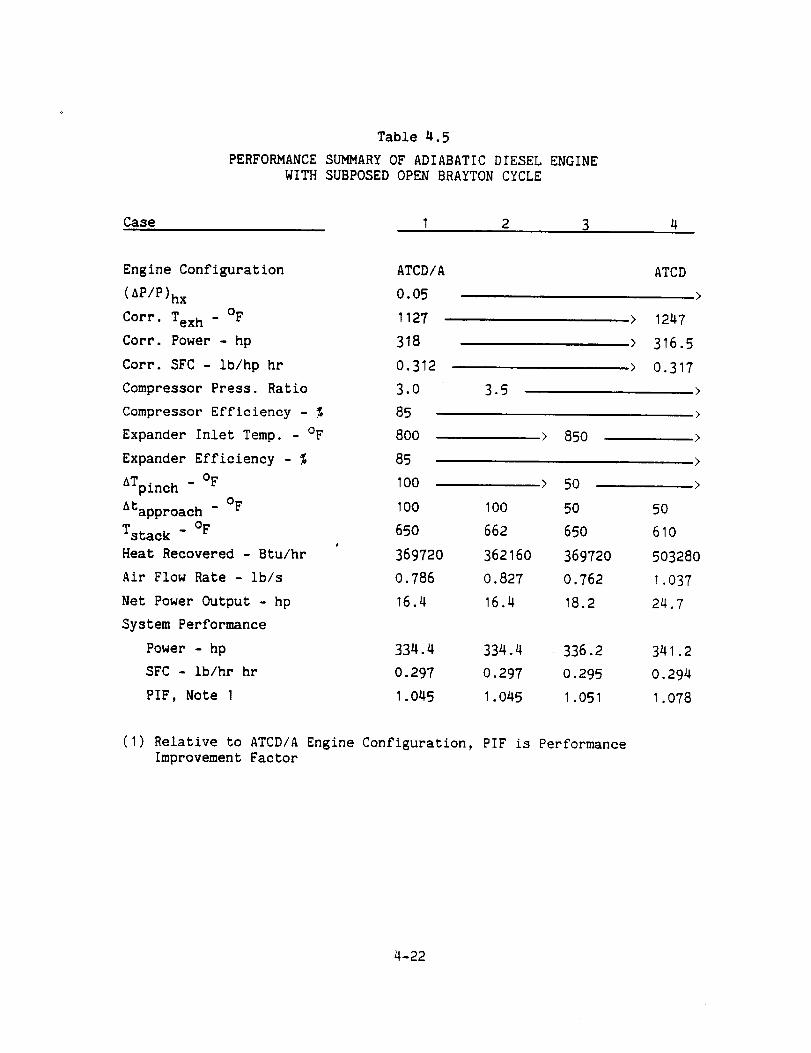
Table 4.5
PERFORMANCE SUGARY OF ADIABATIC DIESEL ENGINE
WITH SUBPOSED OPEN BRAYTON CYCLE
Case I 2 3 4
Engine Configuration
(AP/P)hx
Corr. Tex h - OF
Corr. Power - hp
Corr. SFC - lb/hp hr
Compressor Press. Ratio
Compressor Efficiency - %
Expander Inlet Temp. - OF
Expander Efficiency - %
ATpinc h - o F
Atapproach - oF
Tstac k - oF
Heat Recovered - Btu/hr
Air Flow Rate - lb/s
Net Power Output - hp
System Performance
Power - hp
SFC - ib/hr hr
PIF, Note I
ATCD/A
0.05
1127
318
0.312
3.0
85
8OO
85
IO0
IO0
65O
369720
O. 786
16.4
ATCD
>
>
>
>
3.5
1247
316.5
0.317
>
> 85O
> 5O
100 50
662 650
362160 369720
O.827 0.762
16.4 18.2
>
5O
610
503280
1.037
24.7
334.4 334.4 336.2 341.2
0.297 0.297 0.295 0.294
1.045 1.045 1.051 1.O78
(I) Relative to ATCD/A Engine Configuration, PIF is PerformanceImprovement Factor
4-22
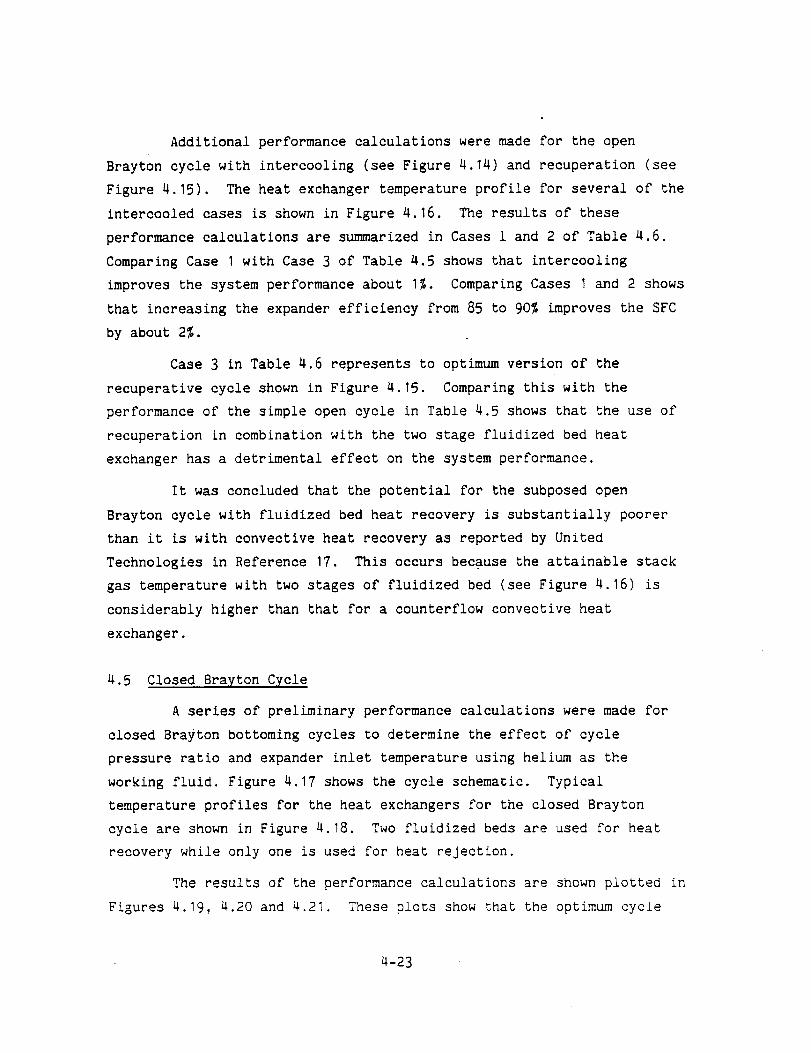
Additional performance calculations were made for the open
Brayton cycle with intercooling (see Figure 4.14) and recuperation (see
Figure 4.15). The heat exchanger temperature profile for several of the
intercooled cases is shown in Figure 4.16. The results of these
performance calculations are summarized in Cases i and 2 of Table 4.6.
Comparing Case I with Case 3 of Table 4.5 shows that intercooling
improves the system performance about I%. Comparing Cases I and 2 shows
that increasing the expander efficiency from 85 to 90% improves the SFC
by about 2%.
Case 3 in Table 4.6 represents to optimum version of the
recuperative cycle shown in Figure 4.15. Comparing this with the
performance of the simple open cycle in Table 4.5 shows that the use of
recuperation in combination with the two stage fluidized bed heat
exchanger has a detrimental effect on the system performance.
It was concluded that the potential for the subposed open
Brayton cycle with fluidized bed heat recovery is substantially poorer
than it is with convective heat recovery as reported by United
Technologies in Reference 17. This occurs because the attainable stack
gas temperature with two stages of fluidized bed (see Figure 4.16) is
considerably higher than that for a counterflow convective heat
exchanger.
4.5 Closed Brayton Cycle
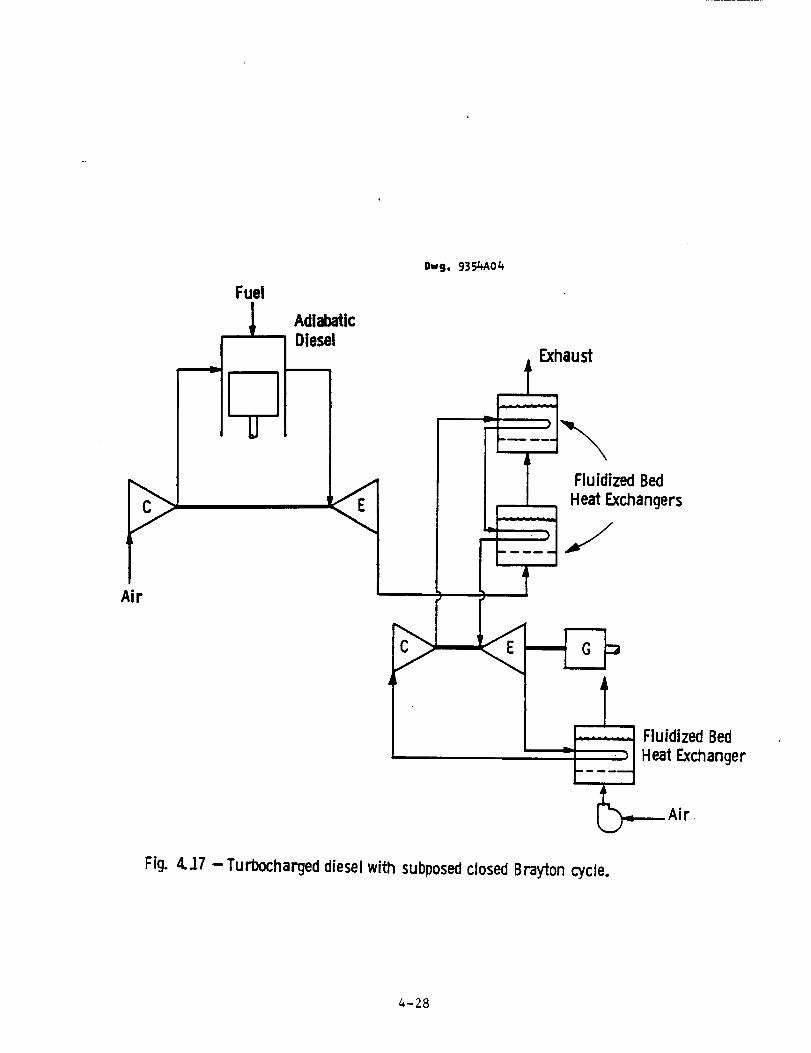
A series of preliminary performance calculations were made for
closed Brayton bottoming cycles to determine the effect of cycle
pressure ratio and expander inlet temperature using helium as the
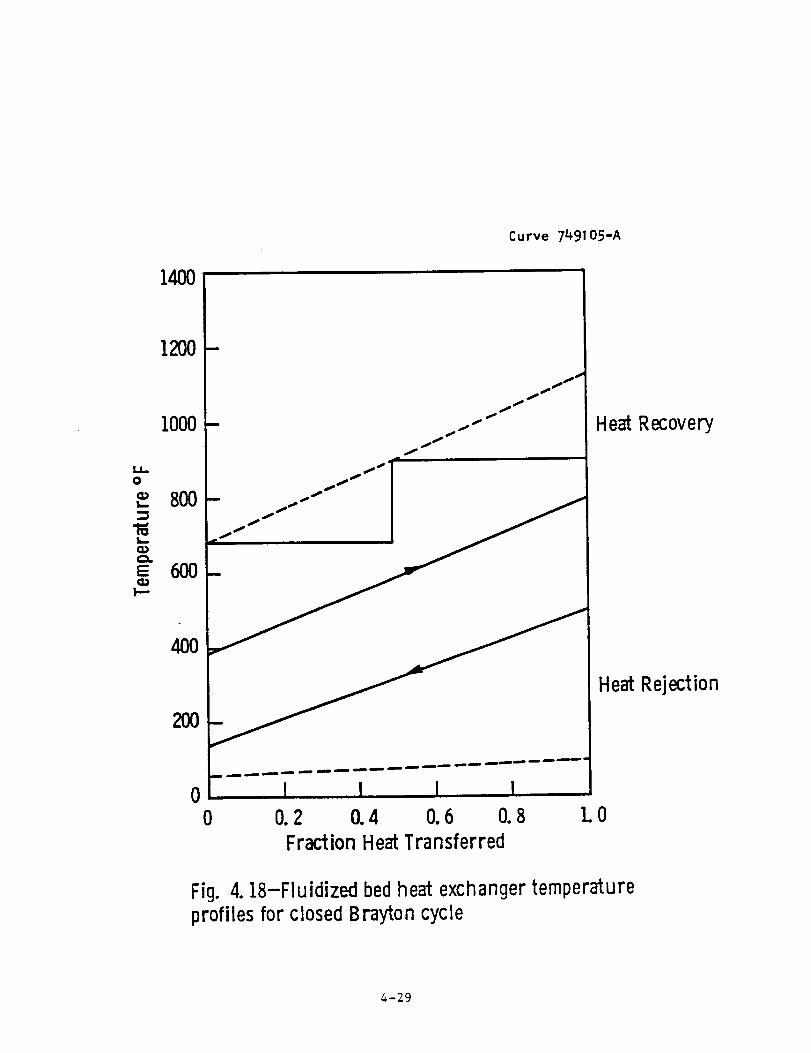
working fluid. Figure 4.17 shows the cycle schematic. Typical
temperature profiles for the heat exchangers for the closed Brayton
cycle are shown in Figure 4.18. Two fluidized beds are used for heat
recovery while only one is used for heat rejection.
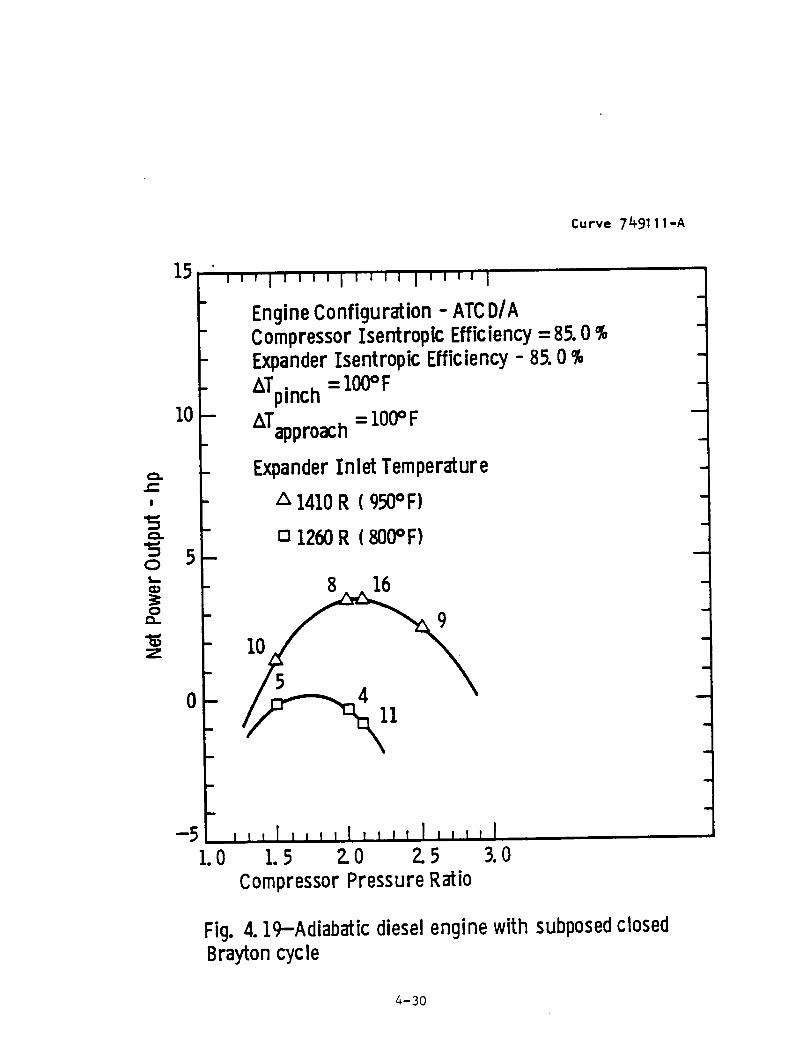
The results of the performance calculations are shown plotted in
Figures 4.19, 4.20 and 4.21. These plots show that the optimum cycle
4-23
Fuel
!!
T
F1uidized BedIntercooler
t
ir
AdiabaticDiesel
Ot_. 935_A03
Exhaust
Fluidizecl Bed
Heat Exchangers
Fig.4. 14-Turbo_arcjed diesel with subposeclintercooled oDen
Brayon cycle
4-24
Dwg. 9354A06
Fuel
AdiabaticDiesel
. IU Exhaust
c_ Bed
changers
Air
Fig. 4..15-Turbocharged diesel with subposed recuperated open Braytoncycle.
4-25
Iil,.0
L.
0.E
1400-
1200-
I000
8OO
6OO
4OO
20O
I I
PR=5Err =8_PFTIC = IO0:F
ATpinch -50 °- F
ATApproach -_50OF
Curve
I
I..T. BedUVtTD= 15cPF
7491 07-A
IIiIIII H.T. BedI UVITD= 146°FII I I
0.6 0.8HeatTransferred
0 I I0 0.2 0.4 1.0
Fraction
1126.5°F
900°F8_°F
Fig. 4. 16-Fluidized bedheat exchanger temperatureprofile intercooled open Brayton cycle
4-26
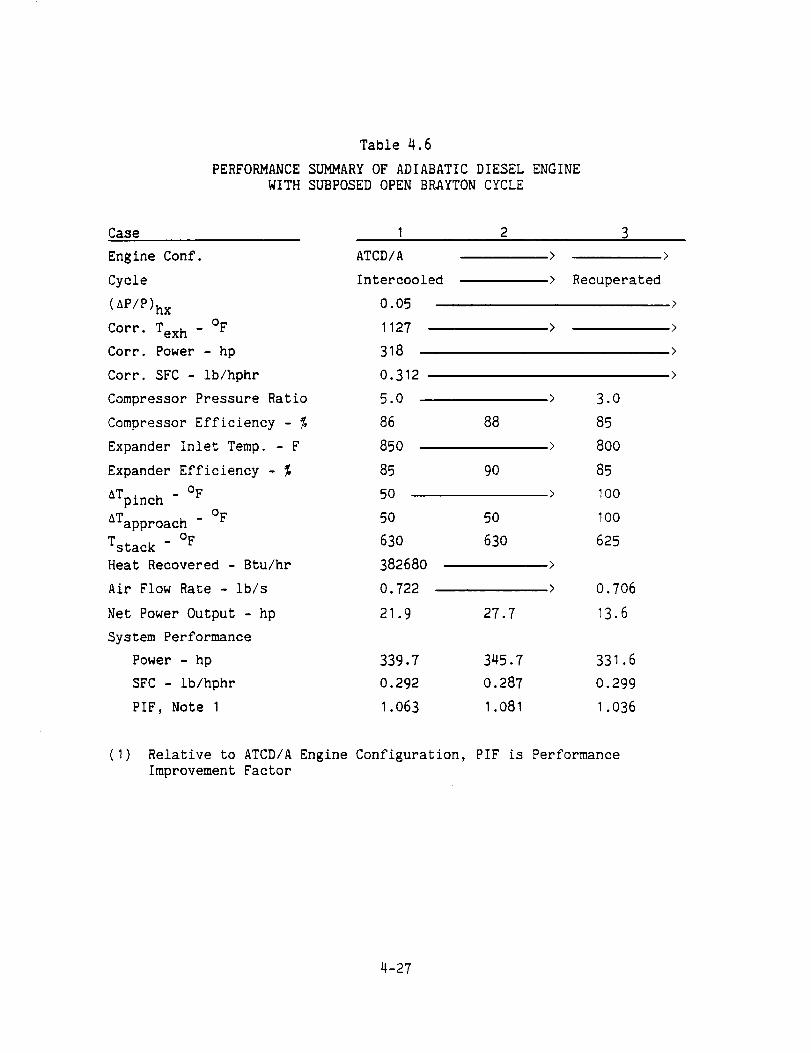
Table 4.6
PERFORMANCE SUMMARY OF ADIABATIC DIESEL ENGINE
WITH SUBPOSED OPEN BRAYTON CYCLE
Case
Engine Conf.
Cycle
(AP/P)hx
Corr. Tex h - OF
Corr. Power - hp
Corr. SFC - Ib/hphr
Compressor Pressure Ratio
Compressor Efficiency - %
Expander Inlet Temp. - F
Expander Efficiency - %
aTpinc h - oF
ATapproach - oF
Tstac k - oF
Heat Recovered - Btu/hr
Air Flow Rate - lb/s
Net Power Output - hp
System Performance
Power - hp
SFC - ib/hphr
PIF, Note I
I 2 3
ATCD/A >
Intercooled > Recuperated
O.05
1127 >
318
0.312
5.0 > 3.0
86 88 85
85O > 8OO
85 9O 85
50 > 1OO
5O 5O tOO
63O 63O 625
382680 >
O.722 > O.706
21.9 27.7 13.6
339.7 345.7 331.6
0.292 0.287 0.299
1.063 1.081 1.036
(I) Relative to ATCD/A Engine Configuration, PIF is Performance
Improvement Factor
4-27
Fuel
Adiabatic
Diesel
Dwg. 9) 51+A0b,
Exhaust
Fluidized Bed
Heat Exchangers
Air
I_--- -_ Fluidized Bed_t ,, Heat Exchanger
_Air
Fig. 4.37 -Turbocharged diesel with subposed closed Brayton cycle.
4-28
Curve 7491O5-A
1400
1200
1000
,'2' 8OO
1110
m
_ _ S _
S S
S S
r _'_ _ _ _ _'° _ _
! ! ! !0 0.2 0.4 0.6 0.8 1.0
Fraction HeatTransferred
HeatRecovery
Heat Rejection
Fig. 4. 18-Fluidized bedheat exchanger temperatureprofiles for closed Brayton cycle
4-29
Curve 749111 -A
I
OL-
oQ_
Z
15
10
B
m
m
m
I,,lllilll'Sl lll'_l
EngineConfiguration - ATCD/ACompressorIsentropic Efficiency=85. 0 %ExpanderIsentropic Efficiency- 85.0 %
ATpinch = 100OF
ATappr0ach= 100°F
ExpanderInlet Temperature
z_1410R(950':'F)
[::I1260R (800°F)
8 _16 9
10
D
ll,II,1,1,,,111,Ttl1.5 2.0 2.5 3.0
Compressor Pressure Ratio
Fig. 4. 19-Adiabatic diesel enginewith subposedclosedBraytoncycle
a
I
m
w
u
i
m
I
m
u
m
i
m
4-30
Curve 7491 10-A
I
ot_
O
Z
+i0
+5
m
m
m
O-
re
m
m
I I I I
Engine Configuration - ATCD/ACompressor Isentropic Efficiency =85. 0Expander Isentropic Efficiency =85. 0AT = lO0°F
pinch
ATApproach = 100°F
Compressor Pressure Ratio = 2. 0
O--
I I ! I80O 85O 900 95O
Expander Inlet Temperature °F
Fig. 4. 20-Adiabatic diesel engine with closedbottoming cycle
m
1000
Brayl:on
4-31

+I0
I
= +5QL_
0
Z
I I I I I l , ,
- Engine Configuration - ATCD/A
Compressor Pressure Ratio-?. 1
Curve 749109-A
i I ' ' l
l
n
ATpinc h = 100°F
ATapproach = 100OF
m
D
D
D
-58O
Expander Inlet Temperature
o 800=F
o 950°F
I I l I l , I I I l I I I
85 90
Compressor and Expander Isentropic Efficiencies - 9_
95
Fig. 4. 21-Adiabatic diesel engine with closed Braytonbottoming cycle
4-32
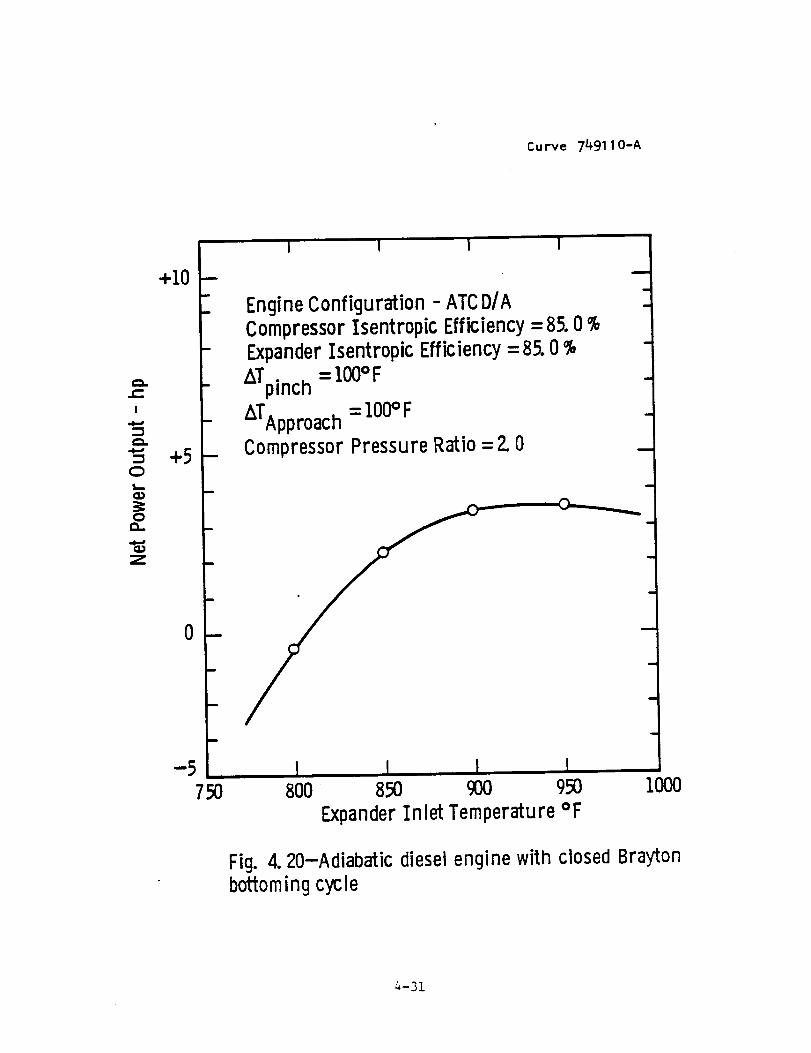
has a compressor pressure ratio of about 2 and an expander inlet tempera-ture of about 950°F. The net power output is a product of the heat
recovered and the cycZe efficiency which have opposing characteristics.
Figure 4.21 shows that the subsystem performance is a strong function of
the compressor and expander isentropic efficiencies and, that for
isentropic efficiency values greater than 88.5%, the optimum value ofexpander inlet temperature is less than 950°F.
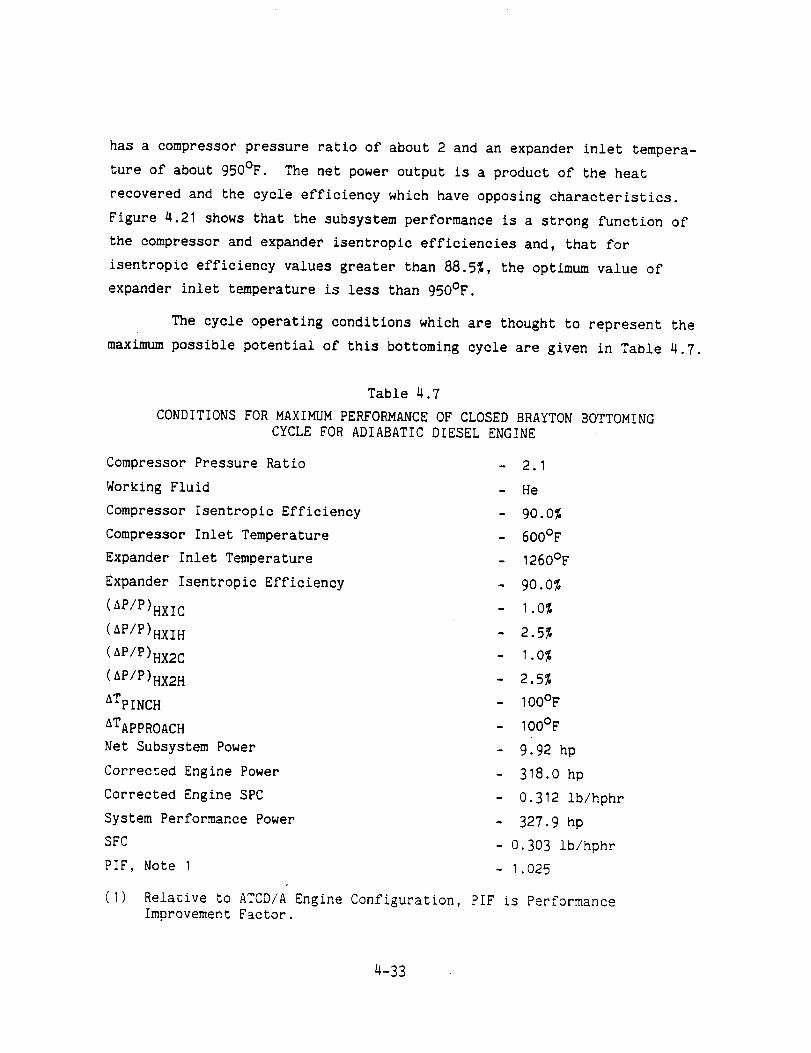
The cycle operating conditions which are thought to represent the
maximum possible potential of this bottoming cycle are given in Table 4.7.
Table 4.7
CONDITIONS FOR MAXIMUM PERFORMANCE OF CLOSED BRAYTON BOTTOMING
CYCLE FOR ADIABATIC DIESEL ENGINE
Compressor Pressure Ratio
Working Fluid
Compressor Isentropic Efficiency
Compressor Inlet Temperature
Expander Inlet Temperature
Expander Isentropic Efficiency
(AP/P)HxIC
(AP/P)HxIH
(AP/P)Hx2c
(AP/P)Hx2H
ATpINCH
&TApPROACH
Net Subsystem Power
Corrected Engine Power
Corrected Engine SPC
System Performance Power
SFC
PIF, Note I
- 2.1
- He
- 90.0%
- 600°F
- 126OOF
- 90.0%
- i .0%
- 2.5%
- 1.0%
- 2.5%
- 100°F
- 100°F
- 9.92 hp
- 3!8.0 hp
- 0.312 Ib/hphr
- 327.9 hp
- 0.303 ib/hphr
- I.025
Relative to ATCD/A Engine Configuration, PIF is Performance
Improvement Factor.
4-33
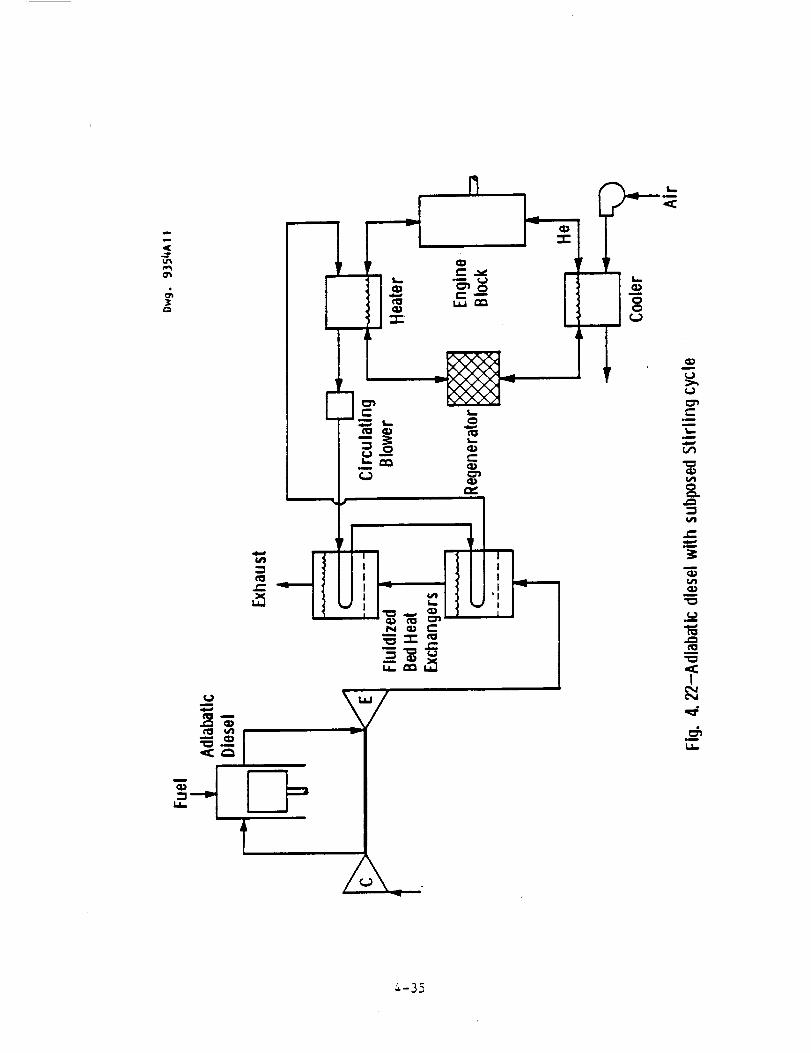
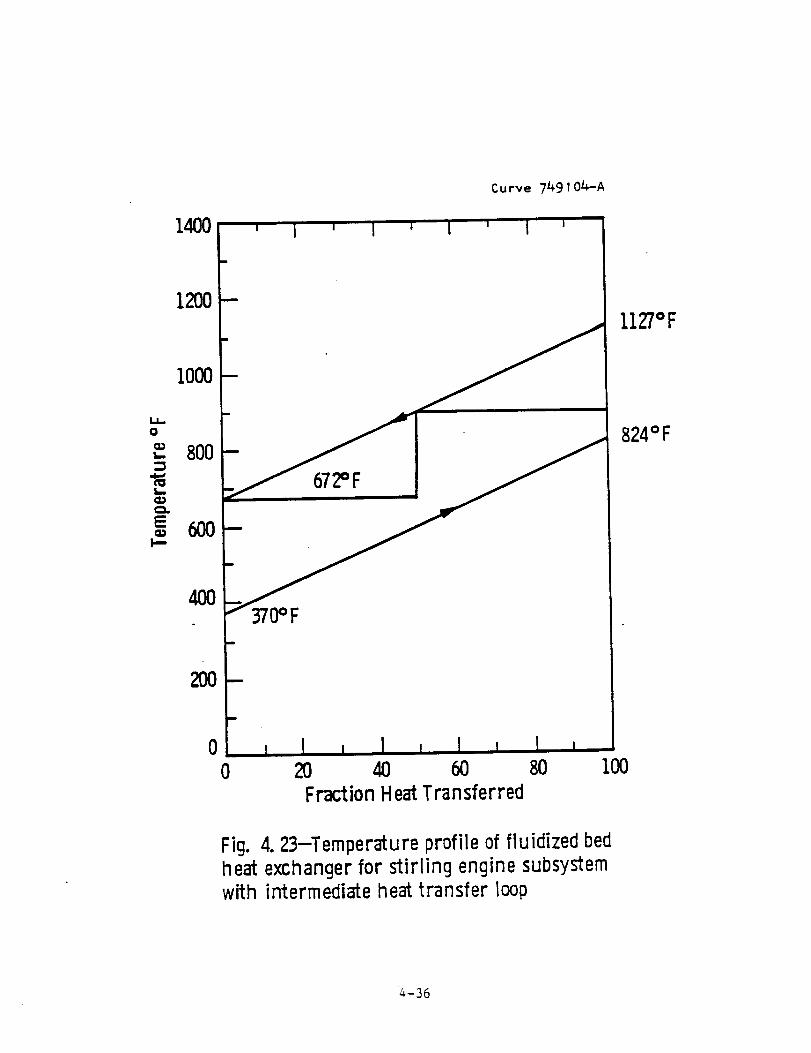
4.6 Stirling Engine
A series of preliminary performance calculations were made for
the Stifling engine subsystem configuration shown in Figure 4.22. This
subsystem uses an intermediate heat transfer loop between an external
fl_idized bed heat exchanger and the Stifling engine and is based on the
system evaluated by General Electric in the Cogeneration Technology
Alternatives Study (Reference 18). A two-stage fluidized bed heat
exchanger was assumed with a typical temperature profile as shown in
Figure 4.23.
The Stifling engine performance was derived from data tabulated
in Martiri's Stirling Engine Design Manual (Reference 19) for a cold end
temperature of IOO°C (212°F). The results of these calculations are
summarized in Table 4.8. Two adiabatic diesel engine configurations
were evaluated over a range of Stifling engine peak cycle temperatures.
The system performance is shown to be a weak function of both the engine
configuration and the peak cycle temperature.
Since the use of the intermediate heat transfer loop gave high
stack gas temperatures and marginal system performance relative to other
bottoming cycles evaluated, optional heat transfer configurations were
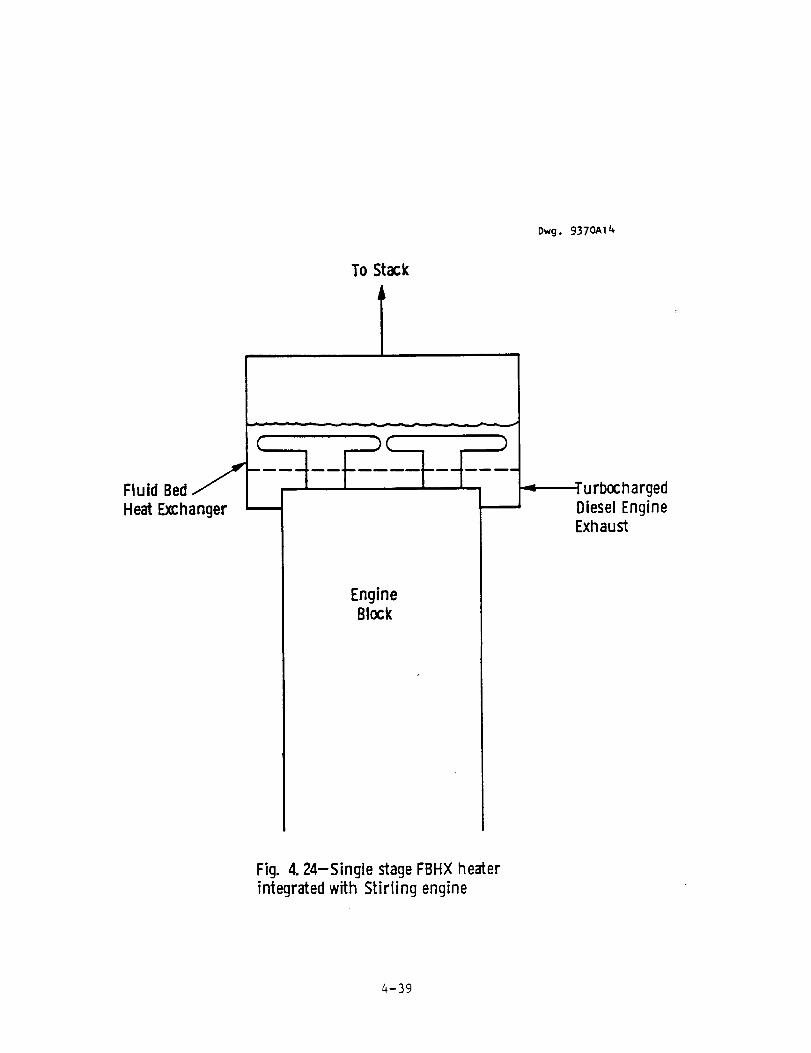
investigated. These results are summrized in Table 4.9. Integrated
fluidized bed heat exchangers as shown in Figure 4.24 were found to have
a potential for significantly better performance than the external heat
exchangers with an intermediate heat transfer loop (see Table 4.9); but,
were judged to be physically impractical.
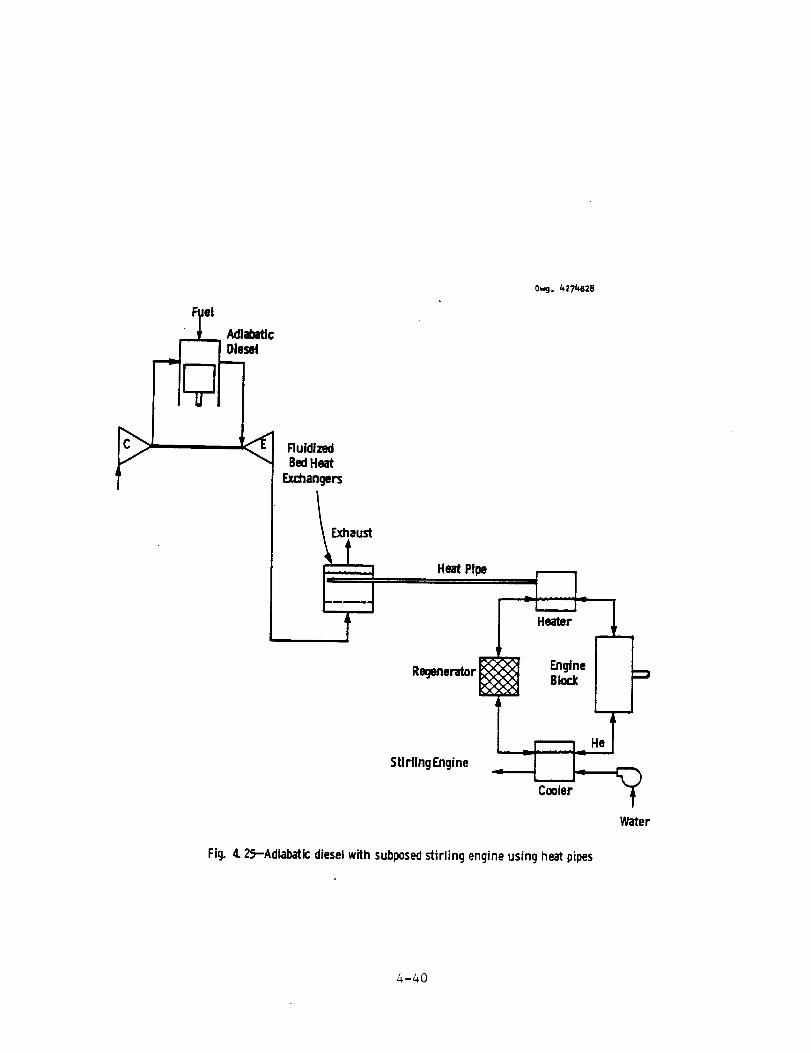
A configuration using a single external fluidized bed heat
exchanger with heat pipes for transporting the heat to the Stirling
engine as illustrated in Figure 4.25 was found to give system perfor-
mance comparable with that of the integrated arrangement. Performance
calculations for these cases are given in Table 4.10.
4-34
m_
o%
&3
!
,u
m
I
UO
m
-m
m
I
m
t,_
&-35
1400
1200
i ' I
Curve 7491 0/_-A
' i J
I127°F
I000
%8oo
CI.
3?0OF
824°F
2OO
m
0 ! I i ! i ! I I0 2O 4O 6O 80
FractionHeatTransferred
IO0
Fig. 4. 23-Temperature profile of fluidized bedheat exchanger for stirling engine subsystemwith intermediate heat transfer toop
4-36
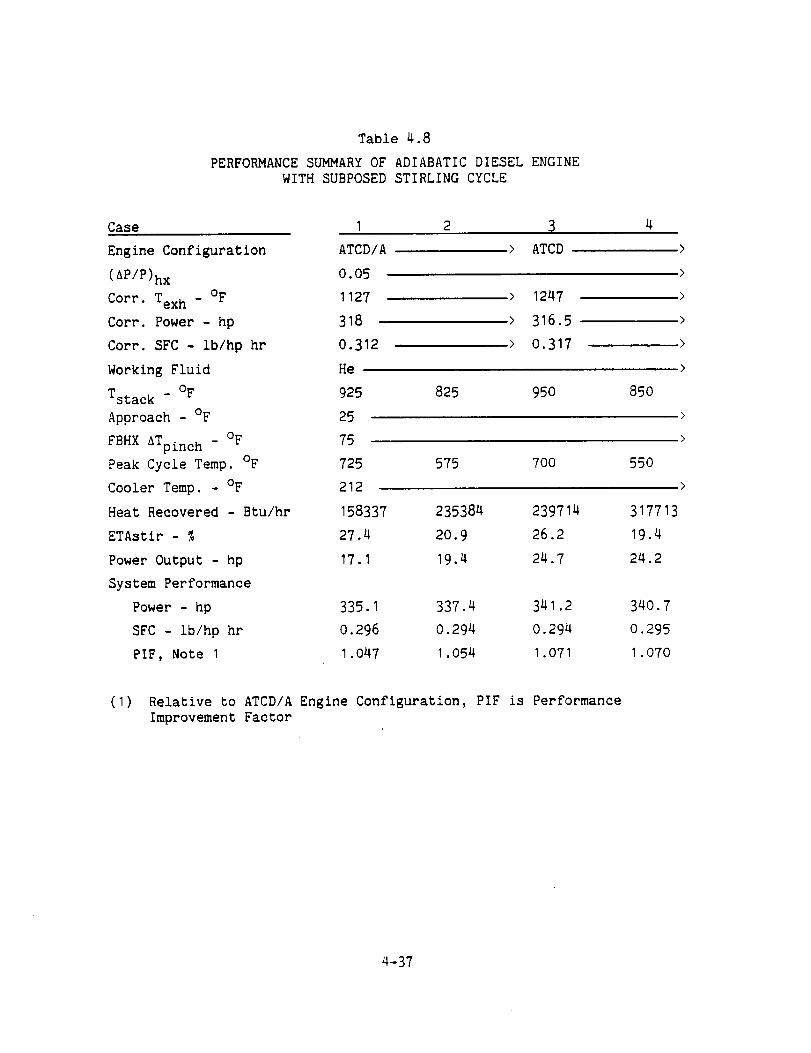
Table 4.8
PERFORMANCESUMMARYOF ADIABATICDIESELENGINEWITHSUBPOSEDSTIRLINGCYCLE
Case I 2 3 4
Engine Configuration ATCD/A > ATCD >
(AP/P)hx 0.05 >
Corr. Tex h - OF 1127 > 1247 >
Corr. Power - hp 318 > 316.5 >
Corr. SFC - ib/hp hr 0.312 > 0.317 >
Working Fluid He >
Tstac k - OF 925 825 950 850
Approach - OF 25 >
FBHX ATpinc h - OF 75 >
Peak Cycle Temp. OF 725 575 700 550
Cooler Temp. - °F 212 >
Heat Recovered - Btu/hr 158337 235384 239714 317713
ETAstir - % 27.4 20.9 26.2 19.4
Power Output - hp 17.1 19.4 24.7 24.2
System Performance
Power - hp 335.1 337.4 341.2 340.7
SFC - ib/hp hr 0.296 0.294 0.294 0.295
PIF, _ote I 1.047 1.O54 1.O71 1.070
(I) Relative to ATCD/A Engine Configuration, PIF is Performance
Improvement Factor
4-37
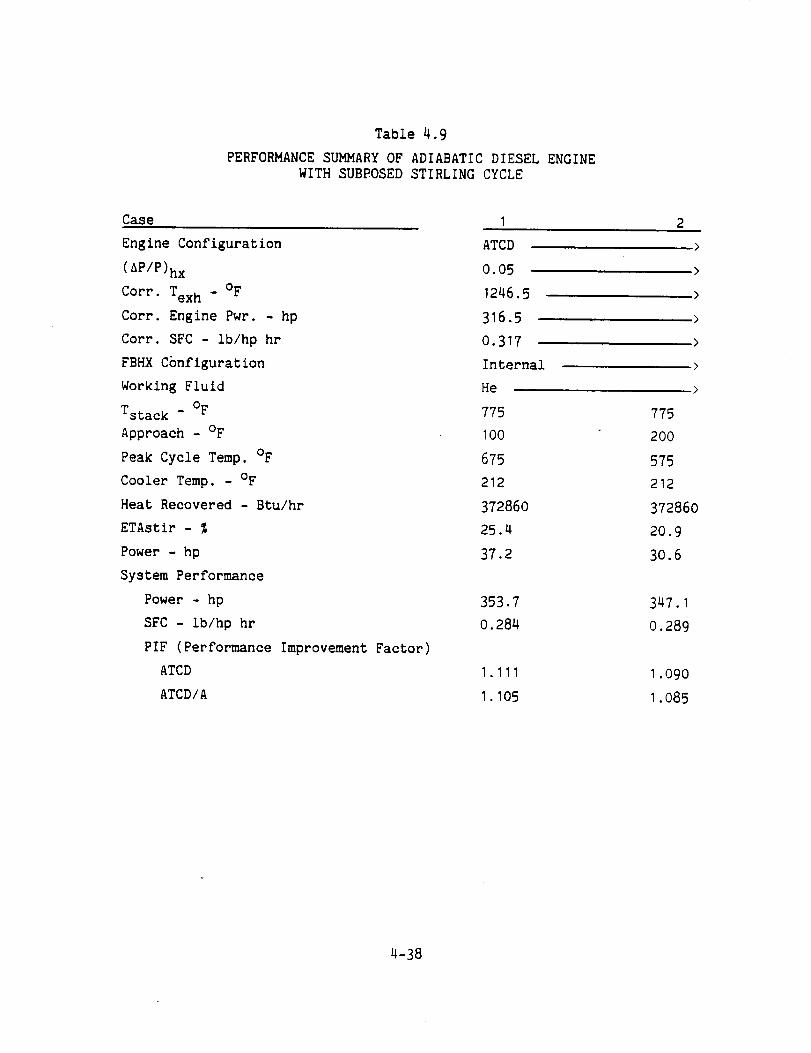
Table 4.9
PERFORMANCE SUMMARY OF ADIABATIC DIESEL ENGINEWITH SUBPOSED STIRLING CYCLE
Case I 2
Engine Configuration ATCD
(nP/P)hx 0.05
Corr. Tex h - OF 1246.5
Corr. Engine Pwr. - hp 316.5
Corr. SFC - ib/hp hr O.317
FBHX Configuration Internal
Working Fluid He
Tstac k - OF 775
Approach - OF 100
Peak Cycle Temp. OF 675
Cooler Temp. - OF 212
Heat Recovered - Btu/hr 372860
ETAstir - % 25.4
Power - hp 37.2
System Performance
Power - hp 353.7
SFC - ib/hp hr 0.284
PIF (Perfor_nce Improvement Factor)
ATCD 1.111
ATCD/A 1.105
775
200
575
212
372860
20.9
30.6
347.1
O.289
1.090
1.085
4-38
To Stack
TDwg. 9370A14
Fluid Bed J
Heat Exchanger m
EngineBlock
TurbochargedDiesel EngineExhaust
Fig. 4. 24-Single stage FBHX heaterintegrated wffh Stirling engine
4-39
AdiabaticDiesel
RuidizedBedHeat
Exchangers
Exhaust
F-4Heat Pipe
Regenerator
StiflingEngine
Owg. _27_e28
--I I-
Heater
+-If-___ He
Water
Fig. 4. 25-Adiabaticdieselwith subposedstirling engineusing heat pipes
4-40

Table 4.10
PERFORMANCE SUGARY OF ADIABATIC DIESEL ENGINE
WITH SUBPOSED STIRLING CYCLE
Case
Engine Configuration
(AP/P)hx
Corr. Tex h - OF
Corr. Engine Pwr. - hp
Corr. SFC - ib/hp hr
FBHX Conf.
Working Fluid
oFTstac k - 775
Approach - OF 100
AThp - °F 0
Peak Cycle Temp. OF 675
Cooler Temp. - OF 212
Heat Recovered - Btu/hr 372860
ETAstir - % 25.4
Power - hp 37.2
System Performance
Power - hp 353.7
SFC - ib/hp hr 0.284
PIF (Performance Improvement Factor)
ATCD 1.111
ATCD/A 1.105
I 2 3 4
ATCD >
0.05 >
1246.5 >
316.5 >
0.317 >
External with heat pipes _>
He >
25 50 75
650 625 600
24.4 23.3 22.1
35.8 34.1 32.4
352.3 350.6 348.9
0.285 0.286 0.288
1.106 I.I01 1.095
I.I01 1.096 1.090
4-41
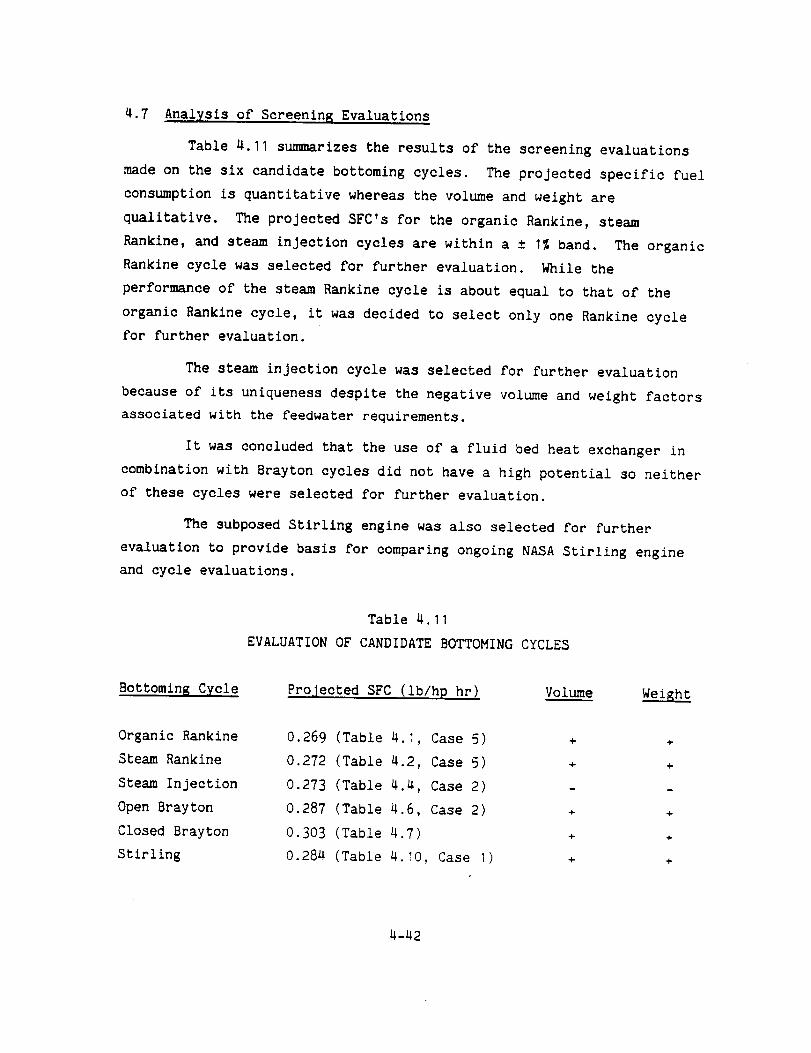
4.7 Analysis of Screening Evaluations
Table 4.11 summarizes the results of the screening evaluations
made on the six candidate bottoming cycles. The projected specific fuel
consumption is quantitative whereas the volume and weight are
qualitative. The projected SFC's for the organic Rankine, steam
Rankine, and steam injection cycles are within a ± I% band. The organic
Rankine cycle was selected for further evaluation. While the
performance of the steam Rankine cycle is about equal to that of the
organic Rankine cycle, it was decided to select only one Rankine cycle
for further evaluation.
The steam injection cycle was selected for further evaluation
because of its uniqueness despite the negative volume and weight factors
associated with the feedwater requirements.
It was concluded that the use of a fluid bed heat exchanger in
combination with Brayton cycles did not have a high potential so neither
of these cycles were selected for further evaluation.
The subposed Stifling engine was also selected for further
evaluation to provide basis for comparing ongoing NASA Stirling engine
and cycle evaluations.
Bottomin E Cycle
Table 4.11
EVALUATION OF CANDIDATE BOTTOMING CYCLES
ProJected SFC (ib/hp hr) Volum____ee
Organic Rankine 0.269 (Table 4.1, Case 5) + +
Steam Rankine 0.272 (Table 4.2, Case 5) + +
Steam Injection 0.273 (Table 4.4, Case 2) - _
Open Brayton 0.287 (Table 4.6, Case 2) ÷ ÷
Closed Brayton 0.303 (Table 4.7) ÷ ÷
Stirling 0.284 (Table 4.10, Case I) + +
4-42
5. EVALUATIONOFSELECTEDHEATRECOVERYSYSTEMS
The bottoming systems selected for further evaluation in the
screening phase were:
o Organic Rankine cycle
o Steam injection cycle
o Stirling engine
These systems were first defined more comprehensively than had been done
in the screening phase, secondly, performance calculations were made for
the truck applications at reference conditions, thirdly, sensitivity
analyses were made relative to the adiabatic diesel exhaust temperature,
and, finally performance calculations were made for the alternate
applications - locomotive and marine.
5.1 Organic Rankine Cycle
5.1.1 Truck Applications
The RC-I cycle conditions used by the Thermo Electron
Corporation (TECO) in Reference i were used as the reference conditions
in the organic Rankine cycle evaluation. This was done to provide a
comparison between the fluidized bed heat exchanger and the conventional
heat exchanger for an organic Rankine bottoming cycle.
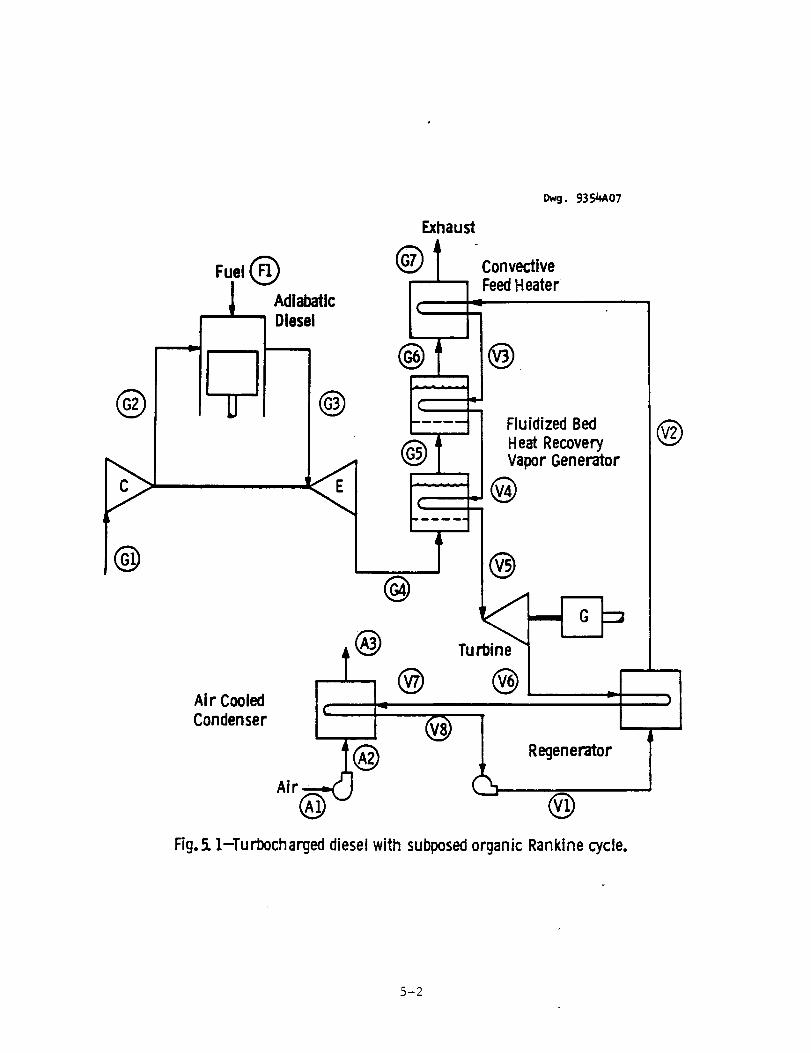
A schematic drawing of this system is shown in Figure 5.1. The
heat recovery apparatus consists of two fluidized beds and one
convective heat exchanger. The feed fluid is regeneratively heated and
the condenser is air cooled.
The state points for the reference conditions for the truck
application are given in Table 5.1. State points for ± g5°F adiabatic
5-I
@
@
D_j. 935_07
Exhaust
Fuel (
II
Air CooledCondenser
t)
AdiabaticDiesel
@ ConvectiveFeedHeater
@ @k
@
@
l ®
! I"
@
®
@
Fluidized BedHeat RecoveryVapor Generator
@
®
Tu
®
Regenerator
®
@
TFig.5. 1-Turbocharged diesel with subposedorganic Rankine cycle.
5-2

O_. _269B65
TABLE5.1-ATCD WITHORGANICRANKINECYCLEUSING RC-1 ( REFERENCECONDITIONSTRUCKAPPLICATION
Station Pressure Temperature Enthalpy Row Rate Composition(Psia) (°F) (BtuJlb) (Ib/s)
GI 14.7 59 Z¢ 6 0. 774 Air
G2 - - - 0.774 Air
G3 - 1445 - 0.802 (1)
G4 17.18 1245 343.3 0. 802 ( 1 )
G5 - 900 247.0 0. 80Z ( 1)
G6 - 587 163.2 O.802 (I}
G7 < 1(_66 347 101. 3 0. 802 (1 )
I:1 - 59 - 0. 0278 No. 2 Dist.
Vl 880 148 28. 6 L 216 RC -1
V2 870 _7 78. 7 1-216 RC - I
V3 852 422 120.8 1. 216 RC - 1
V4 828 557 17(_0 L 716 RC - 1
V5 800 750 237.7 LZ].6 RC-1
V6 & 0 542 193,5 L 216 RC "I
V7 - 320 14_-4 L 216 RC- 1
V8 7. 0 135 25.1 1. 2:16 RC- 1
AI 14. 7 59 28.6 9. 79 Air
A2 14. 7+ 59 28.6 " Air
A3 14.7 121) 43. 3 " Air
(1) Air - 0. 4663
CO2 - 0. 0721
H20 - 0. 0725
N2 - 0. 3843A -0.0048
5-3
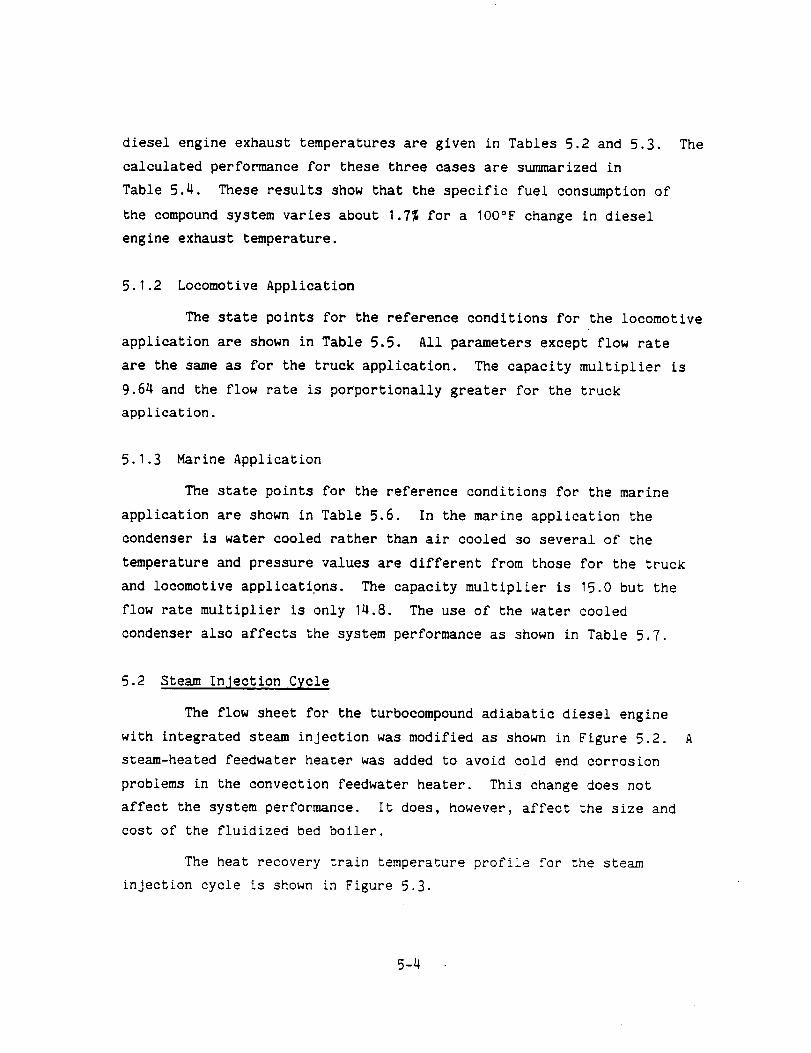
diesel engine exhaust temperatures are given in Tables 5.2 and 5.3.
calculated performance for these three cases are summarized in
Table 5.4. These results show that the specific fuel consumption of
the compound system varies about 1.7% for a IO0°F change in diesel
engine exhaust temperature.
The
5.1.2 Locomotive Application
The state points for the reference conditions for the locomotive
application are shown in Table 5.5. All parameters except flow rate
are the same as for the truck application. The capacity multiplier is
9.64 and the flow rate is porportionally greater for the truck
application.
5.1.3 Marine Application
The state points for the reference conditions for the marine
application are shown in Table 5.6. In the marine application the
condenser is water cooled rather than air cooled so several of the
temperature and pressure values are different from those for the truck
and locomotive applications. The capacity multiplier is 15.0 but the
flow rate multiplier is only 14.8. The use of the water cooled
condenser also affects the system performance as shown in Table 5.7.
5.2 Steam In_ection Cycle
The flow sheet for the turbocompound adiabatic diesel engine
with integrated steam injection was modified as shown in Figure 5.2.
steam-heated feedwater heater was added to avoid cold end corrosion
problems in the convection feedwater heater. This change does not
affect the system performance. It does, however, affect the size and
cost of the fluidized bed boiler.
The heat recovery train temperature profile for the steam
injection cycle is shown in F_gure 5.3.
A
5-4
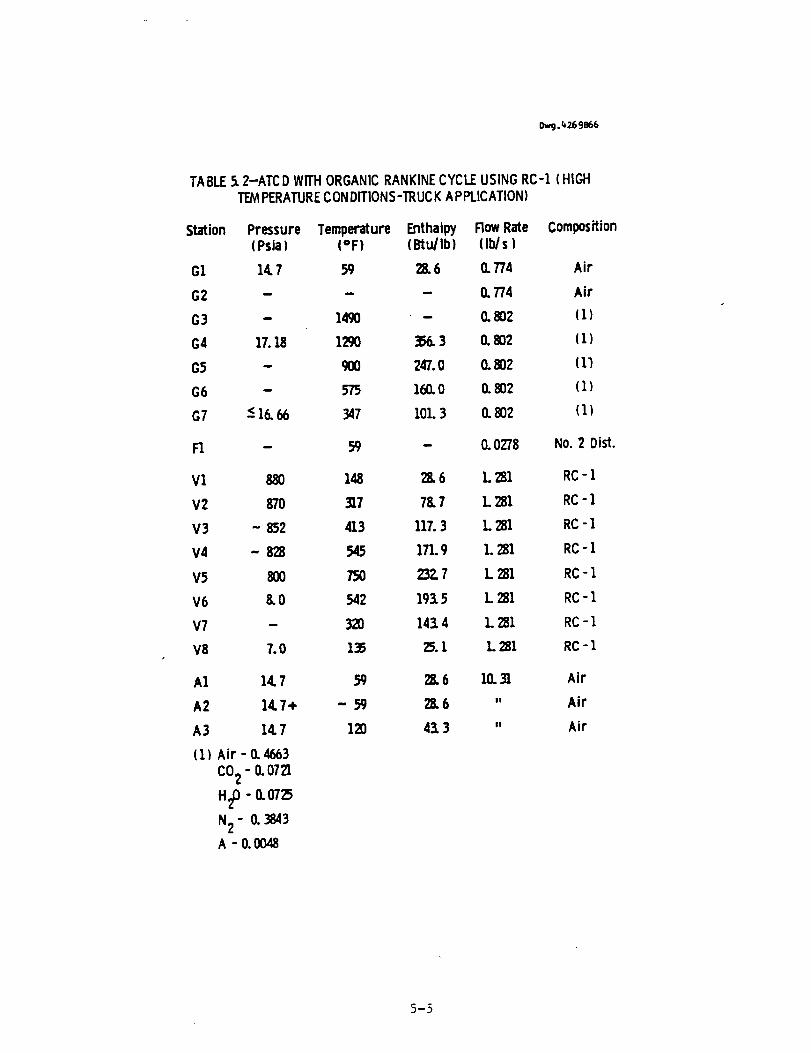
I_. 426 9066
TABLE 5.2-ATC D WITH ORGANIC RANKINE CYCLE USING RC-I (HIGH
PERATURE CONDITIONS-TRUC K APPLICATION)
Station Pressure Temperature Enthalpy Row Rate Composition(Psia) (°F) (Btu/Ib) (Ib/s)
GI 14.7 59 28.6 0.774 Air
G2 - - - 0.774 Air
G3 - 1490 - 0. 802 (1 )
G4 17.18 1290 356.3 0. 802 (1 )
G5 - 900 247.0 0.802 (1_
G6 - 575 160.0 I1 802 (1 )
G7 < 16. 66 347 101. 3 0. 802 (1)
F1 - 59 - 0.0278 No. 2 Dist.
Vl 880 148 28.6 L 281 RC -I
V2 870 317 78. 7 L 281 RC- 1
V3 - 852 413 117. 3 L 281 RC - 1
V4 - 828 545 171.9 1. 281 RC- 1
V5 800 750 232. 7 L 281 RC- 1
V6 8. 0 542 193.5 L 281 RC- 1
V7 - 320 143.4 L 281 RC- 1
V8 7. 0 135 25. 1 1. 281 RC - 1
A1 14. 7 59 28. 6 10. 31 Air
A2 14.7+ - 59 28. 6 " Air
A3 14.7 120 43. 3 " Air
(1) Air - O.4663
CO2 - 0. 0721
H20 - 0.0725
N2 - 0. 3843A -0.0048
5-5
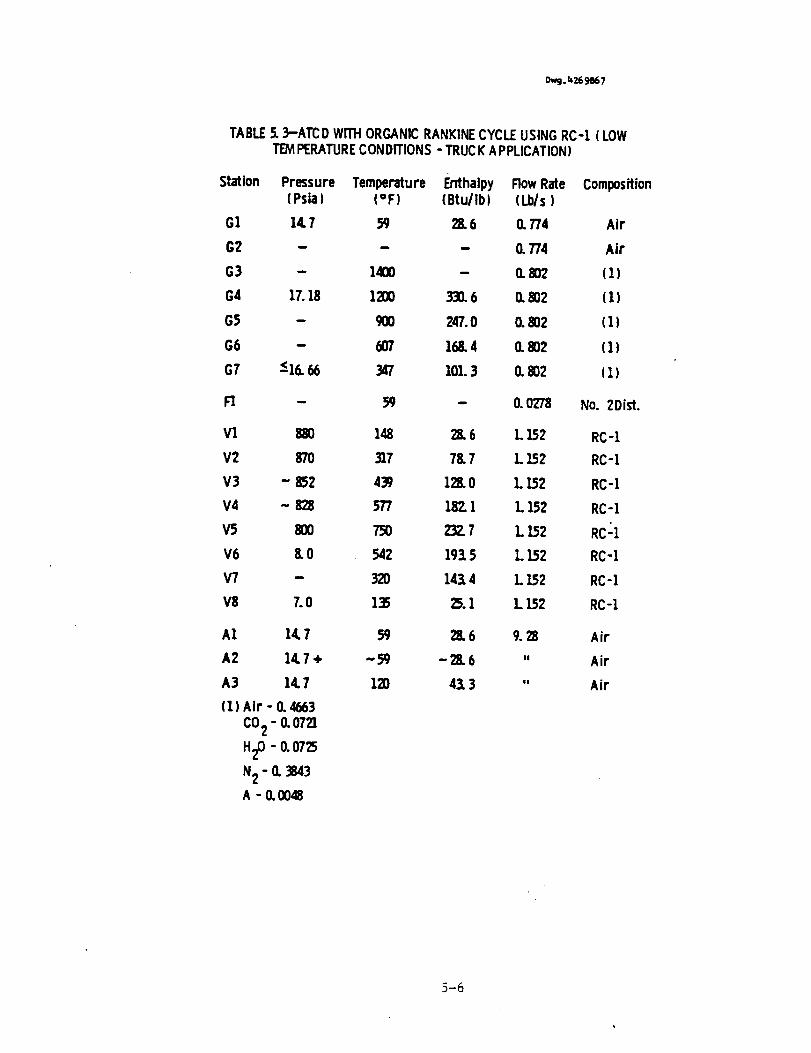
TABLE5. 3-ATCD WITHORGANIC RANKINECYCLEUSING RC-1 ( LOWTEMPERATURECONDITIONS - TRUCK A PPLICATION)
Station Pressure Temperature Enthalpy Flow Rate Composition(Psia I (°F) (Btullb) (Lb/s)
G1 14. 7 59 28. 6 (1 774 Air
G2 - - - (1774 Air
G3 - 1400 - (1802 ( 1)
G4 17.18 1200 331.6 (1802 ( 1)
G5 - g00 247.0 0. 802 (1)
G6 - 607 168. 4 (1 802 (1)
G7 51(=.66 347 101. 3 (1802 ( 1)
F1 - 59 - 0. 0278 No. 2Dist.
Vl 880 148 28. 6 1.152 RC-1
V2 870 317 78. 7 L 152 RC-1
V3 " 852 439 128.0 L 152 RC-1
V4 - 828 577 182.1 L 152 RC-1
V5 800 750 232.7 L 152 RC'I
V6 8. 0 542 193.5 L 152 RC-1
V7 - 320 143. 4 L 152 RC-1
V8 7. 0 135 25.1 L 152 RC-I
A1 14.7 59 28. 6 9. 28 Air
A2 1¢7+ .-59 -28.6 " Air
A3 14. 7 120 43. 3 " Air
(1) Air - 0. 4663
CO2 - (10721
H20 - 0.0725
N2 - (1 3843
A - O.O048
5-6
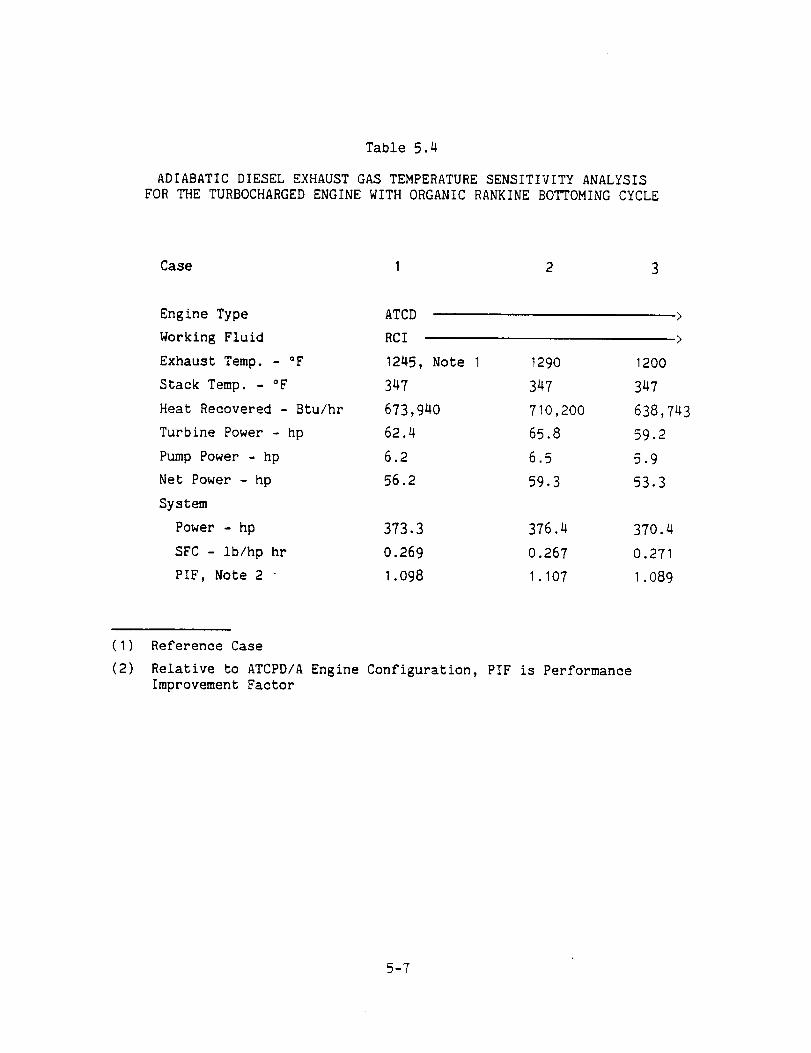
Table 5.4
ADIABATIC DIESEL EXHAUST GAS TEMPERATURE SENSITIVITY ANALYSIS
FOR THE TURBOCHARGED ENGINE WITH ORGANIC RANKINE BOTTOMING CYCLE
Case 1 2 3
Engine Type ATCD >
Working Fluid RCI >
Exhaust Temp. - °F 1245, Note I 1290 1200
Stack Temp. - °F 347 347 347
Heat Recovered - Btu/hr 673,940 710,200 638,743
Turbine Power - hp 62.4 65.8 59.2
Pump Power - hp 6.2 6.5 5.9
Net Power - hp 56.2 59.3 53.3
System
Power - hp 373.3 376.4 370.4
SFC - lb/hp hr 0.269 0.267 0.271
PIF, Note 2 1.098 1.107 1.089
(I) Reference Case
(2) Relative to ATCPD/A Engine Configuration, PIF is Performance
Improvement Factor
5-7
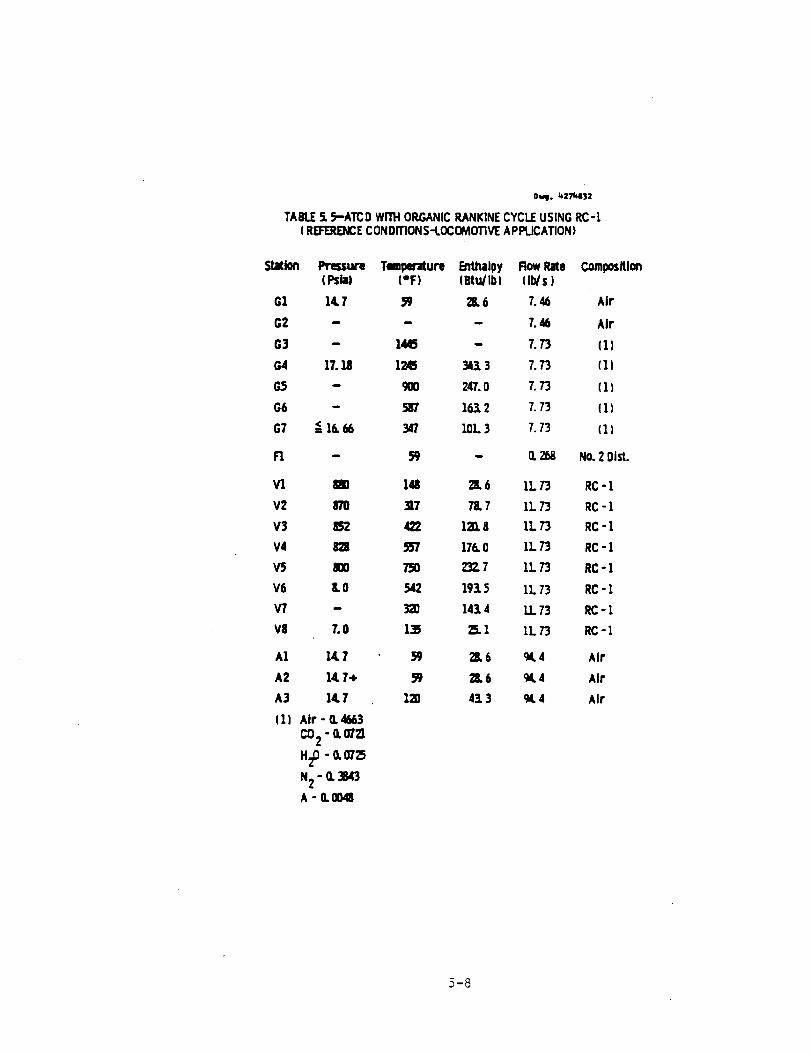
O_j. _27k032
TAmE 5. 5-ATCD wnlt ORGANICRANKINECYCLEUSING RC-I( REFERENCECONDrrloNS-LOCOMOTIVEAPPLICATION)
Station Pressure Temperature Enthalpy Row Rate(Psta| (°F) (Btu/Ibl (Ib/s)
G1 14,7 _ 2S.6 7. 46
G2 - - - 7.46
G3 - 1445 - 7. 73
G4 17.111 1245 34t 3 7. 73
G5 - 900 247.0 7. 73
G6 - 587 163. 2 7. 73
G7 < 16.66 341 101 3 7. 73
FI - 59 - O.268
V1 880 148 3. 6 1L 73
V2 870 _L7 78. 7 1L 73
V3 852 422 1213.8 1L 73
V4 828 _ 176.0 1L 73
V5 800 150 232.7 1L 73
V6 8. 0 542 193.5 1L 73
V7 - 320 14t 4 11 73
V8 7. 0 135 ZS.1 1L 73
A1 14,7 _ 28.6 94.4
A2 14.7<, 59 Z. 6 94.4
A3 14.7 1_n 43.3 q4,4
(1) Air- 0.4663
CO2 - 0. 0721
H_3 - 0, 0725
N_ - • 3M3
A -0.0048
Composition
Air
Air
(1)
(]l
(ll
I1)
(1)
No.2 Dist.
RC-1
RC -1
RC -1
RC-1
RC- I
RC- 1
RC- 1
RC- 1
Air
Air
Air
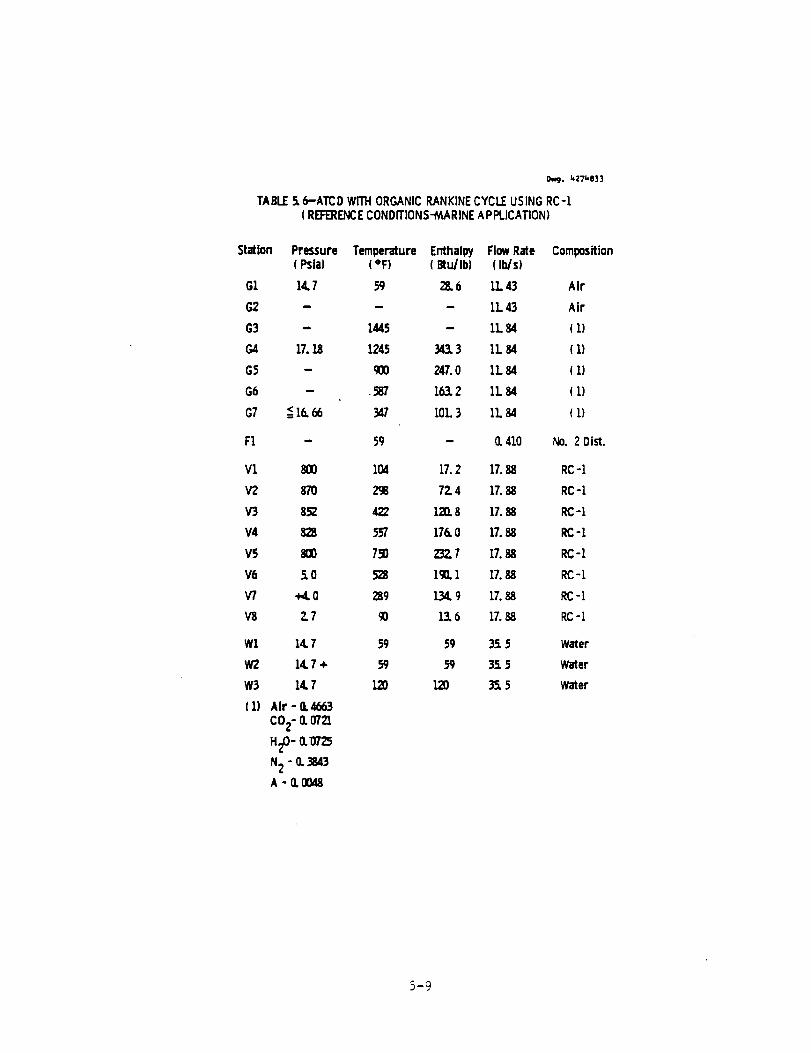
_. t_27_033
TABLE5, 6-ATCD WITHORGANIC RANKINECYCLEUSING RC-I( REFERENCECONDfflONS-MARINEAPPLICATION)
Station Pressure Temperature Enthalw FlowRate Composition(Psla) (°F) (Btu/Ib) ( lids]
G1 14.7 59 23.6 IL 43 Air
G2 - - - 1L43 Air
G3 - 1445 - 1L 84 (1)
C.,4 17.18 1245 343.3 1L 84 (I)
G5 - go0 247.0 11.84 (1)
G6 - . $87 163.2 11.84 (1)
G7 < 16.66 347 101.3 11.84 (1)
F1 - 50 - (1410 No. 2 Dist.
Vl 800 104 17.2 17.88 RC-I
V2 870 298 72.4 17.88 RC-1
V3 852 422 12118 17.88 RC-1
V4 828 557 176.0 17.88 RC-1
V5 800 750 Z3Z 7 17.88 RC-1
V6 5. 0 _ lgO.1 17.88 RC-1
V? +4. 0 289 134.9 17.88 RC-1
V8 Z7 gO 13.6 17.88 RC-1
W1 14.7 5g 59 35. 5 Water
W2 14.7 + 99 59 35. 5 Water
W3 14. 7 ]20 120 35. 5 Water
(1) Air - (144563
CO2- (I 0721
H20- 0.0725
N2 - 0.3843
A - 0.0048
5-9

Table 5.7
PERFORMANCE OF RC-I ORGANIC RANKINE CYCLE
IN MARINE APPLICATION
Engine Type
Cycle Type
Working Fluid
Exhaust Temp. - °F
Stack Temp. - °F
Heat Recovered - Btu/hr
Turbine Power - hp
Pump Power - hp
Net Power - hp
System
Power - hp
SFC - ib/hp hr
PIF, Note 2
ATCD
Organic Rankine
RCI
1245, Note I
347
9.955 x 10⁶
997.1
92.7
904.4
56OO
0.264
1.110
(I) Reference Case
(2) Relative to ATCPD/A Engine Configuration, PIF is
Performance Improvement Factor
5-10
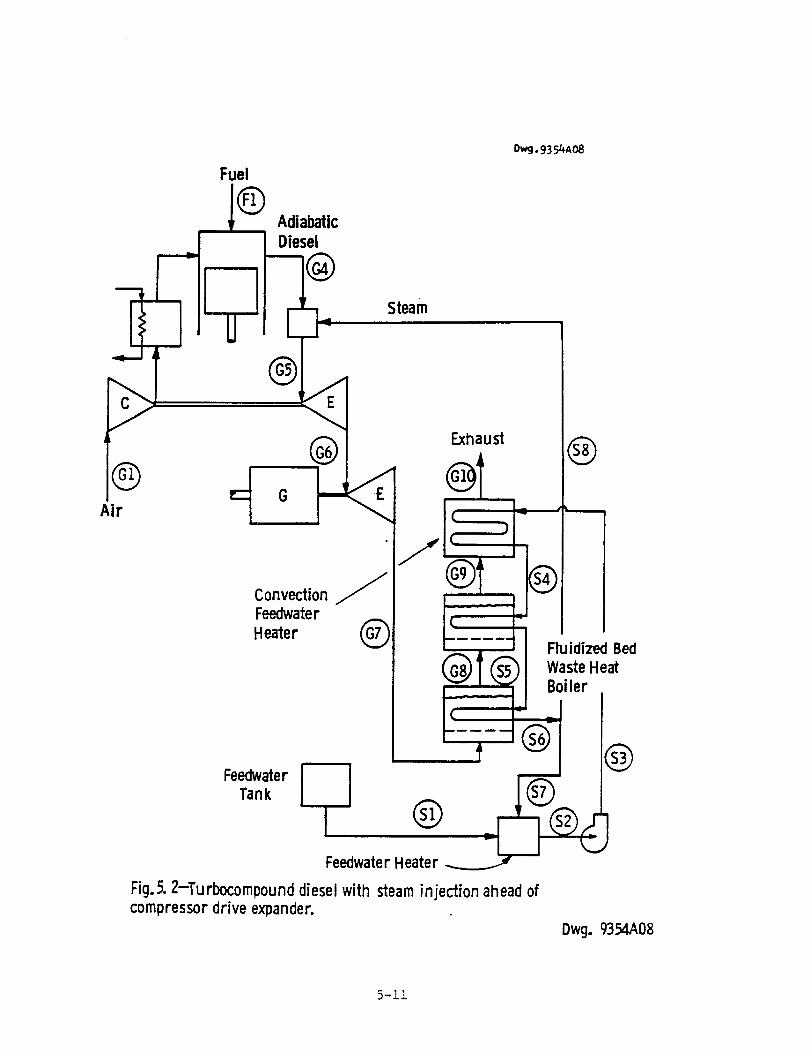
Fuel
D_j. 935J*AO8
Adiabatic
Diesel
Air
I l UiE/
®
G
Steam
@
FeedwaterTank
Convection JFeedwater
Heater (_
Exhaust
ot(
A
($8_
Fluidized Bed
Waste HeatBoiler
I@
Feedwater Heater
Fig.5. 2-Turbocompound diesel with steam injection ahead ofcompressor drive expander.
Dwg. g354A08
5-ii
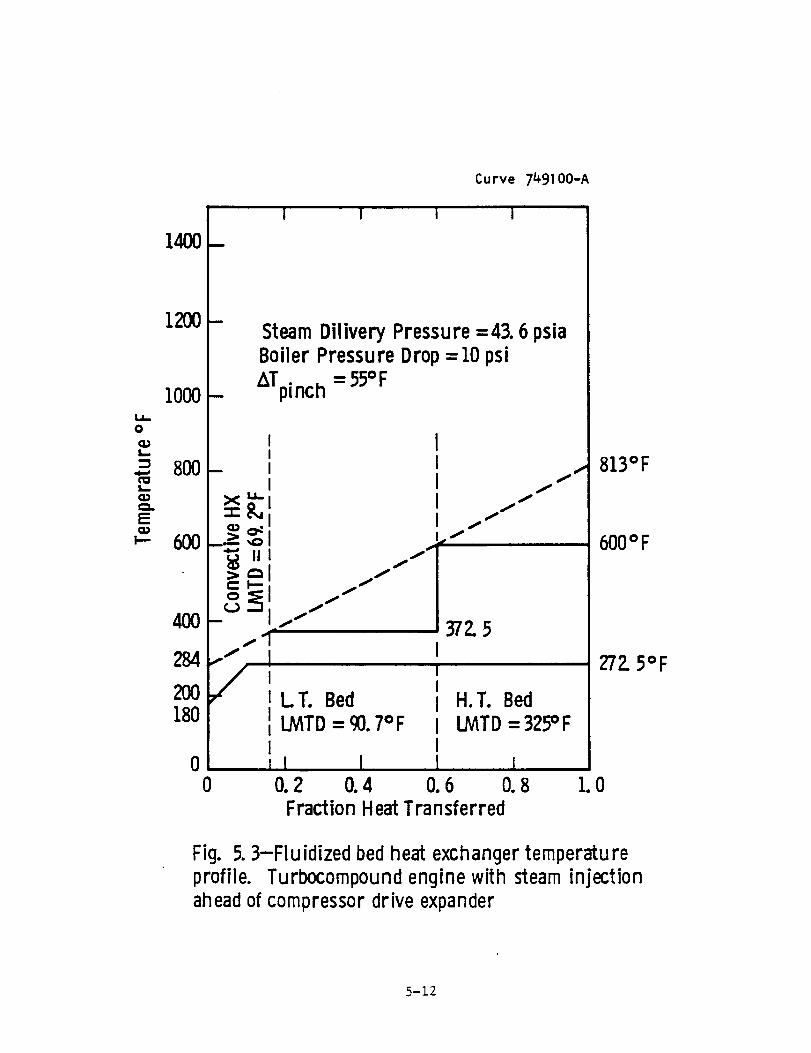
0
¢Pe_L
EQPI--
1400
1200
1000
8OO
600
4OO
284
2OO180
I I
Steam Dilivery Pressure =43. 6 psiaBoiler Pressure Drop= 10psi
ATpinch = 55=F
II
-- II
III
_O I i _
i f
L T. BedI LMTD= 90.7°F
f
i f
H.T.BedLMTD = 325°F
S
00 0.2 0.4 0.6 0.8 1.0
Fraction HeatTransferred
813°F
600°F
Z_Z 5°F
Fig. 5. 3-Fluidized bed heat exchanger temperatureprofile. Turbocompound engine with steam injectionahead of compressor drive expander
5-12

5.2.1 Truck Application
The reference case state point conditions for the truck
application are listed in Table 5.8. Calculations were made for ± 40°F
variations in the cylinder exhaust temperature of the turbocompound
engine compressor-drive expander to determine the sensitivity of thesystem performance. State points conditions for these two cases arelisted in Tables 5.9 and 5.10.
The system performances for the three cases for the truck
application are summarized in Table 5.11. This indicates that there is
a 2.3% change in the system specific fuel consumption for a IOO°Fvariation in cylinder exhaust temperature.
5.2.2 Locomotive and Marine Applications
The state point conditions for the steam injection cycle in the
locomotive application are given in Table 5.12 and those for the marine
application are given in Table 5.13. Since there is no heat rejection
in this cycle, the performances for all applications, including themarine, are the sameand the only parameter which varies with
application is flow rate. The flow rate multiplier for the locomotive
and marine applications are 9.64 and 15.48 respectively.
5.3 Stirling Engine
The final configuration of the Stirling engine bottoming cycle
with heat pipes is shown in Figure 5.4. The heat recovery temperature
profile for this system is shown in Figure 5.5. Two subposed Stirling
engines are used -- one high temperature and one low temperature. Each
engine has a dedicated fluidized bed that operates at the respective
temperature but are integrated into one heat exchanger unit. Mercury is
used as the working fluid in the high temperature heat pipes and toluene
is used in the low temperature ones. Hydrogen is used as the working
fluid in the Stirling engines.
5-13
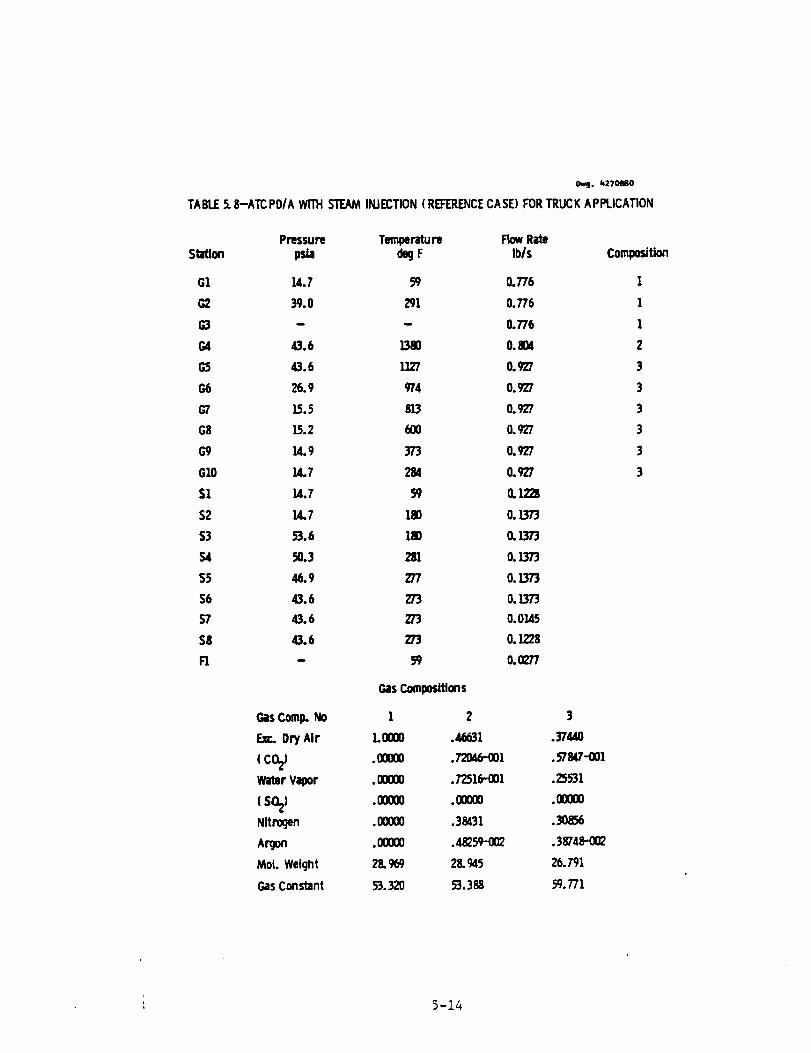
o,,_. kZ7OWO
TABLE5.8-ATePO/A WITHSTEAMINJECTION( REFERENCECASE)FORTRUCKAPI:_.ICATION
Station
G1
O2
(;3
G4
G5
G6
6"7
G8
G9
GIO
S1
$2
S3
$4
$5
$6
$7
$8
F'Z
Pressure Temperature FlowRatepsia de9F Ib/s Composition
_4.7 59 0.776 1
39.0 291 0.776 1
- - 0.776 1
43.5 )380 0.804 2
43.6 1127 0.927 3
26.9 974 0.927 3
15.5 8].3 0.927 3
1.5.2 600 0.927 3
14.9 373 0.927 3
]4.7 284 0.927 3
14.7 59 0.1228
)4.7 IW O.1373
53.6 180 O.1373
50.3 281 O.1373
46.9 277 0.1373
43.6 273 O.[37"3
43.6 273 O.0145
43.6 273 0.1228
- 59 O.O277
GasCompositions
Gas Com. No 1 2 3
DryAir LO000 .46631 .37440
(CO_) .WOO0 .72046-001 .57M7-001
WaterVapor .00000 .72516-.001 . ;5531
( SO2) .(mOO .00000 .WOO0
Nitrogen .00000 .3_31 .30_6
Argon .001300 .4_59-.002 .38748-002
Moi. Weight 28.969 28.945 26.791
GasConstant 53.320 53.388 S_.771
5-14

Station
G1
G2
G3
C,4
G5
G6
G7
G8
G9
GIO
$1
S2
$3
S4
$5
$6
s7
$8
F1
Ov9. L,270g79
TABLE5. 9-ATCPDIA WITHSTEAMINJECTION(HIGH TEMPERATURECASE) FORTRUCK APPLICATION
Pressure Temperature FlowRatepsia (legF Ibis
14.7 59 0.776
39.0 291 O.776
'- - 0.776
43.6 1420 0.804
43.6 1149 O.933
27.2 998 0.933
15.5 _2 0.933
L5.2 600 0.933
14.9 373 0.933
14.7 2_ 0.933
14.7 59 0.1292
14.7 180 O.]445
53.6 180 O.1445
50.3 Z81 0.1445
46.9 277 O.1445
43.6 273 O.1445
43.6 273 0.0153
43.6 273 0.1292
- 59 0.0277
GasCompositions
GasComp. No 1 2
Exc. Dry Air LO000 ._31
( C02) .00000 .72045-001
Water Vapor .00000 .72516-{)01
( SO2) .00000 .00000
Nitrogen .00000 .38431
Argon .00000 .48259-002
Mol. Weight 28.969 28.945
GasConstant 53.320 5"3.388
3
.37062
.5"/263-001
.26283
.00000
.30545
.38357--01_
26.703
60.033
Composition
1
1
1
2
3
3
3
3
3
3
5-15
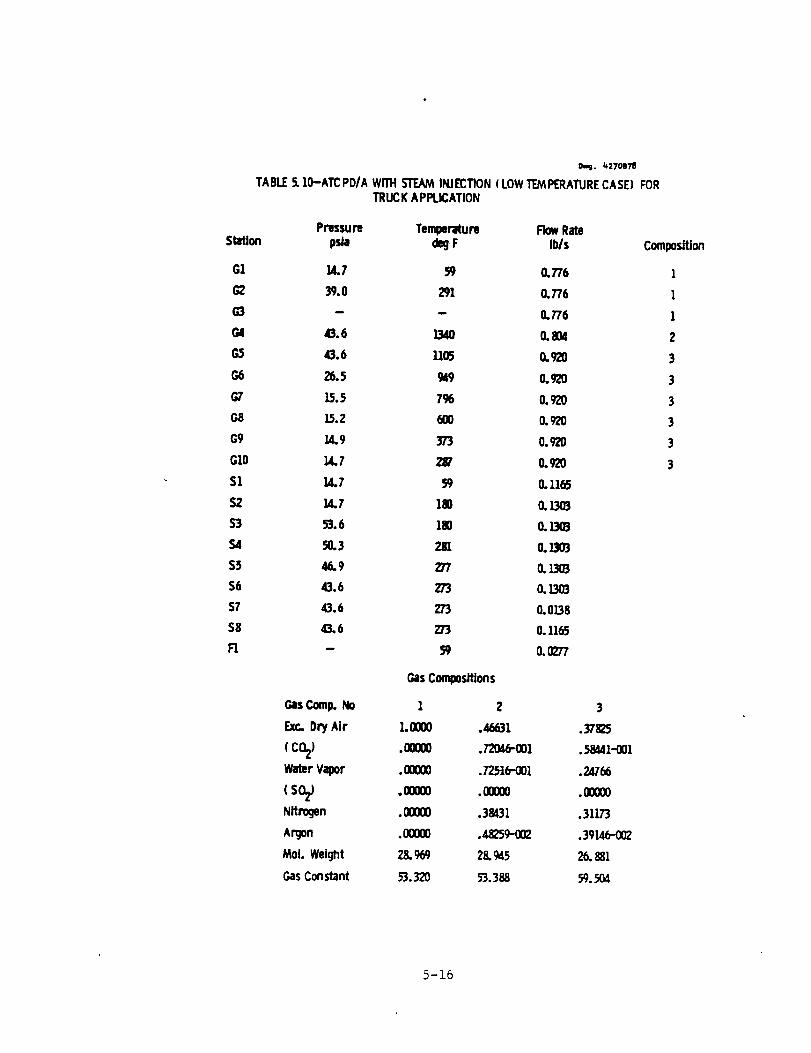
o_. k270S78
TABLE5. IO--ATCPD/A WITH STEAMINJE£TION ( LOWTEMPERATURECASE) FORTRUCK APPLICATION
Pressure Temperature FlowRateStation psia tie9 F Ibis
G1 14.7 59 0,776
(32 39.0 291 0.776
G3 - - 0.776
G4 43.6 )340 0.804
G.5 43. 6 1105 O.929
G6 26.5 949 0.920
G7 15.5 7% 0.920
G8 15.2 6OO O.cy20
G9 ]4.9 373 0.929
GIO 14.7 2_' 0.920
S1 14.7 59 0.1165
S2 14.7 180 O.]303
$3 53.6 180 IL]303
S4 50.3 281 0.1303
$5 46.9 277 0.]3_
$6 43.6 273 O.L_
$7 43. 6 273 O.0138
$8 43. 6 273 O.1165
I:1 - 59 0.(_77
GasCompositions
GasComp. No 1 2 3
Exc. Dry Air 1.0000 .4M31 .)7_.5
( CO2) .00000 .72046-001 .58441-001
Water Vapor .00000 .72.5t6-001 .U,766
( SO2) .00000 .00000 .00000
Nitrogen .00000 .38431 .31173
Argon . IX)O00 ._5_ .3914b-002
Mol. Weight 28. 969 28.945 26.881
GasConstant 53.329 53.388 59.504
Composition
1
1
1
2
3
3
3
3
3
3
5-16
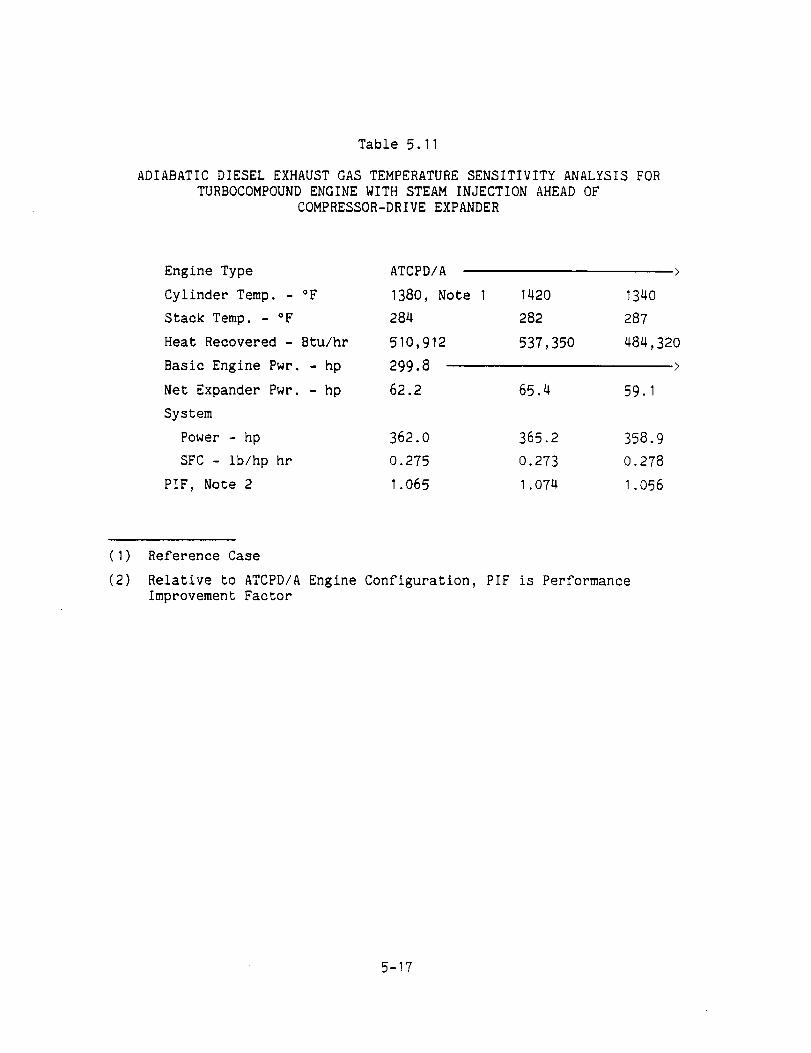
Table 5.11
ADIABATICDIESELEXHAUSTGASTEMPERATURESENSITIVITYANALYSISFORTURBOCOMPOUNDENGINEWITHSTEAMINJECTIONAHEADOF
COMPRESSOR-DRIVEEXPANDER
Engine Type ATCPD/A >
Cylinder Temp. - °F 1380, Note I 1420 1340
Stack Temp. - °F 284 282 287
Heat Recovered - Btu/hr 510,912 537,350 484,320
Basic Engine Pwr. - hp 299.8 >
Net Expander Pwr. - hp 62.2 65.4 59.1
System
Power - hp 362.0 365.2 358.9
SFC - ib/hp hr 0.275 0.273 0.278
PIF, Note 2 1.065 1.074 1.056
(I) Reference Case
(2) Relative to ATCPD/A Engine Configuration, PIF is Performance
Improvement Factor
5-17
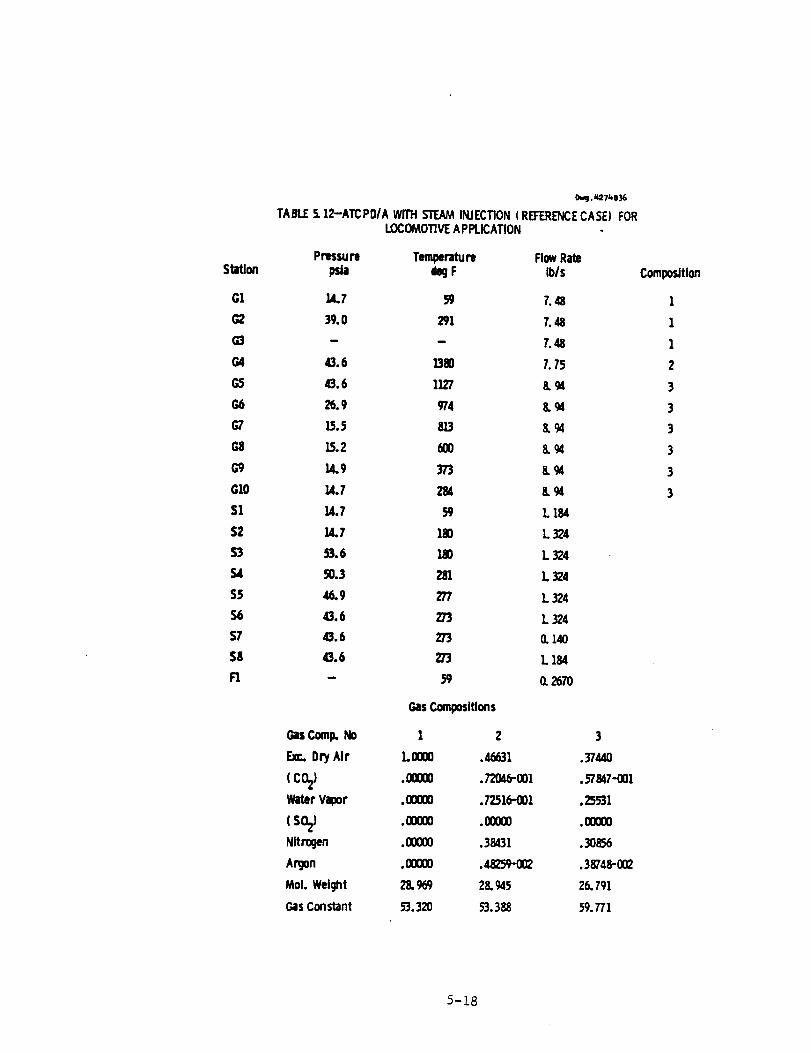
Station
G1
O2
G3
G4
G5
G6
G7
G8
G9
GI0
$1
$2
$3
$4
$5
$6
$7
$8
F1
TABLE5.12-ATCPD/AWITHSTEAMINJECTION(REFEREM_ECASE)FORLOCOMOTWEAPPLICATION
Pressure Temperature FlowRatepsla degF Ibis
)4.7 59 7.48
39.0 291 ?.48
- - 1'.48
43.6 1380 7.15
43.6 1127 8.
26.9 974 8. 94
15.5 813 8.94
]5.2 600 8. 94
14.9 373 8.94
14.7 284 8.94
14.7 59 L 184
14.7 180 L324
53.6 180 L324
50.3 281 L324
46.9 277 L324
43.6 273 L324
43.6 273 O.140
43.6 273 L 184
- 59 O.2670
GasComposltions
GasComp.No 1 2
Ext..DryAir LO000 .46631
( CO2} .00000 .72046-001
WaterVapor .00000 .72516-001
(SO.z) .00000 .00000Nitnxjen .00000 .38431
Argon . OOO00 .ASZSQ-(X)2
Mol. Wel_t 2L 969 28.945
GasConstant 53.320 _.3_
3
.31'440
.57847-001
.25b'31
.00000
.30ff_6
.38748-0l_
26.791
59.771
Composition
l
1
1
2
3
3
3
3
3
3
5-i8
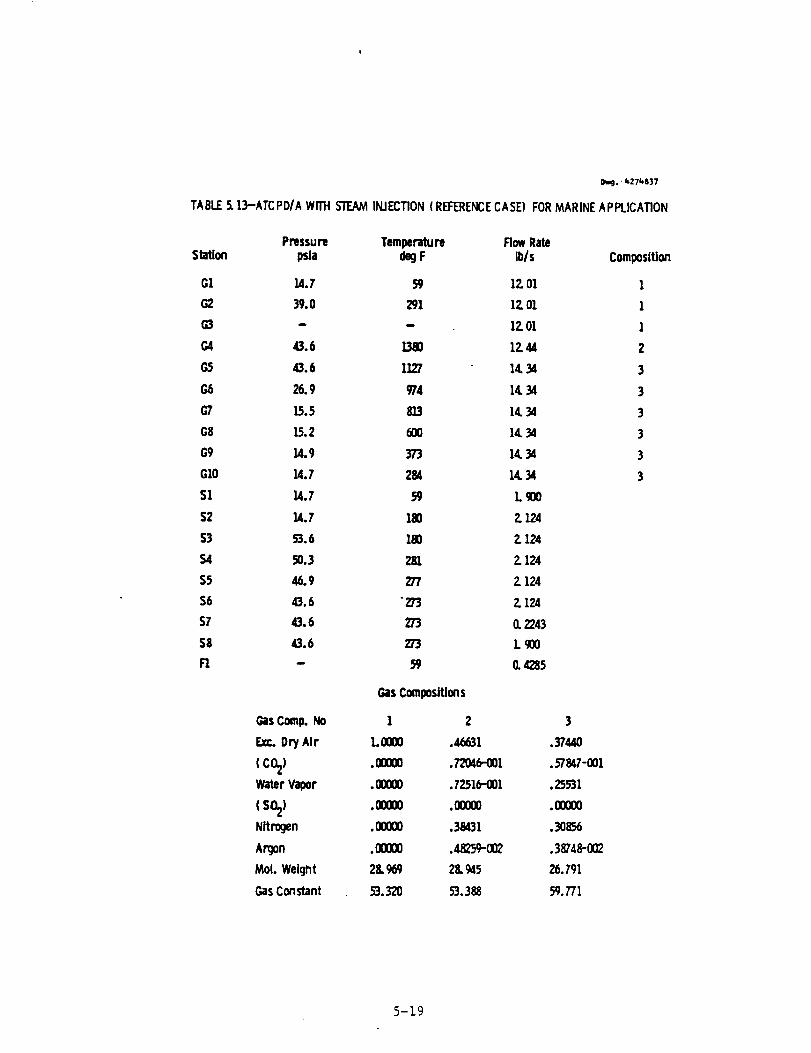
Dwg.. _.27_,e37
TABLE5.13-ATCPDIAWITHSTEAMINJECTION( REFERENCECASE)FORMARINEAPPLICATION
Station
G!
G2
(;3
C4
G5
G6
5"7
G8
G9
GZO
$1
52
$3
$4
$5
$6
$7
$8
F1
Pressure Temperature FlowRatepsla (legF Ibis
14.7 59 12.01
39.0 291 12.01
- - 12.O1
43.6 ]390 12.44
43.6 1127 14.34
26.9 97'4 14.34
15.5 8]3 14.34
15.2 600 14.34
14.9 373 14.34
14.7 284 14.34
14.7 Y) Lg00
14.7 180 2.124
53.6 180 2.124
50.3 281 2. 124
46.9 227 2. 124
43.6 "27'3 2.124
43.6 273 O.2243
4.3.6 273 L_O0
- 59 0.4285
GasCommsitlons
GasComp.No 1 2
Exc.DryAir L0000 .4(_31
( CO2) .00000 .7204(_-001
WaterVapor .00000 .72516-001
( SO2) .00000 .00000
Nitrogen .00000 .38431
Argon .00000 .48259-002
Mol. Weigl_t 28.969 28.945
GasConstant 53.320 _.388
3
•37440
._7847-001
.25_31
.00000
.30856
.38748-002
26.791
59.771
Composition
1
1
l
2
3
3
3
3
3
3
5-19
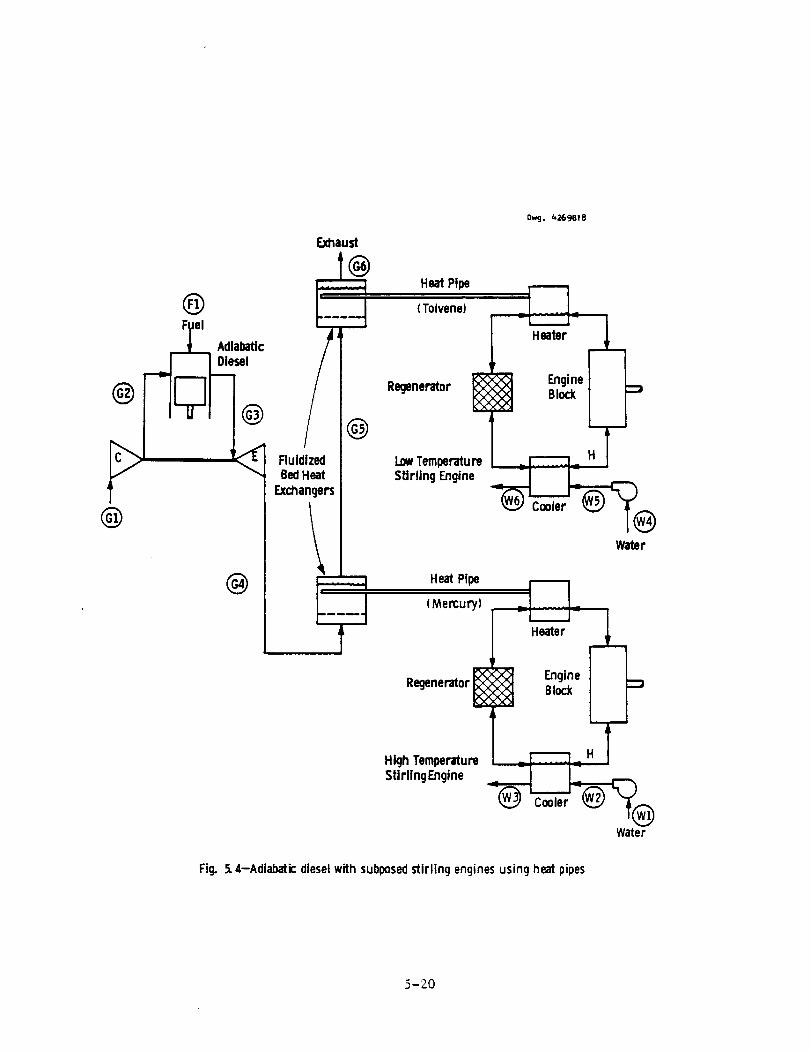
@F_Jel
@
@
EJdlau_
@RuidizedBedHeat
Ex_angers
l
HeatPipe
(Toivene)
Regenerator
LowTemperatureStirling Engine
HeatPipe
(Me_u_)
Regenerator
High TemperatureStirlingEngine
Dwcj. 4269818
-L.__L.I -Heater
EngineBlock
Wtder
-I I-
Heater
EngineBlock
Water
Fig. 5.4-Adiabaticdieselwith subposedstirling enginesusingheat pipes
5-20
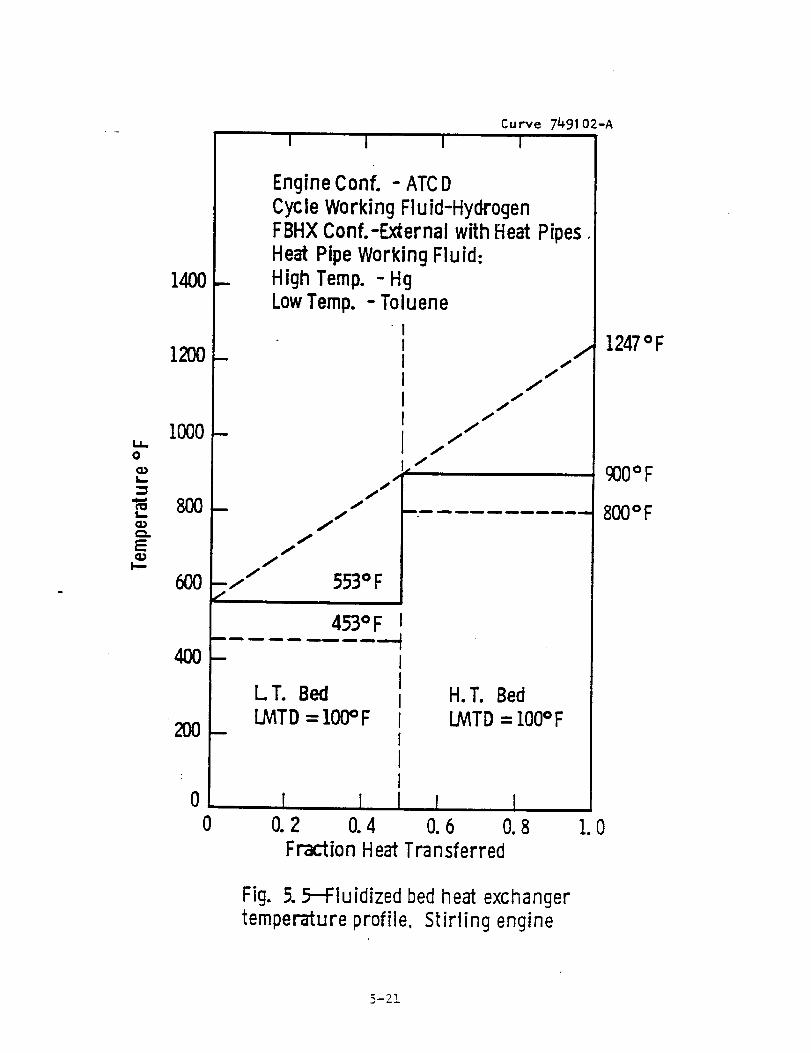
I=t.0
t_
t_
EI--
1400
1200
1000
800
600
400
200
0
ff
f--/
0
I I ICurve 749102-A
I
Engine Conf. - ATCDCycle Working Fluid-HydrogenFBHXConf.-External with Heat PipesHeat PipeWorkingFluid:High Temp. - HgLowTemp. - Toluene
//tj
/ t
/tJ
1247oF
f
1 /
_ cX30°Ftl t" 800OF
553°F
f
453°F=uln,_. _ .-ram, ._1, ,.ilI=,,_D ,fin _l=m,ill,_
-- II
L l'. Bed I H.T. BedLMTD= 100°F I LMTD= 100°F
-- III
I Y I l I0.2 0.4 0.6 0.8
Fraction HeatTransferred1.0
Fig. 5. 5--Fluidized bedheat exchangertemperature profile, Stirling engine
5-21
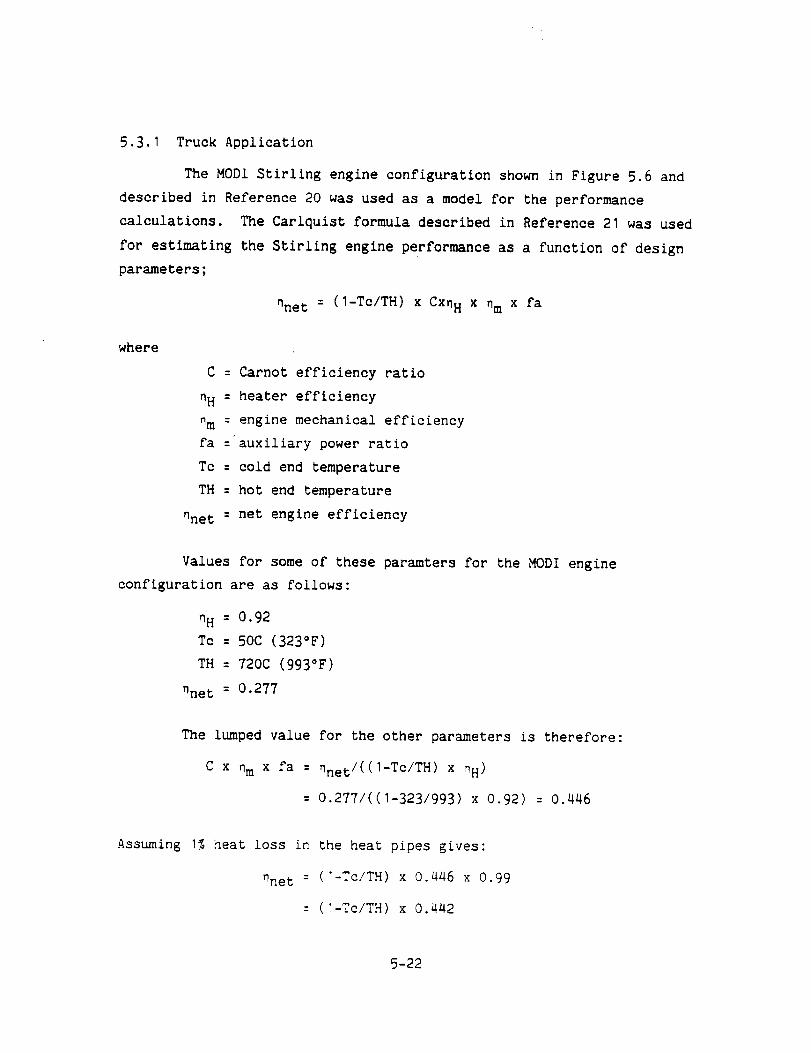
5.3.1 Truck Application
The MODI Stirling engine configuration shown in Figure 5.6 and
described in Reference 20 was used as a model for the performance
calculations. The Carlquist formula described in Reference 21 was used
for estimating the Stifling engine performance as a function of design
parameters;
nne t : (I-Tc/TH) x Cxn H x nm x fa
where
C = Carnot efficiency ratio
nH = heater efficiency
nm = engine mechanical efficiency
fa =auxiliary power ratio
Tc = cold end temperature
TH = hot end temperature
nne t = net engine efficiency
Values for some of these paramters for the MODI engine
configuration are as follows:
nH = 0.92
Tc = 50C (323°F)
TH = 72OC (993°F)
nne t = 0.277
The lumped value for the other parameters is therefore:
C x nm x fa = nnet/((1-Tc/TH) x nH)
= 0.277/((I-323/993) x 0.92) = 0.446
Assuming I% heat loss in the heat pipes gives:
nne t = (I-Tc/TH) x 0.446 x 0.99
= (I-Tc/TH) x 0.442
5-22
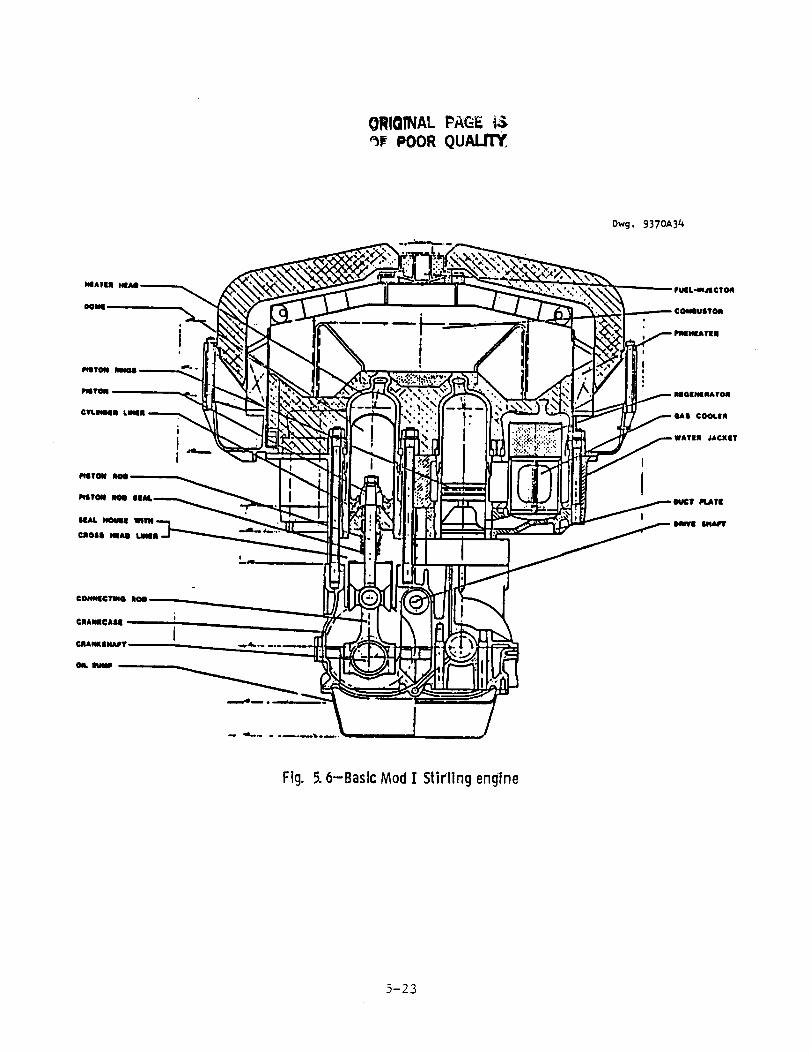
ORIOINAL P_GE 15_1_ POOR QUALJ_
L
Dwg. 9370A34
Fig. 5.6-Basic Mod ! Stirflng engine
5-23
Performance calculations were made for this system for the
reference conditions for the truck application and for +53°F and -47°F
variations of the diesel engine exhaust temperature.
State points conditions for the reference, high temperature, and
low temperature cases are listed in Tables 5.14, 5.15 and 5.16
respectively. The calculated performance for these three cases are
summarized in Table 5.17 and 5.18. The sensitivity of system specific
fuel consumption to diesel engine exhaust temperature is indicated to be
about 2.5% per IOO°F.
5.3.2 Locomotive and Marine Applications
The state point conditions for the locomotive and marine applica-
tions are listed in Tables 5.19 and 5.20, respectively. The values for
the locomotive are the same as those for the truck except for flow rate.
The flow rate multiplier is 10.0. System performance is uneffected.
For the marine application, heat rejection is to the river water
rather than to the air so the cold end temperature of the Stirling
engines is reduced from 122°F to IO5°F. Temperature and enthalpy values
are, therefore, different for the marine application. The system
performance is only slightly affected as shown in Table 5.21.
5.4 Performance of Selected Systems
The performances of the three selected systems for each of the
three applications are summarized in Table 5.22. This indicates that
the organic Rankine cycle has a 2% advantage in the Specific Fuel
Consumption (SFC) than the steam injection and 4% better than the
Stirling for the truck and locomotives applications. For the marine
application, the organic Rankine cycle shows a 4% advantage in SFC than
steam injection and 6% better than the Stirling engine.
These results when compared to the NASA Deference adiabatic
Turbocompound Diesel with aftercooling (Table 2.1) show that the heat
recovery subsystem can result in a 5 to 11 percent SFC advantage for :he
5-24
adiabatic diesel. The cost effectiveness of the SFCadvantage will
depend on the trade-off between the fuel cost savings and heat recoverysystem capital investment.
5'25
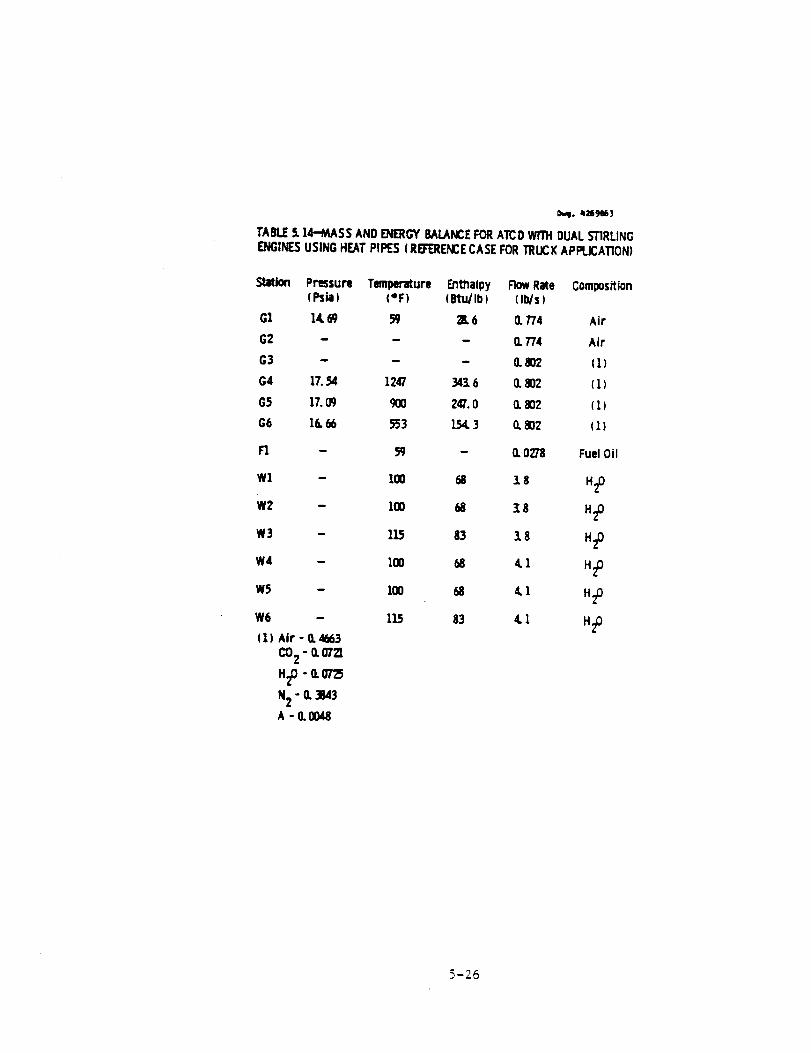
C_l. 4_9e63
TABLEf M-MASS AND ENERGYBALANCEFORATCDwrrH DUALSTIRLING
ENGINESUSING HEATPIGS (REFERENCECASEFORTRUCKAPPLICATION)
Station Pressure Temperature Enthalpy Row Rate Composition(Psia) (°F) (Btldlb) (Ib/s)
G1 14.69 59 _. 6 (1 774 Air
G2 - - - (1774 Air
G3 - - - 0.802 (I)
G4 17.54 1247 34t 6 (1 802 ( 1)
G5 17.09 900 247.0 (1802 ( 1)
G6 16. 66 553 154. 3 (1802 ( 1 )
F1 - _ - (1 0278 Fuel Oil
Wl - 100 68 1 8 H20
W2 - 100 68 I8 H_
W3 - 11_ 83 3.8 H20
W4 - 100 68 4. 1 H20
W5 - 100 68 4.l H20
W6 - 11.5 83 4. 1 H2011) Air - (14663
CO2 - 0. 0721
H20 - (10725
N2 - (1 3M3
A -(1OO48
5-26

I),,,g. 4269B62
TABLE5. 15-MASS AND ENERGYBALANCEFORATCDWITH DUALSTIRLINGENGINESUSING HEATPIPES (HIGH T_PERATURE CASE FORTRUCK
APPtlCATION)
Station Pressure Temperature Enthaipy FlowRate Composition(Psial (°F) (Btu/Ib) (Ib/s)
G1 14. 69 ._ 28.6 (17"/4 Air
G2 - - - 0.7"/4 Air
G3 - - - 0.802 (1)
G4 17.54 1300 359.2 O.802 ( 1 )
G5 17.09 900 247.0 0. 802 ( 1)
G6 16.66 500 140.5 0.802 (1)
FI - 59 - 0. 0278 Fuel Oil
W1 - 100 68 4. 5 H20
W2 - I00 68 4. 5 H20
W) - 115 83 4. 5 H20
W4 - I00 68 4.8 H20
W5 - ZOO 68 4. 8 H20
W6 - 115 83 4. 8 H20
( l ) Air - O.41663
CO2 - 0.0721
H20 -O.O725
N2 - (I3B43
A -0.13048
5-27
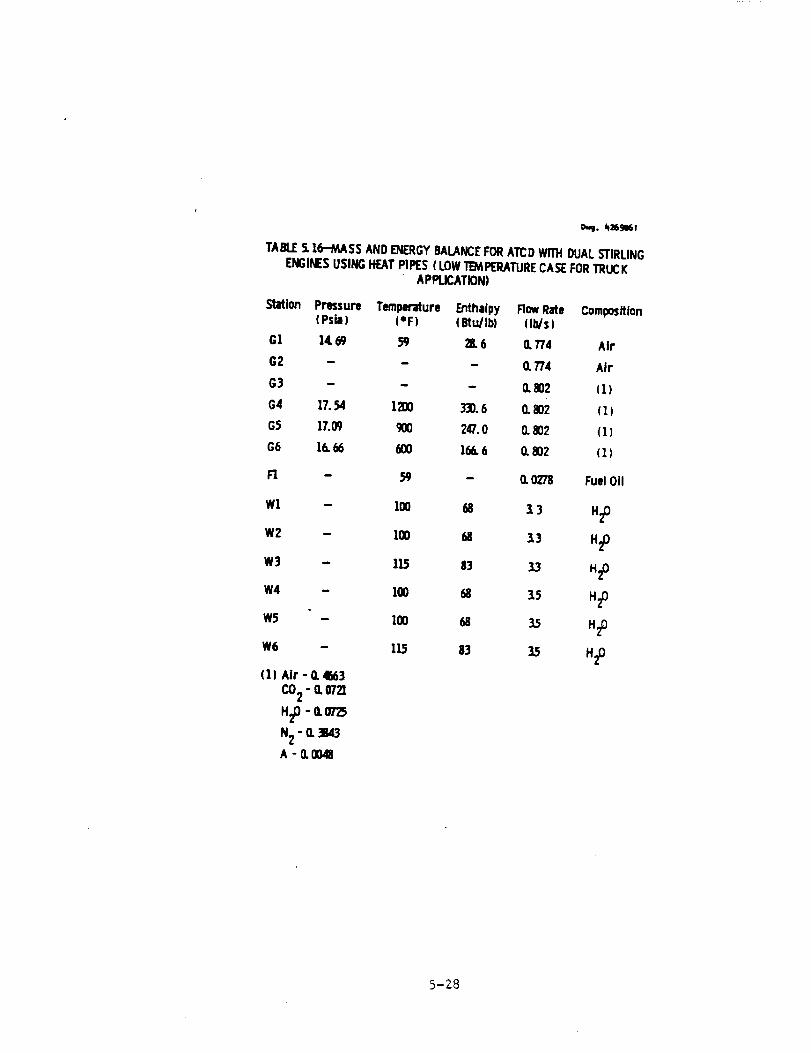
ovj. _269_w
TABLE5. 16-MASS AND ENERGYBALANCEFORATCD WITH DUALSTIRLINGENGINESUSINGHEAT PII_S ( LOWTEMPERATURECASEFORTRUCK
A PPLICAT]ON)
Station Pressure Temperature Enthalpy FlowRate Composition(Psla) (eF) (Btu/Ib) (Ib/s)
GI 14. 69 59 Z 6 O.774 Air
G2 - - - 0. 774 Air
G3 - - - 0.802 (1)
(;4 17.54 1200 3]0. 6 (1 802 ( 1)
G5 17.09 900 247.0 0. 802 ( 1 )
G6 16.66 600 166.6 (1802 ( 1 )
F1 - 59 - 0. 0278 Fuel 011
W1 - 100 68 1 3 H20
W2 - 100 68 13 H20
W3 - 115 83 13 HzO
W4 - 100 68 15 H20
W5 - 100 68 15 H2O
W6 - 115 83 35 H20
(1) Air - I1 4E63
CO2 - 0.0721
H20 -0.0725
N2 - 0. )M3
A -O.OO48
5-28
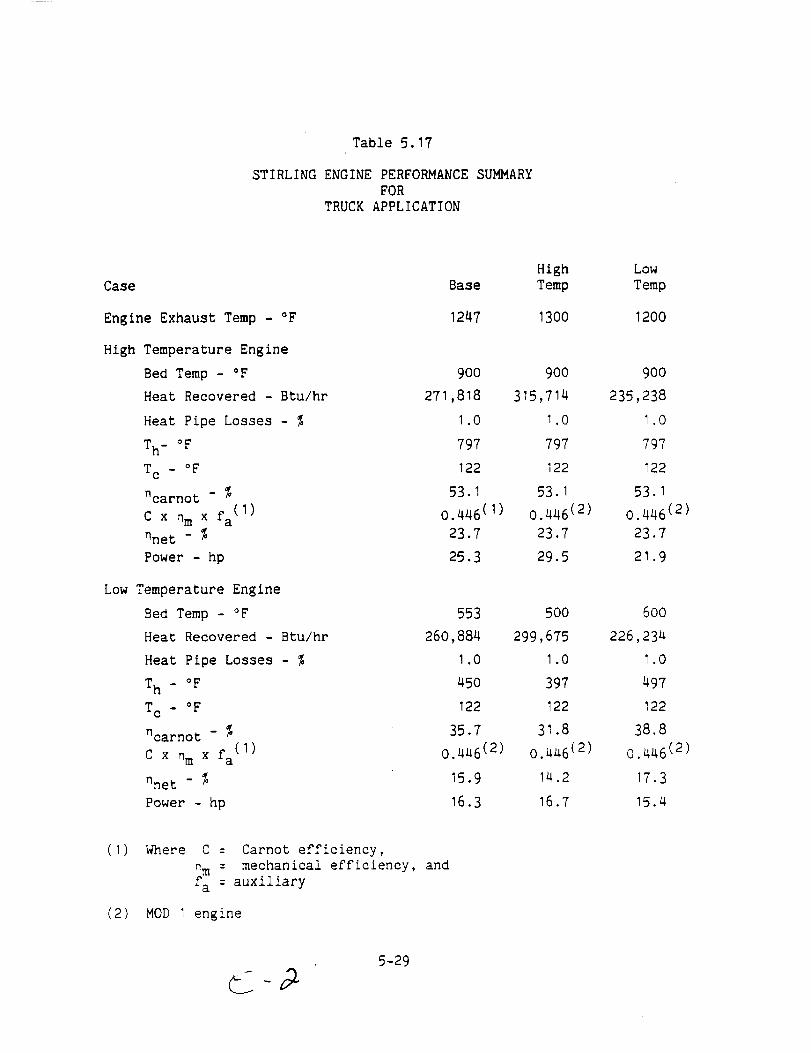
Table 5.17
STIRLINGENGINEPERFORMANCESUMMARYFOR
TRUCKAPPLICATION
Case
Engine Exhaust Temp - °F
High Temperature Engine
Bed Temp - °F
Heat Recovered - Btu/hr
Heat Pipe Losses - %
Th- OF
T c - oF
ncarnot - %
C x nm x fa (I)
nne t - %
Power - hp
Low Temperature Engine
Bed Temp - °F
Heat Recovered - Btu/hr
Heat Pipe Losses - %
Th - oF
Tc - oF
ncarnot - %
C x nm x fa (I)
nne t - %
Power - hp
Base
1247
High
Temp
13oo
Low
Temp
1200
9OO 90O 900
271,818 315,714 235,238
I .0 I.0 I.0
797 797 797
122 122 122
53.1 53.1 53.1
0.446 (I) 0.446 (2) 0.446 (2)
23.7 23.7 23.7
25.3 29.5 21.9
553 5OO 600
260,884 299,675 226,234
I .0 I.0 I.O
450 397 497
122 122 122
35.7 31.8 38.8
0.446 (2) 0.446 (2) 0.446 (2)
15.9 14.2 17.3
16.3 16.7 15.4
(I) Where C = Carnot efficiency,
nm = mechanical efficiency, and
fa = auxiliary
(2) MOD I engine
5-29
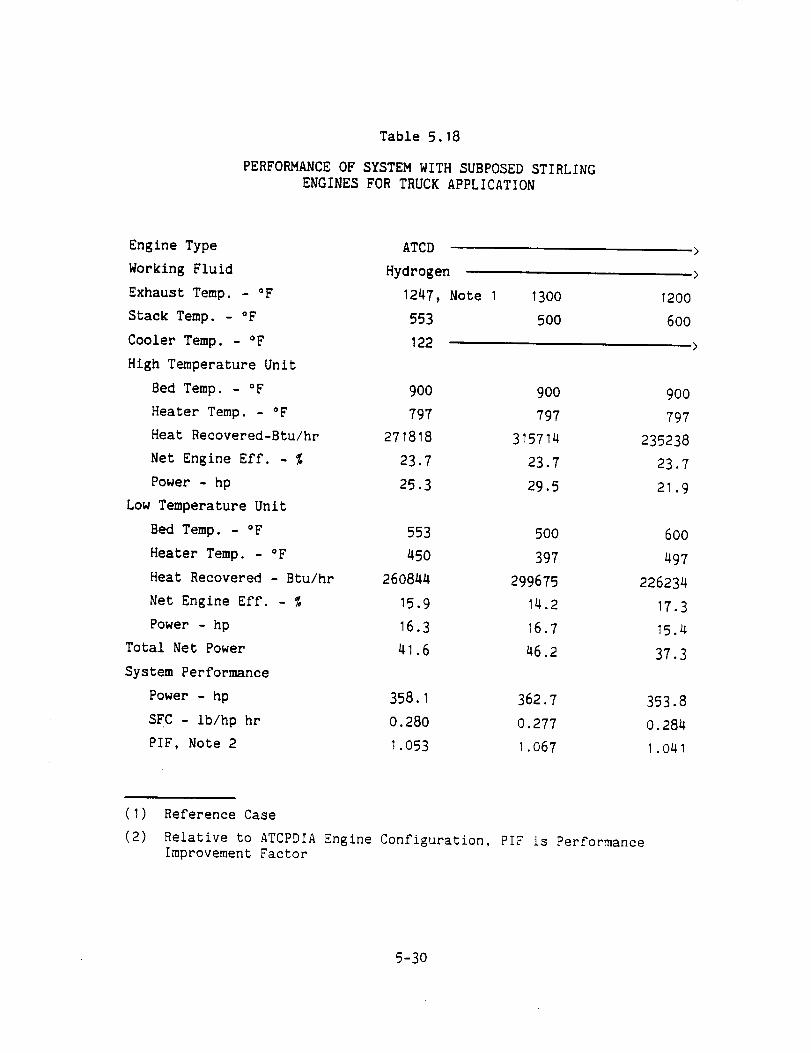
Table 5.18
PERFORMANCE OF SYSTEM WITH SUBPOSED STIRLING
ENGINES FOR TRUCK APPLICATION
Engine Type ATCD
Working Fluid
Exhaust Temp. - °F
Stack Temp. - °F
Cooler Temp. - °F
High Temperature Unit
Bed Temp. - °F 900
Heater Temp. - °F 797
Heat Recovered-Btu/hr 271818
Net Engine Eff. - % 23.7
Power - hp 25.3
Low Temperature Unit
Bed Temp. - °F 553
Heater Temp. - °F 450
Heat Recovered - Btu/hr 260844
Net Engine Eff. - % 15.9
Power - hp 16.3
Total Net Power 41.6
System Performance
Power - hp 358.1
SFC - ib/hp hr 0.280
PIF, Note 2 1.053
Hydrogen
1247, Note I
553
122
13OO
500
1200
6OO
>
900
797
315714
23.7
29.5
900
797
235238
23.7
21.9
500
397
299675
14.2
16.7
46.2
600
497
226234
17.3
15.4
37.3
362.7
0.277
1.067
353.8
0.284
1.041
(I) Reference Case
(2) Relative to ATCPDIA Engine Configuration, PIF is PerformanceImprovement Factor
5-30
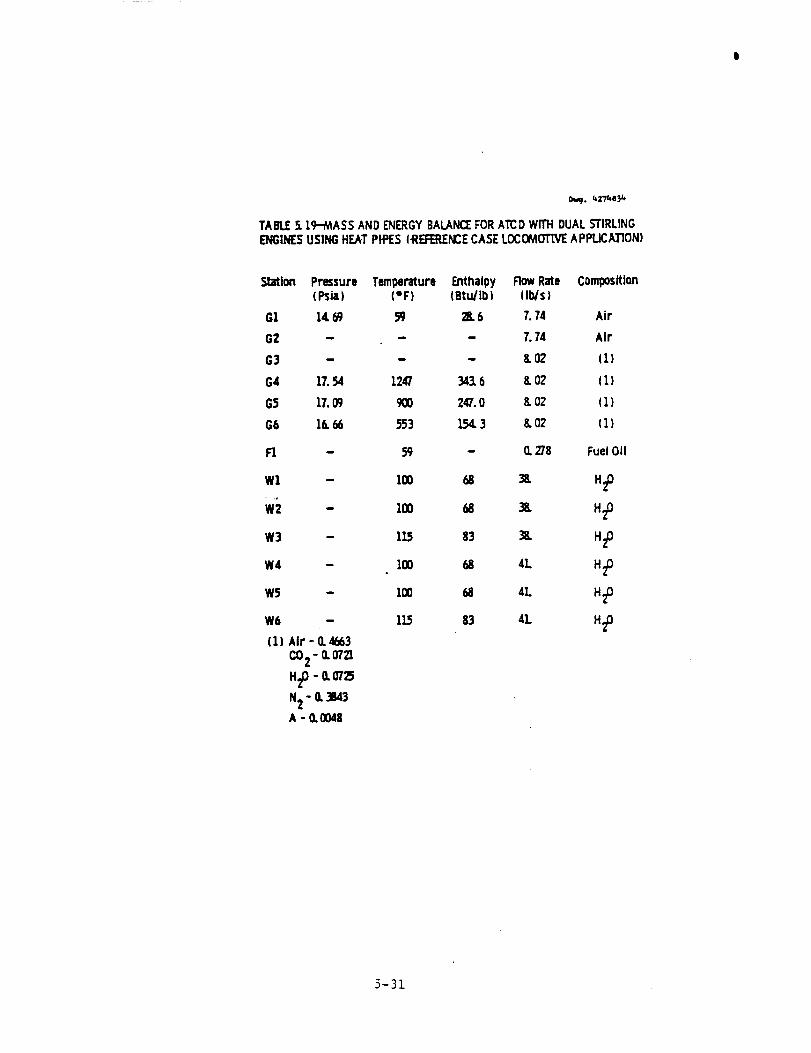
_,q. _27_.e_
TABLE5. 19-MASS AND ENERGYBALANCEFORATCD WITH DUALST1RLINGENGINESUSINGHEAT PIPES (_EFEP_NCECASE LOC_WOTLVEAPPt.JCA]'ION)
Station Pressure Temq_erature Enthall3y Row Rate Composition(Psia) (eF) (Btldlbl (figs)
G1 14.69 59 2B.6 7. 74 Air
G2 - - - 7. 74 Air
G] - - - ¢02 (1)
G4 17.54 1247 343.6 8. 02 ( 1 )
G$ 17.09 900 247.0 8. 02 ( 1 }
G6 16.66 553 154. 3 8. 02 ( 1 }
F1 - 59 - 0. 278 Fuel 011
Wl - t00 68 38. H20
- loo 68 l .zoW3 - 115 83 _ H20
W4 - 100 68 4L H20
W5 - 100 68 4L H2D
W6 - 115 83 4L H20
(1) Air - O.4_3
CO2 - 0.0721
H20 - _ O725
N2 - 0. 3843A -0.O048
5-31
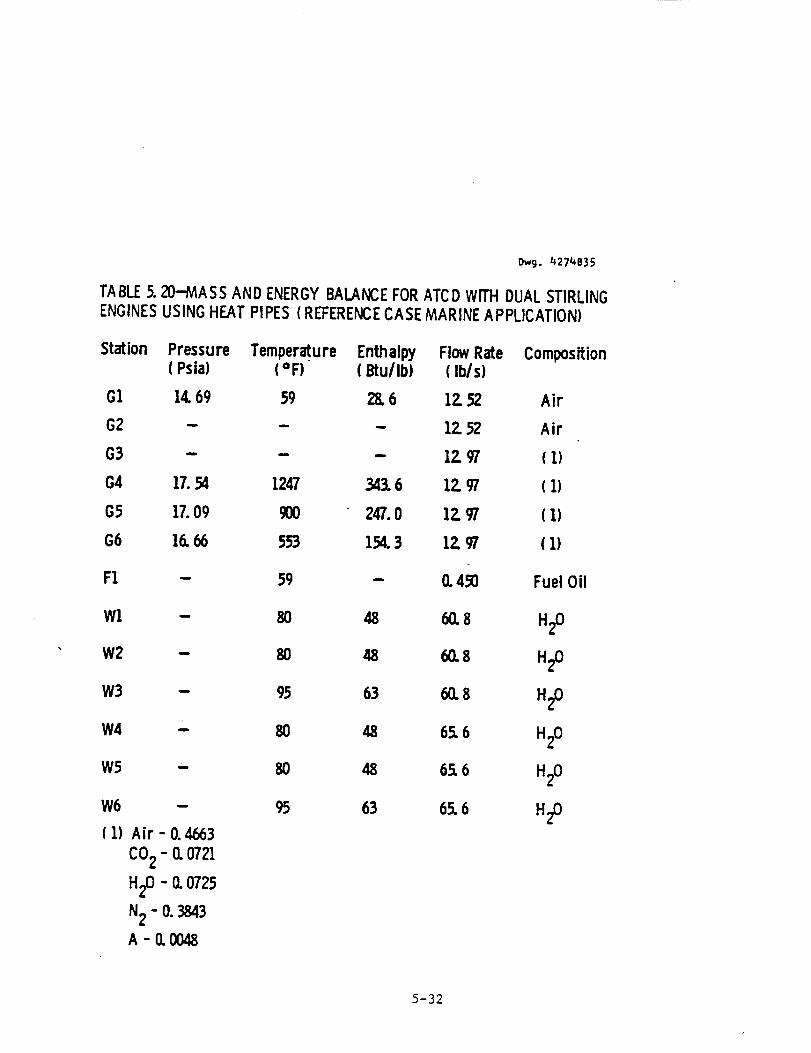
Owg. 4274835
TABLE5. 20-MASS AND ENERGYBALANCEFORATCD WITH DUALSTIRLINGENGINESUSING HEAT PIPES (REFERENCECASE MARINE APPLICATION)
Station Pressure(Psia)
G1 14.69
G2
G3
G4 17.54
G5 17.09
G6 16.66
F1
Wl
W2
W3
W4
W5
W6
(1) Air - O.4663
CO2 - (3.0721
H2D - 0. 0725
N2 - 0. 3843
A - 0.0048
Temper=ure Enthalw FlowRate Composition(=F) (Btu/Ib) (Ibis)
59 28.6 1Z 52 Air
- - 1Z 52 Air
- - 1Z 97 (1)
1247 343.6 1Z 97 (1)
900 247.0 12. 97 (1)
553 154.3 12. 97 (1)
59 - 0. 450 Fuel Oil
8O 48 6O.8 H20
80 48 60.8 H20
95 63 60. 8 H20
80 48 65. 6 H20
80 48 65.6 H20
95 63 65. 6 H2D
5-32
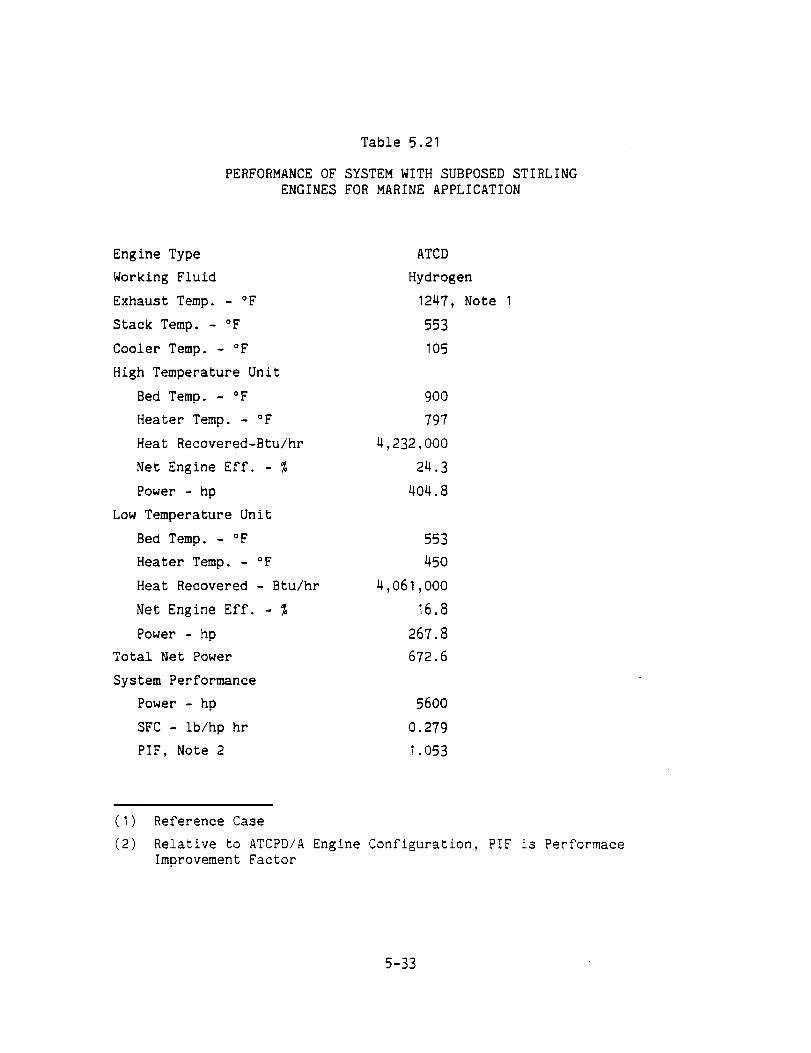
Table 5.21
PERFORMANCE OF SYSTEM WITH SUBPOSED STIRLING
ENGINES FOR MARINE APPLICATION
Engine Type
Working Fluid
Exhaust Temp. - °F
Stack Temp. - °F
Cooler Temp. - °F
High Temperature Unit
Bed Temp. - °F
Heater Temp. - °F
Heat Recovered-Btu/hr
Net Engine Eff. - %
Power - hp
Low Temperature Unit
Bed Temp. - °F
Heater Temp. - °F
Heat Recovered - Btu/hr
Net Engine Eff. - %
Power - hp
Total Net Power
System Performance
Power - hp
SFC - ib/hp hr
PIF, Note 2
ATCD
Hydrogen
1247, Note I
553
105
900
797
4,232,000
24.3
4O4.8
553
45O
4,061,000
16.8
267.8
672.6
56OO
0.279
1.053
(I) Reference Case
(2) Relative to ATCPD/A Engine Configuration, PIF is Performace
Improvement Factor
5-33
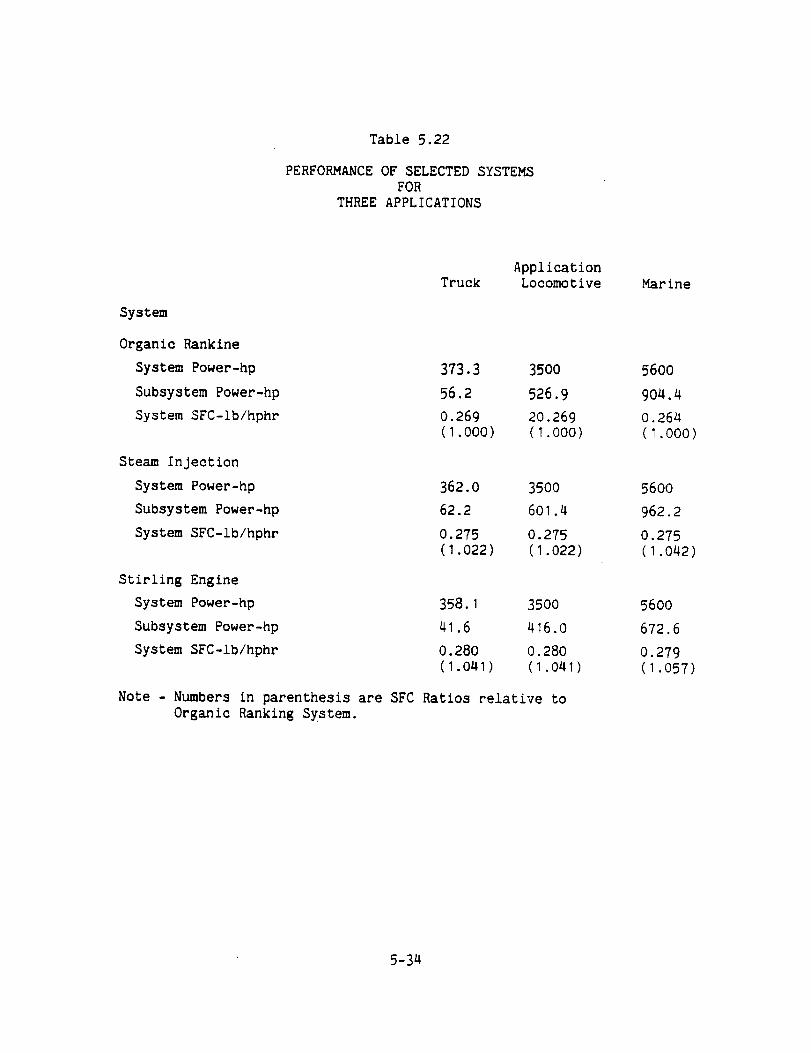
Table 5.22
PERFORMANCE OF SELECTED SYSTEMSFOR
THREE APPLICATIONS
System
Organic Rankine
System Power-hp
Subsystem Power-hp
System SFC-ib/hphr
Steam Injection
System Power-hp
Subsystem Power-hp
System SFC-ib/hphr
Stifling Engine
System Power-hp
Subsystem Power-hp
System SFC-ib/hphr
ApplicationTruck Locomotive Mar ine
373.3 350o 56oo
56.2 526.9 904.4
0.269 20.269 0.264
(1.000) (1.000) (1.000)
362.0 3500 5600
62.2 601.4 962.2
0.275 0.275 0.275
(I.022) (1.022) (1.042)
358.1 35OO 5600
41.6 416.0 672.6
0.280 0.280 0.279
(1.041) (1.041) (1.057)
Note - Numbers in parenthesis are SFC Ratios relative to
Organic Ranking System.
5-34
6. PRELIMINARY DESIGN AND COSTS OF FLUIDIZED BED HEAT EXCHANGERS
FOR SELECTED SYSTEMS
6.1 Conceptual Description of the Heat Recovery Unit
Conceptually, the unit consists of one or more stages of
fluidized bed heat recovery with the possibility of a final convective
heat recovery stage as is shown in Figure 6.1. Horizontal runs of tubes
in many possible configurations pass through each stage of bed and the
convective section in a direction generally in counter-current flow with
the rising diesel exhaust gas. Each stage of bed is made up of a
distributor plate for distributing the diesel gas across the bed cross-
section, a fluidized bed of the selected particles, a splash zone
directly above the bed and the freeboard region where particles ejected
from the bed due to bubbles rising through the bed are allowed to
disengage from the gas and drop back into the bed. Diesel exhaust gas
is introduced through an inlet plenum to the first distributor plate.
The distributor plates are orifice-type plates that are insulated from
the fluidized bed to keep it at maximum temperature to minimize
deposition. The gas passes through each shallow bed in a mode of
turbulent fluidization, resulting in high rates of circulation of the
particles in the bed, uniform bed temperature on each stage, and high
rates of heat transfer from the bed to the tubes.
Deposits formed on the tubes are removed by the circulating bed
material in the form of agglomerated flakes of sooty material.
Likewise, deposits on the bed particles are removed as agglomerates,
much larger than the original submicron soot particles in the diesel
exhaust gas. The agglomerates are assumed to pass through the unit
without significant accumulation and to be of a size that could be
easily collected downstream.
6-I
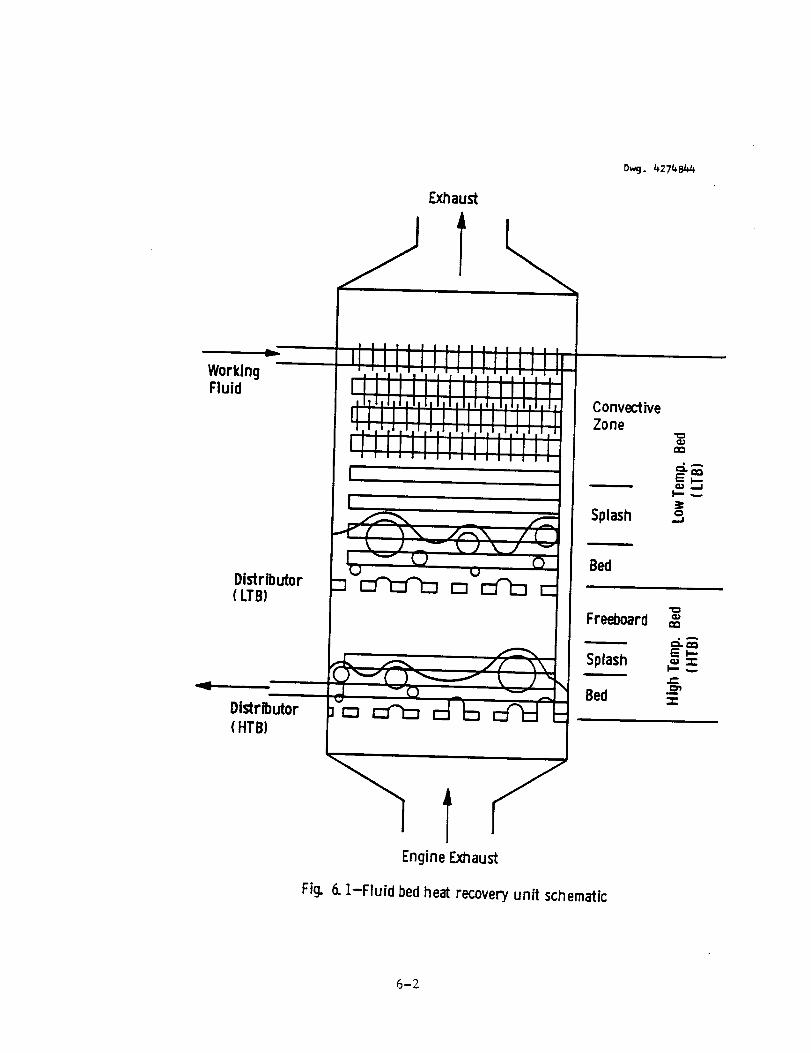
D_. _27_8_
v
WorkingFluid
Distributor(LTB)
_...=m
Distributor
(HTB)
i,
ConvectiveZone
_D
_D
Splash o,,..l
Bed
Freeboard =
----_.. ,4_
Splash ==:E_-.
t,-
Bed =:
1I JEngine Exhaust
Fig. 6. 1-Fluid bed heat recovery unit schematic
6-2
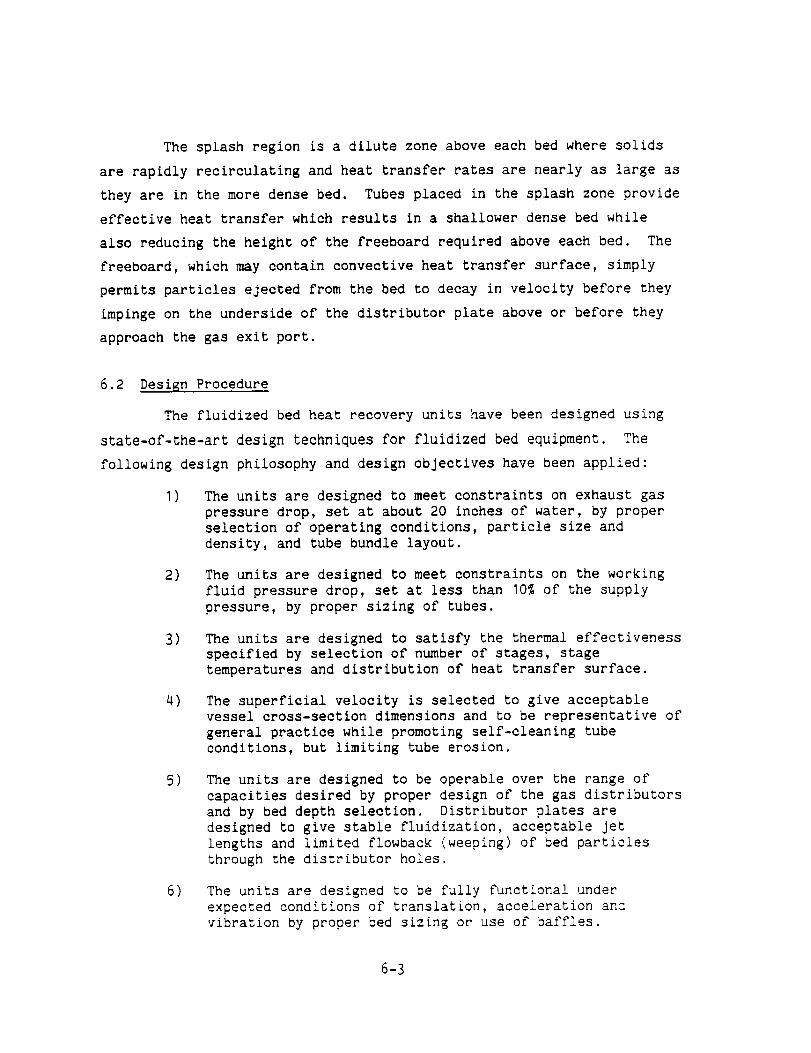
The splash region is a dilute zone above each bed where solids
are rapidly recirculating and heat transfer rates are nearly as large as
they are in the more dense bed. Tubes placed in the splash zone provide
effective heat transfer which results in a shallower dense bed while
also reducing the height of the freeboard required above each bed. The
freeboard, which may contain convective heat transfer surface, simply
permits particles ejected from the bed to decay in velocity before they
impinge on the underside of the distributor plate above or before they
approach the gas exit port.
6.2 Design Procedure
The fluidized bed heat recovery units have been designed using
state-of-the-art design techniques for fluidized bed equipment. The
following design philosophy and design objectives have been applied:
I) The units are designed to meet constraints on exhaust gas
pressure drop, set at about 20 inches of water, by proper
selection of operating conditions, particle size and
density, and tube bundle layout.
2) The units are designed to meet constraints on the working
fluid pressure drop, set at less than I0% of the supply
pressure, by proper sizing of tubes.
3) The units are designed to satisfy the thermal effectiveness
specified by selection of number of stages, stage
temperatures and distribution of heat transfer surface.
4) The superficial velocity is selected to give acceptable
vessel cross-section dimensions and to be representative of
general practice while promoting self-cleaning tube
conditions, but limiting tube erosion.
5) The units are designed to be operable over the range of
capacities desired by proper design of the gas distributors
and by bed depth selection. Distributor plates are
designed to give stable fluidization, acceptable jet
lengths and limited flowback (weeping) of bed particles
through the distributor holes.
6) The units are designed to be fully functional under
expected conditions of translation, acceleration ant
vibration by proper bed sizing or use of baffles.
6-3
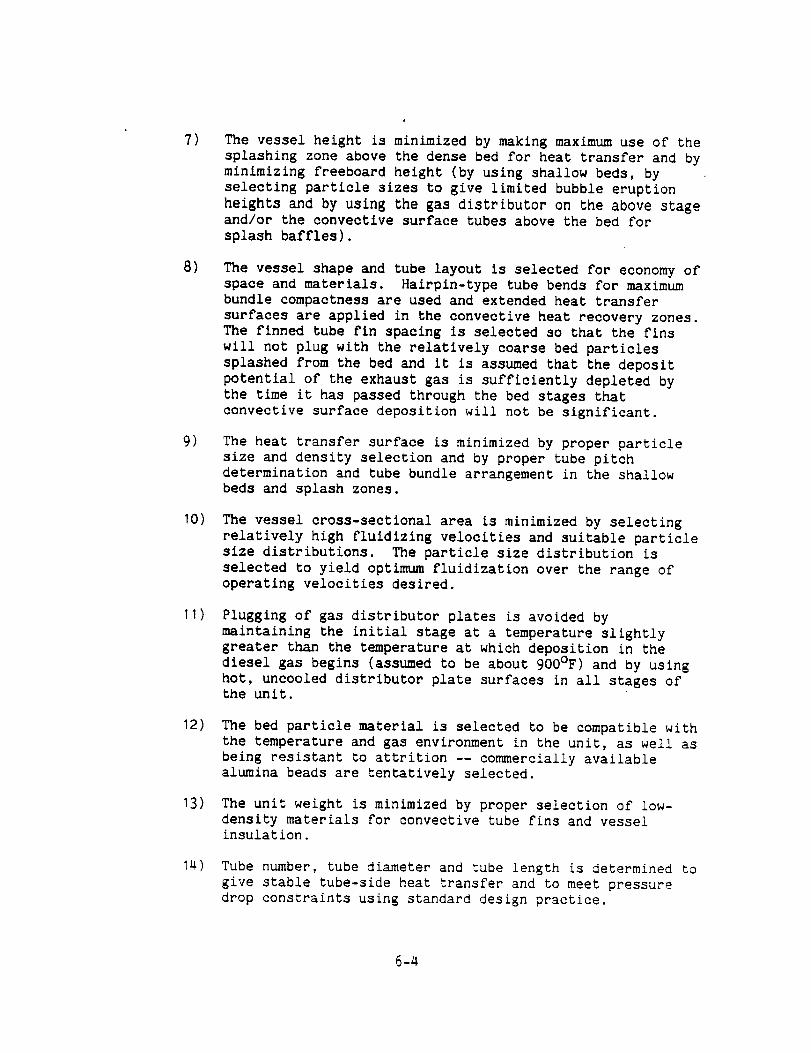
7)
8)
9)
lo)
11)
12)
13)
1.,)
The vessel height is minimized by making maximum use of the
splashing zone above the dense bed for heat transfer and by
minimizing freeboard height (by using shallow beds, by
selecting particle sizes to give limited bubble eruption
heights and by using the gas distributor on the above stageand/or the convective surface tubes above the bed for
splash baffles).
The vessel shape and tube layout is selected for economy of
space and materials. Hairpin-type tube bends for maximum
bundle compactness are used and extended heat transfer
surfaces are applied in the convective heat recovery zones.
The finned tube fin spacing is selected so that the fins
will not plug with the relatively coarse bed particles
splashed from the bed and it is assumed that the deposit
potential of the exhaust gas is sufficiently depleted by
the time it has passed through the bed stages that
convective surface deposition will not be significant.
The heat transfer surface is minimized by proper particle
size and density selection and by proper tube pitch
determination and tube bundle arrangement in the shallow
beds and splash zones.
The vessel cross-sectional area is minimized by selecting
relatively high fluidizing velocities and suitable particle
size distributions. The particle size distribution is
selected to yield optimum fluidization over the range of
operating velocities desired.
Plugging of gas distributor plates is avoided by
maintaining the initial stage at a temperature slightly
greater than the temperature at which deposition in the
diesel gas begins (assumed to be about 9OO°F) and by using
hot, uncooied distributor plate surfaces in all stages ofthe unit.
The bed particle material is selected to be compatible with
the temperature and gas environment in the unit, as well as
being resistant to attrition -- commercially available
alumina beads are tentatively selected.
The unit weight is minimized by proper selection of low-
density materials for convective tube fins and vesselinsulation.
Tube number, tube diameter and tube length is determined to
give stable tube-side heat transfer and to meet pressure
drop constraints using standard design practice.
6-_

15) Vessel wall, tube wall, distributor plate thicknesses and
insulation thicknesses are determined from standard design
practice.
An outline of the iterative design procedure is presented in
Appendix A, explaining the details of the design technique, the
assumptions and correlations applied and the areas of limited
information.
The detailed design procedure was applied for the truck
application to develop a highly effective heat recovery unit design for
each of three cycles, the organic rankine cycle, the steam injection
cycle and the stirling engine cycle. The truck design was then scaled
up directly to the locomotive and marine applications of the three
cycles using the following procedure:
- the unit operating conditions, general vessel shape, tube
bundle layout, distributor plates and material thicknesses
were assumed to the same for the truck, locomotive and marine
applications
- the heat recovery unit diameter (or width) was scaled
according to the square root of the increase in unit capacity
- the vessel height was assumed to remain at the truck heat
recovery unit height
- the heat transfer surface area and its weight were scaled up
in direct proportion to the increase in unit capacity
- the vessel weight was scaled up in direct proportion to the
increase in the unit diameter
6.3 Heat Recovery Unit Design Summary
Table 6.1 summarizing the major characteristics of the heat
recovery units for the truck, locomotive and marine applications with
each of the three cycles is shown below. Overall, the designs for the
three cycles do not differ greatly, although the design details are
significantly different.
6-5
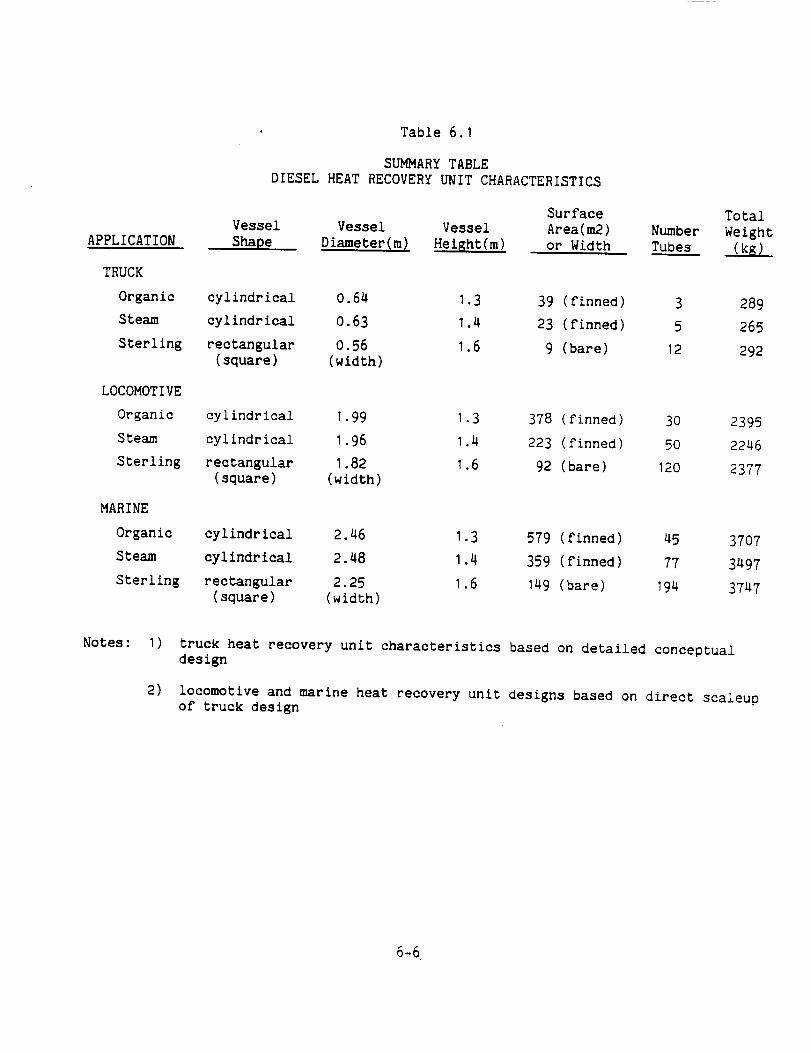
APPLICATION
TRUCK
Organic
Steam
Sterling
LOCOMOTIVE
Organic
Steam
Sterling
MARINE
Organic
Steam
Sterling
Table 6.1
SUMMARY TABLE
DIESEL HEAT RECOVERY UNIT CHARACTERISTICS
Surface
Vessel Vessel Vessel Area(m2)
Shape Diameterlm ) Height(m) or Width
Number
Tubes
Total
Weight
(kg)
cylindrical 0.64 1.3 39 (finned) 3 289
cylindrical 0.63 1.4 23 (finned) 5 265
rectangular 0.56 1.6 9 (bare) 12 292(square) (width)
cylindrical 1.99 1.3 378 (finned) 30 2395
cylindrical 1.96 1.4 223 (finned) 50 2246
rectangular 1.82 1.6 92 (bare) 120 2377(square) (width)
cylindrical 2.46 1.3 579 (finned) 45 3707
cylindrical 2.48 1.4 359 (finned) 77 3497
rectangular 2.25 1.6 149 (bare) 194 3747(square) (width)
Notes:I) truck heat recovery unit characteristics based on detailed conceptual
design
2) locomotive and marine heat recovery unit designs based on direct scaleupof truck design
6-6

6.4 Organic Rankine Cycle
The organic Rankine cycle fluidized bed heat recovery unit
consists of two stages of fluid beds, a high temperature bed and a low
temperature bed, followed by a convective section. The vessel is
cylindrical in shape. Tubes enter the convective section and are coiled
within the freeboard of the low temperature bed. Radially finned tubes
are placed in the convective region, while bare tubes are used in the
bed sections. The coiled tube bundles in the convective section and the
beds are connected with downcomer tubes. Figure 6.2 shows the layout of
the truck unit.
The common characteristics of the truck, locomotive and marine
organic rankine cycle heat recovery units are summarized in Tables 6.2
and 6.3.
The particle material selected for the fluidized beds is
alumina, available in nearly spherical particle shapes having a density
of about 3685 kg/m 3 (230 lb/ft3). The average particle diameter
(surface/volume average) on both bed stages is about 750 um, with a
minimum diameter of about 275 _m and a maximum particle diameter of
about 1200 um. The minimum fluidization velocity of the bed is about
0.6 m/s (2 ft/s). At their operating velocities the shallow beds have
bubble volume fractions of about 43% and the tubes occupy about 18% of
the bed volume. The relative heights of the dense beds, splash zones
and freeboards are indicated in Figure 6.2.
6.5 Steam Injection Cycle
The steam injection cycle heat recovery unit is very similar in
design to the organic rankine cycle unit. It has two stages of fluid
bed heat recovery followed by a convective section and is cylindrical in
shape. The tubes are arranged in coils which enter the top of the unit
and exit at the bottom. Finned tubes are placed in the convective
section and bare tubes in the shallow beds and their splash zones.
Significantly less heat transfer surface is required in the convective
6-7
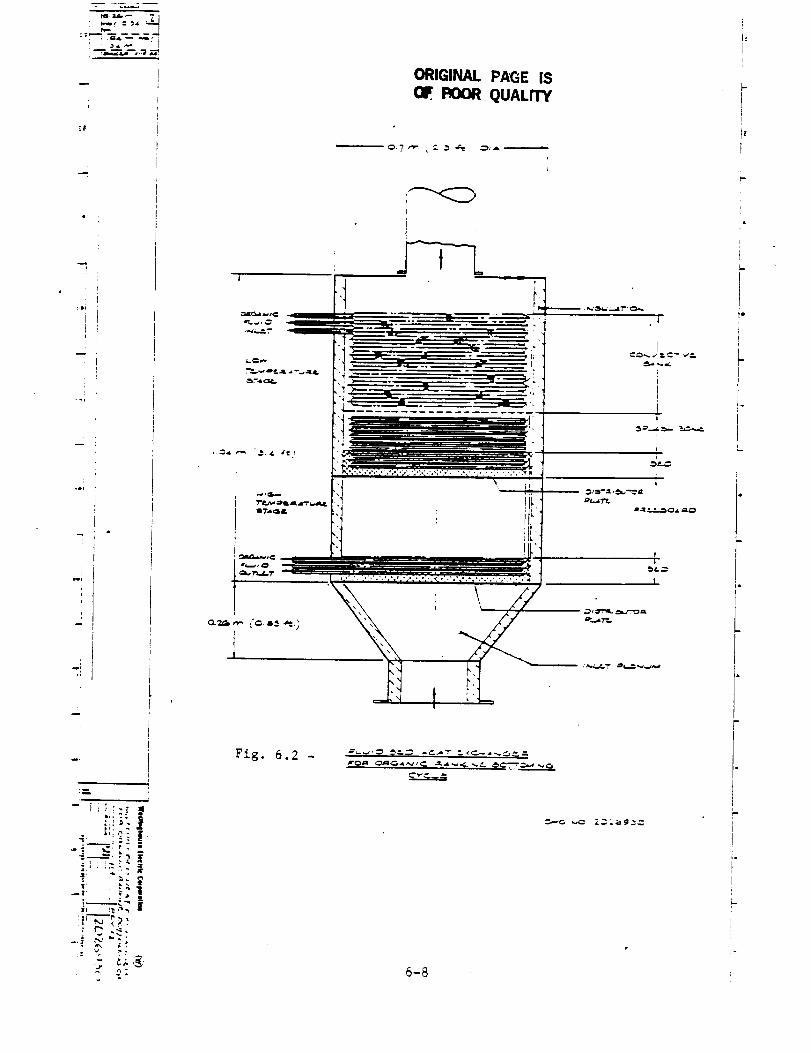
r
!
ii
-ql
*t I
ORIGINAL PAGE IS
OF. POOR QUALITY
¢>-7, "_ Z _ .._.
f
J
, \
Fig. 6.2 -
6-8
J
L
t"
t-
.
I
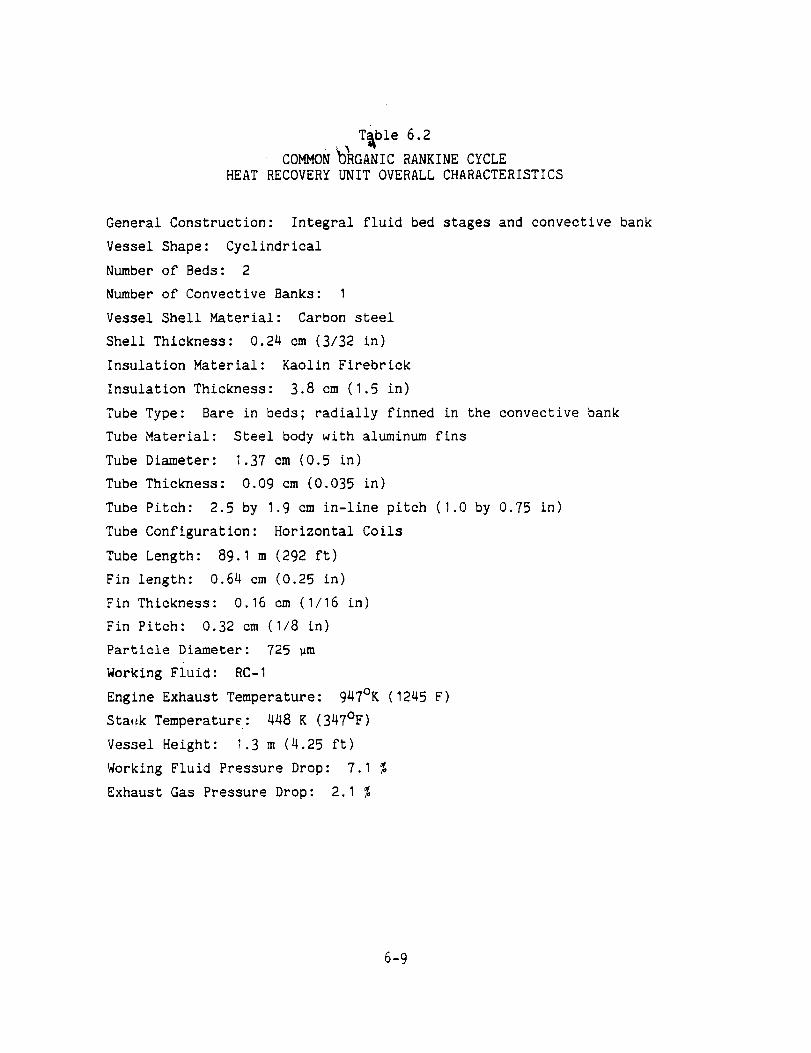
T_ble 6.2co oN RCANICRA KI ECYCLE
HEAT RECOVERY UNIT OVERALL CHARACTERISTICS
General Construction: Integral fluid bed stages and convective bank
Vessel Shape: Cyclindrical
Number of Beds: 2
Number of Convective Banks: I
Vessel Shell Material: Carbon steel
Shell Thickness: 0.24 cm (3/32 in)
Insulation Material: Kaolin Firebrick
Insulation Thickness: 3.8 cm (1.5 in)
Tube Type: Bare in beds; radially finned in the convective bank
Tube Material: Steel body with aluminum fins
Tube Diameter: 1.37 cm (0.5 in)
Tube Thickness: 0.09 cm (0.035 in)
Tube Pitch: 2.5 by 1.9 cm in-line pitch (1.0 by 0.75 in)
Tube Configuration: Horizontal Coils
Tube Length: 89.1 m (292 ft)
Fin length: 0.64 cm (0.25 in)
Fin Thickness: 0.16 cm (I/16 in)
Fin Pitch: 0.32 cm (I/8 in)
Particle Diameter: 725 um
Working Fiuid: RC-I
Engine Exhaust Temperature: 947°K (1245 F)
Sta_k Temperature: 448 K (347°F)
Vessel Height: 1.3 m (4.25 ft)
Working Fluid Pressure Drop: 7.1%
Exhaust Gas Pressure Drop: 2.1%
6-9
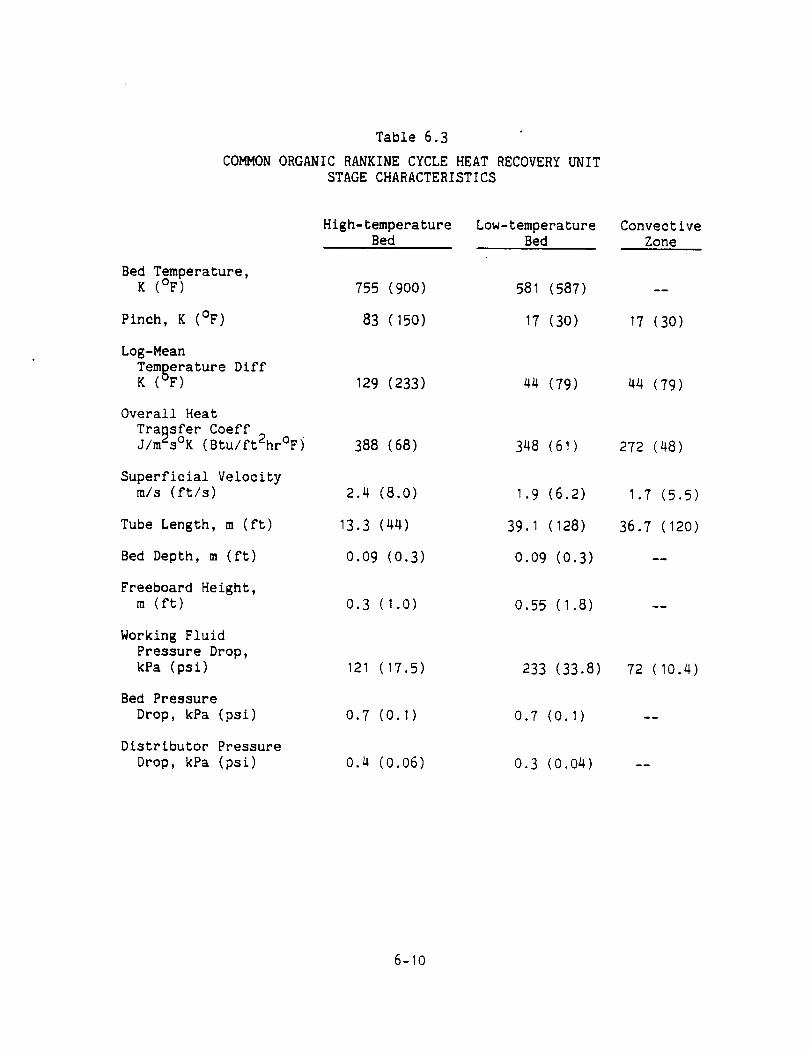
Table 6.3
COMMON ORGANIC RANKINE CYCLE HEAT RECOVERY UNIT
STAGE CHARACTERISTICS
Bed Temperature,K (OF)
Pinch, K (OF)
Log-Mean
Temperature DiffK (_F)
Overall Heat
Transfer Coeff 2J/m_s°K (Btu/ft hr°F)
Superficial Velocitym/s (ft/s)
Tube Length, m (ft)
Bed Depth, m (ft)
Freeboard Height,
m (ft)
Working Fluid
Pressure Drop,
kPa (psi)
Bed Pressure
Drop, kPa (psi)
Distributor Pressure
Drop, kPa (psi)
High-temperature Low-temperature Convective
Bed Bed Zone
755 (900) 581 (587)
83 (150) 17 (30) 17 (30)
129 (233) 44 (79) 44 (79)
388 (68) 348 (61) 272 (48)
2.4 (8.0) 1.9 (6.2)
13.3 (44) 39.1 (128)
0.09 (0.3) 0.09 (0.3)
0.3 ( 1.0) 0.55 ( 1.8)
233 (33.8)121 (17.5)
0.7 (0.1) 0.7 (0.1)
O.3 (0.04)0.4 (0.06)
1.7 (5.5)
36.7 (120)
72 (10.4)
6-10
zone than is in the organic Rankine unit. Figure 6.3 shows the truck
heat recovery unit layout for the steam injection cycle. Because the
exhaust gas temperature entering the heat recovery unit is much lower
than the engine exhaust temperature in this case, the criteria statedthat the first stage temperature should be about 9OO°Fto avoid
distributor plate deposition can not be satisfied. The impact of the
high steam content on the deposit potential of the exhaust gas is not
known.
The commoncharacteristics of the truck, locomotive and marine
heat recovery units for the steam injection cycle are listed in Tables
6.4 and 6.5.
Essentially, the sameparticle material and size distribution isselected for the steam injection cycle as was for the organic Rankine
cycle. The bed minimumfluidization velocity in the steam injection
cycle case is about 0.7 m/s (2.4 ft/s) and the beds operate with bubblevolume fractions of about 38 %and a tube volume fraction of about 11%
on the high-temperature stage and 22 %on the low-temperature stage.
6.6 Stirlin_ Engine Cycle
The stirling engine cycle heat recovery unit differs
significantly in design from the previous two units. It is made up of
two fluidized bed heat recovery stages, a high temperature bed and a low
temperature bed, and is without any convective heat transfer section.
The low temperature bed and its splash zone contains toluene heat pipes
in a hairpin serpentine configuration. The high temperature stage
contains mercury heat pipes in a similar configuration. The heat pipes
require only a single point of entry through the vessel wall since they
have internal circulation of the heat transfer fluid. The vessel is
rectangular in cross-section to accomodate the passage of a large number
of tubes through a single flat wall. The Stirling engine heat recovery
unit layout is presented in Figure 6.4.
6-11
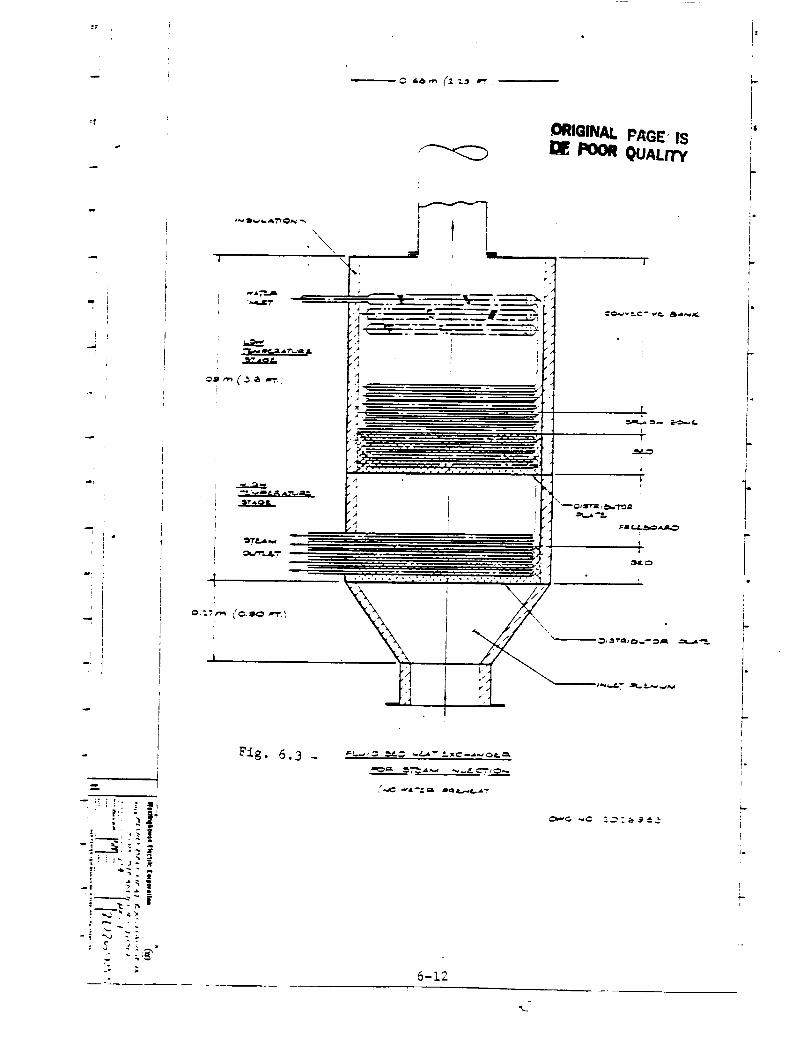
i
L
" 2
_. _._".,.,,_____ :" _
: _ t" ,£. ,2;:_•k :
, '
.\
",,,,,t_'T
"--i._ regal. A'm_-a L
\
\
6-12
,ORIGINAL P/tGE ISPOOR QUALIFY
I
i"
i
t.
i-
<-
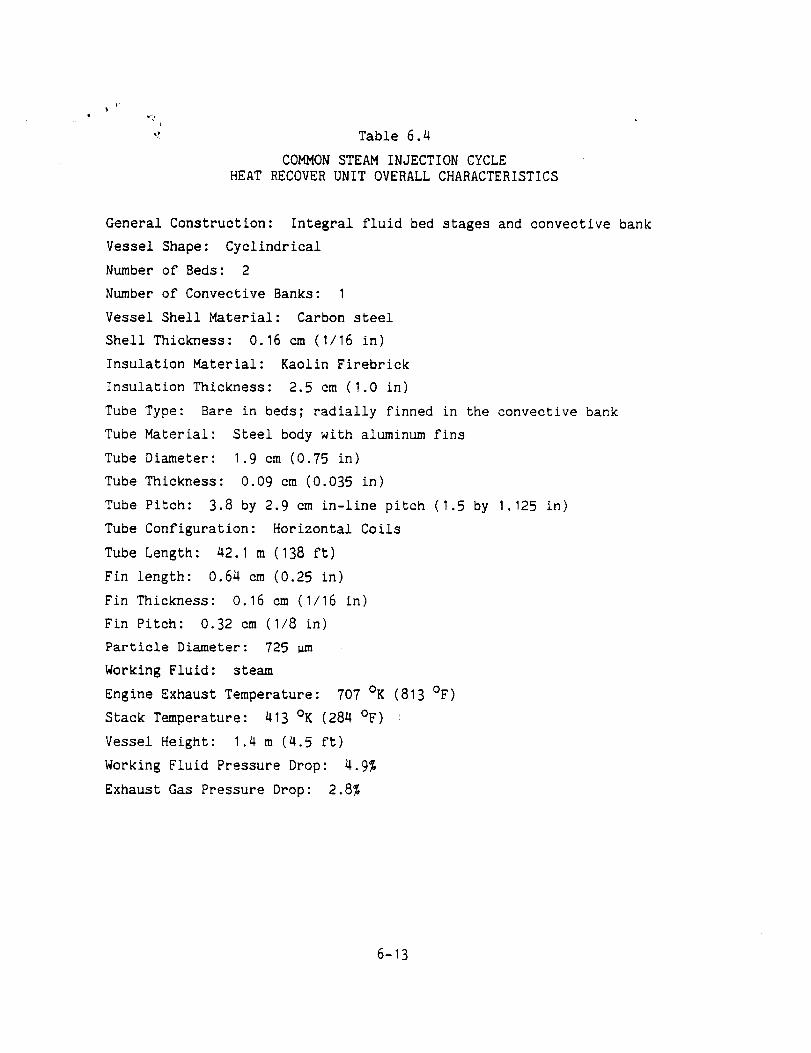
Table 6.4
COMMON STEAM INJECTION CYCLE
HEAT RECOVER UNIT OVERALL CHARACTERISTICS
General Construction: Integral fluid bed stages and convective bank
Vessel Shape: Cyclindrical
Number of Beds: 2
Number of Convective Banks: I
Vessel Shell Material: Carbon steel
Shell Thickness: 0.16 cm (I/16 in)
Insulation Material: Kaolin Firebrick
Insulation Thickness: 2.5 cm (1.0 in)
Tube Type: Bare in beds; radially finned in the convective bank
Tube Material: Steel body with aluminum fins
Tube Diameter: 1.9 cm (0.75 in)
Tube Thickness: 0.09 cm (0.035 in)
Tube Pitch: 3.8 by 2.9 cm in-line pitch (1.5 by 1.125 in)
Tube Configuration: Horizontal Coils
Tube Length: 42.1 m (138 ft)
Fin length: 0.64 cm (0.25 in)
Fin Thickness: 0.16 cm (I/16 in)
Fin Pitch: 0.32 cm (I/8 in)
Particle Diameter: 725 um
Working Fluid: steam
Engine Exhaust Temperature: 707 OK (813 OF)
Stack Temperature: 413 OK (284 OF)
Vessel Height: 1.4 m (4.5 ft)
Working Fluid Pressure Drop: 4.9%
Exhaust Gas Pressure Drop: 2.8%
6-13
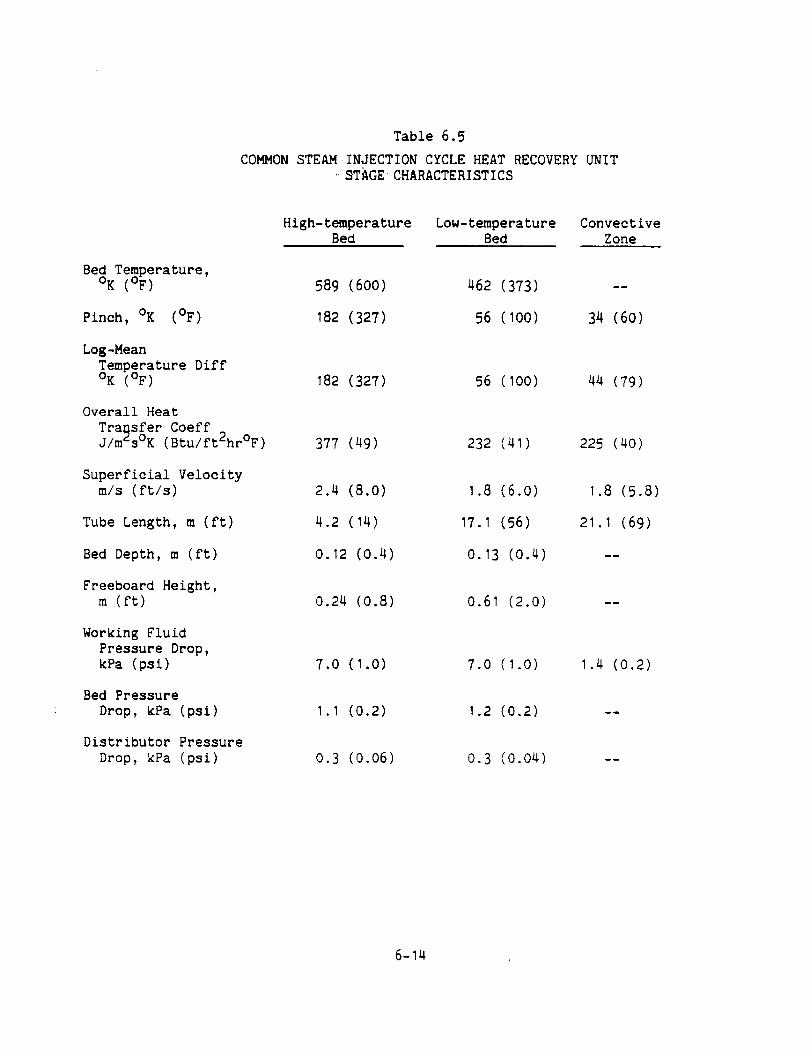
Table 6.5
COMMON STEAM INJECTION CYCLE HEAT RECOVERY UNIT_STAGECHARACTERISTICS
Bed Temperature,OK (OF)
Pinch, OK (OF)
Log-MeanTemperature DiffOK (OF)
Overall Heat
Trassfer CoeffJ/m_s°K (Btu/ft2hr°F)
Superficial Velocitym/s (ft/s)
Tube Length, m (ft)
Bed Depth, m (ft)
Freeboard Height,m (ft)
Working Fluid
Pressure Drop,kPa (psi)
Bed Pressure
Drop, kPa (psi)
Distributor Pressure
Drop, kPa (psi)
High-temperature Low-temperature ConvectiveBed Bed Zone
589 (600) 462 (373) --
182 (327) 56 (100) 34 (60)
182 (327) 56 (100) 44 (79)
377 (49) 232 (41) 225 (40)
2.4 (8.O) 1.8 (6.0) 1.8 (5.8)
4.2 (14) 17.1 (56) 21.1 (69)
0.12 (0.4) 0.13 (0.4) --
0.24 (0.8) 0.61 (2.0) --
7.0 (1.O) 7.0 (1.0) 1.4 (0.2)
1.1 (0.2) 1.2 (0.2) --
0.3 (0.06) 0.3 (0.04) --
6-14
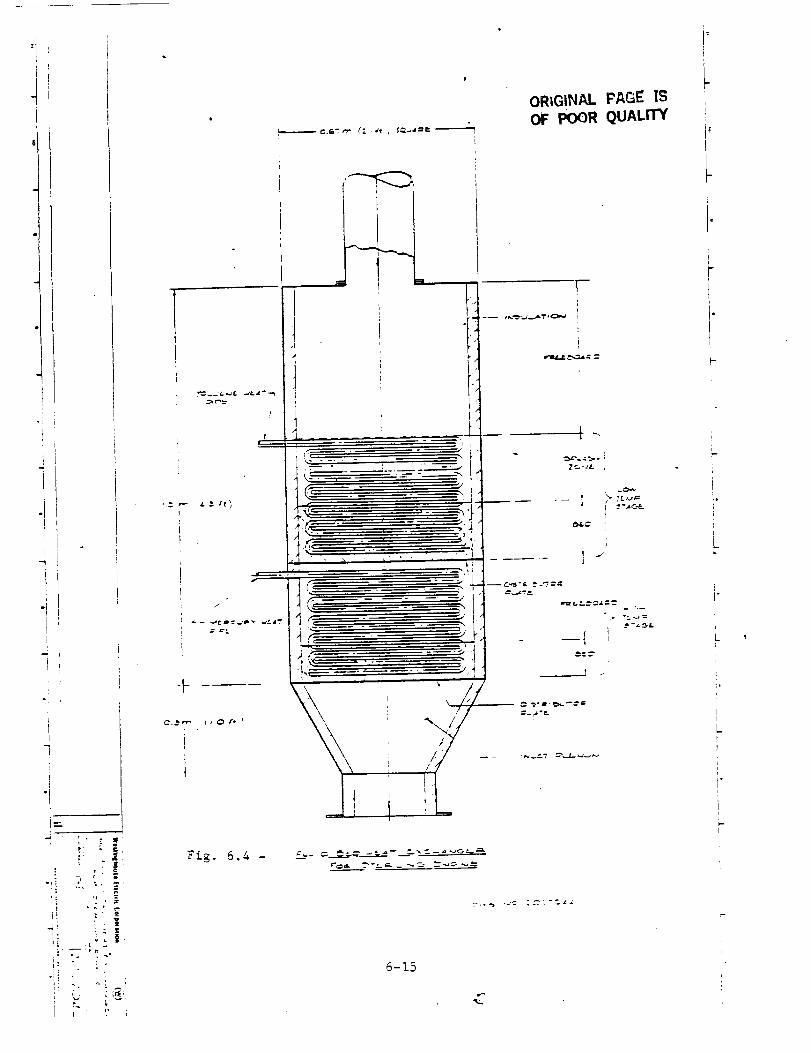
b
"t
J
-!I
1I
I"1
r
i=
', ? ! "
i _ :" ;• - 11
--',r-
I: i'
L L,_, i_._s ' , l
e.c,,_ pp (Z 4,'. _ 1:_.,J_
ORIGINAL PAGE IS
OF POOR QUALITY
k
Fig. 6.4 -
6-15
:
I
i'
I"
i"
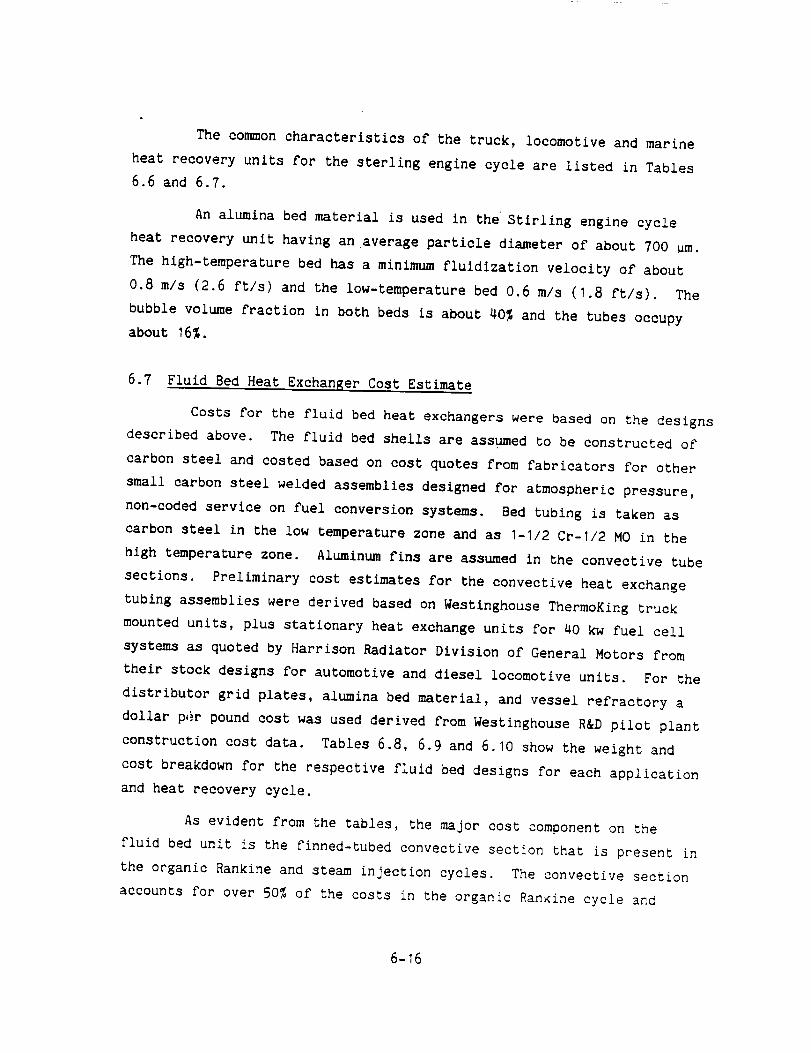
The co,mon characteristics of the truck, locomotive and marine
heat recovery units for the sterling engine cycle are listed in Tables
6.6 and 6.7.
An alumina bed material is used in the Stifling engine cycle
heat recovery unit having an average particle diameter of about 700 um.
The high-temperature bed has a minimum fluidization velocity of about
0.8 m/s (2.6 ft/s) and the low-temperature bed 0.6 m/s (1.8 ft/s). The
bubble volume fraction in both beds is about 40% and the tubes occupy
about 16%.
6.7 Fluid Bed Heat Exchanger Cost Estimate
Costs for the fluid bed heat exchangers were based on the designs
described above. The fluid bed shells are assumed to be constructed of
carbon steel and costed based on cost quotes from fabricators for other
small carbon steel welded assemblies designed for atmospheric pressure,
non-coded service on fuel conversion systems. Bed tubing is taken as
carbon steel in the low temperature zone and as I-I/2 Cr-I/2 MO in the
high temperature zone. Aluminum fins are assumed in the convective tube
sections. Preliminary cost estimates for the convective heat exchange
tubing assemblies were derived based on Westinghouse ThermoKing truck
mounted units, plus stationary heat exchange units for 40 kw fuel cell
systems as quoted by Harrison Radiator Division of General Motors from
their stock designs for automotive and diesel locomotive units. For the
distributor grid plates, alumina bed material, and vessel refractory a
dollar p_}r pound cost was used derived from Westinghouse R&D pilot plant
construction cost data. Tables 6.8, 6.9 and 6.10 show the weight and
cost breakdown for the respective fluid bed designs for each application
and heat recovery cycle.
As evident from the tables, the major cost component on the
fluid bed unit is the finned-tubed convective section that is present in
the organic Rankine and steam injection cycles. The convective section
accounts for over 50% of the costs in the organic Rankine cycle and
6-16
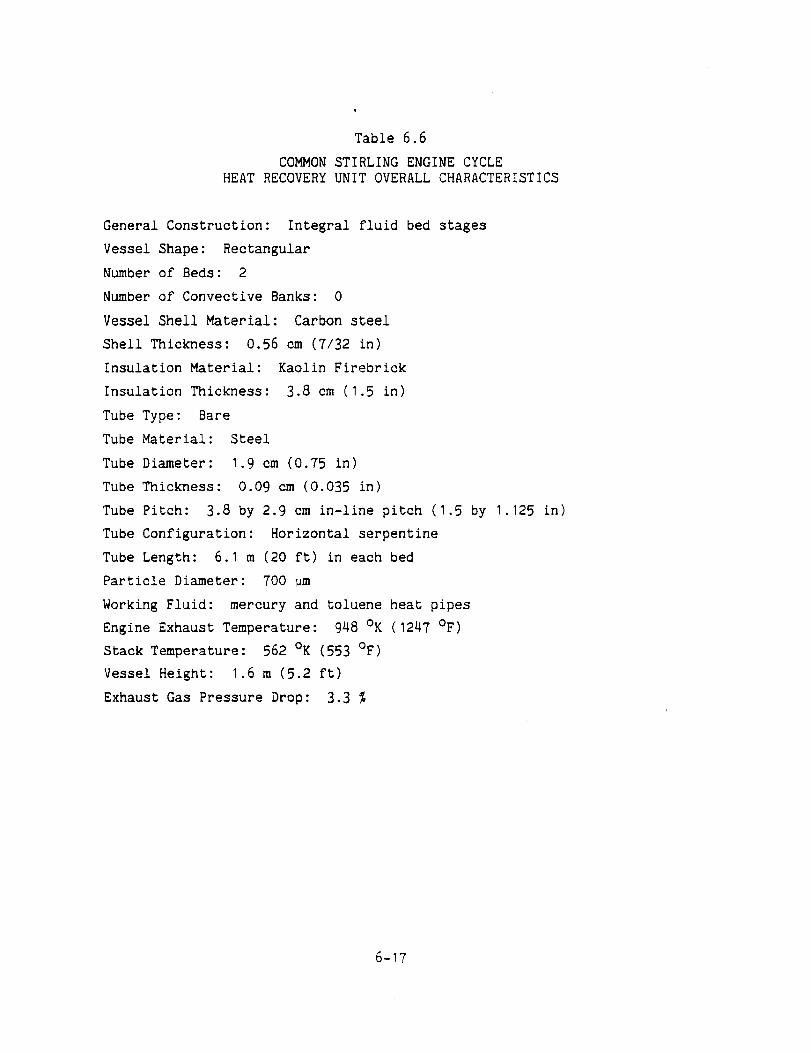
Table 6.6
COMMONSTIRLINGENGINECYCLEHEATRECOVERYUNIT OVERALLCHARACTERISTICS
General Construction: Integral fluid bed stages
Vessel Shape: RectangularNumberof Beds: 2Numberof Convective Banks: 0
Vessel Shell Material: Carbon steel
Shell Thickness: 0.56 cm (7/32 in)Insulation Material: Kaolin Firebrick
Insulation Thickness: 3.8 cm (1.5 in)
Tube Type: BareTube Material: Steel
Tube Diameter: 1.9 cm (0.75 in)
Tube Thickness: 0.09 cm (0.035 in)
Tube Pitch: 3.8 by 2.9 cm in-line pitch (1.5 by 1.125 in)
Tube Configuration: Horizontal serpentine
Tube Length: 6.1 m (20 ft) in each bedParticle Diameter: 700 um
Working Fluid: mercury and toluene heat pipesEngine Exhaust Temperature: 948 OK(1247 OF)Stack Temperature: 562 OK(553 OF)
Vessel Height: 1.6 m (5.2 ft)
Exhaust Gas Pressure Drop: 3.3 %
6-17
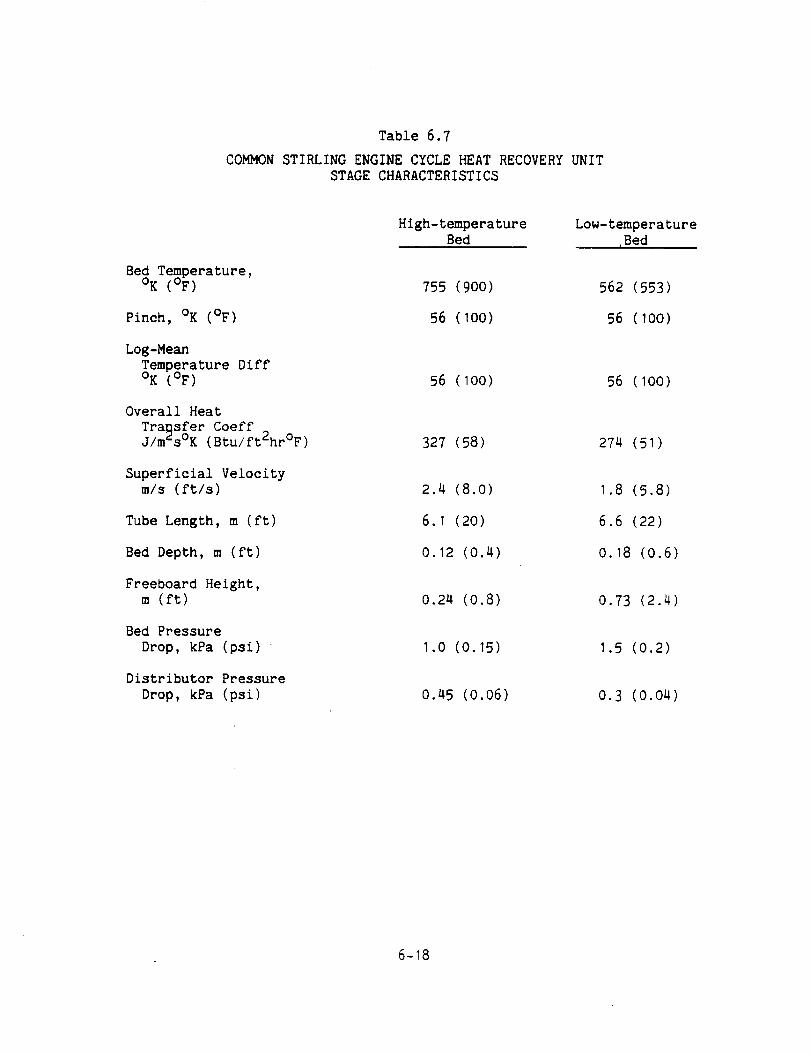
Table 6.7
COMMONSTIRLINGENGINECYCLEHEATRECOVERYUNITSTAGECHARACTERISTICS
BedTemperature,OK (OF)
Pinch, oK (OF)
Log-Mean
Temperature Diff
OK (OF)
Overall Heat
Transfer Coeff
j/m2s°K (Btu/ft2hr°F)
Superficial Velocity
m/s (ft/s)
Tube Length, m (ft)
Bed Depth, m (ft)
Freeboard Height,
m (ft)
Bed Pressure
Drop, kPa (psi)
Distributor Pressure
Drop, kPa (psi)
High-temperature
Bed
755 (900)
56 (lOO)
56 (100)
327 (58)
2.4 (8.0)
6.1 (20)
0.12 (O.4)
0.24 (0.8)
1.0 (0.15)
0.45 (0.06)
Low-temperature
,Bed
562 (553)
56 (100)
56 (lOO)
274 (51)
1.8 (5.8)
6.6 (22)
O. 18 (0.6)
0.73 (2.4)
1.5 (0.2)
o.3 (o.o4)
6-18
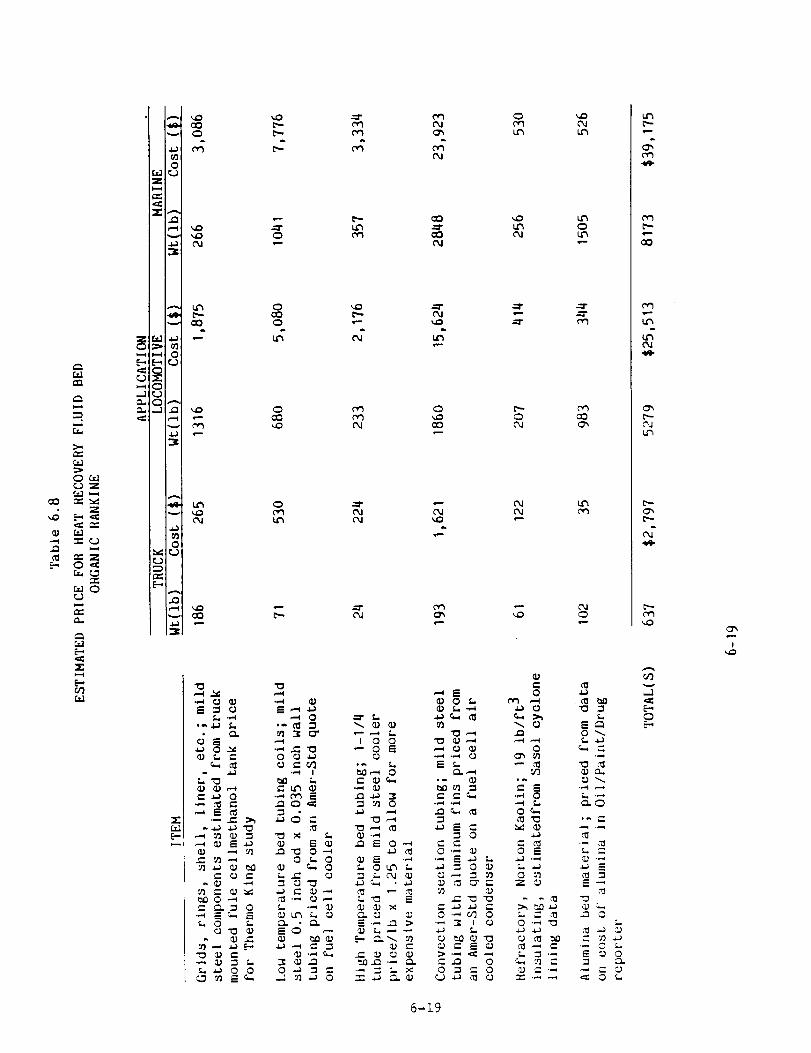
cO
E-
_m
,-1
>.,
O_t.lc.._zf..r.l ,-_
z
_0_._
Z
r.1
0
z
0'10
0
Z
b.-
d_._ 0 ,,,e_ f. e.,
_ _,.__._ 0
._ _ _...
._ =_ =
o"o _
•,,.._ _ _ _,.i._ 0 0
_0
0
0cO
0ClD_o
0
0
0 _ a_
•,-_ I
_ _ 0
,..1 '¢1 ._ o
i o o_" 0 _
_,-_ 0
•_ _]_
"_ _ 0
=._ r_ =_
..._-_ _
OJ
cO
cOO4
0
cO
04
"0,-_
..._ .,.,,
"_ 0
o._
-_ :_ 0 _
o ._ 0"J o•_ _ I 0
-_ 00 "_ _- 0
C_
e.--
0
0
O_,-
w
o
o :_
o ._ -o
_._
u_
0
co
CD
"o
o
"o
c_
<=
.m
C_
.m
©
0 i.o 0
0
o_
•..-
CO
oJ
_o
-]
0
!
6-19

0..,
r..
f.u
0
r_ f.11
r.1 c,_
E-'
2).-
=.S
'-Ii
0
..(
t._
O_
CO
_" _.. "_ o•,-, _ _, __. o _.
-,,,_ _ _ _,
~,-_ 0
,..--I
0 o._
o _-, 0
o _._ -_ _-
0
0
_d
0
°p
_3
C_
I 0 0•" 0 _
°,.-I _
el ._ .-e
.,.,, ._ _ _:
0
0
CO
Lf_
0
_ 0 _.
o .._
o ..-, _ o
_ ._ _ ,,--_
•_ 0o .-_ _, o
cO
o'_
co_o
_oco
aocO
c_
L_t
0
0 _._ _-"
0 .,_ "_
_ "-' _- _ 0
•_ _ _ _ _-,
0
L'-.
'-0CO
.:..m"
COCr_
CO
o
o
!_o
6-20

,_3 '_
"r-
-r" _,
AD --'
0 a::
r_l oo
2.,
F-
E--
Z
m
C.;I[
0J
_ r,e3_ C',a"-e
_E
.._
"" _ 0•_ _ .-
•-_ _ :_
- __=_I _ _ _-_
71 _-- _ vb,O 0 ---_
•-- = C. =
:-. J 0 0
COCO
CO
ORIGINAL PAGE ISoF POOR QU/U.n'Y
CO
O
p,.. c_t_
cOp,,.
a:3
cO
0 0_ 0 _.
4,_"t3 ---
..0, E _"
,13 -- .--;,.- 0 'a"_,
4._ %_ , -3
z. -,'-d __CJ 13
I.; =
_ 0 __, ..,._
1:3 ,--_
,-_ 0•,-4 .,._ 0
_ 0= r-0 '," _)
_ _ 0 i_
71 =1
-- _: I 'D
_ _ _= _
0 _ _ 0
0
0
0
oO
v _
0 _-
;......1
0 71
0 .-- "_
-"* 0
_ _"
.-- r'¢'_ _
© :.- 0
_ ._ 2,.)
8-_Z
6-21
:0
0 "--
",'O
CLO
L =
_= -.
"C
-- 0 L.
=-
CO
..-1
0b',
,=.qI

about 40% in the steam injection cycles. Considering the relatively
minimal performance improvement to the cycle that the convection section
provides in the fluid bed system, it may be more cost effective to
eliminate or minimize this duty.
6-22
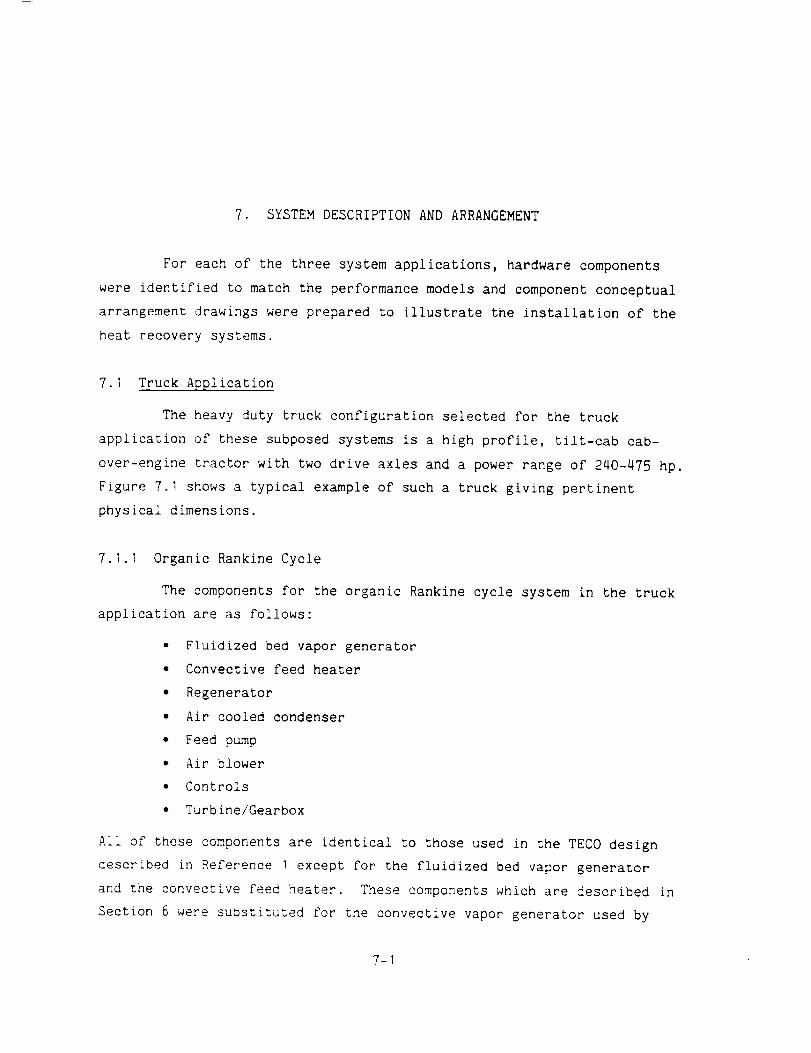
7. SYSTEMDESCRIPTIONANDARRANGEMENT
For each of the three system applications, hardware components
were identified to match the performance models and componentconceptualarrangement drawings were prepared to illustrate the installation of the
heat recovery systems.
7.1 Truck Application
The heavy duty truck configuration selected for the truck
application of these subposed systems is a high profile, tilt-cab cab-
over-engine tractor with two drive axles and a power range of 240-475 hp.
Figure 7.1 shows a typical example of such a truck giving pertinent
physical dimensions.
7.1.1 Organic Rankine Cycle
The components for the organic Rankine cycle system in the truck
application are as follows:
• Fluidized bed vapor generator
• Convective feed heater
• Regenerator
• Air cooled condenser
• Feed pump
• Air blower
• Controls
• Turbine/Gearbox
All of these components are identical to those used in the TECO design
described _n Reference I except for the fluidized bed vapor generator
and the convective feed heater. These components which are _escribed in
Section 6 were substituted for the convective vapor generator used by
7-I
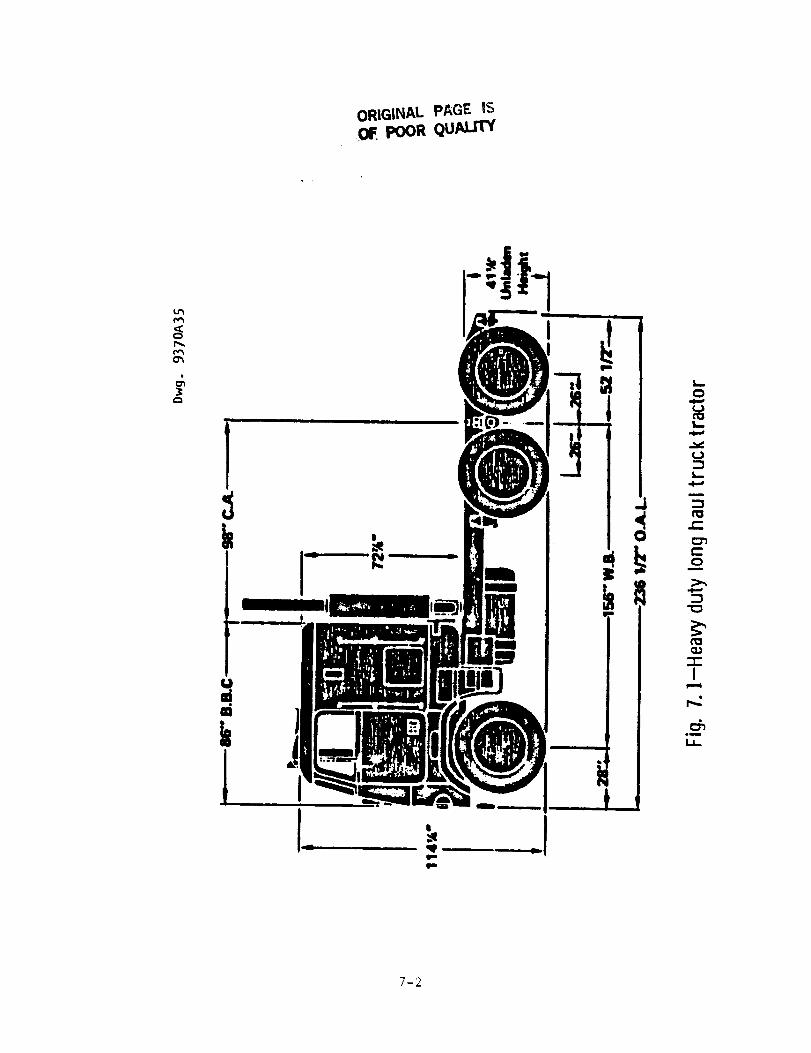
ORIGINALPAGE ISPOORqU_J.S_
tJ_
c,t'%
r_
7-2
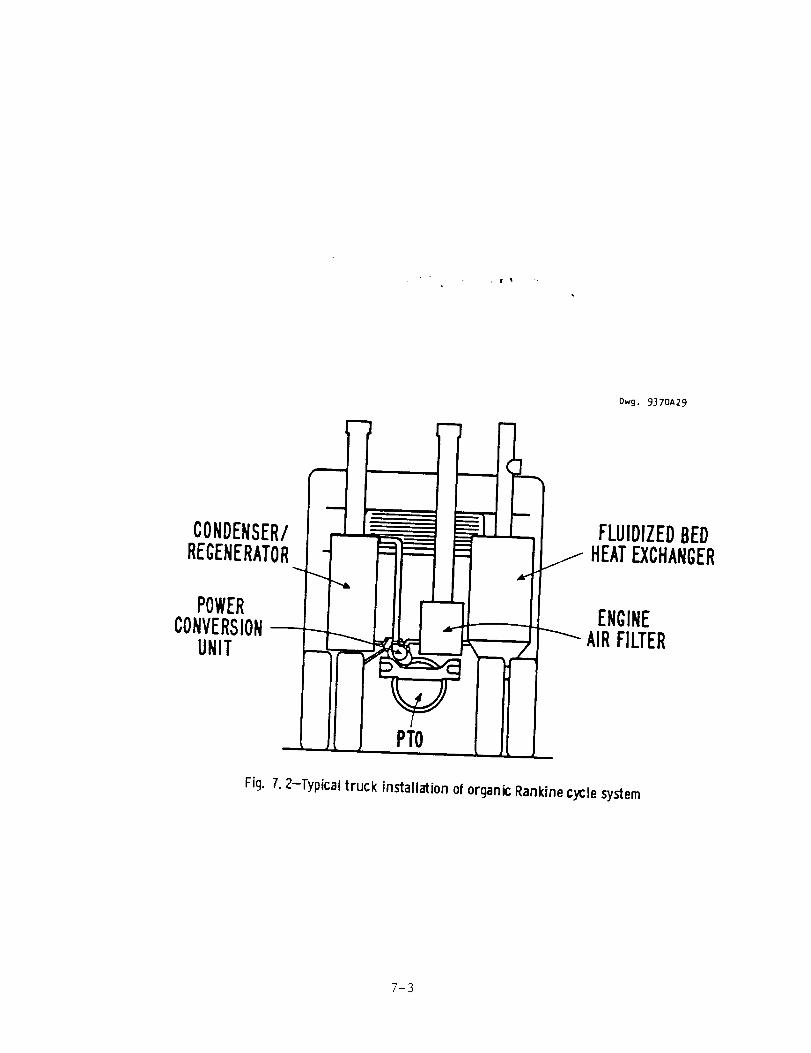
Owg. 9370A29
CONDENSER/REGENERATOR
FLUIDIZEDBEDHEATEXCHANGER
POWERCONVERSIONUNIT
ENGINEAIRFILTER
PTO
Fig. 7. 2-Typical truck installation of organic Rankine cycle system
7-3
TECO. The fluidized bed vapor generator and the convective feedheater
are integrated into a single vessel and arranged as shown in Figure ?,2.
7,1.2 Steam Injection Cycle
The steam injection cycle system for the truck application
consists of the following components
• Feedwater storage tank
• Steam-heated feedwater heater
• Feed pump
• Convection feedwater heater
• Fluidized bed steam generator
• Modified compressor-drive expander
• Modified power expander
• Gearbox
The convection feedwater heater and the fluidized bed steam generator
are described in Section 6. The compressor drive expander and the power
expander which are based on the Cummins T-46B turbocharger are described
in Appendix B, The gearbox and feedwater pump which are also shown in
Figure 7.3 are derived from the TECO design in Reference I, and also
described in Appendix B.
The arrangement for all of the components except the feedwater
storage tank are shown on Figure 7.3. The feedwater storage tank which
is shown on Figure 7.4 is located back of the other components. The
installation of the feedwater tank as shown requires that the truck
frame be lengthened by two feet.
7.1.3 Stirling Engine
The Stirling engine for the truck application consists of the
following components:
• High temperature fluidized bed heat exchanger
• High temperature heat pipe using mercury
7-4
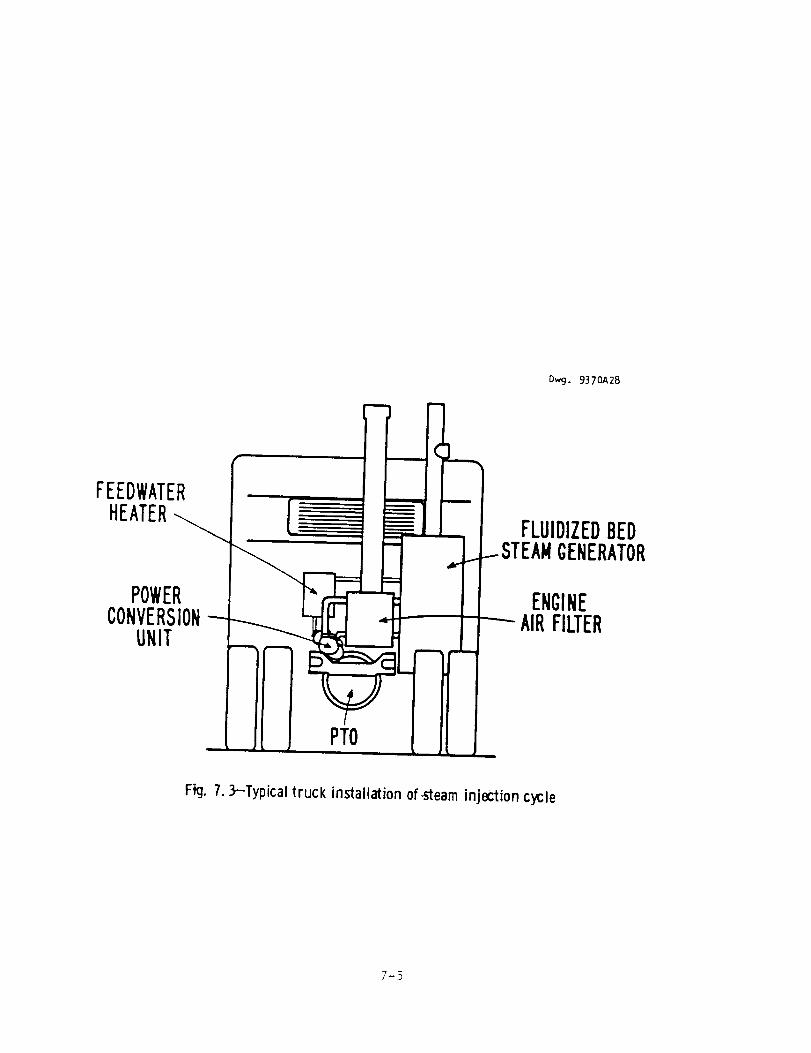
Dwg. 9370A28
FEEDWATERHEATER
POWERCONVERSION
UNIT
PTO
FLUIDIZEDBED...-STEAMGENERATOR
ENGINE
Fig. 7. 3-Typical truck installation of-steaminjection cycle
7-5
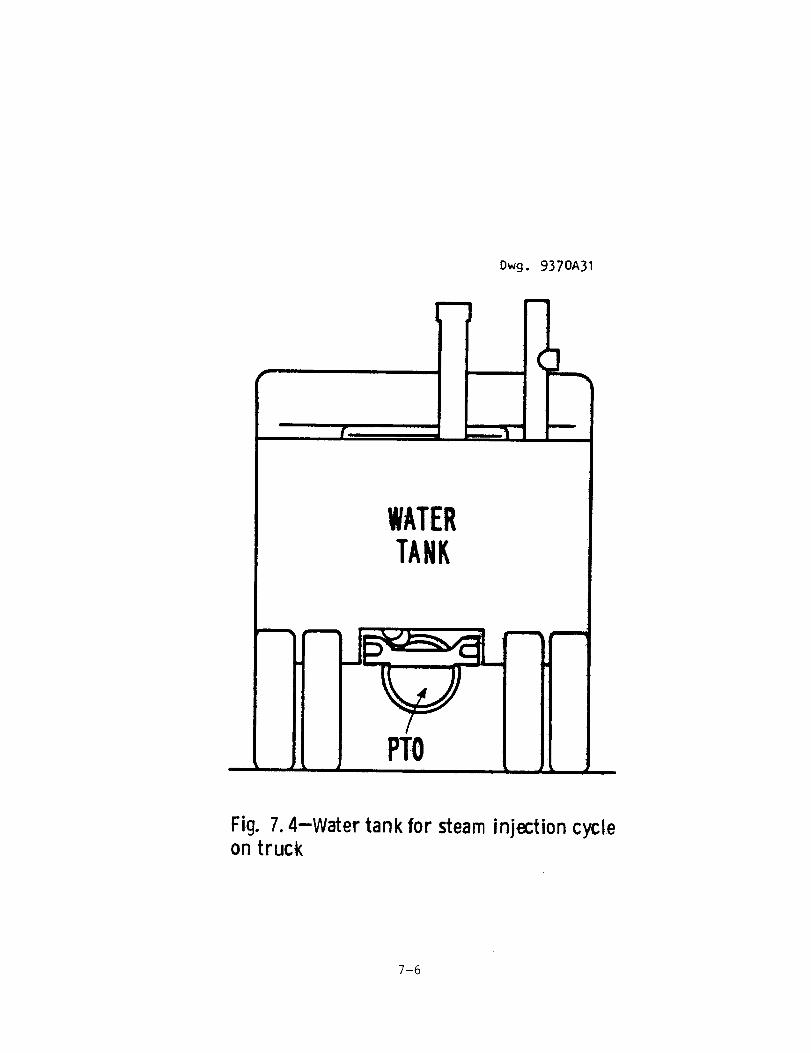
Dwg. 937OA31
i
WATERTANK
PTO
Fig. 7.4-Water tank for steam injection cycleon truck
7-6
• High temperature Stirling engine using hydrogen
• Low temperature fluidized bed heat exchanger
• Low temperature heat pipe using toluene
• Low temperature Stirling engine using hydrogen
Air-cooled heat exchanger for rejecting heat from Stirling
engine
• Gearbox.
The high and low temperature fluidized bed heat exchanger designs are
described in Section 6. The heat pipe system design is shown in Figure
?_5. The selection of heat pipe working fluids was based on operating
temperature considerations.
The Stirling engine modules were scaled from the MODI engine
design described in Reference 20. The procedure used for scaling the
Stirling engines is described in Appendix C.
The arrangement for the Stirling engines in the truck is shown
in Figure 7.6. All of the components except the gearbox and the
radiator are shown _n this f_gure. The gearbox is based on the design
used by TECO in Reference i and scaled according to a procedure given by
Dudley(21) that is summarized in Appendix D. The radiator would be
located where the normal truck engine radiator is now located.
7.2 Locomotive Application
The railroad locomotive configuration selected for the
locomotive application of the three subposed systems is the General
Electric 3600 horsepower C 36-7 diesel-electric locomotive described in
Reference 3 and illustrated in Figure 7.7.
7.2.1 Organic Rankine Cycle
The components of the organic Rankine cycle system for the
locomotive application are similar to those for the truck application
since the output from the subposed system goes to the main engine
crankshaft through a gearbox. The installation of the system is shown
7-7

j
..f
p. a-
.J
I, -,.a}
• j
_ i_
i
< I Ir !t i! [
,, IJ
+i
rl
..J
ORiGiNAL P_.u_
OF POOR QUALITY
i
,-_- -_,-.
--J:L
ii
.Ai
j
_, jd.
r , ', j-
4"
..JI
2_ s_J
01
°' 7fB'I
_; ,AI/.t
31
_ J,: _:
JJI
_,..
J_
.)-
i f
t tl
i
iJ
\
<3
<g ..j
I, +
I i"" '- •
• .2
J
7-8
s
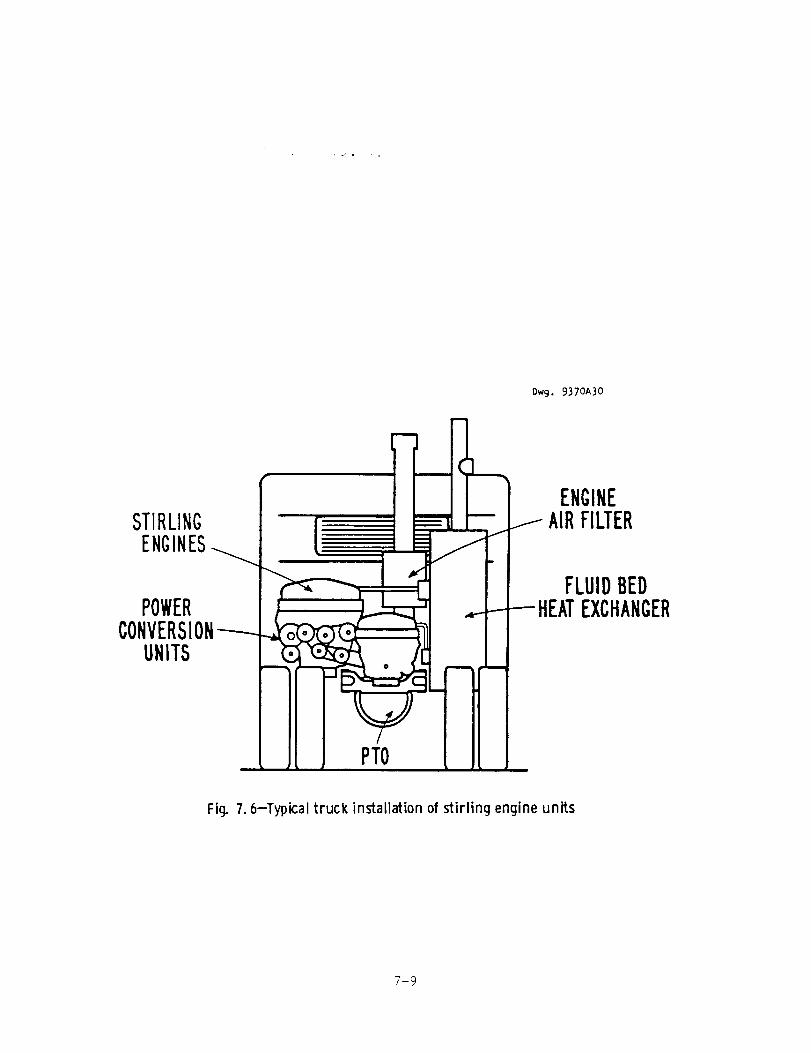
Dw9. 9370A30
u
STIRLING
ENGINES_ .
POWER _ _. ---CONVERSION
UNITS
, , PTO , ,
ENGINEi AIRFILTER
FLUIDBED---HEATEXCHANGER
Fig. 7.6-Typical truck installation of stirling engine units
7-9
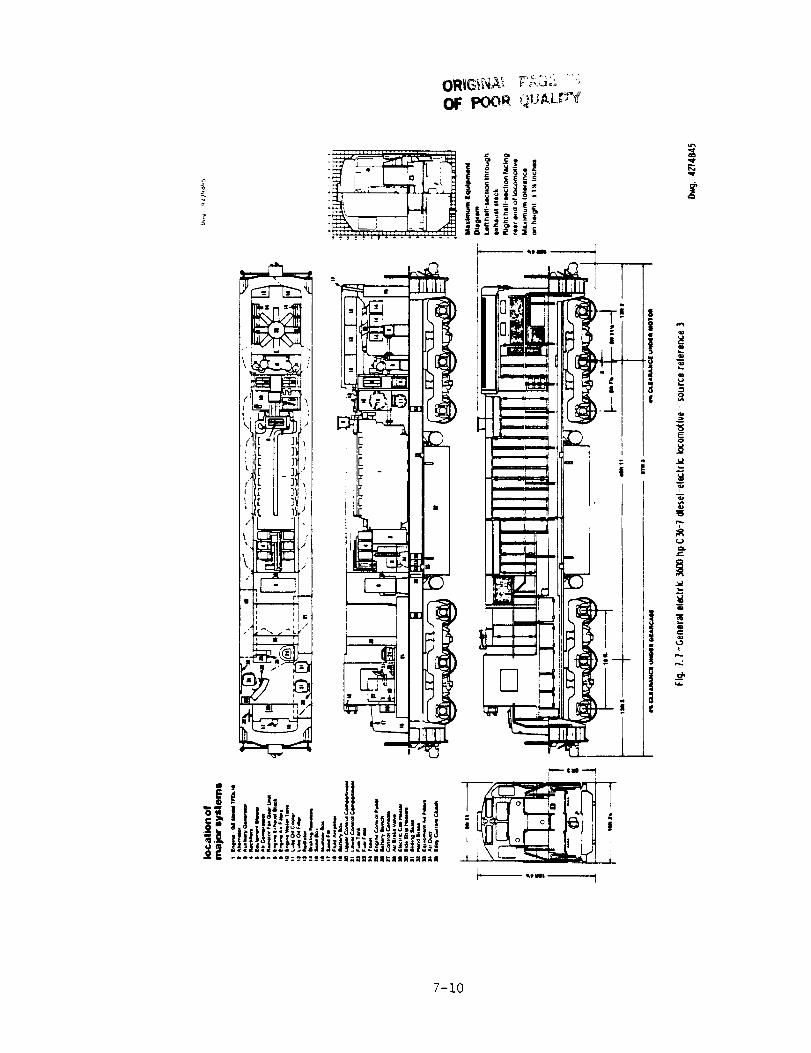
• _,_ _ _'_ d_ _- '<
OF poor _(_u_L_
7-i0
in Figure 7.8. It was possible to eliminate a significant number of the
engine auxiliary associated with a non-adiabatic engine and to conserve
space by rearranging the residual auxiliaries and by shortening the
length of the diesel engine.* It was necessary, however, to lengthenthe locomotive chassis by about 18 in. to fit in the components required
for the fluidized bed system. This is, of course, such a small percent-
age increase that it can probably be reduced to zero by judicious
detailed design which is outside the scope of this study.
7.2.2 Steam Injection Cycle
The componentsof the steam injection cycle system for thelocomotive application are similar to those for the truck since the
subposed power conversion unit connects to the diesel engine crankshaft
through a gearbox, information on the turbomachinery is given in
Appendix C. All of the system componentsexcept the feedwater storagetank are shown in the arrangement drawing given in Figure 7.9. The
incremental length required by the subposed system was almost equal tothe reduction in diesel engine length as the overall locomotive chassis_ength is unchanged.
A separate tender with cylindrical tank 6 ft in diameter and 24
ft long will be required for feedwater to match the fuel storagecapacity of the unit.
7.2.3 Stirling Engine
The componentsof the Stifling engine system for the locomotiveapplication are significantly different from that for the truck. The
system is madeup of multiple MODIStirling engine modules described inReference 20. Seven (7) high temperature modules and seventeen (17) low
temperature modules are required. These 24 modules are arranged in sixbatteries as shown in Figure 7.!0.
*Total power was maintained at 3600 hp so length of engine could bereduced.
7-11
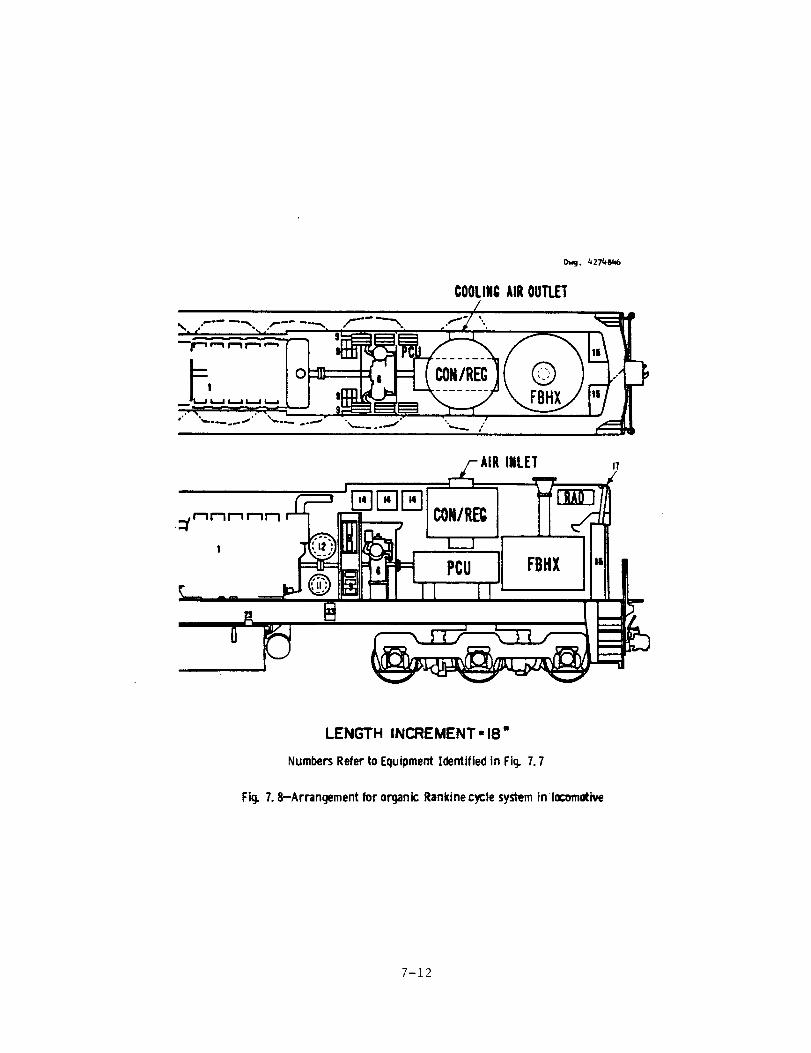
Owg. _27_B_
COOLINGAIROUTLET
INLET 17
,/
LENGTH INCREMENT • 18"
Numbers Refer to Equipment Identified in Fig. 7. 7
Fig. 7. 8-Arran_ment for organic Rankinec_:le system inlocomotive
7-12

D_j, 4274B47
PCU FBHX :,
I1d
LENGTH INCREMENT: O"
Numbers RefertoEquipme_ Identifiedin Fig.7.7
Fig.7.Or-Arrangement forsteam injectionsystem in locomotive
7-13
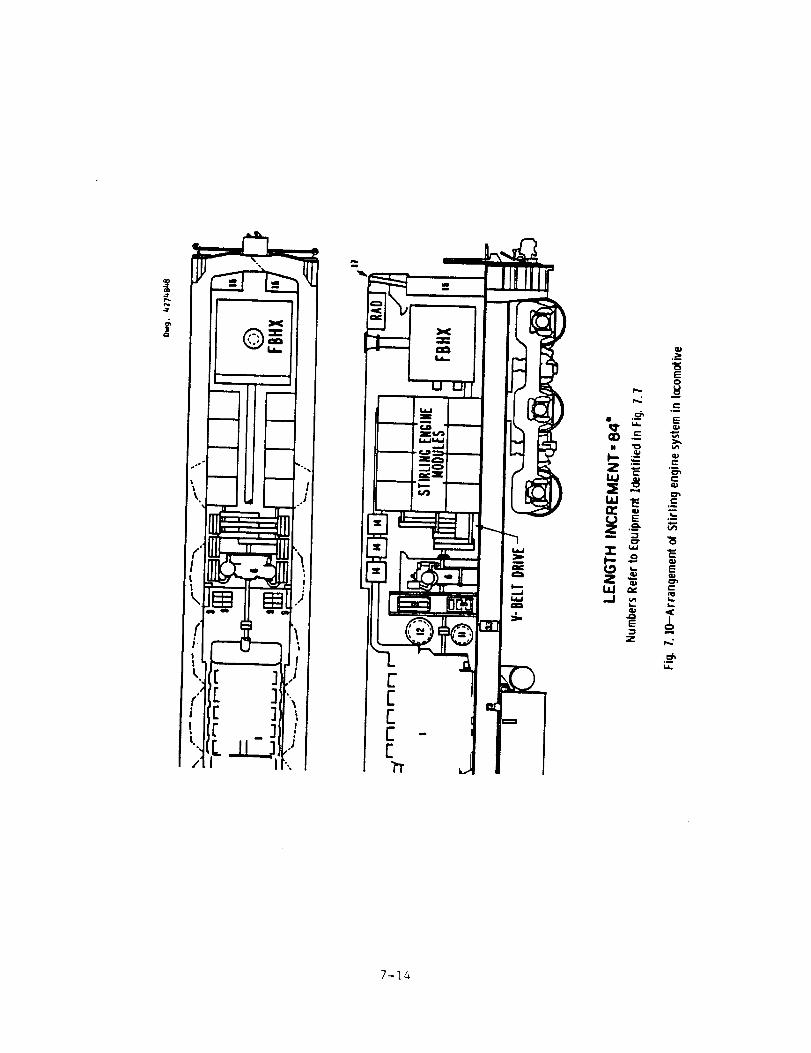
m
ECE
• ,m
QO .S
W
._
I- o
Z _
z
E0
r.-._
E
r-
c
c
E
e...
Io
7-14
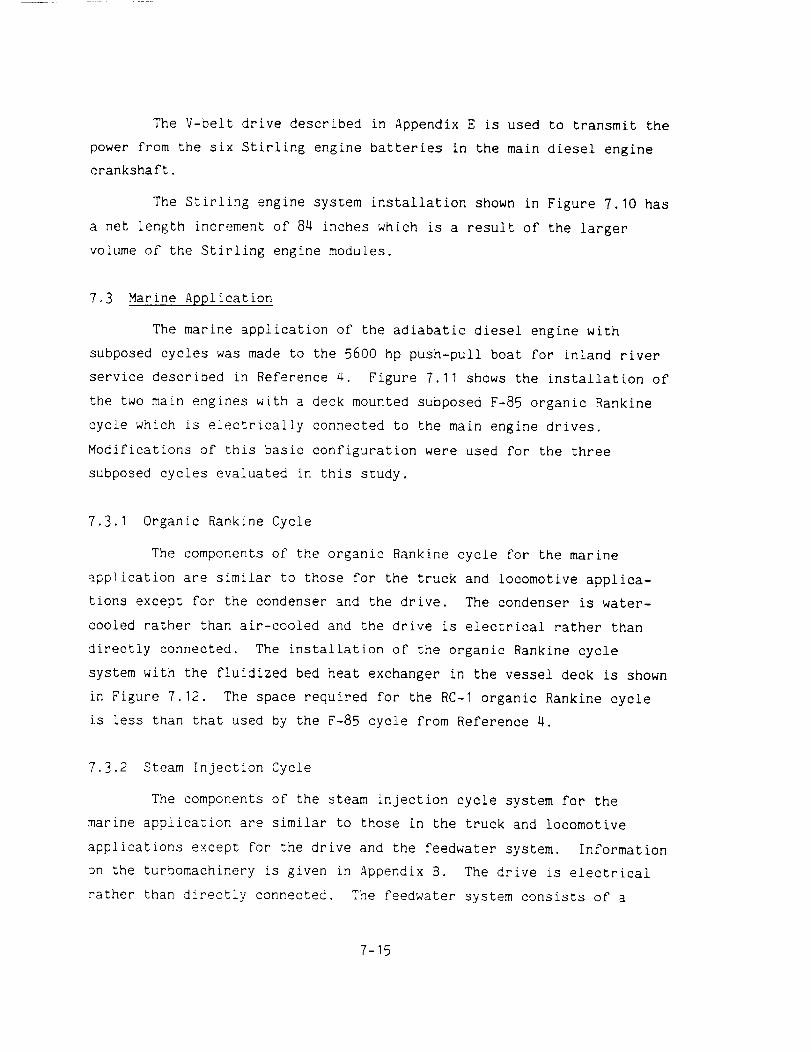
The V-belt drive described in Appendix E is used to transmit the
Dower from the six Stirling engine batteries in the main diesel engine
crankshaft.
The Stifling engine system installation shown in Figure 7.10 has
a net length increment of 84 inches which is a result of the larger
volume of the Stirling engine modules.
7,3 Marine Application
The marine application of the adiabatic diesel engine with
subposed cycles was made to the 5600 hp push-pull boat for inland river
service described in Reference 4. Figure 7.11 shows the installation of
the two main engines with a deck mounted subposed F-85 organic Rankine
cycle which is electrically connected to the main engine drives°
Modifications of this basic configuration were used for the three
subposed cycles evaluated in this study.
7.3.1 Organic Rankine Cycle
The components of the organic Rankine cycle for the marine
epplication are similar to those for the truck and locomotive applica-
tions except for the condenser and the drive. The condenser is water-
cooled rather than air-cooled and the drive is electrical rather than
directly connected. The installation of the organic Rankine cycle
system with the fluidized bed heat exchanger in the vessel deck is shown
in Figure 7.12. The space required for the RC-I organic Rankine cycle
is less than that used by the F-85 cycle from Reference 4.
7.3.2 Steam _njection Cycle
The components of the steam injection cycle system for the
marine application are similar to those in the truck and locomotive
applications except for the drive and the feedwater system. Information
on the turbomachinery is given in Appendix B. The drive is electrical
rather than directly connected. The feedwater system consists of a
7-15

ORIGINAL PA_._ ___OF POORQU_r_
mBC.'IL|¢T_¢ Omv[
Fig. 7. ll-R BC/vessel installation
Dwg. 9370A33
Source: Reference4
7-16
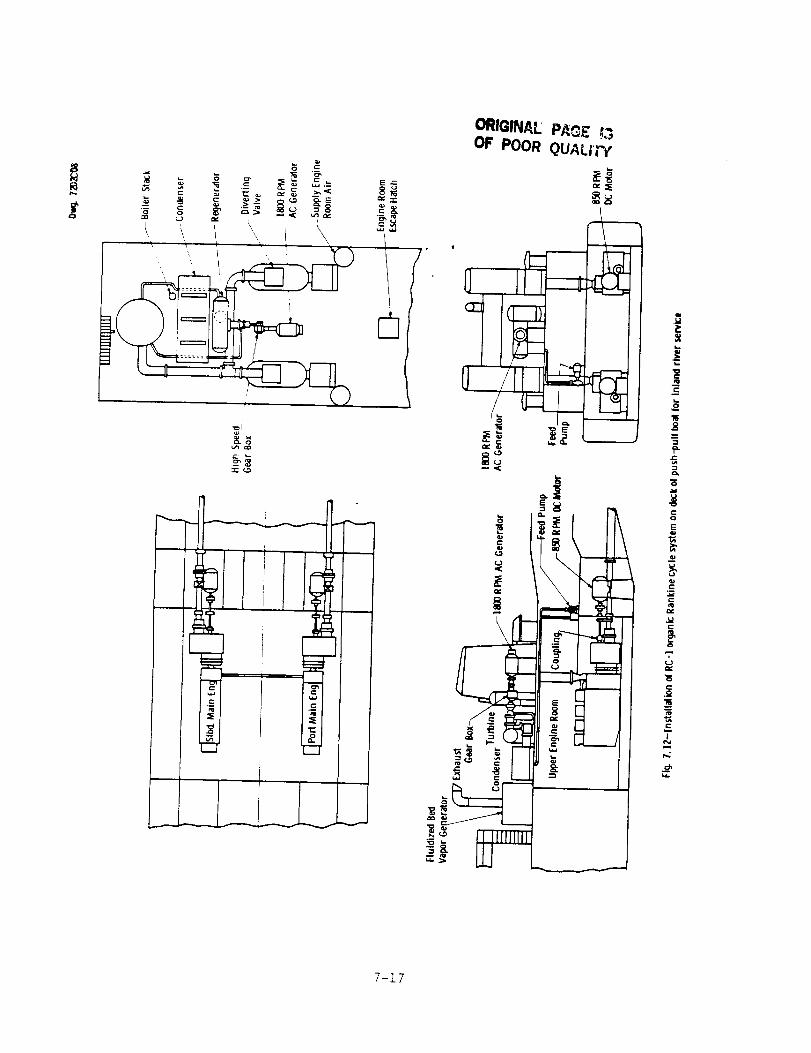
o o _ _> _
a
-_-¢3
F: .c;
-r-
e- a.
OF POORPA_E ;3QUALiPt
-i
JI ---
¢J
I,----,
7-17
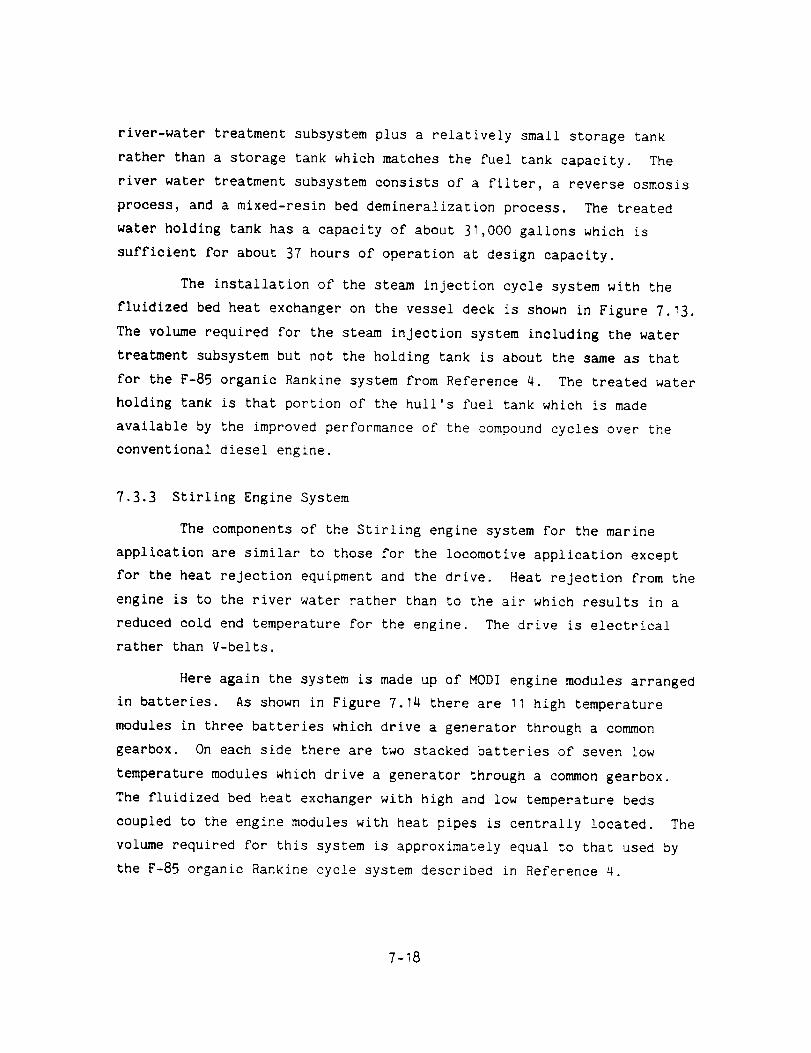
river-water treatment subsystem plus a relatively small storage tank
rather than a storage tank which matches the fuel tank capacity. Theriver water treatment subsystem consists of a filter, a reverse osmosis
process, and a mixed-resin bed demineralization process. The treated
water holding tank has a capacity of about 31,000 gallons which is
sufficient for about 37 hours of operation at design capacity.
The installation of the steam injection cycle system with the
fluidized bed heat exchanger on the vessel deck is shown in Figure 7.13.
The volume required for the steam injection system including the watertreatment subsystem but not the holding tank is about the sameas thatfor the F-85 organic Rankine system from Reference 4. The treated water
holding tank is that portion of the hull's fuel tank which is made
available by the improved performance of the compoundcycles over theconventional diesel engine.
7.3.3 Stirling Engine System
The componentsof the Stirling engine system for the marine
application are similar to those for the locomotive application exceptfor the heat rejection equipment and the drive. Heat rejection from theengine is to the river water rather than to the air which results in a
reduced cold end temperature for the engine. The drive is electricalrather than V-belts.
Here again the system is madeup of MODIengine modules arrangedin batteries. As shown in Figure 7.14 there are 11 high temperature
modules in three batteries which drive a generator through a commongearbox. On each side there are two stacked batteries of seven low
temperature modules which drive a generator through a commongearbox.
The fluidized bed heat exchanger with high and low temperature beds
coupled to the engine modules with heat pipes is centrally located. The
volume required for this system is approximately equal zo that used bythe F-85 organic Rankine cycle system described in Reference 4.
7-18
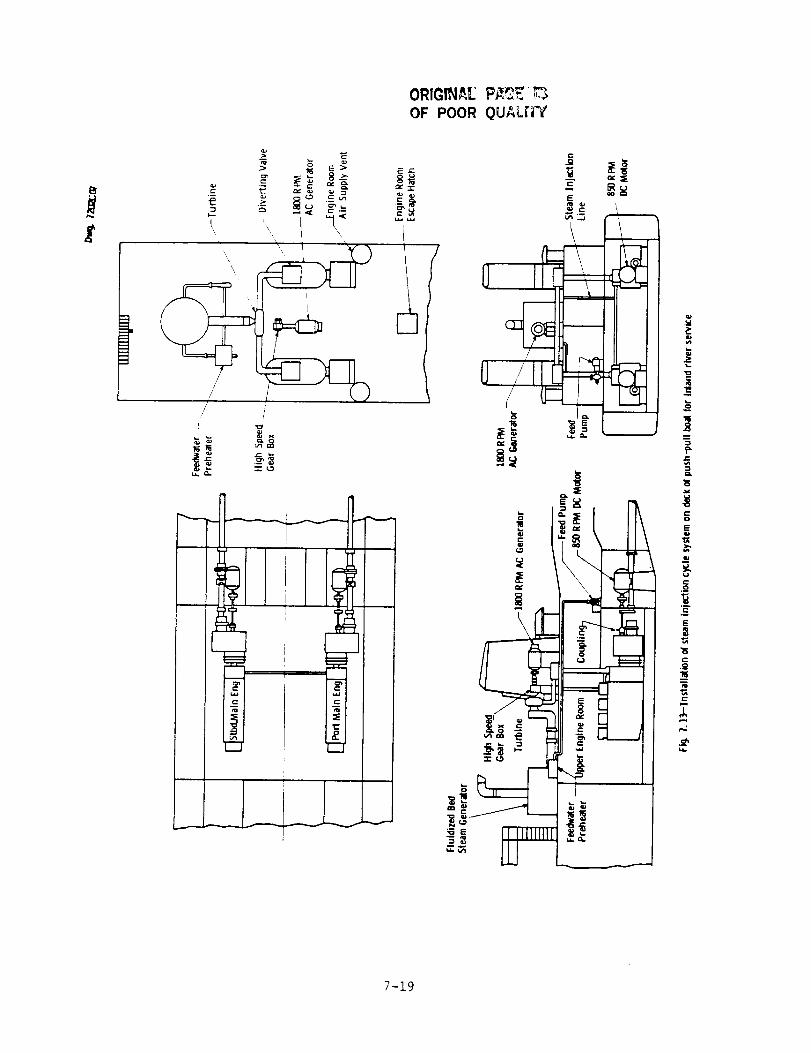
OF POOR QU_Lri_I'
7-].9
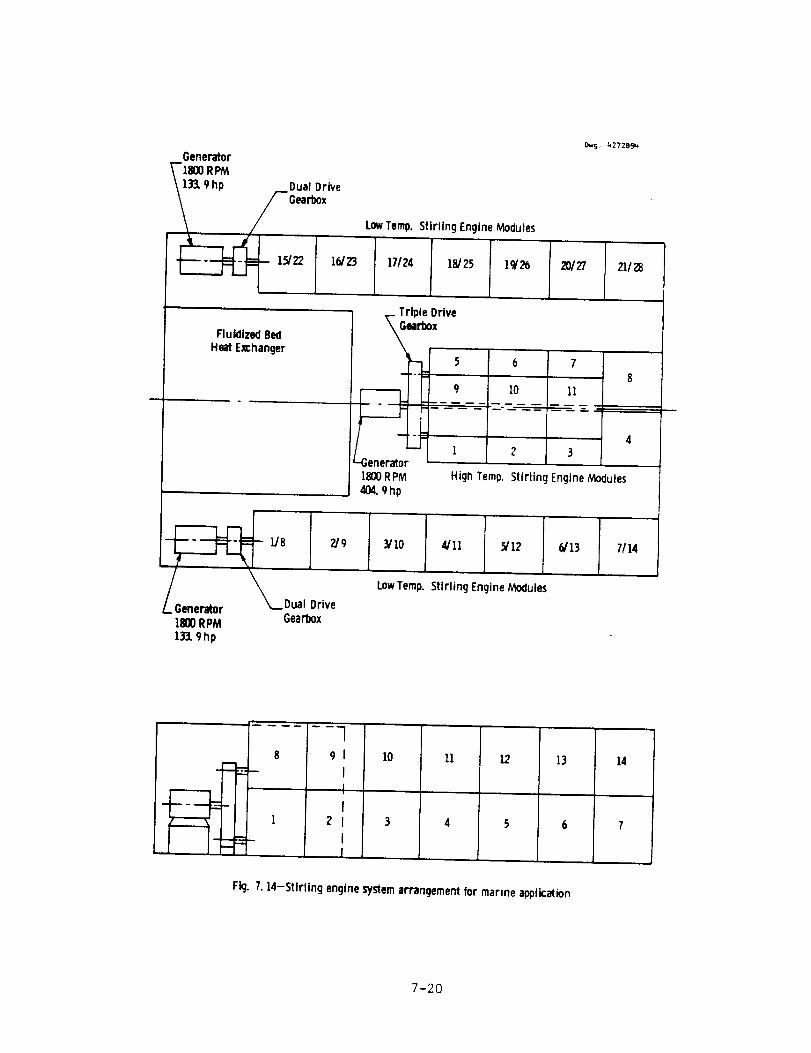
Generator
1800RPM133.9 hp Dual Drive
Gearbox
_---_ L.Temp. Stir,lng EngineM_d_,.__s
__ Triple Drive
FIuidized Bed _earboxHeatE_:hanger
-Generator1800RPM404.9hp
5 6
D.,,vg. 4272B9_
_)/27 21/28
---------- 89 10 II
41
High Temp. Stirling Engine Modules
Dual
1800 RPM13t 9hp
2/9
DriveGearbox
LowTemp. Stifling Engine Modules
7114
8
. Z..--:-_
]91
III
21II
lO 11
3 4
12 13 14
6 7
Fkj. 7. 14-Stirling engine systemarrangementfor marine apolication
7-20
8. SYSTEMCOSTSANDECONOMICASSESSMENT
8.1 System Component Weights and Costs
This section summarizes the heat recovery subsystem component
weights and costs derived from the conceptual design studies described.
The design and cost basis for the different fluid bed heat exchangers
was described in Section 6 above. Tables 8oi through 8.9 summarize the
estimated weights and costs for the major components comprising the heat
recovery system for three different subposed cycles for the three
applications. Where applicable, costs were scaled and indexed from
available studies, References I through 4, and by weight and cost
factors derived for similar mechanical equipment, piping, controls and
other hardware. All prices have been indexed to mid-1984 dollars.
8.1.1 Rankine Cycle System
The weights for all of the system components except the
fluidized bed vapor generator were based on the TECO design in Reference
I. The procedures used for scaling the turboexpander and the planetary
gearbox for the locomotive and marine applications are described in
Appendix F.
8.1.2 Steam Injection Cycle System
The procedures for estimating the weights of compressor drive
expander, the power expander, and the planetary gearbox for all
applications of the steam injection cycle system are described in
Appendix B. The weights of the feed pump and the feed pump drive were
derived from Reference I. The weights of the other components were
calculated or derived from generic data.
8-I
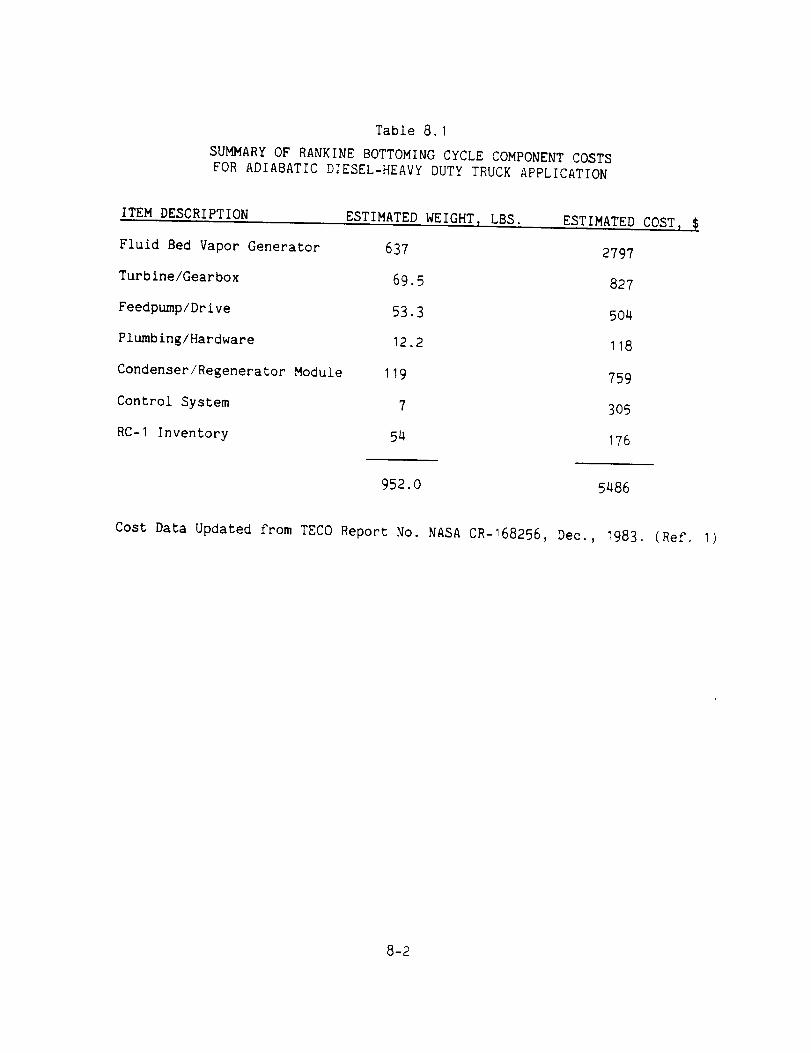
Table 8.1
SUGARYOF RANKINEBOTTOMINGCYCLECOMPONENTCOSTSFORADIABATICDIESEL-HEAVYDUTYTRUCKAPPLICATION
ITEMDESCRIPTION ESTIMATEDWEIGHT_LBS. ESTIMATEDCOST,Fluid Bed Vapor Generator 637
Turbine/Gearbox 69.5
Feedpump/Drive 53.3
Plumbing/Hardware 12.2
Condenser/Regenerator Module 119
Control System 7
RC-I Inventory 54
2797
827
5O4
118
759
3O5
176
952.0 5486
Cost Data Updated from TECOReport No. NASACR-168256, Dec., 1983. (Ref. I
8-2
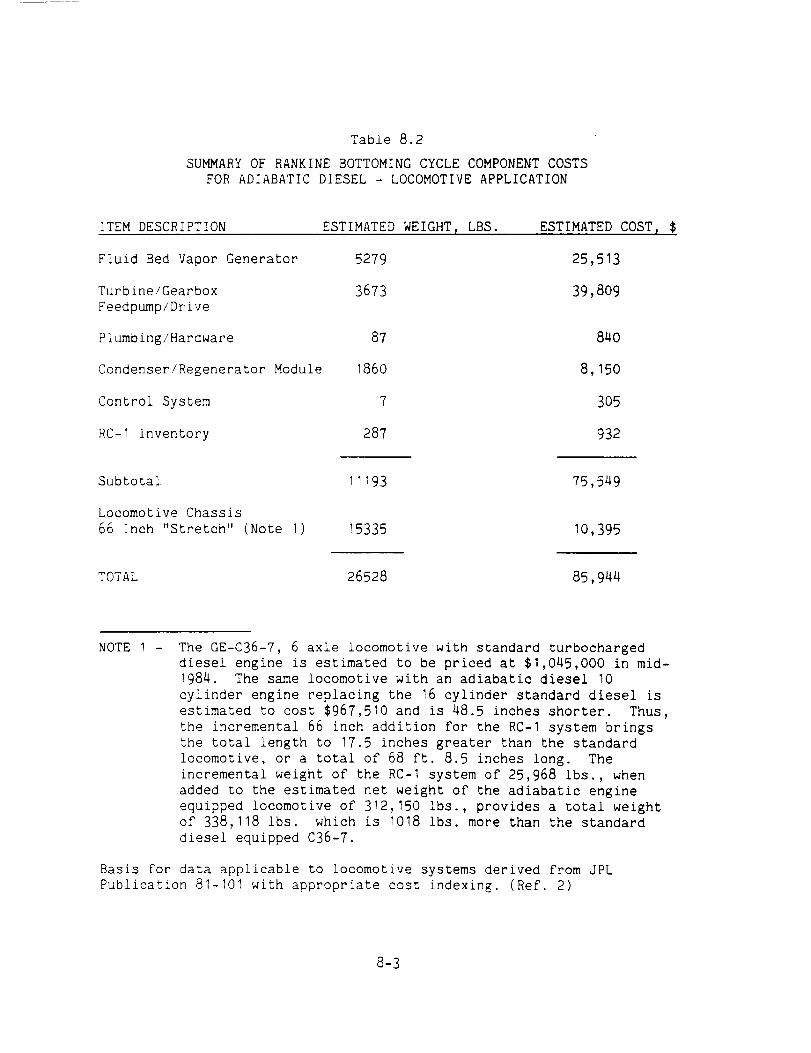
Table 8.2
SUMMARYOF RANKINEBOTTOMINGCYCLECOMPONENTCOSTSFORADIABATICDIESEL- LOCOMOTIVEAPPLICATION
ITEMDESCRIPTION ESTIMATEDWEIGHT,LBS.
Fluid Bed Vapor Generator 5279
Turbine/Gearbox 3673Feedpump/Drive
Plumbing/Hardware 87
Condenser/Regenerator Module 1860
Control System 7
RC-I Inventory 287
ESTIMATEDCOST,$
25,513
39,809
84O
8,150
305
932
Subtotal 11193
Locomotive Chassis
66 Inch "Stretch" (Note I) 15335
75,549
I0,395
TOTAL 26528 85,944
NOTE I - The GE-C36-7, 6 axle locomotive with standard turbocharged
diesel engine is estimated to be priced at $1,045,000 in mid-
1984. The same locomotive with an adiabatic diesel 10
cylinder engine replacing the 16 cylinder standard diesel is
estimated to cost $967,510 and is 48.5 inches shorter. Thus,
the incremental 66 inch addition for the RC-I system brings
the total length to 17.5 inches greater than the standard
locomotive, or a total of 68 ft. 8.5 inches long. The
incremental weight of the RC-I system of 25,968 ibs., when
added to the estimated net weight of the adiabatic engine
equipped locomotive of 312,150 Ibs., provides a total weight
of 338,118 ibs. which is 1018 ibs. more than the standard
diesel equipped C36-7.
Basis for data applicable to locomotive systems derived from JPL
Publication 81-101 with appropriate cost indexing. (Ref. 2)
8-3
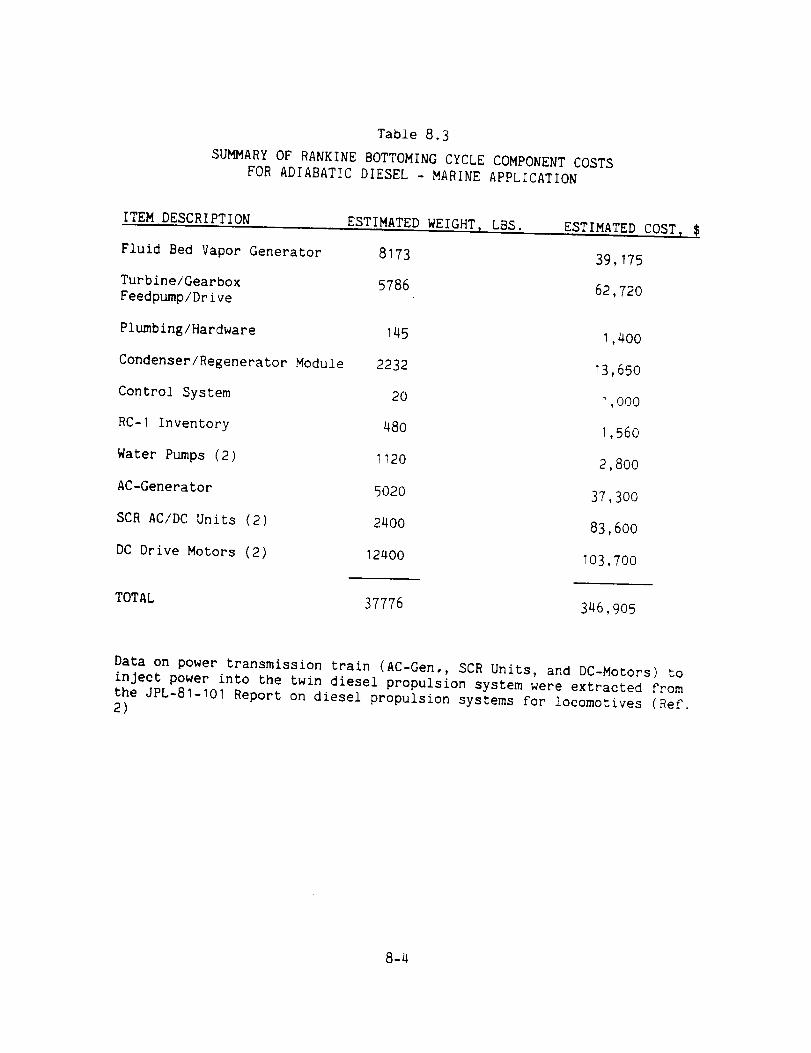
Table 8.3
SUMMARY OF RANKINE BOTTOMING CYCLE COMPONENT COSTS
FOR ADIABATIC DIESEL - MARINE APPLICATION
ITEM DESCRIPTION
Fluid Bed Vapor Generator
Turbine/Gearbox
Feedpump/Drive
ESTIMATED WEIGHT, LBS.
8173
5786
ESTIMATED COST, I'
39,175
62,720
Plumbing/Hardware 145
Condenser/Regenerator Module 2232
Control System 20
RC-I Inventory 480
Water Pumps (2) 1120
AC-Generator 5020
SCR AC/DC Units (2) 2400
DC Drive Motors (2) 12400
1,400
13,650
1,000
1,560
2,800
37,300
83,6OO
103,700
TOTAL 37776346,905
Data on power transmission train (AC-Gen,, SCR Units, and DC-Motors) to
inject power into the twin diesel propulsion system were extracted from
the JPL-81-101 Report on diesel propulsion systems for locomotives (Ref.2)
8-4

Table 8.4
SUMMARYOFSTEAMINJECTIONCYCLECOMPONENTCOSTSFORADTABATICDIESEL- HEAVYDUTYTRUCKAPPLICATION
ITEMDESCRIPTION
Fluid Bed Boiler
Turbine/GearboxFeedpump/Drive
Oil Cooler
Plumbing/Hardware
Control System
Water Tank, Empty
(Full)
ESTIMATEDWEIGHT,LBS.
587
136
3
24
10
750
(5750)
ESTIMATED COST, $
1,989
1,475
15
235
390
1,875
TOTAL 1510
(6510)
5,979
8-5
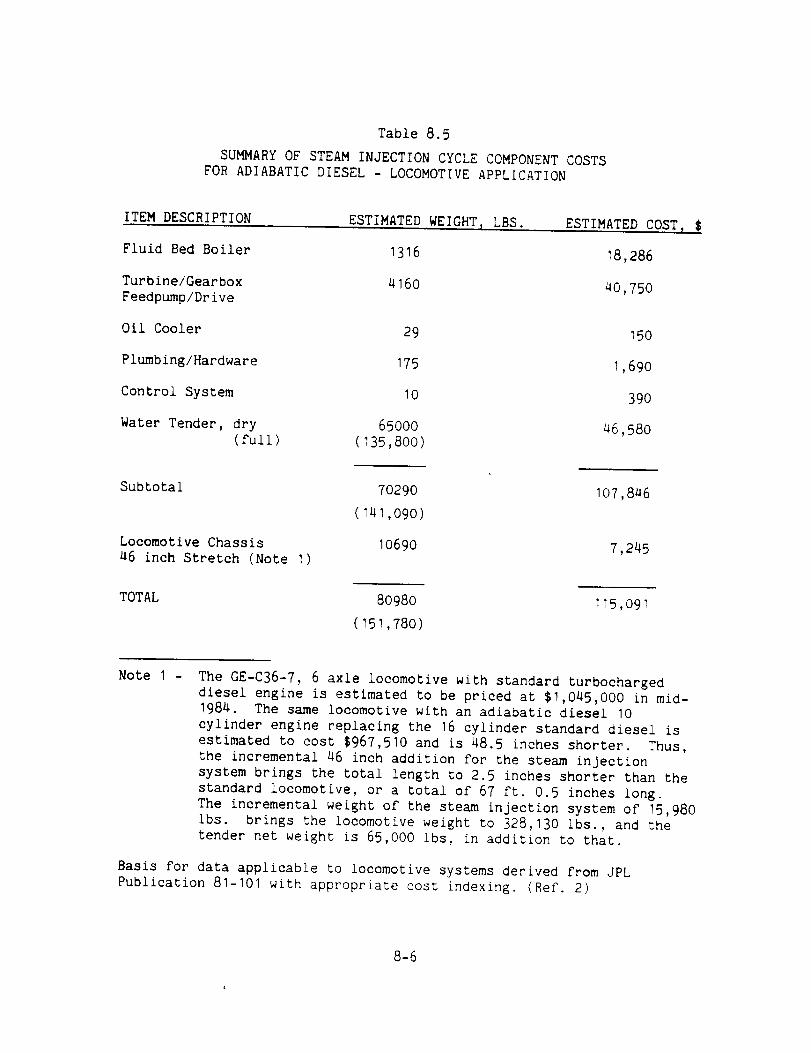
Table 8.5
SUMMARY OF STEAM INJECTION CYCLE COMPONENT COSTS
FOR ADIABATIC DIESEL - LOCOMOTIVE APPLICATION
ITEM DESCRIPTION
Fluid Bed Boiler
Turbine/Gearbox
Feedpump/Drive
Oil Cooler
Plumbing/Hardware
Control System
Water Tender, dry
(full)
ESTIMATED WEIGHT_ LBS.
1316
4160
29
175
10
6500O
(135,800)
ESTIMATED COST, $
18,286
40,750
150
1,690
390
46,58O
Subtotal
Locomotive Chassis
46 inch Stretch (Note I)
70290
(141,090)
10690
107,846
7,245
TOTAL80980 115,091
(151,780)
Note I -The GE-C36-7, 6 axle locomotive with standard turbocharged
diesel engine is estimated to be priced at $1,045,000 in mid-1984. The same locomotive with an adiabatic diesel 10
cylinder engine replacing the 16 cylinder standard diesel is
estimated to cost $967,510 and is 48.5 inches shorter. Thus,
the incremental 46 inch addition for the steam injection
system brings the total length to 2.5 inches shorter than the
standard locomotive, or a total of 67 ft. 0.5 inches long.
The incremental weight of the steam injection system of 15,980
ibs. brings the locomotive weight to 328,130 ibs., and the
tender net weight is 65,000 ibs, in addition to that.
Basis for data applicable to locomotive systems derived from JPL
Publication 81-101 with appropriate cost indexing. (Ref. 2)
8-6
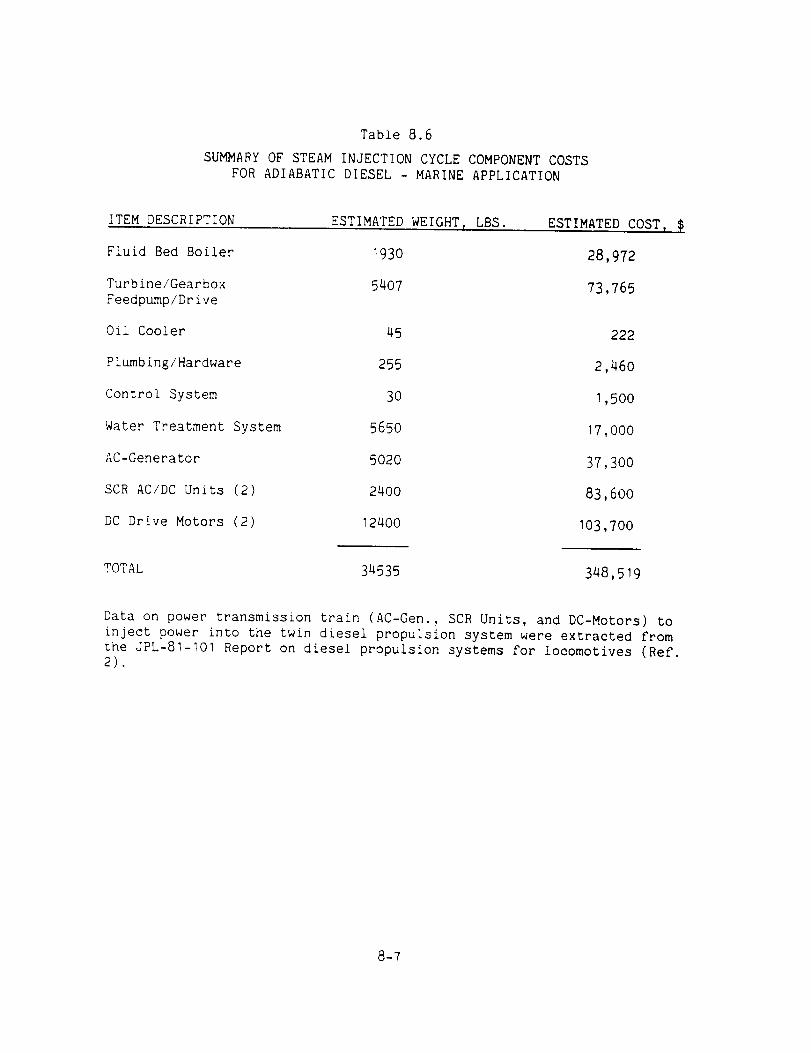
Table 8.6
SUMMARY OF STEAM INJECTION CYCLE COMPONENT COSTS
FOR ADIABATIC DIESEL - MARINE APPLICATION
ITEM DESCRIPTION
Fluid Bed Boiler
Turbine/Gearbox
Feedpump/Drive
Oil Cooler
Plumbing/Hardware
Control System
Water Treatment System
AC-Generator
SCR AC/DC Units (2)
DC Drive Motors (2)
ESTIMATED WEIGHT r LBS.
1930
5407
45
255
30
5650
5020
2400
12400
ESTIMATED COST r $
28,972
73,765
222
2,460
1,5OO
17 0OO
37 300
83 600
103,700
TOTAL 34535 348,519
Data on power transmission train (AC-Gen., SCR Units, and DC-Motors) to
inject power into the twin diesel propulsion system were extracted from
the JPL-81-1OI Report on diesel propulsion systems for locomotives (Ref.2).
8-7
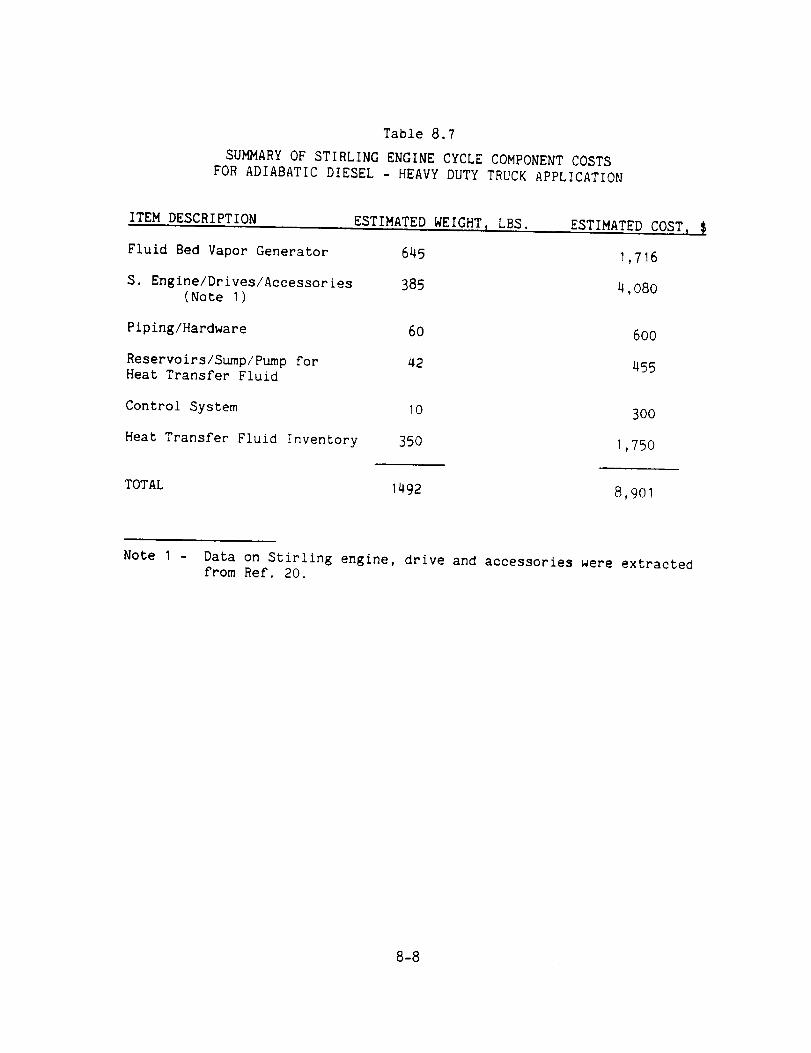
Table 8.7
SUMMARYOFSTIRLINGENGINECYCLECOMPONENTCOSTSFORADIABATICDIESEL- HEAVYDUTYTRUCKAPPLICATION
ITEMDESCRIPTION ESTIMATEDWEIGHTI LBS.
Fluid Bed Vapor Generator 645
S. Engine/Drives/Accessories 385(Note I)
Piping/Hardware 60
Reservoirs/Sump/Pumpfor 42Heat Transfer Fluid
Control System 10
Heat Transfer Fluid Inventory 350
ESTIMATEDCOSTI
1,716
4,080
60o
455
300
1,750
TOTAL 1492 8,901
Note I - Data on Stirling engine, drive and accessories were extractedfrom Ref. 20.
8-8

Table 8r8
SUMMARY OF STIRLING ENGINE CYCLE COMPONENT COSTS
FOR ADIABATIC DIESEL - LOCOMOTIVE APPLICATION
ITEM DESCRIPTION ESTIMATED WEIGHT, LBS. ESTIMATED COST, $
Fluid Bed Vapor Generator
S. Engine/Drives/Accessories
Piping/Hardware
Reservoirs/Sump/Pump forHeat Transfer Fluid
Control System
Heat Transfer Fluid Inventory
Subtotal
Locomotive Chassis
60 inches Longer
TOTAL
5240
3875
400
420
10
3500
13445
13940
27385
15,176
40,970
4,000
4,550
300
17,5OO
82,496
9,450
91,946
8-9
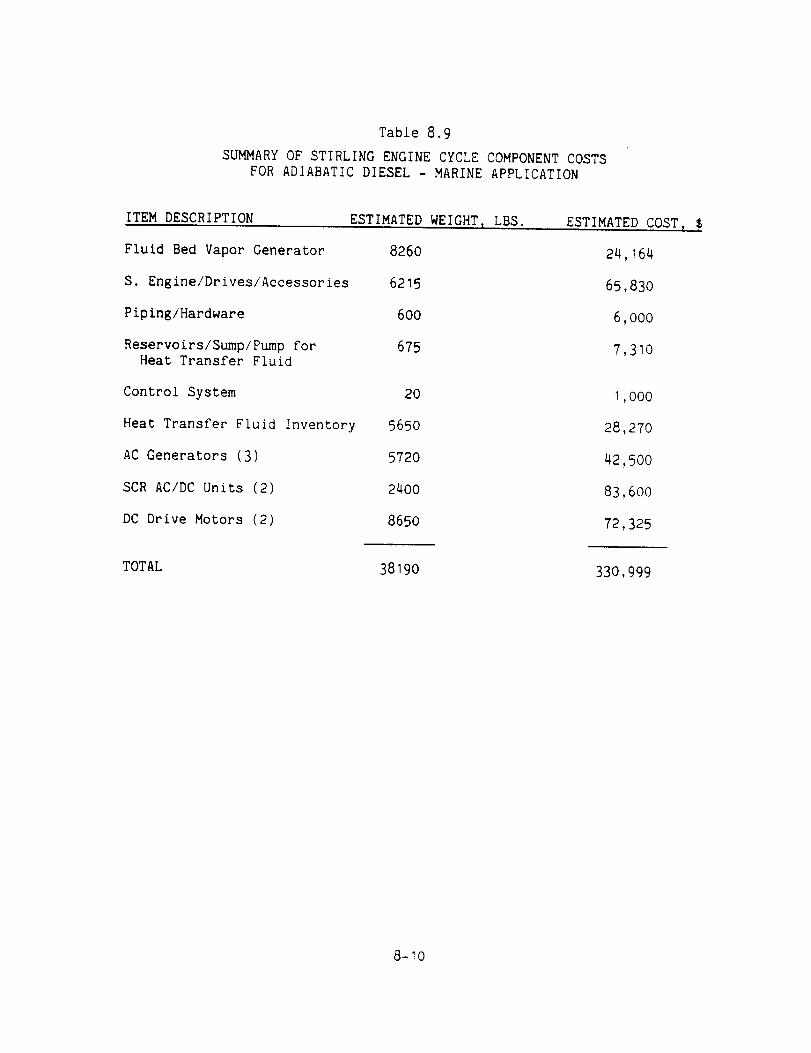
Table 8.9
SUMMARY OF STIRLING ENGINE CYCLE COMPONENT COSTS
FOR ADIABATIC DIESEL - MARINE APPLICATION
ITEM DESCRIPTION ESTIMATED WEIGHT I LBS.
Fluid Bed Vapor Generator
S. Engine/Drives/Accessories
Piping/Hardware
Reservoirs/Sump/Pump forHeat Transfer Fluid
Control System
Heat Transfer Fluid Inventory
AC Generators (3)
SCR AC/DC Units (2)
DC Drive Motors (2)
8260
6215
600
675
20
565O
5720
24O0
865O
ESTIMATED COST,
24,164
65,83O
6,000
7,310
1,000
28,27O
42,500
83,600
72,325
TOTAL 3819O 330,999
8-10
8.1.3 Stirling Engine System
The procedure for estimating the weights of the Stirling engine
for all applications is described in Appendix G. The procedure for
estimating the gearbox weight for the truck application is also
described in Appendix G. The weights of the other components were
calculated, obtained from vendors, or derived from generic data.
8.2 Comparison of System Weights
8.2.1 Truck Application
The system weights for the organic Rankine cycle, steam
injection cycle, and Stifling engine systems for the truck application
are summarized in Tables 8.1, 8.4, and 8.7, respectively. Comparison of
the totals shows that the Rankine cycle system weight is significantly
less than that of the Stifling engine systems. The dry weight of the
steam injection cycle system is approximately the same as that of the
Stirling engine. The weight of the water required to match the fuel
tank capacity for the steam injection cycle, however, is significant.
8.2.2 Locomotive Applications
The system weights for the organic Rankine cycle, the steam
injection cycle, and the Stirling engine systems are sun_narized in
Tables 8.2, 8.5 and 8.8, respectively. The total weights shown are the
sum of the energy conversion system weights and the net incremental
weight of the locomotive. The net incremental weight of the locomotive
is the increase in weight of the stretched chassis, minus the decrease
in weight of the main engine.
Comparing the weights of the energy conversion systems show that
the Rankine cycle is the least with the Stifling about 20% greater. The
dry weight of the steam injection cycle including the dry tender is
substantially greater than those of the other two systems. Comparing
the total weights shows that the organic Rankine cycle and the Stirling
8-11
engine systems are nearly equaio The total dry weight of the steam
injection system is about 3 times that of the other two systems. Adding
the weight of the water to match the fuel storage tanks makes the
difference even greater.
8.2.3 Marine Application
The system weights for the organic Rankine cycle, steam injec-
tion cycle, and Stirling engine systems for the marine application are
summarized in Tables 8.3, 8.6, and 8.9, respectively. Comparing the
total weights shows that the steam injection cycle system weighs the
least. The weights of the two other systems are nearly equal and are
about 15% greater than that of the steam injection cycle system.
The steam injection cycle system is superior in the marine
application because provision is made for processing the feedwater
during the duty cycle and no additional below deck tankage is required.
8.3 Economic Assessment of Turbocompound Diesel Engine Systems
The derived component cost and system performance data are used
to calculate simple payback periods for the various heat utilization
cycles and applications. In this analyses, the simple payback period
(in years) is obtained by dividing the incremental capital investment
for a given system by the annual value of fuel savings for that system.
Table 8.10 shows the assumed economic and operational data used in
calculating annual fuel consumption. Annual duty cycles were obtained
from the previously cited reference studies.(1,2,4) Maintenance costs
have not been included in this analysis. The incremental capital and
fuel basis assumes comparison with the NASA Reference Adiabatic Turbo-
compounded Diesel with aftercooling. The pertinent engine parameters,
costs and payback calculations are given in Tables 8.11 through 8.19 for
each study case. Selling price for the reference diesel truck engine is
taken from Reference I and adjusted to an equivalent Brake Horsepower
Rating (BHP) using the recommended 30 $/hp factor. For the locomotive
8-12
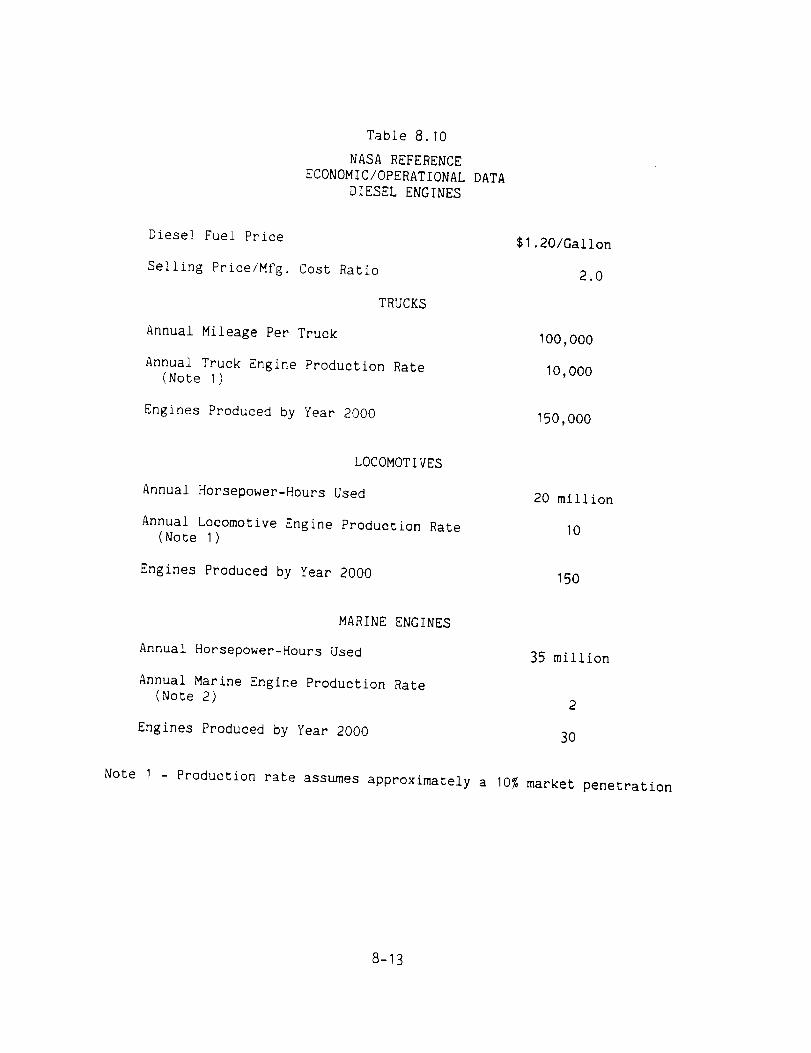
Table 8.10
NASA REFERENCE
ECONOMIC/OPERATIONAL DATA
DIESEL ENGINES
Diesel Fuel Price
Selling Price/Mfg. Cost Ratio
TRUCKS
Annual Mileage Per Truck
Annual Truck Engine Production Rate(Note I)
Engines Produced by Year 2000
$1.20/Gallon
2.0
100,000
10,000
150,000
LOCOMOTIVES
Annual Horsepower-Hours Used
Annual Locomotive Engine Production Rate(Note I)
Engines Produced by Year 2000
20 million
10
150
MARINE ENGINES
Annual Horsepower-Hours Used
Annual Marine Engine Production Rate(Note 2)
Engines Produced by Year 2000
35 million
2
3O
Note I - Production rate assumes approximately a 10% market penetration
8-13
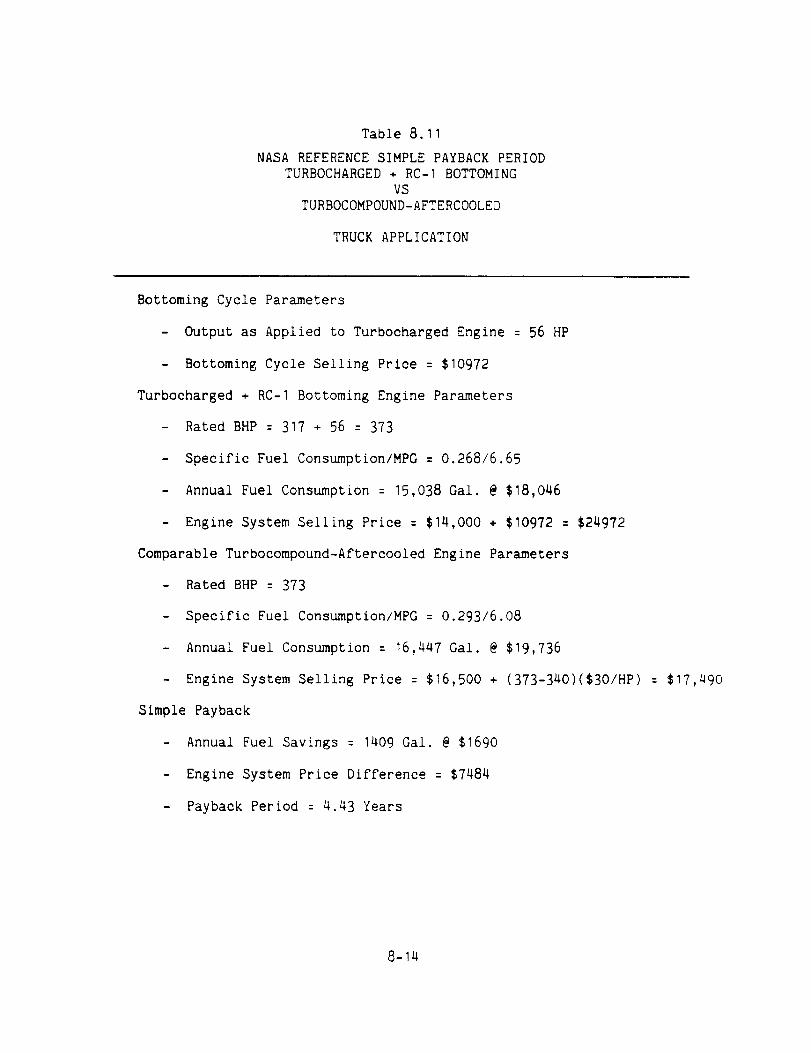
Table 8.11
NASAREFERENCESIMPLEPAYBACKPERIODTURBOCHARGED÷ RC-I BOTTOMING
VSTURBOCOMPOUND-AFTERCOOLED
TRUCKAPPLICATION
Bottoming Cycle Parameters
- Output as Applied to Turbocharged Engine = 56 HP
- Bottoming Cycle Selling Price = $10972
Turbocharged + RC-I Bottoming Engine Parameters
- Rated BHP= 317 + 56 = 373
- Specific Fuel Consumption/MPG= 0.268/6.65
- Annual Fuel Consumption = 15,038 Gal. @$18,046
- Engine System Selling Price = $14,000 + $10972 = $24972
ComparableTurbocompound-Aftercooled Engine Parameters
- Rated BHP= 373
- Specific Fuel Consumption/MPG= 0.293/6.08
- Annual Fuel Consumption = 16,447 Gal. @$19,736
- Engine System Selling Price = $16,500 + (373-340)($30/HP) = $17,_90
Simple Payback
- Annual Fuel Savings = 1409Gal. @$1690
- Engine System Price Difference = $7484
- Payback Period = 4.43 Years
8-Ia
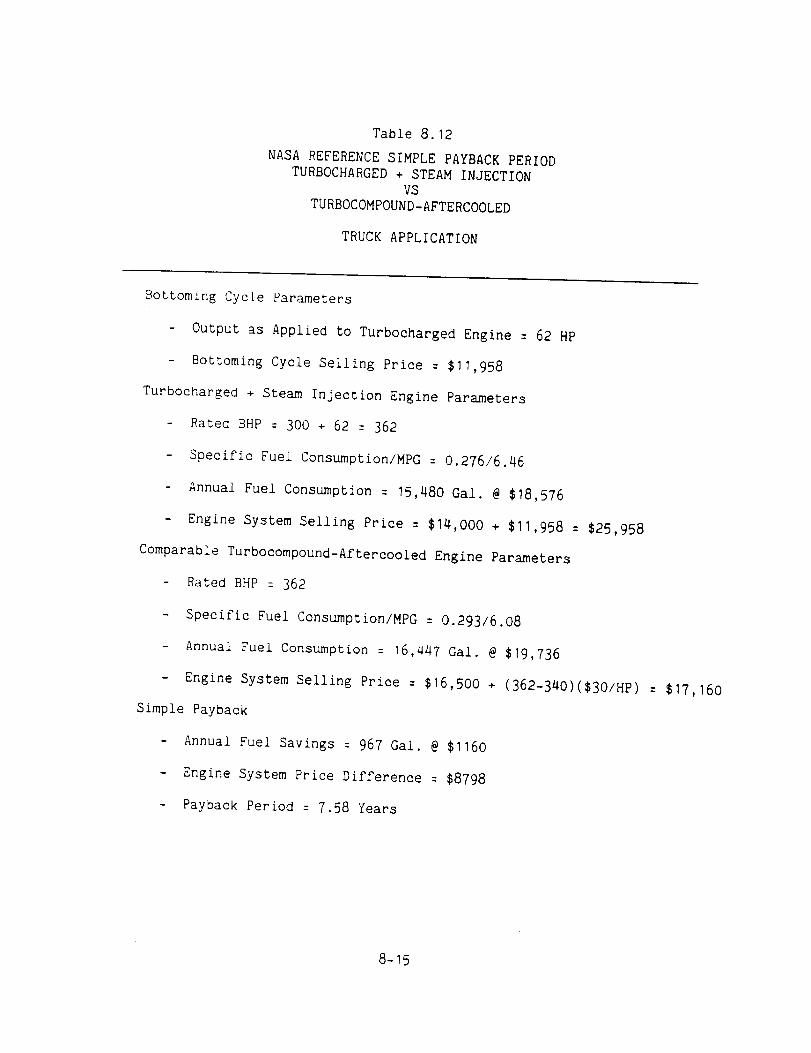
Table 8.12
NASAREFERENCESIMPLEPAYBACKPERIODTURBOCHARGED+ STEAMINJECTION
VSTURBOCOMPOUND-AFTERCOOLED
TRUCKAPPLICATION
Bottoming Cycle Parameters
- Output as Applied to Turbocharged Engine = 62 HP
- Bottoming Cycle Selling Price = $11,958
Turbocharged + SteamInjection Engine Parameters
- Rated BHP= 300 + 62 = 362
- Specific Fuel Consumption/MPG= 0.276/6.46
- Annual Fuel Consumption = 15,480 Gal. @$18,576
- Engine System Selling Price = $14,000 + $11,958 = $25,958
ComparableTurbocompound-Aftercooled Engine Parameters
Rated BHP= 362
- Specific Fuel Consumption/MPG= 0.293/6.08
- Annual Fuel Consumption = 16,447 Gal. @$19,736
- Engine System Selling Price = $16,500 + (362-340)($30/HP) = $17,160Simple Payback
- Annual Fuel Savings = 967 Gal. @$1160
- Engine System Price Difference = $8798
- Payback Period = 7.58 Years
8-15

Table 8.13
NASAREFERENCESIMPLEPAYBACKPERIODTURBOCHARGED+ STIRLINGENGINE
VSTURBOCOMPOUND-AFTERCOOLED
TRUCKAPPLICATION
Bottoming Cycle Parameters
- Output as Applied to Turbocharged Engine = 42 HP
- Bottoming Cycle Selling Price = $17,802
Turbocharged + Stirling Engine Parameters
- Rated BHP= 316 + 42 = 358
- Specific Fuel Consumption/MPG= 0.279/6.39
- Annual Fuel Consumption= 15,649 Gal. @$18,779
- Engine System Selling Price = $14,0OO+ $I?,802 = $31,802
ComparableTurbocompound-Aftercooled Engine Parameters
- Rated BHP= 358
° Specific Fuel Consumption/MPG= 0.293/6.08
- Annual Fuel Consumption = 16,447 Gal. @$19,736
- Engine System Selling Price = $16,5OO+ (358-340)($30/HP) : $17,040
Simple Payback
- Annual Fuel Savings = 798 Gal. @$958
- Engine System Price Difference = $14,762
- Payback Period = 15.4 Years
8-16
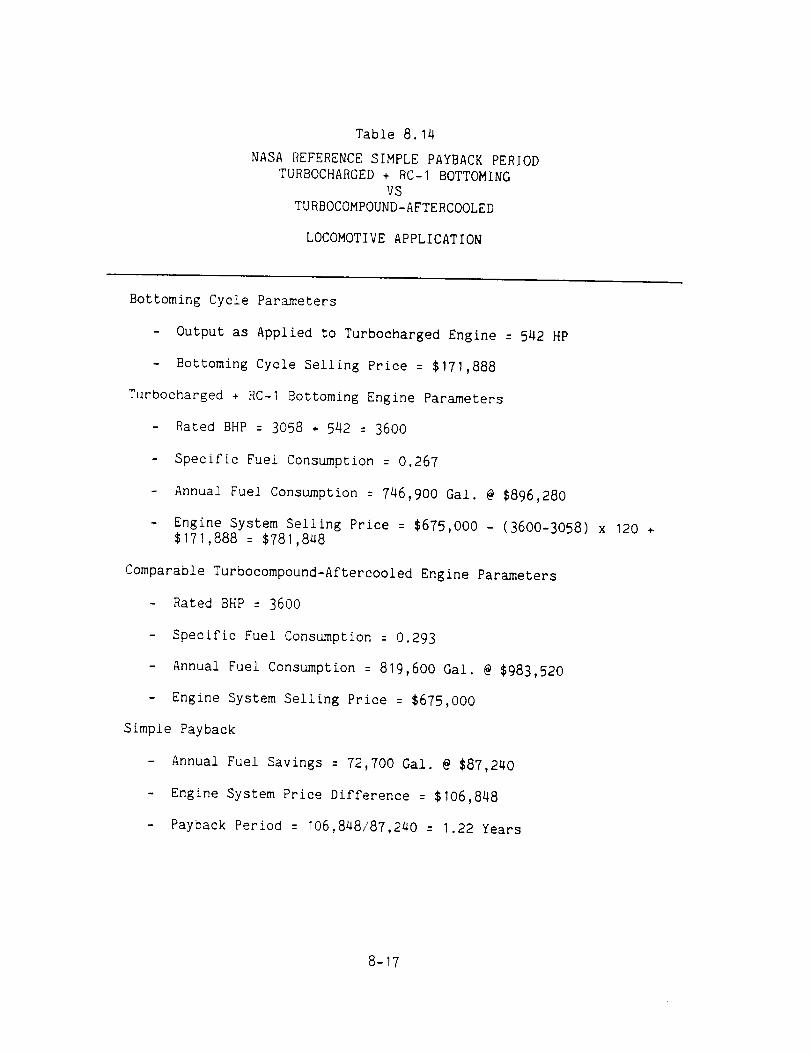
Table 8.14
NASAREFERENCESIMPLEPAYBACKPERIODTURBOCHARGED+ RC-I BOTTOMING
VSTURBOCOMPOUND-AFTERCOOLED
LOCOMOTIVEAPPLICATION
Bottoming Cycle Parameters
- Output as Applied to Turbocharged Engine = 542 HP
- Bottoming Cycle Selling Price = $171,888
Turbocharged + RC-I Bottoming Engine Parameters
- Rated BHP= 3058 + 542 = 3600
- Specific Fuel Consumption= 0.267
- Annual Fuel Consumption= 746,900 Gal. @$896,280
- Engine System Selling Price = $675,000 - (3600-3058) x 120 ÷$171,888 = $781,848
ComparableTurbocompound-Aftercooled Engine Parameters
- Rated BHP= 3600
- Specific Fuel Consumption = 0.293
- Annual Fuel Consumption = 819,600 Gal. @$983,520
- Engine System Selling Price = $675,000
Simple Payback
- Annual Fuel Savings = 72,700 Gal. @$87,240
- Engine System Price Difference = $106,848
- Payback Period = 106,848/87,240 = 1.22 Years
8-17
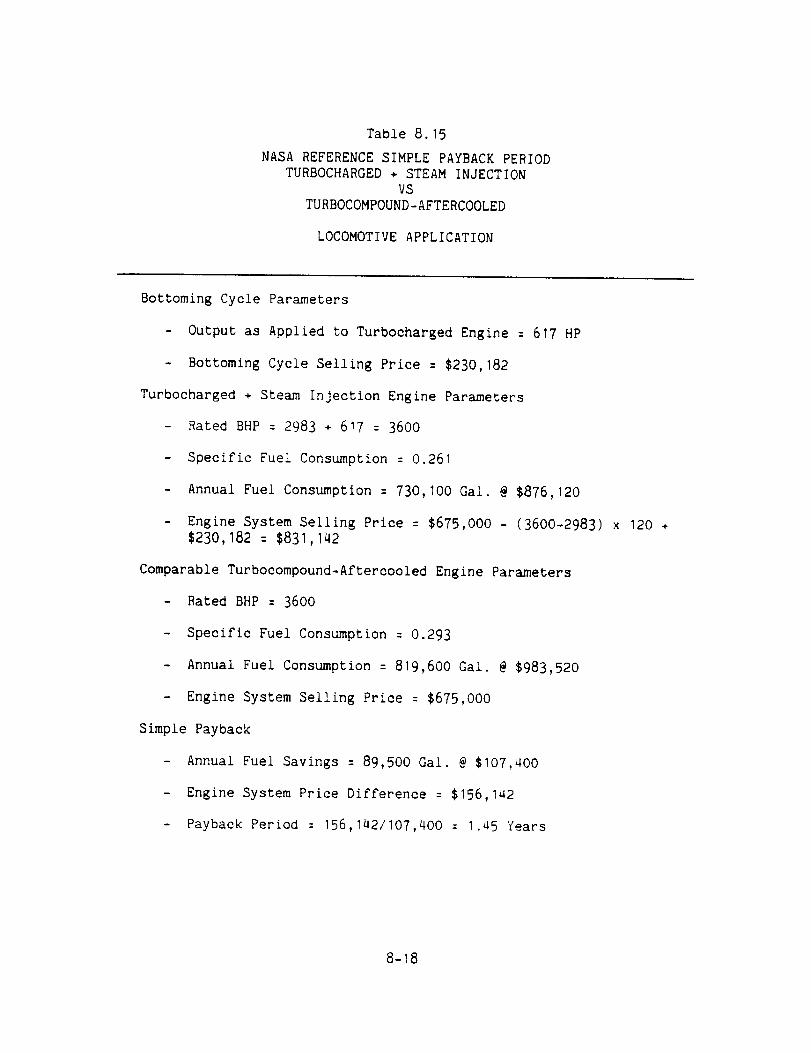
Table 8.15
NASAREFERENCESIMPLEPAYBACKPERIODTURBOCHARGED÷ STEAMINJECTION
VSTURBOCOMPOUND-AFTERCOOLED
LOCOMOTIVEAPPLICATION
Bottoming Cycle Parameters
- Output as Applied to Turbocharged Engine = 617 HP
- Bottoming Cycle Selling Price = $230,182
Turbocharged + Steam Injection Engine Parameters
- Rated BHP= 2983 + 617 = 3600
- Specific Fuel Consumption = O.261
- Annual Fuel Consumption = 730,1OOGal. @$876,120
- Engine System Selling Price = $675,000 - (3600-2983) × 120 ÷$230,182 = $831,142
ComparableTurbocompound-Aftercooled Engine Parameters
- Rated BHP= 3600
- Specific Fuel Consumption = 0.293
- Annual Fuel Consumption = 819,600 Gal. @$983,520
- Engine System Selling Price = $675,000
Simple Payback
- Annual Fuel Savings = 89,500 Gal. @$107,4OO
- Engine System Price Difference = $156,1a2
- Payback Period = 156,142/107,400 = 1.45 Years
8-18
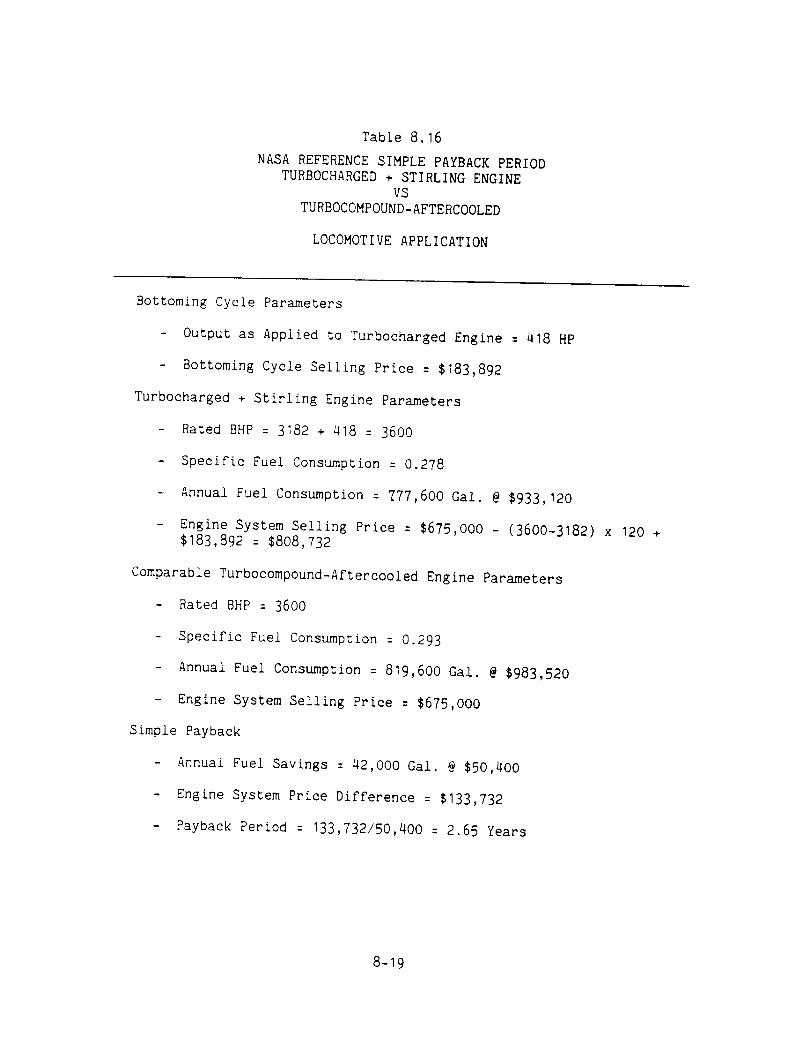
Table 8.16
NASA REFERENCE SIMPLE PAYBACK PERIOD
TURBOCHARGED + STIRLING ENGINE
VS
TURBOCOMPOUND-AFTERCOOLED
LOCOMOTIVE APPLICATION
Bottoming Cycle Parameters
- Output as Applied to Turbocharged Engine = 418 HP
- Bottoming Cycle Selling Price = $183,892
Turbocharged + Stirling Engine Parameters
- Rated BHP = 3182 + 418 = 3600
- Specific Fuel Consumption = 0.278
- Annual Fuel Consumption = 777,600 Gal. @ $933,120
- Engine System Selling Price : $675,000 - (3600-3182) x 120 +$183,892 = $808,732
Comparable Turbocompound-Aftercooled Engine Parameters
- Rated BHP = 3600
Specific Fuel Consumption = 0.293
- Annual Fuel Consumption = 819,600 Gal. @ $983,520
- Engine System Selling Price = $675,000
Simple Payback
- Annual Fuel Savings = 42,000 Gal. @ $50,400
- Engine System Price Difference = $133,732
- Payback Period = 133,732/50,400 = 2.65 Years
8-19
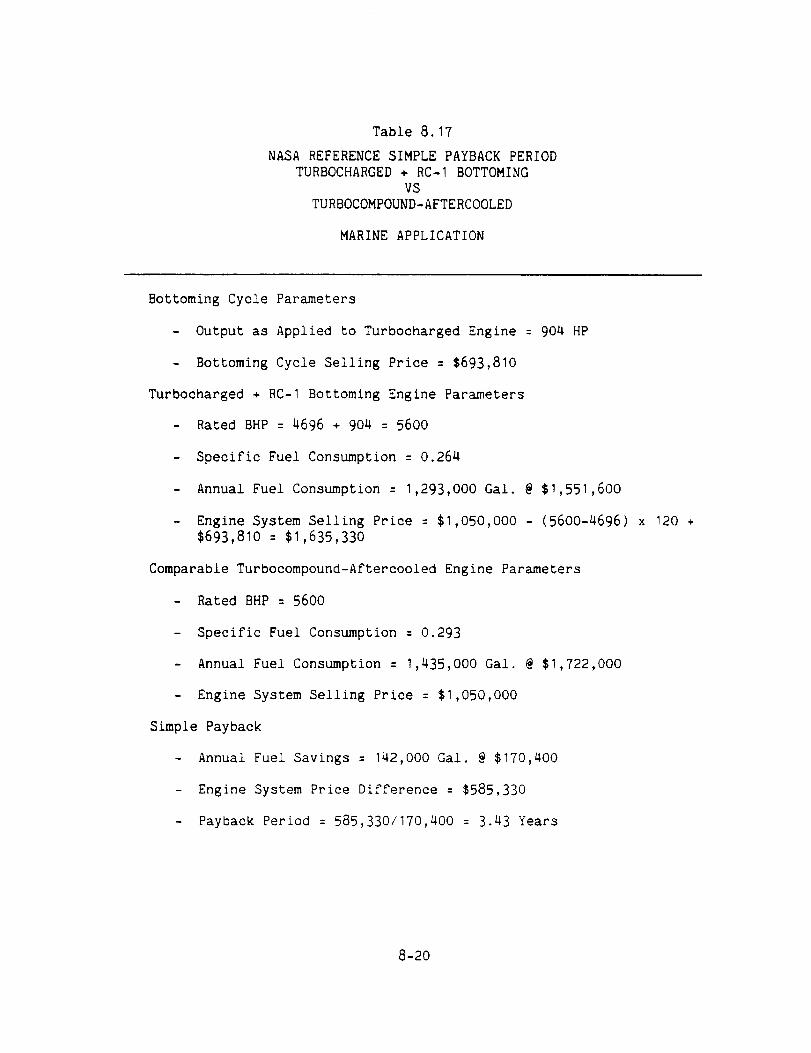
Table 8.17
NASAREFERENCESIMPLEPAYBACKPERIODTURBOCHARGED+ RC-I BOTTOMING
VSTURBOCOMPOUND-AFTERCOOLED
MARINEAPPLICATION
Bottoming Cycle Parameters
- Output as Applied to Turbocharged Engine = 904 HP
- Bottoming Cycle Selling Price = $693,810
Turbocharged + RC-I Bottoming Engine Parameters
- Rated BHP= 4696 + 904 = 5600
- Specific Fuel Consumption = 0.264
- Annual Fuel Consumption = 1,293,000 Gal. @$1,551,600
- Engine System Selling Price = $1,050,000 - (5600-4696) x 120 ÷$693,810 = $1,635,330
ComparableTurbocompound-Aftercooled Engine Parameters
- Rated BHP= 5600
- Specific Fuel Consumption = 0.293
- Annual Fuel Consumption = 1,435,000 Gal. @$1,722,000
- Engine System Selling Price = $1,050,000
Simple Payback
- Annual Fuel Savings = 142,000 Gal. @$170,400
- Engine System Price Difference = $585,330
- Payback Period = 585,330/170,400 = 3.43 Years
8-20

Table 8.18
NASAREFERENCESIMPLEPAYBACKPERIODTURBOCHARGED÷ STEAMINJECTION
VSTURBOCOMPOUND-AFTERCOOLED
MARINEAPPLICATION
Bottoming Cycle Parameters
- Output as Applied to Turbocharged Engine = 962 HP
- Bottoming Cycle Selling Price = $697,038
Turbocharged + Steam Injection Engine Parameters
- Rated BHP= 4638 ÷ 962 = 5600
- Specific Fuel Consumption = O.261
- Annual Fuel Consumption = 1,279,0OOGal. @$1,534,800
- Engine System Selling Price = $1,050,000 - (5600-4638) x 120 ÷$697,038 = $1,631,598
ComparableTurbocompound-Aftercooled Engine Parameters
- Rated BHP= 5600
- Specific Fuel Consumption = 0.293
- Annual Fuel Consumption = 1,435,000 Gal. @$1,722,0OO
- Engine SystemSelling Price = $1,050,0OO
Simple Payback
- Annual Fuel Savings = 156,O00Gal. @$187,2OO
- Engine System Price Difference = $581,598
- Payback Period = 581,598/187,200 = 3.11 Years
8-21
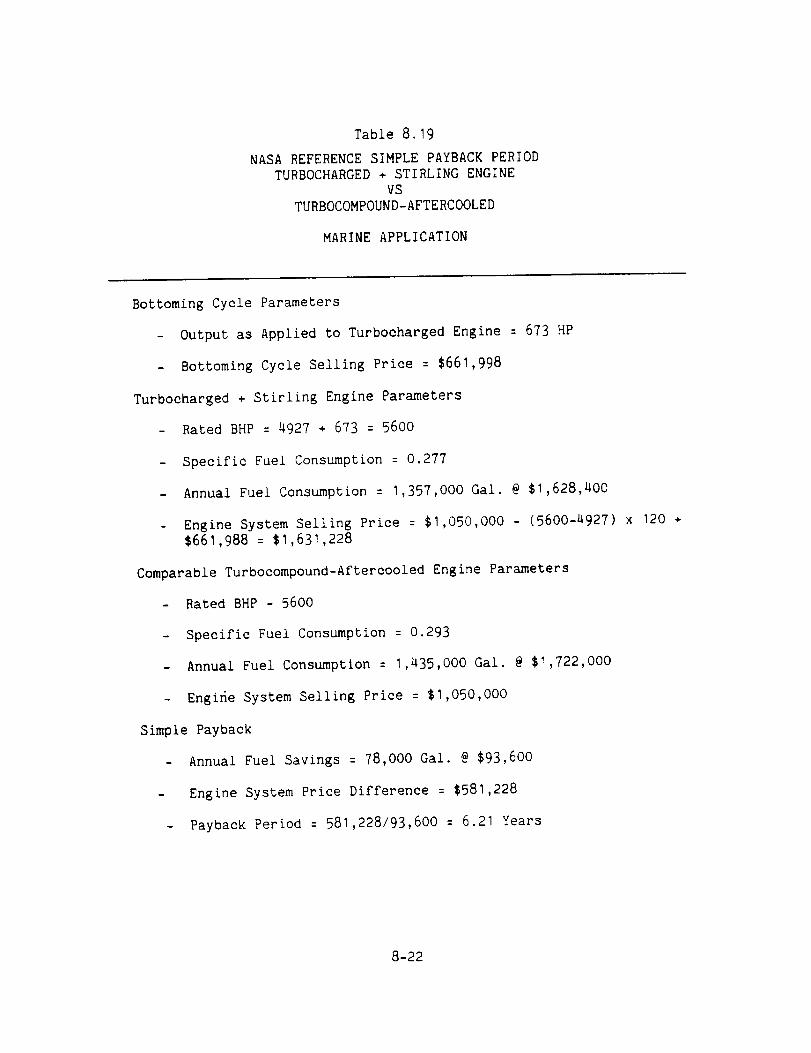
Table 8.19
NASAREFERENCESIMPLEPAYBACKPERIODTURBOCHARGED÷ STIRLINGENGINE
VSTURBOCOMPOUND-AFTERCOOLED
MARINEAPPLICATION
Bottoming Cycle Parameters
- Output as Applied to Turbocharged Engine = 673 HP
- Bottoming Cycle Selling Price = $661,998
Turbocharged + Stirling Engine Parameters
- Rated BHP= 4927 + 673 = 5600
- Specific Fuel Consumption = 0.277
- Annual Fuel Consumption = 1,357,0OOGal. @$1,628,4OO
- Engine System Selling Price = $1,050,OOO- (5600-2927) x 120 +$661,988 = $1,631,228
ComparableTurbocompound-Aftercooled Engine Parameters
- Rated BHP- 5600
- Specific Fuel Consumption = 0.293
- Annual Fuel Consumption = 1,435,0OOGal. @$1,722,0OO
- Engine System Selling Price = $1,050,0OO
Simple Payback
- Annual Fuel Savings = 78,OOOGal. @$93,600
- Engine System Price Difference = $581,228
- Payback Period = 581,228/93,6OO= 6.21 Years
8-22

Table 8.20
SUMMARYOFSIMPLEPAYBACKPERIOD(YRS)
Bottoming Cycle
Application RC-I
4.43
I .22
3.48
Truck
Locomotive
Marine
Steam Injection
7.58
I .45
3.11
Stirling Engine
15.4
2.65
6.21
8-23

and marine applications, the reference adiabatic turbocompound-aftercooled diesel engine performance is assumed. For both the
locomotive and marine application, the payback period calculations are
based on reference engines of comparable size (3600 hp - locomotive and5600 hp - marine) to the study case. The price for both the locomotive
and marine diesel turbocompound-aftercooled reference engine was
estimated by using a 120 $/hp factor to adjust the price data given in
References 2 and 4 respectively. The 120 $/hp factor was derived by
assuming that the incremental hp-factor for the larger engines would be
proportional to that given for the heavy duty truck (Reference I). Inall cases, the price and size of the comparison "Turbocompound-
Aftercooled" engine was adjusted to that of the turbocharged engine with
its bottoming cycle. Note that for the locomotive engines, the cost of$675,000 for the base case 3600 hp engine was derived from the cost
breakdowngiven in Reference 2 and adjusted for mid 1984 dollars. The
cost of the 5600 hp marine engine was based on the same$/hp as for thelocomotive.
Table 8.20 shows a separate summaryof the calculated payback
periods for the nine different cases based on the annual duty and fuelcost assumptions listed previously in Table 8.10.
Based on the simple payback period calculations, the RC-Isubposed heat recovery cycle appears as the most attractive of the three
options for both the truck and locomotive applications while the steam
injection cycle shows the lowest payback for the marine application. Inthis study, the Stirling engine system showedpoorest economics. For
this case, the engine and system drive appeared to be a major costconsideration. The fluid bed costs were relatively low because this
cycle does not utilize any finned tubed, inbed convective section.
Although the RC-I system in the truck application shows a lower
payback period than the other two cycle options, the 4.43 Fears calcu-
lated does not represent a particularly attractive time period. This
calculated simple payback period exceeds the payback target identified
8-24
in Reference 3 and would be even further extended if maintenance costsand costs of moneywere included.
_diaba_!c C,esei heat recovery appears most attractive for the
locomoti/e application. For this case, payback periods ranging from
1.22 to 2.65 years were ca!cuiated for the three different cycleoptions. Again for the simple payback period calculation, the RC-Icycie snowed lowest time period. Based on these results continued
consideration of efficient and cost effective heat recovery for thediesel locomotive appears warranted.
For the marine application, the subposed cycle heat recoverysystems showedpayback periods ranging from 3.48 to 6.21 years. In this
appiication, the steam injection cycle showedthe lowest payback
periods, a resui= of the slightly better system performance (than the
RC-I) and application wit_ high annual fuel costs. The calculatedpayback periods maybe marginal as an incentive for investment
particularly considering the maintenance costs and cost of money havenot been included,
8-25

9. REFERENCES
I o
.
.
°
o
,
o
.
.
10.
11.
DiNanno, L., F. DiBella and M. Koplow, "An RC-I Organic Rankine
Bottoming Cycle for an Adiabatic Diesel Engine," DOE/NASA/0302-1,
NASA CR-168256, TE4322-251-83, December 1983.
Bailey, M. M., "Overview of Waste Heat Utilization Systems,"
DOE/NASA/50194-41 NASA TM 86901, paper presented 22nd Automotive
Technology Development Contractors' Coordination Meeting, Dearborn,
Michigan, October 29-November I, 1984.
Liddle, S. G., et al., "Future Fuels and Engines for Railroad
Locomotives," JPL Publication 81-101, November, 1981.
"For the Study of the Validation of the Application of Rankine
Bottoming Cycle Technology to Marine Diesel Engines," Final Report,
DOE Contract No. DE-ACOI-78C554224, AED-EO-17, July 1980.
Klaren, D. G., Fluid Bed Heat Exchanger: A Major Improvement In
Severe Fouling Heat Transfer, Proceedings of a Seminar, "HeatExchangers", 885, 1983.
U.S. Department of Energy, Idaho Operations Office, EnergyConservation Branch, Background Information for Advanced Heat
Exchanger Notice of Program Interest, NOPI No. DE-NPO7-83ID 12482,Aug. 1983.
Parkinson, G., Ceramics Make a Try for Tough Heat-recovery Jobs,Chemical Engineering, 61, April, 1982.
Cole, W. E., Investigation of Waste Heat Recovery Utilizing
Fluidized Bed Heat Exchangers, United Technologies Reasearch CenterFinal Report, Report R78-912942, Nov. 1978.
Stoeffler, R° C., Enhancement of Heat Transfer in Waste-heat Heat
Exchangers, United Technologies Research Center Final Report, July1980, DOE/ET/I1348-T1.
Rudnicki, M. I., C. S. Mah, and H. W. Williams, Status of Fluidized-
Bed Waste Heat Recovery, Proceedings of a Seminar, "HeatExchangers", 549, 1983
Cox, D., M. Lytton, and C. Rao, Potential Industrial Applications
for Fluidized-Bed Waste Heat Recovery Systems.
9-I
12.
13.
14.
15.
16.
17.
18.
19.
20.
21.
The Econo-Therm Hot-Blast System, The Econo-Therm Corporation,Englewood, N.J.
Ikeda, S., S. Ito and T. Someya, An Experimental Marine FluidizedBed Boiler Plant, Power, 15, Oct., 1983o
Virr, M. J., Fluidized Bed Heat Recovery Systems, Chapter 11 in
Fluidized Beds, Combustion and Applications, J. R. Howard, editor,
Applied Science Pub., New York, 1983.
Carlomagno, G. M., et al, Heat Recovery From Diesel Exhausts ByMeans Of A Fluidized Bed Heat Exchanger, paper presented at the 75th
Annual AIChE Meeting, Los Angeles, California, November, 1982.
Campanile, A°, et al, United States Patent Number 4,340,400, July,1982.
H. E. Khalifa, "Waste Heat Recovery from Adiabatic Diesel Engines byExhaust-Driven Brayton Cycles," United Technologies Research Center,
East Hartford, CT, NASA CR-168257 Dec. 1983, (DOE/NASA/0304-1,1983).
"Cogeneration Technology Alternatives Study (CTAS)" DOE/NASA/O031-
80/I, NASA CR°159765, Prepared by General Electric Co. for NASA/DOE,Jan. 1980.
Martini, W. R., "Stirling Engine Design Manual," 2nd ed.
DOE/NASA/3194-1, NASA CR-168088, January 1983.
"Automotive Stirling Engine MOD 1 Design Review Report," Vol. I, II
and Ill, DOE/NASA/O032-16, NASA CR-167935, prepared by MTI forDOE/NASA, August 1982.
"Stirling Engine Design Manual," Second Edition DOE/NASA/3194-1,NASA CR-168088, January 1983.
9-2
APPENDIX A
FLUID BED HEAT RECOVERY UNIT DESIGN PROCEDURE


NOMENCLATUREAPPENDIXA
Design Characteristics
A: area;subscripts: none = outer tube surface; b = vessel cross-section;
surface; f = ratio of fin area per unit bare tubearea
d: diameter;
subscripts: none = particle; b = bubble; mx = maximum; m =
minimum; t = outer tube; ti = inner tube; or =
orifice; v = vessel; bo = initial bubble at base ofbed
L: length:
subscripts:a : above the tube bundle to the top of the bed
surface; u = under tube bundle to the distributor;
b = bed height; f = fin height; fb = freeboard
height; j = jet length; tdh = transport disengaging
height; v = vessel height; p = inlet plenum height;I = vessel length; w = vessel width, in the
direction of the horizontal tubes; z = plenum outlet
to top of freeboard bundle; sp = splash zone height;tube length
N: number:
subscripts:
n: number:
subscripts:
t = tubes; r = tube runs per tube; 1 = tube layers
or columns; or = orifices per unit area; s = number
of tubes per column with tubes on vertical plane
none = ratio of numbers Nt to N1; r = number of coilrotations on a plane
Q: the heat load on each stage
S:
t:
pitch:
subscripts:
thickness:
subscripts:
h = horizontal tube; v = vertical tube; or =
orifice; w = tube to vessel wail; f = fins
f = fin; t = tube wail; w = vessel wall; d =
deposit; dis = distributor; in = insulation; c =corrosion allowance
Ed: free area fraction on the distributor
¥: ratio of vessel length to width
A-i
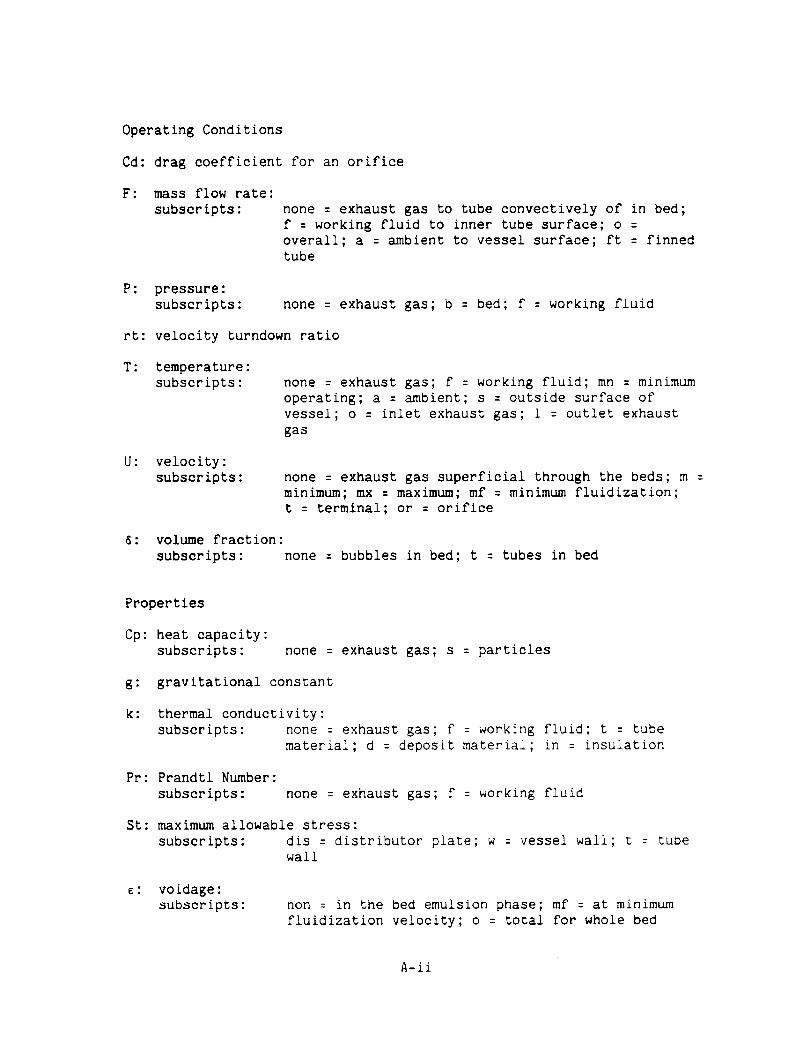
Operating Conditions
Cd: drag coefficient for an orifice
F: mass flow rate:subscripts: none = exhaust gas to tube convectively of in bed;
f = working fluid to inner tube surface; o =overall; a = ambient to vessel surface; ft = finnedtube
P: pressure:subscripts: none = exhaust gas; b = bed; f = working fluid
rt: velocity turndown ratio
T: temperature:subscripts: none = exhaust gas; f = working fluid; mn = minimum
operating; a = ambient; s = outside surface ofvessel; o = inlet exhaust gas; 1 = outlet exhaustgas
U: velocity:subscripts: none = exhaust gas superficial through the beds; m =
minimum; mx = maximum;mf = minimumfluidization;t = terminal; or = orifice
_: volume fraction:subscripts: none = bubbles in bed; t = tubes in bed
Properties
Cp: heat capacity:subscripts: none = exhaust gas; s = particles
g: gravitational constant
k: thermal conductivity:subscripts: none = exhaust gas; f = working fluid; t = tube
material; d = deposit material; in = insulation
Pr: Prandtl Number:subscripts: none = exhaust gas; f = working fluid
St: maximumallowable stress:subscripts: dis = distributor plate; w = vessel wall; t = tube
wall
E: voidage:subscripts: non = in the bed emulsion phase; mf = at minimum
fluidization velocity; o = total for whole bed
A-ii

density •subscripts : none = exhaust gas; f = working fluid; p = particle;
m = at minimumoperation temperature
viscosity:subscripts: none = exhaust gas; f = working fluid
_: particle sphericity
A-iii

APPENDIXA
FLUIDBEDHEATRECOVERYUNIT DESIGNPROCEDURE
The fluid bed heat recovery unit is designed following the
procedure outlined below. The description of the design procedure givenrepresents the major design equations and design philosophy applied.Pertinent references from the general literature are also listed. The
calculational steps are presented in the order in which they areperformed and points of iteration are noted.
The input conditions to the design are the diesel exhaust
conditions (flow rate, temperature, pressure, composition, physical and
thermodynamicproperties) and the working fluid conditions(flow rate,inlet and outlet temperatures, pressure, physical and thermodynamic
properties). The heat recovery unit stage conditions(bed temperatures
and convective section temperatures) are selected to provide the desiredh£at recovery unit effectiveness using an overall energy balance. The
log-mean temperature difference and heat transfer duty on each stage ofthe unit are determined.
A) VELOCITYSELECTION
The fluidization velocity on the first stage of the unit, U(1),(the high-temperature stage, having the highest velocity of all the unitstages) is selected to yield a reasonable unit cross-sectional area.
This velocity may be modified if the resulting overall design is
unacceptable. The fluidization velocity on each of the other fluid bedstages is determined from this by
U(i) = U(1) 0(I) / D(i)(I)
A-I

The minimumoperating velocity on each fluid bed stage is determinedusing the unit turndown ratio
to yield
rt = Fm/ F (_(I) / Om(1) ) (2)
Um(i) : U(i) r t (3)
B) PARTICLE SIZE DETERMINATION
The initial selection in this step is for the particle material.
The material must be physically and chemically stable in the exhaust gas
environment and should be commercially available in suitable particle
sizes having sufficient fluid bed attrition resistance. The particle
density, rp, and the particle average sphericity, _, should be estimated
for input into the design procedure. Iteration of the design procedure
with respect to the particle material may be required inorder to achieve
an acceptable design. In general, the same particle material would be
specified on all of the stages.
The maximum-average particle diameter (using the surface-to-
volume average) on each fluid bed stage is determined, using the Ergun
equation (I)* to maintain the minimum fluidization velocity 0.5 ft/s
below the minimum operating velocity, Um:
dmx(i) :
2 2 2 3 I/2
[B+(B+600 (pp g (1-E)u(i) (Um(i)-O.5))/(r(i) _ _ } ]/(20p
(4)
g/o(i))
where B = 1.75 (Um(i)-0.5) 2 /(_ _3)
*Numbers in paraenthesis refer to References listed at the end of
Appendix A.
A-2
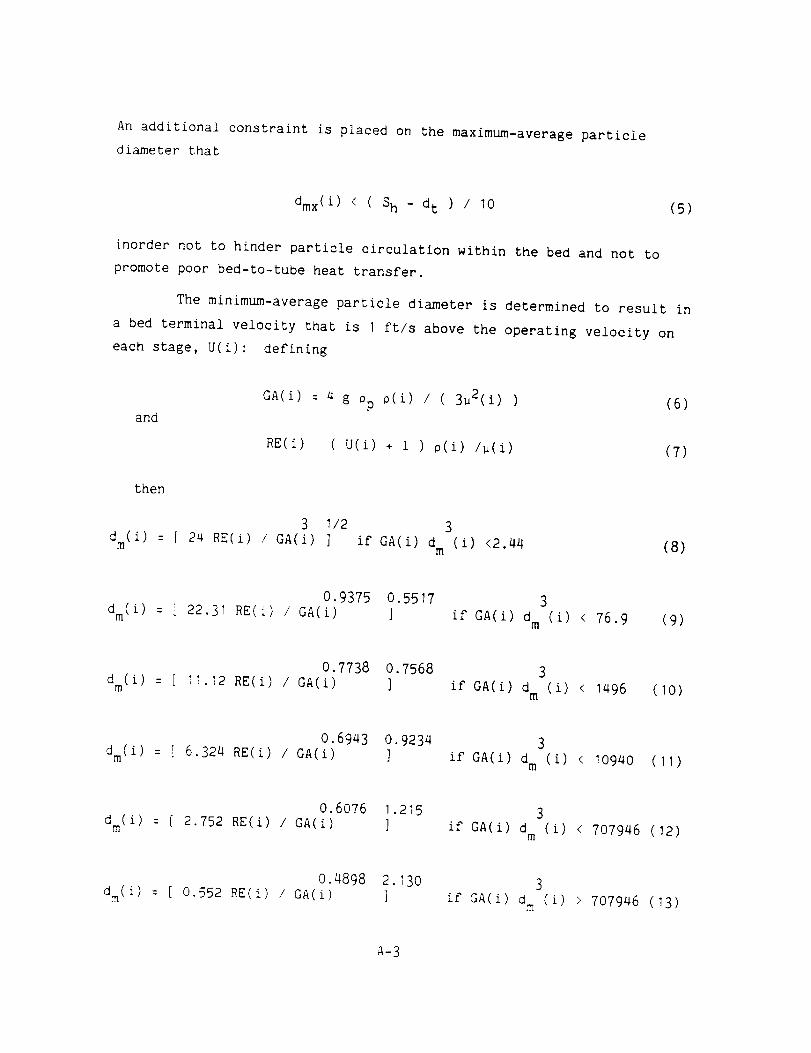
An additional constraint is placed on the maximum-average particle
diameter that
dmx(i) < Sh - dt ) / 10 (5)
inorder not to hinder particle clrculation within the bed and not to
promote poor bed-to-tube heat transfer.
The minimum-average particle diameter is determined to result in
a bed terminal velocity that is I ft/s above the operating velocity on
each stage, U(i): defining
andGA(i) = 4 g _p _(i) / (3u2(i) ) (6)
RE(i) (U(i) + i ) p(i) /u(i) (7)
then
3 I/2
dm(i) : f 24 RE(i) / GA(i) ]3
if GA(i) dm (i) <2.44 (8)
0.9375 O.5517
dm(i) : [ 22.31 RE(i) / GA(i) ]3
if GA(i) dm (i) < 76.9 (9)
0.7738 0.7568
d (i) : [ 11.12 RE(i) / GA(i) ]m
3
if GA(i) dm (i) < 1496 (10)
0.6943 0.9234
dm(i) : [ 6.324 RE(i) / GA(i) ]3
if GA(i) dm (i) < 10940 (11)
0.6076 1.215
d (i) : [ 2 752 RE(i) / GA(i) ]m
3
if GA(i) d (i) < 707946 (12)m
0.4898 2.130
dm(i) : [ 0.552 RE(i) / GA(i) ]3
if GA(i) dm (i) > 707946 (13)
A-3
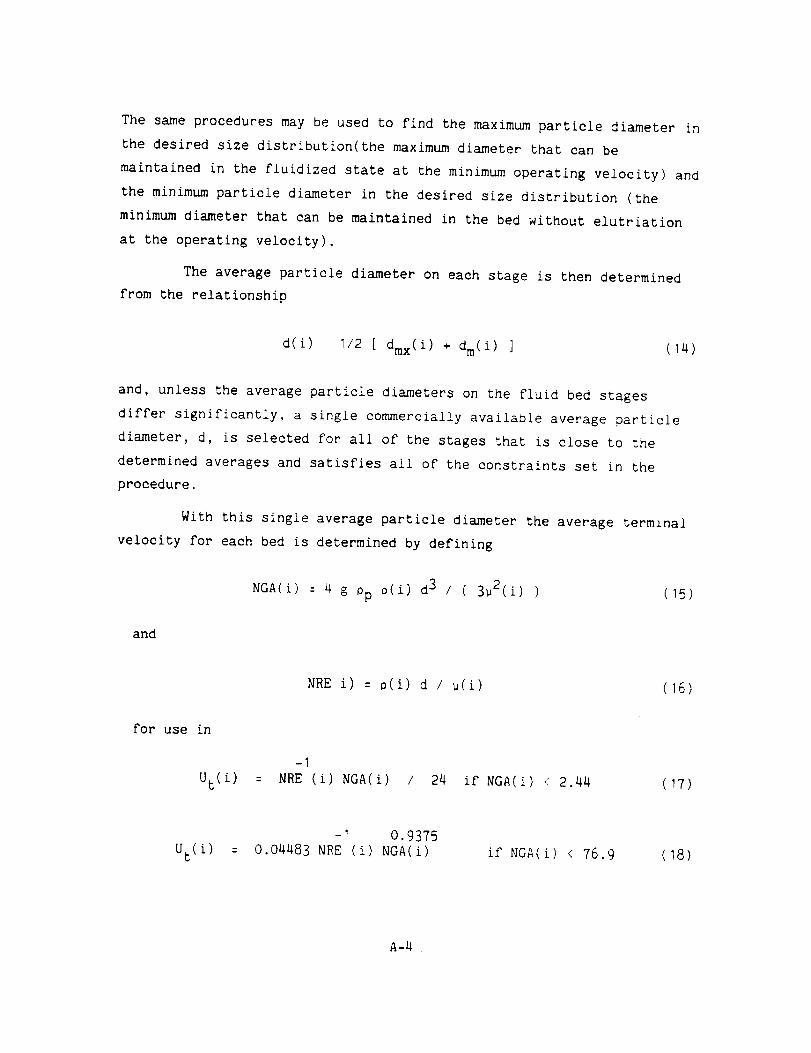
The same procedures may be used to find the maximum particle diameter in
the desired size distribution(the maximum diameter that can be
maintained in the fluidized state at the minimum operating velocity and
the minimum particle diameter in the desired size distribution (the
minimum diameter that can be maintained in the bed without elutriation
at the operating velocity).
The average particle diameter on each stage is then determined
from the relationship
d(i) I/2 [ dmx(i ) ÷ dm(i ) ] (14
and, unless the average particle diameters on the fluid bed stages
differ significantly, a single commercially available average particle
diameter, d, is selected for all of the stages that is close to the
determined averages and satisfies all of the constraints set in the
procedure.
With this single average particle diameter the average terminal
velocity for each bed is determined by defining
NGA(i) : 4 g Op o(i) d 3 / (3_2(i) ) (15
and
for use in
NRE i) = 0(i) d / u(i)
-I
Ut(i) : NRE (i) NGA(i) / 24 if NGA(i) < 2.44
16
17)
-I 0.9375
Ut(i) = 0.04483 NRE (i) NGA(i if NGA(i) < 76.9 18)
A-4
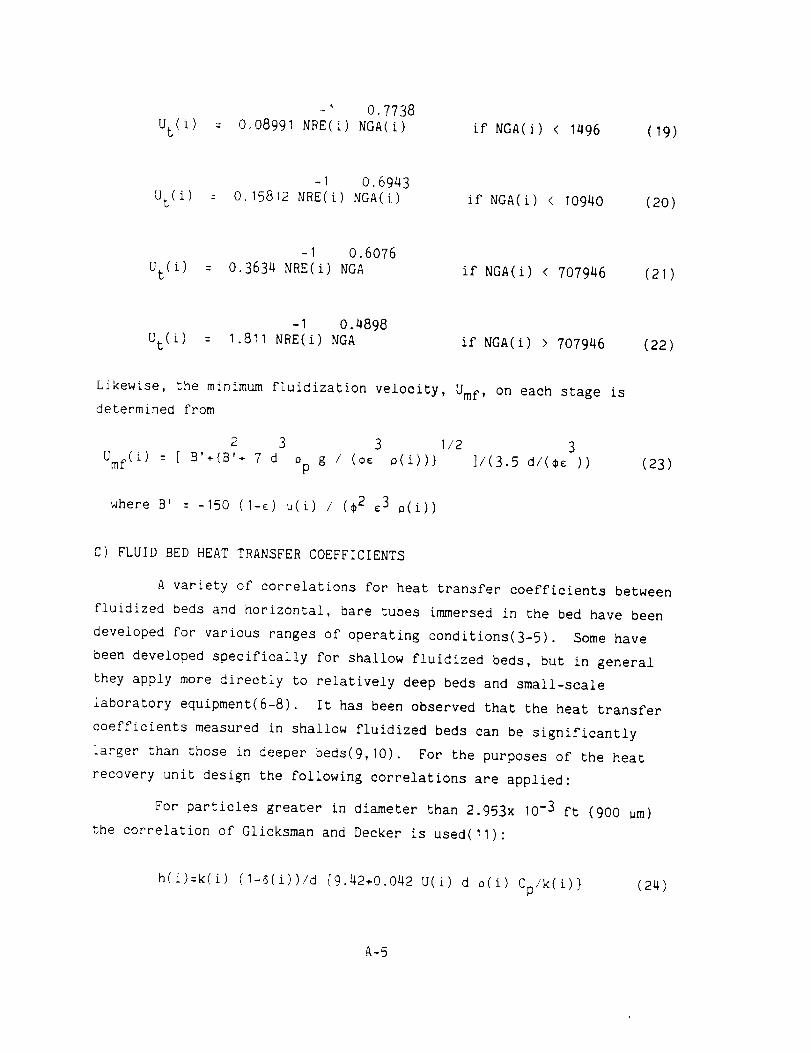
-I 0.7738Ut(i) : 0.08991NRE(i) NGA(i) if NGA(i) < 1496 (19)
-I 0.6943Ut(i) = 0.15812 NRE(i) NGA(i) if NGA(i) < 10940 (20)
-I 0.6076Ut(i) : 0.3634 NRE(i) NGA if NGA(i) < 707946 (21)
-I 0.4898Ut i) = 1.811NRE(i) NGA if NGA(i) > 707946 (22)
Likewise, the minimumfluidization velocity, Umf, on each stage isdetermined from
2 3 3 1/2 3
Umf(i) = [ B'+{B'+ 7 d Op g I (_ _(i))} ]/(3,5 d/(¢_ )) (23)
where B' = -150 (I-_) u(i) / (¢2 e3 s(i))
C) FLUID BED HEAT TRANSFER COEFFICIENTS
A variety of correlations for heat transfer coefficients between
fluidized beds and horizontal, bare tubes immersed in the bed have been
developed for various ranges of operating conditions(3-5). Some have
been developed specifically for shallow fluidized beds, but in general
they apply more directly to relatively deep beds and small-scale
laboratory equipment(6-8). It has been observed that the heat transfer
coefficients measured in shallow fluidized beds can be significantly
larger than those in deeper beds(9,10). For the purposes of the heat
recovery unit design the following correlations are applied:
For particles greater in diameter than 2.953x 10⁻³ ft (900 um)
the correlation of Glicksman and Decker is used(11):
h(i)=k(i) (1-6(i))/d [9.42+0.O_2 U(i) d s(i) Cp/k(i)} (24)
A-5
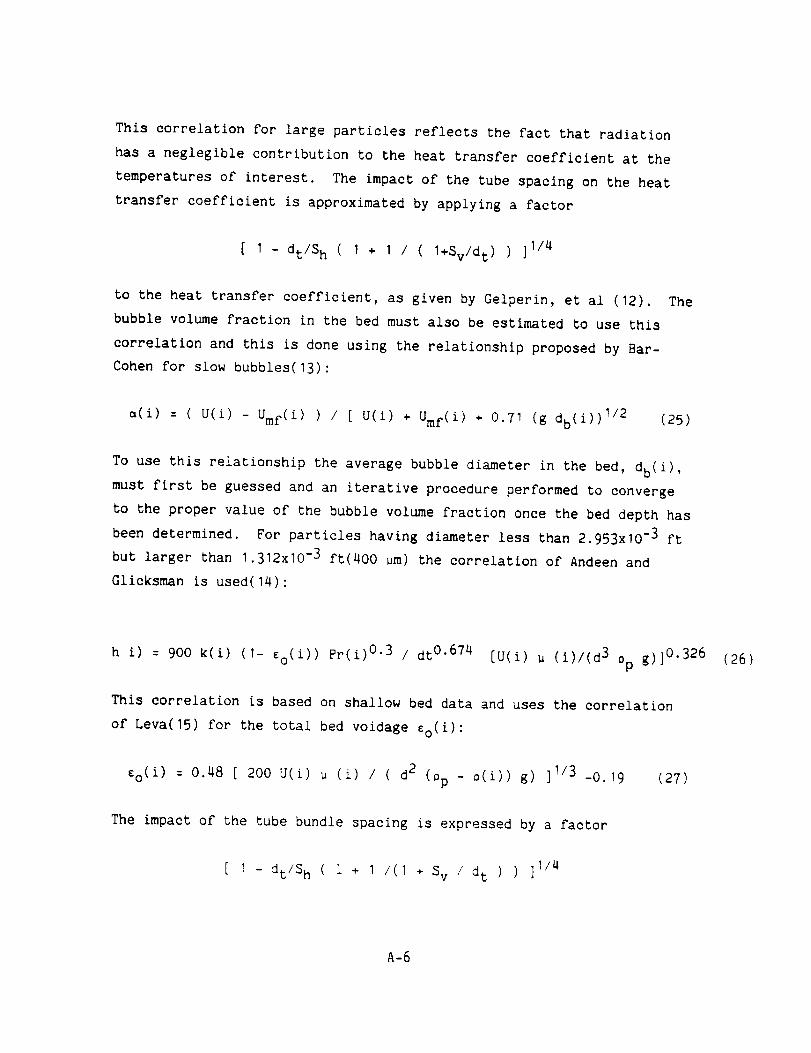
This correlation for large particles reflects the fact that radiation
has a neglegible contribution to the heat transfer coefficient at the
temperatures of interest. The impact of the tube spacing on the heat
transfer coefficient is approximated by applying a factor
[ I - dt/S h ( I + I / (1+Sv/dt) ) ]I/4
to the heat transfer coefficient, as given by Gelperin, et al (12).
bubble volume fraction in the bed must also be estimated to use this
correlation and this is done using the relationship proposed by Bar-
Cohen for slow bubbles(13):
The
a(i) = (U(i) - Umf(i ) ) / [ U(i) + Umf(i) ÷ 0.71 (g db(i))I/2 (25)
To use this relationship the average bubble diameter in the bed, db(i) ,
must first be guessed and an iterative procedure performed to converge
to the proper value of the bubble volume fraction once the bed depth has
been determined. For particles having diameter less than 2.953xi0 -3 ft
but larger than 1.312xi0 -3 ft(400 um) the correlation of Andeen and
Glicksman is used(14):
h i) = 900 k(i) (I- ¢o(i)) Pr(i) 0.3 / dt 0.674 [U(i) u (i)/(d 3 0p g)]0.326
This correlation is based on shallow bed data and uses the correlation
of Leva(15) for the total bed voidage %(i):
%(i) = 0.48 [ 200 U(i) _ (i) / ( d2 (0p - s(i)) g) ]I/3 -0.19 (27)
The impact of the tube bundle spacing is expressed by a factor
[ I - dt/S h ( i + I /(I + Sv / dt ) ) ]I/4
(26)
A-6
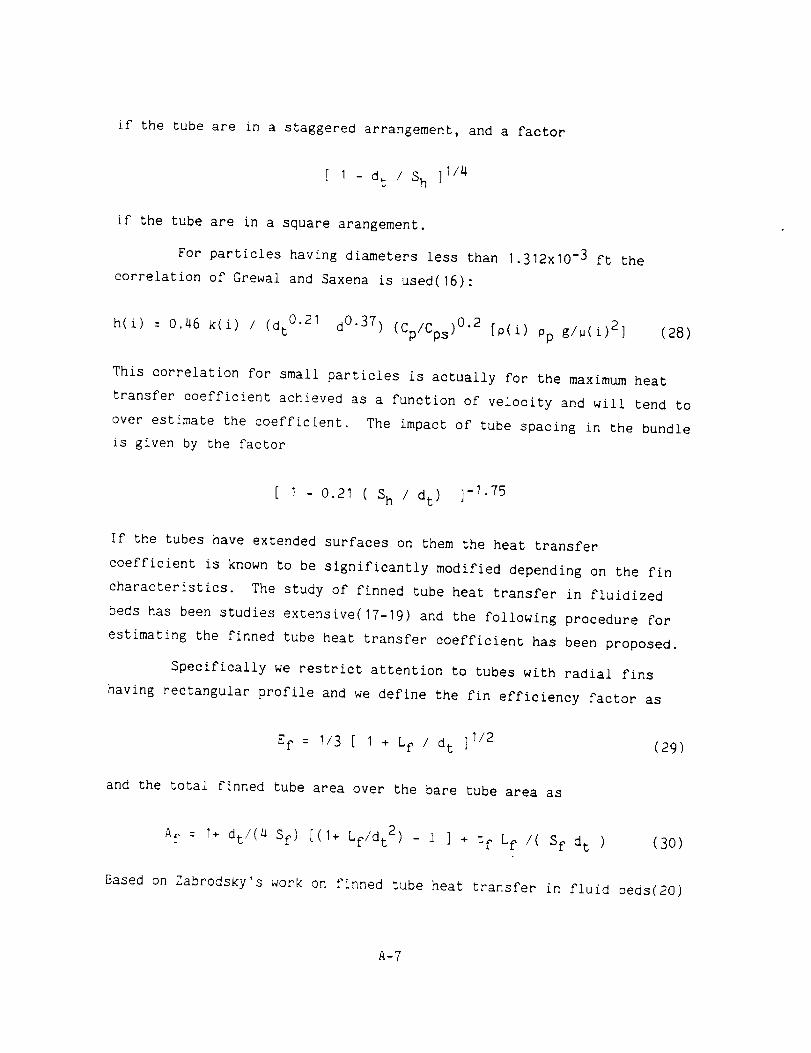
if the tube are in a staggered arrangement, and a factor
[ I - dt / Sh ]I/4
if the tube are in a square arangement.
For particles having diameters less than 1.312xi0-3 ft the
correlation of Grewal and Saxena is used(16):
h(i) = 0.46 k(i) / (dt 0"21 d0"37) (Cp/Cps)0"2 [_(i) _p g/u(i) 2] (28)
This correlation for small particles is actually for the maximum heat
transfer coefficient achieved as a function of velocity and will tend to
over estimate the coefficient. The impact of tube spacing in the bundle
is given by the factor
[ I - 0.21 ( Sh / dt) ]-1.75
If the tubes have extended surfaces on them the heat transfer
coefficient is known to be significantly modified depending on the fin
characteristics. The study of finned tube heat transfer in fluidized
beds has been studies extensive(17-19) and the following procedure for
estimating the finned tube heat transfer coefficient has been proposed.
Specifically we restrict attention to tubes with radial fins
having rectangular profile and we define the fin efficiency factor as
Ef = I/3 [ I + Lf / dt ]I/2 (29)
and the total finned tube area over the bare tube area as
Af : I+ dt/(4 Sf) [(I+ Lf/dt 2) - i ] + tf Lf /( Sf dt ) (30)
Based on Zabrodsky's work on finned tube heat transfer in fluid beds(20)
A-7
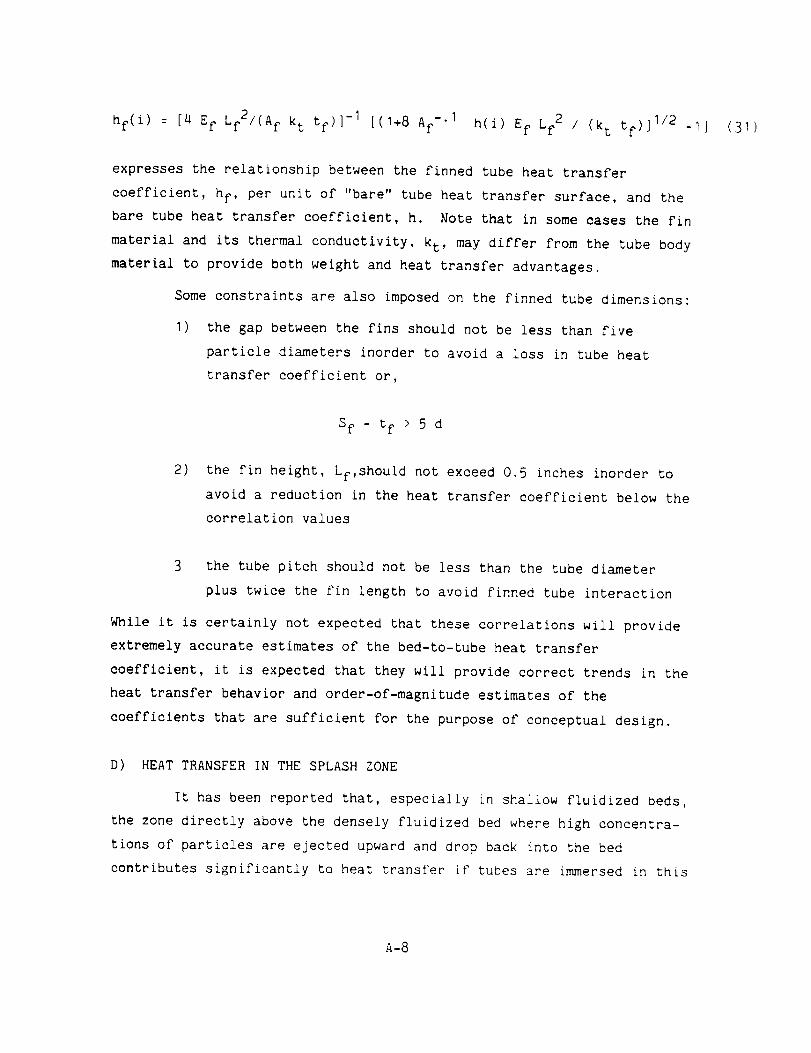
hf(i) : [2 Ef Lf2/(Af k t tf)] -1 [(1+8 Af -'1 h(i) Ef Lf 2 / (k t tf)] 1/2 -t]
expresses the relationship between the finned tube heat transfer
coefficient, hf, per unit of "bare" tube heat transfer surface, and the
bare tube heat transfer coefficient, h. Note that in some cases the fin
material and its thermal conductivity, kt, may differ from the tube body
material to provide both weight and heat transfer advantages.
Some constraints are also imposed on the finned tube dimensions:
I) the gap between the fins should not be less than five
particle diameters inorder to avoid a loss in tube heat
transfer coefficient or,
(31)
2)
Sf - tf > 5 d
the fin height, Lf,should not exceed 0.5 inches inorder to
avoid a reduction in the heat transfer coefficient below the
correlation values
3 the tube pitch should not be less than the tube diameter
plus twice the fin length to avoid finned tube interaction
While it is certainly not expected that these correlations will provide
extremely accurate estimates of the bed-to-tube heat transfer
coefficient, it is expected that they will provide correct trends in the
heat transfer behavior and order-of-magnitude estimates of the
coefficients that are sufficient for the purpose of conceptual design.
D) HEAT TRANSFER IN THE SPLASH ZONE
It has been reported that, especially in shallow fluidized beds,
the zone directly above the densely fluidized bed where high concentra-
tions of particles are ejected upward and drop back into the bed
contributes significantly to heat transfer if tubes are immersed in this
A-8
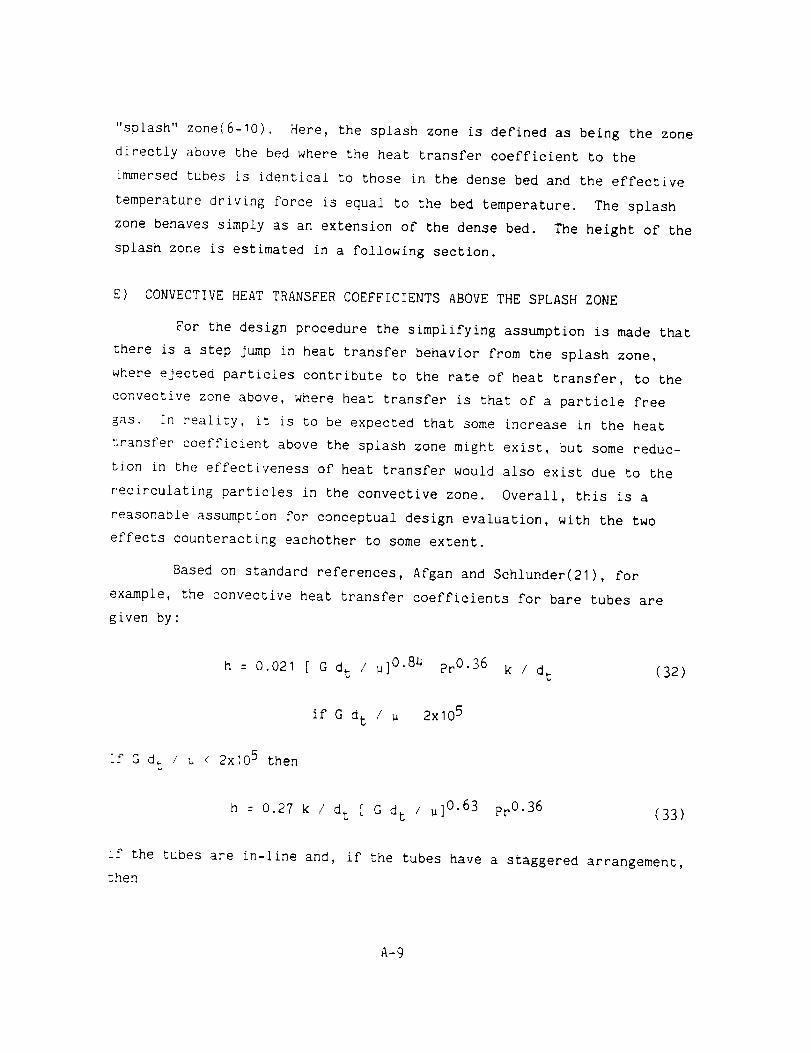
"splash" zone(6-10). Here, the splash zone is defined as being the zone
directly above the bed where the heat transfer coefficient to the
immersed tubes is identical to those in the dense bed and the effective
temperature driving force is equal to the bed temperature. The splash
zone behaves simply as an extension of the dense bed. The height of the
splash zone is estimated in a following section.
E) CONVECTIVE HEAT TRANSFER COEFFICIENTS ABOVE THE SPLASH ZONE
For the design procedure the simplifying assumption is made that
there is a step jump in heat transfer behavior from the splash zone,
where ejected particles contribute to the rate of heat transfer, to the
convective zone above, where heat transfer is that of a particle free
gas. In reality, _t is to be expected that some increase in the heat
transfer coefficient above the splash zone might exist, but some reduc-
tion in the effectiveness of heat transfer would also exist due to the
recirculating particles in the convective zone. Overall, this is a
reasonable assumption for conceptual design evaluation, with the two
effects counteracting eachother to some extent.
Based on standard references, Afgan and Schlunder(21 , for
example, the convective heat transfer coefficients for bare tubes are
given by:
h : O.021 [ G d t / u] O'84
If G d t / u < 2xi05 then
prO.36
if G d t / u 2xi05
k / d t (32)
h = 0.27 k / d t [ G d t / u] O'63 prO-36 (33)
if the tubes are in-line and, if the tubes have a staggered arrangement,
then
A-9

h = 0.35 k / d t [ 4 Sv / Sh )0,2
if Sh / Sv > 2
h = 0.40 k / d t [ G d t / u ]0.2
if Sh / Sv < 2.
[ G d t i _ ]0.6 prO.36 (34)
prO.36 35)
If finned tubes are used in the convective zone then the two factors in
equations 29 and 30 may be used to compute the finned tube heat transfer
coefficient relative to the bare tube value, based on the bare tube
surface area:
hf = [4 Ef Lf 2 /(Afk t tf)] -I [(I+8 h Ef Lf 2 /(k t if) )I/2 -I ] 36)
This equation is restricted to radial fins of rectangular cross-section,
but other forms of fins can easily be considered by modifying t_e
factors Ef and Af.
F) TUBE INNER DIAMETER
The tube wall thickness is determined by standard methods(22):
tt : dt / [2 ( 0.8 ST t / Pf ÷ 0.4 )] + tc (37)
where the tube thickness is rounded up to the next larger standard
thickness and all tubes in the unit are assigned the same dimensions
unless they differ significantly enough to justify differing tube
dimensions in each stage. The tube inner diameter is then
dti = d t - 2 tt (38)
G) TUBE NUMBER
The heat recovery unit internal cross-sectional area Ls
Ab : F / (o(I) U(!) ) (39)
A-tO
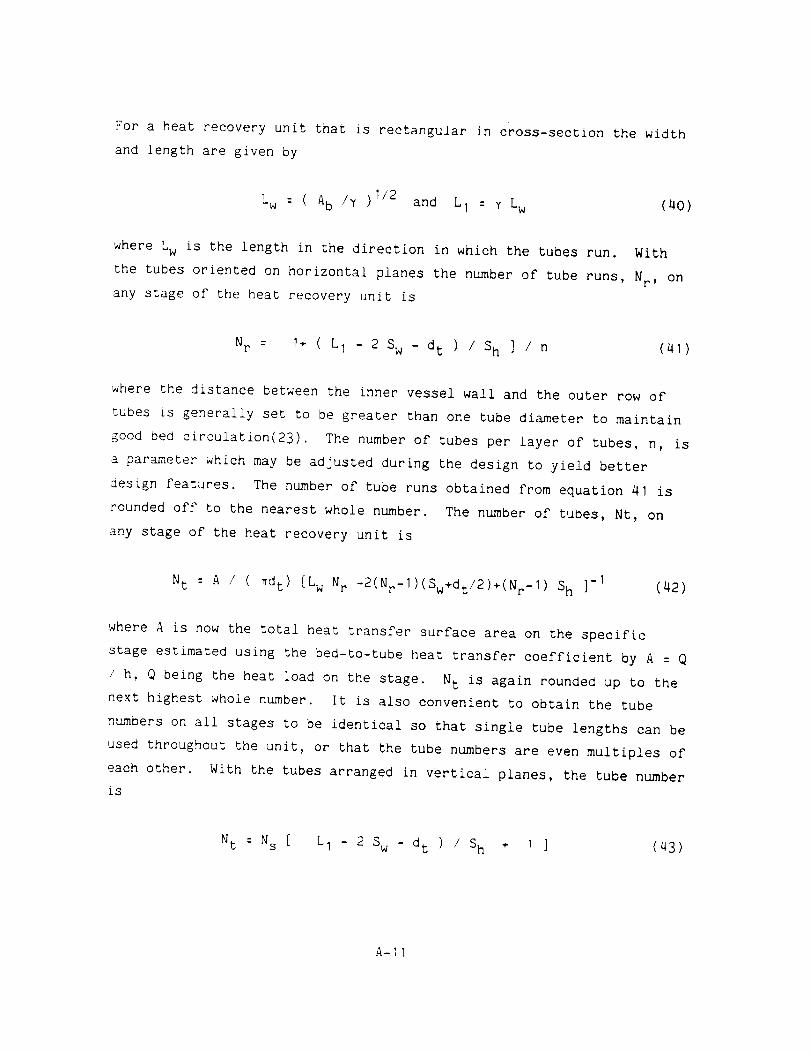
For a heat recovery unit that is rectangular in cross-section the widthand length are given by
T
_w ( Ab /7 )I/2 and LI = ¥ Lw (40)
where Lw is the length in the direction in which the tubes run. With
the tubes oriented on horizontal planes the number of tube runs, Nr, on
any stage of the heat recovery unit is
Nr = I+ ( L I - 2 Sw - d t ) / Sh ] / n (41)
where She distance between the inner vessel wall and the outer row of
tubes is generally set to be greater than one tube diameter to maintain
good bee circulation(23). The number of tubes per layer of tubes, n, is
a parameter which may be adjusted during the design to yield better
design features. The number of tube runs obtained from equation 41 is
rounded off to the nearest whole number. The number of tubes, Nt, on
any stage of the heat recovery unit is
Nt = A / (_dt) (Lw Nr _2(Nr_1)(Sw+dt/2)+(Nr_1) Sh ]-I (42)
where A is now the total heat transfer surface area on the specific
stage estimated using the bed-to-tube heat transfer coefficient by A = Q
/ h, Q being the heat load on the stage. N t is again rounded up to the
next highest whole number. It is also convenient to obtain the tube
numbers on all stages to be identical so that single tube lengths can be
used throughout the unit, or that the tube numbers are even multiples of
each other. With the tubes arranged in vertical planes, the tube number
is
N t = N s [ L I - 2 Sw dt ) / Sh ÷ I ] (43)
A-11
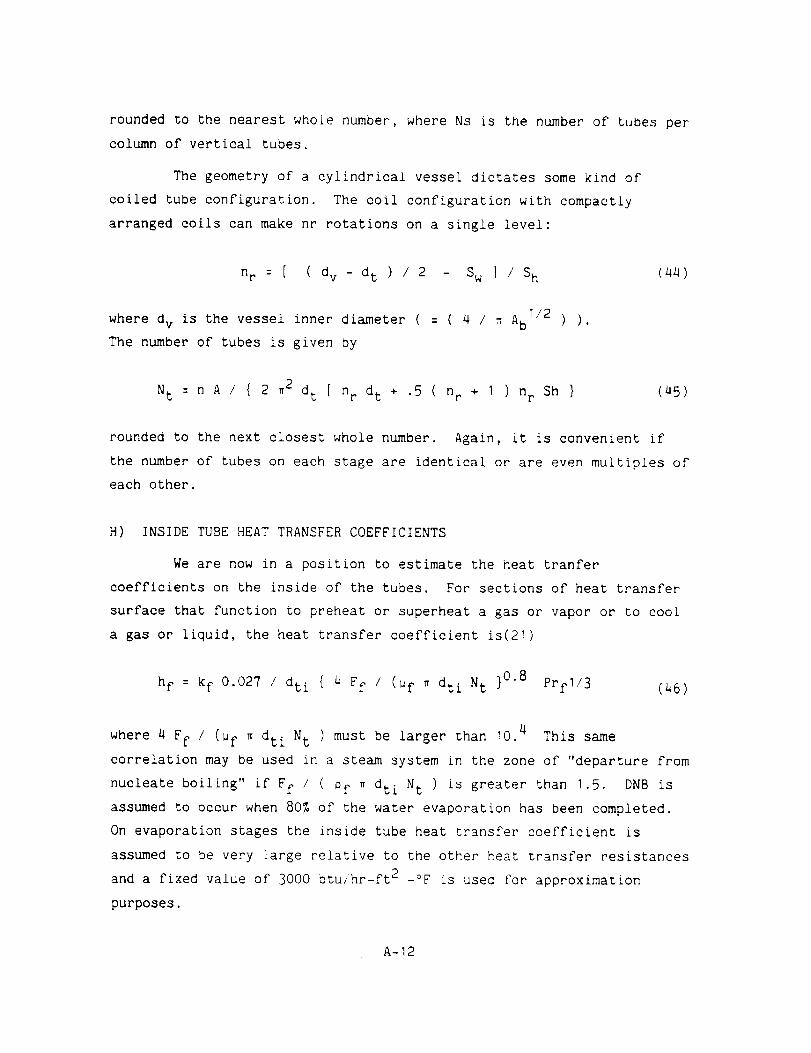
rounded to the nearest whole number, where Ns is the numberof tubes percolumn of vertical tubes,
The geometry of a cylindrical vessel dictates somekind of
coiled tube configuration. The coil configuration with compactly
arranged coils can makenr rotations on a single level:
nr = [ ( dv - dt ) / 2 - Sw ] / Sh (44)
where dv is the vessel inner diameter ( : ( 4 / _ Ab I/2 ) ).
The number of tubes is given by
N t = n A / { 2 _2 dt [ nr dt + .5 ( nr ÷ I ) n r Sh } (45)
rounded to the next closest whole number. Again, it is convenient if
the number of tubes on each stage are identical or are even multiples of
each other.
H) INSIDE TUBE HEAT TRANSFER COEFFICIENTS
We are now in a position to estimate the heat tranfer
coefficients on the inside of the tubes. For sections of heat transfer
surface that function to preheat or superheat a gas or vapor or to cool
a gas or liquid, the heat transfer coefficient is(21)
hf : kf 0.027 / dti { _ Ff / (uf _ dti N t }0.8 Prfl/3 (46)
where 4 Ff / (uf _ dti N t ) must be larger than 10. 4 This same
correlation may be used in a steam system in the zone of "departure from
nucleate boiling" if Ff / ( of _ dti N t ) is greater than 1.5. DNB is
assumed to occur when 80% of the water evaporation has been completed.
On evaporation stages the inside tube heat transfer coefficient is
assumed to be very large relative to the other heat transfer resistances
and a fixed value of 3000 btu/hr-ft 2 -°F is used for approximation
purposes.
A-12
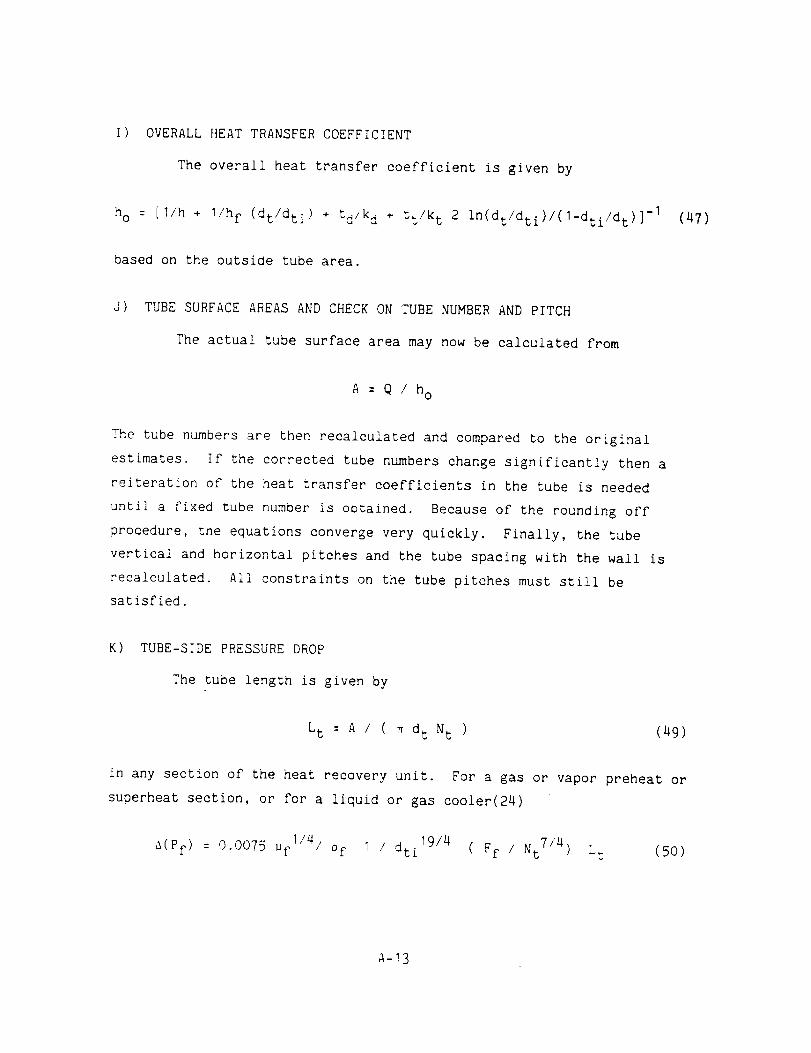
I) OVERALLHEATTRANSFERCOEFFICIENT
The overall heat transfer coefficient is given by
ho = [I/h ÷ I/hf (dt/dti) + tdlk d + tt/k t 2 in(dt/dti)/(1-dti/dt)] -I
based on the outside tube area.
(47)
J) TUBESURFACEAREASANDCHECKONTUBENUMBERANDPITCH
The actual tube surface area may now be calculated from
A : Q / hO
The tube numbers are then recalculated and compared to the original
estimates, if the corrected tube numbers change significantly then a
reiteration of the heat transfer coefficients in the tube is needed
until a fixed tube number is obtained. Because of the rounding off
procedure, the equations converge very quickly. Finally, the tube
vertical and horizontal pitches and the tube spacing with the wall is
recalculated. All constraints on the tube pitches must still be
satisfied.
K) TUBE-SIDE PRESSURE DROP
The tube length is given by
Lt = A / ( _ d t N t ) (49)
in any section of the heat recovery unit. For a gas or vapor preheat or
superheat section, or for a liquid or gas cooler(24)
19/4 7/4A(Pf) = 0.0075 ufl/4/ _f I / dti ( Ff / N t ) L t (5O)
A-13

expresses the pressure drop. Over the evaporation and DBNsection thepressure drop is estimated by(25)
I/4/ 19/4 7/4) I/48(Pf) = 0.0038 Ufl _fv I / dti (Ff / Nt Lt/(1+fl/fv)
+ ( 4 Ff / ( _ dti 2 Nt)2 ( I/rfv + I/rfl) I / g
(51)
where the subscripts I and v stand for liquid and vapor properties.
The total pressure drop should be less than 10% of the working
fluid supply pressure or the tube diameter must be modified and the
design reiterated.
L) GAS DISTRIBUTOR DESIGN
It can be shown that the distributor pressure drop required for
stable operation of the bed is roughly given by(26)
8(Pd ) { ib/ft2_ = U {ft/s} (52)
as compared to other criteria that call for a minimum distributor
pressure drop of from 10 to 35% of the bed pressure drop. The
distributor design is selected to be an orifice plate having uniformly
distributed holes of diameter, dor , no more than four times the average
particle diameter in diameter(rounded up to the closest standard size)
to limit particle weeping. The orifice velocity is
Uor = Cd ( 2 g A(P d) / _I/2) (53)
with Cd being the orifice coefficient, equal to about 0.7.
The let length issued at the orifices is estimated by(27)
Lj = 15 dor [ 0/Op Uor 2 /(g dor) _0.187 (54)
A-I_

and and the number of orifices per unit area is
Nor = U / Uor D / _p 4 / ( _ dor 2) (55)
The initial bubble diameter produced by each jet is(28)
: gi/2 0.4dbo 1.3 [ F / ( D Ab Nor ) ] (56)
Other characteristics of interest in the design of a gas distributor
plate are the orifice pitch,
Sor = I / ( Nor I/2) (57)
and the orifice free area fraction,
_d : ( U / Uor ) ( _ / Din ) (58)
where Din is the gas density of the gas entering the distributor. The
plate thickness is determined from standard thickness relationships for
the selected plate material at the temperature of the inlet gas to the
plate, and is based on the plate supporting its own weight and the
weight of the bed. Supports to prevent warping of the flat plates may
be required for plates of very large cross-section and an insulating
layer on top of the plate will be applied in general to keep the plate
at th highest temperature to minimize deposition of diesel soot.
M) BED DEPTH
The tube surface areas determined previously must be immersed in
the bed or the splash zone above the bed. If all of the tubes are to be
immersed completely in the dense bed region, the required bed depth
(expanded) for tubes on horizontal planes(rectangular or cylindrical
vessels) are
A-15
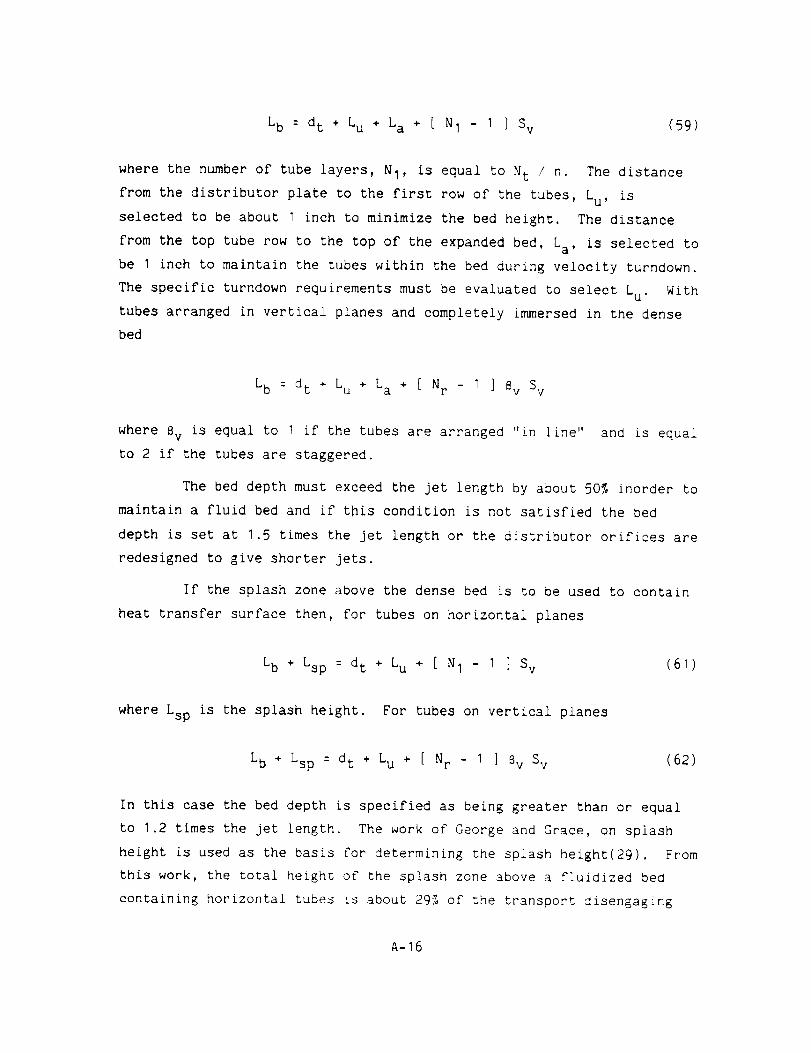
Lb = dt + Lu + La + [ NI - I ] Sv (59)
where the numberof tube layers, NI, is equal to Nt / n. The distance
from the distributor plate to the first row of the tubes, Lu, is
selected to be about I inch to minimize the bed height. The distance
from the top tube row to the top of the expanded bed, La, is selected to
be I inch to maintain the tubes within the bed during velocity turndown.
The specific turndown requirements must be evaluated to select Lu. With
tubes arranged in vertical planes and completely immersed in the dense
bed
Lb = d t ÷ Lu + La ÷ [ N r - I ] 8v Sv
where 8v is equal to I if the tubes are arranged "in line" and is equal
to 2 if the tubes are staggered.
The bed depth must exceed the jet length by about 50% inorder to
maintain a fluid bed and if this condition is not satisfied the bed
depth is set at 1.5 times the Jet length or the distributor orifices are
redesigned to give shorter jets.
If the splash zone above the dense bed is to be used to contain
heat transfer surface then, for tubes on horizontal planes
Lb + Lsp = dt + Lu + [ N I - I ] Sv (61)
where Lsp is the splash height. For tubes on vertical planes
Lb + Lsp : dt + Lu + [ Nr - I ] Sv Sv (62)
In this case the bed depth is specified as being greater than or equal
to 1.2 times the jet length. The work of George and Grace, on splash
height is used as the basis for determining the splash height(29). From
this work, the total height of the splash zone above a fluidized bed
containing horizontal tubes is about 29% of the transport disengaging
A-16
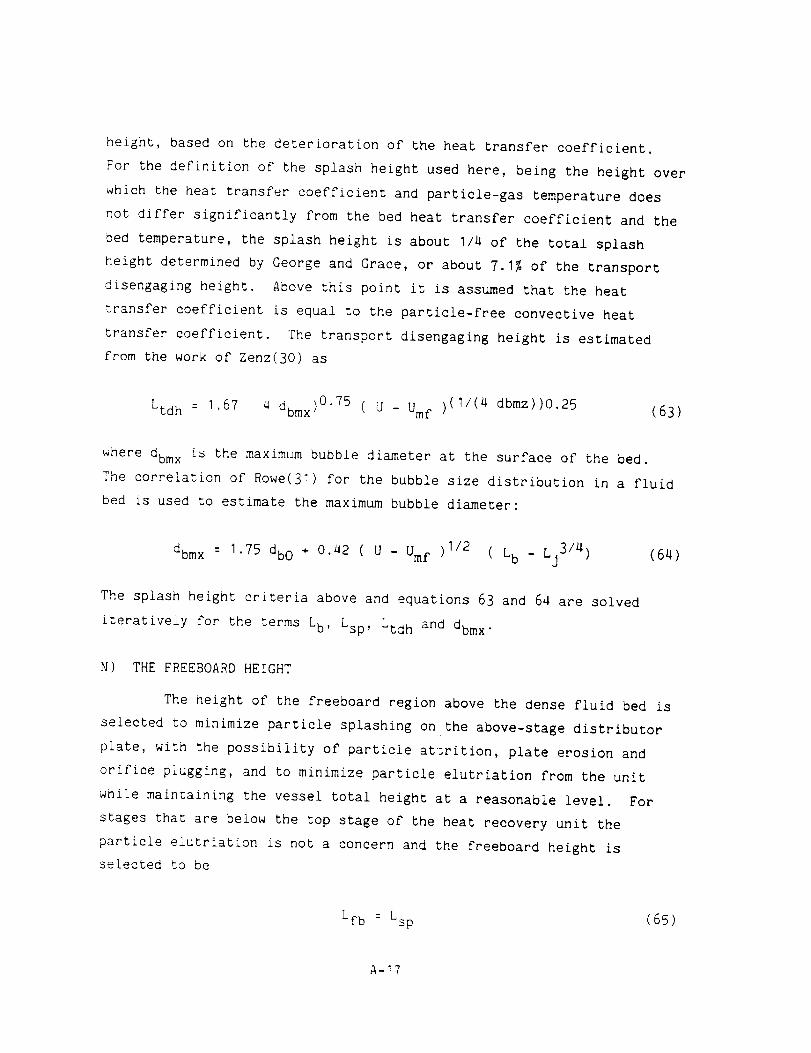
height, based on the deterioration of the heat transfer coefficient.
For the definition of the splash height used here, being the height over
which the heat transfer coefficient and particle-gas temperature does
not differ significantly from the bed heat transfer coefficient and the
bed temperature, the splash height is about I/4 of the total splash
height determined by George and Grace, or about 7.1% of the transportdisengaging height. Above this point it is assumedthat the heattransfer coefficient is equal to the particle-free convective heat
transfer coefficient. The transport disengaging height is estimatedfrom the work of Zenz(30) as
: )0.75 (1/(4 dbmz))O 25Ltd h 1.67 q dbm x ( U - Umf ) (63)
where dbm x is the maximum bubble diameter at the surface of the bed.
The correlation of Rowe(31) for the bubble size distribution in a fluid
bed is used to estimate the maximum bubble diameter:
dbm x : 1.75 dbo ÷ 0.42 ( U - Umf )I/2 ( Lb _ Lj3/4) (64)
The splash height criteria above and equations 63 and 64 are solved
iteratively for the terms Lb, Lsp , Ltd h and dbm x.
N) THE FREEBOARD HEIGHT
The height of the freeboard region above the dense fluid bed is
selected to minimize particle splashing on the above-stage distributor
plate, with the possibility of particle at;rition, plate erosion and
orifice plugging, and to minimize particle elutriation from the unit
while maintaining the vessel total height at a reasonable level. For
stages that are below the top stage of the heat recovery unit the
particle elutriation is not a concern and the freeboard height is
selected to be
Lfb : Lsp (65)
A-17

if there are tubes located in the splash zone, and
Lfb = 0.1 Ltdh (66)
if all of the tubes are immersedin the dense bed.
For the top stage of the unit where particle elutriation is aconcern a greater freeboard height is specified and
Lfb = O.25 Ltdh (67)
if tubes are located in the splash zone, while
Lfb = 0.35 Ltdh (68)
if all tubes are immersed in the dense bed. If a convective zone of
heat recovery fs located in the top stage freeboard then the freeboard
must be large enough to accomodate this surface of height
dt + Lsp +Lz + [ Nr - I/'2 ] Bv Sv
for vertical tubes, and
dt + Lsp ÷ Lz + [ NI - I/2 ] Sv
for horizontal tubes. Lz is the height from the top of the convectivetube bundle to the gas outlet.
O) THEBEDPRESSUREDROP
The bed pressure drop is given by
A(Pb) = Lb 0p [ I - 5t ] [ I - 5 ] [ I - _mf ] (69)
A-18
The fraction of the bed volume occupied by bubbles, _, is taken tobe(13)
: [ U -Umf ] / [ U +Umf + 0.71 ( g db )I/2 ]
where the average bubble diameter in the bed, db, is dbmx/1.75.
volume fraction of tubes in the bed is
The
_t : [ dt A ( Lb - Lu ) / ( ( Lb + Lsp _ Lu ) (4 Ab Lb) ) ]
P) INSULATION THICKNESS
The average thickness of insulation around the heat recovery
vessel is estimated to be
(71)
tin : kin ! ha [ ( ( tO + tI ) / 2 - ta ) / ( ts - ta ) -I] (72)
where this layer of insulation may be distributed nonuniformly with the
thickest portions at the base and the thinner ones at the top. The
specified outer surface temperature of the insulation is ts, while to
and t I are the inlet and outlet gas temperatures, and ta is the ambient
temperature. The ambient to surface heac transfer coefficient, have is
treated as a free parameter because it is highly dependent on the speed
of the vehicle and its geometry.
REFERENCES - Appendix A
I. Ergun, S., Chem. Eng. Progr., 48, 89 (1952)
2_ Fuchs, N. A., Mechanics of Aerosols, Trans., editor C. N. Davies,Pergamon Press, 1956.
3. Kunii, D., and O. Levenspiel, Fluidization Engineering, John Wiley &Sons, Inc., Nwe York, 1969.
a. Botterill, J. S. M., Fluid-Bed Heat Transfer, Academic Press,London, 1975.
<_ "_ A-19
5. Saxena, S. C., et al, Heat Transfer Between A Gas Fluidized Bed andI_ersed Tubes, in Advances in Heat Transfer, Editor T. F_ Irvineand Jo P. Hartnett, Academic Press, NewYork, 1978.
6. Williams, H. W., R. Hernandezand C. S. Mah, Choosing the OptimumBed Material for a Fluidized Bed Heat Exchanger, Proceedings of the16th Intersociety Energy Conversion Engf Conf., 1981.
7. AI All, B. M. A., and J. Boughton, Shallow Fluidized-Bed HeatTransfer, Applied Energy, 3, 101 (1977).
8o Baker, A., Heat Transfer Studies Between A Horizontal Tube and aShallow Flidized Bed, Ph.D. Thesis, Univ. Western Ontario, 1981.
9. Virr, M. J., and H. W. Williams, Heat Transfer in Shallow FluidizedBed Waste Heat Systems, presented at the 1984 Annual AIChEMeeting,San Francisco, CA.
10. Atkinson, G. A., Extended Surface Fluidized Bed Heat Transfer, PhoD. Thesis, Univ. Aston in Birmingham, 1974.
11. Glicksman, L. R., and N. Decker, Heat Transfer in Fluidized Bedswith Large Particles, MIT Industrial Liaison Program, Symposium,January 18, 1979.
12. Gelperin, N. I., V. G. Einshtein, and L. A. Korotynaskaya, Int°Chem.Eng., 9, 137 (1969).
13. Bar-Cohen, A., Fluid Mechanic Characteristics of Bubbling F1uidizedBeds, Adv. Mech. Flow Granular Mater., 2, 529 (1983).
14. Andeen, B. R., and L. R. Glicksman, Heat Transfer to HorizontalTubes in Shallow Fluidized Beds, ASMEpaper 76-HT-67.
15. Leva, M., Can. J. Chem.Eng., 35, 71 (1957).
16. Grewal, N. S., S. C. Saxena, Experimental Studies of Heat TransferBetween a Bundle of Horizontal Tubes and a Gas-Solid Fluidized Bedof Small Particles, Ind. Eng. Chem.Process Des. Dev., 22, 367(1983).
17. Goel, I., S. C. Saxena, and A. F. Dolidovich, Heat Transfer FromRoughand Finned Horizontal Tubes in a Gas Fluidized Bed, J. HeatTransfer, 106, 91 (1984).
18. Krause, W. E., and A. R. Peters, Heat Transfer from HorizontalSerrated Finne_ Tubes in an Air-Fluidized Bedof Uniformly-Size_Particles, ASMEpaper 80-HT-48.
A-20
19o
20.
21_
22°
23.
25.
26_
27.
28.
29.
30.
31.
Chen, J. C., Heat Transfer to Tubes in F1uidized Beds, ASMEpaper76-HT-75.
Zabrodsky, S. S., et al, Heat Transfer of Single Horizontal FinnedTubes and Their Bundles in a Fluidized Bed of Large Particles, inFluidization, editors J. R. Grace and J. M. Matsen, PlenumPress,NewYork, 1980.
Afgan, N., and E. U. Schlunder, Heat Exchangers: Design and TheorySourcebook, Scripta Book Co., Wash. D.C., 1974.
Chemical Engineer's Handbook, editor, J. H. Perry, Fourth Edition,McGraw-Hill Book Co., NewYork, 1963.
Exxon Research and Engineering Co., Industrial Application FluidizedBed Combustion, Indirect Fired Process Heaters, Final Program Reportfor July I, 1976 - September 30, 1980, DOE/ET/10379-T3.
Bird, R. B., W. E. Stewart, and E. N. Lightfoot, TransportPhenomena,John Wiley & Sons, Inc., NewYork, 1960.
Collier, J. G., The Design of Boilers, in Heat Exchangers, editorsS. Kakac, A. E. Bergles, and F. Mayinger, HemispherePub. Corp., NewYork, 1981.
Wen, C. Y., J. Shang, and D. F. King, Distributor Design, presentedat MIT Special SummerProgram on Fluidized Bed Combustion, Program2 60S, July, 1981.
Yang, W. C., Jet Penetration in a Pressurized Fluidized Bed, I&ECFund., 20, 297 (1981).
Davidson, J. F., and B. O. G. Schuler, Trans. Inst. Chem.Engrs.,38, 335 (1960).
George, S. E., and J. R. Grace, AIChEJ., 28(5), 759, (1982).
Zenz, F. A., and N. A. Well, AIChEJ., 4(4), 472(1968).
Rowe, P. N., Prediction of Bubble Size in a gas Fluidized Bed, Chem.Eng. Sci., 31, 285 (1976).
A-21

APPENDIXB
COMPONENTDATAFORSTEAMINJECTIONCYCLESYSTEMS
B.I Compressor Drive Expander
The designs for the compressor drive expander for the steam
injection cycle were based on data from the Cummins T-46B turbocharger.
The Dimensions for the compressor drive expander for the three applica-
tions are tabulated in Figure BI.
The desigr for the power expander was also based on the Cummins
T-46B turbocharger. The designs for the gearbox, the feed pump, and the
feed pump drive that are integral with the power expander were also
based on the TECO system described in Reference I. The dimensions for
the power expander and the gearbox for the three applications are
tabulated in Figure B2.
Conventional procedures for scaling turbomachinery were used for
both of these components. The gearboxes were scaled using the procedure
described in Appendix D.
For the steam injection systems the compressor drive expander,
the power expander, and the gearbox are modifications of standard
turbocompound engine components so the weights chargeable to the subposed
cycle are the incremental weights of these components. Table BI lists
the incremental weights of the compressor drive expander and the power
expander for the three applications. Table B2 lists the incremental
weights of the planetary gearboxes for the three applications.
B-I

o_
3
t
I-- cnt..
iv) (_
-- (..)
(_ I-.-
<I)
G)
r_
!
i-O
r-4)
EI
,..,.400
r-
.o
a
<:
G)m
¢.1
r"Om
(.bG)
r-i
E
l,-
t-O
r-G_
m
(I)
t13c_.XG)
(I)
L_O
Eo
I
B-2
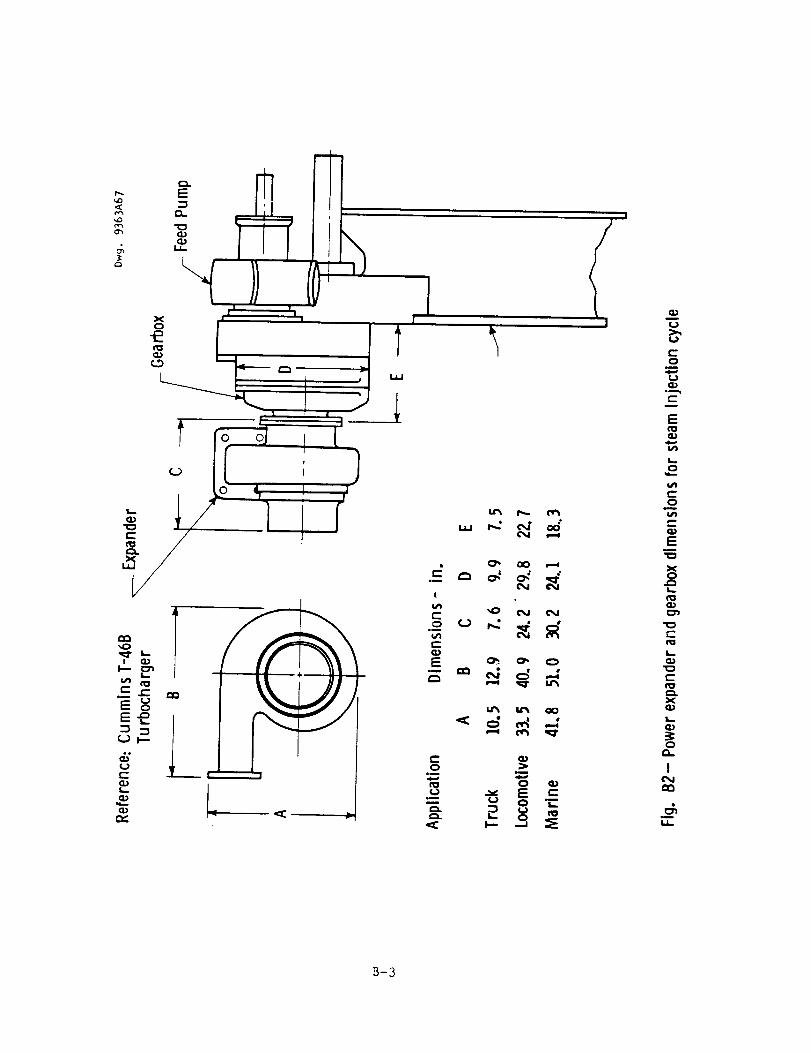
t_
x !
° I Ii
|
Iu
om
°_
E
CD
0
c-O
E
x
r-
CL)
XCI_
0
!
B-3
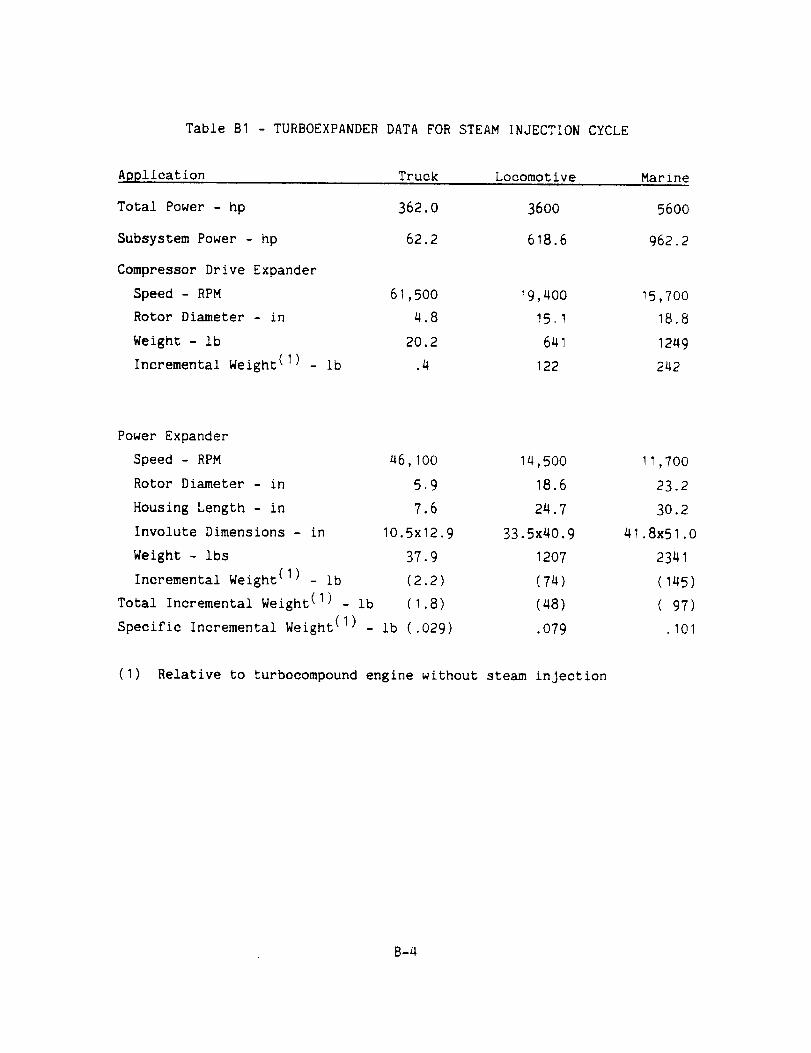
Table BI - TURBOEXPANDER DATA FOR STEAM INJECTION CYCLE
Application Truck Locomotive Marine
Total Power - hp
Subsystem Power - hp
Compressor Drive Expander
Speed - RPM
Rotor Diameter - in
Weight - Ib
Incremental Weight (I) - Ib
362.0 3600 5600
62.2 618.6 962.2
61,500 19,400
4.8 15,1
20.2 641
.4 122
15,700
18.8
1249
242
Power Expander
Speed - RPM 46,100 14,500
Rotor Diameter - in 5.9 18.6
Housing Length - in 7.6 24.7
Involute Dimensions - in IO.5x12.9 33.5x40.9
Weight - ibs 37.9 1207
Incremental Weight (1) - ib (2.2) (74)
Total Incremental Weight (I) - ib (1.8) (48)
.079Specific Incremental Weight (I) - lb (.029)
(I) Relative to turbocompound engine without steam injection
11,700
23.2
30.2
41.8x51.0
2341
(145)
(97)
.101
B-4

Tab]e B2 - PLANETARY GEARBOXES FOR STEAM INJECTION CYCLE SYSTEM
Application Truck Locomotive Marine
Total Power - hp
Subsystem Power - hp
Turbine Speed - RPM
Diesel Engine Speed - RPM
Gear Speed - RPM
Speed Ratio
Gear Q-Factor
Weight Factor
Weight - ibs
Scale Factor
_ncremental Weight(2)_ib
362.0 3600 5600
62.2 618.6 962.2
46,1OO 14,500 11,700
1900 1050 1050
3o0o 1050 1800(1)
15.37 13.81 6.5
•385 10.04 5.34
•959 26.5 14.0
34.5 945 504
.986 2.98 2.41
16.3 439 224
(I) Generator Speed
(2) Relative to turbocompound engine without steam engine
B-5

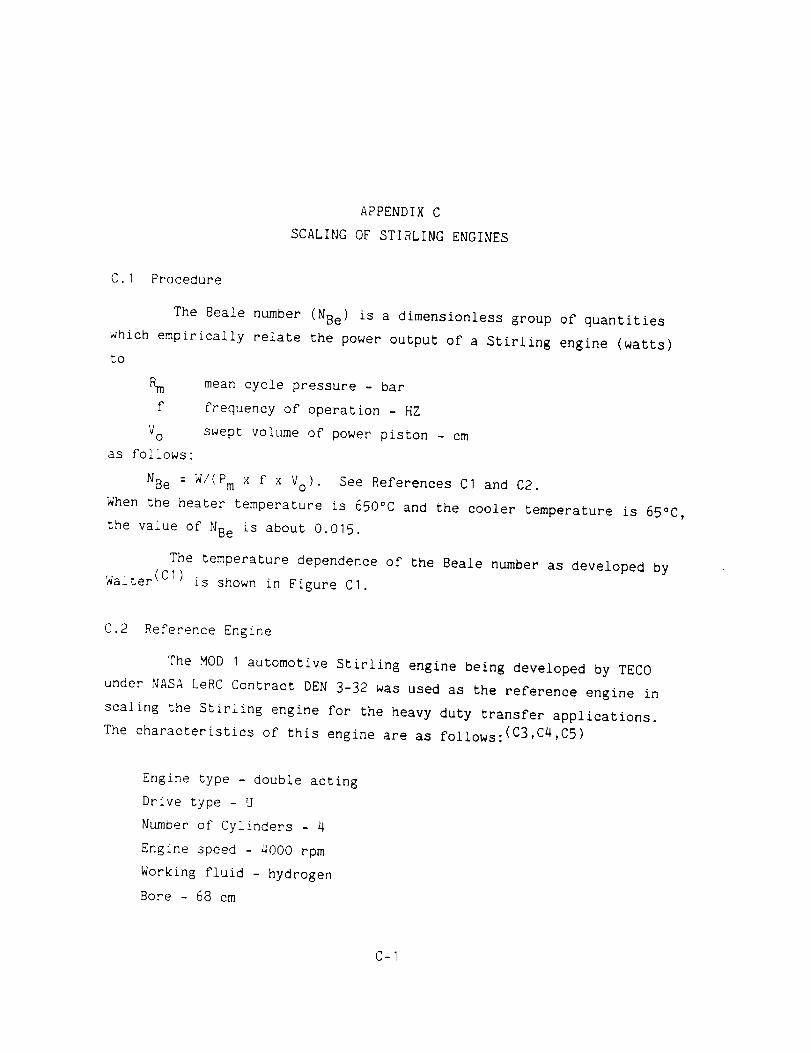
APPENDIXC
SCALINGOFSTIRLINGENGINES
C.I Procedure
The Beaie number (NBe) is a dimensionless group of quantities
which empirically relate the power output of a Stirling engine (watts)to
Rm meancycle pressure - barf frequency of operation - HZ
Vo swept volume of power piston - cmas follows:
NBe= W/(Pm x f x Vo). See References CI and C2.
Whenthe heater temperature is 650°C and the cooler temperature is 65°C,the value of NBe is about O.O15.
The temperature dependenceof the Beale numberas developed byWalter (CI) is shown in Figure CI.
C.2 Reference Engine
The MODI automotive Stifling engine being developed by TECOunder NASALeRCContract DEN3-32 was used as the reference engine inscaling the Stirling engine for the heavy duty transfer applications.The characteristics of this engine are as follows:(C3,C4,C5)
Engine type - double actingDrive type - UNumberof Cylinders - 4
Engine speed - 4000 rpm
Working fluid - hydrogenBore - 68 cm
C-I
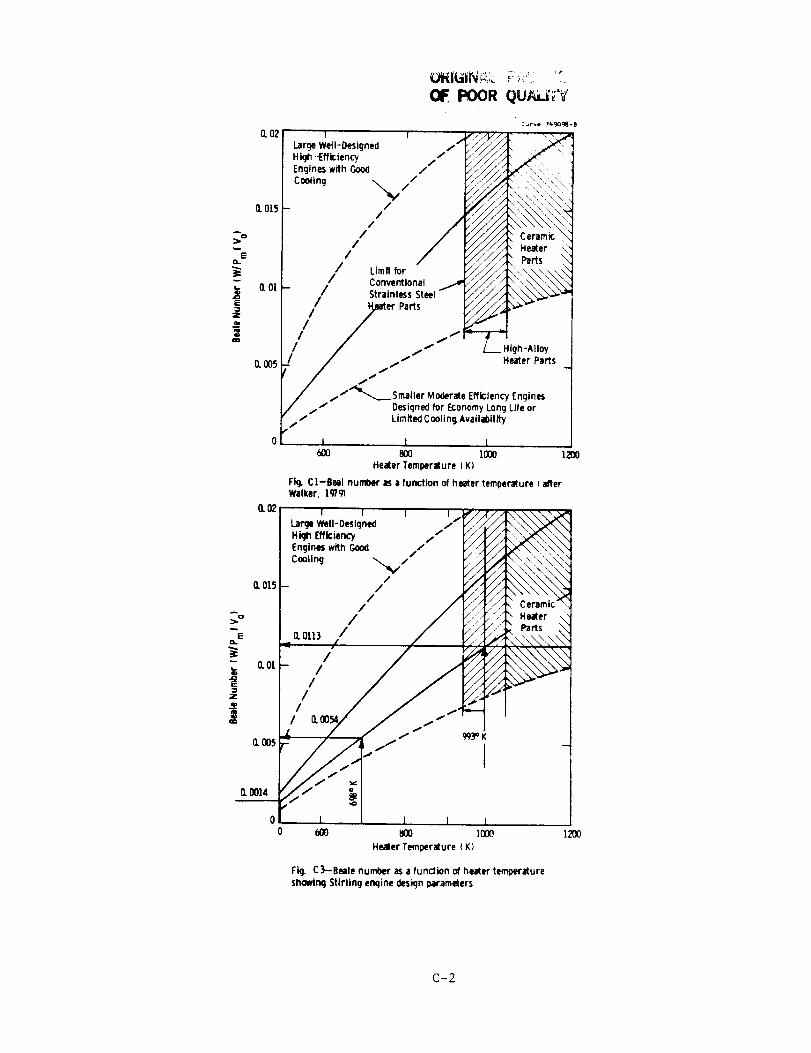
O2
Z
R
0.02
O.015
O. Ol
O, OO5
O.0014
Walker. I_/9}
I I I
Large Well-Designed
High Efficiency
Engines with Good
Cooling -_/
/-- /
//
/oH] /
//
- //
/
I
V.,
// / /////
/.!
- I
".\\ • \
Ceramic \\ Heater
,_\\_,,',
I l l
800 I000
Healer Temperalure (K)
Fig. C3-8eale numOe_ as a fundion of huter temoeraure
sho_n(j Stirling engine design _rameters
1200
C-2
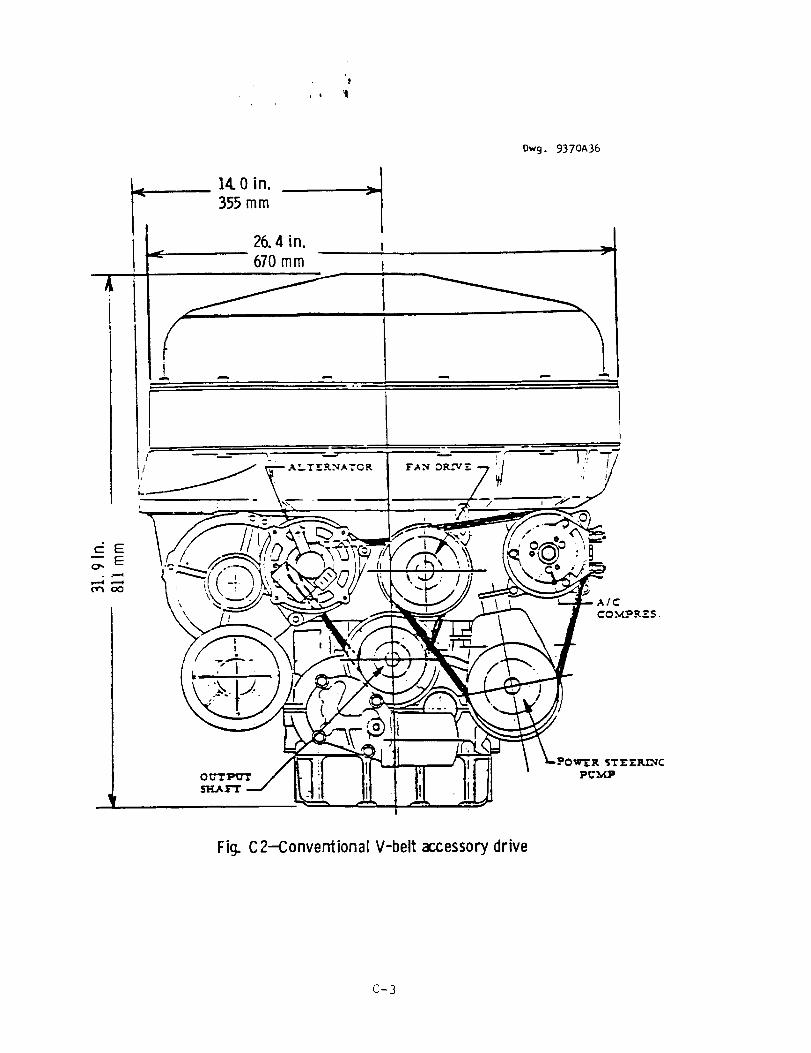
T
14.0 in.
355 mm
26.4 in.670 mm
Dwg. 9370A36
Em
o_ E
Fig. C2-Conventional V-belt accessory drive
¢-3
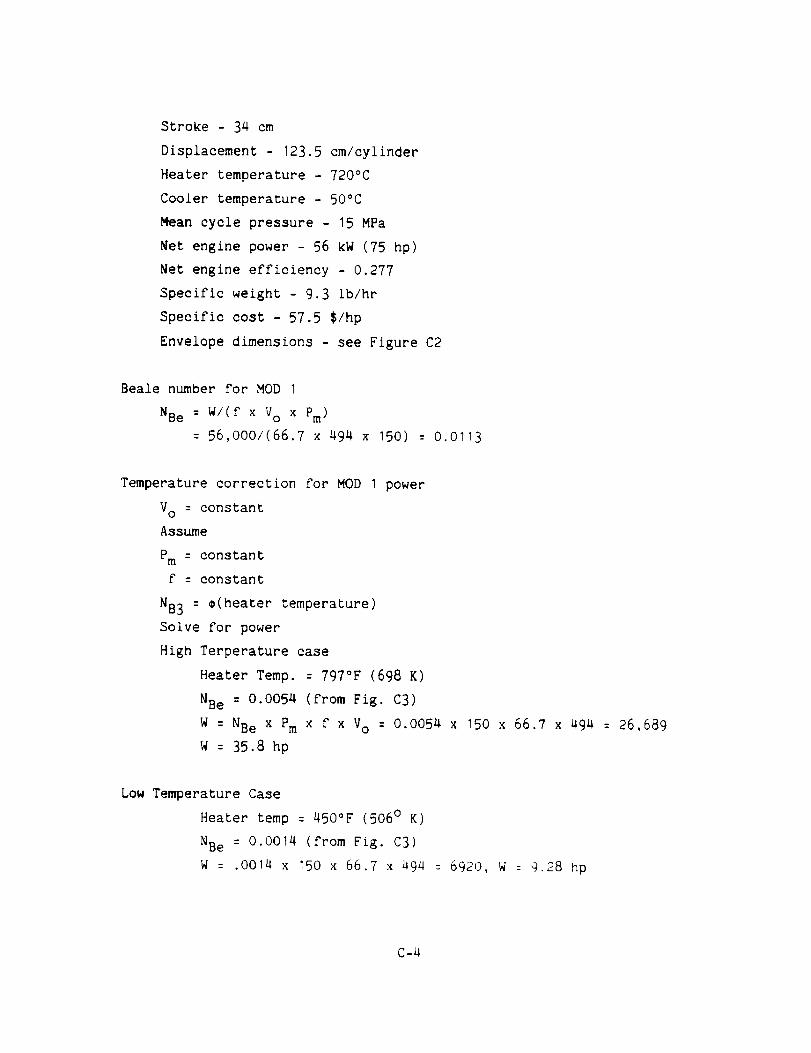
Stroke - 34 cm
Displacement - 123.5 cm/cylinder
Heater temperature - 720°C
Cooler temperature - 50°C
Mean cycle pressure - 15 MPa
Net engine power - 56 kW (75 hp)
Net engine efficiency - 0.277
Specific weight - 9.3 Ib/hr
Specific cost - 57.5 $/hp
Envelope dimensions - see Figure C2
Beale number for HOD I
NBe : W/(f x Vo x Pm )
: 56,000/(66.7 × 494 x 150) = 0.O113
Temperature correction for MOD I power
Vo = constant
Assume
Pm = constant
f = constant
NB3 = _(heater temperature)
Solve for power
High Terperature case
Heater Temp. = 797°F (698 K)
NBe = 0.0054 (from Fig. C3)
W = NBe x Pm × f × Vo = 0.0054 x 150 × 66.7 x 49a = 26,689
W = 35.8 hp
Low Temperature Case
Heater temp : 450°F (506 ° K)
NBe = O.0014 (from Fig. C3)
W = .OO14 x 150 x 66.7 x 494 = 6920, W = 9.28 hp
C-_
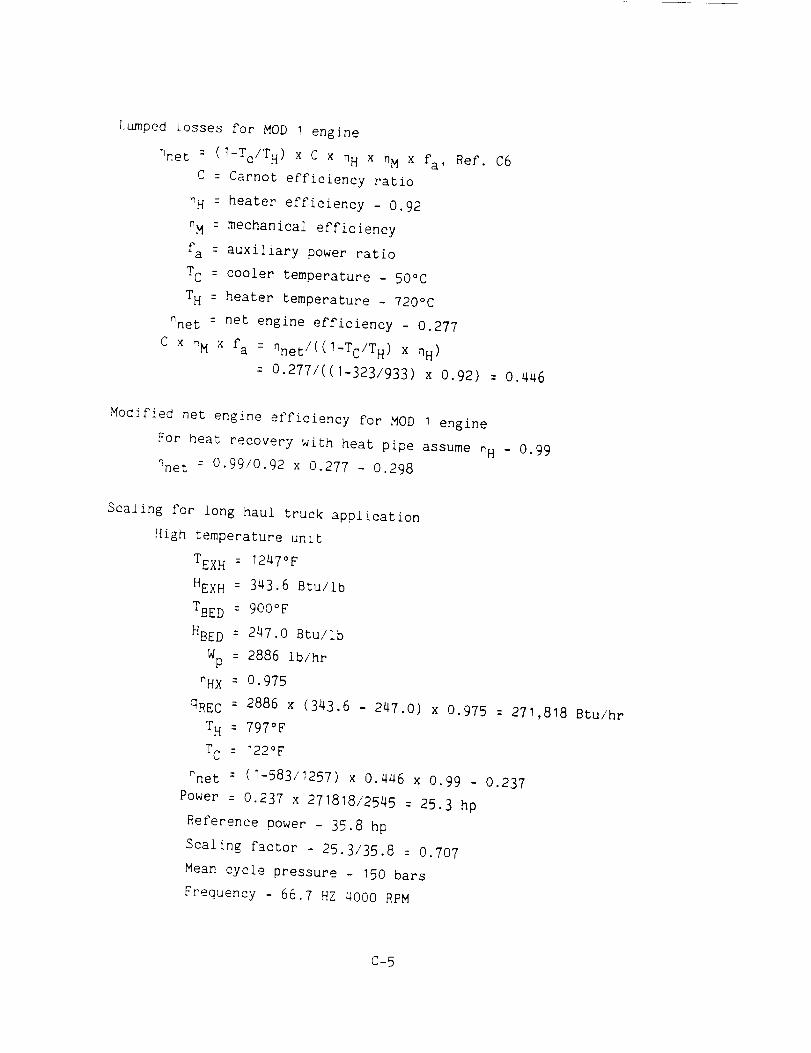
1.umpedLosses for MOD I engine
r_net = (I-Tc/T H) x C × nH × nM × fa, Ref. C6
C = Carnot efficiency ratio
nH = heater efficiency - 0.92
nM = mechanical efficiency
fa = auxiliary power ratio
TC = cooler temperature - 50oc
TH = heater temperature _ 720oc
nnet = net engine efficiency - 0.277
C × nM x fa : nnet/((1-Tc/T H) x qH)
= 0.277/((I-323/933) x O.92) = 0.446
Modified net engine efficiency for MOD I engine
For heat recovery with heat pipe assume nH - 0.99
"Inet = 0.99/0.92 x 0.277 - 0.298
Sca]ing for Long haul truck application
High temperature unit
TEX H = 1247OF
HEX H = 343.6 Btu/lb
TBE D = 900OF
HBE D = 247.0 Btu/ib
Wp = 2886 lb/hr
nHX : 0.975
qREC = 2886 x (343.6 - 247.0) x 0.975 = 271,818 Btu/hr
TH = 797OF
TC = 122OF
_net = (I-583/1257) x 0.446 x 0.99 - 0.237
Power = 0.237 x 271818/2545 = 25.3 hp
Reference power - 35.8 hp
Scaling factor - 25.3/35.8 = 0.707
Mean cycle pressure - 150 bars
Frequency - 66.7 HZ 4000 RPM
C-5
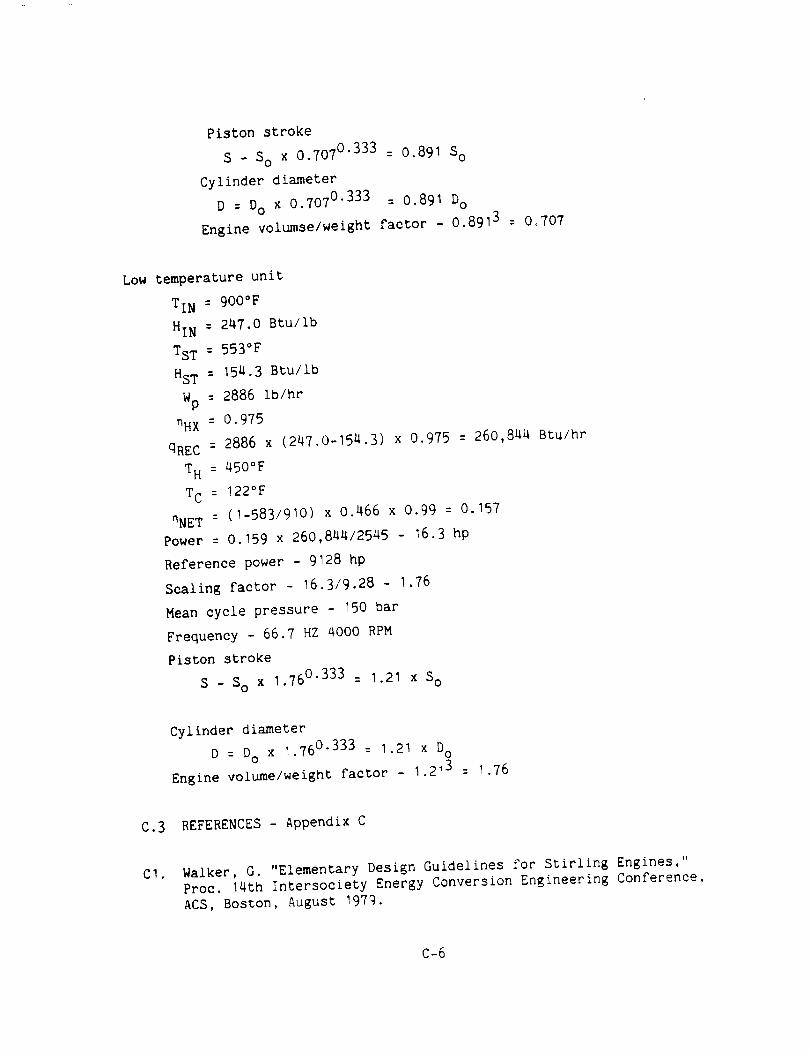
Piston stroke
S - So x 0.7070.333 = Oo891So
Cylinder diameter
D = DO x 0.7070.333 = 0.891D OEngine volumse/weight factor - 0.8913 = 0°707
Low temperature unit
TIN = 900°F
HIN = 247.0 Btu/lbTST = 553°F
HST= 154.3 Btu/ib
Wp= 2886 ib/hr_HX= 0.975
qREC= 2886 x (247.0-154.3) x 0.975 = 260,844 Btu/hr
TH = 450°F
TC = 122°FnNET= (I-583/910) x 0.466 x 0.99 = 0.157
Power = 0.159 x 260,844/2545 - 16.3 hp
Reference power - 9128 hp
Scaling factor - 16.3/9.28 - 1.76
Meancycle pressure - 150 bar
Frequency - 66.7 HZ 4000 RPMPiston stroke
S - So x 1.760.333 = 1.21 x So
Cylinder diameterD = Do x 1.760.333 = 1.21 x Do
Engine volume/weight factor - 1.213 = 1.76
C.3 REFERENCES- Appendix C
CI. Walker, G. "Elementary Design Guidelines for Stirling Engines,"Proc. 14th Intersociety Energy Conversion Engineering Conference,ACS,Boston, August 1973.
C-6
C2.
C3
C4.
C5_
C6.
C?.
West, C. D., "Theoretical Basis for the Beale Number," Proceedings
of the 16th IECEC, August, 1981, p. 1986-7.
Nightingale, N. P., "Automotive Stirling Engine Development
Program," Proc. 21st Auto. Tech. Dev. Contractor's Coordination
Meeting, Dearborn, Michigan, Nov. 14-17, 1983.
Richey, A. E., "MOD I Stirling Engine Performance Data and
Analysis," Proceedings 21st Auto. Tech. Dev. Contractor's
Coordination Meeting, Dearborn, Michigan, Nov. 14-17, 1983.
Personal communication with A. E. Richey, MTI
MartLn, W. R., "Stirling Engine Design Manual - Second Edition,"DOE/NASA/3194-1, Jan. 1983, p. 77.
Gedeon, David, "Scaling Rules for Stirling Engines," Proceedings of
the 16th IECEC, August, 1981, p. 1929-35.
C-7

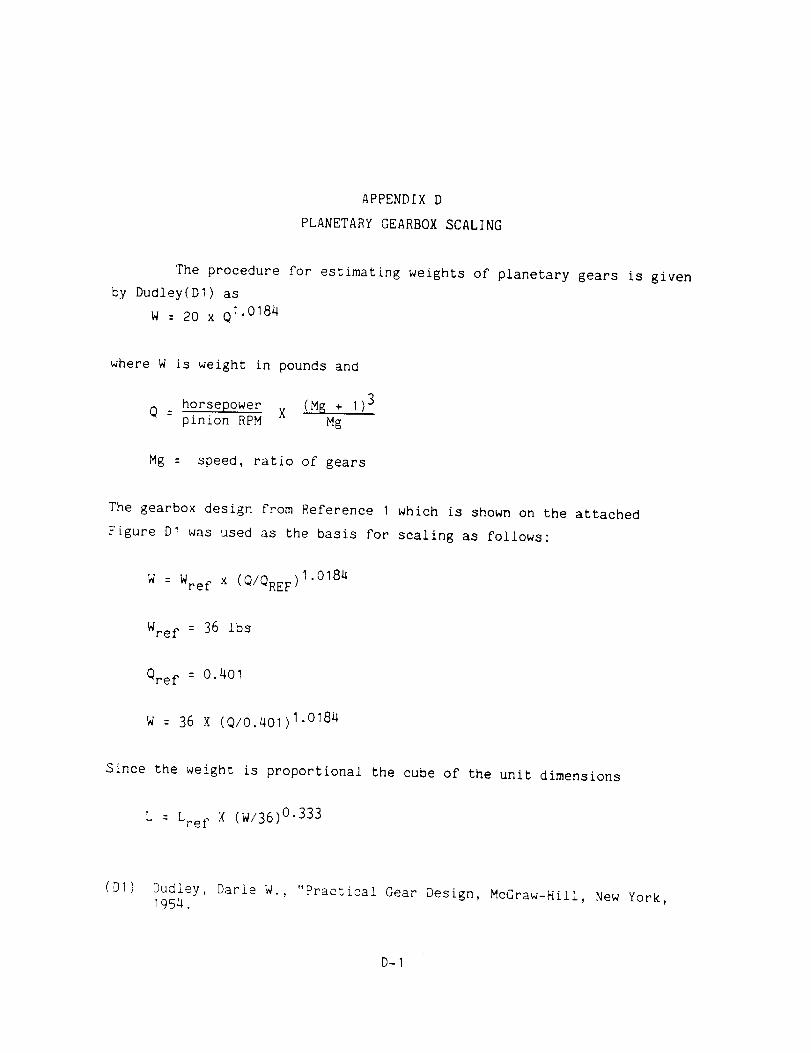
APPENDIXD
PLANETARYGEARBOXSCALING
The procedure for estimating weights of planetary gears is givenby Dudley(D1) as
W= 20 x QI.0184
where W is weight in pounds and
Q _ horsepower X (Mg + I)3
pinion RPM Mg
Mg = speed, ratio of gears
The gearbox design from Reference I which is shown on the attached
Figure DI was used as the basis for scaling as follows:
W = Wre f x (Q/QREF)I-0184
Wre f = 36 Ibs
Qref = O.401
W = 36 X (Q/O.401) I'O18a
Since the weight is proportional the cube of the unit dimensions
L = Ere f X (W/36) O'333
(DI) Dudley, Darie W., "Practical Gear Design McGraw-Hill New York1952 . ' , ,
D-I
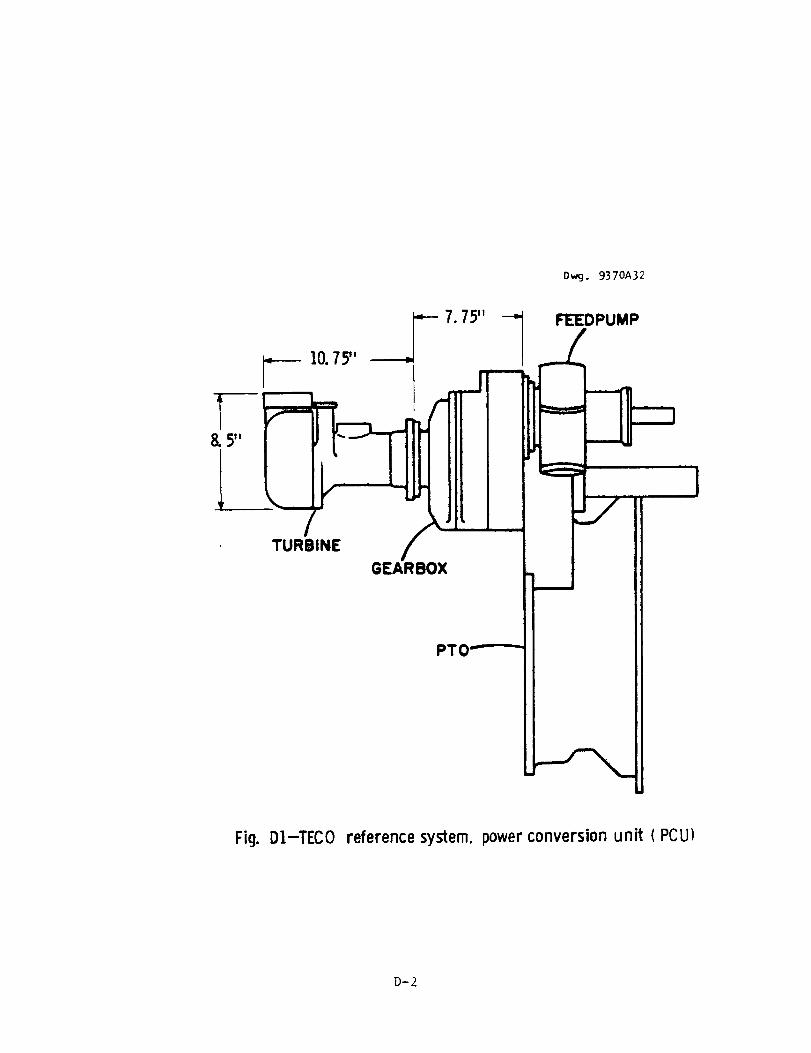
D_. 9370A32
GEARBOX
FEEDPUMP
PTO
Fig. D1-TECO reference system, power conversion unit (PCU)
D-2

APPENDIX E
V-BELT DRIVE DESIGN INFORMATION

-_'_:_:-'''vZ ........ IF'_ .... _F ........ n,_- ..... l III ........ ] I1 .............................. j ..... ----_ _
Robert Hamm
Westinghouse R & D Center
1310 Beulah Road
Pittsburgh, Pennsylvania 15235
_i_';_i_ _OF Poor QG_,_,_,_,_
The Gates Rubber Company999 South BroadwayP O. Box 5887
Denver, Colorado 80217
(303) 744-1911
September 12, 1984
Dear Mr. Harem:
Durin@ cur phone conversation of September 6, you asked me to design drives
for a six unit, St_rllng battery locomotive drive. The drive parameters were:
Battery:
DriveR:
DriveN:
Center Distance:
One 91.8 h.p., five 65.1 h.p.
kOO0 rpm
1050 rpm
30" for bottom four batteries
56" for top two batteries
The belts were picked to obtain the center distances nearest your specifications.
Less expensive drives are available, but have larger center distances than
you specified.
The proposed drive is shown in the accompanying drawings. The drives I am
recommending are as follows:
Drive:
DriveR:
DriveN:
B_]t:
Center Distance:
Tensioning:
Four bottom batteries, 65.1 h.p. each
5/5vxa.95/5VX18.7
5/5'_1ooo30.7"
Apply force of 8 to ii pounds, for deflection
of 15/32"
Drive:
DriveR:
DriveN:
Belt:
Center Distance:
Tensioning:
Top battery, 65.1 h.p.
5/5vx_.95/5vx18.75/5vx15oo56.O5"
Apply force of 7 to ii pounds, for deflection
of T/8".
i E-I
Robert Hamm
Page 2
Drive:
DriveR:
DriveN:
Belt:
Center Distance:
Tensioning:
Top battery, 91.8 h.p.
6/5VX4.9
6/5VX18.7
6/5VX1500
56.O5"Apply force of 8 to 12 pounds, for deflection
of 7/8".
If you have any questions, please contact me.
Sincerely,
BO/cmc Brent 0man
Application _ihngir.eer
E-2
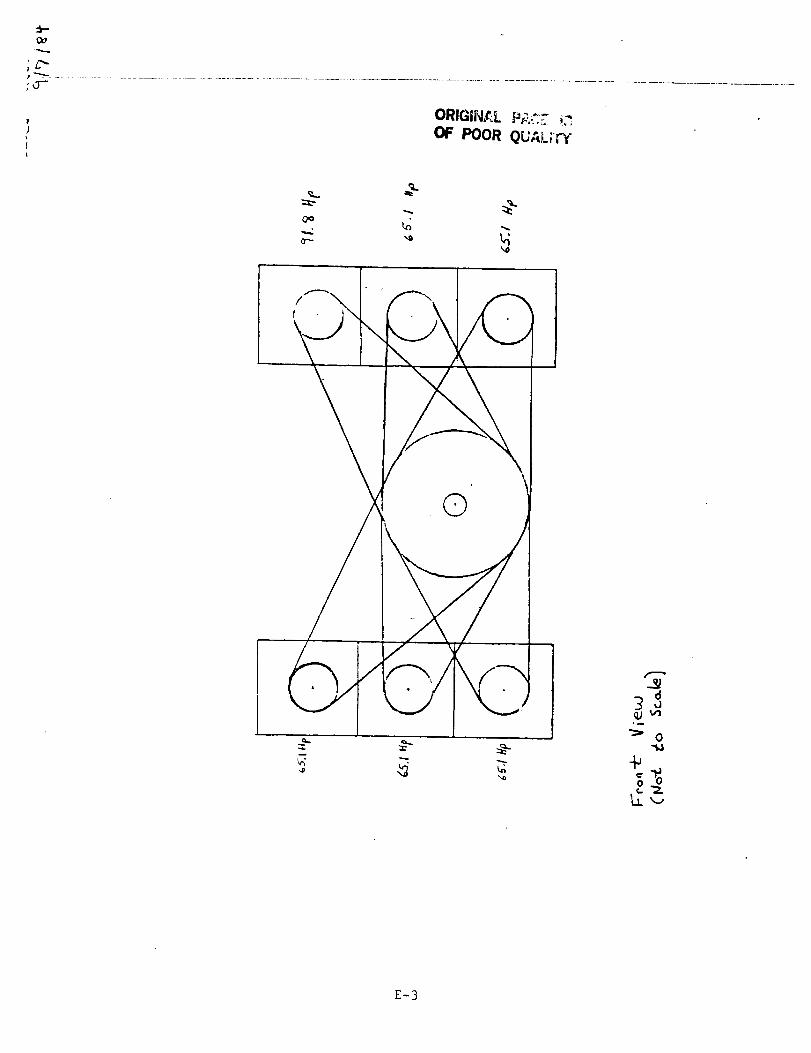
oo
ORIGINRL PP.C.,T.i2
OF POOR QUALITY
',e
/
©
_v.j
Lt_
E-3
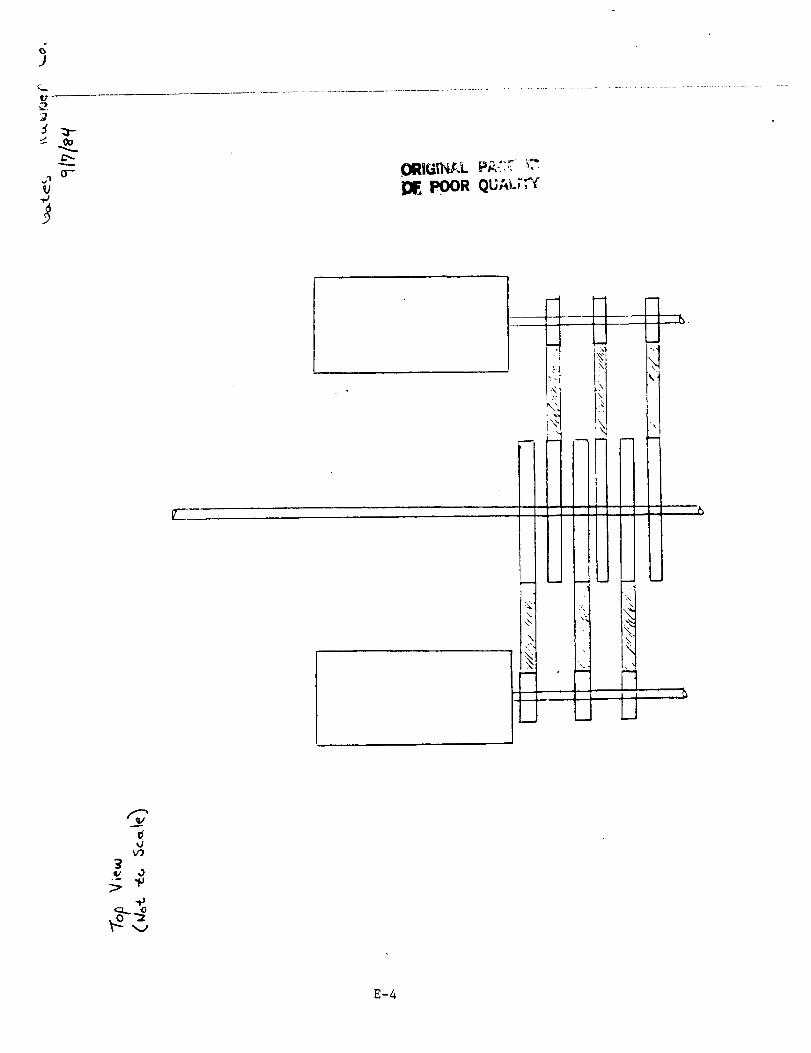
¢...lb."
_2
0"-"j'l
'v'9
,,,9
'F..-4
The Gates Rubber Company999 South BroadwayP O Box 5887
Denver, Colorado 80217
(303) 744-1911
_r. Robert Hamm
W_sting)icuse q&D Center
]_I0 Beul_h Road
Pittsburgh, PA 15235
September 24, 1984
Dear Mr. Hamm:
!r: :_ur teieohone conversations of September 17 regarding my previous drive
so__o_en......._ ...........o_-,_ndations _-=_r your iccDmotive drive, you indicated that _vou ore-
ferreJ tc use PowerBand belts.
"-_ng,.o, the force-deflection method of tensioning for PowerBand belts is not
:_iways convenient since such large forces are required to deflect all of the
individual strands in _ PowerBand at the same time.
Ple_se use the following information for the elongation method of tensioning
in place of my previous tensioning recommendations for single strand belts.
Xeasure the outside circumference of the belts at zero tension. Tighten the
belts until the original outside circumference elongates between the amounts
s_own below:
Horseoower Belt Elongation
65.1 5/SVXIOOO PowerBand 3/8" to 9/16"
65.1 5/5VX15OO PowerBand 1/2" to 13/16"
91.% 6/5VX1500 PowerBand 5/8" to 15/16"
if you have any questions, please contact me.
SO/ckw
Sincerely, I
Brent Oman
Application Engineer
E-5

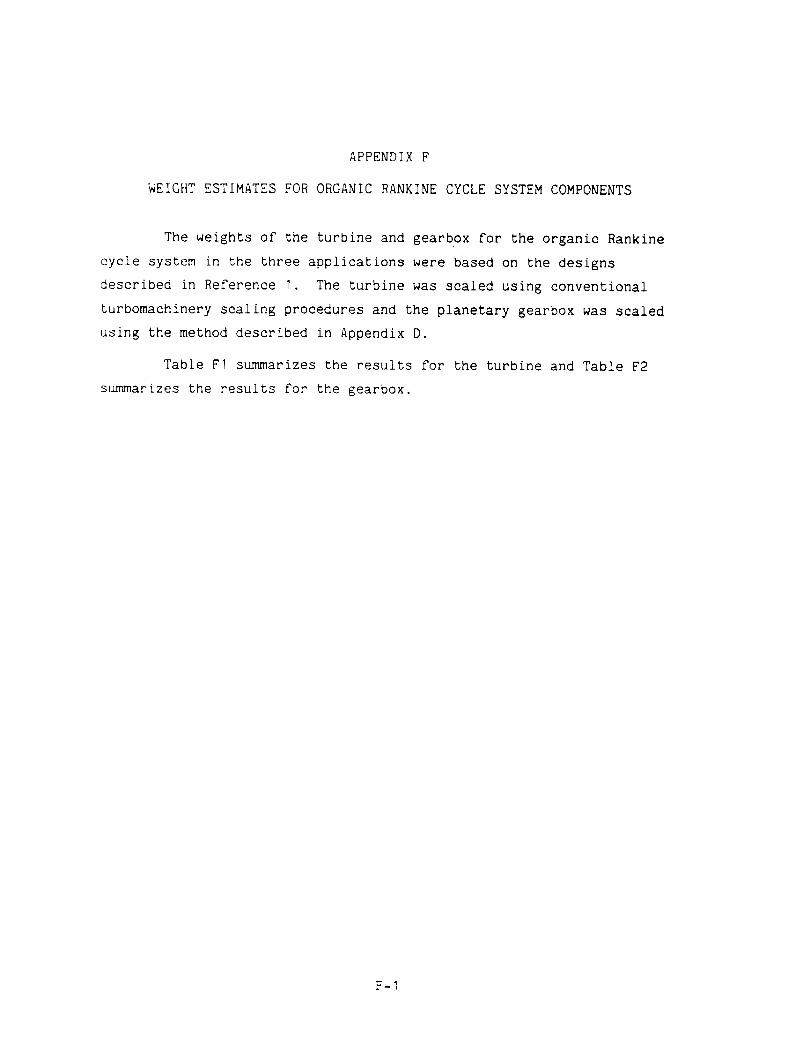
APPENDIX F
WEIGHT ESTIMATES FOR ORGANIC RANKINE CYCLE SYSTEM COMPONENTS
The weights of the turbine and gearbox for the organic Rankine
cycle system _n the three applications were based on the designs
described in Reference I. The turbine was scaled using conventional
turbomachinery scaling procedures and the planetary gearbox was scaled
using the method described in Appendix D.
Table FI summarizes the results for the turbine and Table F2
summarizes the results for the gearbox.
F-I
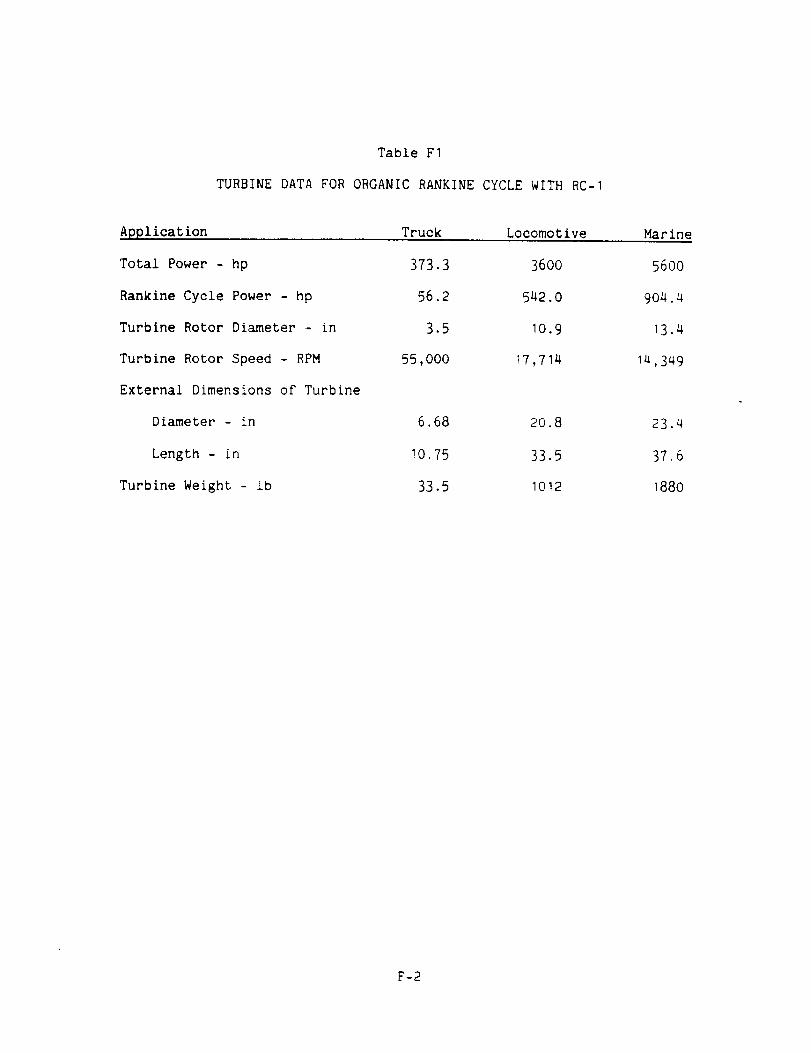
Application
Table FI
TURBINEDATAFORORGANICRANKINECYCLEWITHRC-I
Truck Locomotive Marine
Total Power - hp 373.3
Rankine Cycle Power - hp 56.2
Turbine Rotor Diameter - in 3.5
Turbine Rotor Speed - RPM 55,000
External Dimensions of Turbine
Diameter - in 6.68
Length - in I0.75
Turbine Weight - ib 33.5
3600
542.0
IO.9
17,714
20.8
33.5
1012
56OO
904.4
13.4
14,349
23.4
37.6
_880
F-2
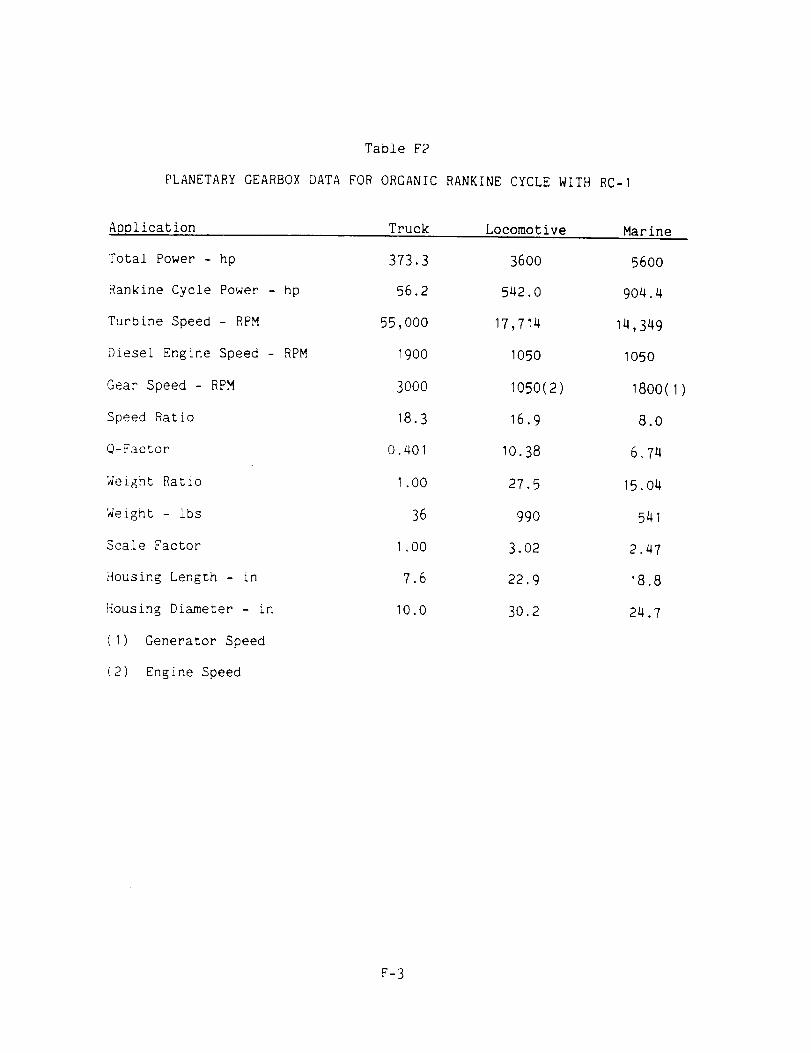
Table F2
PLANETARYGEARBOXDATAFORORGANICRANKINECYCLEWITHRC-I
Application Truck Locomotive Marine
Total Power - hp
Rankine Cycle Power - hp
Turbine Speed- RPM
Diesel Engine Speed - RPM
Gear Speed - RPM
Speed Ratio
Q-Factor
Weight Ratio
Weight - lbs
Scale Factor
Housing Length - in
Housing Diameter - in
(I) Generator Speed
(2) Engine Speed
373.3 36OO
56.2 542.0
55,000 17,714
1900 1050
3000 1050(2)
18.3 16.9
O.401 10.38
1.00 27.5
36 990
1.00 3.02
7.6 22.9
10.0 30.2
5600
904.4
14,349
1050
18oo(i)
8.0
6°74
15.04
541
2.47
18.8
24.7
F-3


APPENDIX G
WEIGHT ESTIMATES FOR STIRLING ENGINE SYSTEM COMPONENTS
The weights of the high and low temperature Stirling engine
modules were derived from the MODI reference engine using the scaling
procedure described in Appendix C. Table GI summarizes the results for
the three applications. For the truck application, the high temperature
module is an 0.89 scale model and the low temperature version is a 1.21
scale model of the reference engine.
For the locomotive application it was found that a single 2.87
scale model high temperature unit would weigh 3.37 times as much as
multiple reference engine modules and that a single 3.89 scale model low
temperature unit would weigh 3.36 times as much as multiple reference
engine modules. It was therefore decided to use multiple reference
engine modules for this application rather than single units.
For the marine application, the same advantage of multiple
reference engine modules over single units obtained so multiple modules
were used for this application alsoo
In the truck application the two Stirling engine modules drive
through a single planetary gearbox. The estimated weight for that
gearbox is given in Table G2.
The locomotive application of the Stirling engine does not use a
gearbox. The V-belt drive provides the required speed reduction.
The gearboxes for the marine application are gear and pinion
type. The weights of these units were estimated.
G-I
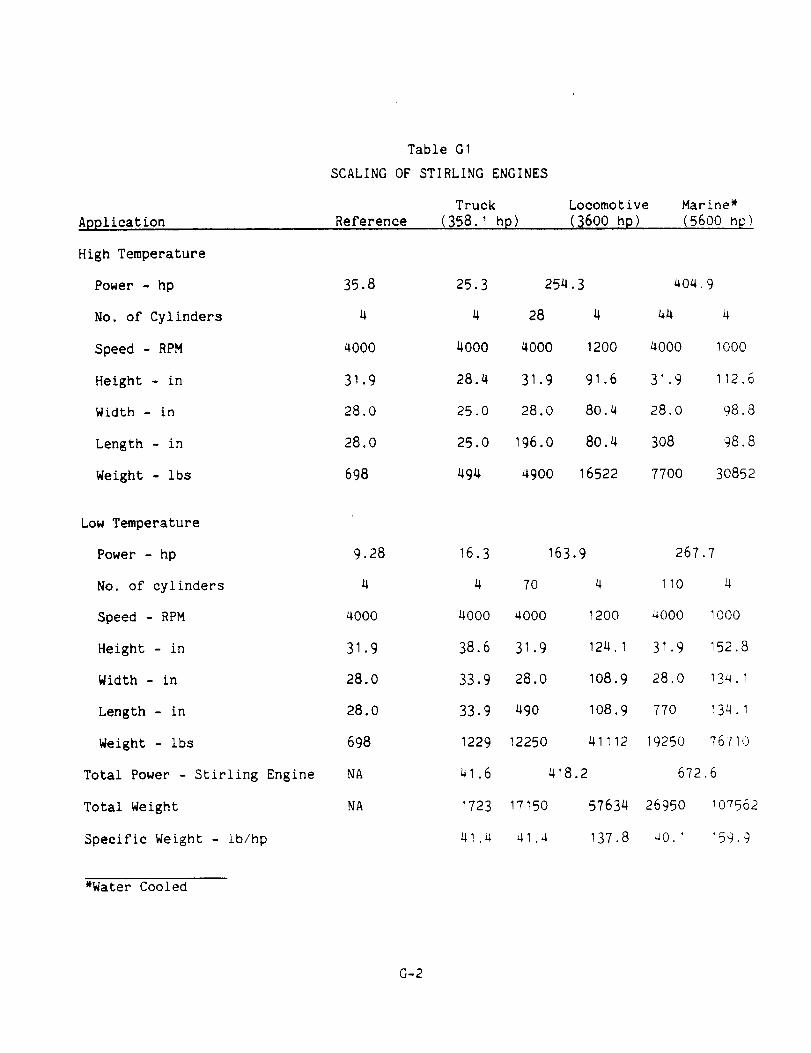
Table GI
SCALINGOFSTIRLINGENGINES
ApplicationTruck
Reference (358.1 hp)Locomot i ve(_600 hP)
Marine*(5600 rip)
High Temperature
Power - hp 35.8 25.3 254.3 404,9
No. of Cylinders 4 4 28 4 44 4
Speed - RPM 4000 4000 _000 1200 4000 1000
Height - in 31.9 28.4 31.9 91.6 31.9 112.6
Width - in 28.0 25.0 28.0 80.4 28.0 98.8
Length - in 28.0 25.0 196.0 80.4 308 98.8
Weight - ibs 698 494 4900 16522 7700 30852
9.28 16.3 163.9
4 4 70 4
4000 4000 4000 12OO
31.9 38.6 31.9 124.1
28.0 33.9 28.0 108.9
28.0 33.9 490 108.9
698 1229 12250 41112
NA 41.6 418.2
NA 1723 17150 57634
_1.4 41.4 137.8
Low Temperature
Power - hp
No. of cylinders
Speed - RPM
Height - in
Width - in
Length - in
Weight - ibs
Total Power - Stirling Engine
Total Weight
Specific Weight - ib/hp
*Water Cooled
267.7
110 4
4000 10OO
31.9 152.8
28.0 134.1
770 !34.1
19250 76710
672.6
26950 _07562
aO.1 159.9
G-2
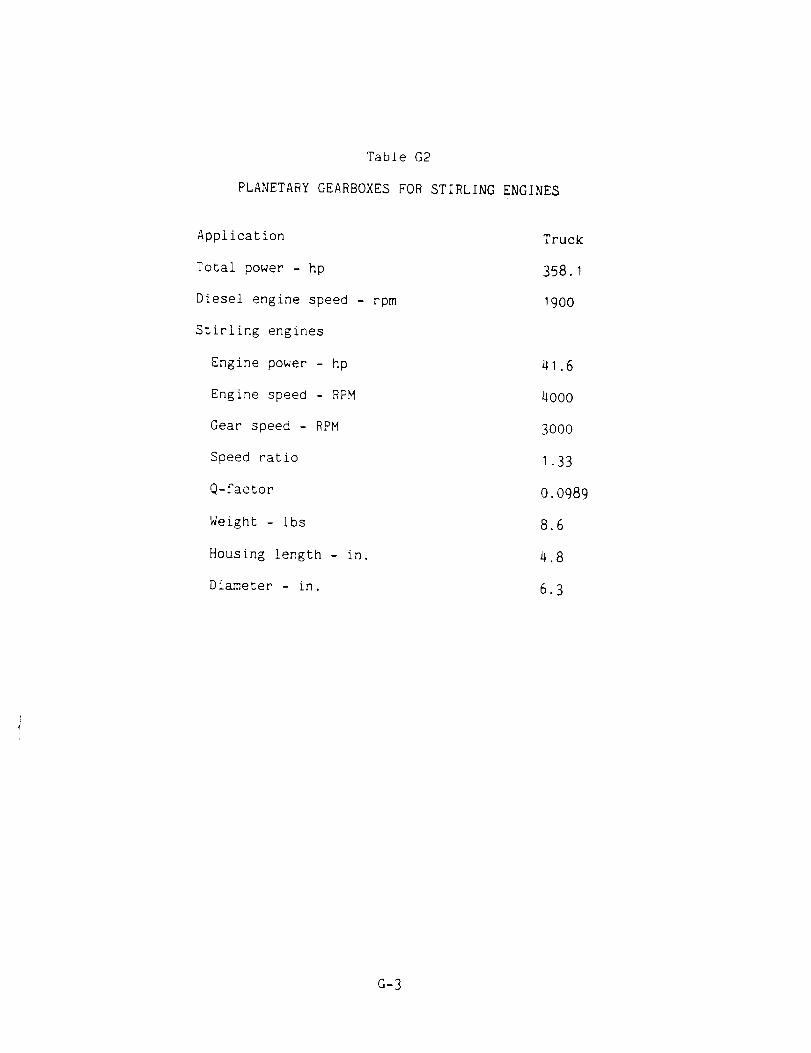
Tab±eG2
PLANETARYGEARBOXESFORSTIRLINGENGINES
Application
Total power - hp
Diesel engine speed - rpm
Stirling engines
Engine power - hp
Engine speed - RPM
Gear speed - RPM
Speed ratio
Q-factor
Weight - ibs
Housing Length - in.
Diameter - in.
Truck
358.1
19OO
41.6
4OOO
3OOO
1.33
O. O989
8,6
4.8
6.3
G-3
J. R. Hdn_m
.......... / _..._-. C,_.J),R. A. Newby
, (
....
D. L. Keairns, Manager
Chemical & Process Engineering
G-4

................................ T ............................
................. 2 Government Accession NoI 91eoort NO
4 "l'ille and Subtitle
Desizn and Evaluation of Fluidized Bed Heat
Recovery for Diesel Engine Systems
7 Aul_or(S)
J. R. Hamm
R. A. Newby
E. J. Vidt
T. E. Lippert
+ 9 Performing Orgamzation Name and Address
Westinghouse Research & Development Center
1310 Beulah Road
pittsburgh, PA [5235
12 Sponsonng Agency Name and Address
U. S. Department of Energy
Office of Vehicle & Engine R&D
Washin!_ton, D.C. 20585
3 Reclpient's Catalog NO
5 Reporl Date
JuLy 1985
6 Performing Organization Code
8 Performing Organization Report NO
10 Work Unit NO
11. Contract or Grant NO
DEN3-345
13 Type of Report and Period Covered
Contractor Report
14 Sponsoring Agency Code
DOE/NASA/0345-I
15 Supplementary Notes
?repared under Intera_ency Agreement DE-AI01-80CS50194, Project Manager
H. Hurray Bailey, Propulsion Systems Division, NASA Lewis Research Cneter,i
Cleveland, OH 44_35
; 16 Abstrac_
I A preliminary conceptual design studv was conducted to evaluate the potential of
utilizing fluidized bed heat exchangers in place of conventional counter-flow heat
!exchangers for heat recovery from adiabatic diesel engine exhaust gas streams.
Fluidized bed heat recovery systems were evaluated in three different heavy duty
transport applications: heavy duty diesel truck, diesel locomotive, and dieselmarine _ushboat. The three applications are characterized by differences in
overall power output and annual utilization.
For each application, the exhaust gas source is a turbocharged-adiabatic diesel
core. Representative subposed exhaust gas heat utilization power cvcles were
selected for conceptual design efforts including design layouts and performance
estimates for the fluidized bed heat recovery heat exchangers. The selected power
cycles were: Organic Rankine with RC-I working fluid, Turbocompound Power Turbine
with Steam Injection, and Stifling Engine.
Fuel economy improvement predictions were used in conjunction with capital cost
estimates and fuel price data to determine Dayback times for the various cases.
7hese were based on simple Dayback assumptions without considerations of
maintenance burdens or the cost of monev.
7 Key Words {SuGgested D'F Authoqs)}
Diesel Engine Economics
Heat Recovery Truck
Adiabatic Locomotive
Fluidized Bed Marine
19 Secu:ity ClassH ,of !ms reoortl
18 Distribution Statement
1 Unclassified-Unlimited
I STAR Category 85
DOE Category UC-96
!20 Securdy Classif _of Ibis page) ;21. NO. of pages
UnclassifiedUnclassified
22 Price"
r-o, sale oy !he NatlonalTecnmcal Informahon Serwce, Sormgfield, V_rgm_a 22161