Embed Size (px)
Citation preview

Design and Evaluation of an Online AnomalyDetector for Distributed Storage Systems
Xin Chen1, Xubin He2, He Guo3 and Yuxin Wang4
1Department of Electrical and Computer Engineering, Tennessee Technological University, Cookeville, TN, USA2Department of Electrical and Computer Engineering, Virginia Commonwealth University, Richmond, VA, USA
3School of Software Technology, Dalian University of Technology, Dalian, LiaoNing, China4School of Computer Science and Technology, Dalian University of Technology, Dalian, LiaoNing, China
Email: [email protected], [email protected], {guohe, wyx}@dlut.edu.cn
Abstract— Performance problems, which may stem fromdifferent system components, such as network, memory,and storage devices, are difficult to diagnose and isolatein distributed storage systems. In this paper, we present aperformance anomaly detector which is able to efficientlydetect performance anomaly and accurately identify thefaulty sources in a system node of a distributed storagesystem. Our method exploits the stable relationship betweenworkloads and system resource statistics to detect the per-formance anomaly and identify faulty sources which causethe performance anomaly in the system. Our experimentalresults demonstrate the efficiency and accuracy of theproposed performance anomaly detector.
Index Terms— performance anomaly detector, distributedstorage systems, parallel file systems
I. INTRODUCTION
Performance is critical in the study of distributed stor-age systems. Synthetic workloads or file system bench-marks are created to examine the behaviors of storagesystems. Although they are very useful in the initial stageof the design and development of storage systems, it isinsufficient for using them to analyze or resolve one com-mon problem called performance anomaly in these sys-tems [1], [2]. By performance anomaly it means that theobserved system behaviors are not expected according tothe observed system workload. For example, I/O through-put has a significant degradation given a moderate amountof I/O requests. Performance anomaly is closely relatedto either some resource-intensive processes that demandlarge portion of system resources (CPU or memory) orsome unexpected software and hardware behaviors likesoftware bugs (memory leaking) and hardware faults (badhard drive sectors), and it is common in storage systems.However, it remains a challenging task to efficiently detectperformance anomaly and accurately identify the faultysources, particularly in distributed storage systems.
Distributed storage systems usually consist of a largeamount of commodity computer nodes which may havedifferent processing capabilities. However, the overall per-formance of such systems is not determined by the fastestcomputer nodes of the systems, instead, the performanceis often limited by the capability of the slowest ones [2],[3]. So, if there exists performance anomaly in some
node of a distributed storage system, it is highly possiblethat the overall system performance will suffer negativeeffects, and such effects may be accumulated and magni-fied due to long-running and large-scale computations [2],which directly hurts the reliability and availability of thesystem. Therefore, it is necessary and crucial to equipdistributed storage systems with a tool which is ableto efficiently detect performance anomaly and accuratelyidentify the faulty sources.
As compared to the fail-stop failures [4], it is moredifficult to detect the existence of performance anomaly,and even more difficult to identify the source of theanomaly, because both dynamic workload change andmany uncertain factors such as caching and schedulingcan perplex people’s ability to understand the systembehaviors. Currently, some anomaly detecting approachesare threshold-based, which set thresholds for observedsystem metrics and raise signals when the thresholds areviolated [5], [6]. However, it is difficult to choose appro-priate thresholds for a variety of workloads and computernodes with different capabilities. Some approaches aremodel-based, which indicate performance anomaly bycomparing the observed system measurements and themodel estimations [2], [7], [8], however, their usages arelimited to the generality of the models.
This work targets the runtime diagnosis of performanceanomaly in distributed storage systems which may con-sist of heterogeneous computer nodes and experiencedynamic changed workloads. The proposed approach isself-diagnosis based, which exploits some invariants thatexist in a computer node of a distributed storage systemto detect the performance anomaly and identify faultysources of that node. Such invariants refer to the stable re-lations between workloads and system resource statisticsin faulty-free situations.
The rest of the paper is organized as follows: Section IIgives a brief discussion on related work. In section III,we describe our methodology for performance anomalydetection and identification, and present the design of ourperformance anomaly detector in section IV. Section Vdescribes our experiments and lists experimental results.Finally, we conclude the paper in section VI.
JOURNAL OF SOFTWARE, VOL. 6, NO. 12, DECEMBER 2011 2379
© 2011 ACADEMY PUBLISHERdoi:10.4304/jsw.6.12.2379-2390

II. RELATED WORK
For large-scale systems like cluster file systems, it is amajor challenge to understand system behaviors, partic-ularly unexpected behaviors. Numerous techniques havebeen proposed for detecting system anomalies. Amongthem, the simplest ones are the threshold-based techniqueswhich are a form of service level agreements (SLAs).They are very useful on the condition that their usersclearly know the key metric to monitor and the bestvalue of the thresholds in different scenarios [5], [6].Unfortunately, it is very difficult, even for an expert, tocorrectly choose the necessary metrics to monitor and setthe right values of the thresholds for different scenariosin the context of today’s complex and dynamic computersystems.
Recently, statistical learning or data mining techniquesare widely employed to construct probability modelsfor detecting various anomalies in large-scale systemsbased on some heuristics and assumptions, although theseheuristics and assumptions may only hold in some par-ticular systems or scenarios.
Kasick et al [2] developed a statistical peer-comparisondiagnosis approach to identify a faulty node in a clusterfile system. The rationale of their approach is based onthe observation that there is an obvious difference betweenthe behaviors of fault-free and faulty nodes. Kavulya etal [9] and Lan et al [8] proposed the similar approachesto detect performance problems in replicated file systemsand a cluster system, respectively. However, the validationof these approaches is based on a strong assumption ofhomogeneous hardware and workloads, which may onlyhold in a few cases.
Besides the probability models for system metrics suchas throughput, response time, etc, various relationshipsand correlations among system inputs and measurementsare also explored and modeled to detect anomalies inlarge-scale computer systems. Chen et al [7] developeda new technique, the principal canonical correlation anal-ysis (PCCA), to perform failure detection in large-scalecomputer systems which provide online Internet services.The key idea of their approach is to capture the contextualrelationships between the system inputs and their internalmeasurements which hold in fault-free scenarios, andare broken in faulty scenarios. However, it is requiredfor applying their technique that there exists a linearrelationship between the system inputs and their internalmeasurements.
Guo et al [10] and Gao et al [11] investigated the prob-abilistic correlation between flow-intensities measured atdifferent points and the one between different systemmeasurements, respectively. In this work, we also exploitthe correlation among system measurements, however, wenot only use them to detect the existence of performanceanomaly in a cluster file system, but also pinpoint thesource of the performance anomaly.
III. PERFORMANCE ANOMALY DETECTION ANDIDENTIFICATION
Given the scale and heterogeneity of distributed storagesystems, it is usually difficult to perform peer comparisonto distinguish faulty nodes from fault-free nodes, becausethe behaviors of nodes in these systems may not becomparable. In this work, a self-diagnosis based approachis adopted to detect the existence of performance anomalyand identify the faulty resources. The major advantageof the approach is its independence of the scale andheterogeneity of distributed storage systems.
The feasibility of the approach is based on two observa-tions. First, resource overuse (CPU and memory) and harddisk faults are very common in today’s distributed storagesystems according to the recent studies [12]–[19]. Theymanifest themselves at least on a computer node. Thus,if it is able to identify the system abnormal behaviorsoriginated from them by analyzing system measurementscollected on a computer node, it is not necessary toadopt centralized or peer comparison based performanceanomaly detectors, which are expensive and not practicalfor heterogeneous computer systems.
Second, there exist some relations among the systemmeasurements of a computer node in distributed storagesystems, which can be regarded as invariants when thenode works properly; but, one or more of such invariantsdoes not hold once the system experiences performanceanomaly [10], [20]. Such observation lays a strong foun-dation for performing self-diagnosis based performanceanomaly detection and faulty resource identification, be-cause performance anomaly can be detected and faultysources can be identified by simply checking whethersome invariants hold or not. Therefore, the main task isto figure out the invariants of distributed storage systemswhich can work as an indicator of performance anomaly.
A. Relation among Computer Nodes in Distributed Stor-age Systems
Before exploring the invariants of distributed storagesystems, it is necessary to understand the relation amongcomputer nodes in these systems. These distributed stor-age systems typically consist of three main components:clients, a metadata server or a server cluster (MDS), anda cluster of I/O servers or object storage devices (OSDs).They provide an inexpensive alternative utilizing Com-modity Off The Shelf (COTS) products allowing largeI/O intensive applications to be run on high performanceclusters [21]. Figure 1 presents a general architecture ofsuch systems. In this architecture, metadata operations areseparated from I/O operations, and there exist two typesof relations among system nodes: the relation between ametadata server and multiple I/O servers and the relationamong a set of I/O servers.
The first type of relation reveals a single point offailure in these storage systems. Because metadata serversare always accessed before actual data transferring, oncemetadata servers are down, clients cannot initiate any I/Ooperations. On the other side, metadata severs do not
2380 JOURNAL OF SOFTWARE, VOL. 6, NO. 12, DECEMBER 2011
© 2011 ACADEMY PUBLISHER

Metadata sever
Metadata sever
Metadata sever
I/O Server
I/O Server
I/O Server
3 U
3 U
3 U
Disk array
Disk array
Disk array
Clients
Figure 1: The general architecture of distributed storagesystems.
intervene the actual I/O processing between clients andI/O servers. Even if a metadata sever is down duringan I/O operation, the I/O operation can still be com-pleted [22]. In this work, because the concentration is I/Operformance of a distributed storage system, the relationbetween a metadata server and multiple I/O servers is notconsidered. The main focus is on studying the relationamong a set of I/O servers which is more relevant tosystem I/O performance.
In a distributed storage system which deploys filesystems like PVFS [23] and Lustre [24], data are usuallydistributed among a set of I/O servers. An I/O requestfrom a client normally consists of several sub-I/O requestscorresponding to different I/O servers. When a clientprocesses such an I/O request, it is blocked on somesyscall until it properly receives all I/O server responses,and then it can process next I/O request. Figure 2 presentsan example of an I/O request sequence from a client. Inthis example, there are total three I/O requests, and eachI/O request contains three sub-I/O requests. For example,sub-I/O request 1, 2, and 3 are of the first I/O request fromthe client, and they are issued to I/O server 1, 2, and 3,respectively. Let s1, s2, and s3 denote the request sendingrate of the client to I/O server 1, 2, and 3 respectively,and they are calculated by Formula 1.
s1 = I/O request 1 + I/O request 4 + I/O request 7t3 − t0
s2 = I/O request 2 + I/O request 5 + I/O request 8t3 − t0
s3 = I/O request 3 + I/O request 6 + I/O request 9t3 − t0
(1)
Thus, when an I/O server experiences a performanceproblem, it definitely increases the client’s response time
0 1 2 3
Figure 2: An I/O request sequence from a client.
(service time + waiting time), and as a result, s1, s2, ands3 will decrease due to the increase of t3−t0. Because therequest receiving rate of an I/O server is proportional tothe sending rate of a client, an important relation among aset of I/O servers can be concluded that once an I/O serverexperiences a performance problem (e.g., I/O performancedecrease), it receives fewer requests per time unit fromclients, so do other I/O servers.
Figure 3 shows I/O request receiving rates of a normalnode and faulty node in the presence of a performanceanomaly. It is clear that when a performance problemoccurs at a computer node, the problem not only reducesthe amount of received request per second at the faultynode, but also manifests similar symptom at other nodeswhich work properly.
Figure 3: I/O request receiving rate during a sequentialwrite. At the 41st second, disk delay faults were injectedin a computer node, which produced a performanceanomaly.
B. Invariants
Various relations among system measurements existin a computer node of a distributed storage system.Here, invariants refer to those stable relations when asystem properly works. Because I/O performance is veryimportant in distributed storage systems, in this work, thefocus is on how to discover and utilize invariants in acomputer node to detect and pinpoint I/O performanceproblems.
Because any performance problem at a computer nodemanifest symptoms of unexpected certain resource usage,because system resources are always limited, once oneor more processes occupies too many resources and doesnot release them, the executions of other processes arenegatively impacted, as the OS kernel forces the processessleep until the required resources are ready [25]. Mean-while, if a resource request from a process cannot be satis-fied immediately, the kernel also forces the process sleep.Thus, one option of utilizing invariants in a computer nodeto detect performance anomaly is to explore the relationsbetween workloads and system resource statistics.
To facilitate the discussion, how a computer nodehandles the I/O requests from clients is first studied.Figure 4 depicts an I/O request flow in a computer node.External I/O requests are first processed by the process
JOURNAL OF SOFTWARE, VOL. 6, NO. 12, DECEMBER 2011 2381
© 2011 ACADEMY PUBLISHER

Figure 4: An I/O request flows in a computer node.
of a distributed file system on the node, then the processsends the I/O requests to a hard disk, and the hard diskfinally completes those I/O requests. According to thelocation of I/O requests, the flow can be divided into twophases: P1 and P2. The former indicates the phase whereI/O requests are processed by the distributed file system,and the latter represents the phase where I/O requests arein a hard disk.
In the two phases, different resources are required forprocessing incoming I/O requests. CPU and memory aretwo major required resources in P1, as in that phase, adistributed file system transforms the I/O requests fromnetwork into the ones for the local disk. I/O requests arefinally stratified in P2, the local disk is the major requiredresource in that phase. Thus, the concentration is of ana-lyzing the relations between workloads and the statisticsof the resources listed above to look for the invariantswhich can be used to detect and pinpoint performanceproblems. By studying the trace data collected from theprevious studies on distributed storage systems [3], [22],three invariants are concluded as follows based on thestatistics listed in Table I.
Invariant for memory. If the process of a distributedfile system at a computer node works properly, withoutintervention of other processes, the total size of I/Orequests over network per second is proportional to theamount of the allocated memory per second.
Memory is allocated to hold data either after the arrivalof write requests from clients or before sending back thesatisfied read requests to clients. Thus, if a computer nodehas sufficient free memory and there are no other memoryintensive processes running on the node, the total sizeof I/O requests over network per second is proportionalto the amount of the allocated memory per second. Theinvariant is used to identify the performance problemsoriginated from memory. Figure 5 gives an example ofthe invariant.
Invariant for CPU. If the process of a distributedfile system at a computer node works properly, withoutintervention of other processes, the total size of I/Orequests over network per second is proportional to thenumber of interrupts per second.
Interrupts are generated during the processing of I/Orequests. For example, a network interface card raiseshardware interrupt to CPU after the arrival of I/O re-quests from clients; disk interrupts are triggered whenI/O requests are issued to a hard disk drive. If more I/Orequests arrive at a computer node, more interrupts aregenerated, and vice versa. Meanwhile, the generation rate
0
5
10
15
20
25
0 5 10 15 20 25
Net
wor
k re
ques
t: M
B/s
ec
Allocated memory: MB/sec
Figure 5: The relation between the total size of I/Orequests over network per second and the amount ofallocated memory per second. Data is from a trace of40 seconds I/O activities in a computer node.
0
5
10
15
20
25
0 2 4 6 8 10 12 14 16 18 20
Net
wor
k re
ques
t: M
B/s
ec
The number of interrupts: 103/sec
Figure 6: The relation between the total size of I/Orequests over network per second and the number ofinterrupts per second. Data is from a trace of 40 secondsI/O activities in a computer node.
of interrupts is closely related to the CPU time of thecorresponding process, as it requires a significant amountof CPU time to process I/O related interrupts [26]. Oncethe CPU resource is insufficient for the distributed filesystem process, fewer I/O related interrupts are generated,and the proportional relation between I/O request arrivalrate and interrupt generating rate does not hold. Theinvariant is used to identify the performance problemsoriginated from CPU. Figure 6 gives an example of theinvariant.
Invariant for disks. If a hard disk works properly andhas continued I/O requests, the average I/O request sizeis proportional to the average I/O request service time.
I/O requests issued to a hard disk usually have differentsizes. It is intuitive that larger requests require more ser-vice time than smaller requests. However, when hard disksprocess discontinued I/O requests, small requests mayrequire more service time than large requests, because thedisk seek time dominates the total request service time.Thus, when a hard disk works properly and has continuedI/O requests, the average I/O request size is proportionalto the average I/O request service time. The invariant isused to identify the performance problems originated fromhard disks. Figure 7 gives an example of the invariant. Inthe figure, the proportional relation is maintained amongI/O requests with large size, but if I/O request size is very
2382 JOURNAL OF SOFTWARE, VOL. 6, NO. 12, DECEMBER 2011
© 2011 ACADEMY PUBLISHER
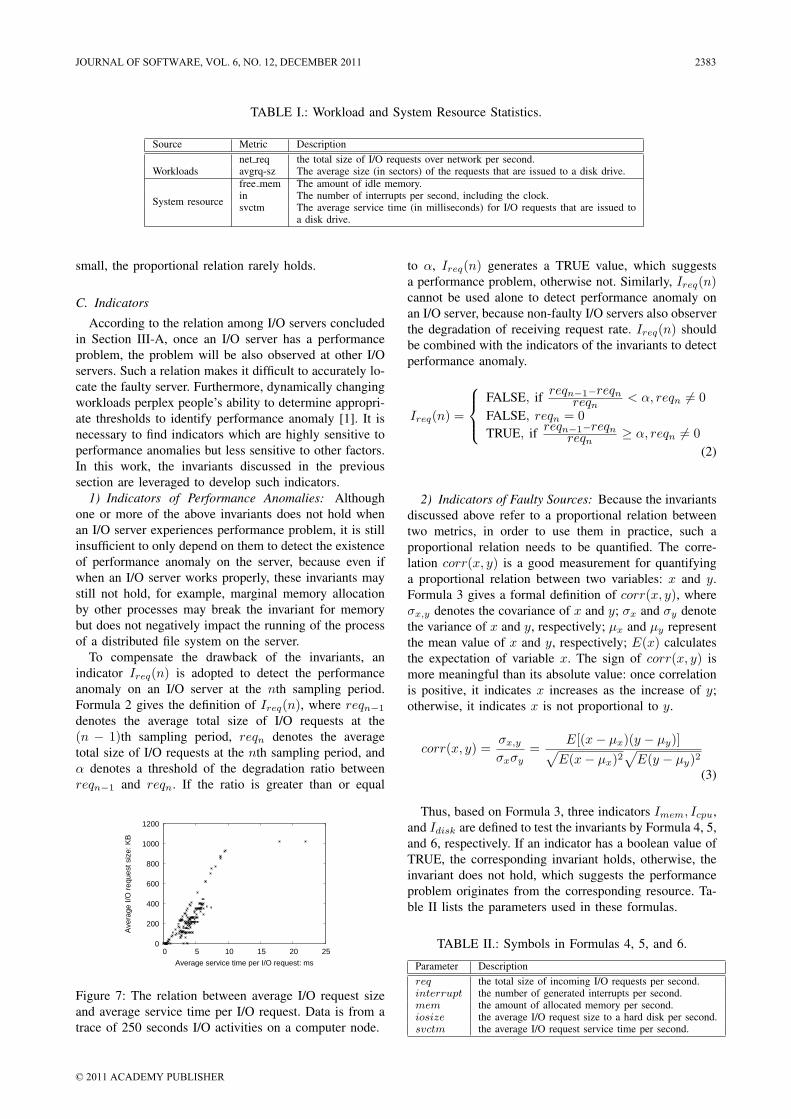
TABLE I.: Workload and System Resource Statistics.
Source Metric Description
Workloadsnet req the total size of I/O requests over network per second.avgrq-sz The average size (in sectors) of the requests that are issued to a disk drive.
System resource
free mem The amount of idle memory.in The number of interrupts per second, including the clock.svctm The average service time (in milliseconds) for I/O requests that are issued to
a disk drive.
small, the proportional relation rarely holds.
C. Indicators
According to the relation among I/O servers concludedin Section III-A, once an I/O server has a performanceproblem, the problem will be also observed at other I/Oservers. Such a relation makes it difficult to accurately lo-cate the faulty server. Furthermore, dynamically changingworkloads perplex people’s ability to determine appropri-ate thresholds to identify performance anomaly [1]. It isnecessary to find indicators which are highly sensitive toperformance anomalies but less sensitive to other factors.In this work, the invariants discussed in the previoussection are leveraged to develop such indicators.
1) Indicators of Performance Anomalies: Althoughone or more of the above invariants does not hold whenan I/O server experiences performance problem, it is stillinsufficient to only depend on them to detect the existenceof performance anomaly on the server, because even ifwhen an I/O server works properly, these invariants maystill not hold, for example, marginal memory allocationby other processes may break the invariant for memorybut does not negatively impact the running of the processof a distributed file system on the server.
To compensate the drawback of the invariants, anindicator Ireq(n) is adopted to detect the performanceanomaly on an I/O server at the nth sampling period.Formula 2 gives the definition of Ireq(n), where reqn−1
denotes the average total size of I/O requests at the(n − 1)th sampling period, reqn denotes the averagetotal size of I/O requests at the nth sampling period, andα denotes a threshold of the degradation ratio betweenreqn−1 and reqn. If the ratio is greater than or equal
0
200
400
600
800
1000
1200
0 5 10 15 20 25
Ave
rage
I/O
req
uest
siz
e: K
B
Average service time per I/O request: ms
Figure 7: The relation between average I/O request sizeand average service time per I/O request. Data is from atrace of 250 seconds I/O activities on a computer node.
to α, Ireq(n) generates a TRUE value, which suggestsa performance problem, otherwise not. Similarly, Ireq(n)cannot be used alone to detect performance anomaly onan I/O server, because non-faulty I/O servers also observerthe degradation of receiving request rate. Ireq(n) shouldbe combined with the indicators of the invariants to detectperformance anomaly.
Ireq(n) =
FALSE, if reqn−1−reqn
reqn < α, reqn 6= 0FALSE, reqn = 0TRUE, if reqn−1−reqn
reqn ≥ α, reqn 6= 0(2)
2) Indicators of Faulty Sources: Because the invariantsdiscussed above refer to a proportional relation betweentwo metrics, in order to use them in practice, such aproportional relation needs to be quantified. The corre-lation corr(x, y) is a good measurement for quantifyinga proportional relation between two variables: x and y.Formula 3 gives a formal definition of corr(x, y), whereσx,y denotes the covariance of x and y; σx and σy denotethe variance of x and y, respectively; µx and µy representthe mean value of x and y, respectively; E(x) calculatesthe expectation of variable x. The sign of corr(x, y) ismore meaningful than its absolute value: once correlationis positive, it indicates x increases as the increase of y;otherwise, it indicates x is not proportional to y.
corr(x, y) =σx,y
σxσy=
E[(x− µx)(y − µy)]√E(x− µx)2
√E(y − µy)2
(3)
Thus, based on Formula 3, three indicators Imem, Icpu,and Idisk are defined to test the invariants by Formula 4, 5,and 6, respectively. If an indicator has a boolean value ofTRUE, the corresponding invariant holds, otherwise, theinvariant does not hold, which suggests the performanceproblem originates from the corresponding resource. Ta-ble II lists the parameters used in these formulas.
TABLE II.: Symbols in Formulas 4, 5, and 6.
Parameter Descriptionreq the total size of incoming I/O requests per second.interrupt the number of generated interrupts per second.mem the amount of allocated memory per second.iosize the average I/O request size to a hard disk per second.svctm the average I/O request service time per second.
JOURNAL OF SOFTWARE, VOL. 6, NO. 12, DECEMBER 2011 2383
© 2011 ACADEMY PUBLISHER

TABLE III.: An Example of a Probability DistributionTable of P (iosize|svctm). Data is from a trace of 250seconds I/O activities in a computer node.
Average service time: msI/O request size: KB [0, 8) [8, 12) [12, )[0, 150) 100% 0 0[150, ) 85% 10% 4%
Icpu ={
FALSE, if corr(req, interrupt) < 0TRUE, if corr(req, interrupt) ≥ 0 (4)
Imem ={
FALSE, if corr(req,mem) < 0TRUE, if corr(req,mem) ≥ 0 (5)
Idisk ={
FALSE, if corr(iosize, svctm) < 0TRUE, if corr(iosize, svctm) ≥ 0 (6)
Because Idisk does not work well in the case ofdiscontinued I/O requests, in order to compensate thedrawback of Idisk, the conditional probability distributionP (iosize|svctm) is checked to confirm the value gen-erated by Idisk; as if a hard disk works stable, a stableprobability distribution has to be observed. Table III givesan example of the probability distribution. For example,if a sequence of {(80KB, 3ms), (81KB, 2ms), (82KB,4ms), (83KB, 2ms)} is observed, although Idisk generatesa FALSE value, the P (iosize|svctm)s of all pairs inthe sequence are 100% according to Table III, thus, theFALSE value of Idisk is not confirmed and a TRUEvalue is generated. In this work, once Idisk generates aFALSE value, and the corresponding P (iosize|svctm) isless than 10%, the FALSE value of Idisk is confirmed,otherwise, Idisk generates a TRUE value.
Although higher accuracy can be achieved by checkingP (iosize|svctm) for identifying disk problems than onlylooking at the proportional relation between iosize andsvctm, the major drawback of the method is the longtraining time which is required for collecting sufficientdata to calculate a dependable probability distribution. So,Idisk serves as the major indicator of disk problems in theabsence of a dependable P (iosize|svctm).
As compared to the performance problems originatedfrom memory, CPU, and hard disks, the problems fromnetwork are more difficult to diagnose, as they usuallymanifest themselves as a symptom of workload change,and it is difficult to only use the local information ofan I/O server to identify them. An indicator Inetwork isdefined by Formula 7, which combines the local infor-mation of an I/O server and the information from otherrelated I/O servers to identify the network problems. InFormula 7, In
network is a local indicator of network onan I/O server n, its TRUE value suggests there mayhave some network problem which causes the perfor-mance anomaly, but the value should be confirmed bythe external information from other I/O servers; I ′network
finally determines whether the network is a faulty sourceor not, if a TRUE value is generated by it, the source of
performance anomaly can be pinpointed to the network.{Innetwork = In
disk ∧ Inmem ∧ In
cpu ∧ Inreq, n ∈ N
I ′network = I1network ∧ I2
network ∧ · · · ∧ Innetwork, n ∈ N
(7)
IV. THE DESIGN OF THE ONLINE PERFORMANCEANOMALY DETECTOR
The online performance anomaly detector is imple-mented as a daemon process which runs at each computernode of a cluster file system. The detector sends alarmsto clients or administration nodes, when performanceanomaly is detected at a computer node. It is worthpointing out that once performance anomaly is detectedon a computer node, it is most likely that the othercomputer nodes generate alarms soon, and those alarmsmay mark other resource as faulty, meanwhile, one ormore of our invariants on the computer node may nothold any more until the performance anomaly is fixed.Thus, the alarms raised after the first alarm in a shortperiod are ignored.
Figure 8 shows the working flow of our performanceanomaly detector. The detection process is triggered whenthere is a significant degradation of req, then all indica-tors are evaluated accordingly to identify which systemcomponent is the faulty source, finally an alarm is raisedif the performance anomaly is detected.
req
disk mem cpu
FALSETRUE
AND
TRUE
FALSE
network
network
AND
TRUEFALSE
Suggests the faulty source is network.
Suggests the faulty source is either disk, memory, or CPU.
Figure 8: The working flow of the online performanceanomaly detector.
V. EXPERIMENTS
To demonstrate the efficiency of our performance de-tector, we constructed a testbed which consisted of fourcomputer nodes (1 metadata server, 3 I/O servers). Theseservers have different computation and I/O capabilities,as shown in table IV. Our detector was evaluated withsynthetic workloads on a parallel file system, PVFS. Fourfaults were injected to produce faulty situation during theevaluation: disk delay faults, network delay faults, CPUoveruse faults, and memory overuse faults. disk delayfaults introduce extra I/O request processing time in ahard disk driver; network delay faults add extra delay atan I/O server for sending every request over the network;CPU and memory overuse faults limit the available CPU
2384 JOURNAL OF SOFTWARE, VOL. 6, NO. 12, DECEMBER 2011
© 2011 ACADEMY PUBLISHER

and memory resource at a low level, respectively. Inour experiments, we adopted a sampling period of fourseconds according to our prior experience, in which foursamples were taken, one per second, and all indicatorswere evaluated at the end of the period; we set α to 50%for Ireq .
In order to measure the efficiency and accuracy of ourdetector, two metrics are defined: the detection latencyand the true positive rate. The former measures howlong our detector may take to detect the existence ofperformance anomaly after the injection of performancefaults, and the latter measures the accuracy of our detectorin terms of the percentage of correct alarms. Formula 8and 9 give the definitions of the two metrics, where ∆denotes the detection latency, Td represents the time pointat which performance anomaly is detected, Ti denotes thefault injection time point, Atd denotes the true positiverate, Ntd and Nfd represent the number of true and falsedetections, respectively.
∆ = Td − Ti (8)
Atd =Ntd
Ntd +Nfd(9)
In this section, the behaviors of our performanceanomaly detector are examined with synthetic workloadsin different faulty situations. Before the discussion of ourdetector in faulty situations, the system behaviors in fault-free situation are studied first; we focus on examiningwhether our invariants hold or not, which is of ultraimportance for the correctness of our detector.
Figure 9 shows the results of 1GB sequential writetests on PVFS in fault-free situation. In the these figures,our three invariants perfectly hold in the presence of asignificant fluctuations of external I/O request rate forboth file systems, as the values of three correlations alongthe time axis are almost positive. The only exception isin figure 9d, the correlation of iosizen and svctmn isnegative at the second sampling period. However, it isreasonable, as in the period, I/O servers just started toprocess I/O requests, hard disks may take relative longservice time for processing the first incoming I/O requestswith moderate sizes, which breaks the third invariant.
The results of 1GB sequential read tests on PVFS infault-free situation are shown in figure 10. As similar as infigure 9, the invariants for memory and CPU hold throughthe tests, but the invariant for disk does not always hold,as there is no data caching for PVFS, which results indiscontinuous I/O requests. Because there is no significantdrop of req in figure 10, even if the invariant is broken,no alarm is raised by our detector in practice.
Due to the space limit, we only discussed the resultsof write tests of the following experiments, and gave asummary of both write and read tests in section V-F.
A. Disk delay faults
This set of experiments evaluated our performanceanomaly detector in the case of disk delay faults whichdo not fail any I/O request but introduce extra I/O request
0
5
10
15
20
0 10 20 30 40 50
Net
wor
k R
eque
st: M
B/s
ec
Time: seconds
IO1IO2IO3
(a) External I/O request rate
0
0.2
0.4
0.6
0.8
1
1.2
0 2 4 6 8 10 12
Cor
rela
tion
Sampling period: 4 seconds/period
IO1IO2IO3
(b) corr(req, mem)
0
0.2
0.4
0.6
0.8
1
1.2
0 2 4 6 8 10 12
Cor
rela
tion
Sampling period: 4 seconds/period
IO1IO2IO3
(c) corr(req, interrupt)
-1
-0.5
0
0.5
1
0 2 4 6 8 10 12
Cor
rela
tion
Sampling period: 4 seconds/period
IO1IO2IO3
(d) corr(iosize, svctm)
Figure 9: 1GB sequential write on PVFS.
0
5
10
15
20
0 10 20 30 40 50
Net
wor
k R
eque
st: M
B/s
ec
Time: seconds
IO1IO2IO3
(a) External I/O request rate
0
0.2
0.4
0.6
0.8
1
1.2
0 2 4 6 8 10 12
Cor
rela
tion
Sampling period: 4 seconds/period
IO1IO2IO3
(b) corr(req, mem)
0
0.2
0.4
0.6
0.8
1
1.2
0 2 4 6 8 10
Cor
rela
tion
Sampling period: 4 seconds/period
IO1IO2IO3
(c) corr(req, interrupt)
-1
-0.5
0
0.5
1
0 2 4 6 8 10
Cor
rela
tion
Sampling period: 4 seconds/period
IO1IO2IO3
(d) corr(iosize, svctm)
Figure 10: 1GB sequential read on PVFS.
processing time in a hard disk driver. The delay was setto 50 ms for the following experiments. Figure 11 showsthe results of 1GB sequential write test on PVFS wherethe disk delay faults were introduced at the 4th samplingperiod (13rd – 16th second) at IO2.
In figure 11, although the invariants for memory andCPU of IO3 do not hold at the 3rd sampling period,req of IO3 does not have a significant drop during suchthe period which is between the 9th and 12rd second infigure 11a, thus, there was no alarm raised. In the 13rdsecond, disk delay faults were introduced at IO2, we notonly observed a sharp drop of req but also saw the FALSEvalue generated by Idisk of IO2 in the 4th sampling periodwhich includes the 13rd second time point, meanwhile, atthe same sampling period, no other invariant was broke.Thus, the performance anomaly was detected, and thefaulty source was pinpointed to the hard disk on IO2.Because each indicator generates a boolean value at theend of a sampling period, for this experiment, the latencywas ∆ = 4× 4− 13 = 3 seconds, and Atd was 100%, asthere was no false detection.
JOURNAL OF SOFTWARE, VOL. 6, NO. 12, DECEMBER 2011 2385
© 2011 ACADEMY PUBLISHER

TABLE IV.: Testbed Information.
Servername
Type CPU Memory HDD Network Card
MDS Metadataserver
P4 CPU 2.53GHz 500MB FUJITSU IDE 8GB5400rpm
1Gbps
IO1 IO server P4 CPU 2.40GHz 2026MB SEAGATE SCSI 18.3GB15000 rpm
1Gbps
IO2 IO server P4 CPU 2.40GHz 1264MB WDC IDE 40GB7200rpm
1Gbps
IO3 IO server P4 CPU 2.80GHz 1010MB WDC SATA 250G7200rpm
1Gbps
0
2
4
6
8
10
12
14
0 5 10 15 20 25 30 35 40
Net
wor
k R
eque
st: M
B/s
ec
Time: seconds
IO1IO2IO3
(a) External I/O request rate
-1
-0.5
0
0.5
1
0 2 4 6 8 10 12
Cor
rela
tion
Sampling period: 4 seconds/period
IO1IO2IO3
(b) corr(req, mem)
-1
-0.5
0
0.5
1
0 2 4 6 8 10 12
Cor
rela
tion
Sampling period: 4 seconds/period
IO1IO2IO3
(c) corr(req, interrupt)
-1
-0.5
0
0.5
1
0 2 4 6 8 10 12
Cor
rela
tion
Sampling period: 4 seconds/period
IO1IO2IO3
(d) corr(iosize, svctm)
Figure 11: Disk delay faults were injected at the 13rdsecond, and the workload was 1GB sequential write onPVFS.
B. Network delay faults
This set of experiments evaluated our performanceanomaly detector in the presence of network delay faultswhich added extra delay at an I/O server for sending everyrequest over the network. The delay was set to 50 ms inthe following experiments. Figure 12 shows the results of1GB sequential write tests on PVFS where the networkdelay faults were introduced at IO2.
In figure 12, network delay faults were injected atthe 15th second at IO2. Our detector correctly detectedthe performance problem caused by the faults at the5th sampling period. For this experiment, the detectionlatency was ∆ = 5 × 4 − 15 = 5 seconds, and the truepositive rate was Atd = 4
4+1 = 0.8, as the performanceanomaly was not detected at the 4th sampling period.
C. CPU overuse
This set of experiments evaluated our performanceanomaly detector in the case of CPU overuse faults whichmake the available CPU resource at a low level. In theset of experiments, our fault injector occupied nearly 90%CPU resource in terms of the percentage of CPU time.
Figure 13 shows the results of the results of 1GBsequential write test on PVFS where CPU overuse faultswere injected at the 19th second at IO2. Because Ireq ofIO2 generated a FALSE value at the 5th sampling period,
0
5
10
15
20
0 5 10 15 20 25 30 35 40
Net
wor
k R
eque
st: M
B/s
ec
Time: seconds
IO1IO2IO3
(a) External I/O request rate
-1
-0.5
0
0.5
1
0 2 4 6 8 10 12
Cor
rela
tion
Sampling period: 4 seconds/period
IO1IO2IO3
(b) corr(req, mem)
-1
-0.5
0
0.5
1
0 2 4 6 8 10 12
Cor
rela
tion
Sampling period: 4 seconds/period
IO1IO2IO3
(c) corr(req, interrupt)
-1
-0.5
0
0.5
1
0 2 4 6 8 10 12
Cor
rela
tion
Sampling period: 4 seconds/period
IO1IO2IO3
(d) corr(iosize, svctm)
Figure 12: Network delay faults were injected at 15thsecond, and the workload was 1GB sequential write onPVFS.
our detector did not raise an alarm. However, our detectorraised an alarm at the next sampling period, and correctlypinpointed CPU as the faulty source, as only the invariantfor CPU of IO2 was broken. For this experiment, thedetection latency was ∆ = 6× 4− 19 = 5 seconds, andthe true positive rate was Atd = 5
5+1 ≈ 0.83.
0
5
10
15
20
0 5 10 15 20 25 30 35 40
Net
wor
k R
eque
st: M
B/s
ec
Time: seconds
IO1IO2IO3
(a) External I/O request rate
-1
-0.5
0
0.5
1
0 2 4 6 8 10 12
Cor
rela
tion
Sampling period: 4 seconds/period
IO1IO2IO3
(b) corr(req, mem)
-1
-0.5
0
0.5
1
0 2 4 6 8 10 12
Cor
rela
tion
Sampling period: 4 seconds/period
IO1IO2IO3
(c) corr(req, interrupt)
-1
-0.5
0
0.5
1
0 2 4 6 8 10 12
Cor
rela
tion
Sampling period: 4 seconds/period
IO1IO2IO3
(d) corr(iosize, svctm)
Figure 13: CPU overuse faults were injected at 19thsecond, and the workload was 1GB sequential write onPVFS.
2386 JOURNAL OF SOFTWARE, VOL. 6, NO. 12, DECEMBER 2011
© 2011 ACADEMY PUBLISHER

D. Memory overuse
This set of experiments evaluated our performanceanomaly detector in the case of memory overuse faultswhich make the available memory resource at a low level.In the set of experiments, our fault injector occupied upto 90% memory resource.
Figure 14 shows the results of the results of 1GBsequential write test on PVFS where memory overusefaults were injected at the 12nd second at IO2. At the 7thsampling period, Ireq of IO2 generated a TRUE value,and the invariant for memory of IO2 was broken, analarm was raised. Because we gradually occupied systemmemory, every 100MB per second, it is reasonable thatthe negative impact of memory overuse faults cannotobserved immediately. For this experiment, the detectionlatency was ∆ = 7× 4− 12 = 16 seconds, and the truepositive rate was Atd = 3
3+4 ≈ 0.43.
0
5
10
15
20
25
0 10 20 30 40 50 60
Net
wor
k R
eque
st: M
B/s
ec
Time: seconds
IO1IO2IO3
(a) External I/O request rate
-1
-0.5
0
0.5
1
0 2 4 6 8 10 12 14 16
Cor
rela
tion
Sampling period: 4 seconds/period
IO1IO2IO3
(b) corr(req, mem)
-1
-0.5
0
0.5
1
0 2 4 6 8 10 12 14 16
Cor
rela
tion
Sampling period: 4 seconds/period
IO1IO2IO3
(c) corr(req, interrupt)
-1
-0.5
0
0.5
1
0 2 4 6 8 10 12 14 16
Cor
rela
tion
Sampling period: 4 seconds/period
IO1IO2IO3
(d) corr(iosize, svctm)
Figure 14: Memory overuse faults were injected at 12ndsecond, the workload was 1GB sequential write on PVFS.
E. Benchmark Workload
The efficiency and accuracy of the detector have beendemonstrated with synthetic workloads in different faultysituations; however, it is still necessary to examine thebehaviors of the detector with realistic workloads tocomprehensively evaluate it. In this section, a parallel I/Obenchmark, BTIO, was adopted to evaluate the detector.BTIO is a tool contained in the NAS Parallel Benchmarks(NPB), and it is used to test the output capabilitiesof high-performance computing systems, especially dis-tributed storage systems [27]. In our experiments, BTIOwas complied with four processes, these processes workcooperatively to perform I/O operations on a dedicatedstorage system.
Figures 15 shows the results of BTIO test on PVFSin fault-free situation. For the test on PVFS, the invari-ants for memory and disk held at most time throughthe experiment; however, the invariant for CPU of allI/O servers did not hold well, especially, the invariantwas frequently broken after the 115 sampling period in
Figure 15c, meanwhile, a significant drop of req wasalso observed at the same time in Figure 15a. It isbecause BTIO performed read operations which requiresfrequently synchronization among all processes after thesampling period that more CPU time was occupied forsynchronization. It is necessary to point out that therewas no value generated by Imem after the 116th samplingperiod, as there was few memory allocations after that.Because no fault was injected for the test, any alarmgenerated by the detector was marked as false detection.In the Figure 15e, there were a total of 12 alarms raisedthrough the test, thus, the true positive rate was Atd =
126126+12 = 0.91.
0
5
10
15
20
25
30
0 100 200 300 400 500
Net
wor
k R
eque
st: M
B/s
ec
Time: seconds
IO1IO2IO3
(a) External I/O request rate
-1
-0.5
0
0.5
1
0 20 40 60 80 100 120 140
Cor
rela
tion
Time: 4 seconds
IO1IO2IO3
(b) corr(req, mem)
-1
-0.5
0
0.5
1
0 20 40 60 80 100 120 140
Cor
rela
tion
Time: 4 seconds
IO1IO2IO3
(c) corr(req, interrupt)
-1
-0.5
0
0.5
1
0 20 40 60 80 100 120 140
Cor
rela
tion
Time: 4 seconds
IO1IO2IO3
(d) corr(iosize, svctm)
0
0.5
1
1.5
2
0 20 40 60 80 100 120 140
Time: 4 seconds
alarm
(e) Alarms
Figure 15: BTIO on PVFS.
1) Disk Delay Faults: This set of experiments evalu-ated the detector in the case of disk delay faults. The delaywas set to 50 ms for the following experiments. Figures 16shows the results of BTIO test on PVFS where the diskdelay faults were introduced at IO2.
In Figure 16, disk delay faults were injected at the410th second at IO2. The detector correctly detected theperformance problem caused by the faults at the 109thsampling period. The detection latency was ∆ = 109 ×4−410 = 26 seconds. The big latency was largely due tothe discontinuous workloads generated by BTIO, as therewas few incoming requests on IO3 between the 103rd and109th sampling period. In Figure 16e, the detector raisedfour false alarms before the correct one, thus, the truepositive rate was Atd = 111
111+4 ≈ 0.97.2) Network Delay Faults: This set of experiments
evaluated the detector in the case of network delay faults.The delay was set to 50 ms for the following experiments.Figure 17 shows the results of BTIO test on PVFS where
JOURNAL OF SOFTWARE, VOL. 6, NO. 12, DECEMBER 2011 2387
© 2011 ACADEMY PUBLISHER

0
5
10
15
20
25
30
0 100 200 300 400 500 600
Net
wor
k R
eque
st: M
B/s
ec
Time: seconds
IO1IO2IO3
(a) External I/O request rate
-1
-0.5
0
0.5
1
0 20 40 60 80 100 120 140 160
Cor
rela
tion
Time: 4 seconds
IO1IO2IO3
(b) corr(req, mem)
-1
-0.5
0
0.5
1
0 20 40 60 80 100 120 140 160
Cor
rela
tion
Time: 4 seconds
IO1IO2IO3
(c) corr(req, interrupt)
-1
-0.5
0
0.5
1
0 20 40 60 80 100 120 140 160
Cor
rela
tion
Time: 4 seconds
IO1IO2IO3
(d) corr(iosize, svctm)
0
0.5
1
1.5
2
0 20 40 60 80 100 120
Time: 4 seconds
alarm
(e) Alarms
Figure 16: PVFS: Disk delay faults were injected at the410th second at IO2.
the disk delay faults were introduced at IO2.In Figure 17, network delay faults were injected at the
411th second at IO2. The detector correctly detected theperformance problem caused by the faults at the 110thsampling period. The detection latency was ∆ = 110 ×4 − 411 = 29 seconds. The big latency was largely dueto the discontinuous workloads generated by BTIO, asthere was no incoming requests on IO3 between the 100thand 108th sampling period. Meanwhile, the invariant forCPU of all I/O servers were more frequently broken afterthe 100th sampling period than the normal case, whichcan be regarded as a side effect of disk delay faults. InFigure 17e, the detector raised three false alarms beforethe correct one, thus, the true positive rate was Atd =
117117+3 ≈ 0.98.
F. Summary
Table V gives a summary of experiments with syn-thetic and BTIO workloads. For synthetic workloads, thedetection latency is limited to two sampling periods (8seconds), the average true positive rate is 84%, and thereare no more than two false detections for most tests exceptthe ones of memory overuse. The main reason for the poorperformance of our detector in the experiments of memoryoveruse is that we gradually occupied system memory,our detector was insensitive to the small memory leak, assystem performance was not significantly affected until alarge portion of memory resource was leaked, thus ourdetector cannot detect immediately the faults of memoryoveruse.
0
5
10
15
20
25
30
0 100 200 300 400 500 600 700 800 900
Net
wor
k R
eque
st: M
B/s
ec
Time: seconds
IO1IO2IO3
(a) External I/O request rate
-1
-0.5
0
0.5
1
0 50 100 150 200 250
Cor
rela
tion
Time: 4 seconds
IO1IO2IO3
(b) corr(req, mem)
-1
-0.5
0
0.5
1
0 50 100 150 200 250
Cor
rela
tion
Time: 4 seconds
IO1IO2IO3
(c) corr(req, interrupt)
-1
-0.5
0
0.5
1
0 50 100 150 200 250
Cor
rela
tion
Time: 4 seconds
IO1IO2IO3
(d) corr(iosize, svctm)
0
0.5
1
1.5
2
0 20 40 60 80 100 120 140
Time: 4 seconds
alarm
(e) Alarms
Figure 17: PVFS: Network delay faults were injected atthe 411th second at IO2.
Because the workloads generated by BTIO were notcontinuous, the average detection latency in the experi-ments with BTIO is larger than the one in the experimentswith synthetic workloads. However, the average accuracyof 94% can be achieved by the detector for BTIO work-loads.
VI. CONCLUSION
In this work, we presented a performance anomalydetector which is used to detect performance anomalyand accurately identify the faulty sources in an I/O serverof cluster file systems. We concluded three invariants ofan I/O server, which referred to the stable relationshipsbetween server workloads and resource statistics whenthe server works properly. By utilizing these invariants, aperformance detector was developed, and the detector wasevaluated with synthetic and BTIO workloads on PVFSfile system in the presence of four different faulty situa-tions. Our preliminary results demonstrated the efficiencyand accuracy of the detector.
ACKNOWLEDGMENT
A preliminary version of this work was presented at the3rd International Symposium on Parallel Architectures,Algorithms, and Programming (PAAP) [28].
This research is sponsored in part by National Sci-ence Foundation grants CNS-1102629, CCF-1102605,and CCF-1102624. This work is also partially supportedby the SeaSky Scholar fund of the Dalian University ofTechnology. Any opinions, findings, and conclusions orrecommendations expressed in this material are those of
2388 JOURNAL OF SOFTWARE, VOL. 6, NO. 12, DECEMBER 2011
© 2011 ACADEMY PUBLISHER

TABLE V.: A Summary of Experiments with Synthetic Workloads.
Filesystem Workload Fault Detection Latency True positive rate # of false de-tection
PVFS
1GB write
Disk delay 3 seconds 100% 0CPU overuse 5 seconds 83% 1
Memory overuse 17 seconds 43% 4Network delay 5 seconds 80% 1
1GB read
Disk delay 7 seconds 67% 2CPU overuse 7 seconds 80% 1
Memory overuse 17 seconds 43% 4Network delay 6 seconds 80% 1
BTIO Disk delay 26 sec 97% 4Network delay 29 sec 98% 3
the author(s) and do not necessarily reflect the views ofthe funding agencies.
REFERENCES
[1] L. Cherkasova, K. M. Ozonat, N. Mi, J. Symons, andE. Smirni, “Anomaly? Application Change? or WorkloadChange? Towards Automated Detection of ApplicationPerformance Anomaly and Change,” in DSN ’08: Pro-ceedings of the International Conference on DependableSystems and Networks, June 2008, pp. 452–461.
[2] M. P. Kasick, J. Tan, R. Gandhi, and P. Narasimhan,“Black-Box Problem Diagnosis in Parallel File Systems,”in FAST ’10: Proceedings of the 8th conference on Fileand Storage Technologies, February 2010, pp. 57–70.
[3] X. Chen, J. Langston, and X. He, “An Adaptive I/OLoad Distribution Scheme for Distributed Systems,” inPMEO-UCNS’ 10: The 9th International Workshop onPerformance Modeling, Evaluation, and Optimization ofUbiquitous Computing and Networked Systems in conjunc-tion with IPDPS’10, April 2010.
[4] R. D. Schlichting and F. B. Schneider, “Fail-stop proces-sors: an approach to designing fault-tolerant computingsystems,” ACM Trans. Comput. Syst., vol. 1, no. 3, pp.222–238, 1983.
[5] E. S. Buneci and D. A. Reed, “Analysis of ApplicationHeartbeats: Learning Structural and Temporal Featuresin Time Series data for Identification of PerformanceProblems,” in SC ’08: Proceedings of the 2008 ACM/IEEEconference on Supercomputing, November 2008, pp. 1–12.
[6] H.-L. Truong, P. Brunner, T. Fahringer, F. Nerieri, R. Sam-borski, B. Balis, M. Bubak, and K. Rozkwitalski, “K-WfGrid Distributed Monitoring and Performance AnalysisServices for Workflows in the Grid,” in E-SCIENCE ’06:Proceedings of the Second IEEE International Conferenceon e-Science and Grid Computing, 2006, pp. 1–15.
[7] H. Chen, G. Jiang, and K. Yoshihira, “Failure Detectionin Large-Scale Internet Services by Principal SubspaceMapping,” IEEE Trans. on Knowl. and Data Eng., vol. 19,no. 10, pp. 1308–1320, 2007.
[8] Z. Lan, Z. Zheng, and Y. Li, “Toward Automated AnomalyIdentification in Large-Scale Systems,” IEEE Transactionson Parallel and Distributed Systems, vol. 21, pp. 174–187,2009.
[9] S. Kavulya, R. Gandhi, and P. Narasimhan, “Gumshoe:Diagnosing Performance Problems in Replicated File-Systems,” in SRDS ’08: Proceedings of the 2008 Sympo-sium on Reliable Distributed Systems, October 2008, pp.137–146.
[10] Z. Guo, G. Jiang, H. Chen, and K. Yoshihira, “TrackingProbabilistic Correlation of Monitoring Data for FaultDetection in Complex Systems,” in DSN ’06: Proceedingsof the International Conference on Dependable Systemsand Networks, June 2006, pp. 259–268.
[11] J. Gao, G. Jiang, H. Chen, and J. Han, “Modeling Proba-bilistic Measurement Correlations for Problem Determi-nation in Large-Scale Distributed Systems,” in ICDCS’09: Proceedings of the 2009 29th IEEE InternationalConference on Distributed Computing Systems, June 2009,pp. 623–630.
[12] B. Chun and A. Vahdat, “Workload and Failure Charac-terization on a Large-Scale Federated Testbed,” Intel Re-search Berkeley Technical Report IRB-TR-03-040, Novem-ber 2003.
[13] D. Oppenheimer, A. Ganapathi, and D. A. Patterson, “Whydo internet services fail, and what can be done about it?” inUSITS’03: Proceedings of the 4th conference on USENIXSymposium on Internet Technologies and Systems, 2003,p. 1.
[14] R. K. Sahoo, A. Sivasubramaniam, M. S. Squillante, andY. Zhang, “Failure Data Analysis of a Large-Scale Hetero-geneous Server Environment,” in DSN ’04: Proceedings ofthe 2004 International Conference on Dependable Systemsand Networks, June 2004.
[15] P. Yalagandula, S. Nath, H. Yu, P. B. Gibbons, andS. Seshan, “Beyond Availability: Towards a Deeper Un-derstanding of Machine Failure Characteristics in LargeDistributed Systems,” in First Workshop on Real LargeDistributed Systems (WORLDS), December 2004.
[16] B. Schroeder and G. A. Gibson, “A Large-Scale Studyof Failures in High-Performance Computing Systems,” inDSN ’06: Proceedings of the International Conference onDependable Systems and Networks, June 2006, pp. 249–258.
[17] W. Jiang, C. Hu, Y. Zhou, and A. Kanevsky, “Are disks theDominant Contributor for Storage Failures? a Comprehen-sive Study of Storage Subsystem Failure Characteristics,”in FAST’08: Proceedings of the 6th USENIX Conferenceon File and Storage Technologies, February 2008, pp. 1–15.
[18] L. N. Bairavasundaram, G. R. Goodson, B. Schroeder,A. C. Arpaci-Dusseau, and R. H. Arpaci-Dussea, “AnAnalysis of Data Corruption in the Storage Stack,” inFAST’08: Proceedings of the 6th USENIX Conference onFile and Storage Technologies, February 2008, pp. 233–238.
[19] W. Jiang, C. Hu, S. Pasupathy, A. Kanevsky, Z. Li, andY. Zhou, “Understanding Customer Problem Troubleshoot-ing from Storage System Logs,” in FAST ’09: Proceedingsof the 7th conference on File and storage technologies,February 2009, pp. 43–56.
[20] G. Jiang, H. Chen, and K. Yoshihira, “Discovering LikelyInvariants of Distributed Transaction Systems for Auto-nomic System Management,” in ICAC ’06: Proceedingsof the 2006 IEEE International Conference on AutonomicComputing, 2006, pp. 199–208.
[21] M. Placek and R. Buyya, “A Taxonomy of Dis-tributed Storage Systems,” www.cloudbus.org/reports/DistributedStorageTaxonomy.pdf.
JOURNAL OF SOFTWARE, VOL. 6, NO. 12, DECEMBER 2011 2389
© 2011 ACADEMY PUBLISHER

[22] X. Chen, J. Langston, and X. He, “Design and Evaluationof a User-Oriented Availability Benchmark for DistributedFile Systems,” in PDCS ’09: Proceedings of the 21stIASTED International Conference on Parallel and Dis-tributed Computing and Systems, November 2009.
[23] “PVFS,” March 2009, http://www.pvfs.org/.[24] “Lustre,” July 2008, http://en.wikipedia.org/wiki/Lustre
(file system).[25] D. P. Bovet and M. Cesati, “Understanding the Linux
Kernel: From I/O Ports to Process Management, 3nd”.O’Reilly Media, Inc., 2006, iSBN: 0-596-00565-2.
[26] Y. Hu, A. Nanda, and Q. Yang, “Measurement, Analysisand Performance Improvement of the Apache Web Server,”in Proceedings of the IEEE International Performance,Computing, and Communications Conference, 1999, pp.261–267.
[27] P. Wong and R. F. V. der Wijngaart, “NAS ParallelBenchmarks I/O Version 2.4,” 2003, http://www.nas.nasa.gov/News/Techreports/2003/PDF/nas-03-002.pdf.
[28] X. Chen, X. He, H. Guo, and Y. Wang, “An OnlinePerformance Anomaly Detector in Cluster File Systems,”in PAAP ’10: Proceedings of the 3rd International Sympo-sium on Parallel Architectures, Algorithms, and Program-ming, December 2010.
Xin Chen received both the MS and PhD degrees in electricalengineering from Tennessee Technological University, USA, in2007 and 2010, respectively, and his BS degree in MechanicalEngineering from Shanghai University, China in 2003. He iscurrently a system engineer at Dell Inc., Austin, Texas, USA.His research interests include computer architecture and storagesystems.
Xubin He received the PhD degree in electrical engineeringfrom University of Rhode Island, USA, in 2002 and boththe BS and MS degrees in computer science from HuazhongUniversity of Science and Technology, China, in 1995 and1997, respectively. He is currently an associate professor inthe Department of Electrical and Computer Engineering at Vir-ginia Commonwealth University. His research interests includecomputer architecture, storage systems, virtualization, and highavailability computing. He received the Ralph E. Powe JuniorFaculty Enhancement Award in 2004 and the TTU ChapterSigma Xi Research Award in 2005 and 2010. He is a seniormember of the IEEE and a member of the IEEE ComputerSociety.
He Guo received both the BS and MS degrees in computer sci-ence from Jilin University, China, in 1982 and Dalian Universityof Technology, China, in 1989, respectively. He is currently aprofessor in the Software School at Dalian University of Tech-nology. His research interests include computer architecture,virtualization, parallel computing and computer vision. He isa member of the IEEE Computer Society.
Yuxin Wang received both the BS and MS degrees in computerscience from Dalian University of Technology, China, in 1997and 2000, respectively. He is currently a lecturer in the Schoolof Computer Science and Technology at Dalian University ofTechnology. His research interests include computer architec-ture, virtualization and pattern recognition.
2390 JOURNAL OF SOFTWARE, VOL. 6, NO. 12, DECEMBER 2011
© 2011 ACADEMY PUBLISHER