Embed Size (px)
Citation preview
11
Design and Development of Ultrasonic Process Tomography
Mohd Hafiz Fazalul Rahiman1, Ruzairi Abdul Rahim2, Herlina Abdul Rahim2 and Nor Muzakkir Nor Ayob2
1Universiti Malaysia Perlis (UniMAP) 2Universiti Teknologi Malaysia (UTM)
1,2Malaysia
1. Introduction
Process tomography is a process of obtaining the plane-section images of a three-
dimensional object. Process tomography techniques produce cross-section images of the
distribution of flow components in a pipeline, and it offers great potential for the
development, and verification of flow models, and also for process diagnostic.
The measurement of two-component flow such as liquid or oil flow through a pipe is
increasingly important in a wide range of applications, for example, pipeline control in oil
exploitation, and chemical process monitoring. Knowledge of the flow component
distribution is required for the determination of flow parameters such as the void fraction,
and the flow regime.
Real-time reconstruction of the flow image is needed in order to estimate the flow regime
when it is continuously evolving. This flow image is important in many areas of industry,
and scientific research concerning liquid/gas two-phase flow. The operation efficiency of
such a process is closely related to accurate measurement, and control of hydrodynamic
parameters such as flow regime, and flow rate (Rahiman et al., 2010). Commonly, the
monitoring in the process industry is limited to either visual inspection or a single-point
product sampling assuming the product is uniformed. This approach for the determination
of fluid flow parameters of two-component flow is also known as flow imaging.
1.1 Principle overview
Ultrasonic sensors have been successfully applied in flow measurement, non-destructive
testing, and it is widely used in medical imaging. The method involves in using ultrasonic is
through transmitting, and receiving sensors that are axially spaced along the flow stream.
The sensors do not obstruct the flow. As the suspended solids’ concentration fluctuates, the
ultrasonic beam is scattered, and the received signal fluctuates in a random manner about a
mean value. This type of sensor can be used for measuring the flow velocity. Two pairs of
sensors are required in order to obtain the velocity using a cross- correlation method.
Ultrasonic sensor propagates acoustic waves within the range of 18 kHz to 20 MHz.
www.intechopen.com

Ultrasonic Waves
212
Ultrasonic wave is strongly reflected at the interface between one substance, and another. However, it is difficult to collimate, and problems occur due to reflections within enclosed spaces, such as metal pipes. There are two types of ultrasonic signals that are usually used. They are the continuous signal, and the pulsed signal. Using a continuous signal will provide continuous impact on the crystal whereas by using pulses the interval of the transmission and reception signal can be estimated. Using the ultrasonic method in the air is very inefficient due to the mismatch of the sensors’ impedance as compared with air’s acoustic impedance. New types of sensors are continually being developed, but the effective ones are expensive. The design of this sensor is critical when it needs to reduce the sensor’s ringing.
1.2 The tomography technique
The first step of a tomographic process is to generate the integral measurements using a selected sensor. The second step is to reconstruct the property field (the cross-sectional distribution of the physical properties of the multiphase media) from the measured integral values. This process is called tomographic reconstruction (Warsito et al., 1999).
There are numerous reconstruction algorithms available for tomographic reconstruction. The algorithms based on Fourier's techniques, and the algebraic reconstruction technique (ART) has been widely used in the field of medicine. However, the choice of the reconstruction algorithm is also dependent on the sensor system selected. In engineering related applications, the number of measurement is usually very small to perform a real-time measurement or limited by constraints on the sensor employed. Therefore, the reconstruction results are then further corrected using a mathematical approximation to obtain a better reconstruction.
In contrast to light or other electromagnetic waves, ultrasound needs medium to transmit through, and interrogates the physical properties (i.e. density, compressibility) of the media. Therefore, it is speculated that such a method would be appropriate for application in a medium with relatively homogeneous but high density, which is poorly penetrated by light or other electromagnetic radiation. In addition, in comparison with high-energy electromagnetic radiation, ultrasonic technique consumes much lower energy, low-cost, and simpler to use, and suitable for applications from laboratory scale to industrial plants (Williams & Beck, 1995).
2. Ultrasonic process tomography – An overview
Instrumentation systems employing a variety of ultrasonic techniques have been applied to a wide range of measurements in the chemical, and process industries (Asher, 1983). At least, eight categories of ultrasonic flow meter can be identified with flow meters of time-of-flight type now being employed in single-phase liquid, and gas flow measurement with a great deal of success. It is favoured by most industries due to the benefits as follows (Asher, 1983):
i. Ultrasonic techniques can usually be truly non-invasive. ii. It has ‘no moving parts’. iii. The radioactive materials are not involved. iv. The rapid response usually in a fraction of a second. v. The energy levels required to excite the transducers are very low, and have no
detrimental effect on the plant or the materials being interrogated.
www.intechopen.com

Design and Development of Ultrasonic Process Tomography
213
vi. A mutually compatible range of techniques can be used to determine a wide range of parameters: these include liquid level, interface position, concentration (or density), temperature, and flow-rate. Hence multiplexed electronics are feasible.
Besides, those benefits have a significant impact, and lead to the development of Ultrasonic
tomography. Ultrasonic tomography offers the advantage of imaging two-component flows,
and gives the opportunity of providing quantitative and real-time data on chemical media
within a full-scale industrial process, such as filtration, without the need of process
interruption (Warsito et al., 1999).
The major potential benefits are; it is possible to gain an insight into the actual process;
secondly, since ultrasonic tomography is capable of on-line monitoring, it has the opportunity
to develop closed-loop control systems, and finally, it can be a non-invasive, and possibly non-
intrusive system. The overall anticipated effects are improvements in product yield, and
uniformity, minimized input process material, reduced energy consumption, and
environmental impact, and the lowering of occupational exposure to plant personnel.
The popular ultrasonic sensing system is the transmission-mode, and the reflection-mode.
The transmission-mode technique is based on the measurement of the changed in the
properties of the transmitted acoustic wave, which are influenced by the material of the
medium in the measuring volume. The change of the physical properties can be the
intensity, and/or transmission time (time-of-flight). The reflection-mode technique is based
on the measurement of the position, and the change of the physical properties of wave or a
particle reflected on an interface. Similar to the reflection-mode technique there are some
techniques based on diffraction or refraction of wave at a discrete or continuous interface in
the object space.
Utilizing attenuation or time-of-flight of a transmitted energy beam such as light or acoustic waves to produce an image of multiphase flow has been attempted at an early stage. In transparent media, optical methods based on light transmission technique, and the photographical techniques has proven quite effective (Rahim et al., 2011). However, since many real reaction systems are optically opaque, an application of the elegant optical method is severely limited.
Techniques based on reflection or the scattering of optical or acoustical waves were realized by measuring the Doppler shift-frequency of the reflected or scattered signals. An example is the use of laser Doppler anemometry for in-situ measurements of velocity, fluctuating velocity, size, and concentration of particles, bubbles or droplets in multiphase systems. A corresponding example of the Doppler technique utilizing ultrasonic wave is the measurements of bubble velocity in a stirred tank, and a ferment or vessel by Broring et al., (1991).
A combination of the transmission and the reflection modes is found in acoustical imaging techniques, which are widely used in medical, and ocean engineering fields from early stages. An application of ultrasonic imaging velocimetry has been attempted by Kytomaa & Corrington (1994) to investigate a transient liquefaction phenomenon of cohesion-less particulate media. More advanced particle imaging velocimetry techniques were developed by combining the photographic technique and image processing technique or using radioactive particle tracking techniques. Examples are using particle image velocimetry
www.intechopen.com

Ultrasonic Waves
214
(PIV), particle streak velocimetry (PSV), and particle tracking velocimetry (PTV) for visualizing the flow pattern of multiphase flows (Rashidi, 1997).
2.1 The attenuation model
The attenuation process may be modelled by Lambert’s exponential law of absorption, where the ultrasonic energy intensity of transmitter and receiver are related as in Figure 1 and Equation (1), where L represents the total path length.
Fig. 1. The ultrasonic attenuation model
exp ( , )o LP P f x y dP (1)
where P = the measured sound pressure (dB), Po = the initial sound pressure (dB), L = path length in the object field (m), and f (x,y) = the attenuation function of the object field (dB/m). Because the pressure is proportional to the voltage measured by the transducer, Equation (1) can be written as Equation (2).
LRx Txv v e (2)
where vRx = the ultrasonic receiver voltage (V), vTx = the ultrasonic transmitted voltage (V),
and = the attenuation coefficient of the object field (Np/m).
As introduced above, the attenuation will critically depend upon the material through which the ultrasonic wave travels.
2.2 Scattering issues
Acoustic impedance is a ratio of acoustic pressure to acoustic volume flow, and is frequency dependent. The greater the difference in acoustic impedance at the interface, the greater will be the amount of energy reflected. At a water, and gas interface, about 99.94% of the ultrasonic energy will be reflected (Rahiman et al., 2008). However, in some cases, scattering occurs on small gas hold-ups. Small was defined as a sphere with a radius of a where the circumference of the sphere, 2πa, divided by the wavelength λ is much less than 1 (i.e. ka = 2πa/λ << 1) where k is the wave number = 2πf/c.
If ultrasonic waves propagate in a bubbly air/water with a wavelength much shorter than the gas radius a, i.e. ka >> 1, the diffraction can be ignored, and these hold-ups will act as many acoustics opacities. This is because when ka >> 1, the surface of the sphere appears as a flat surface with respect to the wavelength, and the scattering becomes the same as a reflection from a flat surface.
Po P L
f (x,y)
Object field
www.intechopen.com

Design and Development of Ultrasonic Process Tomography
215
The relationship of the simplified ultrasonic transmission model is depicted in Equation (3),
and shown graphically in Figure 2.
G C RV V V (3)
where VG is the sensor loss voltage due to the gas opacity, VC is the calibration voltage, and
VR is the receiving voltage. For measuring the concentration profile, the parameter VG is to
be resolved.
Fig. 2. The simplified ultrasound transmission model
3. The measurement system
One of the most important parts in an ultrasonic tomography system is the front-end, which
is the transducer array, and associated electronic hardware. This is important for acquiring
the data needed to produce a meaningful image. This is fundamental to the success or
failure of an acoustic imaging system. Therefore, given the object to be imaged, and the
specifications to be achieved, the design of the front-end of an acoustic imaging system
should be regarded as a first priority.
Ultrasonic transducer is a device capable of converting electrical energy into high-
frequency sound waves, and also converting sound waves back into electrical energy.
Ultrasonic transducer contains piezoelectric crystal materials that have the ability to
transform mechanical energy into electrical energy, and vice versa. In reality, when a
crystal element is pulsed with a voltage profile, a wave starts travelling from each face of
the crystal element. The vibrational mode of the crystal can therefore, only be considered
from a transient wave propagation viewpoint. Resolution and penetrating power of an
ultrasonic wave depends on the resulting wavelength of excitation inside the material in
question. Greater wavelengths or lower frequencies generally penetrate much further into
a material (Kannath & Dewhurst, 2004). Higher frequency ultrasonic excitations with
smaller wavelengths generally decay more rapidly inside a material, but resolution
capability is improved.
For the presented systems, the active element for the transducers is the wide-angle beam
ceramic piezoelectric with resonance frequency of 333 kHz. Transducer elements
employed in ultrasonic imaging arrays may be designed to produce either a narrow
focused beam or a divergent beam. The beam pattern used for two-dimensional imaging
is the cylindrically diverging or ‘fan-shaped’ beam pattern. This is to ensure a maximum
number of transducers located around the pipe circumference, which receive the directly
transmitted wave.
Transmitter Gas cavity
Ultrasound Transmission
VC VG
VR
Receiver
www.intechopen.com

Ultrasonic Waves
216
3.1 Fan-shaped beam sensor array
An example of a fan-shaped beam sensor array is shown in Figure 3, which consists of 32-
ultrasonic transceivers that is mounted on an experimental column. The transceivers enable
the transmission, and reception on the same sensor. The transmission and reception of
ultrasonic waves are, however, controlled by the electronic analogue-switches which direct
the signal to the corresponding channels.
Fig. 3. Ultrasonic transceiver sensor array
One of the significant advantages in employing ultrasonic techniques is it enables
measurement to be made without breaking into the process vessel, and therefore,
measurements can be made where for a reason of safety hygiene, continuity of supply or
cost it is not possible to break into the process vessel. However, the invasive transducers
actually contact the flow inside the pipe, for obvious reasons it is not favoured by most
industries (Sanderson & Yeung, 2002).
In Figure 3, the transmitter is modelled as a point source, which propagates within angle a
in the image plane, and the receiver is modelled as a circular arc with radius of curvature r.
The wavefronts are taken to be circular arcs of uniform ultrasonic energy. When ultrasound
is propagating in the flow medium, areas occupied by the discontinuous component block
the transmitted ultrasound. As a result, an effect analogous to the shadowing of visible light
by an opaque object can be seen in Figure 4. An example of transmitting, and receiving
ultrasonic signals is shown in Figure 5.
www.intechopen.com

Design and Development of Ultrasonic Process Tomography
217
Fig. 4. The discontinuous component viewed by the ultrasonic receiver
Fig. 5. An example of transmitting, and receiving an ultrasonic signal
In our work, a transmission-mode method emphasizing the receiver amplitude, and the
arrival time analysis has been used. Arrival time analysis is based on the simple fact that it
takes some finite time for an ultrasonic disturbance to move from one position to another
inside the experimental pipe. In Figure 5, the observation time denoted by ts was the first peak
after the time-of-flight corresponding to a straight path. By sampling amplitude of this
observation time for every receiving sensor due to projection of transmitters, the
information via transmission-mode method can be obtained. As the distance between the
transmitting sensor, and the receiving sensor increases, the ultrasound will consume longer
time-of flight to reach to the point of interest, and therefore, set out a longer observation
time. This time-of-flight may then be assumed to be proportional to the distance that they
had travelled (Moore et al. 2000).
Transmitting signal
Time, t
Voltage, V
Time-of-Flight (TOF)
ts
Multiple reflection signals
Receiving signal
www.intechopen.com

Ultrasonic Waves
218
3.2 The system block diagram
The system block diagram is shown in Figure 6. The microcontroller will generate a burst tone of a two-cycle ultrasonic pulses at 333kHz with duty-cycle of 50% at each cycle. The delay between each burst tone was 6.667ms which is for the reverberation effect delays of the receiver before the next transmitting transceiver excited. An illustration of the pulses is shown in Figure 7. The reverberation effect delays are needed to avoid overlapping echoes at the receiving transceiver due to two separate ultrasound excitation. To select the corresponding transmitting, and receiving transceivers, several analogue switches have been utilized.
Fig. 6. The ultrasonic system block diagram
Fig. 7. The burst tones generated by microcontroller
The signal generator was designed using a low-noise high-speed op-amp, TLE2141 that acts as comparator. The comparator will generate a 20Vp-p burst tone of 333 kHz. The burst tone excitation is designed so that it is long enough for transient effects but short enough for the burst to be received without multiple reflections as describe previously. The circuit is shown in Figure 8.
www.intechopen.com

Design and Development of Ultrasonic Process Tomography
219
Fig. 8. The signal generator circuit
The signal conditioning circuit consists of two components where the first component is the amplifier, and the second component is the signal processing circuit that is the sample and hold circuit. The amplifier was built using a dual-wide gain bandwidth op-amp to avoid signal distortion during amplification. The amplifier uses two stages inverting op-amp design. Both the first stage and the second stage amplifier gain were set with -150. The signal conditioning circuit is shown in Figure 9.
Fig. 9. The signal conditioning circuit
When the components to be imaged are gases, there may be no directly transmitted signals from the transmitter to the receiver because of the obstacles. By reflecting at the gas component surfaces, the receiver may still detect some signals but at a later time though because direct transmission takes the shortest path, and hence the shortest time. Thus, if the observation time is monitored, it is possible to test whether there are any objects between the transmitter, and the receiver. By sampling the signals at this observation time for every receiving transceiver, the spatial information in the measurement area can be obtained. To discriminate the exact information (information by the observation time) the sample and
www.intechopen.com

Ultrasonic Waves
220
hold method is used. A sample and hold circuit, also called a track-and-hold circuit is a circuit that captures, and holds an analogue voltage in a specific point in time under control of an external circuit (microcontroller). The operation of sample and hold is shown in Figure 10, and the circuit diagram for sample and hold is shown in Figure 11.
The holding signal is also known as the sensor value voltage will be sampled by the DAQ
using the dsPIC30F6011A IC which served as the analogue-to-digital converter as well. The
information captured by the DAQ will be processed, and send to the PC for generating the
corresponding tomography images.
Fig. 10. The sample and hold operation
Fig. 11. The sample and hold circuit
4. Image reconstruction
In this work, the tomographic images are derived by using a back projection algorithm. In order to derive this algorithm, which results in the solution to the inverse problem, the forward problem must be solved first.
4.1 The forward problem
The forward problem determines the theoretical output of each of the sensors when the
sensing area is considered to be two-dimensional. The cross-section of the pipe is mapped
onto a 64 x 64 rectangular array consisting of 4096 pixels. The forward problem can be
solved by using the analytical solution of sensitivity maps, which produces the sensitivity
matrices. Each transmitting sensor is virtually excited, and the affected pixels are taken into
account (as shown in Figure 12).
t
t
t
sample hold
Receiver signal
S&H triggering
Sampled signal
V
ts
www.intechopen.com

Design and Development of Ultrasonic Process Tomography
221
Fig. 12. The sensitivity map for projection TR25 to TR2
4.2 The inverse problem
The inverse problem is to determine from the system response matrix (sensitivity matrices),
a complex transformation matrix for converting the measured sensor values into pixel
values. It is known as the tomogram. To reconstruct the tomogram requires an image
reconstruction algorithm. The details for tomogram reconstruction are presented in the
following section.
4.3 Image reconstruction algorithm
To reconstruct the cross-section of an image plane from the projection data, the back-
projection algorithm has been employed. Most of the work in process tomography has
focused on the back-projection technique. It is originally developed for the X-ray
tomography, and it also has the advantages of low computation cost (Garcia-Stewart et al.,
2003). The measurements obtained at each projected data are the attenuated sensor values
due to object space in the image plane. These sensor values are then back projected by
multiply with the corresponding normalized sensitivity maps. The back projected data
values are smeared back across the unknown density function (image), and overlapped to
each other to increase the projection data density. The process of back-projection is shown in
Figure 13, and Figure 14.
The density of each point in the reconstructed image is obtained by summing up the
densities of all rays which pass through that point. This process may be described by
Equation 4. Equation 4 is the back-projection algorithm where the spoke pattern represents
blurring of the object in space.
1
( , ) ( cos sin )m
b j j jj
f x y g x y
(4)
www.intechopen.com
Ultrasonic Waves
222
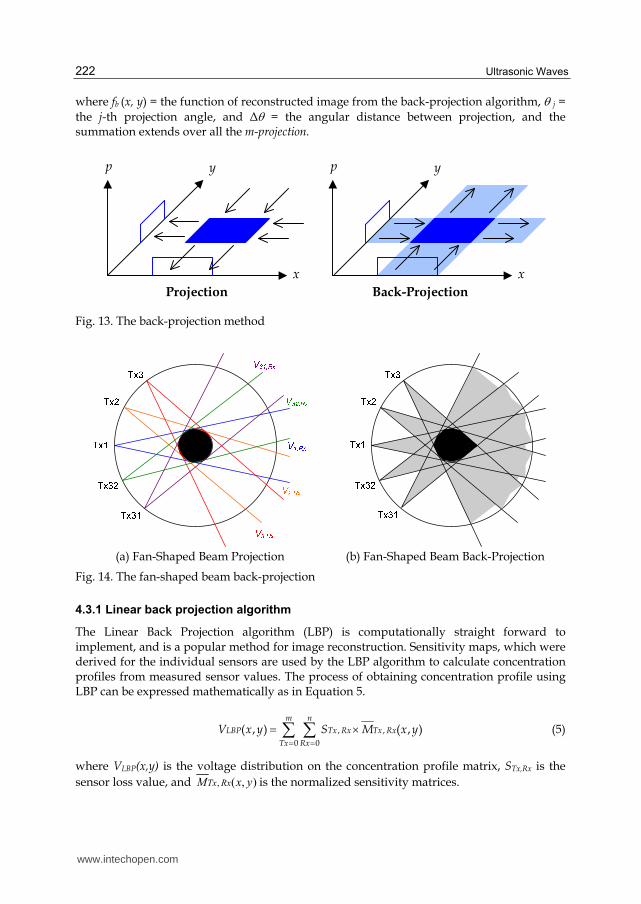
where fb (x, y) = the function of reconstructed image from the back-projection algorithm, j =
the j-th projection angle, and Δ = the angular distance between projection, and the summation extends over all the m-projection.
p
x
y
Projection
p
x
y
Back-Projection
Fig. 13. The back-projection method
(a) Fan-Shaped Beam Projection (b) Fan-Shaped Beam Back-Projection
Fig. 14. The fan-shaped beam back-projection
4.3.1 Linear back projection algorithm
The Linear Back Projection algorithm (LBP) is computationally straight forward to implement, and is a popular method for image reconstruction. Sensitivity maps, which were derived for the individual sensors are used by the LBP algorithm to calculate concentration profiles from measured sensor values. The process of obtaining concentration profile using LBP can be expressed mathematically as in Equation 5.
, ,
0 0
( , ) ( , )m n
LBP Tx Rx Tx Rx
Tx Rx
V x y S M x y
(5)
where VLBP(x,y) is the voltage distribution on the concentration profile matrix, STx,Rx is the
sensor loss value, and ),(, yxM RxTx is the normalized sensitivity matrices.
www.intechopen.com

Design and Development of Ultrasonic Process Tomography
223
4.4 Image reconstruction results
The tomogram reconstruction on three phantoms of a small gas hold-up, a large gas hold-
up, and a dual gas hold-up are shown in Figure 15, 16, and 17 respectively. The results
showed several tomograms reconstructed using; (a) LBP, and (b) LBP with a threshold ratio
of 0.55.
(a) LBP
(b) LBP (with threshold ratio 0.55)
Fig. 15. Small gas hold-up
(a) LBP
(b) LBP (with threshold ratio 0.55)
Fig. 16. Large gas hold-up
www.intechopen.com

Ultrasonic Waves
224
The tomogram in (a) showed that the LBP smears out, and introduces false images
elsewhere. As seen in Figure 15(a), 16(a), and 17(a) the reconstructed images clearly contain
qualitative information about the gas hold-up, but it is hard to distinguish the gas hold-up
boundaries. However, the tomograms in Figure 15(a), 16(a), and 17(a) showed that the area
of high gas concentration is clearly visible, and could be distinguished from the background
image, and the shapes of the reconstructed images are reasonably accurate.
A thresholding technique has been used. To obtain the optimal threshold ratio, a further
analysis has to be conducted by measuring the lowest error corresponds to the threshold
ratio. By thresholding the image with a ratio of 0.55, the reconstructed images have
tremendously improved. The smearing effects by back projection technique, which had
caused non-uniformity of background image has been eliminated, and this is shown in
Figure 15(b), 16(b), and 17(b). As a result, the information of liquid, and gas such as position,
and shape could be easily obtained.
(a) LBP
(b) LBP (with threshold ratio 0.55)
Fig. 17. Dual gas hold-up
5. Conclusions
The ultrasonic process tomography has been designed, and developed. The results show
that the system could be used to identify, and locate the size, and position of gas bubbles in
the measurement column. Experiments showed that, the image reconstructed by LBP results
in blurring the image. This blurry image is due to the nature of back projection technique.
However, the blurry image can be reduced by applying a thresholding technique. Hence, a
clearly visible gas hold-up can be identified. This information is useful, and could be used
for measuring the liquid/gas concentrations.
www.intechopen.com

Design and Development of Ultrasonic Process Tomography
225
6. Acknowledgment
Authors are grateful to the financial support by Ministry of Higher Education Malaysia, Research University Grant from Universiti Teknologi Malaysia (Grant No. Q.J130000.7123.00J04), and Universiti Malaysia Perlis.
7. References
Asher, R. C. (1983). Ultrasonic Sensors in the Chemical, and Process Industries. Journal
Science Instrument Physics. Vol. 16, Pp. 959-963
Broring, S., Fischer, J., Korte, T., Sollinger, S., & Lubbert, A. (1991). Flow Structure of The
Dispersed Gas-phase in Real Multiphase Chemical Reactor-Investigated by A New
Ultrasound-Doppler Technique. Canadian Journal of Chemical Engineering. Vol. 69,
Pp. 1247-1256
Garcia-Stewart, C. A., Polydorides, N., Ozanyan, K. B. & McCann, H. (2003). Image
Reconstruction Algorithms for High-Speed Chemical Species Tomography.
Proceedings 3rd World Congress on Industrial Process Tomography. Banff, Canada. 80-
85
Kannath, A. & Dewhurst, R. J. (2004). Real-Time Measurement of Acoustic Field
Displacements Using Ultrasonic Interferometry. Measurement Science Technology.
Vol. 15, Pp. 59–66
Kytomaa, H. K. & Corrington, S. W. (1994). Ultrasonic Imaging Velocimetry of Transient
Liquefaction of Cohesionless Particulaled Media. International Journal of Multiphase
Flow. Vol. 20, Pp. 915-926
Moore, P. I., Brown, G. J. & Stimpson, B. P. (2000). Ultrasonic Transit-Time Flowmeters
Modelled With Theoretical Velocity Profiles: Methodology. Measurement Science
Technology. Vol. 11, Pp. 1802–1811
Rahim, R. A., Rahiman, M. H. F., Zain, R. M., & Rahim, H. A. (2011). Image Fusion of Dual-
Modal Tomography (Electrical Capacitance, and Optical) for Solid/Gas Flow.
International Journal of Innovative Computing, Information, and Control. Vol. 7, No. 9,
Pp. 5119- 5132
Rahiman, M. H. F., Rahim, R. A., & Ayob, N. M. N. (2010). The Front-End Hardware
Design Issue in Ultrasonic Tomography. Sensors Journal. Vol. 10, Issue 7, Pp. 1276-
1281
Rahiman, M. H. F., Rahim, R. A., & Zakaria, Z. (2008). Design, and Modelling of Ultrasonic
Tomography for Two Component High Acoustic Impedance Mixture. Sensors &
Actuators: A. Physical. Vol. 147, Issue 2, Pp. 409-414
Rashidi, M. (1997). Fluorescence Imaging Techniques: Application to Measuring Flow, and
Transport in Refractive Index-Matched Porous Media. Chemical Engineering
Technology. Vol. 21, Pp. 7-18
Sanderson, M.L. & Yeung, H. (2002). Guidelines for the Use of Ultrasonic Non-invasive
Metering Technique. Flow Measurement, and Instrumentation. Vol. 13, Pp. 125-142
Warsito, W., Ohkawa, M., Kawata, N., & Uchida, S. (1999). Cross-Sectional Distributions of
Gas, and Solid Holdups in Slurry Bubble Column Investigated by Ultrasonic
Computed Tomography. Chemical Engineering Science. Vol. 54, Pp. 4711-4728
www.intechopen.com

Ultrasonic Waves
226
Williams, R. A., & Beck, M. S. (1995). Process Tomography-Principles, Techniques, and
Applications. Oxford, UK: Butterworth-Heinemann
www.intechopen.com

Ultrasonic WavesEdited by Dr Santos
ISBN 978-953-51-0201-4Hard cover, 282 pagesPublisher InTechPublished online 07, March, 2012Published in print edition March, 2012
InTech EuropeUniversity Campus STeP Ri Slavka Krautzeka 83/A 51000 Rijeka, Croatia Phone: +385 (51) 770 447 Fax: +385 (51) 686 166www.intechopen.com
InTech ChinaUnit 405, Office Block, Hotel Equatorial Shanghai No.65, Yan An Road (West), Shanghai, 200040, China
Phone: +86-21-62489820 Fax: +86-21-62489821
Ultrasonic waves are well-known for their broad range of applications. They can be employed in various fieldsof knowledge such as medicine, engineering, physics, biology, materials etc. A characteristic presented in allapplications is the simplicity of the instrumentation involved, even knowing that the methods are mostly verycomplex, sometimes requiring analytical and numerical developments. This book presents a number of state-of-the-art applications of ultrasonic waves, developed by the main researchers in their scientific fields from allaround the world. Phased array modelling, ultrasonic thrusters, positioning systems, tomography, projection,gas hydrate bearing sediments and Doppler Velocimetry are some of the topics discussed, which, togetherwith materials characterization, mining, corrosion, and gas removal by ultrasonic techniques, form an excitingset of updated knowledge. Theoretical advances on ultrasonic waves analysis are presented in every chapter,especially in those about modelling the generation and propagation of waves, and the influence of Goldberg'snumber on approximation for finite amplitude acoustic waves. Readers will find this book ta valuable source ofinformation where authors describe their works in a clear way, basing them on relevant bibliographicreferences and actual challenges of their field of study.
How to referenceIn order to correctly reference this scholarly work, feel free to copy and paste the following:
Mohd Hafiz Fazalul Rahiman, Ruzairi Abdul Rahim, Herlina Abdul Rahim and Nor Muzakkir Nor Ayob (2012).Design and Development of Ultrasonic Process Tomography, Ultrasonic Waves, Dr Santos (Ed.), ISBN: 978-953-51-0201-4, InTech, Available from: http://www.intechopen.com/books/ultrasonic-waves/design-and-development-of-ultrasonic-process-tomography

© 2012 The Author(s). Licensee IntechOpen. This is an open access articledistributed under the terms of the Creative Commons Attribution 3.0License, which permits unrestricted use, distribution, and reproduction inany medium, provided the original work is properly cited.