Embed Size (px)
Citation preview
- -
3
om
N A S A TECHNICAL NOTE NASA TN D-7029
d . / --I - m- 0- = =I
o- P I+= w= * w -3w
LOAN COPY: RETURN F m g
6 p AFWL (DOGL) -- 2
KIRTLAND AFB, N.h( E
DESIGN AND DEVELOPMENT OF A MICROPOUND EXTENDED, RANGE THRUST STAND (MERTS)
by Kenneth W. Stark, Thomas Dennis, Duniel McHngh, und Thomas Williams
Goddard Space Flight Center Greenbelt, M d . 20771
N A T I O N A L AERONAUTICS A N D SPACE A D M I N I S T R A T I O N W A S H I N G T O N , D. C. AUGUST 1971
7
https://ntrs.nasa.gov/search.jsp?R=19710023920 2018-04-09T14:58:09+00:00Z
TECH LlBRARY KAFB, NM
, .
OL33bb0 ~
1. Report No. 2. Government Accession No.
NASA TN D-7029 4. Ti t le and Subtitle
Design and Development of a Micropound Extended Range Thrust Stand (MERTS)
7. Authods) Kenneth W. Stark, Thomas Dennis, Daniel McHugh, and Thomas Williams
9. Performing Organization Name and Address
Goddard Space Flight Center Greenbelt, Maryland 2077 1
2. Sponsoring Agency Name and Address
National Aeronautics and Space Administration Washington, D.C. 20546
5. Supplementary Notes
6.Abstroct
3. Recipient’s Catalog No.
_
5. Report Date August 1971
~~
6. Performing Organization Code
8. Performing Organization Report No.
G1010_ 10. Work Unit No.
11. Contract or Gront No.
13. Type of Report and Period Covered
Technical Note
14. Sponsoring Agency Code
With the development of a variety of electric thrusters for spacecraft auxiliary propulsion having thrust levels in the range from a few micropounds to several millipounds, the need for a highly versatile thrust balance for use in thruster evaluation testing has become quite evident. Such a system, called the micropound extended range thrust stand (MERTS), has been developed at GSFC. This report describes in detail the design phase of all major subsystems, system diagnostic evaluations, and resulting modifications of the MERTS system. The completed MERTS system has been tested with a cesium ion engine as a calibration standard. Thrust levels ranging from 24.5 pN (5.5 plb) to 53.4 pN (12.0 plb) were measured with a maximum thrust stand error of 4.5 percent.
7. Key Words Suggested by Author 18. Distribution Statement
Thrusters, High Accuracy, Micropound Force, Torsional Thrust Unclassified-Unlimit ed Stand, Millipound Force, Extended Range
9. Security Classif. (of this report) 20. Security Clossif. (of this page) 21. No. of Pages 22. Price
Unclassified Unclassified 1 40 1 3.00

FOREWORD
It is the policy of the National Aeronautics and Space Administration to employ, in all formal publications, the international metric units known collectively as the Syst‘eme Internationale d’Unit6s and designated SI in all languages. In certain cases, however, utility requires that other systems of units be retained in addition to the SI units.
This document contains data so expressed because the use of the SI equivalents alone would impair communication. The non-SI units, given in parentheses following their computed SI equivalents, are the basis of the measurements and calculations reported here.

CONTENTS
Page
Abstract . . . . . . . . . . . . . . . . . . . . . . . . . . . . . . . . . . 1
..Foreword. . . . . . . . . . . . . . . . . . . . . . . . . . . . . . . . . . ll
List of Symbols . . . . . . . . . . . . . . . . . . . . . . . . . . . . . . . V
I. INTRODUCTION . . . . . . . . . . . . . . . . . . . . . . . . . . . . 1
11. SYSTEMCONCEPT . . . . . . . . . . . . . . . . . . . . . . . . . . . 2
111. SYSTEM DESIGN AND ANALYSIS . . . . . . . . . . . . . . . . . . . . . 5
A. M e c h a n i c a l . . . . . . . . . . . . . . . . . . . . . . . . . . . . . 5
B. Electrical. . . . . . . . . . . . . . . . . . . . . . . . . . . . . . 18
IV. DIAGNOSTIC EVALUATION AND MODIFICATIONS . . . . . . . . . . . . . . 33
V. PERFORMANCE RESULTS . . . . . . . . . . . . . . . . . . . . . . . . 36
VI. CONCLUSIONS AND RECOMMENDATIONS . . . . . . . . . . . . . . . . . 39
References . . . . . . . . . . . . . . . . . . . . . . . . . . . . . . . . . 40
iii


LIST OF SYMBOLS
A plate area [m2 (in.2 11
al distance from axis of rotation to thruster [m (in.)]
a2 distance from axis of rotation to measurement [m (in.)]
B flux density [Wb/m2 (kilolines/in.2 )]
C capacitance (pF)
‘d maximum distance of fibers from neutral axis [m (in.)]
d arc deflection [m (in.)]
E Young’s modulus of elasticity [N/m2 (lb/in.2 )]
c.g. eccentricity [m (in.)]
force [N (Ib)]
force on beam due to force coil [N (lb)]
force applied to beam from thruster [N (lb)]
damping coefficient [N-m-s (in.-lb-s)]
forcing frequency
acceleration of gravity [9.8 m/s2 (386 in./s2)]
moments of inertia of cross-sectional area [m4 (in.4 )I
current supplied to force coil (0.05 A full scale)
torsional beam moment of inertia [3.65 N-m-s2 (32.3 lb-in.-s2)]
V
I ~ , , . . . ,. , , . . . ..... - - .. .- i . - . . - . - . . .

M.S.
m
N
Y
S
' b
T
TB
TT
t
V
W
Y
gain constant of force coil N/A (lb/A)
gain constant of current source (0.01 A/V)
spring constant of both pivots [N-m/rad (lb-in./rad)]
gain constant of sensor (Vfrad)
capacitor plate gap, null position [m (in.)]
capacitor plate gap, off null position [m (in.)]
capacitor plate gap, off null position [m (in.)]
bending moments [N-m (lb-in.)]
margin of safety
mass [kg (slug)]
number of coil turns
radius [m (in.)]
Laplace operator
bending stress [N/m2 (1b/h2) I
torque [N-m (lb-in.)]
net torque applied to beam [N-m (lb-in.)]
torque on beam due to force coil [N-m (lb-in.)]
torque on beam due to thruster [N-m (lb-in.)]
time (s)
sensor output voltage (5 V full scale)
concentrated load [N (lb)]
deflection due to load [m (in.)]
vi

I
Y1
y2
z
P
E
e
I-C
I-CO
7
vertical distance from c.g. to upper pivot [m (in.)]
vertical distance from c.g. t o lower pivot [m (in.)]
eddy current damper plate thickness [m (in.)]
angle of tilt of structure [rad (deg)]
permittivity
angle of rotation (rad)
cyclic variation of displacement
amplitude of displacement
damping ratio
electrical conductivity
time constant (s)
forced angular frequency (rad/s)
natural frequency (rad/s)
vii
DESIGN AND DEVELOPMENT OF A MICROPOUND EXTENDED RANGE THRUST STAND (MERTS)
by Kenneth W. Stark Thomas Dennis Daniel McHugh
and Thomas Williams
Goddard Space Flight Center
I. INTRODUCTION
When thrusts in the pound range are measured, extraneous noise inputs to the measuring instrument exert a relatively minor influence on the accuracy of the thrust-sensing device. However, as thrust levels approach the low millipound region, their magnitudes approach those generated by building vibrations, highway traffic, personnel, ocean tides, and other such every day occurrences which are normally neglected and not considered. In some cases these effects produce forces that are greater than the output of certain thrusters.
Through the years, in an attempt to measure these small thrusts, several types of thrust stands have been built, among which were the torsional wire platform and the linear motion stand. Each, however, exhibited one or more operational characteristics that limited its usefulness for testing complete flight thruster systems, characteristics such as excessive platform oscillations, time-consuming null-balancing and zeroing techniques, difficult calibration methods, inability to support complete thruster flight systems, questionable accuracy, sensitivity to extraneous noise inputs, lack of enough ruggedness to be treated as laboratory test equipment, and limited thrust readout range. In addition, it was required that the testing system provide electrical, mechanical, and thermal interfaces equivalent to those provided by a spacecraft. Consequently, a program was initiated at GSFC to design and develop a thrust stand system with the following design objectives:
(1) Thrust measuring capability of from 4.4 pN (1 plb) to 222 mN (50 mlb) without mechanical or electrical modifications (50,000:1 dynamic range).
(2) Capability of supporting thrust system weights to 133 N (30 Ib).
1

( 3 ) Resolution of 5 percent.
(4) In situ system calibration.
(5) In situ balancing capability.
(6) Provision of electrical interfaces (power, command, and telemetry) that duplicate spacecraft interfaces.
The micropound extended range thrust stand (MERTS) system design, which has evolved during an extended period of development, incorporates the following characteristics:
(1 ) The system is completely frictionless. The only physical contact w i t h ihe balance beam is through two flexural pivots. The pivots provide the required low torsional spring constant while at the same time providing the required load-carrying capability.
(2) The beam angular displacement is sensed by a differential plate capacitor
( 3 ) Three ranges of thrust measurement are provided: 4.4 pN (1 .O plb) to 445 pN (100 plb), 445 pN (100 plb) to 8.9 mN (2 mlb), and 8.9 mN (2 mlb) to 222 mN (50 mlb). For the upper two ranges, the system operates in a null-balancing mode.
(4) Power is supplied to the beam through the flexural pivots.
(5) Both electromagnetic and eddy-current damping are provided.
(6) A telemetry system is used to obtain sensor data from the balance and the thruster system.
(7) Thruster system commands are activated through an optical link.
II. SYSTEM CONCEPT
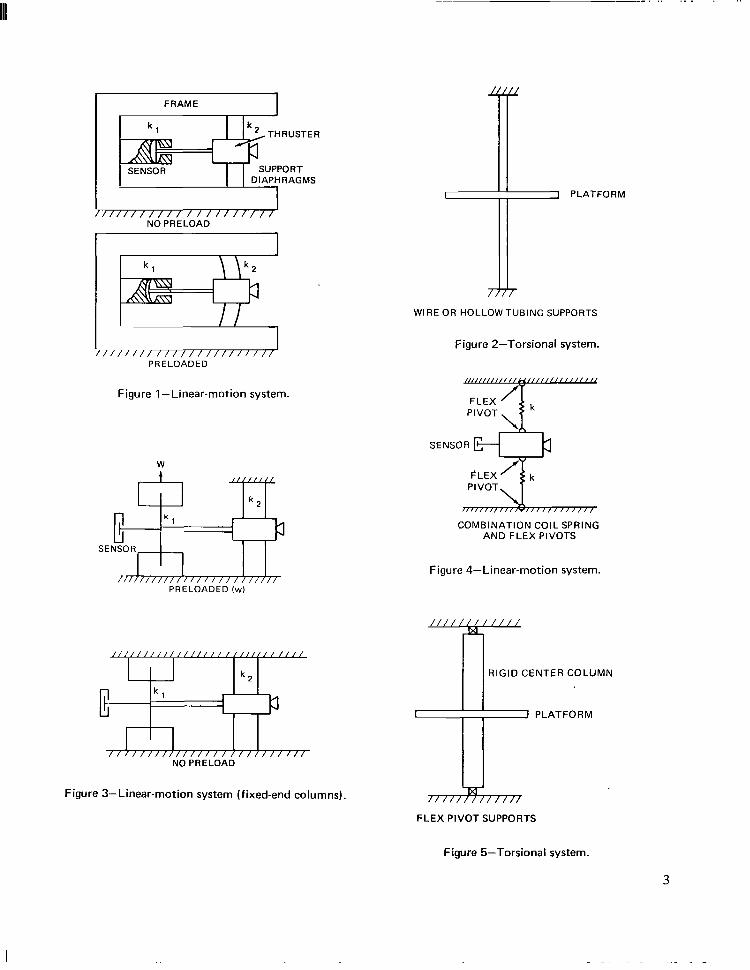
Several system configurations were investigated before a torsional flexural pivot design was chosen. Altogether, eight techniques for sensing the lowest force were considered, consisting of linear displacement with and without preload (Figure l ) , torsional with hollow tubing and wire supports (Figure 2), fixed-end columns with and without axial end preload (Figure 3), combination of flexural pivots and coil springs (Figure 4), and, finally, flexural pivots alone (Figure 5).
All but the last two approaches involved limitations serious enough to preclude further consideration. Some of the more serious limitations were sensitivity to temperature variations requiring temperature controls to within 0.003 K O (0.006 F O ) , balancing instability, and sensitivity to axial preload variations.
2
. .. ... . . ..
I FRAME I
I / / / / / / / / / / / / / / / / / / //1
NO PRELOAD
//////////I////////////PRELOADED
Figure I-Linear-motion system.
W
PRELOADED (w)
NO PRELOAD
I 1 PLATFORM
WIRE OR HOLLOWTUBING SUPPORTS
Figure 2-Torsional system.
FLEX ’
SENSOR
PIVOT,
COMBINATION COIL SPRING AND FLEX PIVOTS
Figure 4-Linear-motion system.
Figure 3-Linear-motion system (fixed-end columns).
FLEX PIVOT SUPPORTS
Figure 5-Torsional system.
3
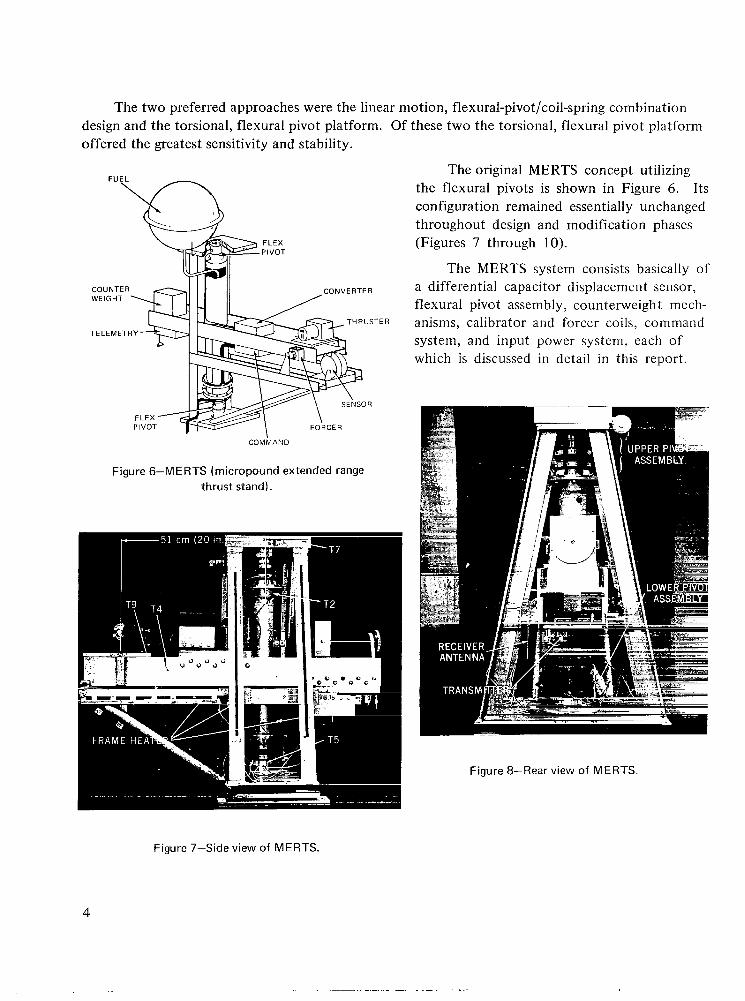
The two preferred approaches were the linear motion, flexural-pivot/coil-spring combination design and the torsional, flexural pivot platform. Of these two the torsional, flexural pivot platform offered the greatest sensitivity and stability.
COUNTER CONVERTER WEIGHT
TELEMETRY
FORCER
COMLAND
Figure 6-MERTS (micropound extended range thrust stand).
Figure 7-Side view of MERTS.
The original MERTS concept utilizing the flexural pivots is shown in Figure 6. Its configuration remained essentially unchanged throughout design and modification phases (Figures 7 through 10).
The MERTS system consists basically of a differential capacitor displacement sensor, flexural pivot assembly, counterweight mechanisms, calibrator and forcer coils, command system, and input power system, each of which is discussed in detail in this report.
Figure 8-Rear view of MERTS.
4
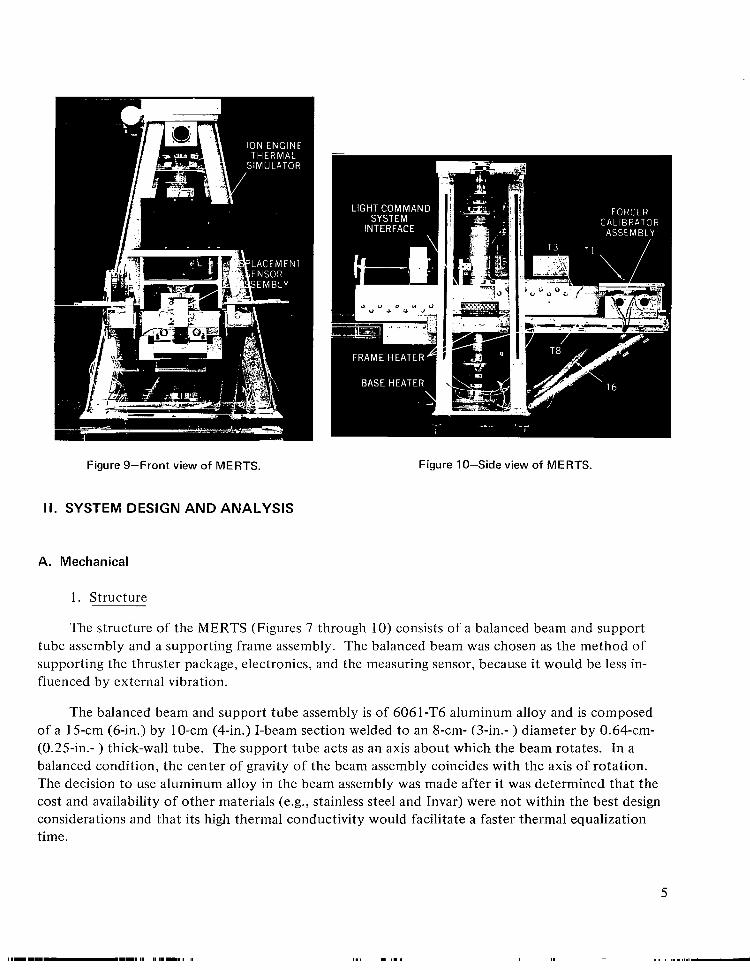
Figure 9-Front view of MERTS.
II. SYSTEM DESIGN AND ANALYSIS
A. Mechanical
1. Structure
Figure 10-Side view of MERTS.
The structure of the MERTS (Figures 7 through 10) consists of a balanced beam and support tube assembly and a supporting frame assembly. The balanced beam was chosen as the method of supporting the thruster package, electronics, and the measuring sensor, because it would be less influenced by external vibration.
The balanced beam and support tube assembly is of 6061-T6 aluminum alloy and is composed of a 15-cm (6-in.) by 1O-cm (4-in.) I-beam section welded to an 8-cm- (3-in.- ) diameter by 0.64-cm(0.25-in.- ) thick-wall tube. The support tube acts as an axis about which the beam rotates. In a balanced condition, the center of gravity of the beam assembly coincides with the axis of rotation. The decision to use aluminum alloy in the beam assembly was made after it was determined that the cost and availability of other materials (e.g., stainless steel and Invar) were not within the best design considerations and that its high thermal conductivity would facilitate a faster thermal equalization time.
5

The supporting frame assembly is an A-frame-shaped structure of 606 1-T6 aluminum alloy designed with an upper and lower mounting plate for pivot support. The triangular A-frame was chosen due to its inherent structural stiffness. The legs of the A-frame assembly are T-sections welded to the lower base and bolted to the upper. Attached to the legs are two parallel I-beams (Figure 9) for supporting mechanical and electrical equipment in proximity to the balanced beam.
A critical factor in the design of the MERTS structure was the need to minimize the deflection of the beam assembly under loaded conditions (i.e., with the thruster package and necessary electronics in place) so as not to affect detrimentally the measurement of thrust.
The maximum bending stress in a loaded beam is given by
Sb =- ‘d I ’
and for a cantilever intermediate-loaded beam, the maximum bending moments and maximum deflection are given by
M = Wa, (2)
and
For a thruster package and electronics weighing 133 N (30 lb) and located 5 1 cm (20 in.) from the axis of rotation, the maximum bending moment is
M = 68 N-m (600 lb-in.).
If the measurement is 61 cm (24 in.) from the axis of rotation, the deflection at the measurement is
y = 0.0099 cm (0.0039 in.).
The maximum stress is then
Sb = 3.10 X IO6 N/m2 (450 Ib/in.2).
With a yield strength for 6061-T6 of 2.8 X lo8 N/m2 (40,000 1b/in2),the margin of safety in bending is
M.S. = 88.
6
2. Beam Natural Frequency __ ~ -~
Because the flexural pivots provide the low torsional spring constant necessary to obtain the angular deflection required for thrust measurement and because of the large mass moment of inertia of the beam, the torsional natural frequency of the rotational assembly will be relatively low.
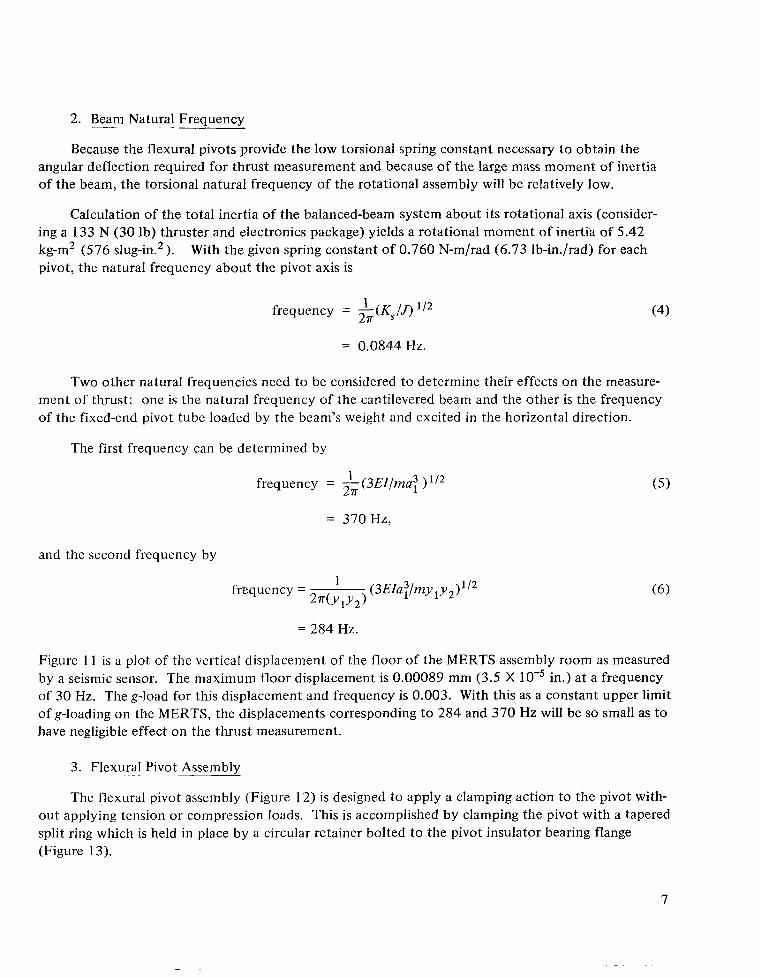
Calculation of the total inertia of the balanced-beam system about its rotational axis (considering a 133 N (30 Ib) thruster and electronics package) yields a rotational moment of inertia of 5.42 kg-m2 (576 slug-in.*). With the given spring constant of 0.760 N-m/rad (6.73 Ib-in./rad) for each pivot, the natural frequency about the pivot axis is
frequency = 2;;(Ks/J>' I 2 (4)1
= 0.0844 Hz.
Two other natural frequencies need to be considered to determine their effects on the measurement of thrust: one is the natural frequency of the cantilevered beam and the other is the frequency of the fixed-end pivot tube loaded by the beam's weight and excited in the horizontal direction.
The first frequency can be determined by
1frequency = -(3EI/ma: ) ' I2 (5)2n
= 370Hz,
and the second frequency by
= 284 Hz.
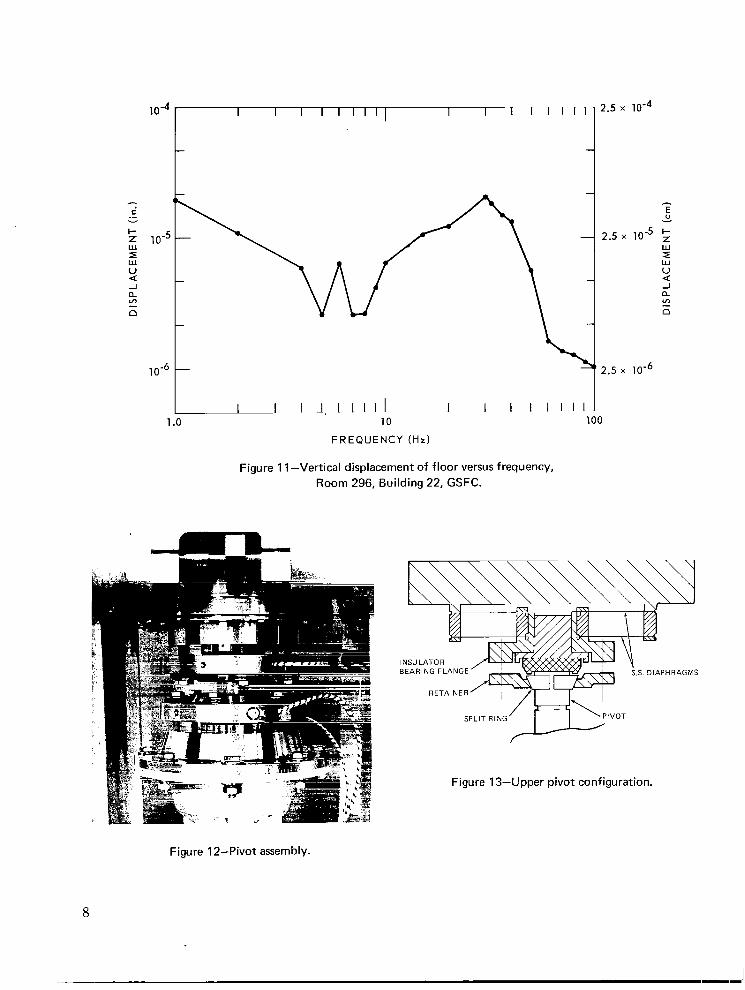
Figure 1 1 is a plot of the vertical displacement of the floor of the MERTS assembly room as measured by a seismic sensor. The maximum floor displacement is 0.00089 mm (3.5 X 10⁻⁵ in.) a t a frequency of 30 Hz. The g-load for this displacement and frequency is 0.003. With this as a constant upper limit of g-loading on the MERTS, the displacements corresponding to 284 and 370 Hz will be so small as to have negligible effect on the thrust measurement.
3. Flexural Pivot Assembly~~~.
The flexural pivot assembly (Figure 12) is designed to apply a clamping action to the pivot without applying tension or compression loads. This is accomplished by clamping the pivot with a tapered split ring which is held in place by a circular retainer bolted to the pivot insulator bearing flange (Figure 13).
7
I I I I I I I T I I I T I I I I
I I 1 - 1 . I l l 1 1 1 1 I I 1 1 1 1 .o 10
FREQUENCY (HZ)
Figure 1 1-Vertical displacement of floor versus frequency, Room 296, Building 22, GSFC.
INSULATOR / T u BEARING FLANGE
2.5
E 0 v
2.5 IO-^ 5 wI w U Q -1 a I? 0
2.5 x
100
2,s. DIAPHRAGMS
s P m R ~ i ' ~ l v o T
Figure 1 3 4 p p e r pivot configuration.
Figure 12-Pivot assembly.
8
ROTATION (rad)
0.017 0.1 t 1
t t
0.025 5 -I I-
I-Z Z w 0.001 0.0025
4 /
// i
R O T A T I O N (dep)
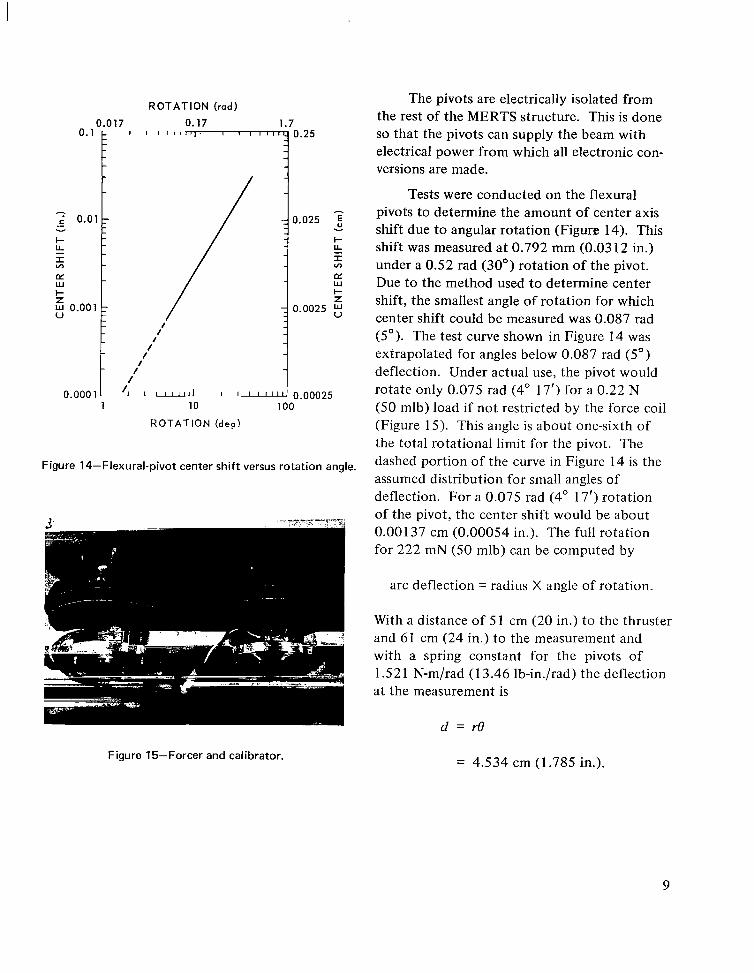
Figure 14-Flexural-pivot center shift versus rotation angle.
Figure 15-Forcer and calibrator.
The pivots are electrically isolated from the rest of the MERTS structure. This is done so that the pivots can supply the beam with electrical power from which all electronic conversions are made.
Tests were conducted on the flexural pivots to determine the amount of center axis shift due to angular rotation (Figure 14). This shift was measured at 0.792 mm (0.0312 in.) under a 0.52 rad (30") rotation of the pivot. Due to the method used to determine center shift, the smallest angle of rotation for which center shift could be measured was 0.087 rad (5"). The test curve shown in Figure 14 was extrapolated for angles below 0.087 rad (5") deflection. Under actual use, the pivot would rotate only 0.075 rad (4" 17') for a 0.22 N (50 mlb) load if not restricted by the force coil (Figure 15). This angle is about one-sixth of the total rotational limit for the pivot. The dashed portion of the curve in Figure 14 is the assumed distribution for small angles of deflection. For a 0.075 rad (4" 17') rotation of the pivot, the center shift would be about 0.00137 cm (0.00054 in.). The full rotation for 222 mN (50 mlb) can be computed by
arc deflection = radius X angle of rotation.
With a distance of 5 1 cm (20 in.) to the thruster and 61 cm (24 in.) to the measurement and with a spring constant for the pivots of 1.521 N-m/rad (13.46 lb-in./rad) the deflection at the measurement is
d = re
= 4.534 cm (1.785 in.).
9
V
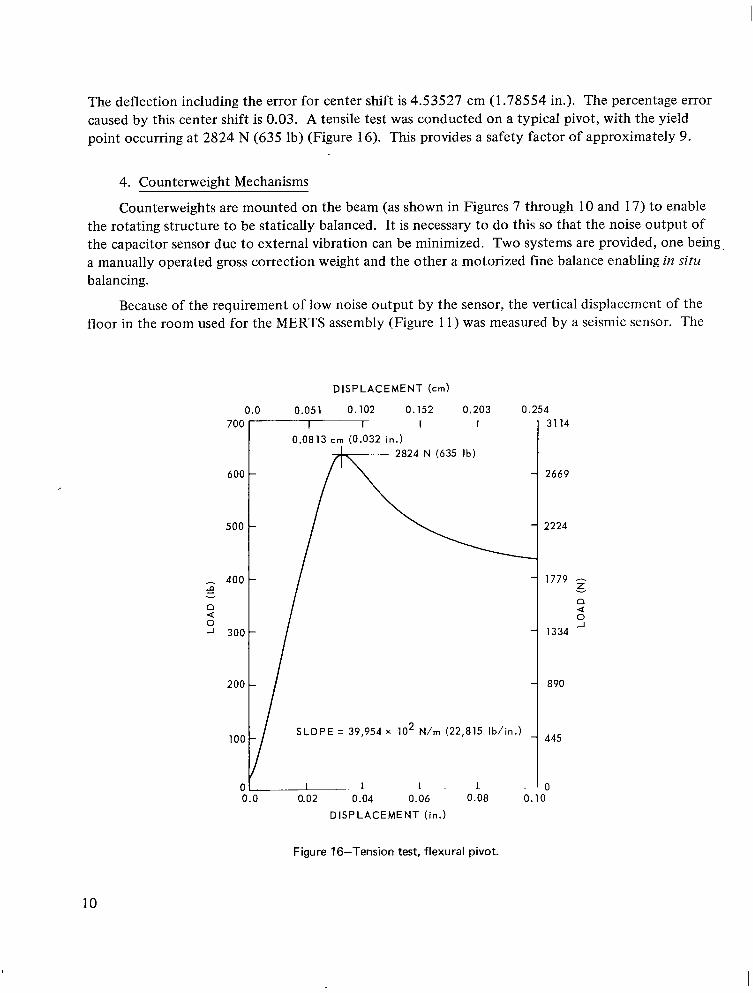
The deflection including the error for center shift is 4.53527 cm (1.78554 in.). The percentage error caused by this center shift is 0.03. A tensile test was conducted on a typical pivot, with the yield point occurring at 2824 N (635 lb) (Figure 16). This provides a safety factor of approximately 9.
4. Counterweight Mechanisms
Counterweights are mounted on the beam (as shown in Figures 7 through 10 and 17) to enable the rotating structure t o be statically balanced. It is necessary to do this so that the noise output of the capacitor sensor due t o external vibration can be minimized. Two systems are provided, one being a manually operated gross correction weight and the other a motorized fine balance enabling in situ balancing.
Because of the requirement of low noise output by the sensor, the vertical displacement of the floor in the room used for the MERTS assembly (Figure 1 1 ) was measured by a seismic sensor. The
DISPLACEMENT ( c m )
0.0 0.051 0.102 0.152 0.203 0.254 700 v f I 31 14
0.0813 c m (0.032 in.)
600 2669
500 2224
- 400 1779 11 v v
nn 66 00 -I -I 300 1334
200 890
1oc SLOPE = 39,954 x lo2 N/m (22,815 Ib I in.1
445
1 0.04 0.06 0.08 0.10
C 0.0
1i0.02
DISPLACEMENT
I
(in.)
. I 0
Figure 16-Tension test, flexural pivot.
10

become
lower cutoff frequency of this instrument was 1.0 Hz. It was assumed for purposes of calculation that this displacement measurement is the maximum displacement in both the horizontal and vertical directions that will excite the MERTS. This means the beam must be balanced accurately enough that the above displacement of the base will not adversely affect the thrust reading. The maximum allowable deflection at the sensor that will not affect the thrust reading is 0.025 pm (1.O X 10-6in.) [3 percent of 4.4 PN (1 ~ 1 b ) l .
To determine the effects of unbalance, it Figure 17-Fine-balance mechanism. is assumed that the c.g. of the beam lies a very
small distance (e < 1 cm) off the axis of rotation. Then, the moments of inertia given by
J = 7 + me2
J = 7.
0
The torque acting on the beam due to the vibration input is
T = J e ,
where is the angular acceleration. Also, when a torque is applied to the beam, the flexural pivots cause a restoring torque proportional to the displacement, or
T = KsO . (91
Equating the sum of the torques to zero for static equilibrium yields
j 6 + KsO + T( t ) = 0 ,
where T ( t )is an applied torque that is a function of time:
T( t ) = To sin ut ,
The solution to the above differential equation is
11

e = Toa;K, sin ut ,
w; - w2
'where on= the system.
' is the natural angular frequcncy of the system and w is the forced frequency of
If the above motion is caused by a steady-state input to the base defined by
p = po sin w t ,
where po is the amplitude of displacement, then the applied force at the base is
Fo = -mpow2
and the torque on the beam due to eccentricity is
To = Foe
= -mepow2 .
Substituting for 0, and To in Equation 12 results in
mepow2 6 = (Jw2 - K ) sin ut.
F o r O m a x , s i n w t =1 anddmax=azomax.Therefore,
mepoa2w2-d m a x - Jw2 - K,
If the motion dmaxis limited to 2.5 X IO-* m ( 1 0- in.), the amount of unbalance becomes a function of frequency and base displacement:
where
w = 2"fr
12
1 I I I I 1 I l l 1 1 -1 I I I I I I I I I l l 1.6
-P ’
-C._ W W l Z Q-I Q m Z 3 U 0 I-Z 3 0I Q I 3 z-X QI
I
BALANCE BEAM TO < 0.05 N-m (0.4 in.-lb)
1.o 10 FREQUENCY (HL)
1.4 2 v
w U1 .1 z 6 J 4 a0.9 z 3 U 0
0.7 5 30 I
0.5 3 -I X
0.2 QI
0 I
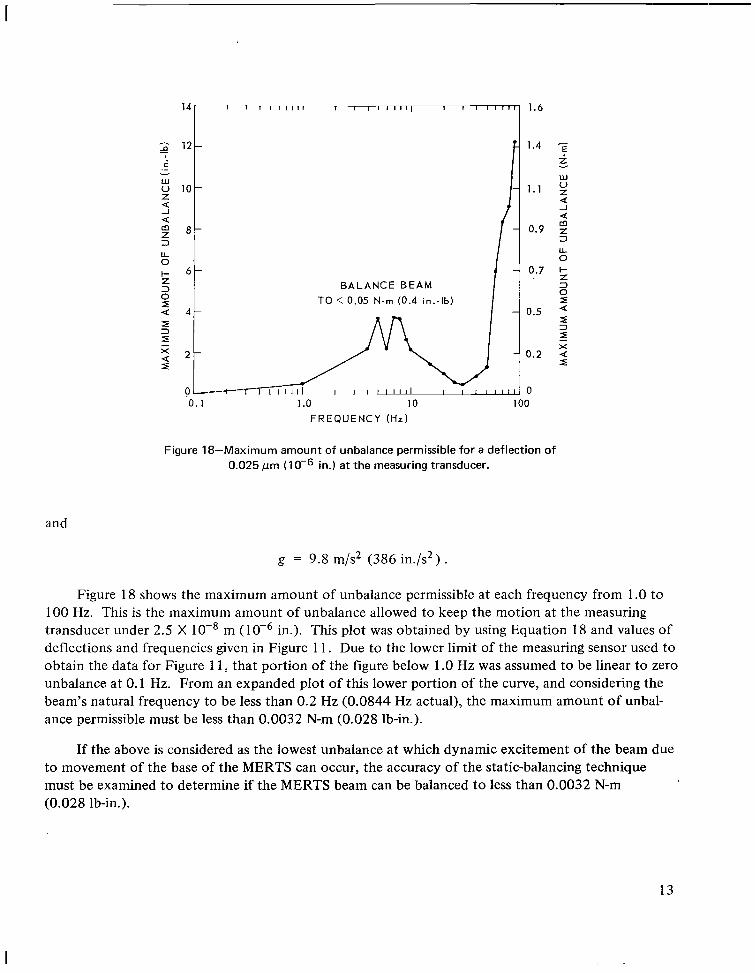
Figure 18-Maximum amount of unbalance permissible for a deflection of 0.025 p m ( 10-6 in.) at the measuring transducer.
and
g = 9.8 m/s2 (386 in./s2).
Figure 18 shows the maximum amount of unbalance permissible at each frequency from 1.O to 100 Hz. This is the maximum amount of unbalance allowed to keep the motion at the measuring transducer under 2.5 X m in.). This plot was obtained by using Equation 18 and values of deflections and frequencies given in Figure 11. Due to the lower limit of the measuring sensor used to obtain the data for Figure 11, that portion of the figure below 1.0 Hz was assumed to be linear to zero unbalance at 0.1 Hz. From an expanded plot of this lower portion of the curve, and considering the beam’s natural frequency to be less than 0.2 Hz (0.0844 Hz actual), the maximum amount of unbalance permissible must be less than 0.0032 N-m (0.028 lb-in.).
If the above is considered as the lowest unbalance at which dynamic excitement of the beam due to movement of the base of the MERTS can occur, the accuracy of the static-balancing technique must be examined to determine if the MERTS beam can be balanced to less than 0.0032 N-m (0.028 lb-in.).
13
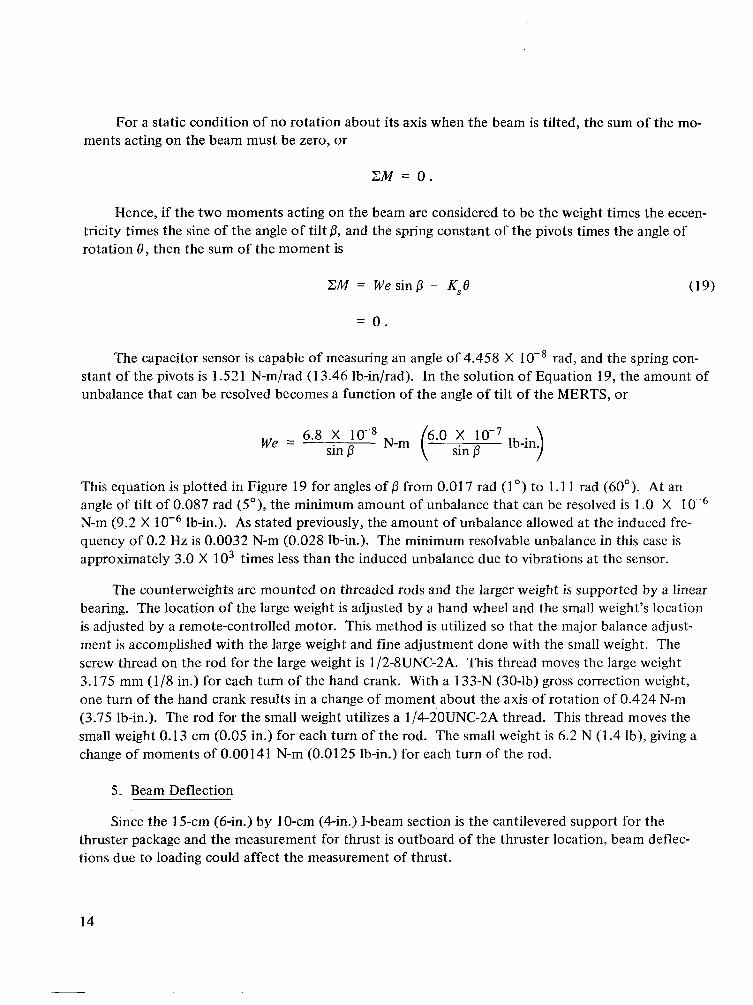
For a static condition of no rotation about its axis when the beam is tilted, the sum of the moments acting on the beam must be zero, or
ZM = 0 .
Hence, if the two moments acting on the beam are considered to be the weight times the eccentricity times the sine of the angle of tilt 0, and the spring constant of the pivots times the angle of rotation 8, then the sum of the moment is
= 0 .
The capacitor sensor is capable of measuring an angle of 4.458 X IO-' rad, and the spring constant of the pivots is 1.52 1 N-m/rad (1 3.46 lb-in/rad). In the solution of Equation 19, the amount of unbalance that can be resolved becomes a function of the angle of tilt of the MERTS, or
We = 6.8 X lo-' N-m sin sin p
This equation is plotted in Figure 19 for angles of p from 0.01 7 rad (1') to 1.1 1 rad (60'). At an angle of tilt of 0.087 rad (5') , the minimum amount of unbalance that can be resolved is 1.O X loM6 N-m (9.2 X lb-in.). As stated previously, the amount of unbalance allowed at the induced frequency of 0.2 Hz is 0.0032 N-m (0.028 lb-in.). The minimum resolvable unbalance in this case is approximately 3.0 X lo3 times less than the induced unbalance due to vibrations at the sensor.
The counterweights are mounted on threaded rods and the larger weight is supported by a linear bearing. The location of the large weight is adjusted by a hand wheel and the small weight's location is adjusted by a remote-controlled motor. This method is utilized so that the major balance adjustment is accomplished with the large weight and fine adjustment done with the small weight. The screw thread on the rod for the large weight is 1/2-8UNC-2A. This thread moves the large weight 3.175 mm (1/8 in.) for each turn of the hand crank. With a 133-N (30-lb) gross correction weight, one turn of the hand crank results in a change of moment about the axis of rotation of 0.424 N-m (3.75 lb-in.). The rod for the small weight utilizes a 1/4-2OUNC-2A thread. This thread moves the small weight 0.13 cm (0.05 in.) for each turn of the rod. The small weight is 6.2 N (1.4 Ib), giving a change of moments of 0.00141 N-m (0.0125 lb-in.) for each turn of the rod.
5. Beam Deflection
Since the 15-cm (6-in.) by 1 O-cm (4411.)I-beam section is the cantilevered support for the thruster package and the measurement for thrust is outboard of the thruster location, beam deflections due to loading could affect the measurement of thrust.
14
ANGLE OF TILT, p (rad)
0.17 0.35 0.52 0.70 - - 1 I I 0.1
1 I 1 ~ _ I - - 1 I 10 20 30 40 50 60
ANGLE OF TILT, p (deg)
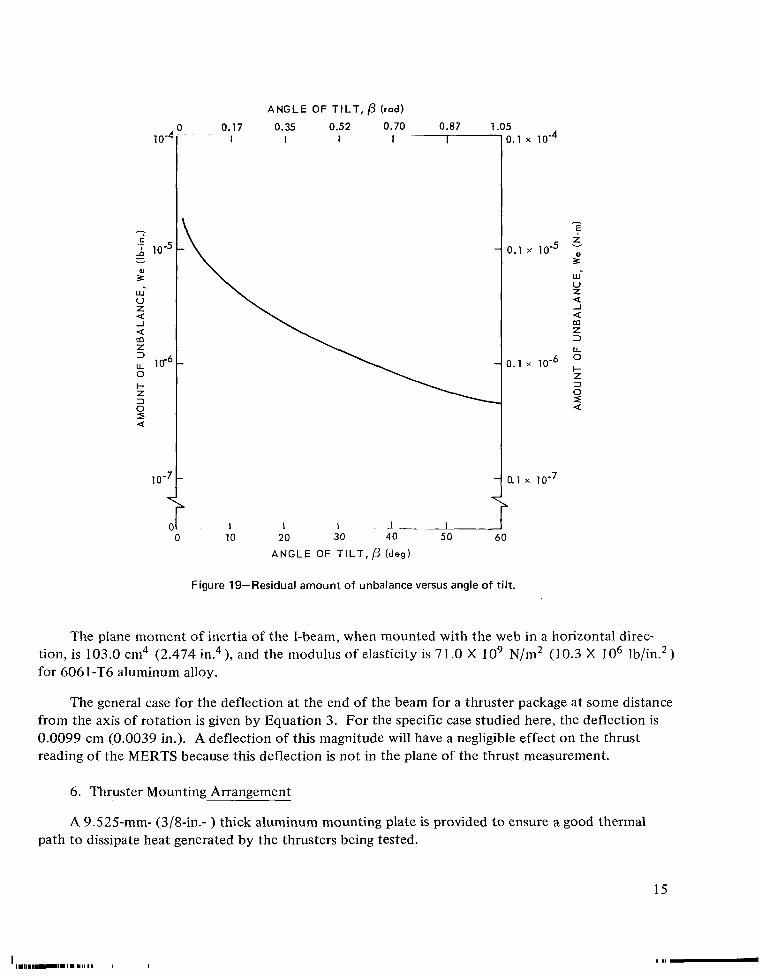
Figure 19-Residual amount of unbalance versus angle of tilt.
The plane moment of inertia of the I-beam, when mounted with the web in a horizontal direction, is 103.0 cm4 (2.474 i n 4), and the modulus of elasticity is 7 1.O X 1O9 N/m2 (1 0.3 X 1O6 Ib/in.* ) for 606 1-T6 aluminum alloy.
The general case for the deflection at the end of the beam for a thruster package at some distance from the axis of rotation is given by Equation 3. For the specific case studied here, the deflection is 0.0099 cm (0.0039 in.). A deflection of this magnitude will have a negligible effect on the thrust reading of the MERTS because this deflection is not in the plane of the thrust measurement.
6. Thruster Mounting Arrangement
A 9.525"- (3/8-in.- ) thick aluminum mounting plate is provided to ensure a good thermal path to dissipate heat generated by the thrusters being tested.
15
'1.11.1.".1..1111 I I
----
The thrust axis, which is perpendicular to the beam axis, is marked by means of a scribed line on the mounting plate and three locating pins on the beam, which ensure proper alignment between the mounting plate and beam. Since the location of the mounting plate relative to the beam is predetermined through the locating pins, the mounting of the thruster to the mounting plate is the only possible source of alignment error. This error can be kept to within 0.049 rad (2" 50');or 5 percent, by the use of optical instruments.
7. External Fuel Sumlv
Certain thrusters planned to be tested on the MERTS (e.g., ammonia resistojets) require external fuel supplies. It was therefore necessary to design an external fuel supply system that would not appreciably alter the deflection constant of the MERTS system.
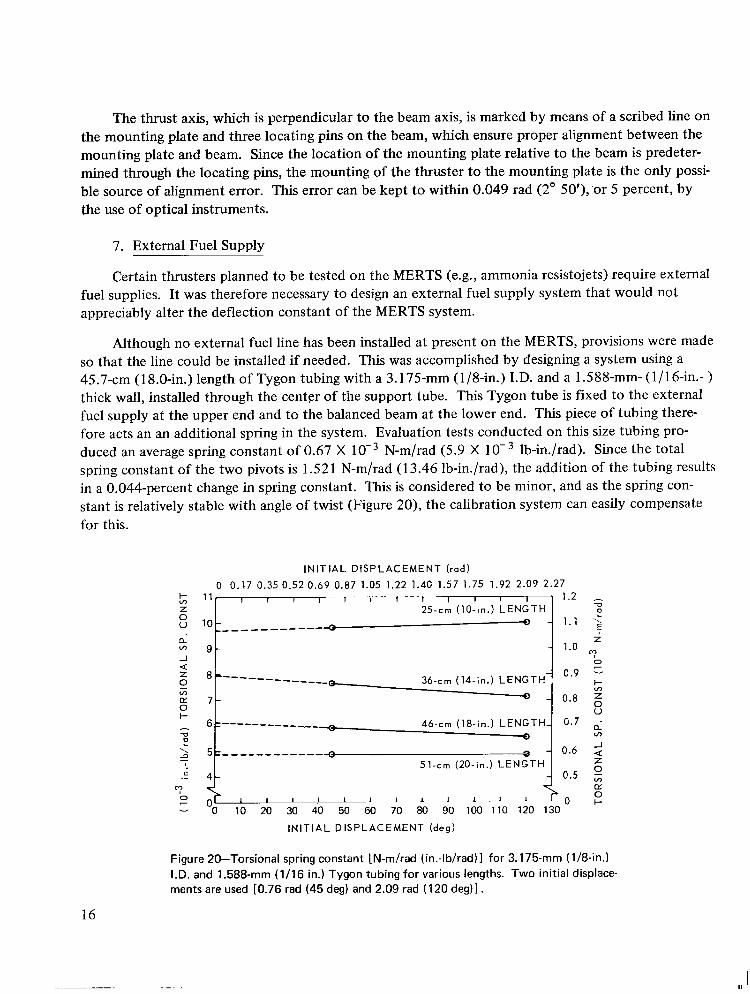
Although no external fuel line has been installed at present on the MERTS, provisions were made so that the line could be installed if needed. This was accomplished by designing a system using a 45.7-cm (18.0-in.) length of Tygon tubing with a 3.175-mm (1/8-in.) I.D. and a 1.588-mm- (1/16-in.- ) thick wall, installed through the center of the support tube. This Tygon tube is fixed to the external fuel supply at the upper end and to the balanced beam at the lower end. This piece of tubing therefore acts an an additional spring in the system. Evaluation tests conducted on this size tubing produced an average spring constant of 0.67 X N-m/rad (5.9 X lb-in./rad). Since the total spring constant of the two pivots is 1.521 N-m/rad (13.46 Ib-in./rad), the addition of the tubing results in a 0.044-percent change in spring constant. This is considered to be minor, and as the spring constant is relatively stable with angle of twist (Figure 20), the calibration system can easily compensate for this.
I N I T I A L D I S P L A C E M E N T ( r a d )
0 0.17 0.35 0.52 0.69 0.87 1.05 1.22 1.40 1.57 1.75
'0 _ _ _ _ _ _
gt
L0 10 20 30 L- 1 - 1 I 1 I I
40 50 60 70 80 90 100
I N I T I A L DISPLACEMENT (deg)
1.92 2.09 2.27 1.2
-0
D1.1 \:
1 Z1.o
@?-0 0.9
t-J
0.8 0" U
0.7 v)
J0.6 Q
Z 0.5
E . I L 0
I110 120 130
Figure 20-Torsional spring constant [N-m/rad (in.-lb/rad)] for 3.1 75-mm (1/84n.) I.D. and 1.588-mm (1/16 in.) Tygon tubing for various lengths. Two initial displacements are used [0.76 rad (45 deg) and 2.09 rad ( 120 deg)1 .
16
8. Capacitor Assembly
In Section I11 B, on the electronics of the MERTS, the merits of the various types of displacement sensors are discussed and the argument for sePection of the differential capacitor type is presented. The mechanical design is discussed in the following paragraphs.
Since the capacitor assembly is an electrical device, the basic design first had to meet the electrical requirements. The most important considerations were edge thickness and fringing effects, surface rigidity, and flatness. Additionally, maintenance of parallelism during operation and minimization of the metal structure necessary to mount the moving plates were considered.
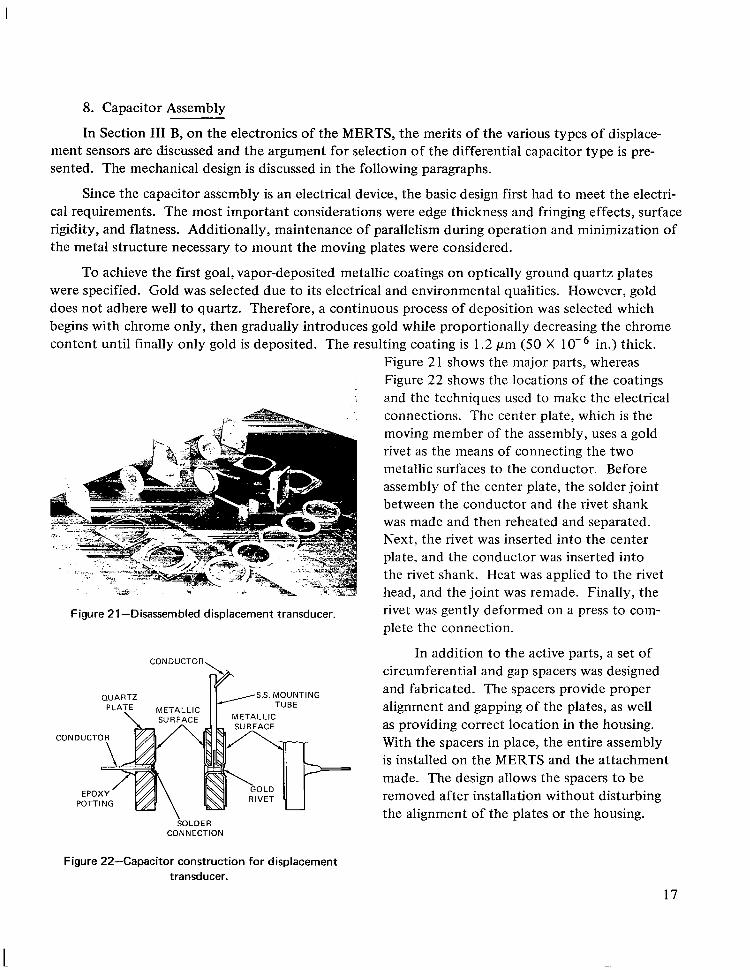
To achieve the first goal, vapor-deposited metallic coatings on optically ground quartz plates were specified. Gold was selected due to its electrical and environmental qualities. However, gold does not adhere well to quartz. Therefore, a continuous process of deposition was selected which begins with chrome only, then gradually introduces gold while proportionally decreasing the chrome content until finally only gold is deposited, The resulting coating is 1.2 pm (50 X 10-6 in.) thick.
Figure 21-Disassembled displacement transducer.
CONDUCTOR
?P QUARTZ
PLATE METALLIP\ SURFAC
\ \ SOLDER
CONNECTION
Figure 22-Capacitor construction for displacement transducer.
Figure 21 shows the major parts, whereas Figure 22 shows the locations of the coatings and the techniques used to make the electrical connections. The center plate, which is the moving member of the assembly, uses a gold rivet as the means of connecting the two metallic surfaces to the conductor. Before assembly of the center plate, the solder joint between the conductor and the rivet shank was made and then reheated and separated. Next, the rivet was inserted into the center plate, and the conductor was inserted into the rivet shank. Heat was applied to the rivet head, and the joint was remade. Finally, the rivet was gently deformed on a press to complete the connection.
In addition to the active parts, a set of circumferential and gap spacers was designed and fabricated. The spacers provide proper alignment and gapping of the plates, as well as providing correct location in the housing. With the spacers in place, the entire assembly is installed on the MERTS and the attachment made. The design allows the spacers to be removed after installation without disturbing the alignment of the plates or the housing.
17
I I SHROUD; ,TANK W P L L S . I T
SHIELDTHRUSTER TARGET
THRUSTER BEAM ENVELOPE
L SHROUD LOAD SUPPORT RAILS\y= /
x x-2 0.1 MOUNTING STRUCTURE CHAMBER LOAD JUPPORT RAILS
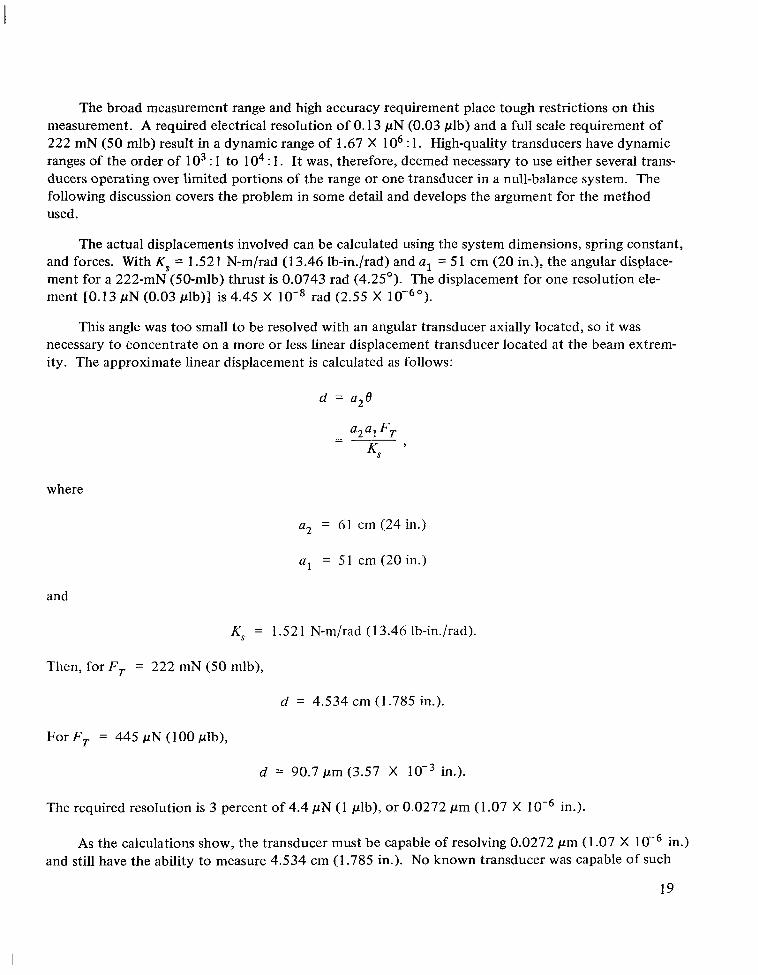
z Figure 24- Ion-engine test configuration.
I-
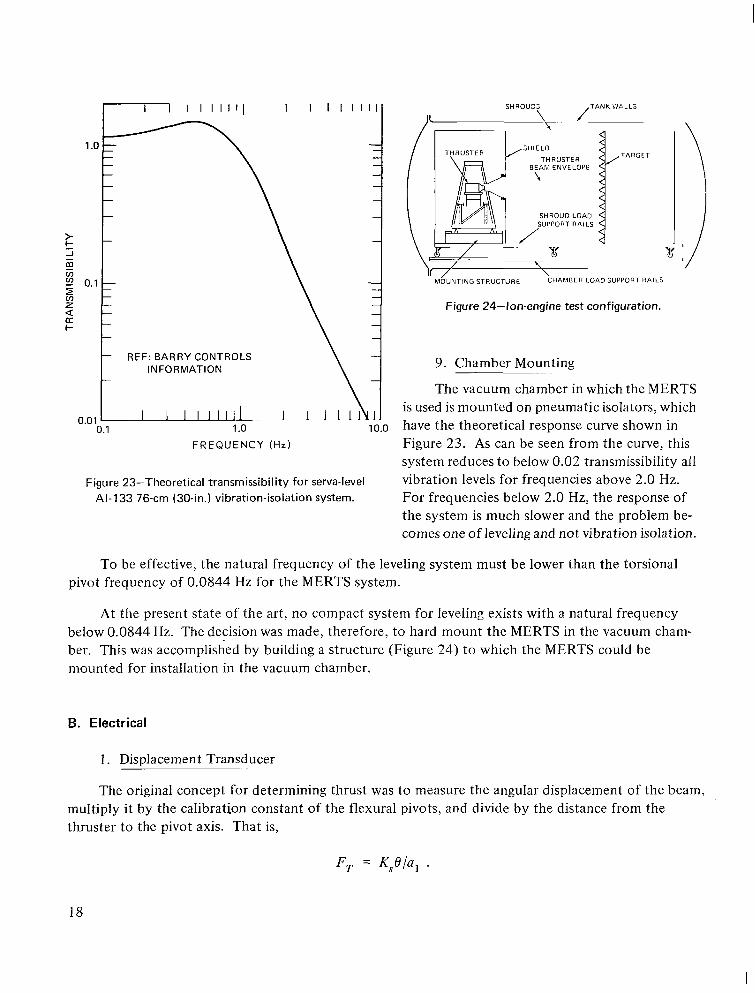
REF: BARRY CONTROLS 9. Chamber MountingI NFORMATl ON
The vacuum chamber in which the MERTS
0.01 I I I I I l l l l I I I 1 1 1 I is used is mounted on pneumatic isolators, which 0.1
t 1.o
\I 10.0 have the theoretical response curve shown in
FREQUENCY (Hz) Figure 23. As can be seen from the curve, this system reduces to below 0.02 transmissibility all
Figure 23-Theoretical transmissibility for serva-level vibration levels for frequencies above 2.0 Hz. AI-133 76-cm (30-in.) vibration-isolation system. For frequencies below 2.0 Hz, the response of
the system is much slower and the problem becomes one of leveling and not vibration isolation.
To be effective, the natural frequency of the leveling system must be lower than the torsional pivot frequency of 0.0844 Hz for the MERTS system.
At the present state of the art, no compact system for leveling exists with a natural frequency below 0.0844 Hz. The decision was made, therefore, to hard mount the MERTS in the vacuum chamber. This was accomplished by building a structure (Figure 24) to which the MERTS could be mounted for installation in the vacuum chamber.
B. Electrical
I . Displacement Transducer
The original concept for determining thrust was to measure the angular displacement of the beam, multiply it by the calibration constant of the flexural pivots, and divide by the distance from the thruster to the pivot axis. That is,
18
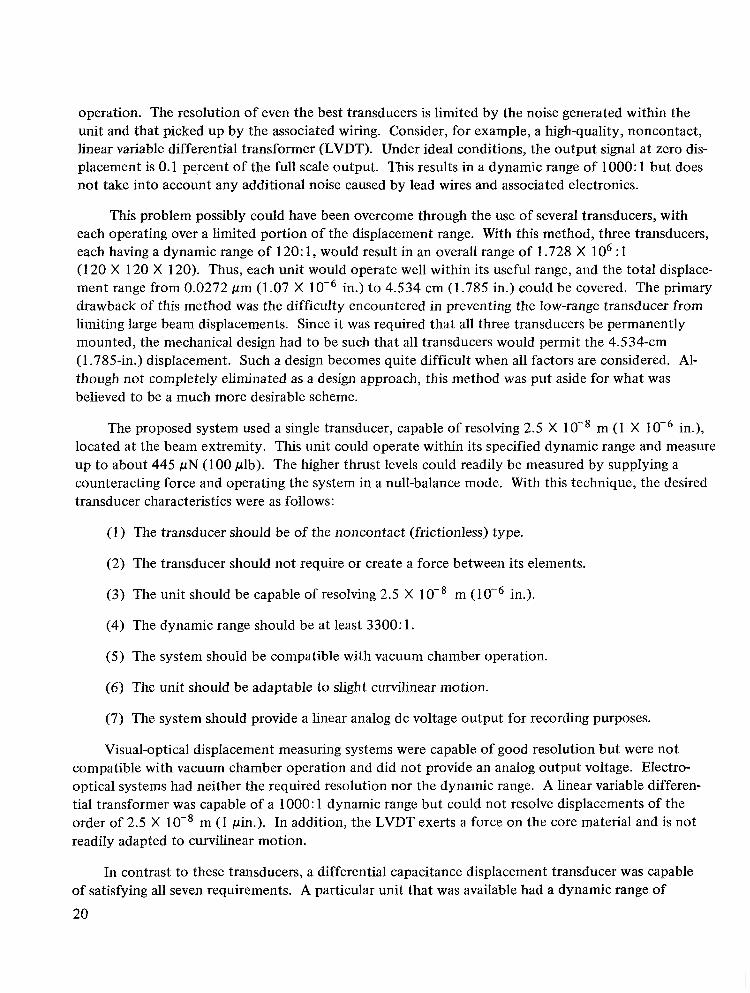
The broad measurement range and high accuracy requirement place tough restrictions on this measurement. A required electrical resolution of 0.13 pN (0.03 plb) and a full scale requirement of 222 mN (50 mlb) result in a dynamic range of 1.67 X 1O6 :1. High-quality transducers have dynamic ranges of the order of 1O3 :1 to lo4 :1. It was, therefore, deemed necessary t o use either several transducers operating over limited portions of the range or one transducer in a null-balance system. The following discussion covers the problem in some detail and develops the argument for the method used.
The actual displacements involved can be calculated using the system dimensions, spring constant, and forces. With K, = 1.52 1 N-m/rad (13.46 lb-in./rad) and al = 5 1 cm (20 in.), the angular displacement for a 222-mN (50-mlb) thrust is 0.0743 rad (4.25'). The displacement for one resolution element [0.13pN (0.03 plb)] is 4.45 X rad (2.55 X
This angle was too small to be resolved with an angular transducer axially located, so it was necessary to concentrate on a more or less linear displacement transducer located at the beam extremity. The approximate linear displacement is calculated as follows:
d = a20
where
a2 = 61 cm (24 in.)
al = 51 cm (20 in.)
and
Ks = 1.52 1 N-m/rad (1 3.46 lb-in./rad).
Then, for F , = 222 mN (50 mlb),
d = 4.534 cm (1.785 in.).
For F , = 445 pN (100 plb),
d = 90.7 pm (3.57 X lo-' in.).
The required resolution is 3 percent of 4.4 pN (1 plb), or 0.0272 pm (1.07 X low6in.).
As the calculations show, the transducer must be capable of resolving 0.0272 pm (1 -07 X 10-6 in.) and still have the ability to measure 4.534 cm (1.785 in.). No known transducer was capable of such
19
operation. The resolution of even the best transducers is limited by the noise generated within the unit and that picked up by the associated wiring. Consider, for example, a high-quality, noncontact, linear variable differential transformer (LVDT). Under ideal conditions, the output signal at zero displacement is 0.1 percent of the full scale output. This results in a dynamic range of 1000:1 but does not take into account any additional noise caused by lead wires and associated electronics.
This problem possibly could have been overcome through the use of several transducers, with each operating over a limited portion of the displacement range. With this method, three transducers, each having a dynamic range of 120: 1,would result in an overall range of 1.728 X 1O6 :1 ( I 20 X 120 X 120). Thus, each unit would operate well within its useful range, and the total displacement range from 0.0272 pm (1.07 X in.) to 4.534 cm (1 -785 in.) could be covered. The primary drawback of this method was the difficulty encountered in preventing the low-range transducer from limiting large beam displacements. Since it was required that all three transducers be permanently mounted, the mechanical design had to be such that all transducers would permit the 4.534-cm (1.785-in.) displacement. Such a design becomes quite difficult when all factors are considered. Although not completely eliminated as a design approach, this method was put aside for what was believed to be a much more desirable scheme.
The proposed system used a single transducer, capable of resolving 2.5 X 10⁻⁸ m (1 X 10⁻⁶ in.), located at the beam extremity. This unit could operate within its specified dynamic range and measure up to about 445 pN (100 plb). The higher thrust levels could readily be measured by supplying a counteracting force and operating the system in a null-balance mode. With this technique, the desired transducer characteristics were as follows:
(1 ) The transducer should be of the noncontact (frictionless) type.
(2) The transducer should not require or create a force between its elements.
(3) The unit should be capable of resolving 2.5 X 10⁻⁸ m ( 1 OF6 in.).
(4) The dynamic range should be at least 3300: 1
(5) The system should be compatible with vacuum chamber operation.
(6) The unit should be adaptable to slight curvilinear motion.
(7) The system should provide a linear analog dc voltage output for recording purposes.
Visual-optical displacement measuring systems were capable of good resolution but were not compatible with vacuum chamber operation and did not provide an analog output voltage. Electrooptical systems had neither the required resolution nor the dynamic range. A linear variable differential transformer was capable of a 1000:1 dynamic range but could not resolve displacements of the order of 2.5 X 10⁻⁸ m (1 pin.). In addition, the LVDT exerts a force on the core material and is not readily adapted to curvilinear motion.
In contrast to these transducers, a differential capacitance displacement transducer was capable of satisfying all seven requirements. A particular unit that was available had a dynamic range of
20
. .. . .... . .._.
10,000:1, a resolution of 2.5 X lo-* m in.), and a linear 0- to 5-Vdc output. A good characteristic of the unit was that the capacitor plate configuration could be tailored to suit the particular system requirements and, therefore, provide a great deal of flexibility.
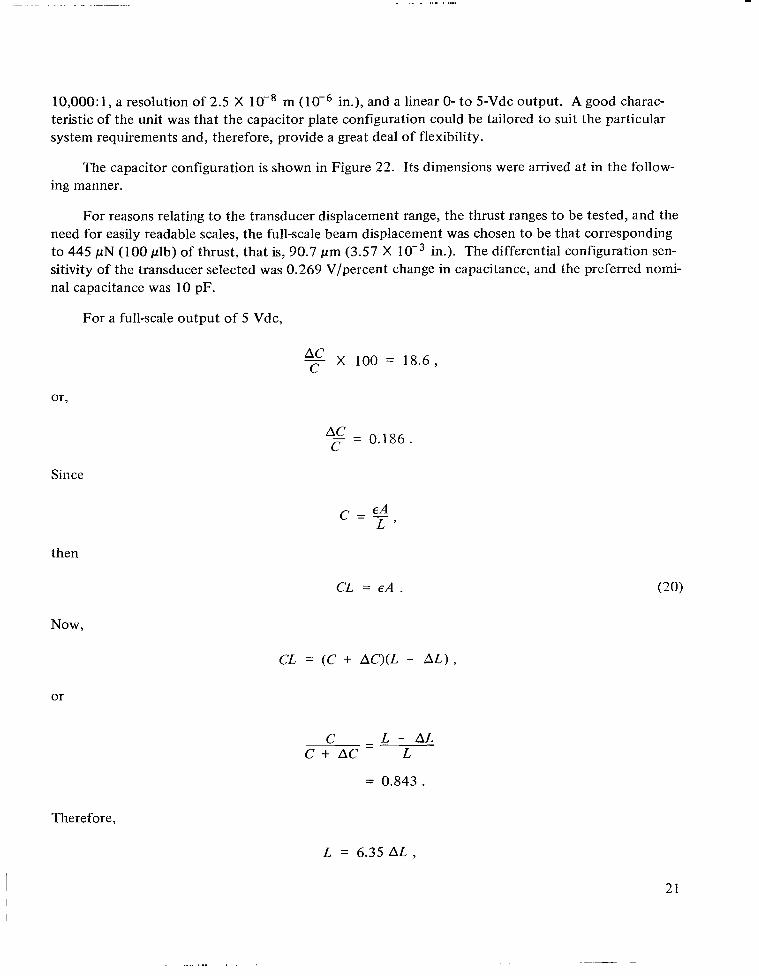
The capacitor configuration is shown in Figure 22. Its dimensions were arrived at in the following manner.
For reasons relating to the transducer displacement range, the thrust ranges to be tested, and the need for easily readable scales, the full-scale beam displacement was chosen to be that corresponding to 445 pN (100 plb) of thrust, that is, 90.7 pm (3.57 X 1O-J in.). The differential configuration sensitivity of the transducer selected was 0.269 V/percent change in capacitance, and the preferred nominal capacitance was 10 pF.
For a full-scale output of 5 Vdc,
C X 100 = 18.6,
Since
then
Now,
CL =
or
C = 0.186.
c = -EA L ’
CL = E A .
(C + AC)(L - A L ) ,
c - L - AL-C + AC L
= 0.843.
Therefore,
L = 6.35 A L ,
21
..... ...
but AL = 90.7 pm (3.57 X in.). So,
L = 0.578 mm (22.75 X in.).
Therefore, to obtain 5 V output for a thrust of 445 pN (100 plb), the distance between parallel capacitor plates should be 0.578 mm. The correct plate area is found as follows:
A = -LC e
= .653 X m2
= 6.53 cm2
and
diameter = (24)
= 2.88 cm
Therefore, the end plates were circular with a diameter of 2.88 cm. To simplify alignment and minimize fringing effects, the center (movable) plate was made larger in diameter. The plates were made by depositing a gold film on optically flat quartz blanks; electrical connections were made at a chamfered hole through the center of each plate.
The transducer electronics is a completely self-contained, potted assembly that is mounted in proximity to the capacitor plates. The package requires 1 W of power from a 28-Vdc source and provides a low-impedance analog dc output. The particular type of capacitance transducer selected does create a small force between the capacitive elements. The force calculations for the differential configuration are shown below:
2
F = [(z)- (?)I2 .
At null position, V , = Vz and L , = L,. Therefore,
F = O
For 3.57 X in. displacement, V I = 7.5 V, L , = 6.67 X m, V2 = 12.5 V, and L , = 4.84 X m. Therefore,
F = 1.6 pN (0.35 plb).
22
Thus, in the worst case, the force caused by the capacitor plates results in an error of only 0.35 percent of the reading. This is well below the 3 percent allowable for electronic-associated errors.
2. Calibrator and Forcer
In order to operate the thrust balance in the closed-loop (null-balance) mode, it was necessary to provide a means of generating a counteracting force on the beam. The forcing system had to be capable of generating any force from 0 to 222 mN (50 mlb) (minimum), be completely frictionless, and have a linear transfer function. Three basic techniques for generating the force were considered; they were classified as reluctance, capacitance, and permanent magnet.
The permanent magnet technique was chosen for use on the MERTS because of its overall superior performance. The basic unit is shown in Figure 15. It consists of a permanent magnet that develops a high-density magnetic field into which is placed a multiturn coil. The force created between the field and the coil is directly proportional to coil current. With the magnet assembly mounted on the beam and the coil mounted on the balance frame, a completely frictionless forcing technique is realized.
The chief advantages of this technique over the others mentioned are
(1) The transfer function is extremely linear (Fc = 2NBnrZc).
(2) The force vector is bidirectional.
(3) Axis misalignment between the coil and magnet assembly has no effect on the transfer function.
(4) The transfer function is not affected by axial motion between the coil and magnet assembly over the small displacement range in this application.
( 5 ) The unit can be driven directly from a standard, low-power amplifier.
No detailed analytical design was carried out. There were several tradeoffs to be made that complicated an analytical approach. In the first place, it was desirable to have a large air gap so that it would not be necessary to maintain precision alignment between the magnet assembly and the coil. However, it was desirable to keep the air gap small in order to minimize fringing and maintain a high flux density so that the potentially high transfer efficiency of the device could be realized. Second, the size and shape of the air gap directly influenced the coil characteristics, which in turn had to satisfy certain self-imposed requirements based on heat loss and drive circuit considerations. For these reasons, the optimum forcing device was determined experimentally, a method which proved to be quite effective. The drive circuit designed to operate the forcer consists of a current-boosted operational amplifier connected as a programmable current source. The output (coil) current is proportional to the input voltage and is not affected by coil temperature or contact resistance in the interconnection wiring. This results in a very stable forcing device.
23
This technique was also used in the development of an accurate, remotely operated calibration system for the MERTS. The system is similar to the forcer except that the drive circuit input is a potentiometer-adjustable, precision reference voltage. The total circuitry is designed so that the output force is a h e a r function of the potentiometer setting at the control console. A gain switch on the programmable current source is used to select any of three calibration ranges; they are 0 to 445 pN (100 plb), 0 to 8.9 mN (2 mlb), and 0 to 222 mN (50 mlb). An “off” position is also provided so that the force can be preset to any desired level without actually being applied to the beam. This permits instant application and removal of any desired calibration force to the beam, thus facilitating rapid calibration of the dynamic as well as the static response of the MERTS. This calibration technique is completely remote and can provide calibration forces at any time during a thruster test.
3. Magnetic Damper
From an operational standpoint, it was desirable that the MERTS have a damping ratio between 0.7 and 1.O. One technique of obtaining this is by an active damping system whereby the beam displacement signal is differentiated and fed back to the force transducer. This, indeed, is the technique used for the 445” (50-mlb) and 8.9-mN (2-mlb) ranges. Because of the high sensitivity of the 445-pN (1 00-plb) range and the larger lead term required to achieve critical damping, more sophisticated electronics would have been required in order to use only the active damping system on this range. In addition, it was desirable to have the beam passively damped to simplify initial setup procedures. Several passive damping methods were considered; based on MERTS operating conditions, an eddy current damper with a permanent magnet field was selected.
The performance of an eddy current damper in this application is determined by the equation
f = ZoAB2r2 .
Using this and magnetic circuit equations, a permanent magnet eddy current damping system was designed to provide a damping ratio of 0.7. However, a standard magnet was available, and in view of the lead time required to purchase a custom magnet, the decision was made to use it. This magnet provided a damping ratio of only 0.5 and was, therefore, supplemented with active damping control to achieve an overall damping ratio of 1 .O. This system has proved so effective that i t will not be replaced by the system originally designed. The system is completely compatible with the MERTS environment and is maintenance free, yet the damping ratio can be readily adjusted to a specific value.
4. Command System-
Since the MERTS and the thruster under test had to be under continuous ground control during testing, it was necessary to develop a system to provide the required operating and control functions. The following design goals were established for this system.
(1) The command system should require no physical contact across the beam/frame interface.
24
I
TELEMETRY RECEIVER 1
COMMAND \ SIGNAL PANEL
CONTROL SYSTEM \ PANEL
F.M. DISCRIMINATORS -
P.D.M. D IGITAL \ SYNC.
P.D.M. D IGITAL DEMULTIPLEXERS-
P.D.M. ?OWER SUPPLY
SYSTEM POWER
u u u u u u u u u u u u u u
- - .
. ... . -4 e
.
1: ..
... e 6 1" I
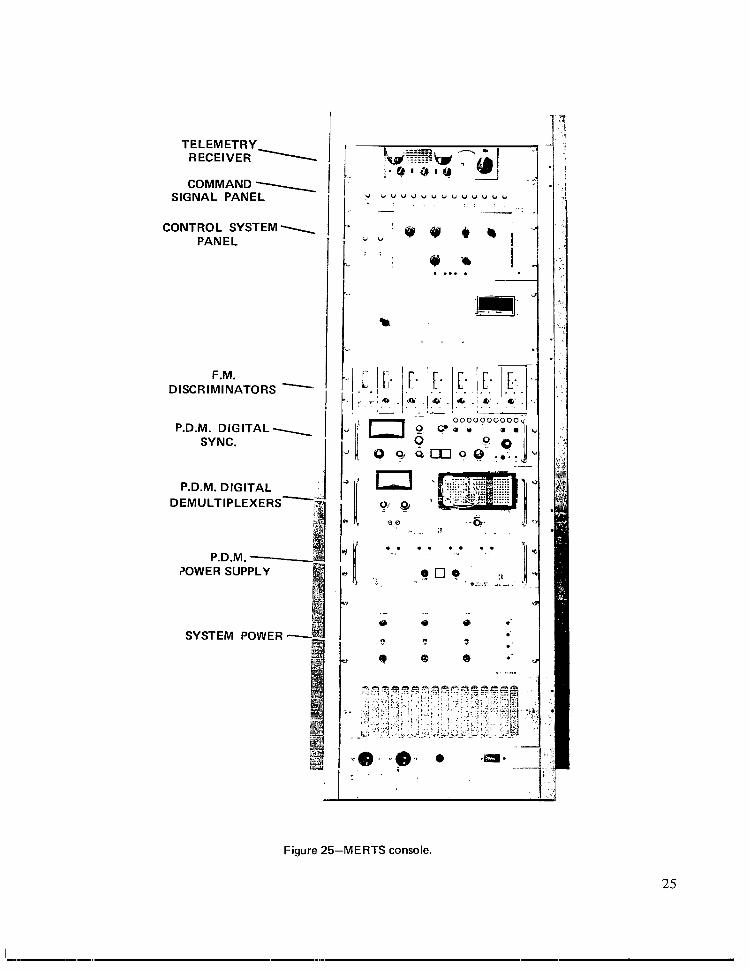
Figure 25-MERTS console.
25
(2) The thruster command signals should be identical to those that would be provided by a spacecraft.
(3) Commands should be provided to perform telemetry calibrations and to operate the static balancing system on the beam.
(4) The command system should have enough flexibility to permit it to control thruster systems that are not spacecraft compatible (ie., which contain no logic).
For simplicity, easy maintenance, and yet great flexibility, a light-operated command system was designed for the MERTS (Figure 10). The system has a total of 16 channels: two for operating the static balancing motor, two for zero- and full-scale telemetry calibrations, and 12 for thruster control. Each channel consists of a light source mounted on the structure frame in proximity to a light sensor mounted on the beam. The source and sensor assemblies are mounted such that a given light source can illuminate only its associated sensor. Closing a switch on the control console (Figure 25) causes a light to illuminate and trigger its associated sensor. The sensor output is amplified and used to generate the required function of that particular command. All of the command system electronics located on the beam are mounted on plugin printed circuit cards. There are two command channels per card. This provides extreme flexibility in that the complete nature of a command function can be modified by merely removing its electronic card and replacing it with another. In this way, it is possible to test flight model thruster systems as well as experimental thrusters with no wiring changes to the command system. In its present configuration for testing the ion engine, the command system electronics on the beam consists of five switch closures, one pulse generator, and 10 “and” gates.
5. Control System
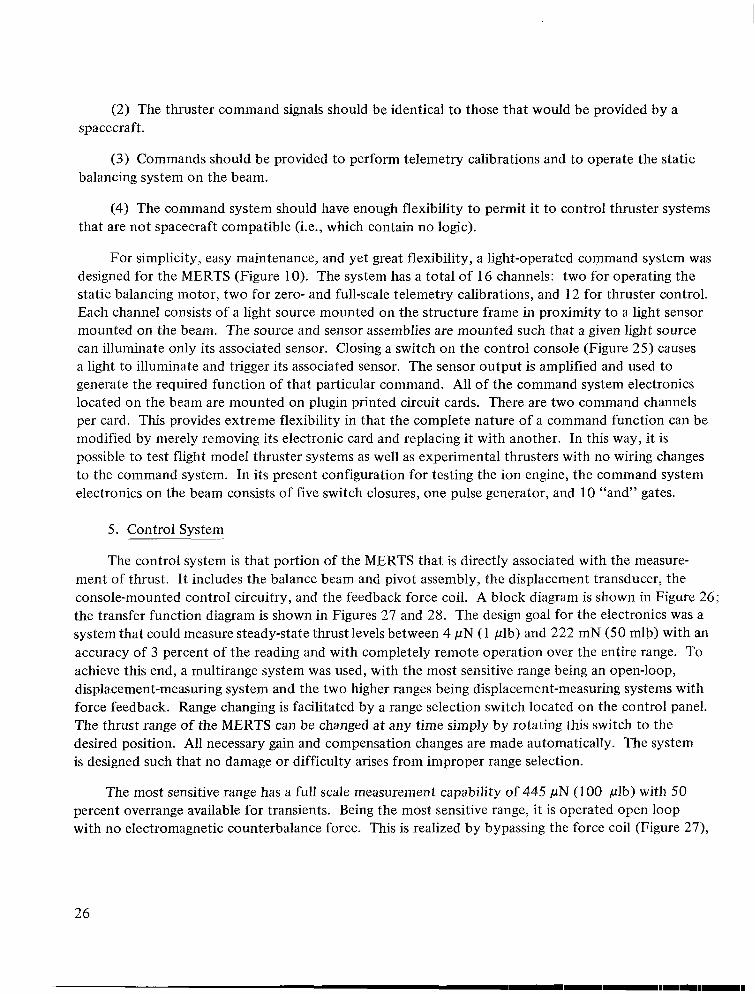
The control system is that portion of the MERTS that is directly associated with the measurement of thrust. I t includes the balance beam and pivot assembly, the displacement transducer, the console-mounted control circuitry, and the feedback force coil. A block diagram is shown in Figure 26; the transfer function diagram is shown in Figures 27 and 28. The design goal for the electronics was a system that could measure steady-state thrust levels between 4 pN (1 plb) and 222 mN (50 mlb) with an accuracy of 3 percent of the reading and with completely remote operation over the entire range. To achieve this end, a multirange system was used, with the most sensitive range being an open-loop, displacement-measuring system and the two higher ranges being displacement-measuring systems with force feedback. Range changing is facilitated by a range selection switch located on the control panel. The thrust range of the MERTS can be changed at any time simply by rotating this switch to the desired position. All necessary gain and compensation changes are made automatically. The system is designed such that no damage or difficulty arises from improper range selection.
The most sensitive range has a full scale measurement capability of 445 pN ( 1 00 plb) with 50 percent overrange available for transients. Being the most sensitive range, it is operated open loop with no electromagnetic counterbalance force. This is realized by bypassing the force coil (Figure 27),
26
FORCE COIL
CAPACITOR PLATES
COUNTERBALANCE FORCE
Figure 26-Control-system block diagram.
thereby letting the current-source gain constant, K,, equai zero. When the terms are combined, the resultant transfer function diagram yields the following transfer function:
V 20K,_ --F , JS2 + fS + K, '
The value of K , was selected to satisfy the requirement that V = 5 V when F , = 445 pN (1 00 plb), or, since
VKSK , = 20F, '
then
K , = 33,650Vlrad
27
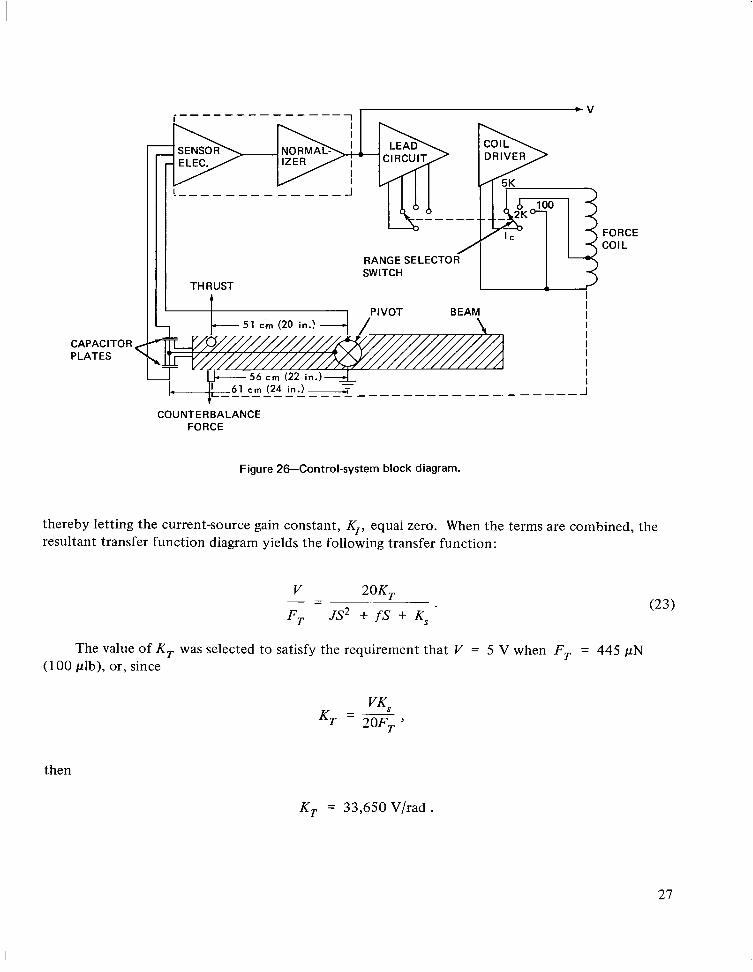
With the known values of J and K,, the characteristic equation becomes
S2 + 0.031fS + 0.416 = 0
and is of the general form
s2 + 2&dNS + w; = 0
Hence,
wN = J 0 . 4 1 6
= 0.646 rad/s.
LEAD CURRENT
J s 2 + f s + Ks
Figure 27-Transfer-function diagram [222 mN (50 mlb) and 8.9 mN (2 mlb) scales].
SENSOR
TT Js2+fs+K,
QF
Figure 28-Transfer-function diagram [445pN (100plb) scale].
For critical damping, = 1; therefore, f = 2wN/1031 = 4.70 N-m-s (41.6 lb-in.-s). The transfer function was programmed on a small analog computer so that a graphic display of the system step response could be obtained. This is shown in Figure 29 and displays the output voltage V as a function of time for various damping ratios. As mentioned previously, when readily available components were assembled to make the eddy current damper, the damping ratio achieved was only about 0.5. This was considered adequate for the initial performance test and is reflected in the test data elsewhere in this report. Since the initial tests, however, the damping ratio has been increased to 1 .O on this range by adding derivative feedback
When the range selector is moved to the 8.9-mN (2-mlb) position, it connects the force coil into the circuit. This applies a force t o the beam that counteracts any applied thrust. The type “0” control loop that results is inherently stable and permits the beam position to continue to be the output parameter. High-stability operational amplifiers were used in the control loop so that gain and offset drifts result in a negligible effect on the output.
28

- -
6 I I I I I 1 I
INPUT: 445-pN (100-plb) STEP
-
-
-
-
I I I I
Figure 29-Step response on 445 pN (100plb) range.
The overall transfer function as derived from the transfer function diagram (Figure 2 7 ) is
V 20K,-~~
F , JS2 + ( j + 22KcKTKrr)S + (22KcK,Kr + K,)
The force coil constant K, is found by supplying all known constants in the steady-state equation
V 20K,-- _ F , 22KcK,KI + K s ’ ( 2 6 )
where, from the previous calculations,
v = 5 v ,
f = 2.35 N-m-s (20.8 Ib-in.-s) ,
K, = 33650 V/rad ,
29
and
K, = 1.521 N-m/rad (13.46 Ib-in./rad).
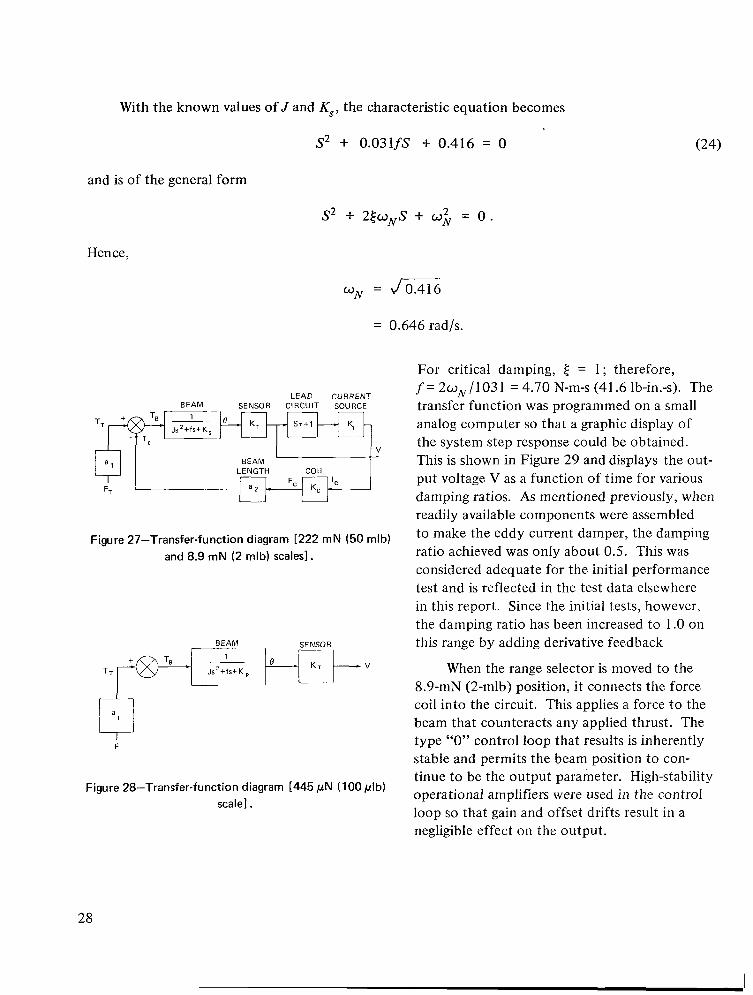
Based on amplifier and forcer characteristics, the current source constant K, was chosen to be 0.01 A/V. Therefore,
20K,F - K,VK, = 22KTK, V
= 0.1536 N/A (0.03454 Ib/A).
Thus, the lead term T is the only undetermined constant in the system equation. Here again the computer was used to display graphically the system response with various values of T (Figure 30). These data were then used to design a lead circuit that is adjustable over the range of T shown and is switched into the control loop when the 8.9-mN (2-mlb) range is selected.
6
5
> v
w 4 0 4 I--I
? 3
2 -
I I I -1. I I 0 1 2 3 4 5 6 7 a
TIME ( s )
Figure 30-Step response on 8.9 mN (2 mlb) range.
30
........
I I I .I1 I I1 I1 I111 I I I I 1 111
6 1 r I I -INPUT: 222-mN (50-mlb) STEP
5
4 L w 2 3 I--I 0 ' 2
1
1 1 I 1 I 1 I
0 0.2 0.4 0.6 0.8 1.0 1.2 1.4 1.6 1.8
TIME ( 5 )
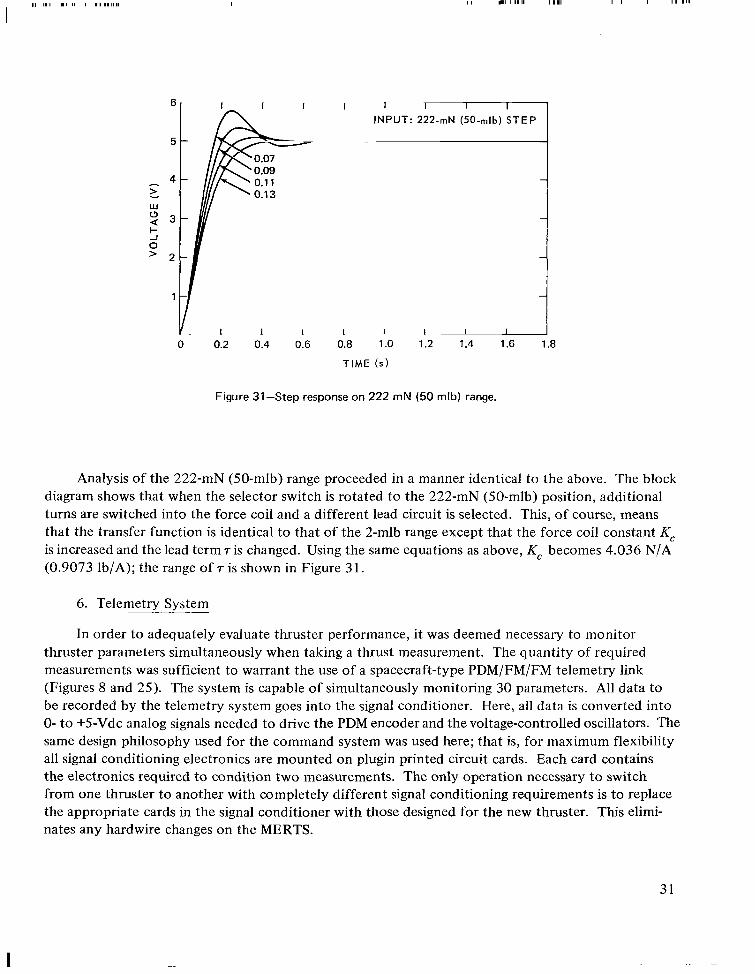
Figure 31-Step response on 222 mN (50 mlb) range.
Analysis of the 222-mN (50-mlb) range proceeded in a manner identical to the above. The block diagram shows that when the selector switch is rotated to the 222-mN (50-mlb) position, additional turns are switched into the force coil and a different lead circuit is selected. This, of course, means that the transfer function is identical to that of the 2-mlb range except that the force coil constant K, is increased and the lead term 7 is changed. Using the same equations as above, K, becomes 4.036 N/A (0.9073 lb/A); the range of 7 is shown in Figure 31.
6. Telemetry System~-
In order to adequately evaluate thruster performance, it was deemed necessary to monitor thruster parameters simultaneously when taking a thrust measurement. The quantity of required measurements was sufficient to warrant the use of a spacecraft-type PDM/FM/FM telemetry link (Figures 8 and 25). The system is capable of simultaneously monitoring 30 parameters. All data to be recorded by the telemetry system goes into the signal conditioner. Here, all data is converted into 0- to +5-Vdc analog signals needed to drive the PDM encoder and the voltage-controlled oscillators. The same design philosophy used for the command system was used here; that is, for maximum flexibility all signal conditioning electronics are mounted on plugin printed circuit cards. Each card contains the electronics required to condition two measurements. The only operation necessary t o switch from one thruster to another with completely different signal conditioning requirements is to replace the appropriate cards in the signal conditioner with those designed for the new thruster. This eliminates any hardwire changes on the MERTS.
31
In addition, the signal conditioner is capable of placing either zero- or full-scale reference signals on all telemetry channels by remote command. This permits an end-to-end calibration of the entire telemetry system to be performed at any time during a test.
A small one-eighth-wave antenna located on the frame of the MERTS receives the R F information and transfers it via a coaxial cable to a receiver in the console. Here the data are reconstructed and fed to a connector on the rear of the console. From here they can be fed to any desirable analog recording equipment.
In its present configuration for testing a particular ion engine, the signal conditioner contains six inverter cards and three thermistor cards. The 12 data outputs from the engine are all 0 to 5 Vdc. Therefore, in order to obtain the required 0 to +5 Vdc, an appropriate inverter circuit was designed and used to construct six identical cards with two inverters each.
Since it was impossible to use hardwire temperature recorders for monitoring beam temperatures during thruster tests, it was necessary to provide this information via the telemetry link. Six identical temperature monitoring circuits were designed and built. Each consists of a calibrated thermistor mounted at the desired monitoring point (Figures 7 and 10) and wired to the data input connector of the signal conditioner, along with a bridge and amplifier circuit that are mounted (in tandem) on a plugin card inside the signal conditioner. The circuits were designed to provide 0 to +5 V over the temperature range from 289 K (60 OF) to 339 K (150 O F ) .
7. Console
With the exception of the data recorders, the MERTS system is completely self-contained. All necessary equipment needed for operating the thrust stand is housed in a standard 66-in. rack (Figure 25), called the console. This includes the power supplies, telemetry processing electronics, and the command and control panels. The console is supplied with power from a standard 120-Vac receptacle and is connected to the thrust stand by one multiconductor cable and one coaxial antenna cable. The unit is mounted on casters so that it can be easily moved to any preferred location.
8. Power
The primary power source for the MERTS system is 120 Vac from a standard laboratory receptacle. Power supplies at the base of the console generate all dc voltages required for the equipment located within the console and on the frame of the thrust stand. In addition, a 28-Vdc supply also provides power to the balance beam through two isolated pivot assemblies. The upper pivot carries the +28 Vdc and has a connection ring to which all 28-V balance beam loads are connected. The bottom pivot is tied to system ground with its connection ring being the central ground for all beam loads. This bottom pivot was insulated from the balance,proper in order to eliminate ground loops and provide grounding flexibility.
With this 28 Vdc as the source, a system of dc/dc converters and regulators are used t o generate all additional voltages needed by the beam electronics and thruster. At the present time, the following voltages are provided: f 28 Vdc, -24 Vdc, f 15 Vdc, and ? 5 Vdc.
32

IV. DIAGNOSTIC EVALUATION AND MODI FlCATlONS
The initial evaluation testing of the MERTS system uncovered two predominant disturbances. One was a torsional movement of the beam due to the environment and to thermal variations of the electronics during warmup. The other was due to inherent building vibrations.
It should be noted here that the contribution of the electronics to the drift problem was found to be negligible.
Initially, the disturbance caused by the thermal variations was the more serious because it resulted in a steady torsional drift of the beam and eventually caused the capacitor sensor t o exceed its designed dynamic range. It was theorized that since the pivot assemblies were mounted at a fixed center distance, the temperature variations experienced caused a vertical load t o be placed on the flexural pivots. A certain percentage of this load caused a cross-coupled torque. This in turn produced a torsional motion or drift. A crude laboratory test on a spare flexural pivot confirmed this theory.
Any design modification to eliminate this vertical stress had to be accomplished without allowing lateral motion, which would affect the capacitor-sensor signal output.
The first attempt at eliminating this thermal effect was to redesign the upper pivot assembly to include linear bushings. Because of the close tolerances held on the sliding fit, stiction was present, which resulted in erratic drift rates. The second modification resulted in the replacement of the linear bushings with linear ball bushings. This eliminated the stiction effect; however, due to the ball bearing clearances in the raceways, a laterally induced vibration was present, resulting in amplification of the noise levels already present at the capacitor sensor.
Finally, a double diaphragm assembly was designed which retained complete freedom of vertical motion through a range of 0.064 cm (0.025 in.), yet prevented any lateral motion (Figures 12 and 13). Evaluation of this design showed a reduction in noise level from 4 to 2 percent of full scale over the ball bushing design and reduction of the thermal drift due to electronic warmup to an acceptable level.
It should be noted here that the use of this new pivot assembly places the 289-N (65-lb) weight of the beam assembly entirely on the lower flexural pivot. As shown in a previous section, the pivots used are capable of withstanding 2824 N (635 lb) before failure, thus providing a safety factor of approximately 9.
The noise induced by the building vibrations was the second problem to be minimized. A survey of several rooms in which the MERTS would be used was taken to determine the frequency and amplitude of this induced vibration. It was found that a peak vertical displacement of approximately 0.91 pm (3.6 X in.) existed at approximately 30 Hz. This resulted in a basic 12-Hz noise frequency from the capacitor displacement transducer which was sufficient to produce a minimum noise level of 5 percent on each of the three thrust ranges. Basically, the problem was one of obtaining a solution by which this noise could be reduced to an acceptable level.
33
-- 3
H E A T INPUT 80.0 T O BEAM
40.0( W )
0 84.1
75.4 T4 (F")
66.3 v)
0 57.2f 84.1 n Q 75.4 W a T 3 (F")
66.3 W 1 57.2.a 3 84.1 0 U 75.4 0 T2 (Fo)I 66.3a W I+ 57.2
93.1
T 1 (F")
DISPLACEMENT SENSOR
D R I F T (V)
- --
302.1-4- - 297.3- - T 4 ( K O )
- - 292.2- - m2 ~~ 287.2 0 - 302.1 -z
n- - 297.3 6- -- I - 292.2 T 3 ( K O )
- - w 287.2 J
- 302.1 a - 0- - 297.3 U- - T 2 ( K O ) 2-
- - 292.2 [LI - w287.2 1+
--
FRAME -HEATER 40.0 I"---
(W 0 I I I 1
~
BASE 80.0 -
HEATER 40.0 I -I J
0 - - 1 , 1 I I
84.1 302.1- --75.4 - 297.3
66.3 - / I - 292.2 T 9 ( K O )
-57.2 I 1 L -
287.2 84.1 302.1-r 75.4 - - 297.3 VIr - 1 8 ( K O ) 2 66.3 - I I - 292.2
- I - n 457.2 I I 287.2 w
84.1 302.1 ' cd-
75.4 - - 297.3 w - T 6 ( K O ) I 66.3 - - 292.2 t-
- -57.2 I r 287.2 81.1 - d - 302.1 - -75.4 297.3- T5 ( K O ) -66.3 -
- 292.2-57.2 287.2
0 1 2 3 4 5 6 7 a 9 10 11
TIME (hr)
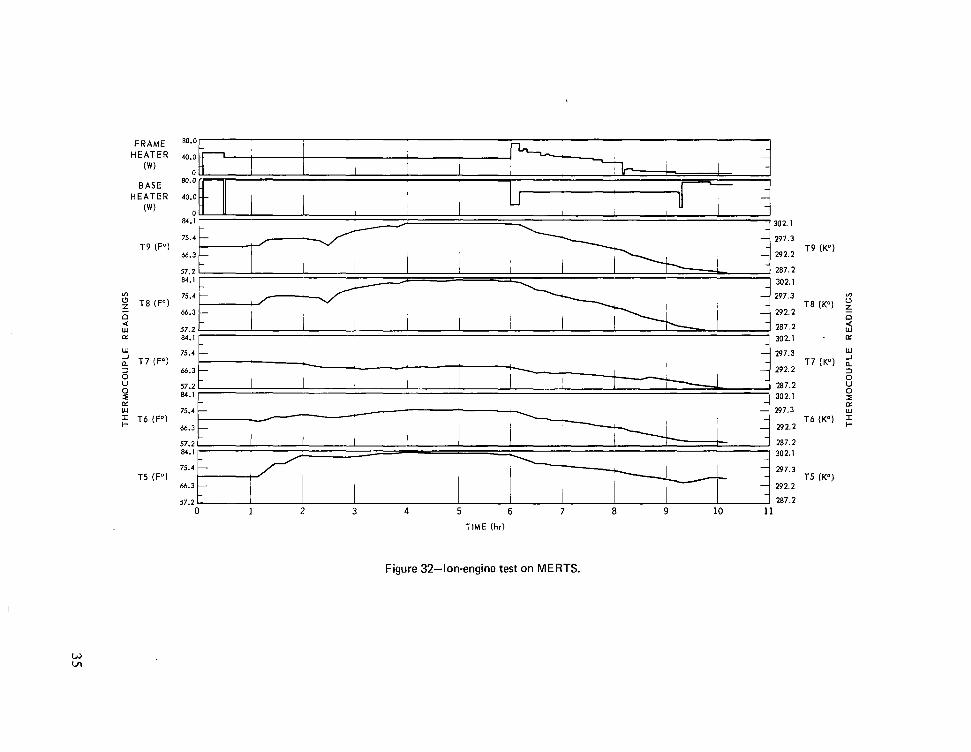
Figure 32-Ion-engine test on MERTS.
w vl
One of the first approaches was to provide vibration isolation by suspending the MERTS system from springs. This technique reduced the 12-Hz noise; however, due to the soft suspension, a high-amplitude, low-frequency wandering was introduced in the range from 0.3 to 0.5 Hz. Various viscous and coulomb damping devices were incorporated in conjunction with the spring suspension, but could not reduce this wandering to an acceptable level without increasing the 12-Hz noise. Because of this and the fact that certain ion engines require a close-fitting, noncontacting shield surrounding the emitting portion of the engine, this approach was abandoned.
The second and final approach was to revert to the original hard-mounted configuration incorporating a three-point mounting system. In addition, a low-pass filter was included to reduce the 12-Hz noise amplitude by 33 dB.
Two reasons for using the three-point mounting system were to reduce thermal conduction to the vacuum chamber shroud when liquid nitrogen is used during cold-wall testing and to provide a more stable mounting base in the event of any warping of the mounting rails inside the chamber during pump down. The use of this mounting arrangement and low-pass filter further reduced the noise output to 0.08 percent of full scale.
As the evaluation program proceeded, the MERTS was placed in the vacuum chamber where testing was performed with the liquid nitrogen cryogenic shroud operating. At this time, an additional thermal problem arose due to radiation cooling. It was manifested in two forms, one being the output signal (V) and the other a stiction effect between the calibrator-forcer coils and core.
In due course, the stiction problem was eliminated by redesigning the forcer-calibrator to incorporate a larger gap clearance (Figure 15). To minimize the thermal problem, strip heaters were mounted on the MERTS frame, resulting in a controlled condition whereby the residual thermal drift was well within the design capabilities of the system. To compensate for this residual drift, the MERTS is mounted at a 0.5" tilt, which allows the use of the motorized fine balance weight for maintaining the beam null position (Figure 17).
V. PERFORMANCE RESULTS
With the final MERTS configuration determined (i.e., 0.5" tilt, strip heaters, three-point mount, and so forth), a test was conducted using a cesium ion engine as a calibration standard to evaluate the MERTS system under operational conditions. In particular, two areas were evaluated. One was the precision with which the MERTS followed the engine thrust, and the other was the accuracy of the MERTS calibration system. The test setup is shown in Figure 24. It should be noted here that the maximum output thrust of this engine is 89 pN (20 plb), which allowed the use of the 445 pN (100 plb) scale on the MERTS, the most sensitive of the three ranges.
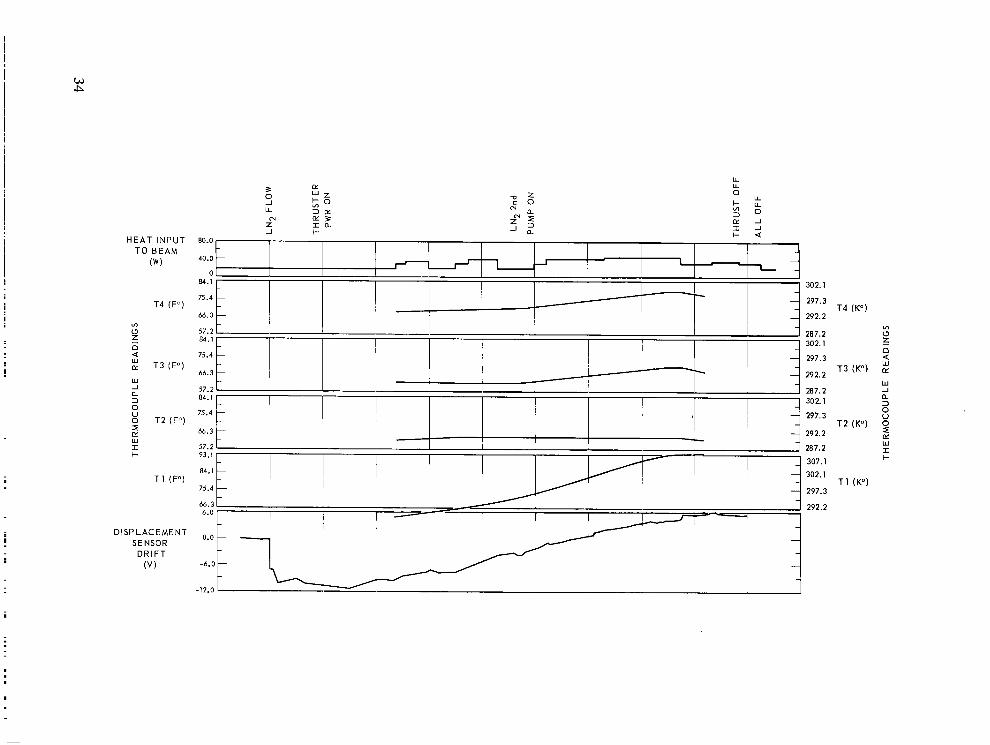
The test lasted a total of 10 hours. During the entire test, the strip heater power, displacement output drift (V), thruster power, and various thruster and MERTS temperatures were monitored; results are presented graphically in Figure 32. The technique by which power is applied to the strip
36
heaters is still experimental and, at present, involves manual control. The method of control is for the operator to observe the direction of output drift and correspondingly alter the heater power input. As can be seen from the curves, it was not until about the 9th hour that the drift rate leveled off. Thrust data taken on future tests will be done after this leveling-off occurs so that rezeroing will not be necessary. The thermocouple locations are shown in Figures 7 and 10.
Referring to Figure 32, it is seen that a sharp negative drop occurs in the output drift trace at 1 hour. This coincides with the introduction of liquid nitrogen into the cryogenic shrouds inside the chamber. As there is no significant change in any of the temperature traces at that point in time, the transient is apparently due to the distortion of the shroud and its frame. In a previous test using gaseous nitrogen to pressurize the shroud incrementally, it was observed that corresponding steps were produced in the output signal. As seen in Figure 24, the MERTS mounting structure is mounted directly to the shroud support rails. Any distortion occurring in the shroud is transmitted to the MERTS through the rails. To nullify this effect, a new mounting arrangement is presently being designed whereby the MERTS rests directly on the chamber rails, thereby bypassing the shroud support rails.
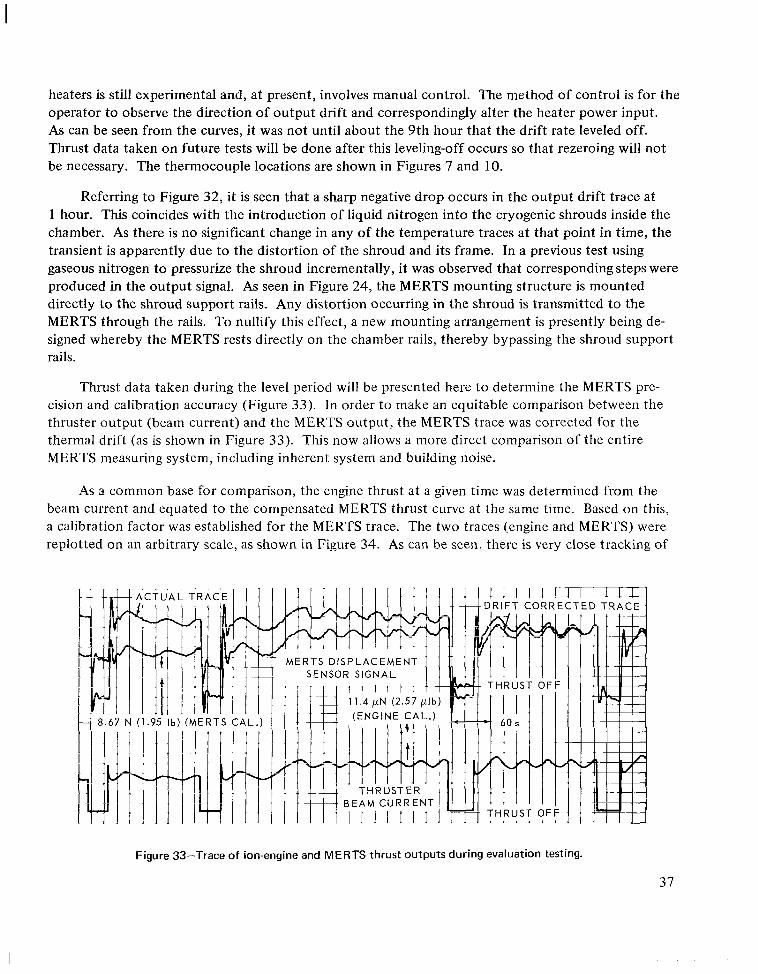
Thrust data taken during the level period will be presented here to determine the MERTS precision and calibration accuracy (Figure 3 3 ) . In order to make an equitable comparison between the thruster output (beam current) and the MERTS output, the MERTS trace was corrected for the thermal drift (as is shown in Figure 3 3 ) . This now allows a more direct comparison of the entire MERTS measuring system, including inherent system and building noise.
As a common base for comparison, the engine thrust at a given time was determined from the beam current and equated to the compensated MERTS thrust curve at the same time. Based on this, a calibration factor was established for the MERTS trace. The two traces (engine and MERTS) were replotted on an arbitrary scale, as shown in Figure 34. As can be seen, there is very close tracking of
4 A C T U A L TRAC’E I I I I I !rmi/Ij lERTS D I S P L A C E M E N T
SENSOR SIGNAL
N (1.95 Ib) (MERTS
ILIt THRUST ERI f I l l
Figure 33-Trace of ion-engine and MERTS thrust outputs during evaluation testing.
37

---- - MERTS ENGINE
Figure 34-Comparison of thermally compensated MERTS output and ion-engine output.
Figure 35-Thermal drift of MERTS output.
the MERTS to the oscillatory thruster output. In the worst case, there is about 2.7 pN (0.6 plb) difference between the ion engine and MERTS, which is within 5 percent of the average 53-pN (1 2-plb) thruster output. In the best case, there is perfect agreement with the ion engine. There exists an average error of approximately 2.5 percent.
The calibration factor for the MERTS trace established by the above procedure is 1.66 X lo2 N/division (0.374 X 10⁻⁶ lb/division). The calibration factor established independently by using known weights and thus establishing the factor for the calibrating coil on the MERTS was 1.73 X 1O2 N/division (0.390 X lb/division), which is within 4.3 percent. This is excellent correlation, considering the fact that 1 percent of the 8.9-mN (2-mlb) calibrator scale had to be used to calibrate 89 p N (20 plb) full scale for this test. The 445-pN (100-plb) calibration coil was not operational for this test, but will be incorporated for future work. It will provide higher calibration accuracy in the micro-pound range, since a greater percentage of its scale will be utilized.
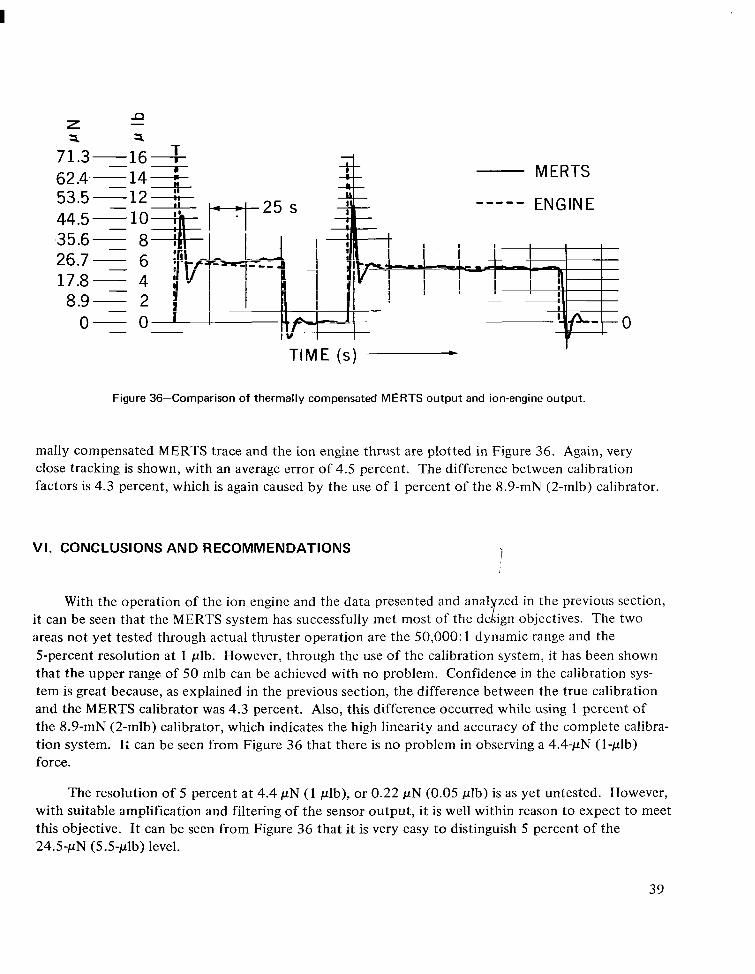
Under the same procedure for comparing the engine thrust to the MERTS output, another section of the data was taken and analyzed (Figure 35). These data are at an average thrust of 24.5 pN (5.5 plb) and are relatively steady, compared to the oscillatory curve previously analyzed. The ther
38
-Z a a
71.3- -167 T
62.4.- -14 53.5 -12-44.5 -10-.35.6-- 8 26.7 -- 6 17.8 -- 4 8.9 - 2
0- 0-
M ERTS
0 I
TIME (s)
Figure 36-Comparison of thermally compensated MERTS output and ion-engine output.
mally compensated MERTS trace and the ion engine thrust are plotted in Figure 36. Again, very close tracking is shown, with an average error of 4.5 percent. The difference between calibration factors is 4.3 percent, which is again caused by the use of 1 percent of the 8.9-mN (2-mlb) calibrator
VI. CONCLUSIONS AND RECOMMENDATIONS i
With the operation of the ion engine and the data presented and anal zed in the previous section, it can be seen that the MERTS system has successfully met most of the de lign objectives. The two areas not yet tested through actual thruster operation are the 50,000: 1 dynamic range and the 5-percent resolution at 1 plb. However, through the use of the calibration system, it has been shown that the upper range of 50 mlb can be achieved with no problem. Confidence in the calibration system is great because, as explained in the previous section, the difference between the true calibration and the MERTS calibrator was 4.3 percent. Also, this difference occurred while using 1 percent of the 8.9-mN (2-mlb) calibrator, which indicates the high linearity and accuracy of the complete calibration system. It can be seen from Figure 36 that there is no problem in observing a 4.4-pN (1-plb) force.
The resolution of 5 percent at 4.4 pN (1 plb), or 0.22 pN (0.05 plb) is as yet untested. However, with suitable amplification and filtering of the sensor output, it is well within reason to expect to meet this objective. It can be seen from Figure 36 that it is very easy t o distinguish 5 percent of the 24.5-pN (5.5-plb) level.
39
To further improve the MERTS system, future efforts will be concentrated on two major areas. One is to design and incorporate a calibration coil for the 4.4-pN (I-plb) to 445-pN ( 1 00-plb) scale so that the 8.9-mN (2-mlb) calibrator will not have t o be used. The other is to design and develop a mounting structure that will rest directly on the chamber walls rather than on the cry0 liner, as it presently does. It is expected that this arrangement will minimize the MERTS sensor shift due to the introduction of liquid nitrogen into the shrouds, which presently occurs as shown in Figure 32.
At present, there is no immediate requirement for an external fuel supply; therefore, the installation of one is not being pursued. However, as mentioned previously, the design of a system by which the fuel could be transferred from a tank to a thruster on the MERTS beam has been completed.
Goddard Space Flight Center National Aeronautics and Space Administration
Greenbelt, Maryland, October 13, 1970 120-26-17-06-51
REFERENCES
1. Harris, Cyril M., and Crede, Charles E., “Shock and Vibration Handbook,’’ Vol. 1, 2, and 3 , McGraw-Hill Book Co., Inc., N.Y., 1961.
2. Roark, Raymond J., “Formulas for Stress and Strain,” 3rd Ed., McGraw-Hill Book Co., Inc., N.Y., 1954.
3 . Thaler, George J., and Brown, Robert G., “Analysis and Design of Feedback Control Systems,” McGraw-Hill Book Co., Inc., N.Y., 1960.
40 NASA-Langley, 1971 - 28

AERONAUTICS IONNATIONAL AND SPACE ADMINISTRAI WASHINGTON,D. C. 20546
OFFICIAL BUSINESS FIRST CLASS MAIL PENALTY FOR PRIVATE USE $300
POSTAGE AND FEES PAID NATIONAL AERONAUTICS ANi
SPACE ADMINISTRATION
0 1 8 001 C 1 U 2 8 710820 S00903DS DEPT OF THE A I R FORCE AF SYSTEMS COMMAND AF WEAPONS LAB (WLOL) ATTN: E LOU BOWMAN, CHIEF TECH L I B R A R Y KIRTLAND AFB NM 87117
If Undeliverable (Section 158POSTMASTER : Postal Manual) Do Not Return
"The aeronautical and space activities of the United States shall be conducted so as t o contribute . . . t o the expansiofa of hU7Jlan knowledge of phenomena in the atirlosphere and space. The Adniinistration shall provide for the widest practicable and appropriate dissemination of inforniation concerning its activities and the results thereof."
-NATIONALAERONAUTICSAND SPACE ACT OF 1958
NASA SCIENTIFIC AND TECHNICAL PUBLICATIONS
TECHNICAL REPORTS: Scientific and technical information considered important, complete, and a lasting contribution to existing knowledge.
TECHNICAL NOTES: Information less broad in scope but nevertheless of importance as a contribution to existing knowledge.
TECHNICAL MEMORANDUMS: Information receiving limited distribution because of preliminary data, security classification, or other reasons.
CONTRACTOR REPORTS: Scientific and technical information generated under a NASA contract or grant and considered an important contribution to existing knowledge.
TECHNICAL TRANSLATIONS: Information piiblished in a foreign language considered to merit NASA distribution in English.
SPECIAL PUBLICATIONS: Information derived from or of value to NASA activities. Publications include conference proceedings, monographs, data compilations, handbooks, sourcebooks, and special bibliographies.
TECHNOLOGY UTILIZATION PUBLICATIONS: Information on technology used by NASA that may be of particular interest in commercial and other non-aerospace applications. Publications include Tech Briefs, Technology Utilization Reports and Technology Surveys.
Details on the availability of these publications may be obtained from:
SCIENTIFIC AND TECHNICAL INFORMATION OFFICE
NATIONAL AERONAUTICS AND SPACE ADMINISTRATION Washington, D.C. PO546