Embed Size (px)
Citation preview

Design and construction of a velocity map
imaging spectrometer
Master's thesisby
Sara Thorin
Lund Reports on Atomic Physics, LRAP-327Lund, August 2004

Abstract
Spectrometers for measuring electron energies can be useful in many areas inphysics . In the Atomic Physics department in Lund an electron spectrometeris used for characterization of attosecond pulses.
The object of this Master's thesis was to design and construct a velocity-mapimaging spectrometer which apart from electron energies also give informationabout the electrons angular distribution. This spectrometer will be used in theattosecond pulse research.
A detailed theory for the differential cross section and angular distribution inphotoionization is presented. Simulations of electron trajectories in an electricfield has been made and the dimensions of the spectrometer has been designedaccordingly along with suitable voltage settings for the electric field and fromthis an entire imaging setup has been constructed.

Contents
1 Introduction1.1 Electron spectrometers . . . . . . . . . . . . . . .
1.1.1 Hemispherical Analyzer . . . . . . . . . .1.1.2 The Time-Of-Flight Spectrometer (TOF)1.1.3 The Velocity Map Imaging Spectrometer (VMIS)
1.2 Motivation for the VMIS .1.3 Outline .
2 Angular distribution in photoionization2.1 Transition Rates . . . . . . . .2.2 The Dipole Approximation ..2.3 The Differential Cross Section .
2.3.1 One Photon Ionization.2.3.2 Two photon ionization .
2.4 Examples of Angular Distribution
3 Principle of the VMIS3.1 From gas cloud to image .
3.1.1 Electrons are emitted .3.1.2 Acceleration towards the detector .3.1.3 Taking a snapshot .....
3.2 Energy and angle resolved spectra3.3 Focusing the image . . . . .3.4 Additional operation modes .
3.4.1 Imaging ions .... .3.4.2 Time-Of-Flight mode
4 Design and construction4.1 Electrode design .
4.1.1 Desired properties for the spectrometer4.1.2 Simulations ...4.1.3 Voltage settings.
4.2 p,metal shield .4.3 Vacuum .
4.3.1 Vacuum chamber.4.3.2 Vaccum pumps
4.4 Gas input . . . .4.5 Detection system ...
1
3344456
77
1012121518
21222222232527282829
3033333335363636363737

4.6 Image processing ..4.7 Abel inversion. . . .4.8 Time-of-flight mode
5 Operating the VMIS5.1 Experiment at AMOLF
5.1.1 Experiment...5.1.2 Result .
5.2 Operation of the spectrometer.5.2.1 Vacuum .5.2.2 MCP, phosphor and CCD camera5.2.3 Laser alignment .5.2.4 Repellor and extractor voltages
5.3 Planned test .
6 Summary and outlook6.1 Summary and Outlook.
Acknowlegements
Bibliography
2
383839
41414141424243434343
4545
46
47

Chapter 1
Introduction
People have always strived to better understand the world around them by looking at it, examining and experimenting. When it comes to understanding verysmall particles, like electrons, it turns out they are quite difficult to examine.
One way of understanding more about the physics of an electron is knocking itout from its atom and finding out where it goes and what energy it has. Lookingin to this process gives information not only on the behavior of the electron,but also on the force that knocks it out from the atom. This means that beingable to detect and extract information about the emitted electron would beinteresting both from a fundamental physics point of view and for examiningphysical phenomena that can ionize atoms, for instance lasers, x-rays, particleradiation and collisions. In this thesis it is electrons ionized by laser that willbe treated.
An electron can be detected for example by letting it hit a surface where itknocks out several more electrons. These electrons will in their turn hit anothersurface where they will be multiplied again and so on until a measurable currenthas been created. This gives a way of detecting if and when an electron has hita surface, but it does not give any information on the energy of the electron.For this purpose an electron spectrometer is needed.
Electron spectrometers are an important tool in both atomic and nuclear physicsas well as in chemistry and biology.
1.1 Electron spectrometers
There exists a number of different ways to measure electron energies. A fewexamples are the Hemispherical Analyzer, the Time-Of-Flight Spectrometer andthe Velocity Map Imaging Spectrometer.
3

1.1.1 Hemispherical Analyzer
This spectrometer consists of two concentric hemispheres held at different potentials. The electrons enter and leave trough narrow slits. Only the electronswith the right kinetic energy can pass the analyzer at a certain potential difference. If the electrons are traveling very fast they will hit the outer hemisphereand if their kinetic energy is very low they will be attracted to the inner hemisphere. Thus only electrons of a very narrow energy region will be able to passthrough the whole analyzer to the detector.
OuterHemisphere
Figure 1.1: Hemispherical analyzer
1.1.2 The Time-Of-Flight Spectrometer (TOF)
A TOF spectrometer is a long tube with a detector on one end. In the otherend there are two electrodes with different potentials. Electrons are emitted inthe ionization region and will fly toward the detector trough a hole in the innerelectrode (see figure 1.2). How long it takes for the the electrons to reach thedetector depend on their kinetic energy. By looking at the time of flight withfor example an oscilloscope the energy of the electrons can be determined.
One type of TOF spectrometer is The Magnetic Bottle Electron Spectrometer(!VIBES). In an !VIBES a magnetic field is created around the TOF tube andthe ionization region in the shape of a bottle - hence the name - and theelectrons are adiabatically accelerated toward the detector. The !VIBES is ableto collect all electrons with a velocity component towards the detector whichgive a very high detection efficiency and a much stronger signal compared tothe plain TOF.
1.1.3 The Velocity Map Imaging Spectrometer (VMIS)
The development of detectors that can register the position where the electronhit, and the use of CCD-cameras gave rise to a new technique in electron spectrometry called "velocity-map imaging". This technique has been used since1997 [1].
4

ionization region
electrodes
detector
Figure 1.2: Schematic view of time-of-flight spectrometer
The VMIS consists of a long tube with the ionization region in one end and adetector system in the other. On each side of the ionization region there is anelectrode with high voltage which creates an electric field, similar to the TOFspectrometer. But in this case the voltages on the two electrodes are so high sothat the electrons initial kinetic energy can be neglected in the time-of-flight tothe detector. Instead it is the position where the electrons hit the detector, amultichannel plate and a CCD-camera, which give information on the electronenergies.
1.2 Motivation for the VMIS
In the Atomic Physics department in LTH, research is being done on high harmonics created by focusing a femtosecond IR laser in a gas. The wavelength ofthe harmonics extend up to the extreme ultra violet (XUV) region. Harmonicsare used to create attosecond pulses or pulse trains [3].
One tool used in analyzing these pulses is an electron spectrometer where theharmonics ionize the detection gas in the spectrometer and the electron energyplus the ionization energy give the energy of the individual harmonics. Theatoms in the detection gas can be ionized not only by a single harmonic butalso in a two photon process by a harmonic and an initial IR photon. This giverise to sidebands in the electron spectra with energies between two consecutiveharmonics. These measurements are done with a magnetic bottle spectrometerdescribed above.
So, why does one want to build a velocity map imaging spectrometer? Thedifference between the MBES and the VMIS is that the imaging machine givesan actual image of the electrons velocity distribution. If the electrons are emittedfrom an s-orbital this angular distribution is equal in all directions but if theionized level is a p-orbital or higher there will be a higher probability for the
5

electrons to be emitted in certain angles - the differential cross section forphoto ionization is angle dependent.
Angular information can be extracted in both TOF and hemispherical spectrometry by either moving the spectrometer in different angles or by changingthe polarization of the laser. In the MBES however the angular information islost due to the fact that the magnetic field redirects the electrons towards thedetector. The advantage of the VMIS compared to the TOF spectrometer andthe hemispherical analyzer is that all angular information is gathered in oneimage and nothing needs to be moved or turned.
The angular information given by imaging spectrometry is interesting both froma general scientific point of view, and for a number of applications. The angulardistribution of emitted electrons will for example differ for different elements andcompounds, different ionized orbitals, number of photons involved in the transition and which electric or magnetic order of the transition (dipole, quadrupoleetc.).
In the case of characterizing attosecond pulses it turns out that for single pulsesand very short pulse trains the photoelectrons created by single and two photon- IR + harmonic - ionization overlap in energy. Thus an electron spectrometer just measuring energy would not be able to distinguish between the harmonicand the sideband. But since the angular distribution of photo electrons is different in these two cases an image of the emitted electrons can be used for theanalysis [2J.
So besides being a way of getting an informative and visual view of the electronsenergy spectra, the velocity map imaging spectrometer is an essential tool whenthe attosecond pulse trains get shorter and shorter and single pulses can beachieved.
Designing and constructing a velocity map imaging spectrometer is the objectiveof this diploma thesis.
1.3 Outline
This report deals with a wide range of aspects in creating a velocity-map imagingspectrometer. Some are only mentioned briefly while others are discussed insome detail.
Chapter 2 gives a derivation and demonstration of the differential cross sectionfor electrons in photoionization.
The principle of the spectrometer and of velocity-map imaging in general isdiscussed in chapter 3.
Chapter 4 deals with the design of the VMIS and gives a short explanation ofthe different constituents.
Chapter 5 includes some measurements done on an imaging machine in Amsterdam, a planned test, and a short manual on how to operate the spectrometer.
6

Chapter 2
Angular distribution inphotoionization
When an atom absorbs electromagnetic radiation it will make a transition to ahigher lying state. If the energy is high enough the final state for the electron isin the continuum, that is, the electron is ejected from the atom. This is calledthe photoelectric effect. In this chapter I will derive the differential cross sectionfor photoionization - which gives the probability for the electron to be emittedin a certain angle - for both one and two photon processes.
2.1 Transition Rates
The time-dependent Schrodinger equation can be written as
(2.1)
where'h2
2 Ze2
Ho=--\J ---2m 47rcor
is the Hamiltonian describing the one electron atom and
I ( ) i'heH t = --A· \Jm
(2.2)
is the time dependent Hamiltonian describing the perturbation, due to the outerelectrical field caused by the laser [4].
A is a vector potential that generates the electric field and can for a plane wavebe expressed as
A(i, t) = Aot (ei(ki'-wt) + e-i(kr-,;t))
The unit vector t is the polarization vector of the laser light.
7
(2.3)
(2.4)
The interaction between the electrical field and the atom can be treated withtime-dependent perturbation theory. The time independent Schrodinger equation for the Ho Hamilton operator is given by
The eigenfunctions 1/Jk are normalized wave functions forming a complete setof base functions. We look for a solution to the time-dependent Schrodingerequation of the form
\{1 = L Ck(t)1/Jk(r)e-iEkt/1ik
hl 2 describes the probability that the system is in state k at time t.
If it is now assumed that there is no perturbation at time t = 0 so that thesystem at this time is in an eigenstate of Ho, then Ci(tO) = 1 and Ck(tO) = 0 fork =I- i, where i stands for initial, and the time dependent perturbation theorycan be used. The coefficient describing the population in the final state f afterinteraction with the laser beam is given by
for the case of one photon ionization. Here Wfi is the frequency differencebetween the final and initial states. For the two-quantum photoelectric effectthe second order perturbation theory is used:
Using equation (2.2) and (2.3) we obtain in the one photon case:
If W fi :::::; W the first part of this expression is dominating and the second partcan be neglected. This means that a photon is absorbed by the atom and theexpression for Cf becomes:
e ei(Wji-W)t - 1- - AoN!! -,--------,--
m 'i(wfi -w)
~A21 ~1 .12 1- COS(v.:fi - w)t2m2 0 j f', (Wfi -w)2 ,
F(t,W/i- W)
8

As t ---> 00 it can be shown that F(t,wfi -w) approaches the value 7rtO(Wfi -w)and so
2 e2
2 2Icf(t)1 = 2-2 AolMfil 7rtO(Wfi - w)m
This is the probability for the system to be in state f at time t if t is large.
The absorption or transition rate is now defined as
d I () 12 e2
2 2-d Cf t = Wfi = 2-2 AolMfil 7rO(Wfi - w)t m
ltVfi can be written as a function of intensity per unit angular frequency range,l(w) = 2Ccow2A6.
The absorption cross section is defined as the rate of absorption of energy dividedby [(wf;)' that is,
It is now possible to derive a cross section for a particular photo ionizationprocess. The total cross section is obtained by integrating over the continuousfinal states of the emitted electron.
47r2
Ji2 Q J 1 2IJ"tot = 2 dkr-IMfil O(Wfi - w)
m Wfi
The integration element can be written dkr = kJdkfdD. Using this and the fact
that the kinetic energy in the final state is given by E f = Ii;;; ,the total crosssection can be rewritten as
Performing the integration over E f with the help of the Dirac function gives
which now leads to the expression for the differential cross section
This gives the probability for the electron to be emitted within the solid angledD in the direction ((), ¢).
9

________ 1
Figure 2.1: Ionization with one photon
In the two photon case the expression for the differential cross section is thesame, but the matrix element !vIfi is a bit more complicated.
W 2............ S
__... 1
Figure 2.2: Ionization with two phmons
In order to calculate cross sections for different transitions the matrix elementIA1ji(W)1 has to be evaluated. To make this easier a dipole approximation canbe made.
2.2 The Dipole Approximation
This derivation is done for the one photon matrix element, but the procedureis similar in the two photon case.
The exponential in the matrix element IiVIfi (w) I, eikr can be expanded as
eikr = 1 + (ik· r) + !.-(ik' r)2 + ...2!
10

The first term in this expansion correspond to electric dipole transitions. Thehigher terms represent magnetic dipole, electric quadrupole transitions and soon.
The extent of atomic wave functions is of the order of the Bohr radius of theatom, that is about lA. The wave number k = 27r/ A is for optical transitionsof the order 103A. This means that the quantity k· r is of the order 10-7
ill,
and eik.r can be approximated with unity. This leads to the electric dipole
approximation.
Furthermore this expression can be rewritten according to the following calculations:
Pd-rdt
-inV1-pm
,im fl'I'Et;: < rz >
The general relation 1t < A >= *< [H, A] > in this case leads to
1 .-:- < flrH - Hrlt >tn1 1in < flrlHi > - in < Hflrli >1 . 1 .in E i < flrlt > - in E f < flrlt >
.~ (Ei - Ef) < flrli >t,. '-v----"'~-hwfi rfi
iwfir fi
The matrix element lvIIi finally takes the form
(2.6)
This expression represents the component of the dipole moment in the i direction between the initial and final states. If (2.6) is non vanishing, the transitionis allowed.
11

2.3 The Differential Cross Section
There are several papers[6][7][9][1O] and theses[ll] which treat different partsof the angular distribution in the atomic photoeffect.. In this section I willdemonstrate the major steps in the derivation of the photoionization differentialcross section both in the one and two photon case.
2.3.1 One Photon Ionization
The differential cross section in the dipole approximatiun can now be written as
If it is now assumed that the polarization of the laser is along the z-axis thedifferential cross section can be written
(2.7)
This expression is valid in a one electron system but can be expanded to applyto many electron systems by replacing the z operator by a sum over all electrons.
The wave functions for the initial state and the continuum final state can bewritten
Pnl (r) Ylm(f}, ¢)00 L
41T L( _i)L eit5 L Pkdr) L YLM(fJ, ¢)YiM(e', ¢')L=O M=-L
(2.8)
(2.9)
where i symbolizes the the quantum numbers nlm and f symbolizes kLM, k isthe momentum of the ejected electron.
z as an operator can be written
(4;z = rcose = V3 rYlQ (e,¢)
Using (2.8), (2.9) ancl (2.10) the matrix element M!i can be calculated
(2.10)
where RnlkL denotes the radial integral JrPnl(r)Pkl(rrdr.
12

z,
,"
kl1f 8'/ :
-/ :I
Figure 2.3: Coordinate system showing the angle between the laser polarizationand the direction of the the ejected electron.
In the dipole approximation the allowed transitions are L = l ± 1 and 6m = 0for linearly polarized light and the sum over !'vI reduces to j\lJ = m. Now< YLMIYlOlYim > can be calculated.
~JYZ-m(B, ¢)YlO(B, ¢)Yim(B, ¢)drl
~ [( 2L + 1)(3'] 1/22(_l)m ( / < L100lLO >< L1mOIlm >3 41T 2l + 1
[(2L + 1)] 1/2
(_l)m (2l + 1) < L100lLO >< L1mOIlm > (2.11)
where < £1001l0 >< L1mOIlm > are Clebsch Gordan coefficients.
The sum over L in j\lJji reduces to
M ji = Mf;=l-l + Mt=l+l
The differential cross section is proportional to the square of Mji and summingover all initial states gives the following expression
m m
+
2"[ 241T (2l-1)(41T) ~ /Rnlk(l-l) I 3 (2l + 1)
m
I < (l - 1)1001LO > 12
1 < (I - l)lmOllm > nY(l-llm(B', ¢'W241T (21 + 3)
IRnlk(l+lll 3 (2l + 1)
I < (l + 1)1001LO > 12
1 < (l + l)lmOllm > 12 1Y(l+llm(B', ¢'W
13
(2.12)
(2.13)
+ 2Re{(_i)(l-1)-(1+1)ei (OI_I-OI+JlR R 47f [(21_1)]1/2 [(21+3)]1/2nlk(l-l) nlk(l+l) 3 (21 + 1) (21 + 1)
< (l- 1)100110 >< (l - 1)1mOllm >
< (l + 1)100110 >< (l + 1)1mOllm > Y(l-l)m(B', ¢/)Y(/+l)m(B/,¢/)}] (2.14)
Simplifications can first be made by rewriting the Clebsch Gordan coefficientsaccording to the following formulas[8].
< (l _ 1)l(-m)mI1O > < llmOI(l _ 1) >= [(l - m + 1)(l + m + 1)] 1/2m (2l+1)(l+1)
< (I + 1)l(-m)mI1O > = < llmOI(l + 1)m >= [U (;~\rlm)r/2 (2.15)
Substituting the expressions for the Clebsch Gordan coefficients and using therelations[7] to make the summation over m
L IYiml 2
L m2 1Yiml2
leads to
21 + 147f (2.16)
l(l + 1)(2l + 1) sin2B (2.17)87f
U+ 1)2 - m 2 2 12 - m 2 2(2l + 1)(21 + 3) lY(l+l)ml + (2l- 1)(2l + 1) lY(l-l)ml
{((l+1)2-m2)(l2-m2) }
+ 2Re (2l + 1)2(2l + 3)(21 _ t, Y(l+l)mY(I-l)m (2.18)
14

dudD
ex [R 2 612 - l(l + 1) sin2e R 2 20 + 1)2 - l(l + 1) sin2e
nlk(l-l) 6(2l - 1) + nlk(l+l) 6(2l + 3)
2R { i6'_1-i6'+1 R R- e e nlk(l-l) nlk(l+l)
((2l+1)COS2e _ (l+1)2 l(l+l)sin2g _ l2 )}]
6 6(2l + 3) + 6(2l + 3) 2(2l - 1)
This expression can be rewritten in terms of Legendre polynomials according to
which leads to
du ~ 41r2nkf mw lRf-1 + (L + I)RT+1dD 41r Ii 3(2l + 1)
CTtot
(
l(l- I)Rf-1 + (l + l)(l + 2)R41 - 6l(i + I)R1+1R1- 1COS(OI+l - 01-1) , )1 - P2(COS e)
, (2l + 1) [lRf-1v
+ (I + I)RT+11 ,
(3
Utat (1 - (3P2 ( cos e'))4rr
where Utat is the total cross section for photoionization and ,8 denotes the asymmetry parameter.
Within chosen 1orbital it is the radial wave functions - and thus the specific typeof atom - that control the appearance of the differential cross section. The Utat
and (3 factors can be evaluated through for instance Hartree-Fock calculations.
2.3.2 Two photon ionization
With two photons involved, the ionization cross section is even more complex.Especially when the two photons are of different frequency. However the angularpart is quite straight forward - in principle just an extra cosine term to thepower of four is added - and I will focus on this angular dependence, whichis the interesting part in this context, and just collect the different physicalconstants and the energy and intensity dependence in a constant C(W1,w2,I).Here I is the intensity of the incident radiation and Wl and W2 the frequenciesof the first and second photon in the process.
From second order perturbation theory the differential cross section in the twophoton case can, in the dipole approximation, be found to be
15

2
da _ C( . I) L < fIE· f1s >< sl!· f1i >- WtS,Wsj, .
drl Ei - Es + 1iW1 + tEs
''-----vv-------MI'
where E is a small number which approaches zero and keeps the denominatorfrom giving a singularity. E i and E s are the energies of the initial and intermediate states.
Using the wave functions (2.8) and (2.9) and the intermediate wave function
together with (2.10) now gives
< fIE· f1s >< sll!· f1i >=
< 47f f) _i)LeiOLPkL(r) t YLM(B, ¢)YLM(B', ¢/)I {f-rYlQ(B, ¢)IPy>.(r)Y>'I"(B, ¢) >L=O M=-L
< Py>.(r)Y>'I"(B, ¢)I{f-rYlQ(B, ¢)lPnl(r)Yim(B, ¢' >
(4 )2 00 L+ L(-i)LeiOLR>.IL < Im1101Afl. > L < Atll10lLM > YLM(B',¢')L=O M=L
For linearly polarized light the only possibility is again M = m. Using this factand equation (2.11) gives
~ < fIE· f1s >< slE· f1i > =L..: Ei - Es + 1iw] - iE
._ [21 + 1 ] 1/247f ~(_i)LetOL -- < 1100110 >< llmOIAm >
L.J 2L+1>.L
< A100110 >< A1mOlLm > YLm(B', ¢')TAl,(w)
The selection rule for the L quantum number in the two photon case is L =HO, ±2 which leads to four terms in the sum due to the four different possibilitiesfor allowed transitions. These possibilities are 1(1 ----> 1+1 ----> l+2), 2(1----> 1+1 ---->1),3(1 ----> 1- 1 ----> I) and 4(1----> 1- 1 ----> 1- 2).
Two of the transitions give the same final state and the differential cross sectiongets the form
16

Substituting the expressions for the Clebsch Gordan coefficients using (??) and(2.15) gives the following matrix elements:
((l-m+1)(l-m+2)(I+m+1)(I+m+2))1/2 i81+2 I I
1v11+2 (21 + 1)(21 + 3)2(21 + 5) TI+l,1+2e Yi+2,m(e ,if; )
((I-m)(l-m-1)(I+m)(l+m-1))1/2 i8 I I
MI - 2 (21 _ 3)(21 _ 1)2(21 + 1) 11-1,1-2 e 1-2Yi_2,m(e, if;)
((I - m + 1) (I + m + 1) (l - m) (l + m) ) i8 I I
Ml - (21 + 1)(21 + 3) Tl+ 1,1 + (21 _ 1)(21 + 1) TI - 1,1 e I Yi,m(e ,¢ )
Apart from equation (2.16), (2.17) and (2.18) the following relations are neededto make the summation over m [[71]:
L m4 lYml!2 = l(l + 1)(21 + 1) sin2e (1 + ~(I - 1)(1 + 2) sin2e)87T 4
m
(12 _ 2 ) 1/2 ( (I _ 1)2 _ 2) 1/22 A2 _ m2 m m Y;* y; _L( ) (21 + 1)(21 - 1) (21 - 1)(21- 3) 1-2,m l,m-
m
1 l(l - 1)-6- -2-1- (8A2 - 4 [3A2 + (I + l)(l - 2)] sin2e+ 5(1 + 1)(1 - 2) sin2e)1 7T - 1
((I - 1)2 - m2 ) 1/2 ( 12 _ m2 ) 1/2 ( (l + 1)2 _ m2 ) 1/2 ( (l + 2? _ m2 ) 1/2
2L (21 - 3)(21 - 1) (21 - 1)(21 + 1) (21 + 3)(21 + 1) (21 + 3)(21 + 5)m
* 1 (I - 1)1(1 + 1)(1 + 2) . 2 . 4
Yz+2,mYi-2,m = 167T (21 _ 1)(21 + 1)(21 + 3) (8 - 40sm e + 35 sm e)
I will for simplicity introduce the quantity X pp' which takes care of the radialpart and the phase shift
X pp' = Re (T;L T)..' u ei (8 v -8Ll )
where p and pi represent the different transition paths (l -4 A -4 L) and (l -4
A' -4 L' ) which will be denoted by the numbers for the allowed transitionchannels established earlier.
Rewriting the sine terms as cosine and gathering all terms of the same powereventually leads to a final expression for the differential cross section in a twophoton process
17

where
a
+
+
1 [(I+l)(l+2)(3l2
+5l+4)()( X 2X)16(2l + 1)2 (2l + 1)2 . 11 + 22 + 12
l(l - 1)(3l2 + l + 2)(2l _ 1)2 (X33 + X44 + 2X34 )
6(l - l)l(l + l)(l + 2) ](2l _ 1)(2l + 3) (X13 + X 14 + X 23 + X 24 )
b
+
+
c
+
+
1 [(l + 1) ( 2 ?)( )2 (l r (l+2)(l+3)(l-4)X 11 ,l(l +5l+8)X?2-6(1+2)(l~+l+2)X128 2l + 1 2 + 3 - -
(2l ~ 1)2 ((l + 1)(l2 - 3l + 4)X33 + (l - l)(l - 2)(l + 5)X44 - 6(l - 1)(l2 + l + 2)X34 )
2l (l + 1) ]( )( l ) (([2 + l + 6)X23 - 3(1- l)(l + 4)X'4 - 3(l + 2)l - 3)X13 - 15(l - l)(l + 2)X14 )2l - 1 2 + 3 -
1 [(l+1)(l+2)16(2l + 1)2 (2l + 3)2 (3(l + 3)(l + 4)Xll - 3l(l - 1)X22 - 10l(l + 3)X12 )
l(l-l) .( )2 (3(l + l)(l + 2)X33 + 3(l - 2)(1- 3)X 44 - lO(l + l)(l - 2)X34 )2l - 1
2l(l + 1)(2l _ 1)(2l +3) (3(l - l)(l + 2)X23 - 5(1- 1)(1- 2)X24 - 5(1 + 2)(l + 3)X13 + 35(l - l)(l + 2)X14
This cross section could also be written in terms of Legendre polynomials:
2.4 Examples of Angular Distribution
This long derivation has resulted in two simple equations for the differentialcross section. It accordingly turns out that, with the exception of ionizationof an s orbital where the electron distribution is uniform, it is more probablefor electrons to be emitted in some angles than in others. The appearance ofthis angular distribution depends on many factors which are contained in theasymmetry parameters (3, A, Band C. The angular distribution will vary fordifferent electron energies: orbitals, different compounds and different numbersof contributing photons.
'When it comes to harmonics there is, as I mentioned in the introduction: boththe possibility for one and two photon ionization. Besides the fact that thesedifferent processes will give different electron energies they will differ in angulardistribution.
18

An example of this illustrated in figure 2.5 is the ionization of argon with the15'th harmonic plus an IR photon. The (3 parameter for the photon energy16wIR is approximately ··0.3 [6) and corresponding values for A, Band Care0.2, 0.55 and 0.2 [2J.
Figure 2.4: Ionization by one or two photons.
ZTD
Figure 2.5: Angular distribution for electrons ionized by one or two photons inArgon.
For other values of the asymmetry parameters more complex shapes are produced. Figure 2.6 shows examples of this.
Besides knowledge of the electron energies this angular information can be extracted from one single measurement OIl an imaging spectrometer.
19

One photon ionization
o
Two photon ionization
18
A =0.9 B =-0.5 C =0.52
18U}·······,········.'.'>.i,······,;·········10
Figure 2.6: Shapes of the angular distribution for different asymmetry parameters.
20

Chapter 3
Principle of the VMIS
The principle of the VMIS is quite simple. Electrons are created in one endof the spectrometer at the intersection of a gas beam and a laser beam. Theyare then accelerated by an electrostatic field toward the detector where theirposition of impact is recorded. From this position information on both energyand angular distribution can be extracted.
Figure 3.1: Simple sideview of electrode tube with laser and electrons
The image will be a number of concentric circles corresponding to electronsemitted with different energies. The angular distribution of the electrons causesthe rings to only be visible in certain angles for which the probability for themto be emitted is large.
21

3.1 From. gas cloud to image
3.1.1 Electrons are emitted
The first step in the velocity map imaging process is the ionization of atoms. Alaser is focused in a gas cloud: the atoms in the gas are ionized and electronsare emitted. These electrons will be ejected in certain angles as discussed inchapter 2.
laser polarization axis
~---... electron
cloud
laser
Figure 3.2: A laser ionizes a gas and electrons are emitted
The direc:tion of the elec:trons depends on what orbital they are emitted fromand the energy of the light involved in the photoionization process. If harmonicsare used this means that electrons ejected by harmonics of different energy willhave different amount of kinetic energy and there will be an angular differencebetween electrons from the one and two photon processes.
3.1.2 Acceleration towards the detector
In the tube: where the electrons are created, an electrostatic field is introduced.It is a strong positive field that pushes the electrons forward to the detector.This doesn't interfere with the electron ejection angle and it almost doesen'taffect their radial velocity at all.
On the way to the detector the electron cloud keeps growing radially and whenit hits the Mep an image with em size concentric circles is produced. Electronswith larger kinetic energy - the ones from higher harmonics - will have agreater radial speed than the ones with lower energy and thus create larger
22

circles. If the electrons were uniformly emitted in a sphere - as is the casein ionization from an s-orbital - the image would be a complete circle, butbecause of the angular distributions some angles on the detector will not be hitby an electron at all. The circle will consequently only be visible in other angles.See figure 3.3
Figure 3.3: Electrons are emitted in the beginning of the electrode tube and animage is produced in the end.
3.1.3 Taking a snapshot
When the electrons hit the front of the !VICP they are multiplied and come out asan increased current on the other side and hit a phosphor screen. The phosphorwill fluoresce when hit by the current and this produces a visible image. Behindthe phosphor is a CCD camera which then takes a picture of the fluorescence.
This is the way images of the photoionization process are produced. Followingis a more detailed description of the imaging spectrometer.
23

CCD
..................................... . .
.,......
phosphor
l\IICP
Figure 3.4: The electrons are multiplied by the MCP and the CCD camera takesa picture of the fluorescing phosphor.
24

3.2 Energy and angle resolved spectra
In contrast to time-of-flight spectroscopy: where information of the electronkinetic energy is given by the time it takes for the particle to reach the detector,velocity map imaging gets the velocity information (kinetic energy and angulardistribution) from the two-dimensional image.
The position at which the electron hits the detector is directly proportional tothe electrons initial velocity in the yz-direction except for a magnification factorcaused by the electric fields component in the yz-direction. This results in aring on the detector with a certain radius R: related to the expansion speed Vaof the emitted electron cloud as R = vat where t is the time-of-flight.
y
electron trajectory
IRv-'
~--- -- v\11 0,,,,
x x
z
z~ L ~
Figure 3.5: Schematic view of the geometry of the imaging.
In the x-direction t.he electron gets the velocity
VE.x = /2TE
. m
from the electrostatic field. Here m is the electron mass. The kinetic energygained by an electron in such a field is
TE =qV
where q is the charge of the electron and V is the potential in which it isaccelerated. If the electric field component in the yz-direction is disregardedfor now and it is assumed that the acceleration region is small compared to thetotal length L of the spectrometer tube, the time-of-flight can be approximatedas
25

t~~=LJ mVE,x 2qV
This means the radius R = vot will be connected to the initial kinetic energy ofthe electron according to
where To = mv6/2.
Figure 3.6: This figure shows the fieldlines which are perpendicular to the electicfield.
However the electric field isn't just directed along the x-axis but also slightlyradially. It turns out [12] that the component of the field in the yz-directiononly contributes with a magnification factor N, that is, the radius of the circlesbecomes a bit larger than they would with an electric field strictly in the xdirection. The radius of the rings on the image thus behaves as
ffioR~NL -qV
This magnification factor needs to be determined through calibration for eachexperimental setup. In this way the energy To of the emitted electrons can bemeasured from the spectrometer image.
Apart from giving information about the energy of the electrons, the imagereceived from the spectrometer is angular resolved. The angular distributiondiscussed in chapter 2 causes the rings on the image to be visible only at certainangles. This means that looking at the angular dependent variations on the ringsgive some knowledge about the emitted electrons. The full three dimensionalinformation can be reconstructed from the projected two dimensional imagewith a mathematical transformation called Abel inversion which I will discusslater.
26

Figure 3.7: An exampel of a real image from an imaging electron spectrometer.
3.3 Focusing the image
The spectrometer consists of a long tube with the detection system in one end.In the other end of the tube is the repeller - a flat circular electrode. A coupleof millimeters in front of the repeller is the extractor. a similar electrode butwith a hole in the middle. A negative high voltage is applied to the repeller andextractor which creates an electric field in the electrode tube. The electrons areejected from an area between the repeller and extractor at the crossing of a gasbeam and a laser beam.
Ideally one would want the electrons to appear from one single point and fromthat point be accelerated toward the detector. However there is always a smallspatial volume in the gas-laser beam crossing and the electrons are created inthis mm large volume. The high positive voltage on the repeller electrode willcollapse the electrons in the x-direction (along the TOFaxis) into a thin pancakethat will propagate toward the detector. Thus it will seem like the electrons arecreated in this "pancake area".
One of the objectives of the spectrometer is to make all electrons with the sameinitial velocity - energy and angle - to appear on the same point on the detector regardless of where they were created. By changing the voltage on theextractor, or more specifically changing the ratio between the extractor andrepeller voltages i?;, one can focus the electrons so that they all end up onthe same point on the focal plane. This is due to the fact that the electronsbecomes refracted slightly inwards by the electric field and means that the electrodes serve as electrostatic lenses focusing the image sharply on the detector,compensating for the electrons initial area of creation. The focusing is howeveronly effective when the ionizing happens quite near the center of the ionization region. SIJ1IlION, the simulation software I have used, shows this effect bypicturing the electric high and low potentials as gravitational potentials in theform of hills and valleys (see figure 3.8).
27

Figure 3.8: An image of the electrode tube with the electric potential picturedas gravitational potential.
Apart from the extractor, extra lenses can be added for fine tuning of the focusand for magnification of the image.
However it is not just focusing the image that is important for a good resolution. Electrons of different energies and angles need to be focused onto differentpoints on the detector. Increasing energy will result in circles with increasingradius on the 2D image. In order to get maximum resolution the radius of theimage of electrons with the highest energy has to be a:; similar to the radius ofthe detection area as possible. That is, the trajectori~s for the electrons withmaximum energy have to be as widely spread as possible without hitting thewalls of the TOF tube. This is achieved by changing the voltage settings onthe electrodes for different maximum energies. Higher voltages are needed forhigher electron energies.
When the lens configuration is optimal, the resolution of the spectrometer islimited by the detection system.
3.4 Additional operation modes
Besides being an electron imaging machine, the spectrometer can be used forimaging ions. It can also be used in a time-of-flight mode for just measuringthe energy of electrons and ions.
3.4.1 Imaging ions
Besides emitted electrons, positive ions are created in the ionization of the gasatoms. Looking at these ions is another interesting application of the spectrometer. Ion spectrometry can also be used for making sure that the received
28

signal is really from the input gas and not noise like background ionizing. Theprinciple of imaging ions is very similar to imaging electrons. The only difference is that the negative voltages on the repeller and the lenses needs to beswitched to positive values. Furthermore the ion imaging is a bit less sensitiveto disturbances.
3.4.2 Time-Of-Flight mode
Changing the spectrometer into operating in time-of-flight mode is very easy.An electric circuit that monitors the electron signal is connected to the MCPand the current cased by the electrons or ions is recorded on an oscilloscope.The reason for using the spectrometer this way is that much lower voltages isrequired for the MCP when you just want to extract the current and not makean image, thereby decreasing the risk of damaging the equipment while aligningthe setup. This will be discussed in more detail in section 4.8.
29

Chapter 4
Design and construction
The design and drawing of the spectrometer chamber is mainly made by Dr.Johan Norin, former PhD student at the Atomic Physics department. I haveonly made small alterations and additions to it.
In the front of the spectrometer is the detector mount where an Mep is installed.On the flanges near the detector a small vacuum turbo pump and a vacuumgauge is mounted.
The electrode tube is welded on a flange that is held in place between thedetector mount unit and the main chamber unit.
On the top of the spectrometer is the gas input, the high voltage vacuum feedtroughs for the electrode electric cables, and another vacuum gauge. On theflange on the bottom of the main chamber a large vacuum turbo pump ismounted.
The Laser comes in sideways into the electrode tube trough a small hole. Thedrawing can be seen in figure 4.1 and 4.2 and a schematic view of the setupis pictured in figure 4.3. Figure 4.4 is a photograph of the final real velocitymap-imaging spectrometer.
Following is a more detailed description of the different parts of the imagingsetup.
30
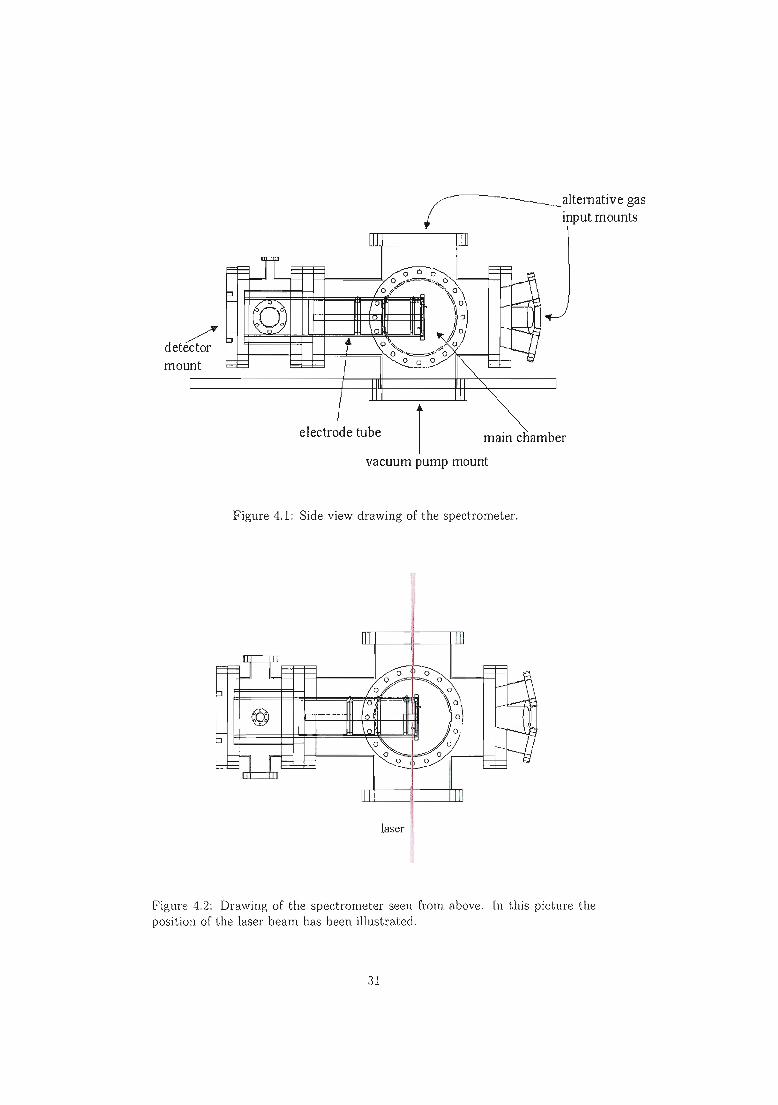
electrode tube
/detectormount
~ ~ltell1ative gas, mput mounts
rTr1-----TTl1
main chamber
vacuum pump mount
Figure 4.1: Side view drawing of the spectrometer.
laser
Figure 4.2: Drawing of the spectrometer seen from above. In this picture theposition of the laser beam has been illustrated.
31

CCDcamera
phosphor
MCP
laserpolarizationaXIs
repeller
Figure 4.3: Schematic view if the imaging setup.
Figure 4.4: Photo of the velocity map imaging spectrometer.
32

4.1 Electrode design
In order to create the set of electrostatic lenses needed for the imaging I haveused a computer program called SIMION to simulate the electron trajectoriesfor different lens configurations. Designing and perfecting the electrode dimensions and voltage settings has been one of the most important parts in makingthis spectrometer.
4.1.1 Desired properties for the spectrometer
In order to get a good measurement the following properties are required:
• Focusing; electrons of the same initial velocity need to be focused onto thesame point on the detector. This has to work for wide range of electronenergies.
• Spread; the maximum energy electrons have to reach the detector with aslarge radius as possible.
• Free path; the electrons have to get from the repeller to the detectorwithout smashing into the tube walls or the electrode lenses.
• Linearity; the squared ring radius should vary approximately linearly withthe kinetic energy.
To achieve these requirements there are a number of different parameters thatcan be varied (see figure 4.7)
• Distance between electrostatic lenses, particularly between the point ofelectron creation and the extractor.
• The number of electrostatic lenses.
• The diameter of the lens openings.
• Voltage settings on the lenses - in particular the extractor/repeller ratio.
• The length of the tube, that is the distance between repeller and detector.
All this has to be taken into account when designing and constructing the velocity map imaging system.
4.1.2 Simulations
The simulation software SIMION is constructed for drawing electrodes, settingvoltages and calculating trajectories for charged particles in an electrostaticfield. It uses potential arrays that define the geometry and potential of electrodes. The potential of the points between the electrodes is determined bysolving the Laplace equation. SIMION solves this by finite difference methods
33

Figure 4.5: The three dimensional view of the electrode tube in SIMION.
/extractor
TIelectron trajectories
/
Figure 4.6: Side view of the electrode tube in SIIVIION with calculated anddisplayed electron trajectories.
and calls it refining the array. Refined arrays can then be projected as 2D or 3Dimages into a workbench volume. Here trajectories for ions of different energy,mass and charge can be calculated and displayed.
The electrodes and tube are literally drawn up by hand in SIMION and are givenspecific voltages. They are drawn from side view and by choosing cylindricalsymmetry they are rotated around the x-axis. The entire array is then refined,that is the field due to the drawn electrodes is calculated.
Before starting the simulations, mass, energy, angle, charge and start positionneed to be set for the particles. After this the ion trajectories can be calculatedand drawn up. The electrode potentials can then be modified by a fast adjustingsystem in SIMION so that the best voltage settings are achieved.
To start out I chose a lens configuration with repeller (R) extractor (E) and fiveextra lenses. I soon realized that the last three lenses were unnecessary sincethey gave the best result when set to av. The design of the extra lenses is suchthat they each consists of circular electrodes with a hole in the middle. Voltage
34

400
17 56 55....--~ .~
I III IIIt16
",1
30
111130
IIR E lens 1 lens 2 /
detector
Figure 4.7: This is the final configuration of the electrode tube with repeller,extractor and two extra lenses.
is applied to the electrode in the middle and the two others are grounded. Thisis the lens construction that gives the best result.
For a specific lens design and length of tube the voltage setting only depend onthe maximum electron energy. It is as mentioned earlier the ratio of repellerand extractor voltages that controls the point of focus and this ratio is nearlyconstant for the different settings.
The final design of electrodes and tube can be seen in picture 4.7.
4.1.3 Voltage settings
The extractor-repeller voltage ratio is about 0.8, but varies slightly for differentmaximum energies. The spectrometer is made mainly for a maximum electronenergy of 20 eV but the voltages are easily changed for lower maximum energies.
Max electron energy 20 eV 10 eV 5 eVRepeller -4900 V -2500 V -1300 VExtractor -4000 V -2050 V -1070 Vlens no 1 -2500 V -1000 V -400 Vlens no 2 -700 V -100 V OVVE/VR 0.816 0.82 0.823
In practice the focus is never as good as in the simulations and there are verymany factors in a real experiment that affect the outcome of the imaging. Ihave learned that it is sufficient to use only the repeller and extractor since theextra focusing the two lenses provide is often blurred out for various reasons inthe actual image. However the extra lenses could still be useful for fine tuningin a very precise measurement, and they are necessary when the image need tobe magnified. When the lenses aren't used, the first one of them (closest to theextractor) is set to OV, in order to make the last bit of the electrode tube fieldfree.
35

4.2 p,metal shield
Stray magnetic fields - even very small fields - strongly influence electrontrajectories and must be directed around the electrode tube. This is accomplished by a magnetic shield of high permeability which guides the magneticflux around the critical area.
Mu-metal is a nickel-iron alloy (77% Ni. 15% Fe, plus Cu and !VIo) which hasextremely high magnetic permeability at low field strengths. A shield has beenmade in this material to fit around and protect the electrode tube.
A hole made in the mu-metal destroys the shielding effectiveness. The penetration from the external field extends internally to a distance approximately equalto the hole diameter. For this reason I have had to keep the holes for electricalcables, laser and gas small.
"When f.t-metal is altered in some way. like bending. welding or cut, its shieldingproperties are damaged. After building it, the shield needs to be given a vacuumbake to nooo to restore the magnetic permeability. After this heating it has tobe handled with great care in order to keep its properties.
4.3 Vacuum
A long mean free path is needed for the electrons inside the spectrometer. Thenumber of collisions on the way to the detector has to be as low as possible.This means high vacuum is required in the chamber. Also, the !VICP needs highvacuum to not be damaged when high voltage is applied to it. To produce highvacuum the chamber has to be tightly sealed and equipped with a good vacuumpump system.
4.3.1 Vacuum chamber
The chamber is made of stainless steel components with Conflat® flanges. TheConflat® flange is a seal fitting with a knife edge that gets pressed into a coppergasket when screwed on to another flange. This ensures that the chamber is tightenough to contain high vacuum.
4.3.2 Vaccum pumps
Under the main chamber a turbomolecular pump is mounted. It contains rapidlyspinning turbine rotors that push gas from the inlet towards the exhaust. Theturbopump can not operate if the pressure is too high so before turning it on.the pressure in the chamber needs to be reduced by a for-vacuum pump.
A similar but smaller setup is installed near the detector in order to keep thepressure low there even when gas is let in the main chamber.
36

Two vacuum-gages are installed on the machine - one on the main chamberand one near the detector. So far the measured vacuum has gone as low as7· 10-9 mbar in the main chamber and 2· 10-8 mbar by the detector, but thepressure is still slowly dropping.
4.4 Gas input
The detection gas in the spectrometer is a noble gas and it needs to be present inthe ionization region of the spectrometer during an experiment. At the momenta needle valve is installed where small amounts of gas can be let directly in tothe main chamber. But in order to get a good result from the imaging the gaslaser crossing has to be quite small and the amount of gas let in to the chamberneeds to be as small as possible. This can be accomplished by letting a piezzoelectric crystal - triggered by the laser pulses - let small puffs of gas into atube with a skimmer in one end. The skimmer then gives a very narrow gasbeam, and the pulsing of the gas makes sure that as little as possible is let in.
Ithin gas beam
skimmer
li~-".i~{
Igas puff
Figure 4.8: Small puffs of noble gas is let in to a tube by a piezzo electric crystaland a skimmer narrows it down to thin gas beam.
4.5 Detection system
The detection system consists of a multichannel plate (MCP) with a phosphorscreen on one side and a CCD camera (see figure 3.4).
An MCP is a device which intensifies a signal - in this case electrons - bymultiplication of electrons in small channels under the presence of a high electricfield. When hit by an electron the channel walls produces more and moresecondary electrons. This process amplifies the original signal by several ordersof magnitude.
On the back side of the MCP is a layer of phosphor, also supplied with highvoltage. The phosphor will fluoresce when hit by an electric current. A CCDcamera is then used to make an image of the phosphor screen. The CCD cameratransfers the image to a computer where it is saved and later processed.
37

The detector setup used at the moment is an IvICP with a 2.5 cm diameteractive area used in a continuous mode. Ideal would be a larger active area andthe possibility of using the detector pulsed and trigged by the pulsed laser.
A hit by an electron on the detector gives a very intensi\e spot which is strongerthan spots caused by interference and noise. If the detecwr is on only in the timeframe when electrons hit the IvICP surface the weaker noise can be subtracted.In addition to a pulsed IvICP a fast CCD camera that takes pictures with a highfrequency, and doesn't integrate the image over a long Lime, is needed.
4.6 Image processing
The image from the CCD camera can be run through a computer program thateffectively gets rid of noise. In the program a threshold value can be set andall pixels with intensities above this value is set to one and all others to zero.This sorts out all information in the image not caused by an electron hit and itgives all electron hits the same value to compensate for efficiency fluctuationson the J\,ICP active area. After this processing the images are summed up andthe characteristic spectrometer image slowly develops.
------~-~
Figure 4.9: Processed image from a VIvIIS.
4.7 Abel inversion
The image from the spectrometer is a two dimensional projection of the threedimensional velocity distribution. If the image contains an axis of symmetry as is the case in the velocity mapping of electrons - imerse Abel transform canbe performed to retrieve the full 3D information.
The Abel transform is an integral transform of the form
f(R) = 2100
g(v)v dvIRI Jv2 - R2
where f(R) represent the 2D radial distribution obtained on the detector.
38

The Abel inversion that reconstructs the 3D velocity distribution is then
g(V)=_!.jOOd!(R) 1 dR7r v dR vv2 - R2
The Abel inversion has to be done numerically since there are no analyticalfunctions available in the image, only pixel intensities. Several algorithms havebeen developed to carry out this procedure [13][14] and for this spectrometer aniterative method, that exploits the close relationship between the 2D projectionand the 3D distribution, is used [15].
~"<-h .....
. I . ; _;":':" ~ I .
.".: ;.: ".
. \
..~.,
Figure 4.10: To the left is the raw image from the sectrometer and to the rightan Abel inversion has been made.
4.8 Time-of-flight mode
A decoupJing box with an electric circuit is needed for the spectrometer to beused in TOF mode. It is connected to either the MCP or phosphor screen highvoltage inputs and monitor the current produced by the electrons. The circuitcan be seen in figure 4.1l.
By letting an oscilloscope be trigged by the laser and Yiewing the current fromthe decoupJing box on the scope screen, the time of flight of the electrons can bemeasured. This is useful when aligning the laser for an experiment. The MCPneeds very high voltages ('" 5kV) to be able to produce an image, but usedwith lower voltages the current from the electrons can still be monitored on anoscilloscope. The MCP is very sensitive when operated with high voltage andif the laser during the lineup would hit a surface in the spectrometer, a blastof ions would be ejected towards the detector and damage it. This is why itis important to use the spectrometer in TOF mode umil the setup is properlyaligned. Another reason for using the spectrometer as a TOF is the possibilityit gives to separate different compounds in the ionized gas. If the pressure in
39

high VOl~supply 66 MQ h ·detector
12200 pF / 6kV
signal ground
Figure 4.11: Decoupling box to monitor the current caused by the electronsfrom the MCP.
the chamber is too high, background atoms and molecules can be ionized andmeasuring the the positive ions time of flight - which is mass dependent makes it possible to distinguish between the different elements and make sureit is the signal from the detection gas that is being registered.
40

Chapter 5
Operating the VMIS
5.1 Experiment at AMOLF
During the course of my diploma work I went for a week to the AMOLF institutein Amsterdam and participated in some measurements with a similar spectrometer. The aim was to see a real velocity-mapping setup in action and get somepractical experience of the different elements of an imaging experiment. Thevisit was very rewarding and some of the components in the setup have beeninspired from the imaging machine I saw at AMOLF.
5.1.1 Experiment
The purpose of the experiment was to examine the DNA component Uracil andthe defragmentation process that occurs under the influence of a laser. TheUracil was a white powder that was heated in a oven and entered into theionization region trough a small hole. The setup of the spectrometer was verysimilar to mine except for the gas input. Both a mode locked Nd:YAG laserand a femtosecond laser were used in the test. One of the major difficulties wasto get the laser perfectly aligned in the middle of the electrode tube, where itcoincided with the gas beam.
The signal from the ions was first viewed with the spectrometer in time-of-flightmode on an oscilloscope and then imaged and computer processed.
5.1.2 Result
During my week in Amsterdam, unfortunately, no signal was acquired from theuracil. However the signal from the background ionization was quite strong andI was able to make an image of this. The conditions for imaging backgroundions where not perfect for a sharp image since the ions come from a rather largevolume where the laser is strong enough to ionize. I did get a nice image though
41

where it can be seen that the photo dissociation has an angular distribution (seefigure 5.1).
Figure 5.1: Result from imaging a background ion on an imaging machine atAIVIOLF, Amsterdam.
The week after I left AMOLF I learned that the experiment was now workingand that a good signal was received from the Uracil.
5.2 Operation of the spectrometer
Here follows a short description on how to operate the VMIS and the first stepsin making an experiment.
5.2.1 Vacuum
In addition to the need for high vacuum in the spectrometer when an experimentis being conducted, vacuum is required when an experiment is not running inorder to keep the inside of the chamber from being contaminated and for theMep which need vacuum even when it is just stored.
To start the vacuum pumps:
• Make sure the vents between turbo pumps and fore-vacuum pumps areclosed, and that cooling water is on.
• Start both for-vacuum pumps, wait a couple of seconds and then open thevents.
• When the pressure has gone down below 1· 10- 1 mbar, both turbo pumpscan be turned on.
42

5.2.2 MCP, phosphor and CCD camera
• Two high voltage supplies are needed for the MCP and phosphor. It isimportant to have some sort of safety switch connected to these powersupplies that shuts the power off if it goes above a certain limit value.This is used to protect the sensitive MCP and phosphor. The voltageshave to be raised very slowly if it is the first time in long they are beingused. The total process takes a couple of hours and is done according toa scheme in the MCP manual.
• When the MCP is used frequently the voltages can be switched on muchfaster. The voltage settings for the MCP and phosphor screen for differentusage are listed in the manual.
• The CCD is turned on. Make sure the cable for cooling the camera isinserted properly, the camera has to be cooled at all times when it is on.
5.2.3 Laser alignment
When a narrow gas input exists it is important that the laser beam is very wellcentered in the ionization region so that the focus of the laser overlaps withthe gas beam. Otherwise there will be no signal at all. Within the region ofgas-laser-overlap where a signal can be detected, changing the laser alignmentslightly can improve the focus of the electrons.
5.2.4 RepeUor and extractor voltages
The repeller and extractor need one high voltage supply each and if the extralenses are used, one supply for each of them is needed to. It is important thatthese power supplies are very precise because the voltages don't have to be offby much for the focus to change a lot.
After the laser alignment is optimized, the voltages on the repeller and extractorcan be modified until the best possible resolution is achieved.
5.3 Planned test
For testing the spectrometer I have been planning a small experiment wherebackground atoms are ionized. When the pressure in the chamber is rv 7· 10-7
mbar there is enough air in the ionization region to be able to see a signal fromionized air particles. The idea is to measure ions since this is much easier thanmeasuring electrons, no p.-metalshield is necessary for instance.
A femtosecond laser beam from the kHz system in the next room has beenaligned through the spectrometer. The needle valve is used to carefully letsome air into the chamber to raise the pressure a bit since the current vacuumis too high to see any ions from the background right now.
43

kHz laser
Figure 5.2: A femtosecond laser is aligned trough the spectrometer to be usedin a background ionizing experiment.
The TOF signal would first be monitored on an oscilloscope and after makingsure the laser alignment is good an image of the ions would be made.
44

Chapter 6
Summary and outlook
6.1 Summary and Outlook
This diploma work has consisted of designing and constructing a velocity-mapimaging spectrometer.
I started out by doing simulations of electron trajectories in an electric fieldwhich led to the design of the electrode tube with repeller, extractor and theextra electrostatic lenses. The voltage settings on the electrodes - which givethe important result of focusing the electron trajectories - were also decidedfrom the simulations.
Next, all parts needed for the spectrometer were orde,'ed and the job of building the chamber started, including designing a table, tightening screws and installing the vacuum system. Apart from the chamber, many other componentswere needed, such as an MCP-phosphor detector, a CCD camera, high powersupplies, TOF circuit and and vacuum valves, which were ordered, collected andtested.
The final result is now standing in the pico lab in the Atomic Physics departmentready to be tested.
The first experiment planned for the spectrometer is a test where elements fromthe background air will be ionized and the positive ions imaged. The next stepfor the spectrometer is to start imaging electrons and to optimize laser alignmentand electrode voltages to get a good and stable setup. A pulsed detector, a fastCCD camera and a gas input with the possibility to make a narrow atom beamare other things that need to be investigated.
In the future, the imaging spectrometer will be used for characterizing attosecand pulses, especially when pulse trains become so short that electron energydistributions from consecutive harmonics and side bands overlap and angularresolution is necessary for the analysis. Furthermore the imaging machine willbe a good tool for doing atomic physics in general and for examining energyand angular distributions of electrons and ions.
45

Acknowlegements
I want to thank my supervisor Prof. Anne L'Huillier for giving me the opportunity to have this exiting project as a diploma work and for all her help, adviseand inspiration.
A special thanks goes to Dr. Johan Norin and Dr. Allan Johansson for all theirwork with the spectrometer, their help and inspiring collaboration.
Thank you to Prof. Marc Vrakking for advice and for letting me come toAMOLF and participate in an experiment, and a special thanks to Dr. FranckLepine for making my week at AMOLF so useful and inspiring.
Thanks to my mother for constant support and cheer leading and thank youOla Synnergren for support, advise and help.
So many people have contributed to the spectrometer along the way and I wantto give a special thanks to you all for your time and effort.
46

Bibliography
[1] A.T.J.B. Eppink and D.H. Parker, Rev. Sci. lnstrum. 68 (9), 3477 (1997)
[2] S.A. Aseyev, Y. Ni, 1.J. Frasinski, and M.J.J. Vrakking, Phys. Rev. Lett.91 (22), 223902 (2003)
[3] A. L'Huillier and F. Krausz, High-order harmonic generation and its application to attosecond metrology.
[41 Brandsen and Joachain, Physics of Atoms and Molecules, Second Edition
[5] Gunnar Ohlen, Quantum Mechanics II
[6] D. J. Kennedy and S. T. Manson, Photoionization of the Nobel gases,Physical Review A 5 (1971)
[7] E. Amous, S. Klarsfeld and S. Wane, Angular Distribution in the TwoQuantum Atomic Photoeffect, Physical Review A 7 (1972)
[8] 1. Lindgren J.Morrison, Atomic Many-Body Theory, Second Edition
[9] H. K. Tseng, R. H. Pratt, S. Yu and A. Ron, Photoelectron angular distributions, Physical Review A 17 (1977)
[10] J. W. Cooper, Photoelectron-angular-distribution parameters for rare-gassubshells, Physical Review A 47 (1992)
[111 P. M. Paul, These de doctorat (2001)
[121 F. Rosca-Pruna, PhD Thesis (2001)
[13] C. Bordas, F. Paulig, H. Helm, and D. 1. Huestis, Rev. Sci. lnstrum. 67,2257 (1996)
[14] J. Winterhalter, D. Maier, J. Honerkamp, V. Schyja, and H. Helm, J. Chern.Phys. 110, 11187 (1999)
[15] M.J.J. Vrakking, Rev. Sci. lnstrum. 72(11) 4084(2001)
47