Embed Size (px)
Citation preview
CHEMICAL ENGINEERING TRANSACTIONS
VOL. 51, 2016
A publication of
The Italian Association
of Chemical Engineering Online at www.aidic.it/cet
Guest Editors: Tichun Wang, Hongyang Zhang, Lei Tian Copyright © 2016, AIDIC Servizi S.r.l.,
ISBN 978-88-95608-43-3; ISSN 2283-9216
Design and Application of Hydraulic Engineering Destroy Risk Avoidance Path System Based on ArcGIS Engine
Yi Lou*a, Juqin Shena, Shiye Yuanb aSchool of Business, Hohai University, Nanjing, 211100, China bBusiness School, Jiangsu Open University, 210036, Nanjing, China [email protected]
This paper took Visual Basic as the programming language, chose Windows XP system and ArcGIS 9.2 as the system platforms, and developed Hydraulic Engineering Destroy Risk Avoidance Path System (hereafter referred to as HEDRAPS) by ArcGIS Engine 9.2.The system has been applied to the practice of A hydraulic engineering destroy risk avoidance, aiming to verify its integrity and practicability of various functions. The application of HEDRAPS can both improve the theoretical research concerning the hydraulic engineering risk management and guide the practice process of hydraulic engineering risk emergency management.
1. Introduction
The flood is one of the main and frequent natural disasters in the world. The primary goal of hydraulic engineering is to prevent ecological damage and economic loss caused by the flood. Various countries have focused on the construction of hydraulic engineering. In the past half century, the major flood disasters are increasingly frequent around the world, therefore, result in severe damages. Therefore, the heavy loss caused by devastating flood shall not be neglected. The Arc Objects promoted by ESRI Company is integrated with most of GIS applications based on COM technology’s component object library. Some scholars have conducted many beneficial researches on ArcGIS, which helped the research of this paper greatly. Olivera et al (2006) introduced the tool for water and soil evaluation based on ArcGIS in Texas. Boroushaki et al (2008)
discussed the decision-making model integrated with AHP-OWA and ArcGIS. Kneissl et al (2011) applied ArcGIS software to design an independent map projection of volcanic eruption scale. Liu et al (2012)
conducted quantitative evaluation on mineral resources based on the ArcGIS platform. Li and Luo (2013) took Visual Studio 2008 as the platform to develop the forest resource management system in Major Mountain Forest Farm and combing ArcGIS Engine secondary development kit. From the perspective of the above mentioned research achievements, the scholars have conducted sufficient researches on the design and application of management systems based on ArcGIS. However, there are few researches on the prevention and control of destructive risk of hydraulic engineering. This paper constructed hydraulic engineering destroys risk avoidance path selection model based on the shortest path rule and Dijkstra algorithm by combing the fuzzy variable assessment method. The ArcGIS Engine 9.2 was adopted to develop HEDRAPS, so as to achieve the visual management at the time of destroy risk of hydraulic engineering.
2. Construction of Hydraulic Engineering Destroy Risk Avoidance Path Selection Model
2.1 Construct Road Network Database The network applied by ArcGIS Network Analyst is stored in the form of the network database. We can build the network database by using the traffic roads within the risk impact region. The network database includes three network elements including border source, link point source and turn source. The line feature builds the database via border source. The point feature builds the database via link power. The turn features builds the database via turn source. The road network database is built in Geodatabase’s work space, which can support
road’s multiple boundaries and focus sources so as to conduct multi-model network analysis.
DOI: 10.3303/CET1651168
Please cite this article as: Lou Y., Shen J.Q., Yuan S.Y., 2016, Design and application of hydraulic engineering destroy risk avoidance path system based on arcgis engine, Chemical Engineering Transactions, 51, 1003-1008 DOI:10.3303/CET1651168
1003

2.2 Design Optimal Evacuation Road The shortest path is the basic problem in applied mathematics. The design of the optimal evacuation path of hydraulic engineering destroy risk requires the analysis model of the shortest path for certain reference. Assume G≤V, E> is a non-empty simple finite graph; v is the set of node; E is the border set. For any of weight, P is the effective path between two points in G; then it is the optimal path between two points in G. Computer scientist Edsger W. Dijkstra (1956) have proposed the Dijkstra algorithm generates the shortest path according to the sequence of path length increment, which is applicable to the shortest path algorithms with all the arcs’ weight as non-negative.
2.3 Shelter Selection The shelter selection involves many complex and inconstant factors with certain range of fluctuation. According to this range, the variable fuzzy set can be determined to conduct fuzzy comprehensive evaluation. The characteristic value matrix of evaluation index of shelter selection scheme is as Eq (1).
Xmn=(xij) (1)
The matrix row represents evaluation index i(i=1,2,…,m; m is the number of index); the matrix column represents index j(j=1,2,…,n; n is the number of alternatives ) , the standard interval [a, b] matrix I(a,b)of scheme index i and grade h. References to the equations should be as Eq(2).
IAB=ABmnc=([a,b]ih) (2)
The solution procedure of variable fuzzy set engineering approach of shelter selection scheme is as follows: Step 1, determine the variation interval [c, d] matrix of index i and grade h according to the interval [a, b]. References to equations should be as Eq (3).
* ([ , ] )cd m c ihI CD c d , h=1, 2, … c, c is level (3)
Step 2, determine the matrix M of index i and grade h according to the analysis on index i. References to the equations should be as Eq(4).
Mmc=(mih) (4)
Step 3, when the evaluation index x falls at the left side of matrix M, its relative difference should be as Eq(5).
, [ , ]
, [ , ]
A
A
x aD x a m
M a
x aD x c a
c a
(5)
When the evaluation index falls at the left side of matrix M, its relative difference should be as Eq(6).
, [ , ]
, [ , ]
A
A
x bD x M b
M b
x bD x b d
d b
(6)
Take the value as 1 with non-negative β in the formula. Namely, the relative difference function model is a
linear function. Step 4, calculate the synthetic relative membership matrix of sample j and index i to rank h. The equations should be as Eq(7).
* ( )j m c j ihU u (7)
Step 5, determine the index weight vector. The equations should be as Eq(8).
1 2( , ,..., ) ( )m iw w w w w (8)
Step 6, calculate the grade feature value h of shelter selection scheme j. The equations should be as Eq(9).
* ( )c n j ih hjU w u u (9)
1004
Step 7, calculate the characteristic values of shelter selection scheme. The equations should be as Eq(10).
1 2(1,2,..., )( ) ( , ,..., )hj nH c u H H H (10)
3. System Design and Development of HEDRAPS
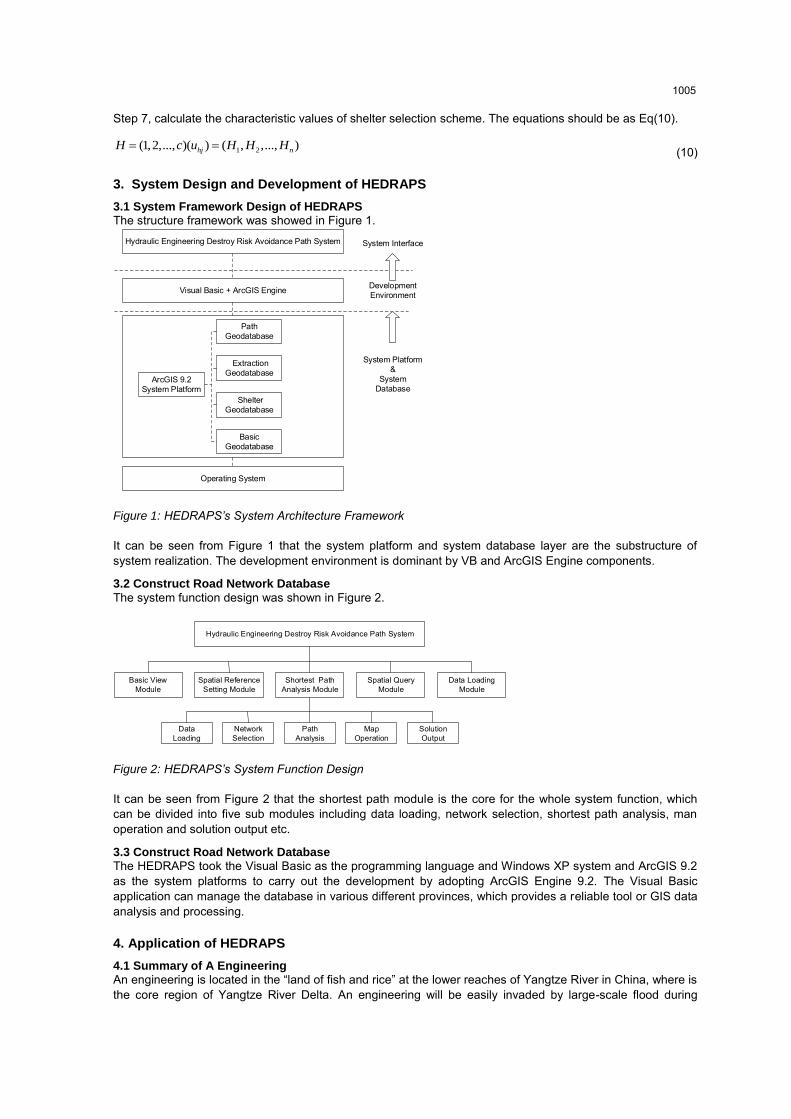
3.1 System Framework Design of HEDRAPS The structure framework was showed in Figure 1.
Hydraulic Engineering Destroy Risk Avoidance Path System
Visual Basic + ArcGIS Engine
ArcGIS 9.2 System Platform
Path Geodatabase
Operating System
Extraction Geodatabase
Shelter Geodatabase
Basic Geodatabase
System Interface
Development Environment
System Platform&
System Database
Figure 1: HEDRAPS’s System Architecture Framework
It can be seen from Figure 1 that the system platform and system database layer are the substructure of system realization. The development environment is dominant by VB and ArcGIS Engine components.
3.2 Construct Road Network Database
The system function design was shown in Figure 2.
Hydraulic Engineering Destroy Risk Avoidance Path System
Basic View Module
Spatial Reference Setting Module
Shortest Path Analysis Module
Spatial Query Module
Data Loading Module
Data Loading
Network Selection
Path Analysis
Map Operation
Solution Output
Figure 2: HEDRAPS’s System Function Design
It can be seen from Figure 2 that the shortest path module is the core for the whole system function, which can be divided into five sub modules including data loading, network selection, shortest path analysis, man operation and solution output etc.
3.3 Construct Road Network Database The HEDRAPS took the Visual Basic as the programming language and Windows XP system and ArcGIS 9.2 as the system platforms to carry out the development by adopting ArcGIS Engine 9.2. The Visual Basic application can manage the database in various different provinces, which provides a reliable tool or GIS data analysis and processing.
4. Application of HEDRAPS
4.1 Summary of A Engineering An engineering is located in the “land of fish and rice” at the lower reaches of Yangtze River in China, where is
the core region of Yangtze River Delta. An engineering will be easily invaded by large-scale flood during
1005

Meiyu period with high probability for destroy risk. Based on this, this paper took the destroy risk confronted by A engineering as the research object to select proper avoidance place and path by applying HEDRAPS.
4.2 Shelter Unit Division and Spatial Data Editing
The specific steps are as follows: (1) Build Shapfiles, start Arccatalog, select New/Shapfiles, input name and feature type. (2) Open the cell attribute table, select Opinions/Add Field, add the fields such as area and population size etc. (3) Open Field Calculator dialog box in the attribute table, check Advance options and input VBA code.
4.3 A Engineering Destroy Risk Avoidance Shelter Selection (1) Initial Selection of Avoidance Shelter In order to make a rapid choice, the initial screening must be done on the original scheme. Assume Ω is the
plane space within the range of risk influence, Pi=(i=1,2,…,n1) was the evacuation point in the plane; Bj=(j=1,2,…,n2) was the shelter point in the plane; the constraint condition of spatial space was | Pi - Bj |<=d. This paper assumed d=9 km; 16 shelter points were selected in the plane. The details are in Table 1.
Table 1: Refuge Point Primary Selection (Space distance constraints)
Symbol Context Symbol Context Symbol Context Symbol Context 1 A 5 E 9 I 13 M 2 B 6 F 10 J 14 N 3 C 7 G 11 K 15 O 4 D 8 H 12 L 16 P
Si is the safety coefficient of various shelter points; s is the minimum safety coefficient; then S i>=s. Assumed s=2.5, the safety condition of various shelter points after the expert evaluation was showed in Table 2.
Table 2: Refuge Point Primary Selection (Security evacuation)
Refuge Point Ground Elevation Submerged(Y/N) Security Index A 17 Y 0 B 15 N 4.5 C 14 N 2.5 D 15 N 3 E 17 N 3 F 16 N 3.5 G 14 N 3 H 13 N 4 I 14 N 4.5 J 13 N 4.5 K 13 N 3.5 L 16 N 2 M 12 N 1.5 N 13 N 1.5 O 14 N 1.5 P 16 Y 0.5
It can be analysed from Table 2 that ten shelter points including B, C, D, E. F, G, H, I, J and K conform to Si>=s among 16 optional shelter points. Assume Ci is the capacity of shelter point; c is the population size of evacuation point, then Ci>=c. This paper assumed c=150 persons. The population capacity of various shelter points was shown in Table 3.
Table 3: Refuge Point Primary Selection (Victim capacity)
Point Capacity Point Capacity Point Capacity Point Capacity A 500 E 200 I 100 M 300 B 1500 F 200 J 300 N 150 C 130 G 100 K 1000 O 800 D 100 H 800 L 2000 P 900
It can be analysed from Table 4 that six shelter points including B, E, F, H, J and K conform to Ci>=c among ten optional ones after safety evaluation. Assume Gi is the road grades around the shelter; g is the minimum road grade up to the requirement of evacuation access, then Gi>=g. This paper assumed g=1. The road grades around the shelter points were shown in Table 4.
1006

Table 4: Refuge Point Primary Selection (Road rank)
Point Rank Point Rank Point Rank Point Rank A 2 E 0.5 I 3 M 1 B 1 F 0.5 J 3 N 1 C 0.5 G 0 K 3 O 1 D 0 H 2 L 0 P 0
It can be analysed from Table 5 that four shelter points including B, H, J and K conform to the requirement Gi>=g among six ones after safety evaluation and population capacity evaluation. (2) Network Analysis This paper took the evacuation point Z as the datum point to choose the shortest path among four evacuation points including B, H, J and K. The shortest path generation shall output the static shortest path and dynamic shortest path. The dataset definition attributes were shown in Table 5.
Table 5: Network Dataset Attribute Definition
Symbol Context Symbol Context Symbol Context Symbol Context NAME Name USE Usage UNITS Units DATAT Datatype LEN Length MCOST Money MET Meters DOUBLE Precision MINT Mint TCOST Timing MIN Minutes DOUBLE Precision
(3) Fuzzy Variable Assessment Analysis Assume the evaluation index is the shortest spatial distance; X1 is the shortest evacuation time; X2 is the safety condition of shelter points; X3 is the population capacity of shelter points; X4 the index value of various shelter points is shown in Table 6.
Table 6: Value Index of Refuge Point
Refuge Point X1 X2 X3 X4 B 6.278 9.7 4.5 1500 H 8.467 16.1 4 800 J 10.167 21.6 4.5 300 K 10.053 16.4 3.5 1000
The evaluation standard interval of shelter selection is shown in Table 7 by combing the practical condition and experience evaluation.
Table 7: Value Index of Refuge Point
Index Ⅰ Ⅱ Ⅲ Ⅳ Ⅴ X1 1-7 7-12 12-18 18-24 24-30 X2 1-10 10-120 20-30 30-45 45-80 X3 5-4 4-3 3-2 2-1 1-0 X4 6,000-1,000 1,000-500 500-300 300-150 150-50
To calculate the grade standard difference function vA (μ)ih by judging whether the evaluation index x was at the left side or right side of M according to matrix Iab, Icd and M. If x was at the left side of M, then choose the Eq (5); if x was at the right side of M, choose the Eq (6). Relative Membership Matrix of Shelter Point B, H, J, K
1
0.56 0.44 0 0 0
0.52 0.48 0 0 0
0.5 0.5 0 0 0
0.2 0.7 0.3 0 0
2
0.35 1.07 0.15 0 0
0.2 1.01 0.31 0 0
0.75 0.25 0 0 0
0 0 0.5 0.5 0
3
0.18 1.07 0.32 0 0
0 0.42 0.66 0.08 0
0 0.5 0.5 0 0
0.5 0.5 0 0 0
4
0.19 1.07 0.31 0 0
0.18 1.02 0.32 0 0
0.25 0.75 0.25 0 0
0.9 0.1 0 0 0
According to the variable evaluation model, as Eq(11).
1007
1
1
1( )
[ (1 )]
1
( )
A h
m pp
i A ih
i
m
i A ih
i
v
w u
w u
(11)
The modelling standard parameter α=1 with hamming distance p=1. The characteristic values of different
weight grades of various schemes were obtained by taking all the above parameter vectors into weight evaluation model, the comprehensive evaluation is shown in Table 8.
Table 8: Comprehensive Evaluation of Refuge Point
Refuge Point Characteristic value of unequal weight grades Standard interval of shelter B 1.579 II H 1.963 II J 2.317 III K 1.955 II
According to the principle in Table 8, the smaller of unequal weights, and the better. The shelter point B shall be selected as the evacuation point Z’s shelter point with the shortest avoidance path.
5. Conclusions
The following conclusions can be reached through the research of this paper. (1) HEDRAPS took Visual Basic as the programming language and Windows XP system and ArcGIS 9.2 as the system platforms and adopted ArcGIS Engine 9.2 for development, which is applicable to non-professional personnel operation with improved human-computer interaction. (2)The GIS spatial analysis function and network analysis function were fully applied to drive HEDRAPS to become a system with complete structure. (3) HEDRAPS adopted fuzzy variable assessment method to evaluate the initial scheme of shelter selection, which improves the accuracy and reliability of HEDRAPS on calculating the shortest path of shelters.
Acknowledgments
This paper is supported by Jiangsu Province social science fund program “The research on the theory and
practice issue of Jiangsu's leading explorer on Green GDP accounting system.”(No. 14EYC006).
Reference
Boroushaki S., Malczewski J., 2008, Implementing An Extension of The Analytical Hierarchy Process Using Ordered Weighted Averaging Operators with Fuzzy Quantifiers in ArcGIS, COMPUTERS & GEOSCIENCES, 4(34),399-410, DOI: 10.1016/j.cageo.2007.04.003
Dijkstra E. W., 1959, A Note on Two Problems in Connexion with Graphs, Numerische Mathematik, (1), 269–
271 Kneissl T., van Gasselt S., Neukum G ,2011, Map-Projection-Independent Crater Size-Frequency
Determination in GIS Environments-New Software Tool for ArcGIS, PLANETARY AND SPACE SCIENCE, 9(59),1243-1254, DOI: 10.1016/j.pss.2010.03.015
Li C., Luo C.W., 2013, The Forest Resource Management System Based on ArcGIS Engine Design and Implementation, Forest Logging Engineering, 01, 15-20+25
Liu Y.B., Gong X.P., Chen B., Wang Z., Wu Y.S., 2012, The Application Of Comprehensive Information Prognosis in Iron Ore Resources of the East Kunlun Fault by ArcGIS -Take Type Sedimentary Metamorphic Iron Ore For Example , Acta Geologica Sinica, 06,1005-1019
Olivera F., Valenzuela M., Srinivasan R., Choi J. , Cho H.D., Koka S., Agrawal A., 2006, ArcGIS-SWAT: A Geodata Model and GIS Interface for SWAT,JOURNAL OF THE AMERICAN WATER RESOURCES ASSOCIATION, 2(42),295-309, DOI: 10.1111/j.1752-1688.2006.tb03839.x
1008

![Shortest-pathg rocerys hoppingjustinppearson.com/pages/shortest-path-grocery-shopping/shortest-path-grocery-shopping.pdfGraphPlot[meshGraph, ImageSize→ Full] Getthegraphvertices](https://img.pdfslide.us/doc/110x75/5ec9717fc18133726b4d56ff/shortest-pathg-rocerys-h-graphplotmeshgraph-imagesizea-full-getthegraphvertices.jpg)