Embed Size (px)
Citation preview
Proceedings World Geothermal Congress 2015
Melbourne, Australia, 19-25 April 2015
1
Design and Analysis of Multi-well Interference Tests
Serhat Akin
Department of Petroleum & Natural Gas Engineering, Middle East Technical University, Ankara - Turkey
Keywords: multi-well interference test, superposition, numerical well test analysis
ABSTRACT
Conventional interference tests conducted in geothermal reservoirs are used to assess bulk transmissivities and storativities as well
as the productivity and size of a geothermal reservoir. Hydrological heterogeneities such as no-flow and pressure support
boundaries can also be identified using such tests. In a typical interference test a pressure disturbance is created in one well and the
pressure response is measured in one or more wells. Analysis of such tests is straightforward if only one well is active. In this
paper presence of more than one active well in interference tests is discussed. Design and analysis of an interference test where
more than one well is active is presented using data obtained from a geothermal reservoir located in West Anatolia, Turkey. The
analysis was conducted by including the effects of other flowing wells using superposition in time and space. It has been observed
that careful interpretation is required to obtain correct reservoir properties from interference tests. It has been also observed that
numerical test analysis is not superior to analytical analysis due to additional data requirement.
1. INTRODUCTION
Conventional interference testing in geothermal fields is one of the major tools used to determine bulk transmissivities
(permeability-thickness product) and storativities (porosity-compressibility-thickness product), and to locate boundaries. Changes
in the hydrology of geothermal reservoirs in geologic time can be caused through mineral dissolution and/or deposition, changes in
the heat flux into or out of the system, crustal movements, changes in fluid components (brine and gas) moving into or out of the
reservoir, and exploitation. Exploitation increases the rate of occurrence of natural processes in the reservoir, with mineral
dissolution/deposition and reduction in the heat capacity of the system being the most significant. Interference tests are both an
essential and economical tool in assessing the extractable heat capacity of a geothermal field and monitoring changes in reservoir
characteristics as the geothermal field maturates through exploitation. They serve to prove the existence of productive reservoir
between the wells.
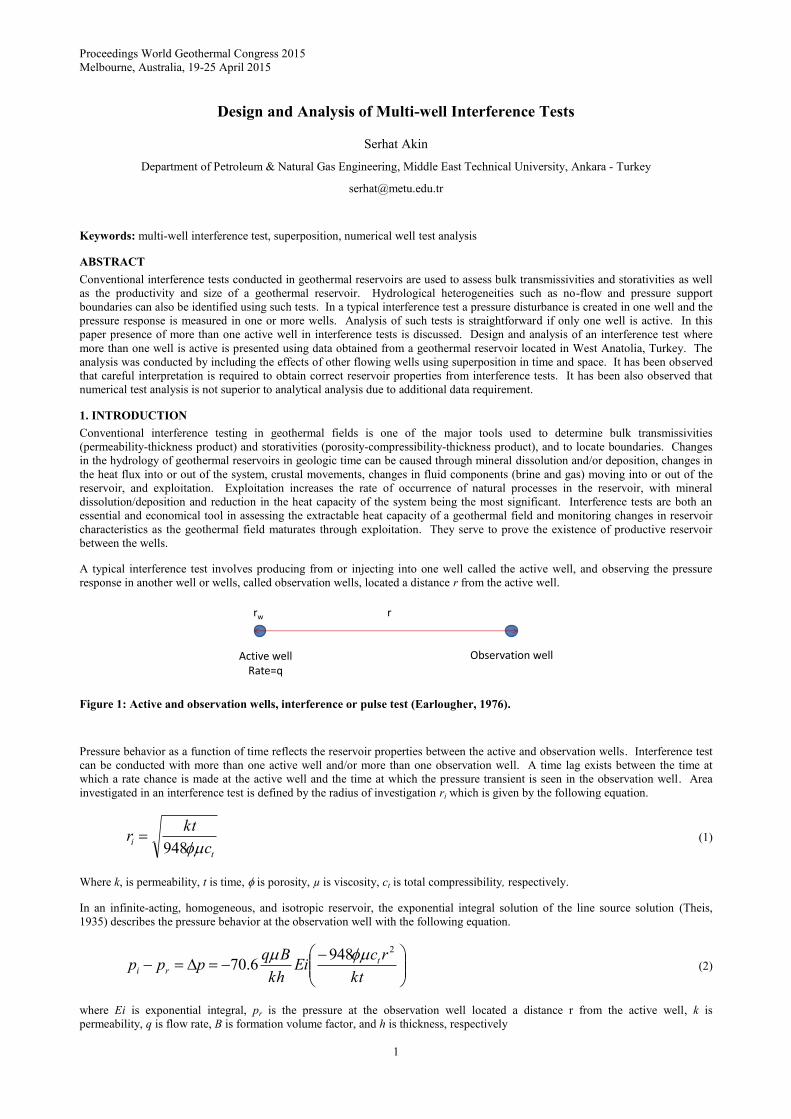
A typical interference test involves producing from or injecting into one well called the active well, and observing the pressure
response in another well or wells, called observation wells, located a distance r from the active well.
Figure 1: Active and observation wells, interference or pulse test (Earlougher, 1976).
Pressure behavior as a function of time reflects the reservoir properties between the active and observation wells. Interference test
can be conducted with more than one active well and/or more than one observation well. A time lag exists between the time at
which a rate chance is made at the active well and the time at which the pressure transient is seen in the observation well. Area
investigated in an interference test is defined by the radius of investigation ri which is given by the following equation.
t
ic
ktr
948 (1)
Where k, is permeability, t is time, is porosity, µ is viscosity, ct is total compressibility, respectively.
In an infinite-acting, homogeneous, and isotropic reservoir, the exponential integral solution of the line source solution (Theis,
1935) describes the pressure behavior at the observation well with the following equation.
kt
rcEi
kh
Bqppp t
ri
29486.70
(2)
where Ei is exponential integral, pr is the pressure at the observation well located a distance r from the active well, k is
permeability, q is flow rate, B is formation volume factor, and h is thickness, respectively
rw r
Active wellRate=q
Observation well
Akin
2
Since the skin factor of the active well does not affect the drawdown at the observation well, skin factor does not appear in the
equation. From this solution, it can be observed that by suitable observation of the pressure change, it may be possible to identify
two important parameters: the permeability-thickness and the storativity (Earlougher, 1977; Horne, 1995). Usually, type curve
matching is used to analyze pressure data from an interference test with constant rate production at the active well. Using
appropriate dimensionless variables the aforementioned solution can be written as follows.
d
dd
t
rEip
42
1 2
(3)
Many formations exhibit areal (ky-kx) anisotropy. This anisotropy may also be applicable for formations containing trending
fracture patterns commonly observed in geothermal reservoirs. Ramey (1975) presented a solution originally given by Papadopulos
(1965). The pressure response p(x,y,t) at an observation well caused by an active well (producer or injector) located at the origin in
a rectangular (x-y) coordinate system is given by the following equation.
2
22
22
00105.02
1
2.141 xyyyxx
xyyyxxtxyti
xyyyxxkkk
xykxkyk
t
cEi
Bq
pphkkk
(4)
Where
2122
42
1xyyyxxyyxxXX kkkkkk (5)
2122
42
1xyyyxxyyxxYY kkkkkk (6)
xy
xxXX
k
kkarctan (7)
Where kxx
, kyy
, kxy are components of the permeability tensor (md).
The principal permeabilities, kXX and k
YY, and the orientation, , can be determined from interference test data from three
observation wells located on different rays from the active well at the origin. Method requires performing a type curve match of the
test data with the aforementioned exponential-integral solution. For the anisotropic case, dimensionless pressure and time variables
are defined, respectively, as follows.
Bq
pphkkkp
xyti
xyyyxxD2.141
2 (8)
xykxkyk
kkk
c
t
r
t
xyyyxx
xyyyxx
tD
D
2
0002637.022
2
2 (9)
A multi-well interference test was conducted in the Uenotai geothermal field, Akita Prefecture, Japan (Menzies et al., 1990). Two
injection and five observation wells were used. The observation well pressure data have been analyzed using analytical simulation
techniques, modified by using the principle of superposition in both time and space to account for multiple production wells and
changes in flow rate. Due to the two-phase conditions present in the reservoir, the analysis is only considered to provide order-of-
magnitude estimates of the reservoir transmissivity and storativity. A numerical modeling study (Antunez et al, 1990) confirmed
the findings; however, model results did not match the reduction in enthalpy that occurred during the test.
Sanyal et al (2000) reported 13 well interference test where three wells flowed continuously. Other wells were put on production
one by one with the aim of determining whether the two aquifers present in the field were in hydrologic communication and
estimating the storage and flow properties of each aquifer. The data were analyzed using superposition of the “line source solution”
to the “diffusivity equation” for fluid flow in porous media in both space and time. Using the measured and inferred production
histories of the wells, the observed and calculated pressure histories of the observation wells were matched satisfactorily by trial
and error.
Leaver et al (1988) presented analyses of multiple interference tests carried out in the Ohaaki geothermal field between 1979 and
1983. Several well pairs with more than one permeable depth were tested. Tests are analyzed by use of homogeneous reservoir

Akin
3
models in an effort to identify a linear boundary of the field. The analysis of interference tests on the same doublet showed that
vastly different reservoir parameters could be found unless careful interpretation was made.
As described above, in a typical interference test a pressure disturbance is created in one well and corresponding pressure response
is measured in one or more wells. In new reservoirs, an interference test is not affected by other production in the field. Analysis
of such tests is straightforward if only one well is active. In this study presence of more than one active well in interference tests is
discussed using synthetic data. First, analysis of data will be presented where presence of other wells are ignored. Errors will be
discussed thoroughly. Finally, using data obtained from a geothermal reservoir located in West Anatolia, Turkey interference test
design and analysis conducted by including the effects of other flowing wells using superposition in time and space will be
presented.
2. METHODOLOGY
The proposed multi-well, multi-rate analytical simulation model uses the concept of mathematical superposition in time and in
space of the aforementioned "exponential integral solution" to calculate the pressure response at any point in a reservoir due to the
production or injection from one or more wells at variable rates. The model uses the measured flow rate history of the wells to
calculate the theoretical pressure (or water level) response as a function of time at any given point in the reservoir. Certain
reservoir and well characteristics such as reservoir fluid viscosity, specific volume of the reservoir fluid, wellbore diameter, "skin
factor" (if the observation well is an active well), reservoir flow capacity (or transmissivity), reservoir storage capacity, reservoir
temperature, specific volume or density of the injected water, initial reservoir pressure, and the distance between each production
well and the observation point are required as input data to the model. It is assumed that there are no chemical reactions occurring
during the test period that will affect the reservoir fluid and rock properties. For the sake of simplicity, it is assumed that the
reservoir fluid is pure water.
The analytical model can be the classical model described in the previous section or any double porosity model with or without the
presence of boundaries (Horne, 1995). First a manual type curve matching is conducted using Kappa’s Saphir software (Houze et
al, 2013). Then the calculated pressure behavior from this model is compared with the observed pressure behavior using a gradient
based automated history matching procedure embedded in Saphir. If the simulated pressure and observed pressure behaviors agree
within a chosen tolerance, the behavior of the well is assumed to be "matched". Once this match is achieved, the assumed model
with the chosen parameters is considered to be "calibrated". This automated history matching process is continued until the
calculated pressure behavior matches the observed behavior within the chosen tolerance for that well. After this stage, confidence
interval of each parameter is checked to see whether they are less than 10%. If the calculated and observed pressure behaviors do
not match or the confidence intervals are larger than 10%, one or more of the input parameters to the model are changed and the
pressure behavior is recalculated. The tolerance is chosen based on the sensitivity and accuracy of the pressure measurements.
Once the match is obtained, the hydrologic properties used to get the match can be considered to be reliable estimates for the
reservoir.
3. RESULTS
The initial assessment of geothermal reservoirs is usually aimed to determine both the flow capacity and estimation of the reserves.
First the impact of ignoring the other wells’ effect on the flow capacity and estimation of the reserves will be demonstrated using a
synthetic example. Then a real field interference test where more than one active well is present will be designed and then analyzed
using the procedure introduced in the previous section.
3.1 Synthetic Example
Let’s assume that in a faulted – fractured geothermal field an interference test is to be conducted. In this hypothetical scenario, it is
assumed that four production wells (Well 1, 2, 5, and 6) and 3 injection wells (Well 3, 4 and 4) are used for an existing power plant.
It is further assumed that the wells produce and inject to same feed zone in the reservoir. Two wells that will be used in a new
power plant are to be tested by flowing one well and observing the pressure change in the other well. The locations of the wells and
finite conductivity (1.524 Darcy - m) faults in the field are given in Figure 2. Using Kappa’s Saphir software (Houze et al, 2013)
this situation as well its variations were modeled. The model simulated an interference test conducted in a double porosity
reservoir with wellbore storage and skin effects. In order to consider the effects of existing wells production wells while keeping
all injectors active, production wells are kept open (Table 1). The pressure recorded in the observation well as a result of flowing
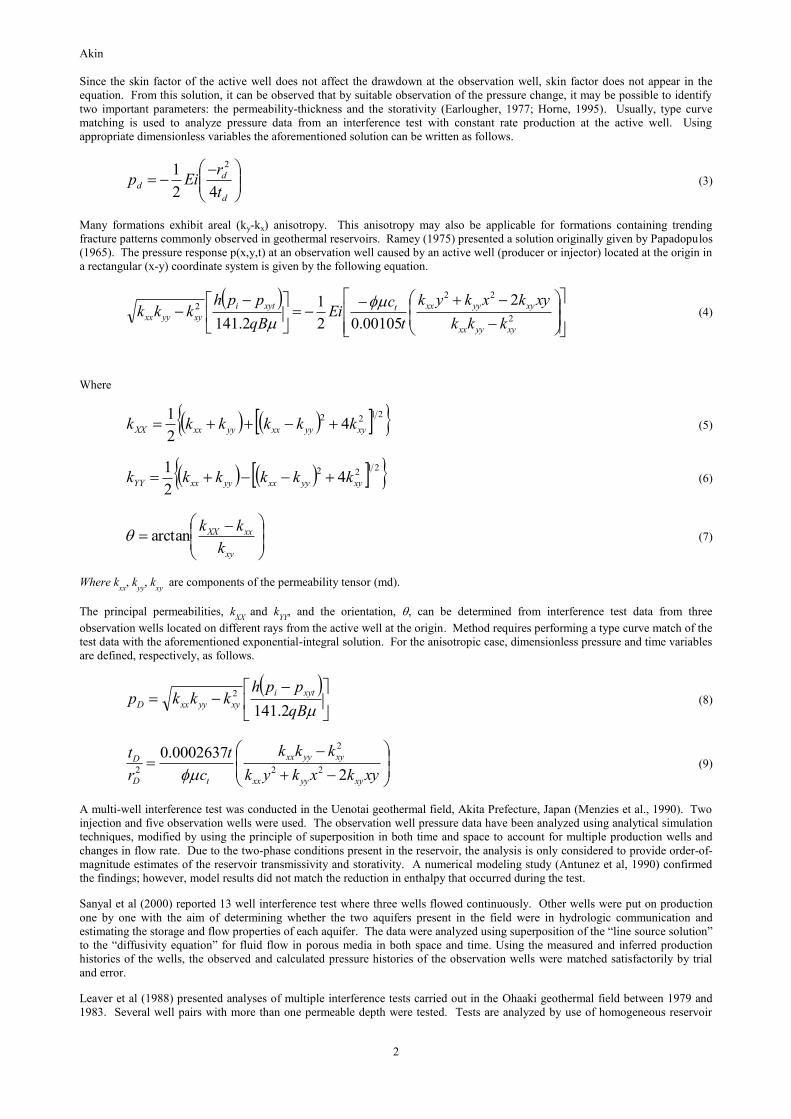
active well was simulated by including the effects of other flowing wells using superposition in time and space (Figure 3). The
complex production history due to the presence of other active wells induces distortions that diffuses and progressively absorbed by
the overall pressure profile (Figure 3).
Figure 2. Synthetic Interference Test Well Field
Akin
4
Figure 3. Synthetic Pressure and Derivative of Pressure four wells producing.
Analysis of the interference tests were conducted using the aforementioned type curve matching and automated history matching
procedure intentionally ignoring the effects of other wells. In all cases a lower flow capacity and storage capacity were obtained at
the end of each analysis (Table 1). On the other hand, larger skin and wellbore storage value were obtained for the active well in all
cases. It was observed that the confidence intervals for all parameters were larger than 25% regardless of number of wells used in
the matching process. The confidence intervals were very wide (>100%) for wellbore storage, skin, inter porosity flow parameter
and storativity ratio values decreasing the reliability of the estimates.
As discussed in the previous sections, interference test results can be used to estimate storage capacity of the reservoir (that can be
used in the estimation of the reserves) and the bulk transmissivities (that can be used to determine deliverability rate from the
reservoir). The amount of fluid in storage in the reservoir can be calculated from the storage capacity values estimated from
matching of the test results. Storage capacity (S, m/bar) is defined as:
(10)
Where is the porosity of the reservoir, fraction; ct is total compressibility of the reservoir rock and fluid, bar-1; and h is reservoir
thickness, m, respectively
In the synthetic example the total compressibility is taken as 4.35113x10⁻⁵, bar-1 and the thickness is 500 m. As can be seen from
Table 1 when the effects of other active wells are ignored, storage capacity is underestimated roughly three times less than the
original value. Similarly the deliverability rate is also underestimated two times the original value seriously affecting the well
spacing estimates. If the development of the field is considered with these values it is obvious that the reservoir development
considerations such production – reinjection as well as production – production well spacing will be negatively affected.
Table 1. Results of well test analysis ignoring production and injection effects of existing wells.
K,
md skin C
bbl/psi
S
(m/bar)
Flow
Capacity
Darcy –
m
One Well Producing 16.3 0.999 2.54x10⁻⁵ 0.0339 0.873 0.0391 0.000737 8.15
Two Wells Producing 26.9 0.999 2.35x10⁻⁵ 0.0351 0.814 0.0424 0.000763 13.45
Three Wells Producing 26.9 0.999 2.13x10⁻⁵ 0.035 0.714 0.047 0.000761 13.45
Four Wells Producing 26.9 0.999 2.13x10⁻⁵ 0.0351 0.63 0.0433 0.000763 13.45
Four Wells Producing
Longer Time
26.8 0.999 2.09x10⁻⁵ 0.0359 0.747 0.0479 0.000781 13.40
Four Wells Producing
Double Production
25.4 0.259 2.22x10⁻⁵ 0.0406 0.375 0.0451 0.000883 12.7
True 33.3 0.1 1.0x10⁻⁶ 0.1 0 0.01 0.002175 16.65
3.2 Case Study
A multi-well interference test was designed and conducted in a faulted and fractured reservoir located in West Turkey. The
reservoir temperature is larger than C at a depth between 1100 m to 1500 m. Marbles and schists of the Paleozoic Menderes
Massif metamorphics are the reservoir rocks of the geothermal system. Impermeable clayey levels of the overlying Salihli -
Hamamdere units, which are Miocene terrestrial sediments, are the cap rocks. Presence of hot waters is closely related to some
specific faults and graben tectonics. Hydrogeological and geochemical properties of the field are reported elsewhere (Filiz, et al,
1992). The test objectives were set to obtain the following
• Static wellbore temperature and pressure profiles of each well before interference testing;
• Baseline reservoir pressure conditions in monitoring well prior to the test;
• Fluid samples that are representative of virgin reservoir fluid;
• Data in the observation wells and in the active wells (after shutting in) during and after each well’s respective flow period;
1E-12
1E-09
0.000001
0.001
1
0.0001 0.001 0.01 0.1 1 10 100 1000
Pre
ssu
re a
nd
De
riva
tive
Pre
ssu
re, p
si
Time, hr
Akin
5
• Local and regional reservoir properties;
• Existence of the inter-well pressure connection;
• A reservoir model from the analysis of the interference test;
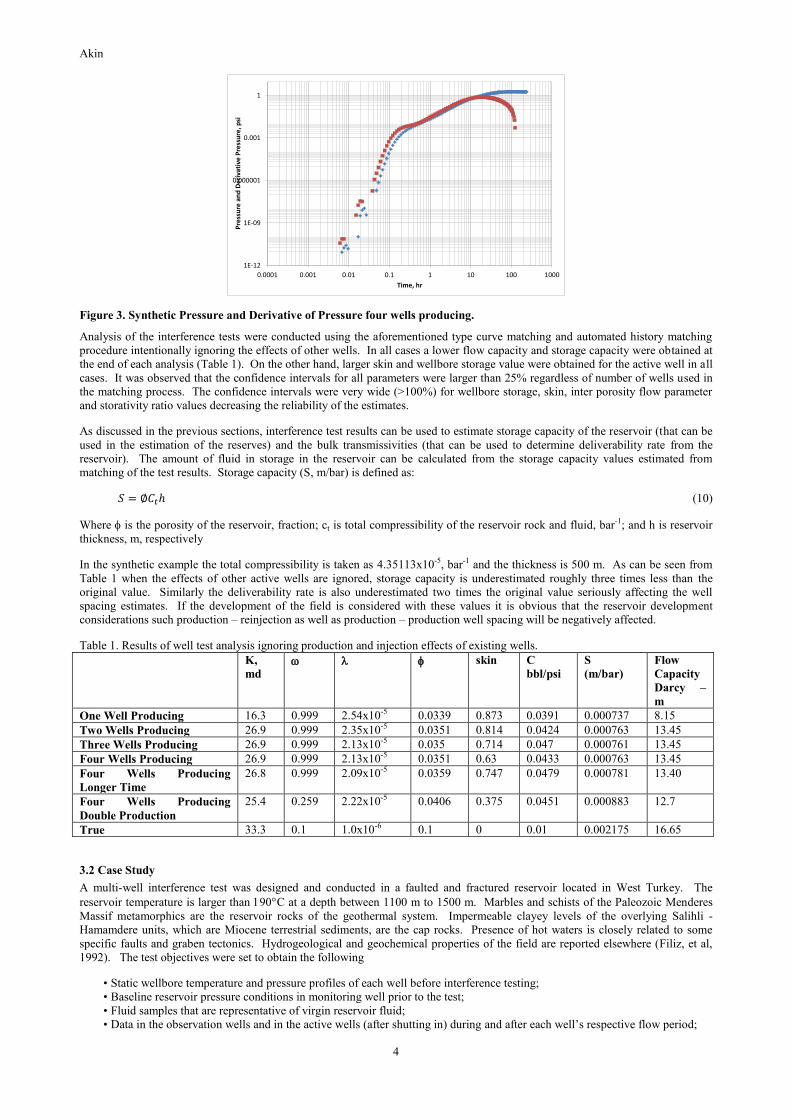
For the test design five wells present in the field were considered. Three of these wells are located south west of the observation
well (Figure 4). The test program was carefully developed to address the aforementioned issues. In Phase I each of the active wells
was allowed to flow independently one day long followed by another day of shut-in period. Some “clean” periods where each of
the active wells is shut-in were built into the test design. The purpose of these “clean” periods was to introduce stable periods
where boundaries and other features are easily detected. Phase II was to commence subsequently to dictate whether or not all wells
will flow together for a period of 72 hours. The flow periods were kept at reasonable durations due to possible calcite scaling
issues. The fractured and heterogeneous nature of the system and interpretation of previous buildup and injection tests suggests that
a double porosity model would best describe the transient behavior in the observation well. It was assumed that a quartz gauge will
be used and that faulted nature introduced (ky-kx) anisotropy of 0.1. It has been observed that short a flow period of 24 hours was
reasonable to observe hydraulic communication between active wells and the observation well (Figure 5). The log – log plot of the
final build-up pressure and pressure derivative clearly showed the effect of boundaries (Figure 6). Thus, it was concluded that the
final “clean” period duration was long enough to observe boundary effects as well as to determine reservoir properties.
Figure 4. Location of observation well (O-1) and active wells.
Figure 5. Test design - pressure behavior expected at the observation well during the whole test.
Figure 6. Test design - pressure and pressure behavior expected at the observation well during buildup period.
O-1W-1
W-3
W-2
W-4
550 m
N
3.40E+07
3.41E+07
3.41E+07
3.42E+07
3.42E+07
3.43E+07
3.43E+07
3.44E+07
3.44E+07
3.45E+07
3.45E+07
0 100 200 300 400 500
Pre
ssu
re, P
a
Time, hr
1000
10000
100000
1000000
0.001 0.01 0.1 1 10 100
Pre
ssu
re, P
ress
ure
De
riva
tive
, Pa
Time, hr
Akin
6
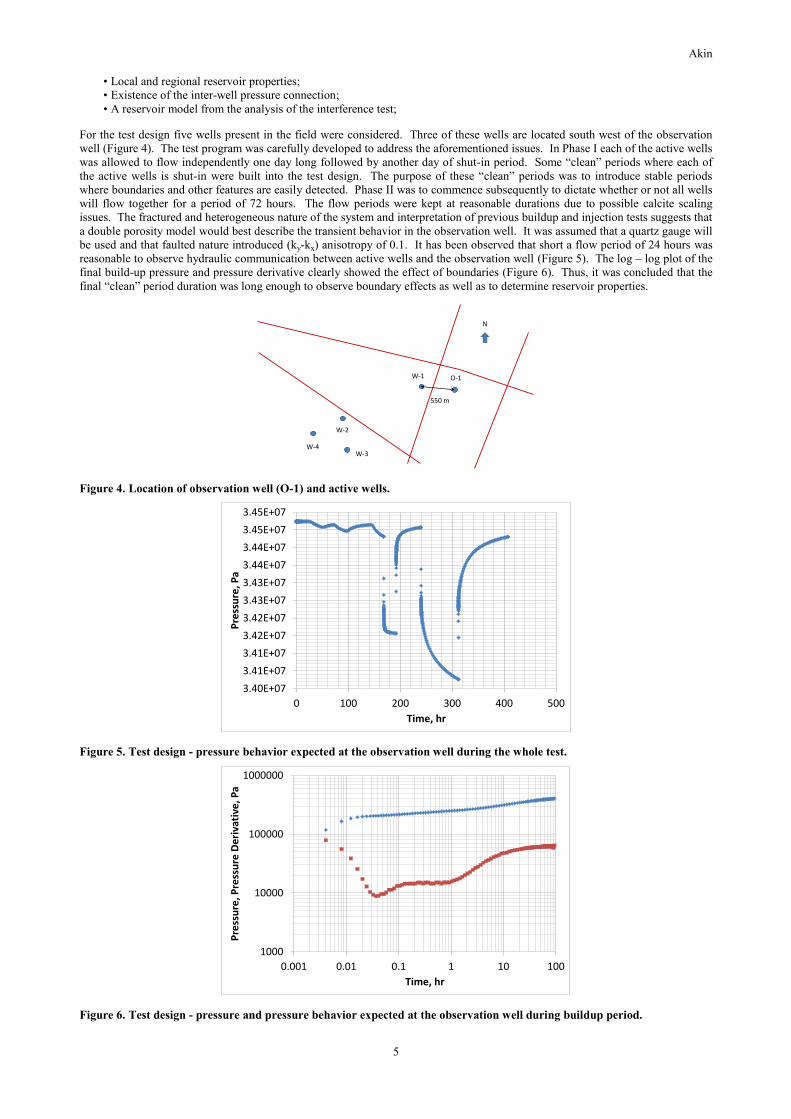
The test began with establishing baseline pressures (Figure 7) in both wells. Following that each well was allowed to flow at
differing rates while the pressure response was monitored in O-1 well located 550 meters away from the nearest well (Figure 4).
The “clean” buildup period of each well was also monitored. Finally, all wells were allowed to flow simultaneously at differing
flow rates aimed at establishing stable field deliverability. Real time flow rate data that was obtained as a result of this schedule is
given in Figure 7. All through the test stable flow rates were achieved for three of the active wells except Well-1 whose rate
continually decreased from 540 t/hr to 220 t/hr. Complex production history due to rate changes in active wells induced distortions
that diffused and progressively absorbed by the overall pressure profile (Figure 8 and Figure 9). The recorded pressure data
showed oscillations that may be the result of earth tides or residual barometric fluctuations. No hydrologic boundaries to the
geothermal system were apparent in the interference data. However, the seasonal rise in water level may have masked the effects
of a boundary in the very late time data. This sheds a new light on the hydrological properties of the fault system given in Figure 4.
The fault does not behave according to classic models for either a barrier or constant potential boundary. Instead, it is essentially
invisible to testing. Several equally hypotheses may explain this behavior. First, the hot water may upwell over a broad region
rather than along a single fault zone that would be detected hydrologically. Second, the fault permeability may be on the same
order of magnitude as the permeability of other geological features (fracture systems, etc) and hence indistinguishable. Finally, a
single fault may provide a conduit for upwelling from greater depth but as the fault approaches surface, the width of the fracture
surface may increase creating a diffuse upwelling region in the near surface zones. Without more information, it is not possible to
further comment on the correctness of these possibilities.
Figure 7. Interference test schedule.
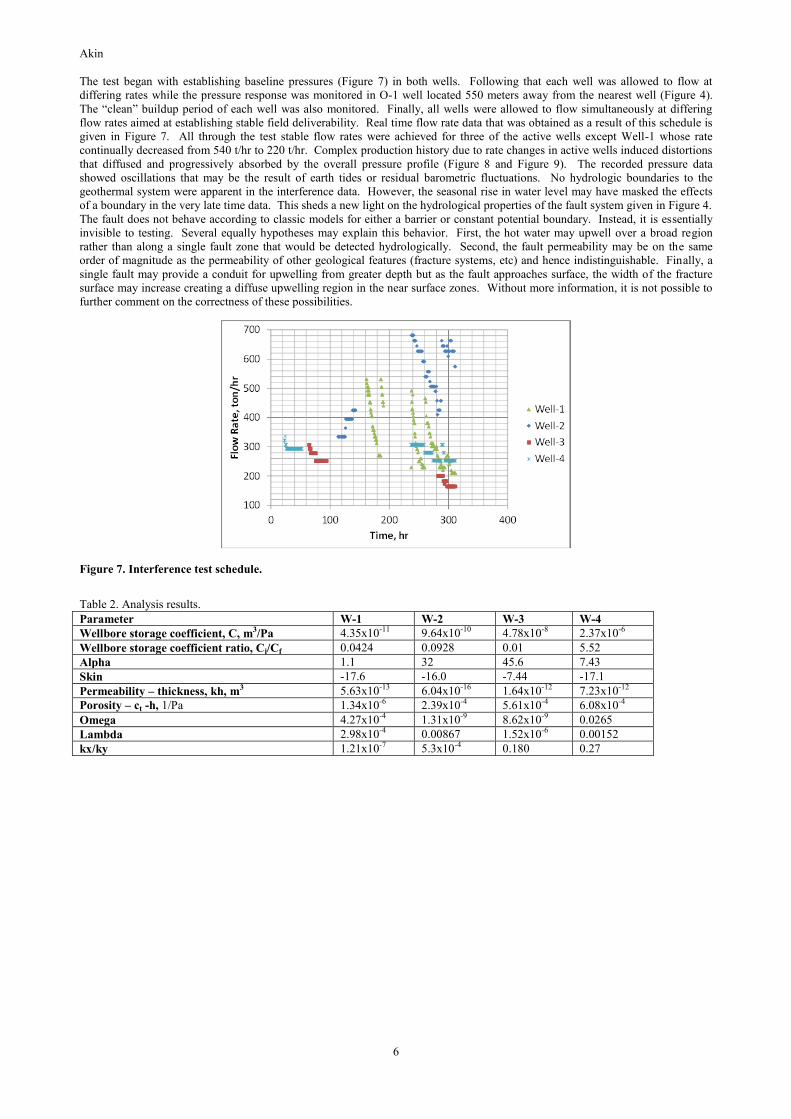
Table 2. Analysis results.
Parameter W-1 W-2 W-3 W-4
Wellbore storage coefficient, C, m3/Pa 4.35x10⁻¹¹ 9.64x10⁻¹⁰ 4.78x10⁻⁸ 2.37x10⁻⁶
Wellbore storage coefficient ratio, Ci/Cf 0.0424 0.0928 0.01 5.52
Alpha 1.1 32 45.6 7.43
Skin -17.6 -16.0 -7.44 -17.1
Permeability – thickness, kh, m3 5.63x10⁻¹³ 6.04x10⁻¹⁶ 1.64x10⁻¹² 7.23x10⁻¹²
Porosity – ct -h, 1/Pa 1.34x10⁻⁶ 2.39x10⁻⁴ 5.61x10⁻⁴ 6.08x10⁻⁴
Omega 4.27x10⁻⁴ 1.31x10⁻⁹ 8.62x10⁻⁹ 0.0265
Lambda 2.98x10⁻⁴ 0.00867 1.52x10⁻⁶ 0.00152
kx/ky 1.21x10⁻⁷ 5.3x10⁻⁴ 0.180 0.27
Akin
7
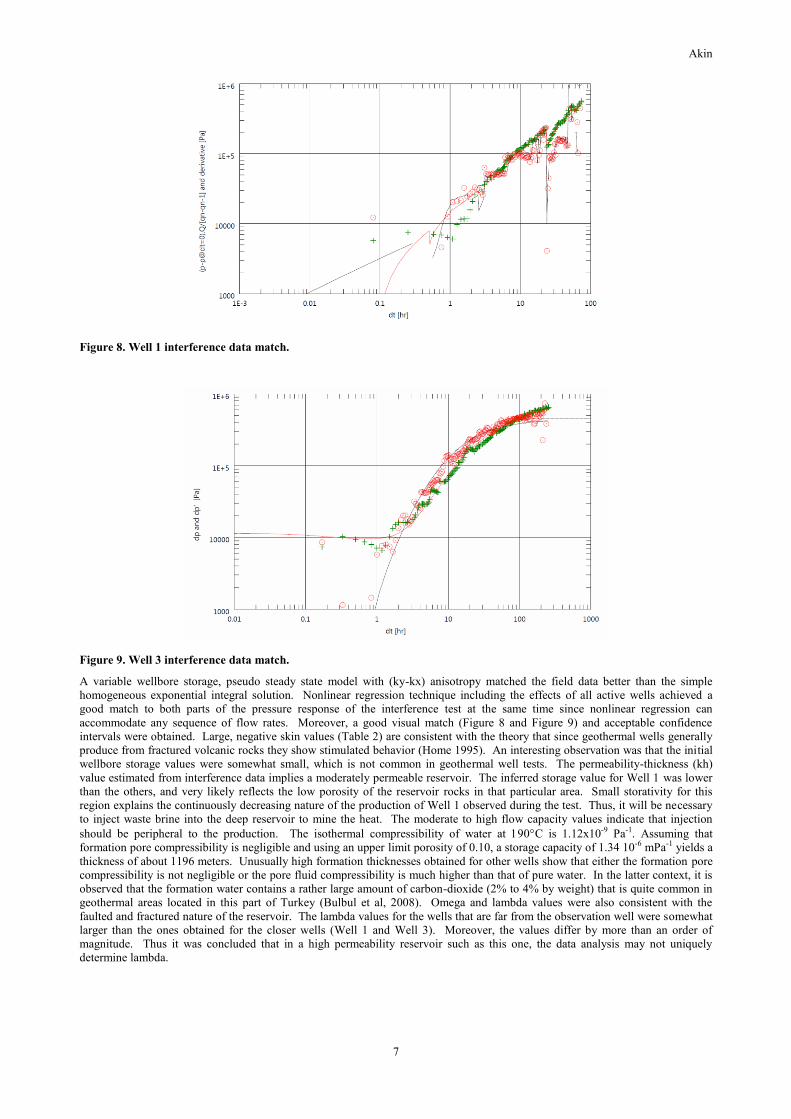
Figure 8. Well 1 interference data match.
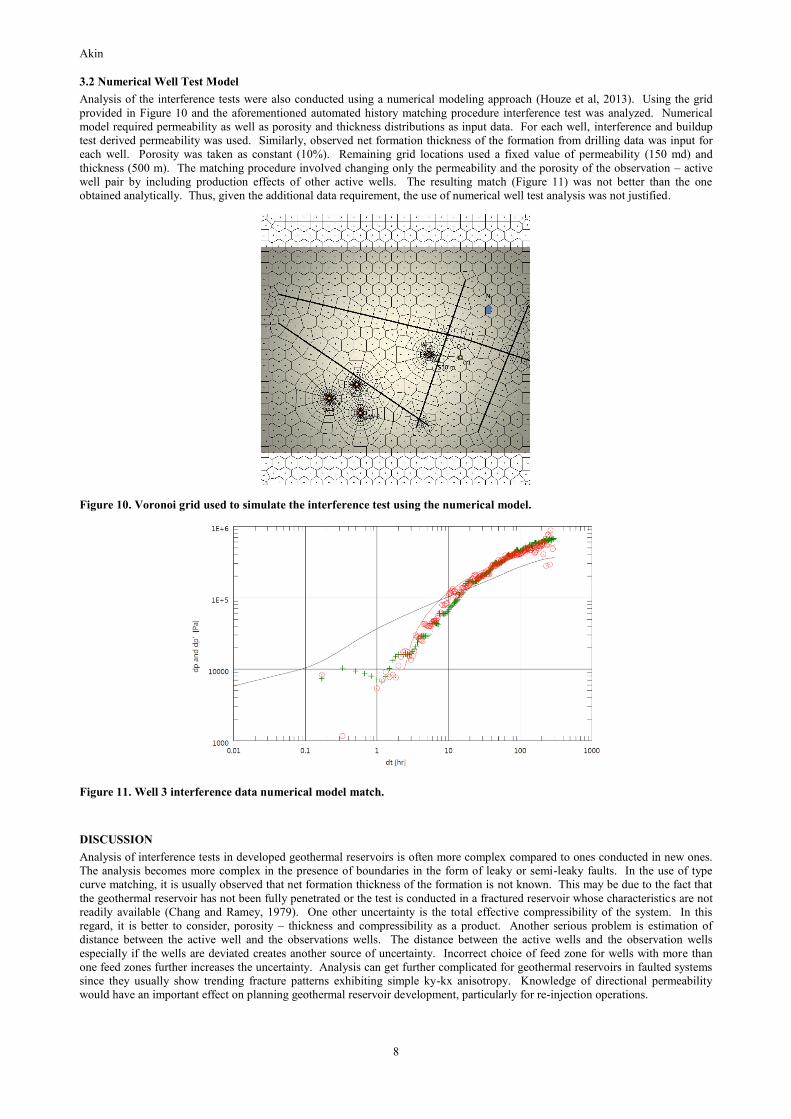
Figure 9. Well 3 interference data match.
A variable wellbore storage, pseudo steady state model with (ky-kx) anisotropy matched the field data better than the simple
homogeneous exponential integral solution. Nonlinear regression technique including the effects of all active wells achieved a
good match to both parts of the pressure response of the interference test at the same time since nonlinear regression can
accommodate any sequence of flow rates. Moreover, a good visual match (Figure 8 and Figure 9) and acceptable confidence
intervals were obtained. Large, negative skin values (Table 2) are consistent with the theory that since geothermal wells generally
produce from fractured volcanic rocks they show stimulated behavior (Home 1995). An interesting observation was that the initial
wellbore storage values were somewhat small, which is not common in geothermal well tests. The permeability-thickness (kh)
value estimated from interference data implies a moderately permeable reservoir. The inferred storage value for Well 1 was lower
than the others, and very likely reflects the low porosity of the reservoir rocks in that particular area. Small storativity for this
region explains the continuously decreasing nature of the production of Well 1 observed during the test. Thus, it will be necessary
to inject waste brine into the deep reservoir to mine the heat. The moderate to high flow capacity values indicate that injection
should be peripheral to the production. The isothermal compressibility of water at C is 1.12x10⁻⁹ Pa-1. Assuming that
formation pore compressibility is negligible and using an upper limit porosity of 0.10, a storage capacity of 1.34 10-6 mPa-1 yields a
thickness of about 1196 meters. Unusually high formation thicknesses obtained for other wells show that either the formation pore
compressibility is not negligible or the pore fluid compressibility is much higher than that of pure water. In the latter context, it is
observed that the formation water contains a rather large amount of carbon-dioxide (2% to 4% by weight) that is quite common in
geothermal areas located in this part of Turkey (Bulbul et al, 2008). Omega and lambda values were also consistent with the
faulted and fractured nature of the reservoir. The lambda values for the wells that are far from the observation well were somewhat
larger than the ones obtained for the closer wells (Well 1 and Well 3). Moreover, the values differ by more than an order of
magnitude. Thus it was concluded that in a high permeability reservoir such as this one, the data analysis may not uniquely
determine lambda.
Akin
8
3.2 Numerical Well Test Model
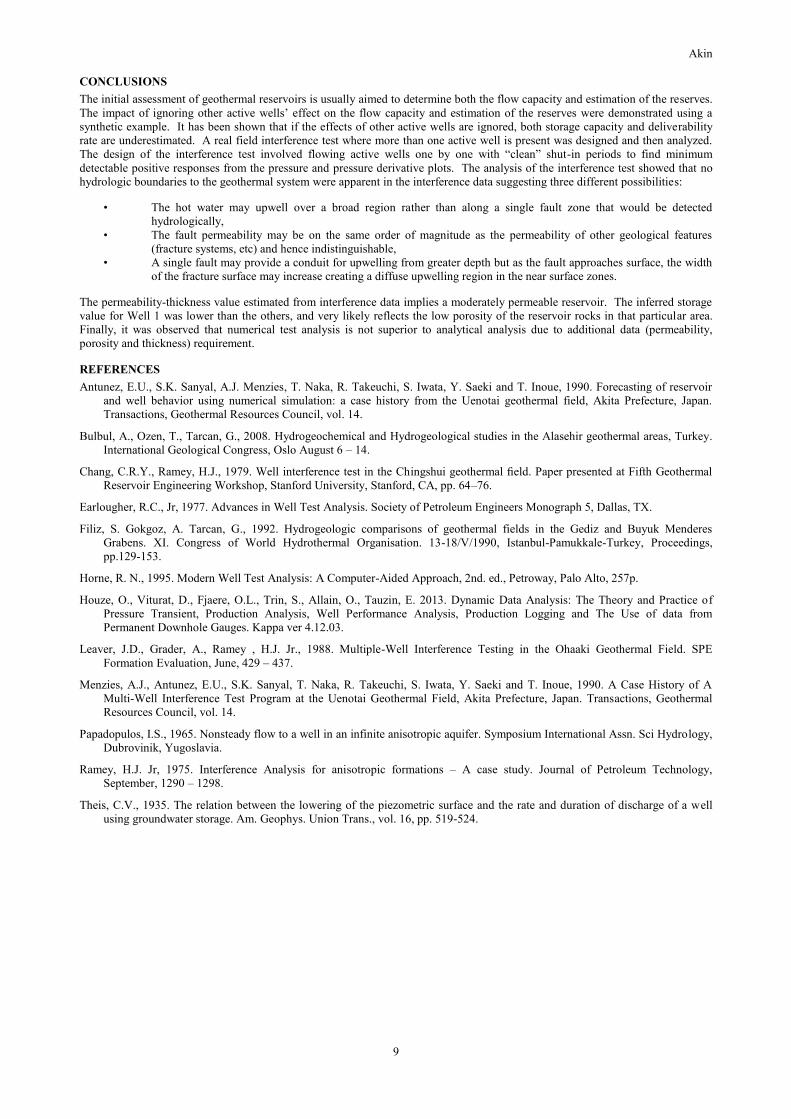
Analysis of the interference tests were also conducted using a numerical modeling approach (Houze et al, 2013). Using the grid
provided in Figure 10 and the aforementioned automated history matching procedure interference test was analyzed. Numerical
model required permeability as well as porosity and thickness distributions as input data. For each well, interference and buildup
test derived permeability was used. Similarly, observed net formation thickness of the formation from drilling data was input for
each well. Porosity was taken as constant (10%). Remaining grid locations used a fixed value of permeability (150 md) and
thickness (500 m). The matching procedure involved changing only the permeability and the porosity of the observation – active
well pair by including production effects of other active wells. The resulting match (Figure 11) was not better than the one
obtained analytically. Thus, given the additional data requirement, the use of numerical well test analysis was not justified.
Figure 10. Voronoi grid used to simulate the interference test using the numerical model.
Figure 11. Well 3 interference data numerical model match.
DISCUSSION
Analysis of interference tests in developed geothermal reservoirs is often more complex compared to ones conducted in new ones.
The analysis becomes more complex in the presence of boundaries in the form of leaky or semi-leaky faults. In the use of type
curve matching, it is usually observed that net formation thickness of the formation is not known. This may be due to the fact that
the geothermal reservoir has not been fully penetrated or the test is conducted in a fractured reservoir whose characteristics are not
readily available (Chang and Ramey, 1979). One other uncertainty is the total effective compressibility of the system. In this
regard, it is better to consider, porosity – thickness and compressibility as a product. Another serious problem is estimation of
distance between the active well and the observations wells. The distance between the active wells and the observation wells
especially if the wells are deviated creates another source of uncertainty. Incorrect choice of feed zone for wells with more than
one feed zones further increases the uncertainty. Analysis can get further complicated for geothermal reservoirs in faulted systems
since they usually show trending fracture patterns exhibiting simple ky-kx anisotropy. Knowledge of directional permeability
would have an important effect on planning geothermal reservoir development, particularly for re-injection operations.
Akin
9
CONCLUSIONS
The initial assessment of geothermal reservoirs is usually aimed to determine both the flow capacity and estimation of the reserves.
The impact of ignoring other active wells’ effect on the flow capacity and estimation of the reserves were demonstrated using a
synthetic example. It has been shown that if the effects of other active wells are ignored, both storage capacity and deliverability
rate are underestimated. A real field interference test where more than one active well is present was designed and then analyzed.
The design of the interference test involved flowing active wells one by one with “clean” shut-in periods to find minimum
detectable positive responses from the pressure and pressure derivative plots. The analysis of the interference test showed that no
hydrologic boundaries to the geothermal system were apparent in the interference data suggesting three different possibilities:
• The hot water may upwell over a broad region rather than along a single fault zone that would be detected
hydrologically,
• The fault permeability may be on the same order of magnitude as the permeability of other geological features
(fracture systems, etc) and hence indistinguishable,
• A single fault may provide a conduit for upwelling from greater depth but as the fault approaches surface, the width
of the fracture surface may increase creating a diffuse upwelling region in the near surface zones.
The permeability-thickness value estimated from interference data implies a moderately permeable reservoir. The inferred storage
value for Well 1 was lower than the others, and very likely reflects the low porosity of the reservoir rocks in that particular area.
Finally, it was observed that numerical test analysis is not superior to analytical analysis due to additional data (permeability,
porosity and thickness) requirement.
REFERENCES
Antunez, E.U., S.K. Sanyal, A.J. Menzies, T. Naka, R. Takeuchi, S. Iwata, Y. Saeki and T. Inoue, 1990. Forecasting of reservoir
and well behavior using numerical simulation: a case history from the Uenotai geothermal field, Akita Prefecture, Japan.
Transactions, Geothermal Resources Council, vol. 14.
Bulbul, A., Ozen, T., Tarcan, G., 2008. Hydrogeochemical and Hydrogeological studies in the Alasehir geothermal areas, Turkey.
International Geological Congress, Oslo August 6 – 14.
Chang, C.R.Y., Ramey, H.J., 1979. Well interference test in the Chingshui geothermal field. Paper presented at Fifth Geothermal
Reservoir Engineering Workshop, Stanford University, Stanford, CA, pp. 64–76.
Earlougher, R.C., Jr, 1977. Advances in Well Test Analysis. Society of Petroleum Engineers Monograph 5, Dallas, TX.
Filiz, S. Gokgoz, A. Tarcan, G., 1992. Hydrogeologic comparisons of geothermal fields in the Gediz and Buyuk Menderes
Grabens. XI. Congress of World Hydrothermal Organisation. 13-18/V/1990, Istanbul-Pamukkale-Turkey, Proceedings,
pp.129-153.
Horne, R. N., 1995. Modern Well Test Analysis: A Computer-Aided Approach, 2nd. ed., Petroway, Palo Alto, 257p.
Houze, O., Viturat, D., Fjaere, O.L., Trin, S., Allain, O., Tauzin, E. 2013. Dynamic Data Analysis: The Theory and Practice of
Pressure Transient, Production Analysis, Well Performance Analysis, Production Logging and The Use of data from
Permanent Downhole Gauges. Kappa ver 4.12.03.
Leaver, J.D., Grader, A., Ramey , H.J. Jr., 1988. Multiple-Well Interference Testing in the Ohaaki Geothermal Field. SPE
Formation Evaluation, June, 429 – 437.
Menzies, A.J., Antunez, E.U., S.K. Sanyal, T. Naka, R. Takeuchi, S. Iwata, Y. Saeki and T. Inoue, 1990. A Case History of A
Multi-Well Interference Test Program at the Uenotai Geothermal Field, Akita Prefecture, Japan. Transactions, Geothermal
Resources Council, vol. 14.
Papadopulos, I.S., 1965. Nonsteady flow to a well in an infinite anisotropic aquifer. Symposium International Assn. Sci Hydrology,
Dubrovinik, Yugoslavia.
Ramey, H.J. Jr, 1975. Interference Analysis for anisotropic formations – A case study. Journal of Petroleum Technology,
September, 1290 – 1298.
Theis, C.V., 1935. The relation between the lowering of the piezometric surface and the rate and duration of discharge of a well
using groundwater storage. Am. Geophys. Union Trans., vol. 16, pp. 519-524.