Embed Size (px)
Citation preview
4
Design and Analysis of IP-Multimedia Subsystem (IMS)
Wagdy Anis Aziz1 and Dorgham Sisalem2 1Mobinil
2Tekelec, Berlin 1Egypt
2Germany
1. Introduction
IP Multimedia Subsystem (IMS) has resulted from the work of the Third Generation Partnership Project (3GPP) toward specifying an all-IP communication service infrastructure (24.229 2009). Mainly looking at the needs and requirements of mobile operators, the 3GPP first specified IMS as a service architecture combining the Internet’s IP technology and wireless and mobility services of current mobile telephony networks. After that the IMS architecture was extended to include fixed networks as well. By deciding to use session initiation protocol (SIP) as the signaling protocol for session establishment and control in IMS instead of developing its own set of protocols, 3GPP has opened the door toward a tight integration of the mobile, fixed and Internet worlds. Recent reports already indicate that there are more than 200 million subscribers using the IMS technology for telephony services.
In this chapter we provide a theoretical model that can be used by operators and network designers to determine the effects of introducing IMS to their networks in terms of bandwidth usage for example and the effects of losses and delays on the service quality. This model uses as the input various traffic characteristics such as the number of calls per second and mean holding time and network characteristics, such as losses and propagation delays. The output of the model provides details on the bandwidth needed for successfully establishing a session when using SIP over UDP in IMS networks.
Voice traffic in IP Multimedia Subsystem (IMS) will be served using Internet Protocol (IP) which is called Voice over IP (VoIP). This chapter uses the "E-Model", (ITU-T Rec. G.107 2005), as an optimization tool to select network and voice parameters like coding scheme, packet loss limitations, and link utilization level in IMS Network. The goal is to deliver guaranteed
Quality of Service for voice while maximizing the number of users served. This optimization can be used to determine the optimal configuration for a Voice over IP in IMS network.
2. Bandwidth calculation for IMS session establishment
2.1 Introduction
By deciding to use session initiation protocol (SIP) as the signaling protocol for session establishment and control in IMS instead of developing its own set of protocols, 3GPP has
www.intechopen.com
Mobile Networks 68
opened the door toward a tight integration of the mobile, fixed and Internet worlds. SIP can be used over various transport protocols such as UDP, TCP or SCTP. To enable the reliable transmission of SIP messages even when used over UDP, SIP supports application level retransmission mechanisms. That is in case no response was received for a sent request then after a timeout the request is retransmitted. Thereby, losses due to overloaded servers or lossy links would cause delays in the session establishment and hence reduce the perceived service quality.
In this part of the chapter we provide a theoretical model that can be used by operators and
network designers to determine the effects of introducing IMS to their networks in terms of
bandwidth usage for example and the effects of losses and delays on the service quality.
This model uses as the input various traffic characteristics such as the number of calls per
second and mean holding time and network characteristics, such as losses and propagation
delays. The output of the model provides details on the bandwidth needed for successfully
establishing a session when using SIP over UDP in IMS networks. In Sec. 2.2 we provide the
related work to this chapter and present a brief overview of the literature concerning
modeling of SIP. In Sec. 2.3 the IMS and SIP in IMS are presented. In Sec. 2.4 the IMS session
establishment phases is presented. The SIP model for IMS session establishment is presented
in Sec. 2.5.
2.2 Related work
With the success of SIP, there have already been a number of studies addressing aspects of performance evaluation and modeling of SIP. Chebbo et al. describe in (Chebbo et al. 2003) a modeling tool with which it is possible to estimate the number of required SIP entities for supporting certain traffic. Gurbani et al. present in (Gurbani et al. 2005) a theoretical model of a SIP server using queuing theory. This model is then used to evaluate the performance of a SIP server in terms of response time and number of served requests. Wu et al. analyze in (Wu et al.2003) the usage of SIP for carrying telephony information in terms of queuing delay and delay variations.
In general, these studies aim at investigating the performance of SIP servers in terms of the
number of SIP sessions that can be supported by a SIP server or the processing delays at
such servers. In contrast, in our work we do not aim at modeling the performance of a SIP
server but to investigate the performance of SIP in terms of the number of messages and
amount of time needed by SIP for establishing a session in lossy environments.
Fathi et al. (Fathi et al.2006) present a model of SIP in VoIP networks and investigate the effects of mobility on the performance of session establishment using SIP. The used model is however rather simplified and is only applicable to stateless SIP proxies which have no notion of transactions. Alam et al. (Alam et al.2005) discuss different performance model for SIP deployment scenarios in mobile networks. This involves providing models for evaluating the performance of push-to-talk applications or the effects of different mobility concepts. The work does not however provide for a model of how SIP itself deals with losses. Sisalem et al. (Sisalem et al. 2008) provided a theoretical model of the effects of losses and delays on the performance of SIP. While that work is providing the basis for our work here, it is rather limited to simple SIP networks as are discussed in IETF. The work in this chapter takes the multi-hop nature of IMS into account as well as the SIP specifications.
www.intechopen.com
Design and Analysis of IP-Multimedia Subsystem (IMS) 69
2.3 Background
In this section, a description of the IP Multimedia Sub system (IMS) architecture including the function of the key components and SIP function in IMS is also presented.
2.3.1 IMS architecture
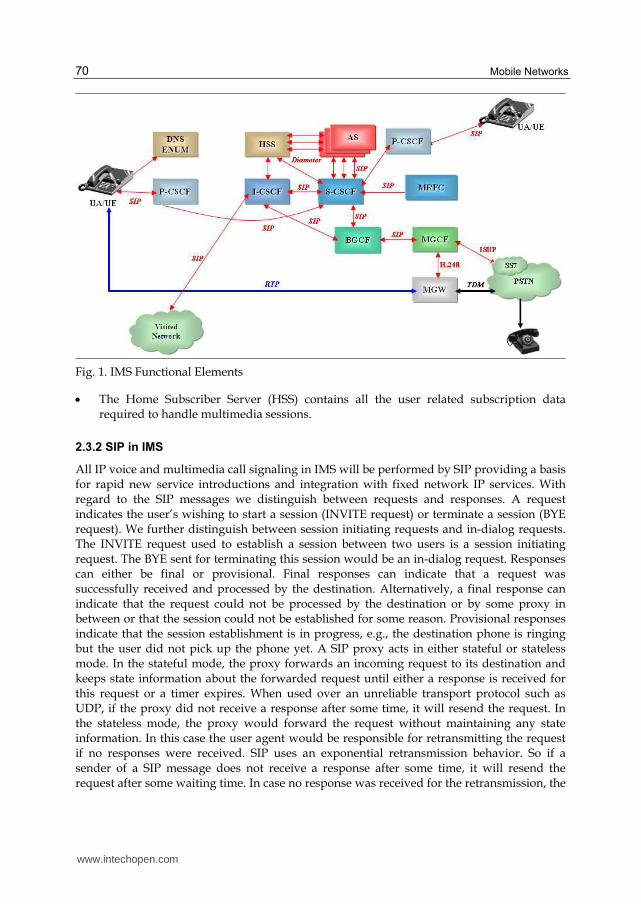
3GPP has standardized the IP Multimedia Subsystem specifications (24.229 2009).IETF also collaborates with them in developing protocols that fulfill their requirements. Figure 1 shows the common nodes included in the IMS .These nodes are:
CSCF (Call/Session Control Function): CSCF is a SIP server which processes SIP signaling in the IMS. There are three types of CSCFs depending on the functionality they provide,
Proxy Call Session Control Function (P-CSCF)
Interrogating Call Session Control Function (I-CSCF)
Serving Call Session Control Function (S-CSCF).
P-CSCF (Proxy-CSCF): The P-CSCF is the first point of contact between the IMS terminal and the IMS network. All the requests initiated by the IMS terminal or destined to the IMS terminal traverse the P-CSCF.
I-CSCF (Interrogating-CSCF): It has an interface to the SLF (Subscriber Location Function) and HSS (Home Subscriber Server). This interface is based on the Diameter protocol (Calhoun et al. 2003).
The I-CSCF retrieves user location information and routes the SIP request to the appropriate destination, typically an S-CSCF.
S-CSCF (Serving-CSCF): It maintains a binding between the user location and the user’s SIP address of record (also known as Public User Identity). Like the I-CSCF, the S-CSCF also implements a Diameter interface to the HSS.
SIP AS (Application Server): The AS is a SIP entity that hosts and executes IP Multimedia Services based on SIP.
ENUM (E.164 NUmber Mapping): The ENUM allows telephone numbers to be resolved into SIP URLs using the Domain Name System (DNS) (Faltstrom 2000).
MRF (Media Resource Function): The MRF provides a source of media in the home network. It is further divided into a signaling plane node called the MRFC (Media Resource Function Controller) and a media plane node called the MRFP (Media Resource Function Processor). The MRFC acts as a SIP User Agent and contains a SIP interface towards the S-CSCF. The MRFC controls the resources in the MRFP via an H.248 interface (ITU-T H.248.1 2005).
BGCF (Breakout Gateway Control Functions): BGCF a SIP server that includes routing functionality based on telephone numbers.
SGW (Signaling Gateway): SGW performs lower layer protocol conversion.
MGCF (Media Gateway Control Function): MGCF implements a state machine that does protocol conversion and maps SIP to either ISUP (ISDN User part) over IP or BICC (Bearer Independent Call Control) over IP. The protocol used between the MGCF and the MGW is H.248 (ITU-T H.248.1 2005)
MGW (Media Gateway): The MGW interfaces the media plane of the PSTN. On one side the MGW is able to send and receive IMS media over the Real-Time Protocol (RTP) (Schulzrinne et al. 2003)
www.intechopen.com
Mobile Networks 70
Fig. 1. IMS Functional Elements
The Home Subscriber Server (HSS) contains all the user related subscription data required to handle multimedia sessions.
2.3.2 SIP in IMS
All IP voice and multimedia call signaling in IMS will be performed by SIP providing a basis for rapid new service introductions and integration with fixed network IP services. With regard to the SIP messages we distinguish between requests and responses. A request indicates the user’s wishing to start a session (INVITE request) or terminate a session (BYE request). We further distinguish between session initiating requests and in-dialog requests. The INVITE request used to establish a session between two users is a session initiating request. The BYE sent for terminating this session would be an in-dialog request. Responses can either be final or provisional. Final responses can indicate that a request was successfully received and processed by the destination. Alternatively, a final response can indicate that the request could not be processed by the destination or by some proxy in between or that the session could not be established for some reason. Provisional responses indicate that the session establishment is in progress, e.g., the destination phone is ringing but the user did not pick up the phone yet. A SIP proxy acts in either stateful or stateless mode. In the stateful mode, the proxy forwards an incoming request to its destination and keeps state information about the forwarded request until either a response is received for this request or a timer expires. When used over an unreliable transport protocol such as UDP, if the proxy did not receive a response after some time, it will resend the request. In the stateless mode, the proxy would forward the request without maintaining any state information. In this case the user agent would be responsible for retransmitting the request if no responses were received. SIP uses an exponential retransmission behavior. So if a sender of a SIP message does not receive a response after some time, it will resend the request after some waiting time. In case no response was received for the retransmission, the
www.intechopen.com
Design and Analysis of IP-Multimedia Subsystem (IMS) 71
sender increases the waiting time and tries again and so up to a certain number of retransmissions, (Rosenberg et al.2002) (29.328 2008).In general one can distinguish between two retransmission modes in SIP:
2.3.2.1 INVITE-retransmissions
This behavior applies for INVITE requests as well as some other messages exchanged during session establishment. If this mode is used then the sender retransmits a message if no confirmation was received after T1 seconds. The retransmission timer is then increased exponentially up to a maximum retransmission timer (Timer B). Once this timer is reached the sender drops the message and stops the retransmission.
2.3.2.2 Non-INVITE-retransmissions
This behavior applies to all requests other than INVITE. In this mode the sender retransmits a message if no confirmation was received after T1 seconds. The retransmission timer is then increased exponentially up to a maximum retransmission timer called T2. Once this timer is reached the sender continues retransmitting the request every T2 up to a maximum timer (TimerF). Once this timer is reached the sender drops the message and stops the retransmission.
2.4 IMS session establishment phases
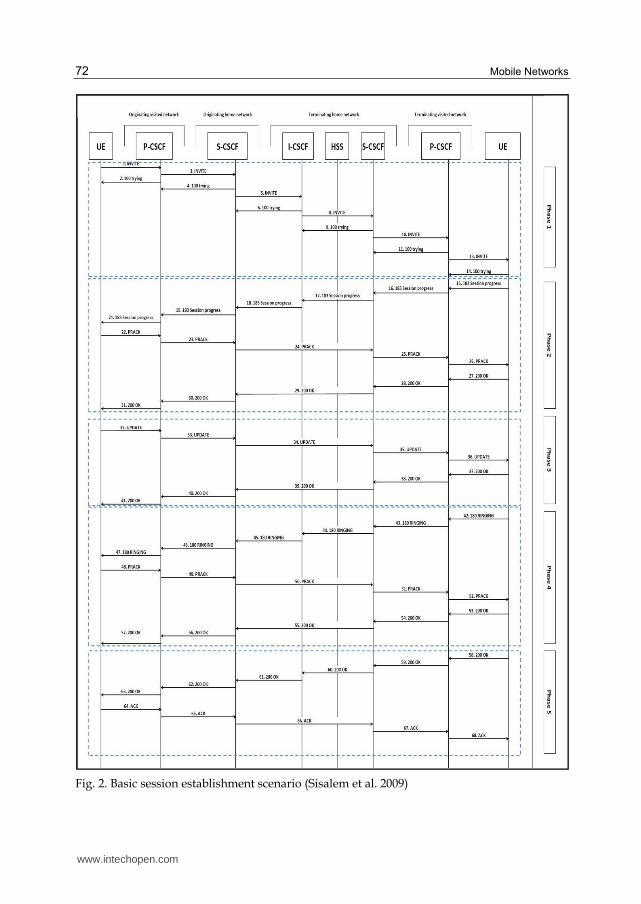
Figure 2 illustrates a basic session establishment in the IMS with the caller and callee roaming to foreign networks. The example is based on the scenario provided in (Sisalem et al. 2009) .The session establishment in IMS is triggered by the sending of an INVITE request. In general, the session establishment can be considered as consisting of five phases, namely:
Phase 1: Initiation (INVITE / 100 Trying): This phase is initiated with the sending of an INVITE request and is terminated when the client receives a provisional or final response. (INVITE-retransmission mode).
Phase 2: Negotiation (Session Progress 183 / PRACK / 200 OK) : In this phase the caller and callee negotiate the audio and video codes to be used as well as the QoS criteria. The 183 provisional responses is sent reliably. Session Progress 183 (INVITE-retransmission mode) , PRACK and 200 OK (Non-INVITE-retransmission mode)
Phase 3: Confirmation (UPDATE / 200 OK): In this phase the caller and callee complete the code and QoS negotiations. UPDATE and 200 OK (Non-INVITE-retransmission mode)
Phase 4: Ringing: (Ringing 180 / PRACK / 200 OK): In this phase the callee informs the caller that the user is being alerted about the call. Ringing 180 (INVITE-retransmission mode) , PRACK and 200 OK (Non-INVITE-retransmission mode)
Phase 5: Final Response (200 OK / ACK): In this phase the callee informs the caller that the call was accepted. 200 OK / ACK (Non-INVITE-retransmission mode)
2.5 Modeling IMS session establishment
In this section we will provide a theoretical model for SIP retransmission techniques in lossy network, bandwidth calculation for IMS session set up and estimation of IMS session set up delay. Figure.2. shows that the calls traverse five SIP proxies. Each link of the depicted network has a loss rate of (l) and has a propagation delay of (D) seconds.
www.intechopen.com
Mobile Networks 72
Fig. 2. Basic session establishment scenario (Sisalem et al. 2009)
www.intechopen.com
Design and Analysis of IP-Multimedia Subsystem (IMS) 73
2.5.1 Modeling the retransmission of the INVITE request
For the case of INVITE requests, the exponential retransmission behavior is used up to a timer called TimerB. That is a request is retransmitted at time points T1, 3T1, 7T1, 15T1 and up to TimerB. This can be represented as a series in the form of:
岫に怠 − な岻Tな, 岫に態 − な岻Tな, 岫に戴 − な岻Tな…… . 岫に択套 − な岻Tな (1)
With 岫に択套 − な岻Tな = TimerB . Thereby the maximum number of retransmitted INVITE requests (N辿) is
N辿 = 尾log態岫TimerBTな + な岻琵 (2)
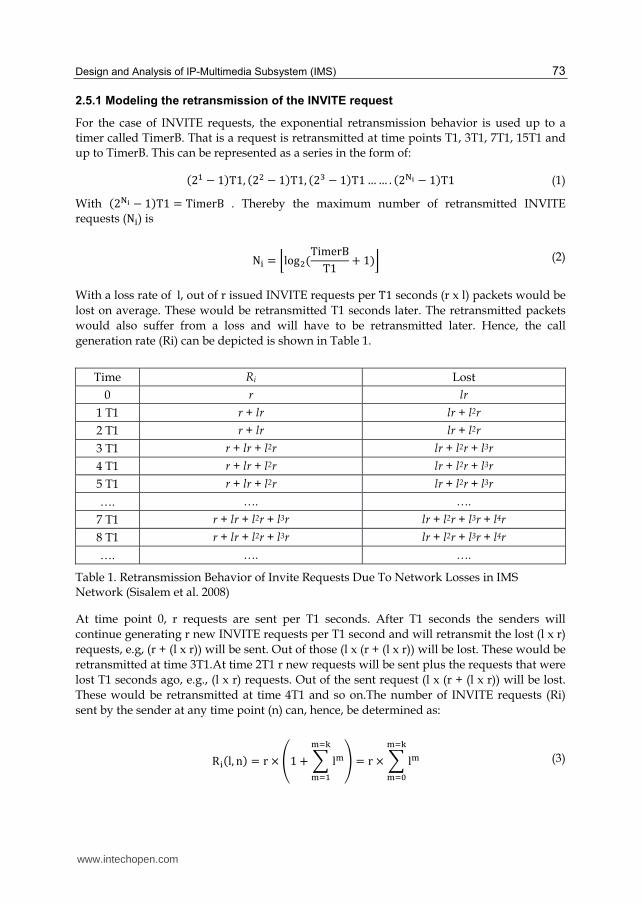
With a loss rate of l, out of r issued INVITE requests per Tな seconds (r x l) packets would be
lost on average. These would be retransmitted T1 seconds later. The retransmitted packets
would also suffer from a loss and will have to be retransmitted later. Hence, the call
generation rate (Ri) can be depicted is shown in Table 1.
Time Ri Lost
0 r lr
1 T1 r + lr lr + l2r
2 T1 r + lr lr + l2r
3 T1 r + lr + l2r lr + l2r + l3r
4 T1 r + lr + l2r lr + l2r + l3r
5 T1 r + lr + l2r lr + l2r + l3r
…. …. ….
7 T1 r + lr + l2r + l3r lr + l2r + l3r + l4r
8 T1 r + lr + l2r + l3r lr + l2r + l3r + l4r
…. …. ….
Table 1. Retransmission Behavior of Invite Requests Due To Network Losses in IMS Network (Sisalem et al. 2008)
At time point 0, r requests are sent per T1 seconds. After T1 seconds the senders will
continue generating r new INVITE requests per T1 second and will retransmit the lost (l x r)
requests, e.g, (r + (l x r)) will be sent. Out of those (l x (r + (l x r)) will be lost. These would be
retransmitted at time 3T1.At time 2T1 r new requests will be sent plus the requests that were
lost T1 seconds ago, e.g., (l x r) requests. Out of the sent request (l x (r + (l x r)) will be lost.
These would be retransmitted at time 4T1 and so on.The number of INVITE requests (Ri)
sent by the sender at any time point (n) can, hence, be determined as:
R辿岫l, n岻 = r × 嵜な + 布 l鱈鱈退谷鱈退怠 崟 = r × 布 l鱈鱈退谷
鱈退待 (3)
www.intechopen.com
Mobile Networks 74
with (k = 局log態岫n + な岻曲). n can be maximally (鐸辿鱈奪嘆台怠鐸怠 ).
At this stage the number of new losses, e.g. losses of newly generated requests, would become equal to the number of retransmissions that will be terminated as the maximum number of attempts was already tried. Hence, at this stage the system reaches a steady state.
2.5.2 Losses during INVITE phase
As already described, an INVITE is sent reliably on a hop-by-hop basis. Hence if the INVITE sent by the Caller UE or the 100 response sent by the first proxy in originating visited network (P-CSCF) request were lost then the Caller UE would retransmit the INVITE. The same applies between the each two proxies and between the last proxy in terminating home network (P-CSCF) and the Callee UE. Hence, we can consider the six hops as independent from each other. For each hop a request is considered to be successfully sent if the request and its response arrive at their destinations successfully. Thereby, one needs to consider the losses in both directions, e.g., an end-to-end loss (l) of
l奪 = な − 岫な − l岻態 (4)
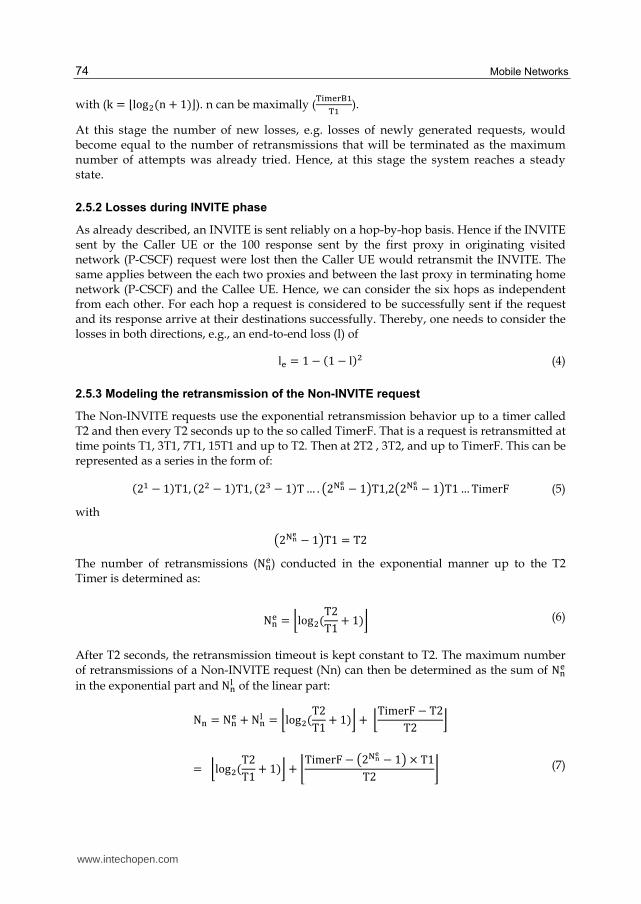
2.5.3 Modeling the retransmission of the Non-INVITE request
The Non-INVITE requests use the exponential retransmission behavior up to a timer called T2 and then every T2 seconds up to the so called TimerF. That is a request is retransmitted at time points T1, 3T1, 7T1, 15T1 and up to T2. Then at 2T2 , 3T2, and up to TimerF. This can be represented as a series in the form of:
岫に怠 − な岻Tな, 岫に態 − な岻Tな, 岫に戴 − な岻T… . 盤に択投刀 − な匪Tな,に盤に択投刀 − な匪Tな…TimerF (5)
with 盤に択投刀 − な匪Tな = Tに
The number of retransmissions (N樽奪) conducted in the exponential manner up to the T2 Timer is determined as:
N樽奪 = 尾log態岫TにTな + な岻琵 (6)
After T2 seconds, the retransmission timeout is kept constant to T2. The maximum number of retransmissions of a Non-INVITE request (Nn) can then be determined as the sum of N樽奪
in the exponential part and N樽狸 of the linear part:
N樽 = N樽奪 + N樽狸 = 尾log態岫TにTな + な岻琵 +尾TimerF − TにTに 琵 = 尾log態岫TにTな + な岻琵 + 嶂TimerF − 盤に択投刀 − な匪 × TなTに 嶢 (7)
www.intechopen.com
Design and Analysis of IP-Multimedia Subsystem (IMS) 75
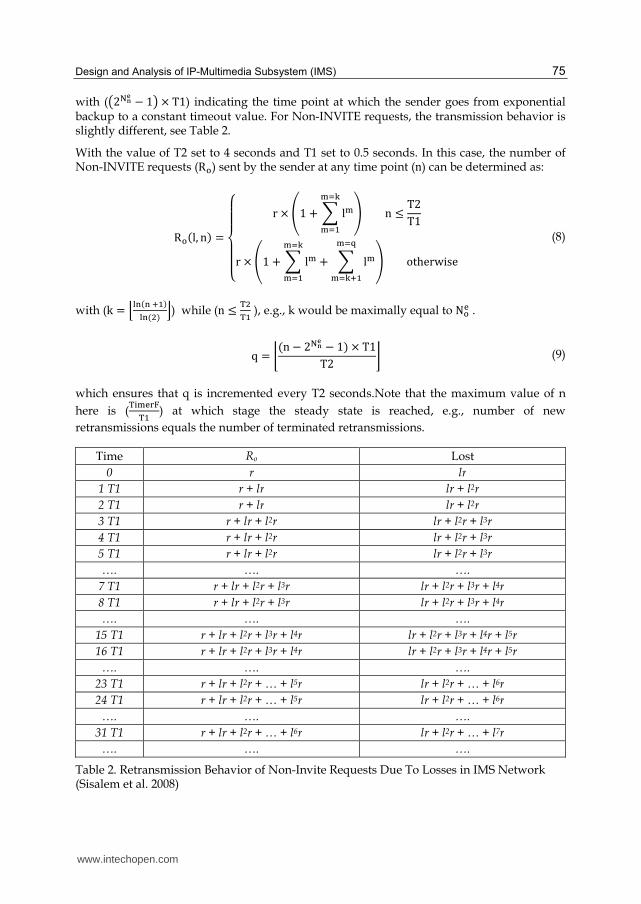
with (盤に択投刀 − な匪 × Tな) indicating the time point at which the sender goes from exponential backup to a constant timeout value. For Non-INVITE requests, the transmission behavior is slightly different, see Table 2.
With the value of T2 set to 4 seconds and T1 set to 0.5 seconds. In this case, the number of Non-INVITE requests (R誰) sent by the sender at any time point (n) can be determined as:
R誰岫l, n岻 =菌衿衿芹衿衿緊 r × 嵜な + 布 l鱈鱈退谷
鱈退怠 崟 n ≤ TにTなr × 嵜な + 布 l鱈鱈退谷
鱈退怠 + 布 l鱈鱈退単鱈退谷袋怠 崟 otherwise (8)
with (k = 崘狸樽岫樽袋怠岻狸樽岫態岻 嵌) while (n ≤ 鐸態鐸怠 ), e.g., k would be maximally equal to N誰奪 .
q = 嶂岫n − に択投刀 − な岻 × TなTに 嶢 (9)
which ensures that q is incremented every T2 seconds.Note that the maximum value of n
here is (鐸辿鱈奪嘆題鐸怠 ) at which stage the steady state is reached, e.g., number of new
retransmissions equals the number of terminated retransmissions.
Time Ro Lost
0 r lr
1 T1 r + lr lr + l2r
2 T1 r + lr lr + l2r
3 T1 r + lr + l2r lr + l2r + l3r
4 T1 r + lr + l2r lr + l2r + l3r
5 T1 r + lr + l2r lr + l2r + l3r
…. …. ….
7 T1 r + lr + l2r + l3r lr + l2r + l3r + l4r
8 T1 r + lr + l2r + l3r lr + l2r + l3r + l4r
…. …. ….
15 T1 r + lr + l2r + l3r + l4r lr + l2r + l3r + l4r + l5r
16 T1 r + lr + l2r + l3r + l4r lr + l2r + l3r + l4r + l5r
…. …. ….
23 T1 r + lr + l2r + … + l5r lr + l2r + … + l6r
24 T1 r + lr + l2r + … + l5r lr + l2r + … + l6r
…. …. ….
31 T1 r + lr + l2r + … + l6r lr + l2r + … + l7r
…. …. ….
Table 2. Retransmission Behavior of Non-Invite Requests Due To Losses in IMS Network (Sisalem et al. 2008)
www.intechopen.com
Mobile Networks 76
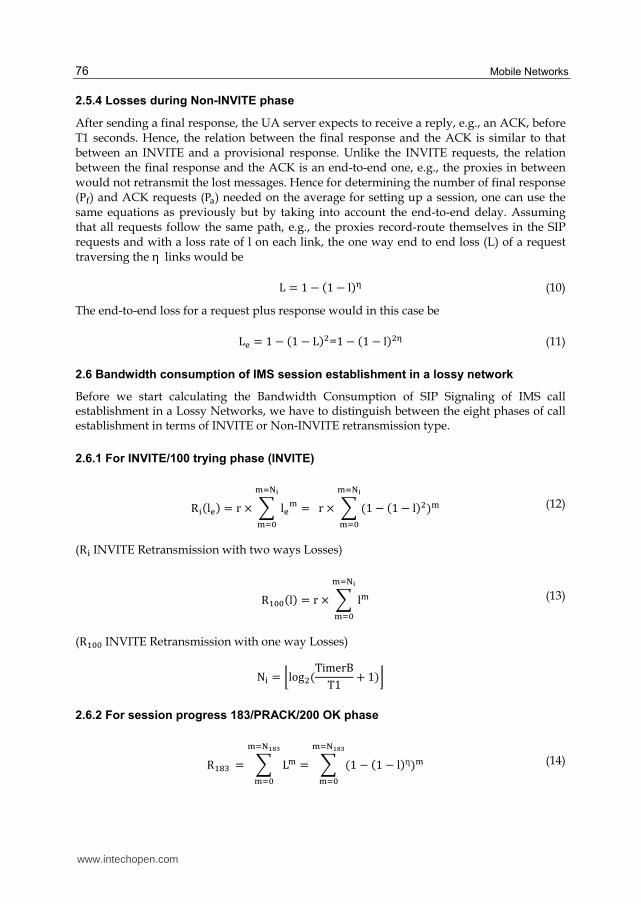
2.5.4 Losses during Non-INVITE phase
After sending a final response, the UA server expects to receive a reply, e.g., an ACK, before T1 seconds. Hence, the relation between the final response and the ACK is similar to that between an INVITE and a provisional response. Unlike the INVITE requests, the relation between the final response and the ACK is an end-to-end one, e.g., the proxies in between would not retransmit the lost messages. Hence for determining the number of final response (P脱) and ACK requests (P叩) needed on the average for setting up a session, one can use the same equations as previously but by taking into account the end-to-end delay. Assuming that all requests follow the same path, e.g., the proxies record-route themselves in the SIP requests and with a loss rate of l on each link, the one way end to end loss (L) of a request traversing the η links would be
L = な − 岫な − l岻遅 (10)
The end-to-end loss for a request plus response would in this case be
L奪 = な − 岫な − L岻態=な − 岫な − l岻態遅 (11)
2.6 Bandwidth consumption of IMS session establishment in a lossy network
Before we start calculating the Bandwidth Consumption of SIP Signaling of IMS call establishment in a Lossy Networks, we have to distinguish between the eight phases of call establishment in terms of INVITE or Non-INVITE retransmission type.
2.6.1 For INVITE/100 trying phase (INVITE)
R辿岫l奪岻 = r × 布 l奪鱈鱈退択套鱈退待 = r × 布 岫な − 岫な − l岻態岻鱈鱈退択套
鱈退待 (12)
(R辿INVITE Retransmission with two ways Losses)
R怠待待岫l岻 = r × 布 l鱈鱈退択套鱈退待 (13)
(R怠待待INVITE Retransmission with one way Losses)
N辿 = 尾log態岫TimerBTな + な岻琵 2.6.2 For session progress 183/PRACK/200 OK phase
R怠腿戴 = 布 L鱈鱈退択迭添典鱈退待 = 布 岫な − 岫な − l岻η岻鱈鱈退択迭添典
鱈退待 (14)
www.intechopen.com

Design and Analysis of IP-Multimedia Subsystem (IMS) 77
(R怠腿戴INVITE Retransmission with one way End to End Losses)
N怠腿戴 = 尾log態岫T怠腿戴+ T沢琢代大啄Tな + な岻琵 (15)
T怠腿戴 = Tな × 岫に択套 − な岻 (16)
N辿 = 尾log態岫TimerBTな + な岻琵 (17)
T沢琢代大啄 = Tな × 盤に択搭刀 − な匪 +Max 岫ど, Tに × N樽狸 岻 (18) T沢琢代大啄 = Tに + 岫TimerF − Tに岻 = Tに + はねTな − 8Tな = Tに + のはTな = はねTな
N樽 = N樽奪 + N樽狸 = 尾log態岫TにTな + な岻琵 + 尾TimerF − TにTに 琵 (19)
R沢琢代大啄 = 布 L奪鱈鱈退択投鱈退待 = 布 岫な − 岫な − l岻態η岻鱈鱈退択投
鱈退待 (20)
(R沢琢代大啄Non-INVITE Retransmission with two ways End to End Losses)
R態待待 = 布 L鱈鱈退択投鱈退待 = 布 岫な − 岫な − l岻η岻鱈鱈退択投
鱈退待 (21)
(R態待待Non-INVITE Retransmission with one way End to End Losses)
N樽 = N樽奪 + N樽狸 = 尾log態岫TにTな + な岻琵 + 尾TimerF − TにTに 琵 (22)
L = な − 岫な − l岻遅 (23)
L奪 = な − 岫な − L岻態= な − 岫な − l岻態遅 (24)
2.6.3 For UPDATE/200 OK phase
R濁沢第代鐸醍 = 布 L奪鱈鱈退択搭鱈退待 = 布 岫な − 岫な − l岻態η岻鱈鱈退択搭
鱈退待 (25)
(R濁沢第代鐸醍Non-INVITE Retransmission with two ways End to End Losses)
www.intechopen.com
Mobile Networks 78
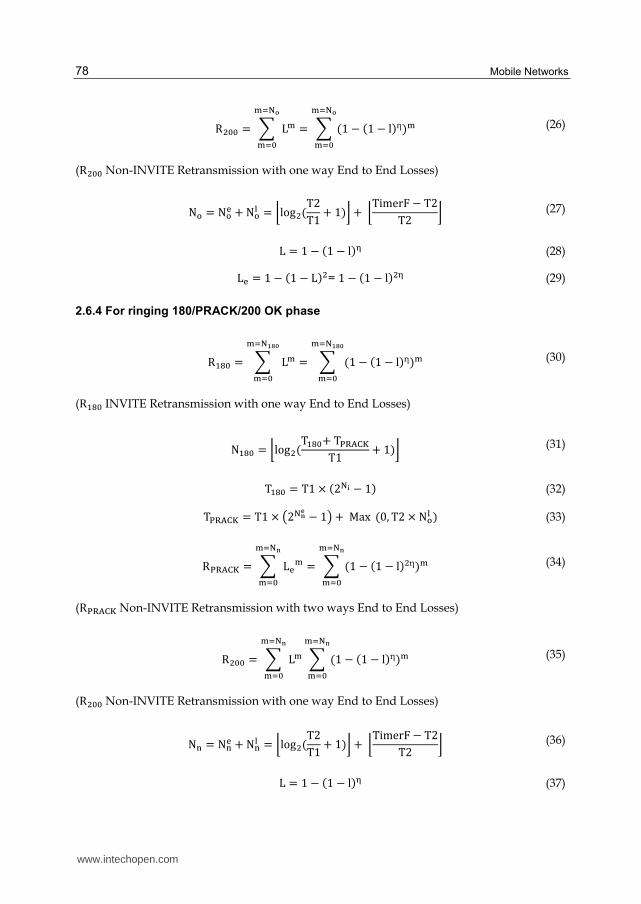
R態待待 = 布 L鱈鱈退択搭鱈退待 = 布 岫な − 岫な − l岻η岻鱈鱈退択搭
鱈退待 (26)
(R態待待Non-INVITE Retransmission with one way End to End Losses)
N誰 = N誰奪 + N誰狸 = 尾log態岫TにTな + な岻琵 + 尾TimerF − TにTに 琵 (27)
L = な − 岫な − l岻遅 (28)
L奪 = な − 岫な − L岻態= な − 岫な − l岻態遅 (29)
2.6.4 For ringing 180/PRACK/200 OK phase
R怠腿待 = 布 L鱈鱈退択迭添轍鱈退待 = 布 岫な − 岫な − l岻η岻鱈鱈退択迭添轍
鱈退待 (30)
(R怠腿待INVITE Retransmission with one way End to End Losses)
N怠腿待 = 尾log態岫T怠腿待+ T沢琢代大啄Tな + な岻琵 (31)
T怠腿待 = Tな × 岫に択套 − な岻 (32)
T沢琢代大啄 = Tな × 盤に択投刀 − な匪 +Max 岫ど, Tに × N誰狸 岻 (33)
R沢琢代大啄 = 布 L奪鱈鱈退択投鱈退待 = 布 岫な − 岫な − l岻態η岻鱈鱈退択投
鱈退待 (34)
(R沢琢代大啄Non-INVITE Retransmission with two ways End to End Losses)
R態待待 = 布 L鱈鱈退択投鱈退待 布 岫な − 岫な − l岻η岻鱈鱈退択投
鱈退待 (35)
(R態待待Non-INVITE Retransmission with one way End to End Losses)
N樽 = N樽奪 + N樽狸 = 尾log態岫TにTな + な岻琵 + 尾TimerF − TにTに 琵 (36)
L = な − 岫な − l岻遅 (37)
www.intechopen.com
Design and Analysis of IP-Multimedia Subsystem (IMS) 79
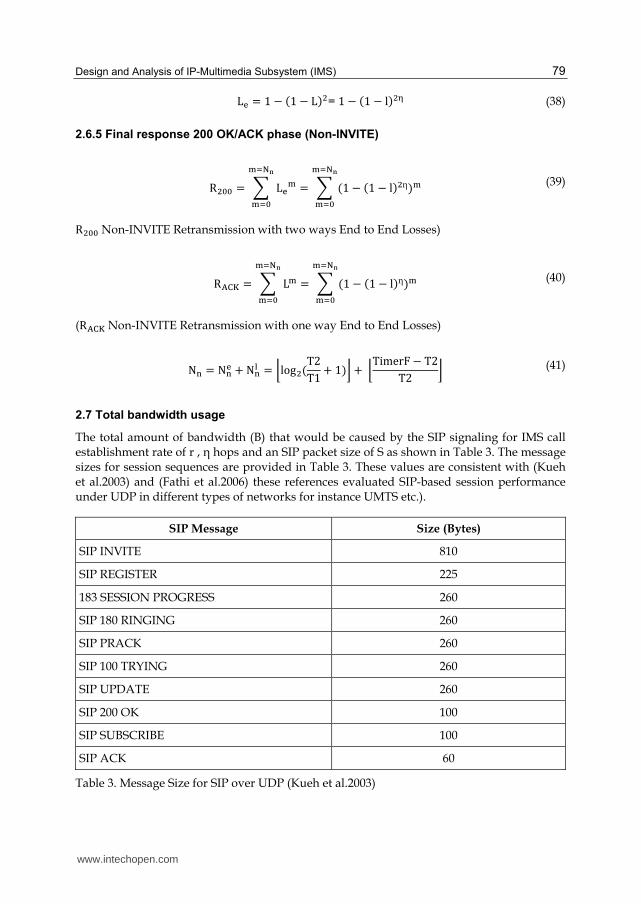
L奪 = な − 岫な − L岻態= な − 岫な − l岻態遅 (38)
2.6.5 Final response 200 OK/ACK phase (Non-INVITE)
R態待待 = 布 L奪鱈鱈退択投鱈退待 = 布 岫な − 岫な − l岻態η岻鱈鱈退択投
鱈退待 (39)
R態待待Non-INVITE Retransmission with two ways End to End Losses)
R代大啄 = 布 L鱈鱈退択投鱈退待 = 布 岫な − 岫な − l岻η岻鱈鱈退択投
鱈退待 (40)
(R代大啄Non-INVITE Retransmission with one way End to End Losses)
N樽 = N樽奪 + N樽狸 = 尾log態岫TにTな + な岻琵 + 尾TimerF − TにTに 琵 (41)
2.7 Total bandwidth usage
The total amount of bandwidth (B) that would be caused by the SIP signaling for IMS call establishment rate of r , η hops and an SIP packet size of S as shown in Table 3. The message sizes for session sequences are provided in Table 3. These values are consistent with (Kueh et al.2003) and (Fathi et al.2006) these references evaluated SIP-based session performance under UDP in different types of networks for instance UMTS etc.).
SIP Message Size (Bytes)
SIP INVITE 810
SIP REGISTER 225
183 SESSION PROGRESS 260
SIP 180 RINGING 260
SIP PRACK 260
SIP 100 TRYING 260
SIP UPDATE 260
SIP 200 OK 100
SIP SUBSCRIBE 100
SIP ACK 60
Table 3. Message Size for SIP over UDP (Kueh et al.2003)
www.intechopen.com
Mobile Networks 80
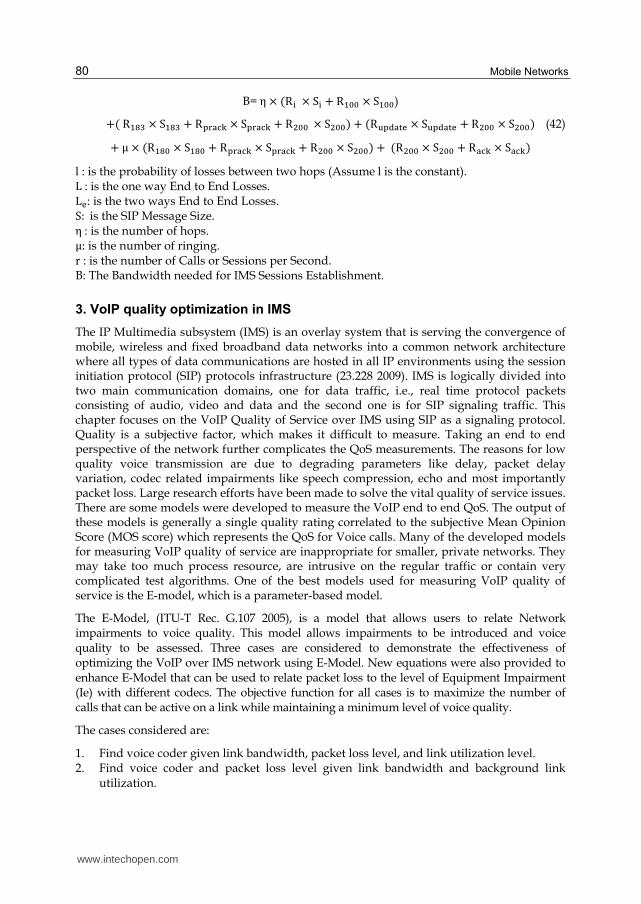
B=η × 岫R辿 × S辿 + R怠待待 × S怠待待)
+岫R怠腿戴 × S怠腿戴 + R丹嘆叩達谷 × S丹嘆叩達谷 + R態待待 × S態待待岻 + 岫R探丹辰叩担奪 × S探丹辰叩担奪 + R態待待 × S態待待岻 (42) +μ × 岫R怠腿待 × S怠腿待 + R丹嘆叩達谷 × S丹嘆叩達谷 + R態待待 × S態待待岻 +岫R態待待 × S態待待 + R叩達谷 × S叩達谷岻 l : is the probability of losses between two hops (Assume l is the constant). L: is the one way End to End Losses. L奪: is the two ways End to End Losses. S:is the SIP Message Size. η: is the number of hops. μ: is the number of ringing. r : is the number of Calls or Sessions per Second. B: The Bandwidth needed for IMS Sessions Establishment.
3. VoIP quality optimization in IMS
The IP Multimedia subsystem (IMS) is an overlay system that is serving the convergence of mobile, wireless and fixed broadband data networks into a common network architecture where all types of data communications are hosted in all IP environments using the session initiation protocol (SIP) protocols infrastructure (23.228 2009). IMS is logically divided into two main communication domains, one for data traffic, i.e., real time protocol packets consisting of audio, video and data and the second one is for SIP signaling traffic. This chapter focuses on the VoIP Quality of Service over IMS using SIP as a signaling protocol. Quality is a subjective factor, which makes it difficult to measure. Taking an end to end perspective of the network further complicates the QoS measurements. The reasons for low quality voice transmission are due to degrading parameters like delay, packet delay variation, codec related impairments like speech compression, echo and most importantly packet loss. Large research efforts have been made to solve the vital quality of service issues. There are some models were developed to measure the VoIP end to end QoS. The output of these models is generally a single quality rating correlated to the subjective Mean Opinion Score (MOS score) which represents the QoS for Voice calls. Many of the developed models for measuring VoIP quality of service are inappropriate for smaller, private networks. They may take too much process resource, are intrusive on the regular traffic or contain very complicated test algorithms. One of the best models used for measuring VoIP quality of service is the E-model, which is a parameter-based model.
The E-Model, (ITU-T Rec. G.107 2005), is a model that allows users to relate Network impairments to voice quality. This model allows impairments to be introduced and voice quality to be assessed. Three cases are considered to demonstrate the effectiveness of optimizing the VoIP over IMS network using E-Model. New equations were also provided to enhance E-Model that can be used to relate packet loss to the level of Equipment Impairment (Ie) with different codecs. The objective function for all cases is to maximize the number of calls that can be active on a link while maintaining a minimum level of voice quality.
The cases considered are:
1. Find voice coder given link bandwidth, packet loss level, and link utilization level. 2. Find voice coder and packet loss level given link bandwidth and background link
utilization.
www.intechopen.com
Design and Analysis of IP-Multimedia Subsystem (IMS) 81
3. Find voice coder and background link utilization level given link bandwidth and packet loss level
OPNET and MATLAB are the optimization tools that are used in this chapter.
3.1 Assumptions for E-Model
The E-Model, (ITU-T Rec. G.107 2005) is extremely complex with 18 inputs that feed interrelated components. These components feed each other and recombine to form an output (R). The recommendation (ITU-T Rec. G.108 1999) gives a thorough description on how to carry out an E-model QoS calculation within VoIP networks.
Due to the complexity of the E-Model, the approach used here is to try to identify which E-Model parameters are fixed and which parameters are not. In the context of this research the only parameters of the E-Model that are not fixed are:
T and Ta – Delay variables
Ie – Equipment Impairment Factor
Id – Delay Impairment Factor
Where (T) is the mean one way delay of the echo path, (Ta) is the absolute delay in echo free conditions. In addition, parameters that affect delay Id and Ie are introduced:
PL - Packet Loss %
ρ- Link Utilization
Coder Type
Next, the relationship between these parameters is identified. Since, we are making the
assumption that the echo cancellers on the end are very good, we can say that T = Ta and Ie
is directly related to a particular coding scheme and the packet loss ratio.
According to the above assumption, R-Factor equation can be reduced to the following expression (ITU-T Rec. G.107 2005):
R = 93.2 – Id (Ta) – Ie (codec, packet loss) (43)
3.1.1 Calculation of the delay impairment Id
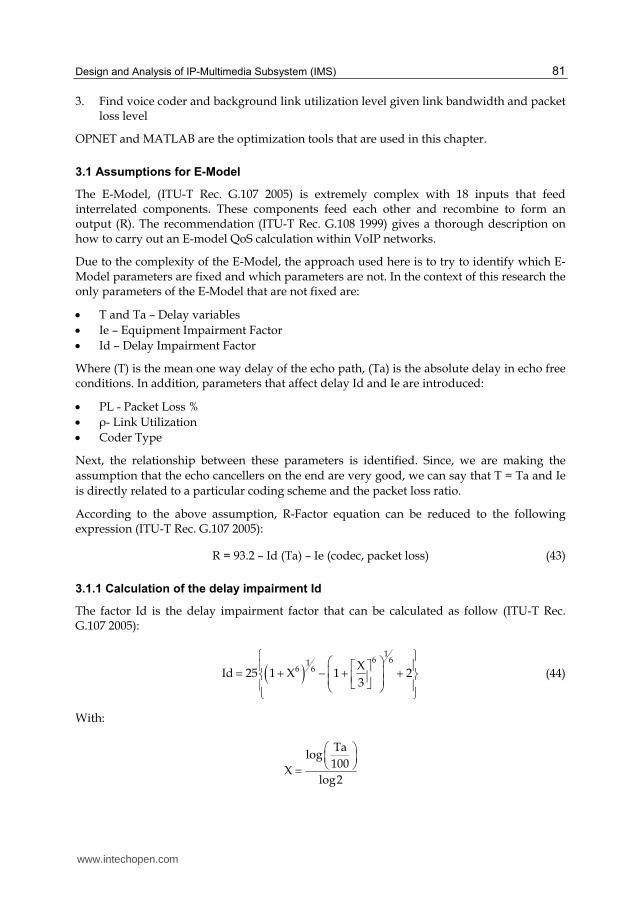
The factor Id is the delay impairment factor that can be calculated as follow (ITU-T Rec. G.107 2005):
16 61
6 6 XId 25 1 X 1 2
3
(44)
With:
Talog
100X
log2
www.intechopen.com
Mobile Networks 82
3.1.2 Calculation of the equipment impairment Ie
The loss impairment Ie captures the distortion of the original voice signal due to low-rate codec, and packet losses in both the network and the play out buffer. Currently, the E-Model (ITU-T Rec. G.107 2005) can only cope with speech distortion introduced by several codecs i.e. G.729 (ITU-T Rec. G.729 2007) or G.723 (ITU-T Rec. G.723 2006). Specific impairment factor values for codec operation under random packet-loss have formerly been treated using tabulated, packet-loss dependent Ie values. Now, the Packet-loss Robustness Factor Bpl is defined as codec specific value. The packet-loss dependent Effective Equipment Impairment Factor Ie-eff is derived using the codec specific value for the Equipment Impairment Factor at zero packet-loss. Ie and the Packet-loss Robustness Factor Bpl are listed in Table I for several codecs. With the Packet-loss Probability Ppl, (ITU-T Rec. G.113 2007).Ie-eff is calculated using formula (44)
PplIe eff Ie 95 Ie
Ppl Bpl (45)
Ie is the equipment impairment factor.
Bpl is called the packet-loss robustness factor, which depends on the used codec.
Ie,eff represents the packet loss dependent effective equipment Impairment factor, derived from the value of Ie depending on codec and at zero packet loss.
Ppl is the packet loss probability
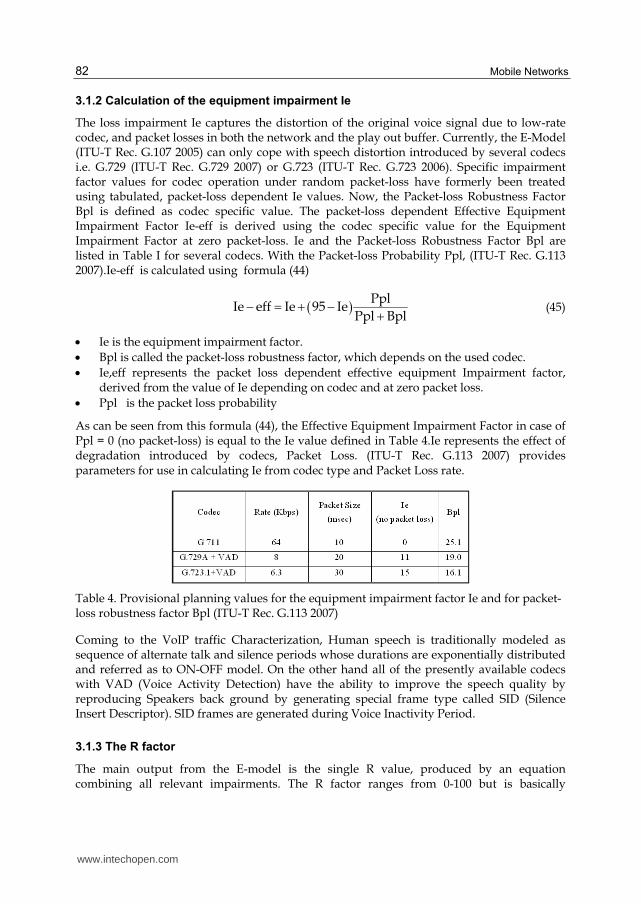
As can be seen from this formula (44), the Effective Equipment Impairment Factor in case of Ppl = 0 (no packet-loss) is equal to the Ie value defined in Table 4.Ie represents the effect of degradation introduced by codecs, Packet Loss. (ITU-T Rec. G.113 2007) provides parameters for use in calculating Ie from codec type and Packet Loss rate.
Table 4. Provisional planning values for the equipment impairment factor Ie and for packet-loss robustness factor Bpl (ITU-T Rec. G.113 2007)
Coming to the VoIP traffic Characterization, Human speech is traditionally modeled as sequence of alternate talk and silence periods whose durations are exponentially distributed and referred as to ON-OFF model. On the other hand all of the presently available codecs with VAD (Voice Activity Detection) have the ability to improve the speech quality by reproducing Speakers back ground by generating special frame type called SID (Silence Insert Descriptor). SID frames are generated during Voice Inactivity Period.
3.1.3 The R factor
The main output from the E-model is the single R value, produced by an equation combining all relevant impairments. The R factor ranges from 0-100 but is basically
www.intechopen.com

Design and Analysis of IP-Multimedia Subsystem (IMS) 83
unacceptable below 50. It is recommended for most networks to arrive at a score above 70 when measuring. A user should therefore always reach for an R value as high as possible for all possible connections. Table 5 describes the various quality and satisfaction categories related to the E-model factor R (ITU-T Rec. G.107 2005).
Range of E-Model Rating R Speech Transmission
Quality Category User Satisfaction
90 < R < 100 Best Very Satisfied
80 < R < 90 High Satisfied
70 < R < 80 Medium Some Users Dissatisfied
60 < R < 70 Low Many Users Dissatisfied
50 < R < 60 Poor Nearly All Users Dissatisfied
NOTE - Connection with E-Model Rating R Below 50 are not Recommended
Table 5. E-model related quality and satisfaction categories (ITU-T Rec. G.107 2005).
3.2 Project setup
The simulation is done using OPNET simulation tool IT Guru Academic Edition 9.1 for VoIP in IMS network using SIP Protocol. The network consists of IP-Telephones (VoIP or IMS Clients) connected to the Internet by routers which act as IP gateway, the network is managed by the SIP proxy server (act as P-CSCF) which uses the SIP protocol to establish the voice calls (VoIP) on the IMS network as shown in figure 3. The links between the routers and the Internet are T1 with link speed 1.544 Mbps and the links between the dialer, dialed, Proxy Server and the routers are 1000 Base-x. The idea is to configure the network with a certain parameters and run the simulation then getting from the tool the result values which used in E-Model equations to measure the Quality of service Factor R. The objective function for all cases is to maximize the number of calls that can be active on a link while maintaining a minimum level of voice quality (R). The cases considered are:
1. Find the optimal voice coder given link bandwidth, packet loss level, and background link utilization level.
Fig. 3. Network Topology
www.intechopen.com
Mobile Networks 84
2. Find the optimal voice coder and the optimal packet loss level given link bandwidth and background link utilization.
3. Find the optimal voice coder and the optimal background link utilization level given link bandwidth and packet loss level.
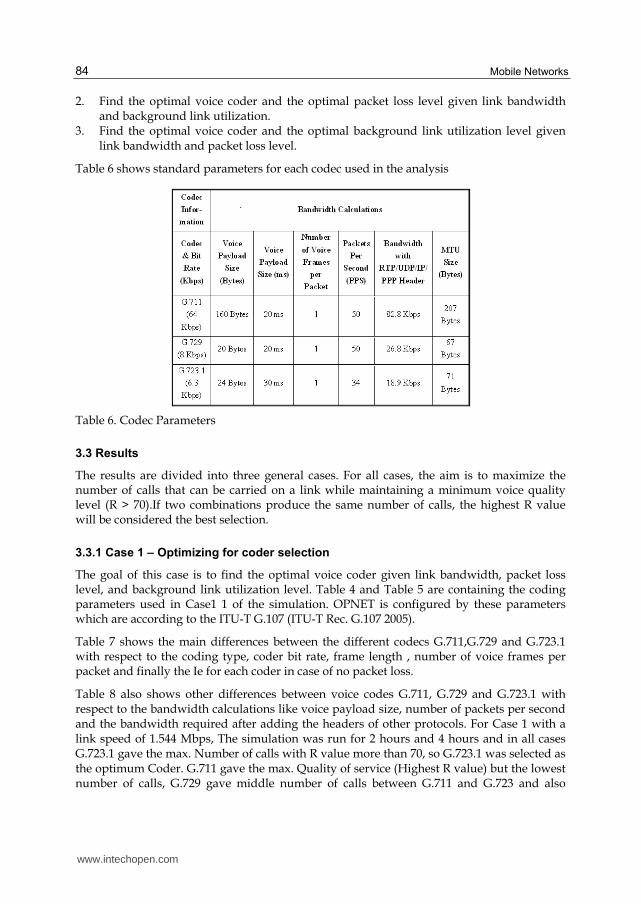
Table 6 shows standard parameters for each codec used in the analysis
Table 6. Codec Parameters
3.3 Results
The results are divided into three general cases. For all cases, the aim is to maximize the number of calls that can be carried on a link while maintaining a minimum voice quality level (R > 70).If two combinations produce the same number of calls, the highest R value will be considered the best selection.
3.3.1 Case 1 – Optimizing for coder selection
The goal of this case is to find the optimal voice coder given link bandwidth, packet loss level, and background link utilization level. Table 4 and Table 5 are containing the coding parameters used in Case1 1 of the simulation. OPNET is configured by these parameters which are according to the ITU-T G.107 (ITU-T Rec. G.107 2005).
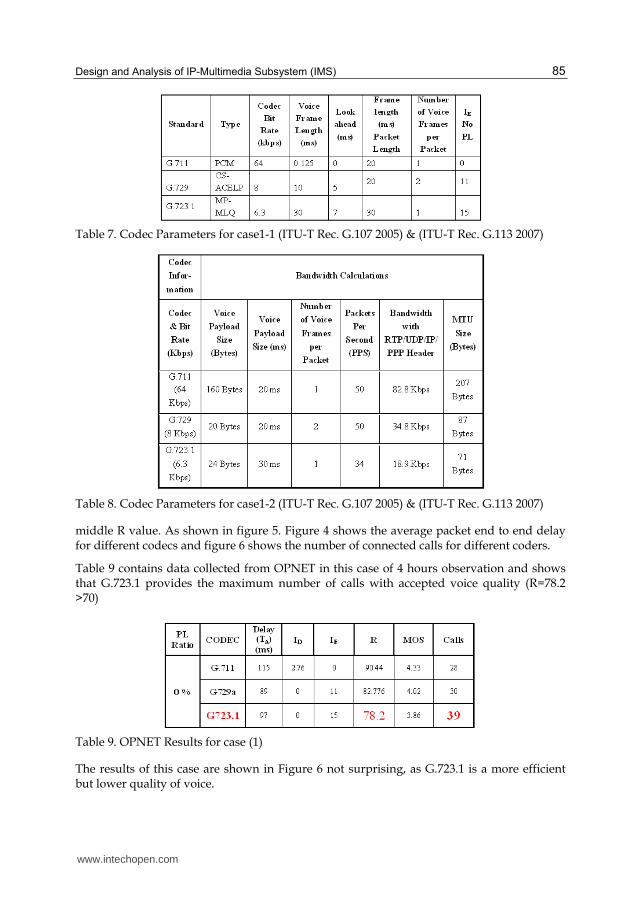
Table 7 shows the main differences between the different codecs G.711,G.729 and G.723.1 with respect to the coding type, coder bit rate, frame length , number of voice frames per packet and finally the Ie for each coder in case of no packet loss.
Table 8 also shows other differences between voice codes G.711, G.729 and G.723.1 with respect to the bandwidth calculations like voice payload size, number of packets per second and the bandwidth required after adding the headers of other protocols. For Case 1 with a link speed of 1.544 Mbps, The simulation was run for 2 hours and 4 hours and in all cases G.723.1 gave the max. Number of calls with R value more than 70, so G.723.1 was selected as the optimum Coder. G.711 gave the max. Quality of service (Highest R value) but the lowest number of calls, G.729 gave middle number of calls between G.711 and G.723 and also
www.intechopen.com
Design and Analysis of IP-Multimedia Subsystem (IMS) 85
Table 7. Codec Parameters for case1-1 (ITU-T Rec. G.107 2005) & (ITU-T Rec. G.113 2007)
Table 8. Codec Parameters for case1-2 (ITU-T Rec. G.107 2005) & (ITU-T Rec. G.113 2007)
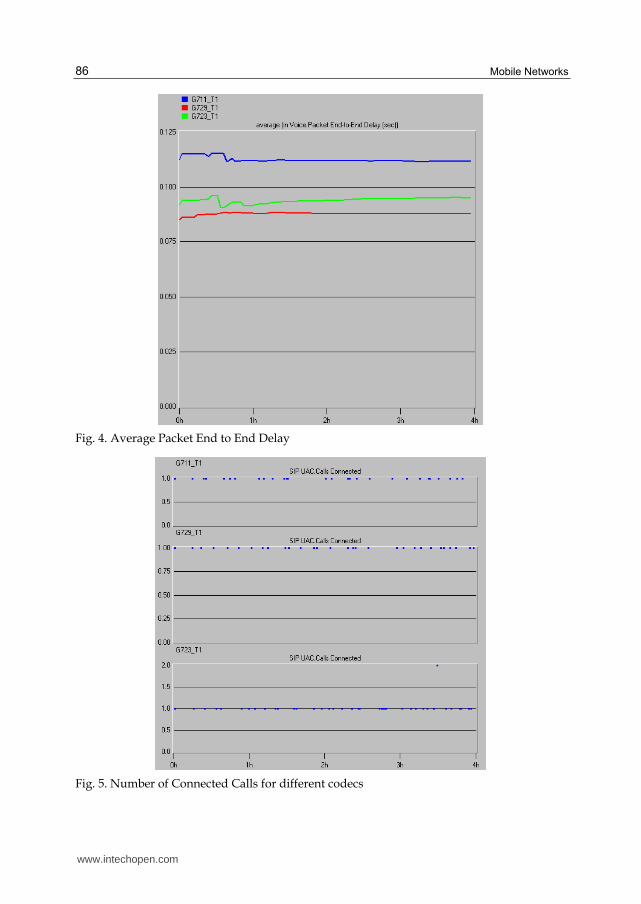
middle R value. As shown in figure 5. Figure 4 shows the average packet end to end delay for different codecs and figure 6 shows the number of connected calls for different coders.
Table 9 contains data collected from OPNET in this case of 4 hours observation and shows that G.723.1 provides the maximum number of calls with accepted voice quality (R=78.2 >70)
Table 9. OPNET Results for case (1)
The results of this case are shown in Figure 6 not surprising, as G.723.1 is a more efficient but lower quality of voice.
www.intechopen.com
Mobile Networks 86
Fig. 4. Average Packet End to End Delay
Fig. 5. Number of Connected Calls for different codecs
www.intechopen.com
Design and Analysis of IP-Multimedia Subsystem (IMS) 87
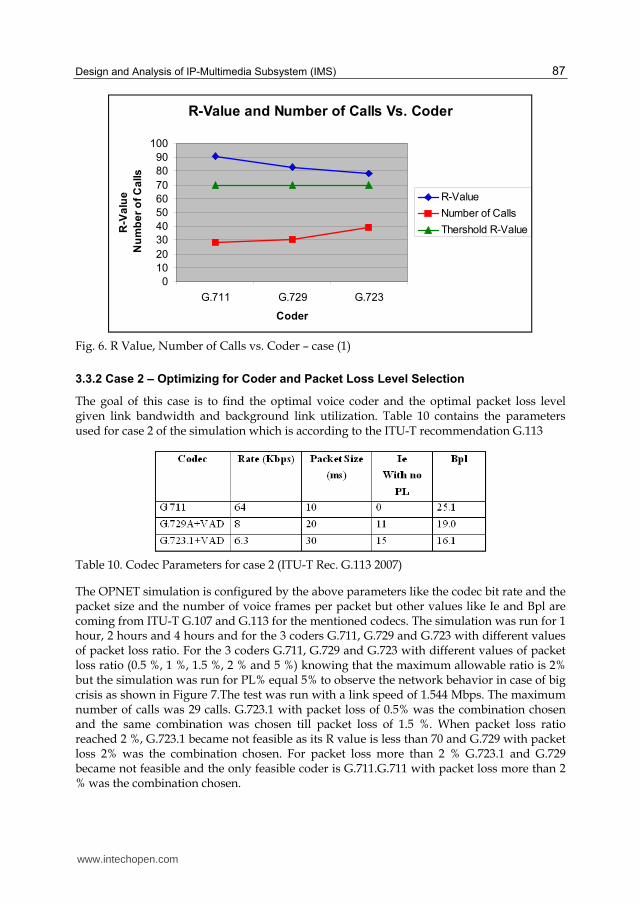
Fig. 6. R Value, Number of Calls vs. Coder – case (1)
3.3.2 Case 2 – Optimizing for Coder and Packet Loss Level Selection
The goal of this case is to find the optimal voice coder and the optimal packet loss level given link bandwidth and background link utilization. Table 10 contains the parameters used for case 2 of the simulation which is according to the ITU-T recommendation G.113
Table 10. Codec Parameters for case 2 (ITU-T Rec. G.113 2007)
The OPNET simulation is configured by the above parameters like the codec bit rate and the packet size and the number of voice frames per packet but other values like Ie and Bpl are coming from ITU-T G.107 and G.113 for the mentioned codecs. The simulation was run for 1 hour, 2 hours and 4 hours and for the 3 coders G.711, G.729 and G.723 with different values of packet loss ratio. For the 3 coders G.711, G.729 and G.723 with different values of packet loss ratio (0.5 %, 1 %, 1.5 %, 2 % and 5 %) knowing that the maximum allowable ratio is 2% but the simulation was run for PL% equal 5% to observe the network behavior in case of big crisis as shown in Figure 7.The test was run with a link speed of 1.544 Mbps. The maximum number of calls was 29 calls. G.723.1 with packet loss of 0.5% was the combination chosen and the same combination was chosen till packet loss of 1.5 %. When packet loss ratio reached 2 %, G.723.1 became not feasible as its R value is less than 70 and G.729 with packet loss 2% was the combination chosen. For packet loss more than 2 % G.723.1 and G.729 became not feasible and the only feasible coder is G.711.G.711 with packet loss more than 2 % was the combination chosen.
R-Value and Number of Calls Vs. Coder
0
10
20
30
40
50
60
70
80
90
100
G.711 G.729 G.723
Coder
R-V
alu
e
Nu
mb
er
of
Ca
lls
R-Value
Number of Calls
Thershold R-Value
www.intechopen.com
Mobile Networks 88
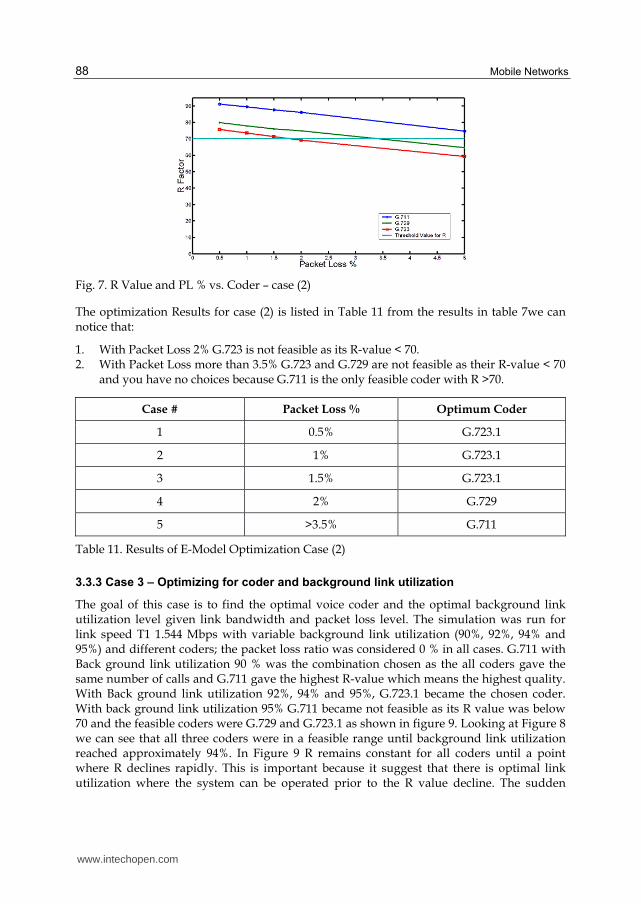
Fig. 7. R Value and PL % vs. Coder – case (2)
The optimization Results for case (2) is listed in Table 11 from the results in table 7we can notice that:
1. With Packet Loss 2% G.723 is not feasible as its R-value < 70. 2. With Packet Loss more than 3.5% G.723 and G.729 are not feasible as their R-value < 70
and you have no choices because G.711 is the only feasible coder with R >70.
Case # Packet Loss % Optimum Coder
1 0.5% G.723.1
2 1% G.723.1
3 1.5% G.723.1
4 2% G.729
5 >3.5% G.711
Table 11. Results of E-Model Optimization Case (2)
3.3.3 Case 3 – Optimizing for coder and background link utilization
The goal of this case is to find the optimal voice coder and the optimal background link utilization level given link bandwidth and packet loss level. The simulation was run for link speed T1 1.544 Mbps with variable background link utilization (90%, 92%, 94% and 95%) and different coders; the packet loss ratio was considered 0 % in all cases. G.711 with Back ground link utilization 90 % was the combination chosen as the all coders gave the same number of calls and G.711 gave the highest R-value which means the highest quality. With Back ground link utilization 92%, 94% and 95%, G.723.1 became the chosen coder. With back ground link utilization 95% G.711 became not feasible as its R value was below 70 and the feasible coders were G.729 and G.723.1 as shown in figure 9. Looking at Figure 8 we can see that all three coders were in a feasible range until background link utilization reached approximately 94%. In Figure 9 R remains constant for all coders until a point where R declines rapidly. This is important because it suggest that there is optimal link utilization where the system can be operated prior to the R value decline. The sudden
www.intechopen.com

Design and Analysis of IP-Multimedia Subsystem (IMS) 89
decrease in R is due to the fact that as utilization values approach 100%, the delay becomes unbounded, which negatively affects the R value. It is noticed that at 90% background Link utilization that all coders give the same number of calls, so the selection in this case is based on the R-Value which is the highest for G.711. It is also noticed that the most affected parameter in this case is the Id which is expected as the Background Link Utilization is affecting the Delay (Id) parameters as shown in Figure 10.The optimization Result for case (3) is listed in Table 12
Fig. 8. R Value, Background link Utilization % vs. Coder – case (3)
Fig. 9. Background Link Utilization % and Id vs. Coder – case (3)
Table 12. Results of E-Model Optimization Case (3)
www.intechopen.com

Mobile Networks 90
Table 12 shows that G.711 with Back ground link utilization 90 % was the combination
chosen as the all coders gave the same number of calls and G.711 gave the highest R-value
which means the highest quality. With Back ground link utilization 92%, 94% and 95%,
G.723.1 became the chosen coder. With back ground link utilization 95% G.711 became not
feasible as its R value was below 70 and the feasible coders were G.729 and G.723.1.
3.4 Discussion of E-Model optimization results
This chapter utilized the E-Model to assist with the selection of parameters important to
assure the QoS of VoIP in IMS Networks. These parameters include the voice coder,
allowable packet loss and the allowable background link utilization. It was based on the
concept that maximization of the link usage with respect to the number of calls which is
important to the user. It was shown that an optimization of the E-Model is possible and
useful. Table 13 reviews the total results of the optimization problem.
Table 13. The total results of the optimization problem.
All of the three cases found that G.723.1 is optimal depending on the Circumstances. G.723.1 looks more favorable due to the fact that G.723.1 uses less bandwidth per audio stream. In
case 2 , G.723.1 with 0.5%, 1% and 1.5% packet loss was optimal but with packet loss 2 % it was not feasible and G.729 was the optimum coder. In case3 , G.711 coder was selected in case of background link utilization of 90% but in all other cases till 95% G.723.1 was the
optimal coder giving the maximum number of calls with R Value more than 70%. The ability to analyze various coders, delay, packets loss and the effect of background link utilization is vital to the QoS of VoIP in IMS network. The optimization of the E-Model provides a tool that is useful for this purpose.
3.5 Proposed enhancement in E-Model
In this section we propose some new equations developed by us using MATLAB could be
added to E-Model equations to enhance E-Model performance. It is noticed that the most
affected parameter in case (2) when trying to find the best coder in different packet losses
condition is the Ie which is expected as the PL is affecting the Ie parameters as shown in
Figure10.
www.intechopen.com
Design and Analysis of IP-Multimedia Subsystem (IMS) 91
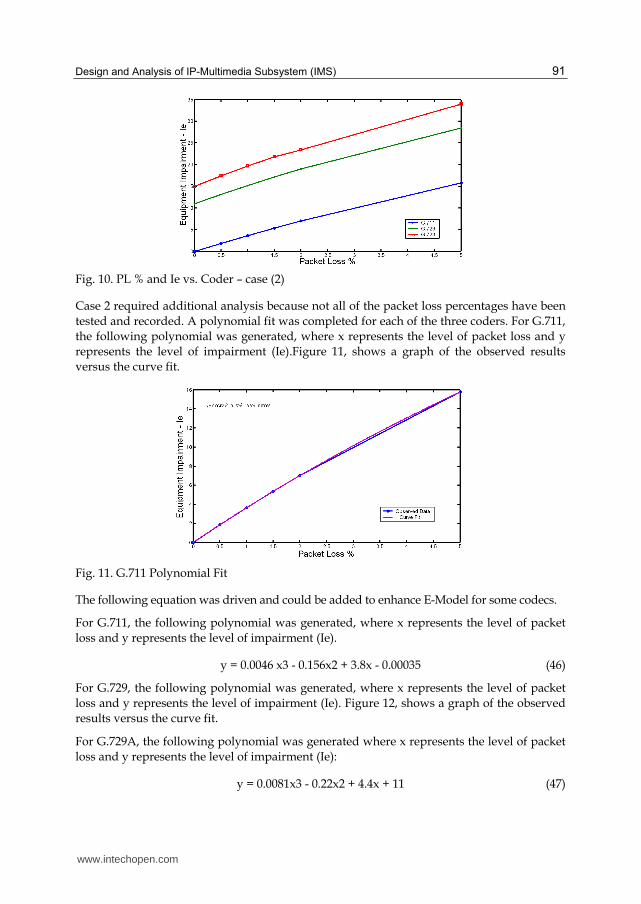
Fig. 10. PL % and Ie vs. Coder – case (2)
Case 2 required additional analysis because not all of the packet loss percentages have been
tested and recorded. A polynomial fit was completed for each of the three coders. For G.711, the following polynomial was generated, where x represents the level of packet loss and y represents the level of impairment (Ie).Figure 11, shows a graph of the observed results versus the curve fit.
Fig. 11. G.711 Polynomial Fit
The following equation was driven and could be added to enhance E-Model for some codecs.
For G.711, the following polynomial was generated, where x represents the level of packet
loss and y represents the level of impairment (Ie).
y = 0.0046 x3 - 0.156x2 + 3.8x - 0.00035 (46)
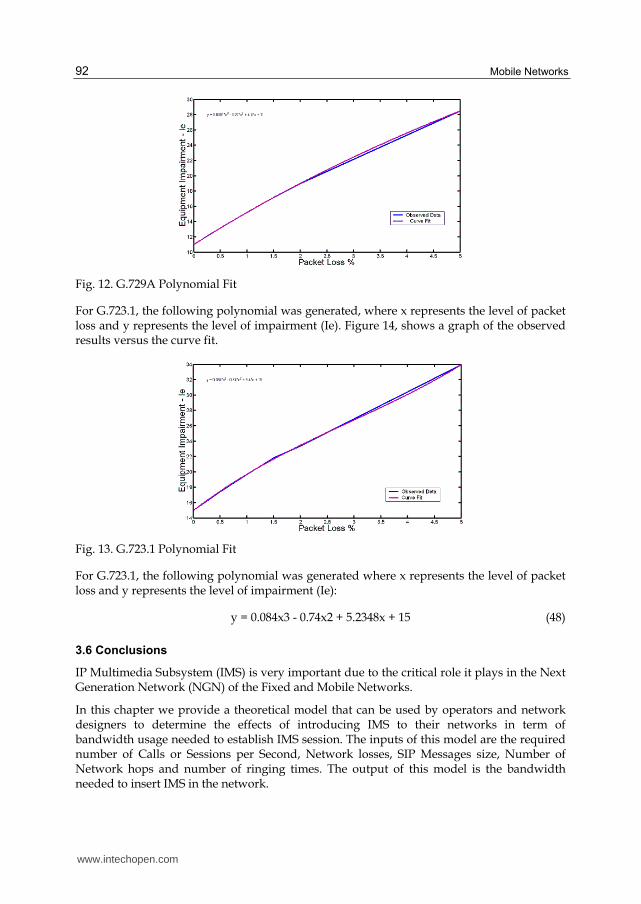
For G.729, the following polynomial was generated, where x represents the level of packet
loss and y represents the level of impairment (Ie). Figure 12, shows a graph of the observed results versus the curve fit.
For G.729A, the following polynomial was generated where x represents the level of packet loss and y represents the level of impairment (Ie):
y = 0.0081x3 - 0.22x2 + 4.4x + 11 (47)
www.intechopen.com
Mobile Networks 92
Fig. 12. G.729A Polynomial Fit
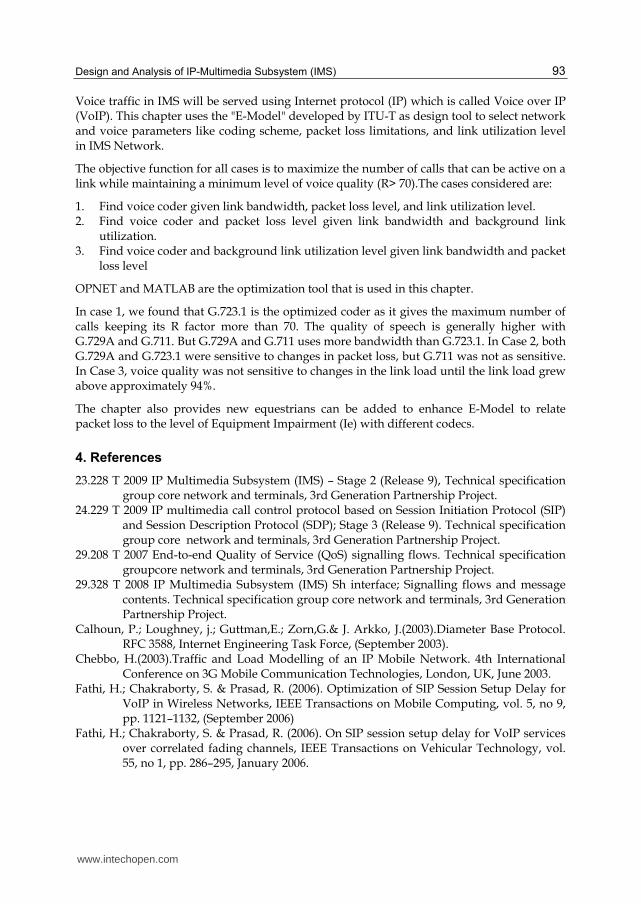
For G.723.1, the following polynomial was generated, where x represents the level of packet loss and y represents the level of impairment (Ie). Figure 14, shows a graph of the observed results versus the curve fit.
Fig. 13. G.723.1 Polynomial Fit
For G.723.1, the following polynomial was generated where x represents the level of packet loss and y represents the level of impairment (Ie):
y = 0.084x3 - 0.74x2 + 5.2348x + 15 (48)
3.6 Conclusions
IP Multimedia Subsystem (IMS) is very important due to the critical role it plays in the Next Generation Network (NGN) of the Fixed and Mobile Networks.
In this chapter we provide a theoretical model that can be used by operators and network designers to determine the effects of introducing IMS to their networks in term of bandwidth usage needed to establish IMS session. The inputs of this model are the required number of Calls or Sessions per Second, Network losses, SIP Messages size, Number of Network hops and number of ringing times. The output of this model is the bandwidth needed to insert IMS in the network.
www.intechopen.com
Design and Analysis of IP-Multimedia Subsystem (IMS) 93
Voice traffic in IMS will be served using Internet protocol (IP) which is called Voice over IP (VoIP). This chapter uses the "E-Model" developed by ITU-T as design tool to select network and voice parameters like coding scheme, packet loss limitations, and link utilization level in IMS Network.
The objective function for all cases is to maximize the number of calls that can be active on a link while maintaining a minimum level of voice quality (R> 70).The cases considered are:
1. Find voice coder given link bandwidth, packet loss level, and link utilization level. 2. Find voice coder and packet loss level given link bandwidth and background link
utilization. 3. Find voice coder and background link utilization level given link bandwidth and packet
loss level
OPNET and MATLAB are the optimization tool that is used in this chapter.
In case 1, we found that G.723.1 is the optimized coder as it gives the maximum number of calls keeping its R factor more than 70. The quality of speech is generally higher with G.729A and G.711. But G.729A and G.711 uses more bandwidth than G.723.1. In Case 2, both G.729A and G.723.1 were sensitive to changes in packet loss, but G.711 was not as sensitive. In Case 3, voice quality was not sensitive to changes in the link load until the link load grew above approximately 94%.
The chapter also provides new equestrians can be added to enhance E-Model to relate packet loss to the level of Equipment Impairment (Ie) with different codecs.
4. References
23.228 T 2009 IP Multimedia Subsystem (IMS) – Stage 2 (Release 9), Technical specification group core network and terminals, 3rd Generation Partnership Project.
24.229 T 2009 IP multimedia call control protocol based on Session Initiation Protocol (SIP) and Session Description Protocol (SDP); Stage 3 (Release 9). Technical specification group core network and terminals, 3rd Generation Partnership Project.
29.208 T 2007 End-to-end Quality of Service (QoS) signalling flows. Technical specification groupcore network and terminals, 3rd Generation Partnership Project.
29.328 T 2008 IP Multimedia Subsystem (IMS) Sh interface; Signalling flows and message contents. Technical specification group core network and terminals, 3rd Generation Partnership Project.
Calhoun, P.; Loughney, j.; Guttman,E.; Zorn,G.& J. Arkko, J.(2003).Diameter Base Protocol. RFC 3588, Internet Engineering Task Force, (September 2003).
Chebbo, H.(2003).Traffic and Load Modelling of an IP Mobile Network. 4th International Conference on 3G Mobile Communication Technologies, London, UK, June 2003.
Fathi, H.; Chakraborty, S. & Prasad, R. (2006). Optimization of SIP Session Setup Delay for VoIP in Wireless Networks, IEEE Transactions on Mobile Computing, vol. 5, no 9, pp. 1121–1132, (September 2006)
Fathi, H.; Chakraborty, S. & Prasad, R. (2006). On SIP session setup delay for VoIP services over correlated fading channels, IEEE Transactions on Vehicular Technology, vol. 55, no 1, pp. 286–295, January 2006.
www.intechopen.com
Mobile Networks 94
Faltstrom, P. (2000) E.164 number and DNS, RFC 2916, Internet Engineering Task Force, (September 2000).
Gurbani, V.; Jagadeesan,L. & Mendiratta, V.(2005). Characterizing session initiation protocol (SIP) network performance and reliability. In ISAS, ser. Lecture Notes in Computer Science, M. Malek, E. Nett, and N. Suri, Eds. Springer, pp. 196–211.
ITU-T (2005) H.248.1 ITR 2005 Gateway control protocol. Technical report, ITU-T. ITU-T (2005) Rec. G.107. The E-model, a Computational Model for use in Transmission
Planning.Technical report, ITU-T. ITU-T (1999) Rec. G.108. Application of the E-model: A planning guide. Technical report,
ITU-T. ITU-T (2007) Rec. G.729. Coding of Speech at 8 kbit/s Using Conjugate-Structure Algebraic-
Code-Excited Linear-Prediction (CS-ACELP)", Technical report.ITU-T. ITU-T (2006) Rec.G.723. Dual rate speech coder for multimedia communications
transmitting at 5.3 and6.3 kbit/s. Technical report, ITU-T. ITU-T (2007) Rec. G.113.Transmission impairments due to speech processing. Technical
report, ITU-T. Kueh, V.; Tafazolli, R.& Evans, B.(2003). Performance Evaluation of SIP-based Session
Establishment Over Satellite-UMTS. Vehicular Technology Conference, 2003. VTC 2003-Spring. The 57th IEEE Semiannual, Vol: 2, 22-25 Apr 2003, pp: 1381 – 1385.
Muhammad T. Alam (2005). An Optimal Method for SIP-Based Session Establishment over IMS. International Symposium on Performance Evaluation of Computer And Telecommunication Systems (SCS 2005), July 24-28, Hilton Cherry Hill/Philadelphia, Philadelphia, Pennsylvania, Sim Series.Vol 37, No. 3, pp: 692-698.
Rosenberg, J.; H. Schulzrinne , H.; Camarillo,G.; Johnston, A.; J. Peterson,J.; R. Sparks, R.;M. Handley,M.& Schooler,E.(2002) SIP: Session Initiation Protocol. Internet Engineering Task Force, RFC 3261,(June 2002).
Schulzrinne, H.; Casner, S.; Frederick, S.; & Jacobson, R.(2003) RTP: a Transport Protocol for Real-Time Applications, STD 64, RFC 3550, Internet Engineering Task Force, (July 2003).
Sisalem, D.; Floroiu, J.; Kuthan, J.; Abend, U. & Schulzrinne, H.(2009) . SIP Security. ISBN 978-0-4-470.51636.2 (cloth)
Sisalem, D.; Liisberg, M. & Rebahi, Y.(2008).A Theoretical Model of the Effects of Losses and Delays on the Performance of SIP. Globecom 2008, New Orleans, (December 2008)
Wu, J.; & Wang, P.(2003).The Performance Analysais of SIP-T Signaling System in Carrier Class VoIP Network, Proceedings of the 17th International Conference on Advanced Information Networking and Applications. Washington, DC, USA: IEEE Computer Society, 2003, p. 39.
www.intechopen.com
Mobile NetworksEdited by Dr. Jesús Ortiz
ISBN 978-953-51-0593-0Hard cover, 192 pagesPublisher InTechPublished online 09, May, 2012Published in print edition May, 2012
InTech EuropeUniversity Campus STeP Ri Slavka Krautzeka 83/A 51000 Rijeka, Croatia Phone: +385 (51) 770 447 Fax: +385 (51) 686 166www.intechopen.com
InTech ChinaUnit 405, Office Block, Hotel Equatorial Shanghai No.65, Yan An Road (West), Shanghai, 200040, China
Phone: +86-21-62489820 Fax: +86-21-62489821
The growth in the use of mobile networks has come mainly with the third generation systems and voice traffic.With the current third generation and the arrival of the 4G, the number of mobile users in the world will exceedthe number of landlines users. Audio and video streaming have had a significant increase, parallel to therequirements of bandwidth and quality of service demanded by those applications. Mobile networks requirethat the applications and protocols that have worked successfully in fixed networks can be used with the samelevel of quality in mobile scenarios. Until the third generation of mobile networks, the need to ensure reliablehandovers was still an important issue. On the eve of a new generation of access networks (4G) andincreased connectivity between networks of different characteristics commonly called hybrid (satellite, ad-hoc,sensors, wired, WIMAX, LAN, etc.), it is necessary to transfer mechanisms of mobility to future generations ofnetworks. In order to achieve this, it is essential to carry out a comprehensive evaluation of the performance ofcurrent protocols and the diverse topologies to suit the new mobility conditions.
How to referenceIn order to correctly reference this scholarly work, feel free to copy and paste the following:
Wagdy Anis Aziz and Dorgham Sisalem (2012). Design and Analysis of IP-Multimedia Subsystem (IMS),Mobile Networks, Dr. Jesús Ortiz (Ed.), ISBN: 978-953-51-0593-0, InTech, Available from:http://www.intechopen.com/books/mobile-networks/design-and-analysis-of-ip-multimedia-subsystem-ims