Embed Size (px)
Citation preview
International Journal of Science and Research (IJSR) ISSN: 2319-7064
ResearchGate Impact Factor (2018): 0.28 | SJIF (2018): 7.426
Volume 9 Issue 2, February 2020
www.ijsr.net Licensed Under Creative Commons Attribution CC BY
Design, Analysis and Optimization of a BAJA-SAE
Frame
Yogesh Chandra
Manipal Institute of Technology, Department of Mechanical and Manufacturing Engineering, Manipal University, Udupi-576103,
Karnataka, India
Abstract: The report being elaborated below involves the design, analysis and fabrication of a multi-tubular space frame. The main
motive of the roll cage is to ensure the structural safety and comfort of the driver under all loading conditions as well as incorporating
all the other subsystems together. The roll-cage has been drafted on various designing software’s such as Solidworks and CATIA. The
analysis and optimization has been done on advanced 3D CAD modelling and FEA software’s such as ANSYS, Solidworks and
Hyperworks. The material used for fabrication was finalized after extensive market surveys on the basis of cost and strength to weight
ratio. Testing and development to meet the design requirements and validation of the specification was undertaken.
Keywords: BAJA-SAE, CHASSIS, FEA
1. Introduction
The roll-cage is fabricated by a material of same
composition but different cross-sections depending on the
load. The roll cage has been designed by taking BAJA SAE
2019 RULEBOOK into consideration. The design discussed
in the following report involves the incorporation of a
305CC single cylinder BRIGGS AND STRATTON engine.
So it becomes more significant to minimize the weight so as
to achieve the maximum possible acceleration by balancing
the strength to weight ratio. Best possible fabrication
techniques have been used to manufacture the roll-cage with
importance given to driver ergonomics and
2. Material Selection
The selection of the material is generally on the basis of its
strength to weight ratio, elongation properties and
availability. An optimum balance of fulfilling design
requirements and minimizing weight is crucial for successful
design.
The materials generally chosen are AISI 4130 and AISI
1018 steels. The following table compares the two materials.
Table 1: 1018 vs 4130 Material AISI 1018 AISI 4130
Yield Strength 417 MPa 638 MPa
Ultimate Strength 473 MPa 810 MPa
Bending Strength 402.9 MPa 415 MPa
Preferred Welding Type MIG Welding TIG Welding
Availability Easily Available Less Available
Cost Cheap Expensive
From the above it can be deduced that AISI 4130 has a much
better strength to weight ratio. Also by using AISI 4130, we
can ensure a straight weight reduction of 17% per tubing
length without compromising on its strength.
2.1 Selection of Cross-Section
Primary member
To select the most appropriate section for primary members,
an analysis was done for bending strength, bending stiffness
and weight per meter of the cross-section. The graphs of
Bending Strength and Bending Stiffness versus thickness
were plotted in MATLAB. They also include the minimum
requirements for bending stiffness, bending strength and
minimum wall thickness (1.6 mm) as specified by the
rulebook. The cross sections shortlisted were 1 inch, 1.15
inch and 1.25 inch. Through a market survey, it was found
that the above mentioned pipe diameters were available in
following thicknesses - 1mm, 1.2mm, 1.65mm, 1.8mm and
2.1mm
Figure 1: Bending stiffness vs thickness
Paper ID: SR20208233756 DOI: 10.21275/SR20208233756 617
International Journal of Science and Research (IJSR) ISSN: 2319-7064
ResearchGate Impact Factor (2018): 0.28 | SJIF (2018): 7.426
Volume 9 Issue 2, February 2020
www.ijsr.net Licensed Under Creative Commons Attribution CC BY
Figure 2: Bending strength vs thickness
Since the cross section 1.15 inch x 1.65 mm gives minimum
weight along with satisfying all the conditions, it was
selected for the primary members
Secondary Members Secondary members are provided with an aim of providing
structural support to the entire frame and primary members
in particular. Since these members are specifically structural
they are used of smaller diameter and thickness as compared
to the primary ones.
2.2 Welding Technique
Generally TIG and MIG welding is used to weld 4130 steel.
By conducting destructive tests on weld samples of these
techniques the optimum welding technique that is TIG
welding was selected.
CAD Model
Rollcage was designed using Solidworks and CATIA.
Analysis and optimization was conducted using ANSYS and
ALTAIR Hyperworks. The following parameters were
considered while designing the roll-cage:
2.3 Driver Ergonomics
Ergonomics comes into picture with 5 aspects that are to be
concentrated upon:
1) Safety
2) Comfort
3) Ease of use
It is important that the driver be comfortable for the
endurance race in which he is to drive the vehicle for a time
length of continuous 4 hours and thus from this point of
consideration for ATV of BAJA SAE, the comfort and
safety of the driver are vital in order to reduce the fatigue of
the driver and hence increase his efficiency.
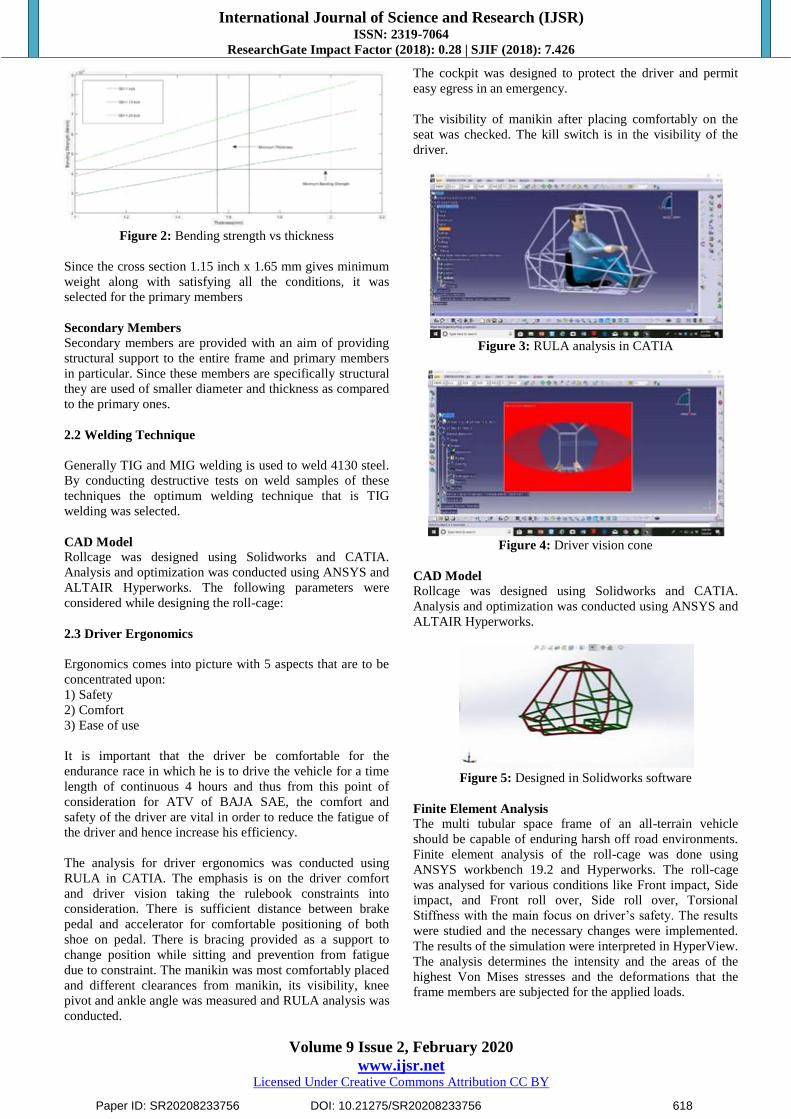
The analysis for driver ergonomics was conducted using
RULA in CATIA. The emphasis is on the driver comfort
and driver vision taking the rulebook constraints into
consideration. There is sufficient distance between brake
pedal and accelerator for comfortable positioning of both
shoe on pedal. There is bracing provided as a support to
change position while sitting and prevention from fatigue
due to constraint. The manikin was most comfortably placed
and different clearances from manikin, its visibility, knee
pivot and ankle angle was measured and RULA analysis was
conducted.
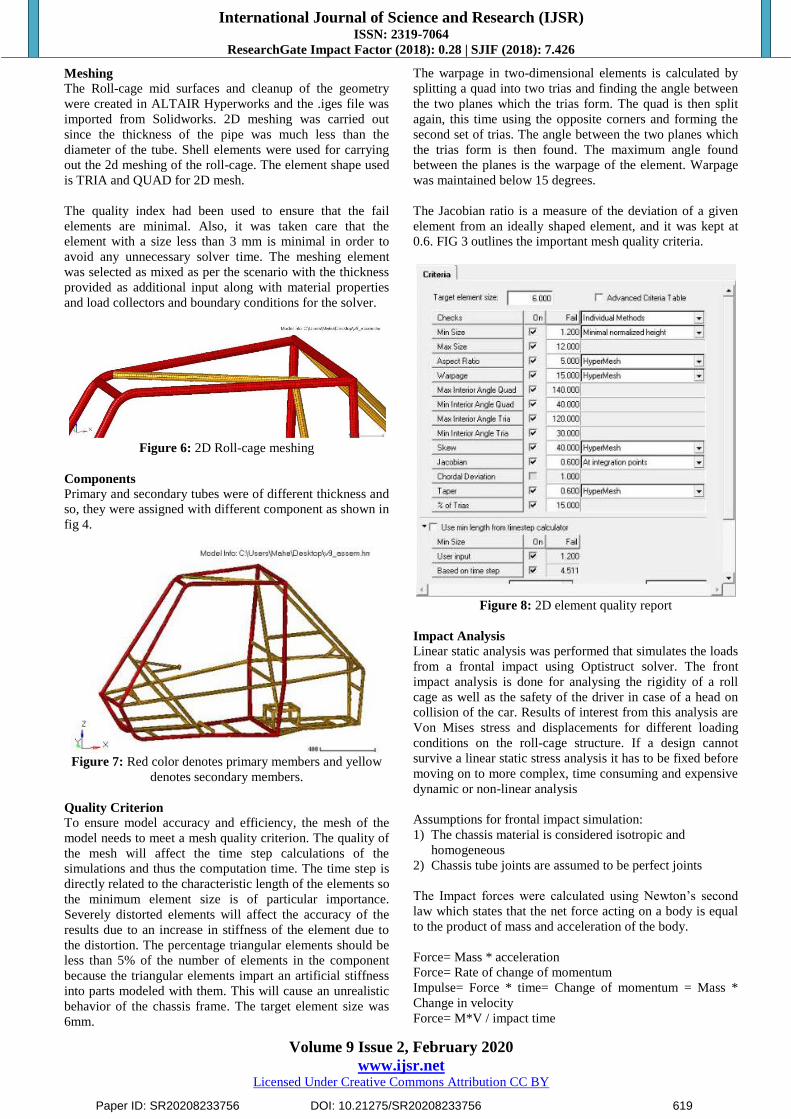
The cockpit was designed to protect the driver and permit
easy egress in an emergency.
The visibility of manikin after placing comfortably on the
seat was checked. The kill switch is in the visibility of the
driver.
Figure 3: RULA analysis in CATIA
Figure 4: Driver vision cone
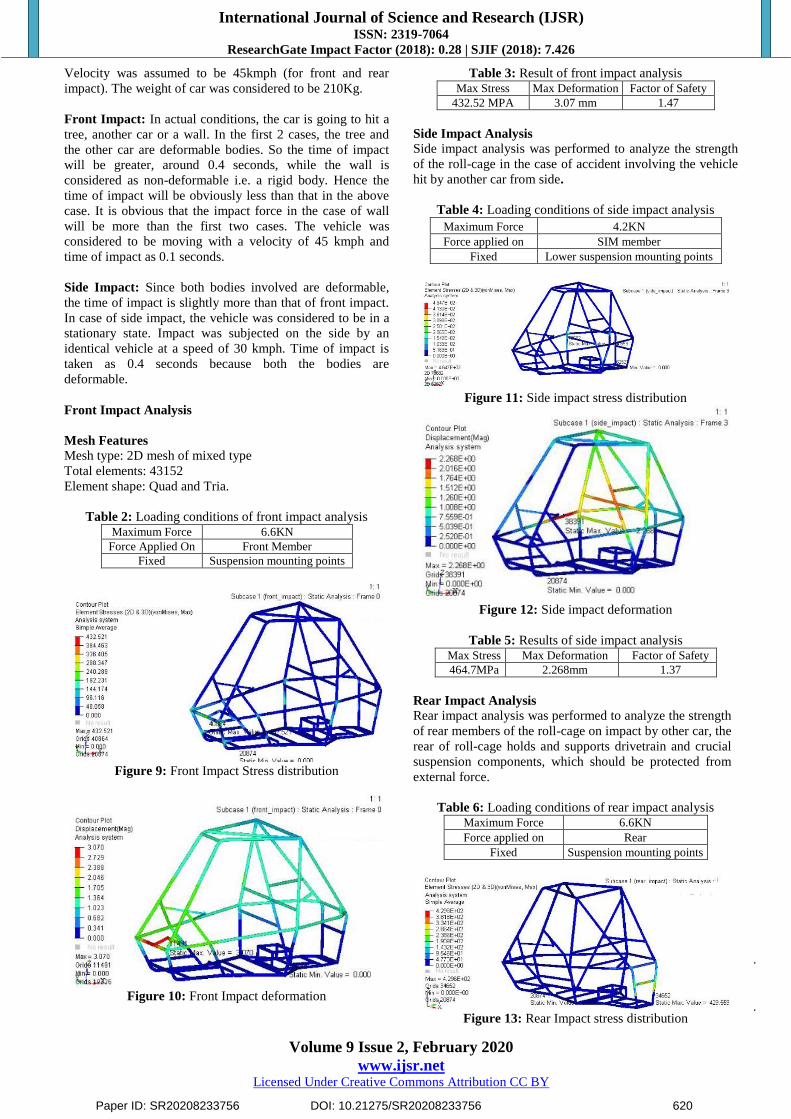
CAD Model
Rollcage was designed using Solidworks and CATIA.
Analysis and optimization was conducted using ANSYS and
ALTAIR Hyperworks.
Figure 5: Designed in Solidworks software
Finite Element Analysis
The multi tubular space frame of an all-terrain vehicle
should be capable of enduring harsh off road environments.
Finite element analysis of the roll-cage was done using
ANSYS workbench 19.2 and Hyperworks. The roll-cage
was analysed for various conditions like Front impact, Side
impact, and Front roll over, Side roll over, Torsional
Stiffness with the main focus on driver’s safety. The results
were studied and the necessary changes were implemented.
The results of the simulation were interpreted in HyperView.
The analysis determines the intensity and the areas of the
highest Von Mises stresses and the deformations that the
frame members are subjected for the applied loads.
Paper ID: SR20208233756 DOI: 10.21275/SR20208233756 618
International Journal of Science and Research (IJSR) ISSN: 2319-7064
ResearchGate Impact Factor (2018): 0.28 | SJIF (2018): 7.426
Volume 9 Issue 2, February 2020
www.ijsr.net Licensed Under Creative Commons Attribution CC BY
Meshing
The Roll-cage mid surfaces and cleanup of the geometry
were created in ALTAIR Hyperworks and the .iges file was
imported from Solidworks. 2D meshing was carried out
since the thickness of the pipe was much less than the
diameter of the tube. Shell elements were used for carrying
out the 2d meshing of the roll-cage. The element shape used
is TRIA and QUAD for 2D mesh.
The quality index had been used to ensure that the fail
elements are minimal. Also, it was taken care that the
element with a size less than 3 mm is minimal in order to
avoid any unnecessary solver time. The meshing element
was selected as mixed as per the scenario with the thickness
provided as additional input along with material properties
and load collectors and boundary conditions for the solver.
Figure 6: 2D Roll-cage meshing
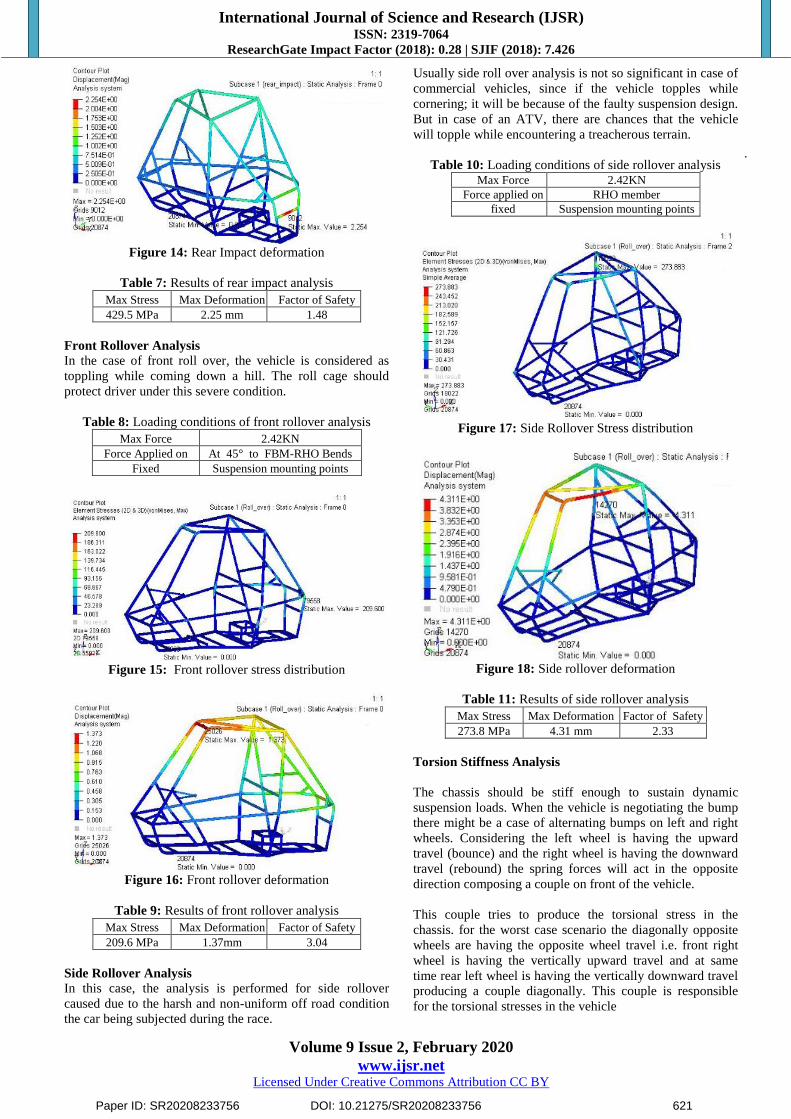
Components Primary and secondary tubes were of different thickness and
so, they were assigned with different component as shown in
fig 4.
Figure 7: Red color denotes primary members and yellow
denotes secondary members.
Quality Criterion
To ensure model accuracy and efficiency, the mesh of the
model needs to meet a mesh quality criterion. The quality of
the mesh will affect the time step calculations of the
simulations and thus the computation time. The time step is
directly related to the characteristic length of the elements so
the minimum element size is of particular importance.
Severely distorted elements will affect the accuracy of the
results due to an increase in stiffness of the element due to
the distortion. The percentage triangular elements should be
less than 5% of the number of elements in the component
because the triangular elements impart an artificial stiffness
into parts modeled with them. This will cause an unrealistic
behavior of the chassis frame. The target element size was
6mm.
The warpage in two-dimensional elements is calculated by
splitting a quad into two trias and finding the angle between
the two planes which the trias form. The quad is then split
again, this time using the opposite corners and forming the
second set of trias. The angle between the two planes which
the trias form is then found. The maximum angle found
between the planes is the warpage of the element. Warpage
was maintained below 15 degrees.
The Jacobian ratio is a measure of the deviation of a given
element from an ideally shaped element, and it was kept at
0.6. FIG 3 outlines the important mesh quality criteria.
Figure 8: 2D element quality report
Impact Analysis
Linear static analysis was performed that simulates the loads
from a frontal impact using Optistruct solver. The front
impact analysis is done for analysing the rigidity of a roll
cage as well as the safety of the driver in case of a head on
collision of the car. Results of interest from this analysis are
Von Mises stress and displacements for different loading
conditions on the roll-cage structure. If a design cannot
survive a linear static stress analysis it has to be fixed before
moving on to more complex, time consuming and expensive
dynamic or non-linear analysis
Assumptions for frontal impact simulation:
1) The chassis material is considered isotropic and
homogeneous
2) Chassis tube joints are assumed to be perfect joints
The Impact forces were calculated using Newton’s second
law which states that the net force acting on a body is equal
to the product of mass and acceleration of the body.
Force= Mass * acceleration
Force= Rate of change of momentum
Impulse= Force * time= Change of momentum = Mass *
Change in velocity
Force= M*V / impact time
Paper ID: SR20208233756 DOI: 10.21275/SR20208233756 619
International Journal of Science and Research (IJSR) ISSN: 2319-7064
ResearchGate Impact Factor (2018): 0.28 | SJIF (2018): 7.426
Volume 9 Issue 2, February 2020
www.ijsr.net Licensed Under Creative Commons Attribution CC BY
Velocity was assumed to be 45kmph (for front and rear
impact). The weight of car was considered to be 210Kg.
Front Impact: In actual conditions, the car is going to hit a
tree, another car or a wall. In the first 2 cases, the tree and
the other car are deformable bodies. So the time of impact
will be greater, around 0.4 seconds, while the wall is
considered as non-deformable i.e. a rigid body. Hence the
time of impact will be obviously less than that in the above
case. It is obvious that the impact force in the case of wall
will be more than the first two cases. The vehicle was
considered to be moving with a velocity of 45 kmph and
time of impact as 0.1 seconds.
Side Impact: Since both bodies involved are deformable,
the time of impact is slightly more than that of front impact.
In case of side impact, the vehicle was considered to be in a
stationary state. Impact was subjected on the side by an
identical vehicle at a speed of 30 kmph. Time of impact is
taken as 0.4 seconds because both the bodies are
deformable.
Front Impact Analysis
Mesh Features
Mesh type: 2D mesh of mixed type
Total elements: 43152
Element shape: Quad and Tria.
Table 2: Loading conditions of front impact analysis Maximum Force 6.6KN
Force Applied On Front Member
Fixed Suspension mounting points
Figure 9: Front Impact Stress distribution
Figure 10: Front Impact deformation
Table 3: Result of front impact analysis Max Stress Max Deformation Factor of Safety
432.52 MPA 3.07 mm 1.47
Side Impact Analysis
Side impact analysis was performed to analyze the strength
of the roll-cage in the case of accident involving the vehicle
hit by another car from side.
Table 4: Loading conditions of side impact analysis
Maximum Force 4.2KN
Force applied on SIM member
Fixed Lower suspension mounting points
Figure 11: Side impact stress distribution
Figure 12: Side impact deformation
Table 5: Results of side impact analysis Max Stress Max Deformation Factor of Safety
464.7MPa 2.268mm 1.37
Rear Impact Analysis
Rear impact analysis was performed to analyze the strength
of rear members of the roll-cage on impact by other car, the
rear of roll-cage holds and supports drivetrain and crucial
suspension components, which should be protected from
external force.
Table 6: Loading conditions of rear impact analysis Maximum Force 6.6KN
Force applied on Rear
Fixed Suspension mounting points
Figure 13: Rear Impact stress distribution
Paper ID: SR20208233756 DOI: 10.21275/SR20208233756 620
International Journal of Science and Research (IJSR) ISSN: 2319-7064
ResearchGate Impact Factor (2018): 0.28 | SJIF (2018): 7.426
Volume 9 Issue 2, February 2020
www.ijsr.net Licensed Under Creative Commons Attribution CC BY
Figure 14: Rear Impact deformation
Table 7: Results of rear impact analysis
Max Stress Max Deformation Factor of Safety
429.5 MPa 2.25 mm 1.48
Front Rollover Analysis
In the case of front roll over, the vehicle is considered as
toppling while coming down a hill. The roll cage should
protect driver under this severe condition.
Table 8: Loading conditions of front rollover analysis
Max Force 2.42KN
Force Applied on At 45° to FBM-RHO Bends
Fixed Suspension mounting points
Figure 15: Front rollover stress distribution
Figure 16: Front rollover deformation
Table 9: Results of front rollover analysis
Max Stress Max Deformation Factor of Safety
209.6 MPa 1.37mm 3.04
Side Rollover Analysis
In this case, the analysis is performed for side rollover
caused due to the harsh and non-uniform off road condition
the car being subjected during the race.
Usually side roll over analysis is not so significant in case of
commercial vehicles, since if the vehicle topples while
cornering; it will be because of the faulty suspension design.
But in case of an ATV, there are chances that the vehicle
will topple while encountering a treacherous terrain.
Table 10: Loading conditions of side rollover analysis Max Force 2.42KN
Force applied on RHO member
fixed Suspension mounting points
Figure 17: Side Rollover Stress distribution
Figure 18: Side rollover deformation
Table 11: Results of side rollover analysis
Max Stress Max Deformation Factor of Safety
273.8 MPa 4.31 mm 2.33
Torsion Stiffness Analysis
The chassis should be stiff enough to sustain dynamic
suspension loads. When the vehicle is negotiating the bump
there might be a case of alternating bumps on left and right
wheels. Considering the left wheel is having the upward
travel (bounce) and the right wheel is having the downward
travel (rebound) the spring forces will act in the opposite
direction composing a couple on front of the vehicle.
This couple tries to produce the torsional stress in the
chassis. for the worst case scenario the diagonally opposite
wheels are having the opposite wheel travel i.e. front right
wheel is having the vertically upward travel and at same
time rear left wheel is having the vertically downward travel
producing a couple diagonally. This couple is responsible
for the torsional stresses in the vehicle
Paper ID: SR20208233756 DOI: 10.21275/SR20208233756 621
International Journal of Science and Research (IJSR) ISSN: 2319-7064
ResearchGate Impact Factor (2018): 0.28 | SJIF (2018): 7.426
Volume 9 Issue 2, February 2020
www.ijsr.net Licensed Under Creative Commons Attribution CC BY
Table 12: Loading conditions of torsional analysis
Max Force 2.42KN
Force applied on Diagonally Opposite Suspension Mounts
Fixed Diagonally Opposite Suspension Mounts
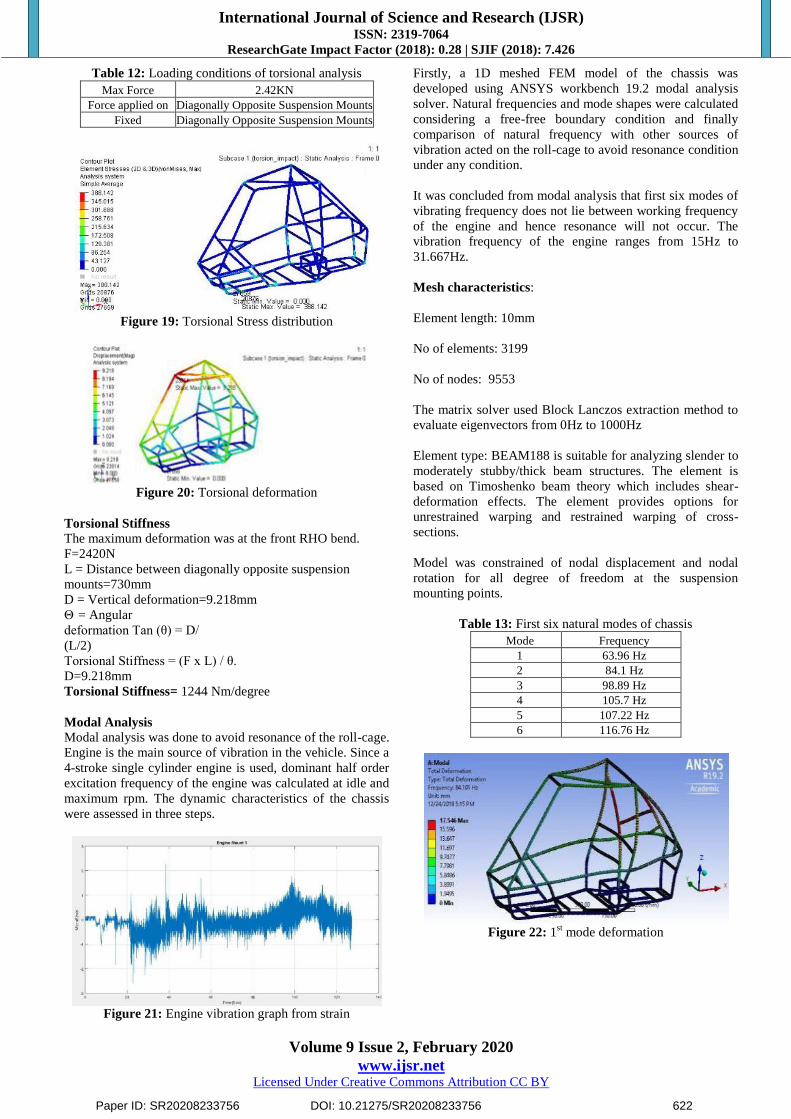
Figure 19: Torsional Stress distribution
Figure 20: Torsional deformation
Torsional Stiffness
The maximum deformation was at the front RHO bend.
F=2420N
L = Distance between diagonally opposite suspension
mounts=730mm
D = Vertical deformation=9.218mm
Θ = Angular
deformation Tan (θ) = D/
(L/2)
Torsional Stiffness = (F x L) / θ.
D=9.218mm
Torsional Stiffness= 1244 Nm/degree
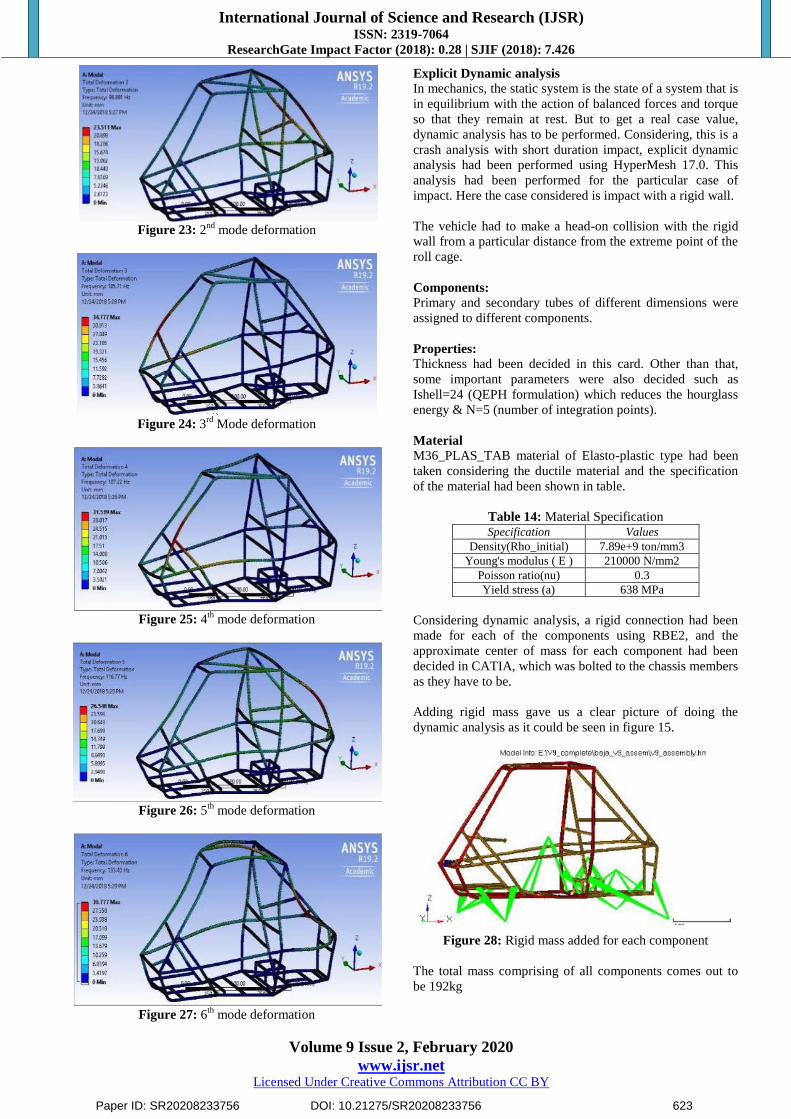
Modal Analysis
Modal analysis was done to avoid resonance of the roll-cage.
Engine is the main source of vibration in the vehicle. Since a
4-stroke single cylinder engine is used, dominant half order
excitation frequency of the engine was calculated at idle and
maximum rpm. The dynamic characteristics of the chassis
were assessed in three steps.
Figure 21: Engine vibration graph from strain
Firstly, a 1D meshed FEM model of the chassis was
developed using ANSYS workbench 19.2 modal analysis
solver. Natural frequencies and mode shapes were calculated
considering a free-free boundary condition and finally
comparison of natural frequency with other sources of
vibration acted on the roll-cage to avoid resonance condition
under any condition.
It was concluded from modal analysis that first six modes of
vibrating frequency does not lie between working frequency
of the engine and hence resonance will not occur. The
vibration frequency of the engine ranges from 15Hz to
31.667Hz.
Mesh characteristics:
Element length: 10mm
No of elements: 3199
No of nodes: 9553
The matrix solver used Block Lanczos extraction method to
evaluate eigenvectors from 0Hz to 1000Hz
Element type: BEAM188 is suitable for analyzing slender to
moderately stubby/thick beam structures. The element is
based on Timoshenko beam theory which includes shear-
deformation effects. The element provides options for
unrestrained warping and restrained warping of cross-
sections.
Model was constrained of nodal displacement and nodal
rotation for all degree of freedom at the suspension
mounting points.
Table 13: First six natural modes of chassis
Mode Frequency
1 63.96 Hz
2 84.1 Hz
3 98.89 Hz
4 105.7 Hz
5 107.22 Hz
6 116.76 Hz
Figure 22: 1
st mode deformation
Paper ID: SR20208233756 DOI: 10.21275/SR20208233756 622
International Journal of Science and Research (IJSR) ISSN: 2319-7064
ResearchGate Impact Factor (2018): 0.28 | SJIF (2018): 7.426
Volume 9 Issue 2, February 2020
www.ijsr.net Licensed Under Creative Commons Attribution CC BY
Figure 23: 2
nd mode deformation
Figure 24: 3
rd Mode deformation
Figure 25: 4
th mode deformation
Figure 26: 5
th mode deformation
Figure 27: 6
th mode deformation
Explicit Dynamic analysis
In mechanics, the static system is the state of a system that is
in equilibrium with the action of balanced forces and torque
so that they remain at rest. But to get a real case value,
dynamic analysis has to be performed. Considering, this is a
crash analysis with short duration impact, explicit dynamic
analysis had been performed using HyperMesh 17.0. This
analysis had been performed for the particular case of
impact. Here the case considered is impact with a rigid wall.
The vehicle had to make a head-on collision with the rigid
wall from a particular distance from the extreme point of the
roll cage.
Components:
Primary and secondary tubes of different dimensions were
assigned to different components.
Properties:
Thickness had been decided in this card. Other than that,
some important parameters were also decided such as
Ishell=24 (QEPH formulation) which reduces the hourglass
energy & N=5 (number of integration points).
Material
M36_PLAS_TAB material of Elasto-plastic type had been
taken considering the ductile material and the specification
of the material had been shown in table.
Table 14: Material Specification Specification Values
Density(Rho_initial) 7.89e+9 ton/mm3
Young's modulus ( E ) 210000 N/mm2
Poisson ratio(nu) 0.3
Yield stress (a) 638 MPa
Considering dynamic analysis, a rigid connection had been
made for each of the components using RBE2, and the
approximate center of mass for each component had been
decided in CATIA, which was bolted to the chassis members
as they have to be.
Adding rigid mass gave us a clear picture of doing the
dynamic analysis as it could be seen in figure 15.
Figure 28: Rigid mass added for each component
The total mass comprising of all components comes out to
be 192kg
Paper ID: SR20208233756 DOI: 10.21275/SR20208233756 623
International Journal of Science and Research (IJSR) ISSN: 2319-7064
ResearchGate Impact Factor (2018): 0.28 | SJIF (2018): 7.426
Volume 9 Issue 2, February 2020
www.ijsr.net Licensed Under Creative Commons Attribution CC BY
Figure 29: Total mass of the system
Contact
Type 7 contact is created so that the components can interact
in the event of impact. Istf value of stiffness scale factor of 4
was considered with gapmin of 1mm, with Inacti taken as 6
for variable gap with consideration of initial penetration.
Load collector
Velocity: - Initial velocity of 45 kmph was imparted to our
vehicle using card INIVEL collector and they were made to
collide with the rigid wall which is at a distance of 10 mm
from the front most part of the vehicle.
Cards
Several cards were made in order to optimize the whole
simulation. Some of them were:-
A. ENG_RUN:
T-stop had been calculated and decide here, which is
basically total run time for the simulation. For this, the total
time taken to hit the second vehicle and coming back to its
original position has been taken. Considering the second
vehicle at a distance 10mm from the rigid wall, and vehicle
moving at speed of 45kmph, the total time would be 0.1
seconds.
B .ENG_TFILE:
The frequency of time after which the animation file would
be generated is mentioned here which is taken as 0.001.
C. ENG_ANIM_ELEM:
Those parameters which had to be evaluated other than
displacement (default) had been taken here i.e. hourglass
energy and Von misses stress.
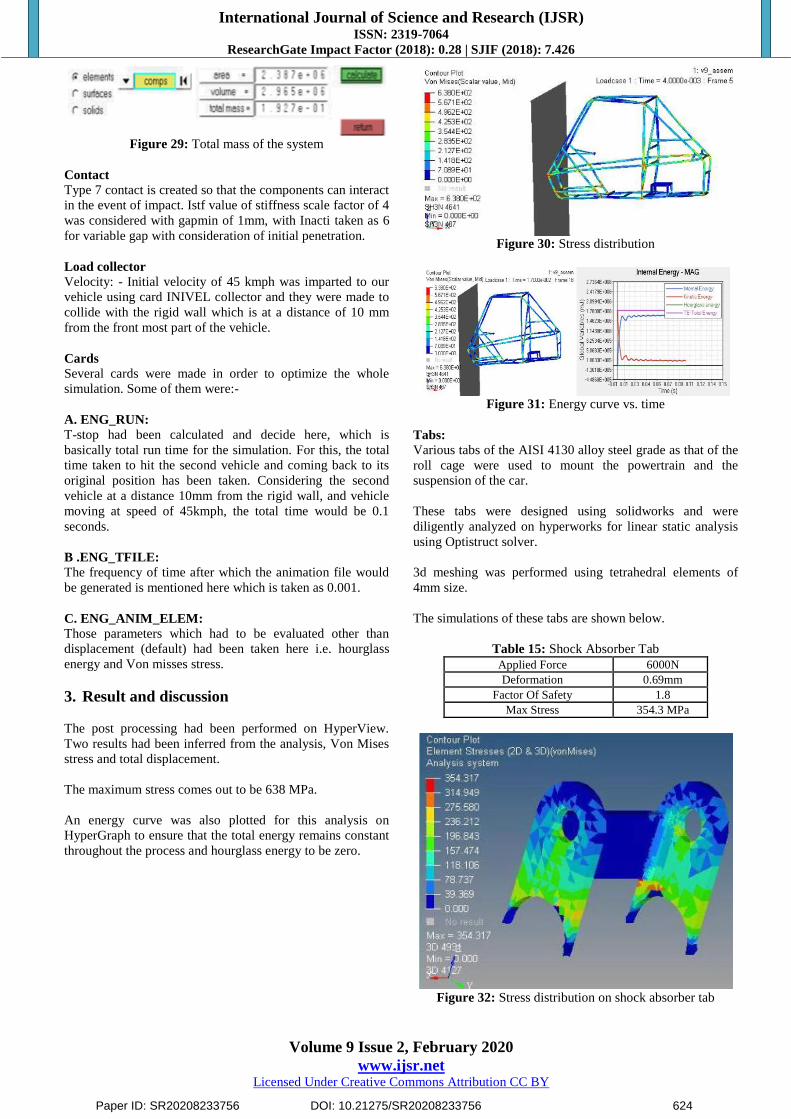
3. Result and discussion
The post processing had been performed on HyperView.
Two results had been inferred from the analysis, Von Mises
stress and total displacement.
The maximum stress comes out to be 638 MPa.
An energy curve was also plotted for this analysis on
HyperGraph to ensure that the total energy remains constant
throughout the process and hourglass energy to be zero.
Figure 30: Stress distribution
Figure 31: Energy curve vs. time
Tabs:
Various tabs of the AISI 4130 alloy steel grade as that of the
roll cage were used to mount the powertrain and the
suspension of the car.
These tabs were designed using solidworks and were
diligently analyzed on hyperworks for linear static analysis
using Optistruct solver.
3d meshing was performed using tetrahedral elements of
4mm size.
The simulations of these tabs are shown below.
Table 15: Shock Absorber Tab
Applied Force 6000N
Deformation 0.69mm
Factor Of Safety 1.8
Max Stress 354.3 MPa
Figure 32: Stress distribution on shock absorber tab
Paper ID: SR20208233756 DOI: 10.21275/SR20208233756 624
International Journal of Science and Research (IJSR) ISSN: 2319-7064
ResearchGate Impact Factor (2018): 0.28 | SJIF (2018): 7.426
Volume 9 Issue 2, February 2020
www.ijsr.net Licensed Under Creative Commons Attribution CC BY
Table 16: Upper A-Arm Tabs
Applied Force 6000N
Deformation 0.78mm
Factor Of Safety 1.73
Max Stress 368.7 MPa
Figure 33: Stress distribution on upper arm tab
Table 17: Lower A-Arm Tabs
Applied Force 6000N
Deformation 0.82mm
Factor of Safety 1.47
Max Stress 434.1 MPa
Figure 34: Stress distribution on Lower a-arm tab
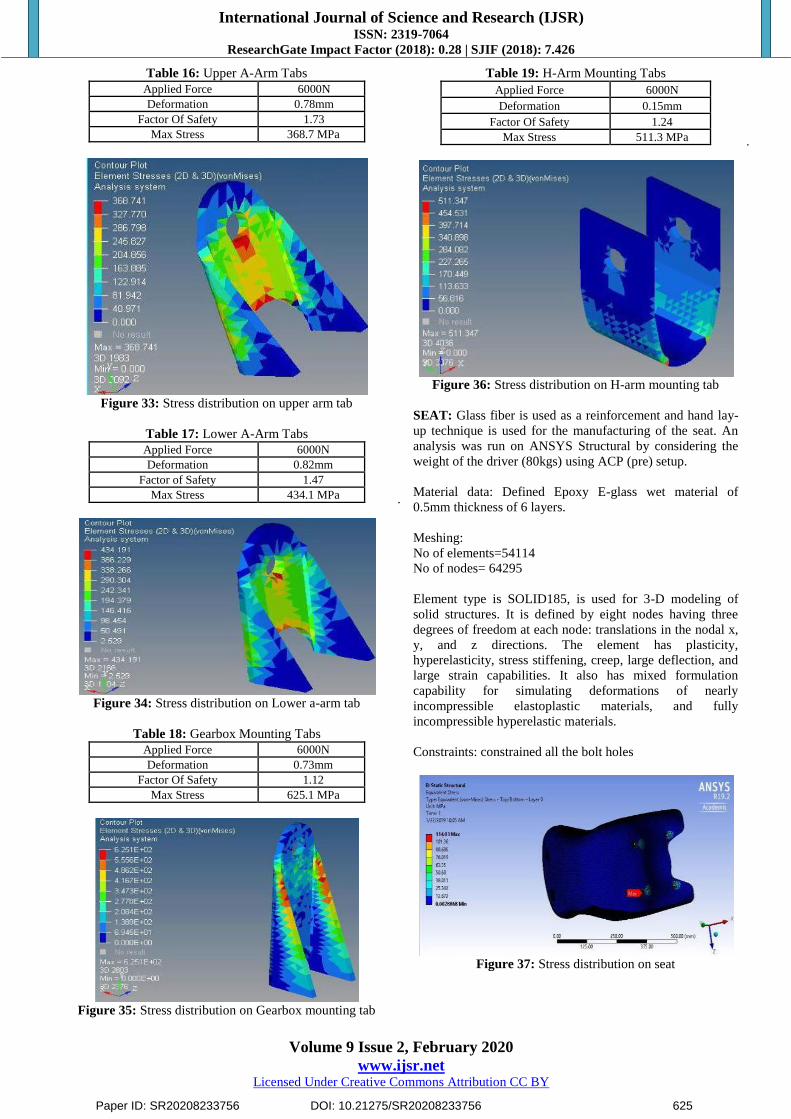
Table 18: Gearbox Mounting Tabs
Applied Force 6000N
Deformation 0.73mm
Factor Of Safety 1.12
Max Stress 625.1 MPa
Figure 35: Stress distribution on Gearbox mounting tab
Table 19: H-Arm Mounting Tabs
Applied Force 6000N
Deformation 0.15mm
Factor Of Safety 1.24
Max Stress 511.3 MPa
Figure 36: Stress distribution on H-arm mounting tab
SEAT: Glass fiber is used as a reinforcement and hand lay-
up technique is used for the manufacturing of the seat. An
analysis was run on ANSYS Structural by considering the
weight of the driver (80kgs) using ACP (pre) setup.
Material data: Defined Epoxy E-glass wet material of
0.5mm thickness of 6 layers.
Meshing:
No of elements=54114
No of nodes= 64295
Element type is SOLID185, is used for 3-D modeling of
solid structures. It is defined by eight nodes having three
degrees of freedom at each node: translations in the nodal x,
y, and z directions. The element has plasticity,
hyperelasticity, stress stiffening, creep, large deflection, and
large strain capabilities. It also has mixed formulation
capability for simulating deformations of nearly
incompressible elastoplastic materials, and fully
incompressible hyperelastic materials.
Constraints: constrained all the bolt holes
Figure 37: Stress distribution on seat
Paper ID: SR20208233756 DOI: 10.21275/SR20208233756 625
International Journal of Science and Research (IJSR) ISSN: 2319-7064
ResearchGate Impact Factor (2018): 0.28 | SJIF (2018): 7.426
Volume 9 Issue 2, February 2020
www.ijsr.net Licensed Under Creative Commons Attribution CC BY
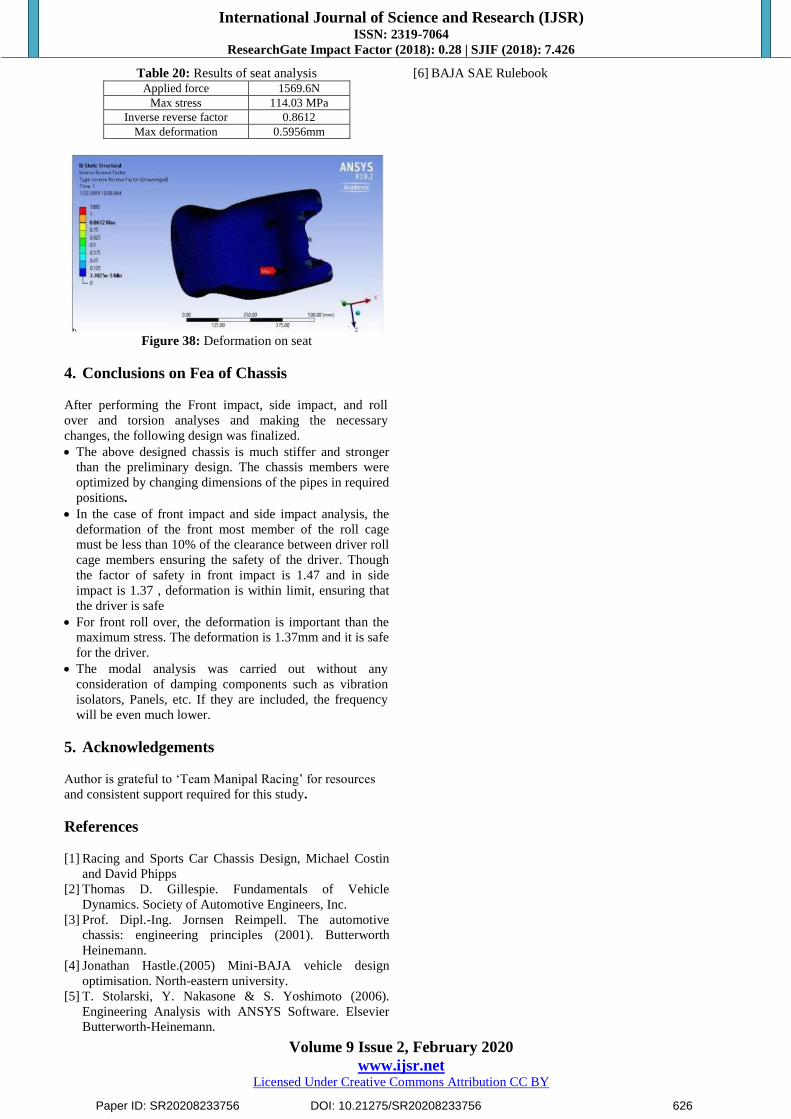
Table 20: Results of seat analysis Applied force 1569.6N
Max stress 114.03 MPa
Inverse reverse factor 0.8612
Max deformation 0.5956mm
Figure 38: Deformation on seat
4. Conclusions on Fea of Chassis
After performing the Front impact, side impact, and roll
over and torsion analyses and making the necessary
changes, the following design was finalized.
The above designed chassis is much stiffer and stronger
than the preliminary design. The chassis members were
optimized by changing dimensions of the pipes in required
positions.
In the case of front impact and side impact analysis, the
deformation of the front most member of the roll cage
must be less than 10% of the clearance between driver roll
cage members ensuring the safety of the driver. Though
the factor of safety in front impact is 1.47 and in side
impact is 1.37 , deformation is within limit, ensuring that
the driver is safe
For front roll over, the deformation is important than the
maximum stress. The deformation is 1.37mm and it is safe
for the driver.
The modal analysis was carried out without any
consideration of damping components such as vibration
isolators, Panels, etc. If they are included, the frequency
will be even much lower.
5. Acknowledgements
Author is grateful to ‘Team Manipal Racing’ for resources
and consistent support required for this study.
References
[1] Racing and Sports Car Chassis Design, Michael Costin
and David Phipps
[2] Thomas D. Gillespie. Fundamentals of Vehicle
Dynamics. Society of Automotive Engineers, Inc.
[3] Prof. Dipl.-Ing. Jornsen Reimpell. The automotive
chassis: engineering principles (2001). Butterworth
Heinemann.
[4] Jonathan Hastle.(2005) Mini-BAJA vehicle design
optimisation. North-eastern university.
[5] T. Stolarski, Y. Nakasone & S. Yoshimoto (2006).
Engineering Analysis with ANSYS Software. Elsevier
Butterworth-Heinemann.
[6] BAJA SAE Rulebook
Paper ID: SR20208233756 DOI: 10.21275/SR20208233756 626
![[Please list the analysis conducted] - Baja SAE Baja SAE Redesign Comparison... · Web view2016 Baja SAE Design Comparison Document 2016 Baja SAE Design Comparison Document 2016 Baja](https://img.pdfslide.us/doc/110x75/5ab1e61b7f8b9a284c8d112e/please-list-the-analysis-conducted-baja-baja-sae-redesign-comparisonweb-view2016.jpg)