Embed Size (px)
Citation preview
Working Paper Number 156
December 2008 Desert Power: The Economics of Solar Thermal Electricity
for Europe, North Africa, and the Middle East By Kevin Ummel and David Wheeler
The Center for Global Development is an independent, nonprofit policy research organization that is dedicated to reducing global poverty and inequality and to making globalization work for the poor. This paper was made possible in part by financial support from the Australian Agency for International Development. Use and dissemination of this Working Paper is encouraged; however, reproduced copies may not be used for commercial purposes. Further usage is permitted under the terms of the Creative Commons License. The views expressed in this paper are those of the author and should not be attributed to the board of directors or funders of the Center for Global Development.
www.cgdev.org
Abstract
A climate crisis is inevitable unless developing countries limit carbon emissions from the power sector in the near future. This will happen only if the costs of low-carbon power production become competitive with fossil fuel power. We focus on a leading candidate for investment: solar thermal or concentrating solar power (CSP), a commercially available technology that uses direct sunlight and mirrors to boil water and drive conventional steam turbines. Solar thermal power production in North Africa and the Middle East could provide enough power to Europe to meet the needs of 35 million people by 2020. We compute the subsidies needed to bring CSP to financial parity with fossil-fuel alternatives. They conclude that large-scale deployment of CSP is attainable with subsidy levels that are modest, given the planetary stakes. By the end of the program, unsubsidized CSP projects are likely to be competitive with coal- and gas-based power production in Europe. The question is not whether CSP is feasible but whether programs using CSP technology will be operational in time to prevent catastrophic climate change. For such programs to spur the clean energy revolution, efforts to arrange financing should begin right away, with site acquisition and construction to follow within a year.
Desert Power:
The Economics of Solar Thermal Electricity
For Europe, North Africa, and the Middle East
Kevin Ummel
David Wheeler
Center for Global Development
December, 2008
Thanks to Waleed Alsuraih, Husam Beides, Nancy Birdsall, Ken Chomitz, Michele de Nevers,
Dennis de Tray, Chris Flavin, Chandra Govindarajalu, Kirk Hamilton, Dan Hammer, Robin
Kraft, Lawrence MacDonald, Fred Morse, Paul Martin, Joel Meister, Alan Miller, John
O’Donnell, and Mead Over and for valuable comments and suggestions. All remaining errors
are our own.
2
Executive Summary
A climate crisis is inevitable unless developing countries limit carbon emissions from the power
sector in the near future. This will only happen if low-carbon technologies become cost-
competitive for private investors, because feasible international subsidies for clean technology
will be tiny relative to the needed sectoral investment. Success will require focusing on strategic
investments that create a market cost advantage for clean power.
This paper focuses on a leading investment candidate, solar thermal or concentrating solar power
(CSP), a commercially available technology that uses direct sunlight and mirrors to boil water
and drive conventional steam turbines. We focus on the most promising near-term prospect for
CSP expansion: export of electricity to Europe from the desert regions of the Middle East and
North Africa (MENA), which receive some of the most intense solar radiation in the world.
Recognizing this, the Union for the Mediterranean, initiated in July 2008 and composed of EU
member states and non-EU Mediterranean nations, has adopted the goal of deploying 20
gigawatts of solar generating capacity in the region by 2020.
The paper analyzes an expansion program that exports electricity to Europe from representative
sites in Morocco, Libya, and Jordan. We compute the subsidies needed to bring CSP to financial
parity with fossil-fuel alternatives in an assessment that considers project siting, power
transmission, short- and long-run costs, power market characteristics and financing options.
Construction begins in 2010, with 20 gigawatts of generating capacity and associated
transmission infrastructure installed by 2020. Total delivery to Europe in 2020 is 55,000
gigawatt hours – enough to satisfy the power demand of 35 million people. The program
directly averts about 2.7 billion tons of carbon dioxide (CO2) emissions over the lifetime of the
facilities, and indirectly averts an additional 2.6 billion tons by accelerating cost reductions for
investments outside the program.
We estimate that implementation will require international clean technology subsidies of about
$20 billion over ten years. By the end of the program, the expected profitability of unsubsidized
CSP projects is competitive with that of coal and gas power generation in Europe. Over the full
life of the program, the present value cost of CO2 averted is as low as $14 per ton. This is a very
modest carbon shadow price, even by conservative standards.
We conclude that large-scale deployment of CSP in the MENA region is attainable at levels of
public subsidy that are modest, given the planetary stakes. The question is not whether CSP is
feasible, but whether programs like the MENA initiative will be operational in time to prevent
catastrophic climate change. For such programs to spur the clean energy revolution, efforts to
arrange financing should begin right away, with site acquisition and construction to follow
within a year.
3
1. Introduction
Although carbon mitigation proposals have traditionally focused on developed countries,
emissions from developing countries are growing so rapidly that they will probably account for
one-half of atmospheric carbon loading by 2030 (Wheeler and Ummel, 2007). This will sharpen
the dilemma for negotiators at the UN’s Copenhagen conference in 2009, because a climate
crisis is inevitable unless developing countries begin limiting their carbon emission in the near
future. This will only happen if carbon-intensive technologies become more costly than clean
technologies, via regulation of the former or significant cost reduction for the latter. The first
option seems unrealistic: Poor countries are unlikely to accept carbon regulation at Copenhagen
for several reasons. They favor low-cost power (which is often carbon-intensive) because they
remain focused on poverty reduction. In addition, they remain unwilling to shoulder an
additional cost burden because they rightly view their historical role in creating the climate crisis
as modest. Finally, we can scarcely expect poor countries to regulate global emissions when
they cannot even control local pollutants that kill, injure and damage the livelihoods of millions
of their citizens every year.
The second option, in contrast, does seem feasible. Developing countries may well agree
to limit carbon emissions if developed countries make a credible offer to cover the incremental
cost of clean technologies. Anticipating this condition, the US, UK and Japan have recently
proposed a Clean Technology Fund (CTF) and delegated its management to the World Bank,
citing the Bank’s global experience with large energy projects (McCormick, 2008). In principle
this offers a way forward, but potentially-critical problems of scale and cost must be considered.
To assess their significance, this paper considers the prospects for clean technology promotion in
the power sector. Power and heat generation are responsible for over 27% of total CO2
4
emissions, and the proportion is rising (IPCC, 2007). Even if clean technology subsidies are
large by historical standards, they will inevitably be tiny relative to the needed investment in this
sector. Meeting future energy demand will require $26 trillion in infrastructure investment
between now and 2030, more than half of it in the developing world (IEA, 2008). Private
investors will dominate the sector, and they will only choose renewable technology if it costs less
than fossil-fired power. To succeed, donor institutions will have to focus their relatively modest
resources on strategic investments that create a market cost advantage for clean power. If this
cannot be achieved, clean technology subsidies are unlikely to be provide more than a palliative.
Fortunately, our review of the evidence suggests that such an achievement is possible for a
handful of clean technologies that can be developed at the requisite scale in the near future.
Given the rapidly-closing window for action that can prevent a climate catastrophe, identifying
and exploiting those limited options is a critical task for the global community.
The leading candidate may be solar thermal or concentrating solar power (CSP), which
uses direct sunlight and mirrors to boil water and drive conventional steam turbines. The
necessary technology and engineering are straightforward, no exotic materials are required, and
commercial facilities have been in operation for more than 20 years. About 500 MW of CSP
generating capacity is currently installed worldwide, with plans to add an additional 6,000 MW
by 2012 – most of it in California and Spain.1 A central task for the global community is to open
a similar expansion path for low- and middle-income countries. In this paper, we consider the
most promising near-term prospect: the desert regions of the Middle East and North Africa
(MENA), which receive some of the most intense solar radiation in the world. Much of it falls
on largely-uninhabited land with little or no agricultural potential and, consequently, a low
1 http://www.earth-policy.org/Updates/2008/Update73_data.htm#table1
5
opportunity cost of utilization. Given these favorable conditions, the technical potential for
exploitation of MENA solar resources is nearly limitless.
Potential demand for these resources in nearby Europe is also huge. With the European
Union planning to reduce member countries’ greenhouse emissions by at least 15% from current
levels by 2020, mostly through cap-and-trade regulation in the power sector, the regional
demand for carbon-free electricity is intense and growing. At the same time, geopolitical
considerations argue for reduced dependence on Russian natural gas and stronger political and
economic integration with the southern Mediterranean region. In addition, MENA governments
are interested in exploiting solar resources to meet rapidly-growing domestic demand, while
redirecting natural gas production toward more profitable export opportunities. Recognizing
these potential benefits, the Union for the Mediterranean, initiated in July 2008 and composed of
EU member states and non-EU Mediterranean nations, has adopted the goal of deploying 20
gigawatts of solar generating capacity in the region by 2020.
Extensive studies of MENA solar potential and technical feasibility have been conducted in
the past, particularly the excellent MED-CSP and TRANS-CSP projects led by the German
Aerospace Center (DLR 2005, 2006). We build on that work, providing estimates that reflect
more recent information about input prices and CSP learning curves. We focus particularly on
the subsidies needed to promote large-scale private-sector expansion of CSP in MENA during
the coming decade, and the effect of alternative financing options on project profitability.
The remainder of the paper is organized as follows. In Section 2, we present a GIS analysis
that identifies prospective solar fields in MENA and the potential for both domestic supply and
export of electricity to Europe. Section 3 develops cost estimates for CSP technology and
associated transmission systems, as well as coal- and gas-fired alternatives. In Section 4, we
6
employ a simple financial model to compare the expected profitability of competing power
generation options. Section 5 estimates the scale of international subsidies needed to make CSP
projects as appealing to investors as fossil-fueled alternatives in Europe and selected MENA
countries. Section 6 estimates the total cost of an expansion program capable of making CSP
generation as profitable as European fossil fuel alternatives within 10 years. In Section 7, we
provide a summary and conclusions.
7
2. Spatial Analysis of Potential Solar Fields
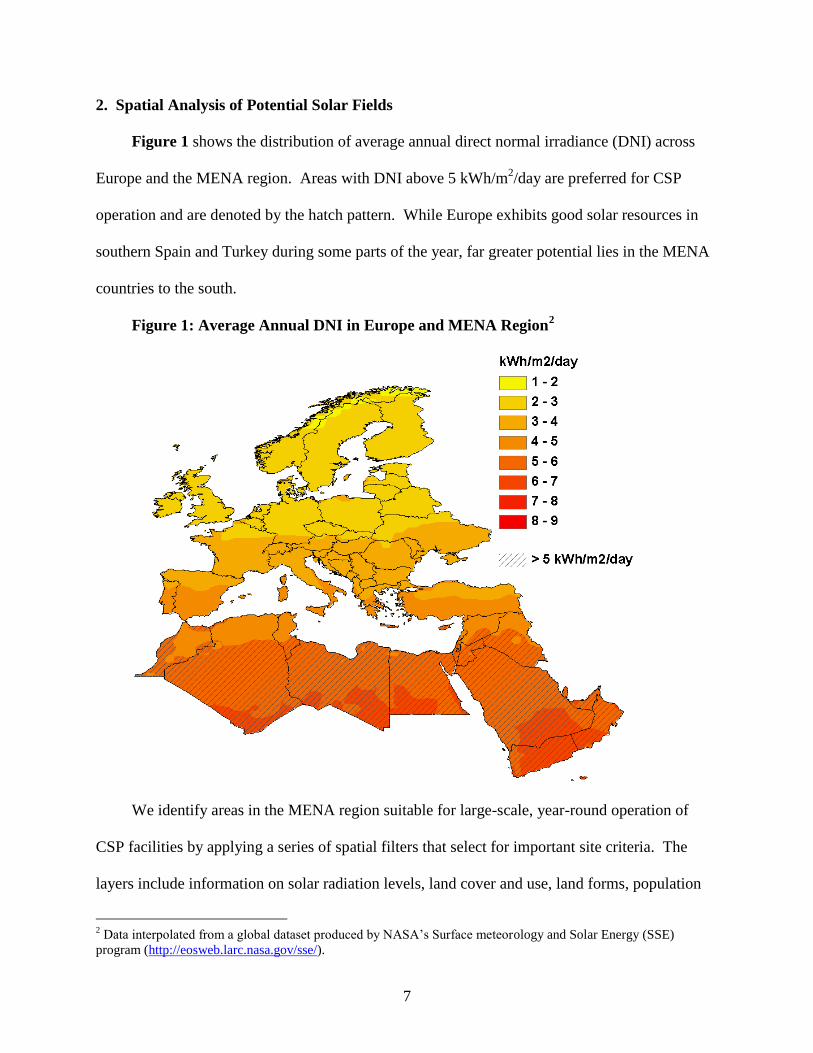
Figure 1 shows the distribution of average annual direct normal irradiance (DNI) across
Europe and the MENA region. Areas with DNI above 5 kWh/m2/day are preferred for CSP
operation and are denoted by the hatch pattern. While Europe exhibits good solar resources in
southern Spain and Turkey during some parts of the year, far greater potential lies in the MENA
countries to the south.
Figure 1: Average Annual DNI in Europe and MENA Region2
We identify areas in the MENA region suitable for large-scale, year-round operation of
CSP facilities by applying a series of spatial filters that select for important site criteria. The
layers include information on solar radiation levels, land cover and use, land forms, population
2 Data interpolated from a global dataset produced by NASA’s Surface meteorology and Solar Energy (SSE)
program (http://eosweb.larc.nasa.gov/sse/).
8
density, and location of water sources and protected areas. We combine the results with
information on the location of roads, as well as existing and potential transmission corridors, to
determine areas of likely lowest-cost deployment. Our methodology identifies five preferred
sites, based on their potential for domestic power supply and/or export of electricity to Europe.
High-resolution data on direct normal irradiance come from the Solar and Wind Energy
Resource Assessment (SWERA) of the United Nations Environment Programme.3 The dataset
contains monthly and annual average DNI at about 40-km (~22 arc-minute) resolution for Africa,
most of the Arabian Peninsula, and the Near East.4 We assume that CSP technologies require
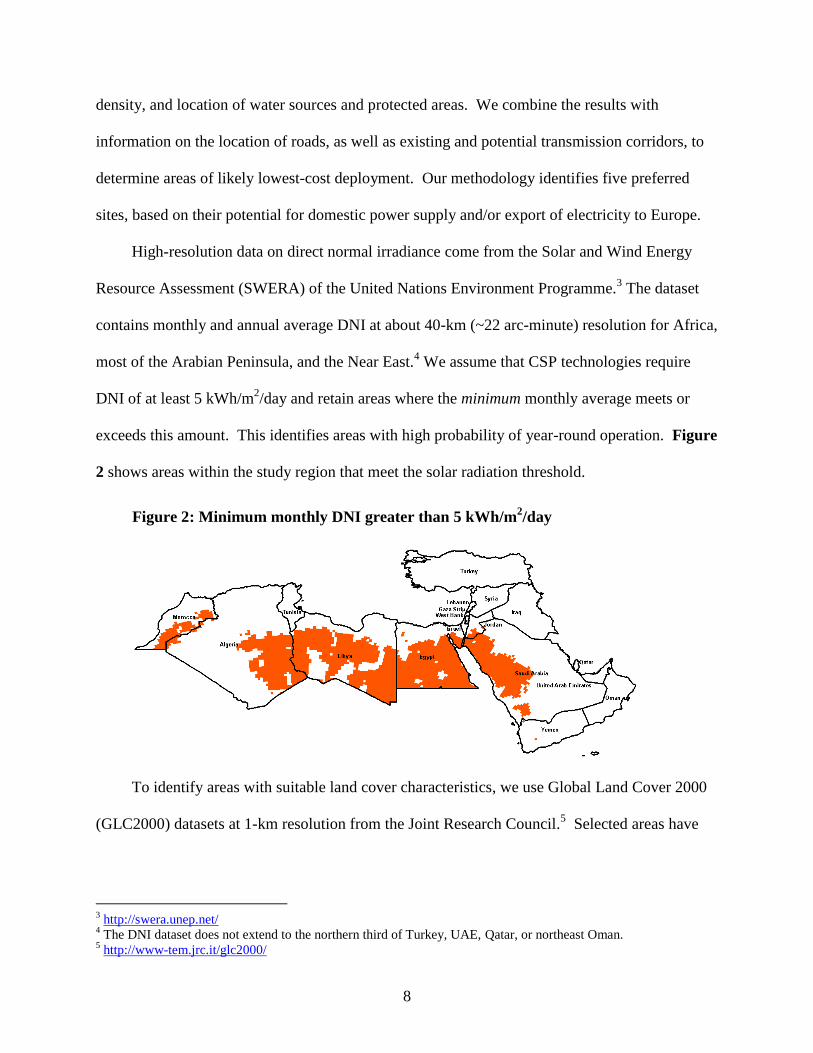
DNI of at least 5 kWh/m2/day and retain areas where the minimum monthly average meets or
exceeds this amount. This identifies areas with high probability of year-round operation. Figure
2 shows areas within the study region that meet the solar radiation threshold.
Figure 2: Minimum monthly DNI greater than 5 kWh/m2/day
To identify areas with suitable land cover characteristics, we use Global Land Cover 2000
(GLC2000) datasets at 1-km resolution from the Joint Research Council.5 Selected areas have
3 http://swera.unep.net/
4 The DNI dataset does not extend to the northern third of Turkey, UAE, Qatar, or northeast Oman.
5 http://www-tem.jrc.it/glc2000/
9
land cover classified as shrubland, grassland, gravel and stone, bare rock, stony desert, and
hardpan; this specifically excludes any cropland from consideration.
We also identify a range of unsuitable features. We use the Harmonized World Soil
Database to screen for shifting sand dunes and corrosive salt flats incompatible with heavy
construction. Oak Ridge National Laboratory’s 30 arc-second LandScan population database
enables us to identify inappropriate settled areas with population densities exceeding 100 persons
per square km.6 Data on inland bodies of water come from the 1992 Digital Chart of the World
compiled by the United States Defense Mapping Agency.7 Areas protected from development by
national law or international treaties are identified by the UNEP World Database on Protected
Areas.8 We apply a 4-km safety buffer to sand dunes and a 2-km buffer to all other unsuitable
features.
We identify sufficiently flat terrain using a slope database developed by the U.S.
Geological Survey for global landslide analysis and derived from high-resolution surface
elevation data retrieved by NASA’s Shuttle Radar Topography Mission (Verdin et al., 2007). To
ease computational requirements, we use mean slope values generated at 30-arc second
resolution instead of the original 3-arc second grid. We exclude from consideration areas that
exhibit an average slope greater than 2%.
Areas that are close to transportation infrastructure will have lower construction and
maintenance costs than more remote locales. We create a composite database of the MENA
regional road network by combining data from the International Steering Committee for Global
Mapping, the Digital Chart of the World, and a layer constructed from Michelin road maps by
6 http://www.ornl.gov/sci/landscan/index.html
7 http://biogeo.berkeley.edu/bgm/gdata.php
8 http://sea.unep-wcmc.org/wdbpa/
10
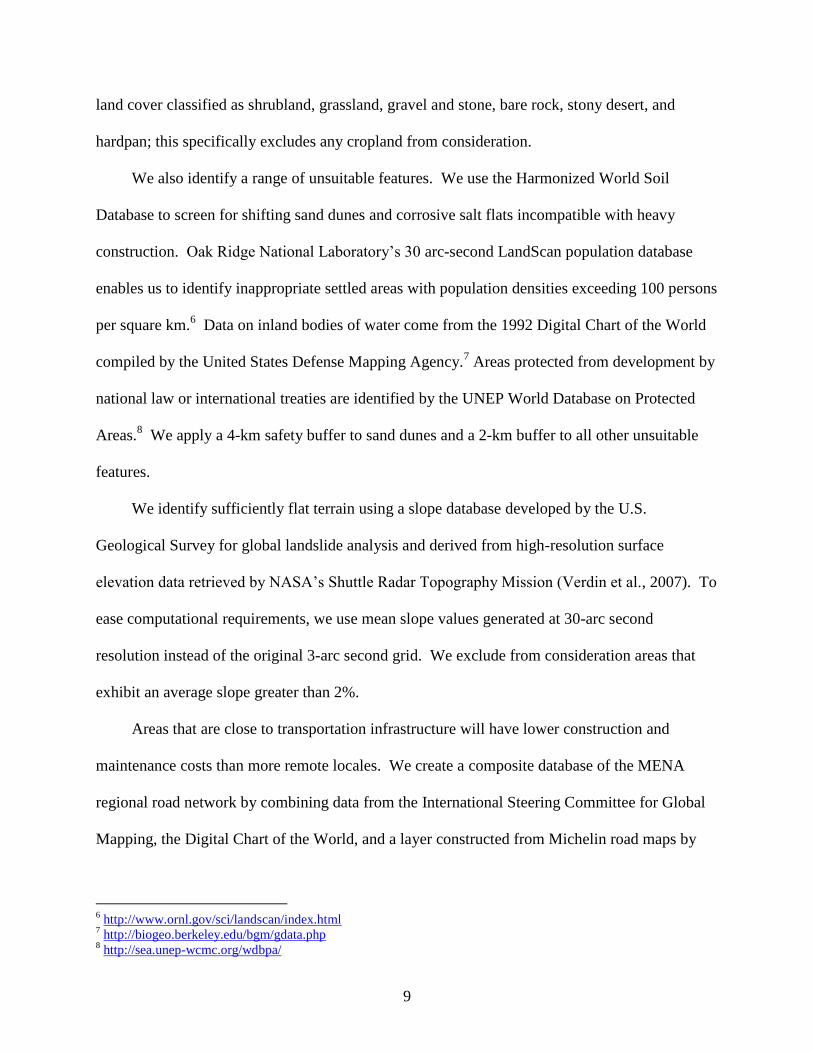
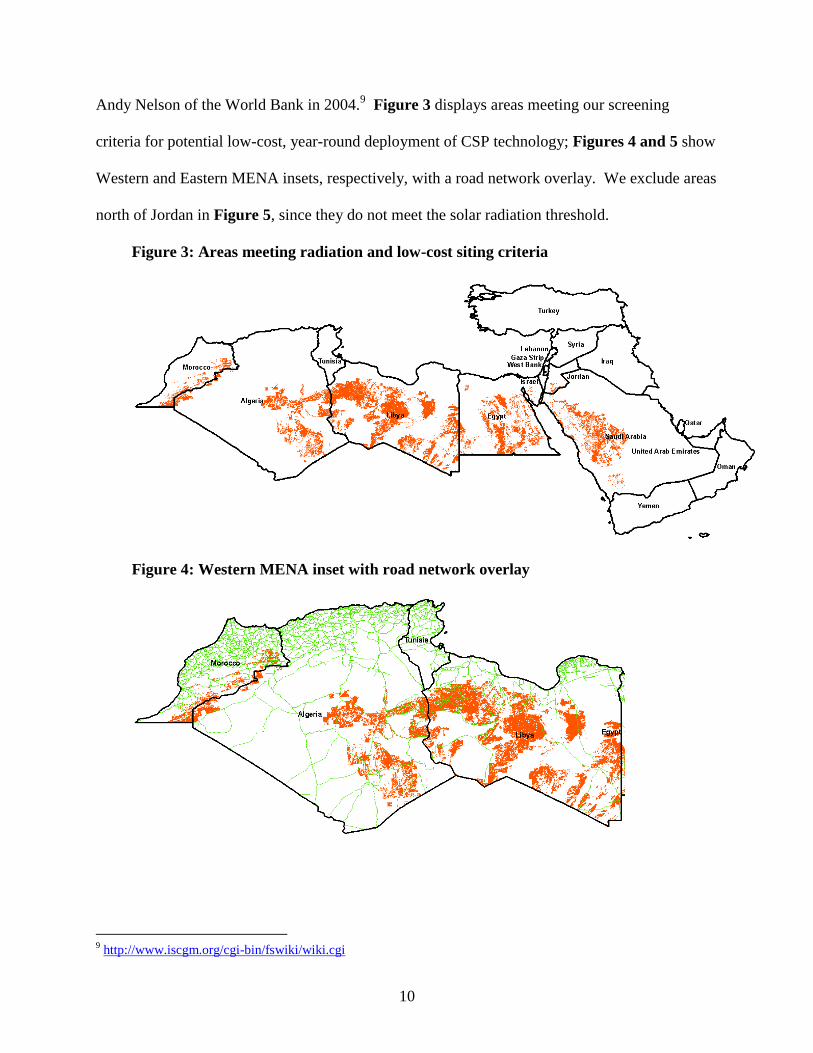
Andy Nelson of the World Bank in 2004.9 Figure 3 displays areas meeting our screening
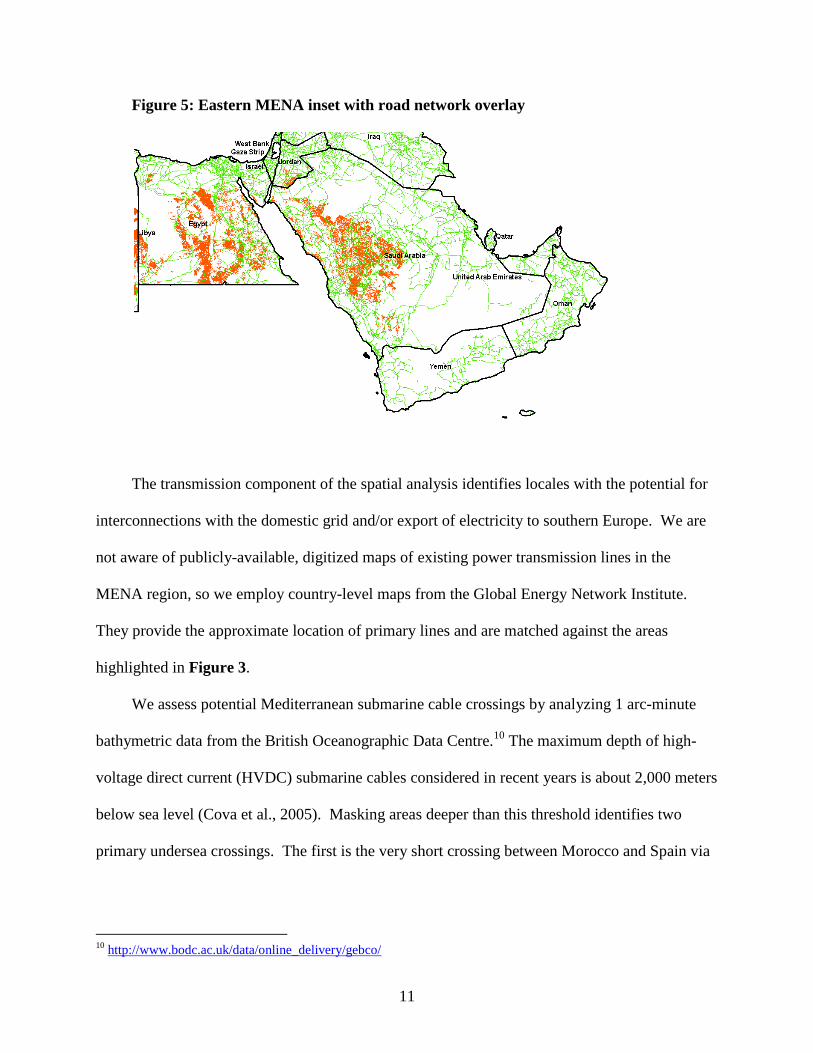
criteria for potential low-cost, year-round deployment of CSP technology; Figures 4 and 5 show
Western and Eastern MENA insets, respectively, with a road network overlay. We exclude areas
north of Jordan in Figure 5, since they do not meet the solar radiation threshold.
Figure 3: Areas meeting radiation and low-cost siting criteria
Figure 4: Western MENA inset with road network overlay
9 http://www.iscgm.org/cgi-bin/fswiki/wiki.cgi
11
Figure 5: Eastern MENA inset with road network overlay
The transmission component of the spatial analysis identifies locales with the potential for
interconnections with the domestic grid and/or export of electricity to southern Europe. We are
not aware of publicly-available, digitized maps of existing power transmission lines in the
MENA region, so we employ country-level maps from the Global Energy Network Institute.
They provide the approximate location of primary lines and are matched against the areas
highlighted in Figure 3.
We assess potential Mediterranean submarine cable crossings by analyzing 1 arc-minute
bathymetric data from the British Oceanographic Data Centre.10
The maximum depth of high-
voltage direct current (HVDC) submarine cables considered in recent years is about 2,000 meters
below sea level (Cova et al., 2005). Masking areas deeper than this threshold identifies two
primary undersea crossings. The first is the very short crossing between Morocco and Spain via
10
http://www.bodc.ac.uk/data/online_delivery/gebco/
12
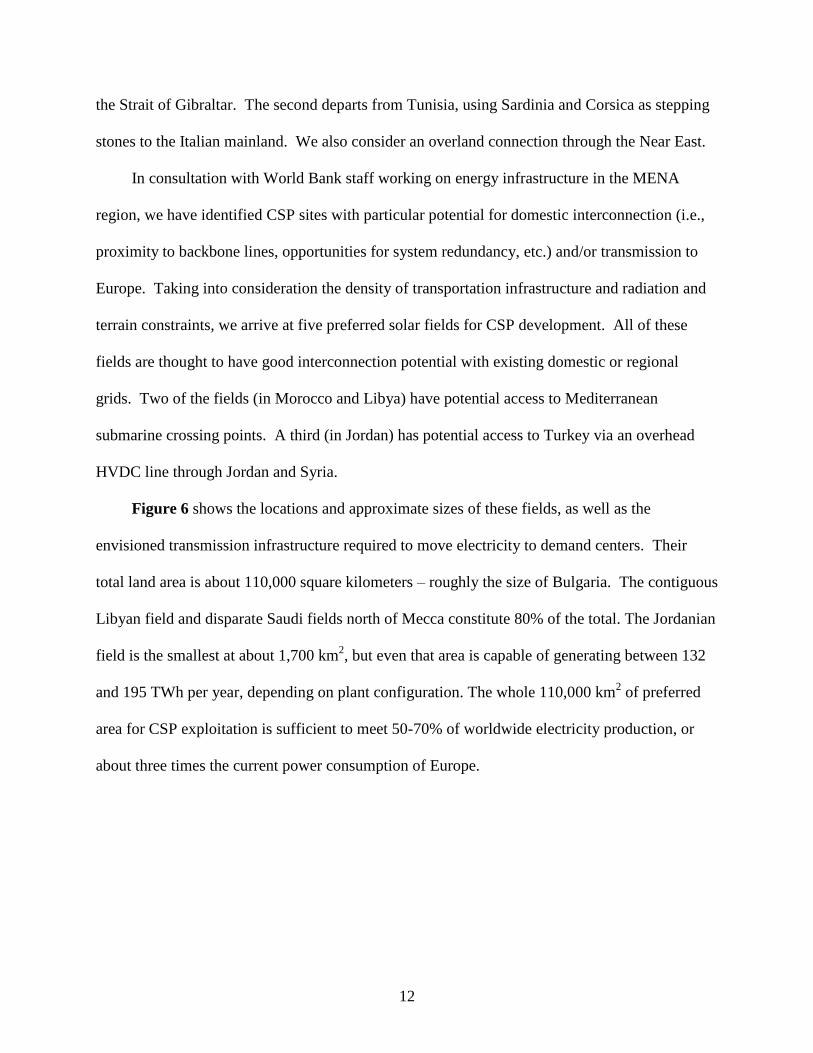
the Strait of Gibraltar. The second departs from Tunisia, using Sardinia and Corsica as stepping
stones to the Italian mainland. We also consider an overland connection through the Near East.
In consultation with World Bank staff working on energy infrastructure in the MENA
region, we have identified CSP sites with particular potential for domestic interconnection (i.e.,
proximity to backbone lines, opportunities for system redundancy, etc.) and/or transmission to
Europe. Taking into consideration the density of transportation infrastructure and radiation and
terrain constraints, we arrive at five preferred solar fields for CSP development. All of these
fields are thought to have good interconnection potential with existing domestic or regional
grids. Two of the fields (in Morocco and Libya) have potential access to Mediterranean
submarine crossing points. A third (in Jordan) has potential access to Turkey via an overhead
HVDC line through Jordan and Syria.
Figure 6 shows the locations and approximate sizes of these fields, as well as the
envisioned transmission infrastructure required to move electricity to demand centers. Their
total land area is about 110,000 square kilometers – roughly the size of Bulgaria. The contiguous
Libyan field and disparate Saudi fields north of Mecca constitute 80% of the total. The Jordanian
field is the smallest at about 1,700 km2, but even that area is capable of generating between 132
and 195 TWh per year, depending on plant configuration. The whole 110,000 km2 of preferred
area for CSP exploitation is sufficient to meet 50-70% of worldwide electricity production, or
about three times the current power consumption of Europe.
13
Figure 6: Location of Preferred Solar Fields and Transmission Corridors11
11
European transmission lines (green) are for illustration only. See May (2005) for description of preferred routing.
14
3. Power Generation and Transmission Infrastructure Costs
Assessing the comparative costs of power generation projects is difficult. Quoted prices
for materials and equipment (steel, cement, turbines, electric generators, etc.) can vary
considerably across countries and projects. The same is true for the cost of construction labor
and operational and maintenance personnel. Coal, oil, and gas differ in quality and cost, and
their future prices are difficult to predict. Full project costs, especially for renewable
technologies, are also influenced by the physical characteristics of project sites. In addition,
expected profitability, which determines whether or not a project is actually pursued, is affected
by electricity tariff structures, tax incentives, renewable portfolio standards, debt-to-equity ratios,
finance and insurance arrangements, capital cost schedules, investors’ expected returns, and,
importantly, expectations about regulation of greenhouse gas emissions.
We apply a simplified methodology that allows us to compare CSP to coal and gas power
plants, the primary alternatives in the MENA region and Europe. In this section, we develop
cost estimates for the relevant generation technologies and transmission systems. Later, we
embed these costs in a simple financial model to assess expected project profitability and
financing requirements.
3.1 Power Generation Costs
Direct generating cost data are generally not available for individual countries, so we must
estimate them using a range of other sources. We take recent capital cost data for coal and gas
plants from ESMAP (2008), which provides estimates for the United States and India as of
January 2008.12
We draw or estimate performance and technical specifications and operations
12
http://www.esmap.org/filez/pubs/724200833229_power_prices.pdf
15
and maintenance costs from extensive studies by NETL (2007),13
MIT (2007),14
and ESMAP
(2007).15
Estimated capital and operating costs for CSP plants come from our assessment of four
solar thermal plant proposals currently under review by the California Energy Commission,
ranging from 177 MW to 750 MW.16
The technologies employed include parabolic trough,
power tower, Stirling-dish, and compact linear Fresnel reflector (CLFR).
Since the preferable CSP technology may differ by locale and application, we use the
average expected performance and costs of the projects reviewed. The average reported capital
cost is $2.77 per watt. Since it is unclear whether the reported figures include project
contingencies, we increase this figure by 20% to arrive at an estimate of $3.32 per watt for U.S.
plants without thermal storage. We also assign a 20% markup to operating costs for process
contingencies.
Little information is available on the technical and economic parameters of solar thermal
storage, whereby excess heat generated during the day is used to run a plant’s power block at
night.17
We develop an estimate using two sources: the cost of saline storage for parabolic trough
CSP, as reported in NREL’s Solar Advisor Model;18
and modeling results for the storage
potential of compact linear Fresnel reflector CSP, which allow us to estimate the additional array
requirements for providing 24-hour power production (Mills and Morgan, 2008).19
13
http://www.netl.doe.gov/energy-analyses/baseline_studies.html 14
http://web.mit.edu/coal/ 15
http://www.esmap.org/filez/pubs/4172008104859_Mini_Grid_Electrification.pdf 16
http://www.energy.ca.gov/siting/solar/index.html 17
Conversations with CSP executives have elicited different opinions on the profitability of thermal storage for
nighttime power generation. Since the highest electricity tariffs will be offered during peak-use daylight hours when
most consumption occurs, the cost of storage must be low enough to remain profitable during off-peak hours. Since
MENA-to-Europe transmission is South-to-North, and there is strong temporal alignment of peak electricity
consumption and production, storage is unlikely to be a limiting factor for CSP in the short term. 18
https://www.nrel.gov/analysis/sam/ 19
Estimated requirements are based on solar multiples (SM): the ratios of energy produced to energy converted to
power during daylight hours. The higher the ratio, the greater the energy that can be stored for nighttime power
production. Mills and Morgan (2008) report a financially optimal solar multiple (SM) of 3 for 16-hour storage
configurations. Ausra Inc.’s planned Carrizo (California) CLFR plant without storage exhibits a solar multiple of
16
We adjust these figures to generate cost estimates for selected MENA and European
countries. We adjust coal and gas capital costs for the U.S. and India using comparative price
indices for gross fixed capital formation, which includes machinery and construction, for
MENA, European countries, the U.S., and India (ICP, 2008). In the case of CSP, we use
reported differences in labor construction wages, worker productivity, and steel, concrete, and
turbine prices between the United States and India as a starting point (ESMAP, 2008). Overall,
we estimate that CSP capital costs could be lower by 12% or more when construction occurs in
India instead of the United States. We then apply price index ratios to estimate how much of this
reduction should apply in the case of specific MENA countries.
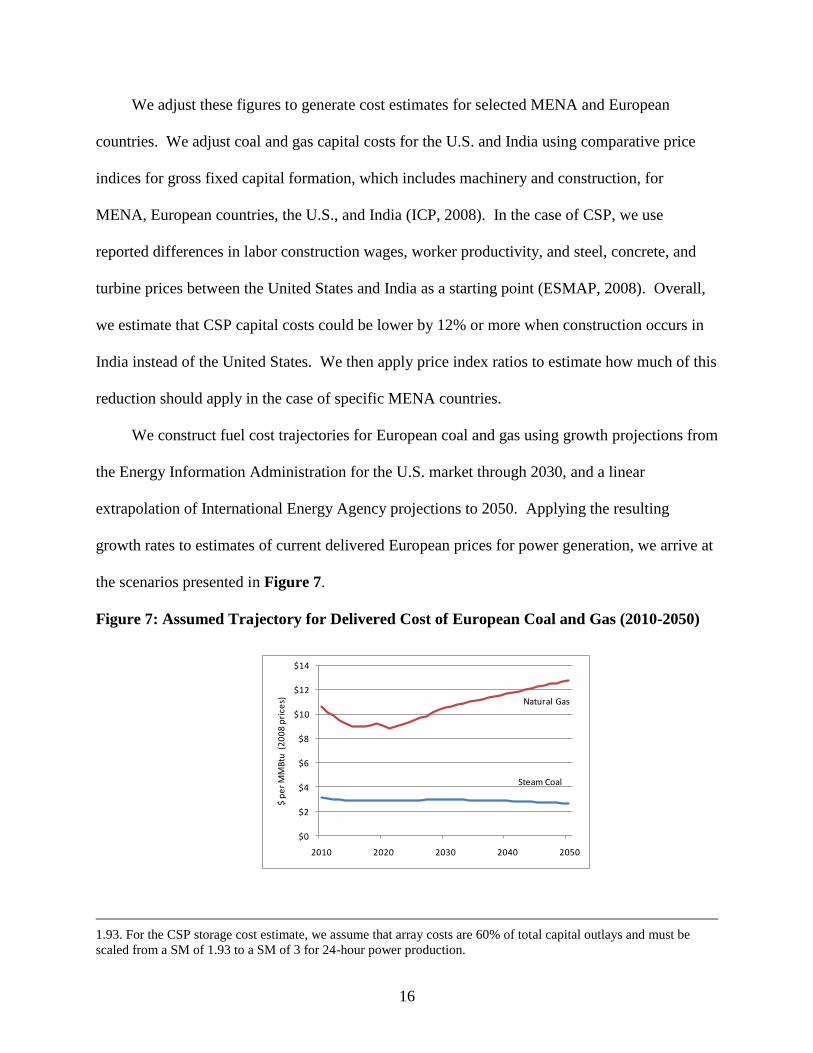
We construct fuel cost trajectories for European coal and gas using growth projections from
the Energy Information Administration for the U.S. market through 2030, and a linear
extrapolation of International Energy Agency projections to 2050. Applying the resulting
growth rates to estimates of current delivered European prices for power generation, we arrive at
the scenarios presented in Figure 7.
Figure 7: Assumed Trajectory for Delivered Cost of European Coal and Gas (2010-2050)
1.93. For the CSP storage cost estimate, we assume that array costs are 60% of total capital outlays and must be
scaled from a SM of 1.93 to a SM of 3 for 24-hour power production.
Steam Coal
Natural Gas
$0
$2
$4
$6
$8
$10
$12
$14
2010 2020 2030 2040 2050
$ p
er
MM
Btu
(2
00
8 p
rice
s)
17
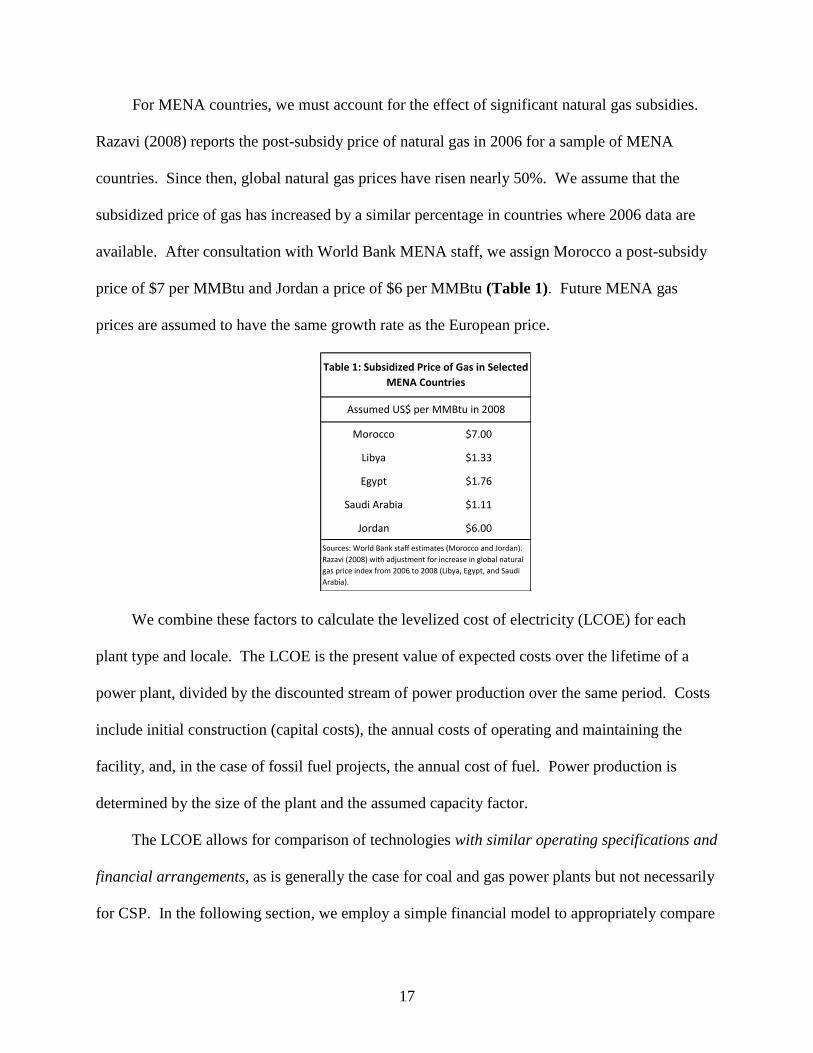
For MENA countries, we must account for the effect of significant natural gas subsidies.
Razavi (2008) reports the post-subsidy price of natural gas in 2006 for a sample of MENA
countries. Since then, global natural gas prices have risen nearly 50%. We assume that the
subsidized price of gas has increased by a similar percentage in countries where 2006 data are
available. After consultation with World Bank MENA staff, we assign Morocco a post-subsidy
price of $7 per MMBtu and Jordan a price of $6 per MMBtu (Table 1). Future MENA gas
prices are assumed to have the same growth rate as the European price.
We combine these factors to calculate the levelized cost of electricity (LCOE) for each
plant type and locale. The LCOE is the present value of expected costs over the lifetime of a
power plant, divided by the discounted stream of power production over the same period. Costs
include initial construction (capital costs), the annual costs of operating and maintaining the
facility, and, in the case of fossil fuel projects, the annual cost of fuel. Power production is
determined by the size of the plant and the assumed capacity factor.
The LCOE allows for comparison of technologies with similar operating specifications and
financial arrangements, as is generally the case for coal and gas power plants but not necessarily
for CSP. In the following section, we employ a simple financial model to appropriately compare
Morocco $7.00
Libya $1.33
Egypt $1.76
Saudi Arabia $1.11
Jordan $6.00
Sources: World Bank staff estimates (Morocco and Jordan).
Razavi (2008) with adjustment for increase in global natural
gas price index from 2006 to 2008 (Libya, Egypt, and Saudi
Arabia).
Table 1: Subsidized Price of Gas in Selected
MENA Countries
Assumed US$ per MMBtu in 2008
18
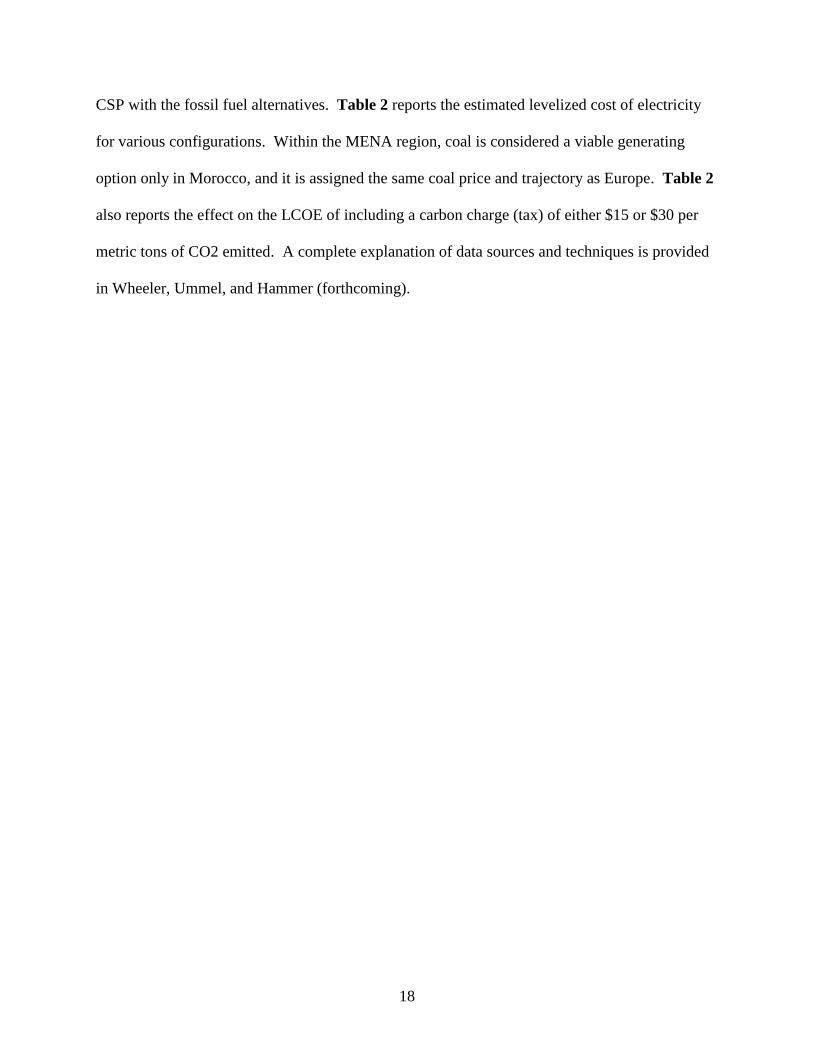
CSP with the fossil fuel alternatives. Table 2 reports the estimated levelized cost of electricity
for various configurations. Within the MENA region, coal is considered a viable generating
option only in Morocco, and it is assigned the same coal price and trajectory as Europe. Table 2
also reports the effect on the LCOE of including a carbon charge (tax) of either $15 or $30 per
metric tons of CO2 emitted. A complete explanation of data sources and techniques is provided
in Wheeler, Ummel, and Hammer (forthcoming).
19
No S
tora
ge
With
Sto
rage
Net c
apacity
(MW
)500
500
500
500
500
500
500
500
250
250
Capacity
facto
r80%
80%
80%
80%
80%
80%
80%
80%
26%
60%
Tota
l capita
l cost (m
illions)
$1,2
37
$922
$500
$415
$397
$386
$396
$393
$731-$
774
$1,3
47-$
1,4
26
Annual o
pera
tions a
nd m
ain
tenance (m
illions)
$36.6
$27.3
$11.5
$9.5
$9.1
$8.9
$9.1
$9.0
$7.9
-$8.3
$18.6
-$19.7
Avera
ge a
nnual fu
el c
osts
(millio
ns)
$92.6
$92.6
$238.3
$150.8
$28.7
$37.9
$23.9
$129.3
$0
$0
Annual C
O2 e
mis
sio
ns (k
iloto
ns)
2,8
70
2,8
70
1,2
51
1,2
51
1,2
51
1,2
51
1,2
51
1,2
51
00
Raw
wate
r usage (lite
rs p
er M
Wh)
2,4
72
2,4
72
1,1
41
1,1
41
1,1
41
1,1
41
1,1
41
1,1
41
70
70
Tota
l require
d la
nd (s
quare
km
)n/a
n/a
n/a
n/a
n/a
n/a
n/a
n/a
7.3
11.4
Leveliz
ed c
ost o
f ele
ctric
ity (c
ents
per k
Wh)
No c
arb
on c
harg
e8.4
7.1
9.8
6.4
2.5
2.7
2.3
5.6
15.8
- 16.7
12.8
- 13.6
Carb
on c
harg
e o
f $15 p
er to
n C
O2
9.6
8.3
10.3
6.9
3.0
3.3
2.9
6.1
15.8
- 16.7
12.8
- 13.6
Carb
on c
harg
e o
f $30 p
er to
n C
O2
10.8
9.5
10.9
7.4
3.6
3.8
3.4
6.7
15.8
- 16.7
12.8
- 13.6
Assum
ptio
ns: O
pera
tional life
of 3
0 y
ears
and d
iscount ra
te o
f 10%
in a
ll cases. C
onstru
ctio
n tim
e o
f thre
e y
ears
for c
oal a
nd g
as; tw
o y
ears
for C
SP. C
apita
l costs
assum
ed to
be s
pre
ad e
venly
over
constru
ctio
n p
erio
d, b
egin
nin
g in
2009. "A
vera
ge a
nnual fu
el c
osts
" is th
e p
resent d
olla
r avera
ge c
ost o
ver th
e life
time o
f the p
lant g
iven a
n a
ssum
ed fu
el p
rice tra
jecto
ry. N
atu
ral g
as c
osts
in M
EN
A c
ountrie
s
refe
r to th
e s
ubsid
ized c
ost o
f gas fo
r dom
estic
pow
er p
roducers
. Costs
for C
SP a
re a
vera
ge v
alu
es b
ased o
n a
uth
ors
' assessm
ent o
f a ra
nge o
f technolo
gie
s, in
clu
din
g to
wer, tro
ugh, S
tirling-d
ish, a
nd lin
ear
Fre
snel c
onfig
ura
tions. C
SP "s
tora
ge" c
onfig
ura
tion is
based o
n a
uth
ors
' rough c
ost a
nd p
erfo
rmance e
stim
ate
s fo
r 16-h
our s
alin
e th
erm
al s
tora
ge. S
ee th
e A
nnex fo
r more
deta
ils.
Euro
pe
Moro
cco
Lib
ya
Egypt
Jord
an
Tab
le 2
: Estim
ate
d L
eveliz
ed
Fin
an
cia
l Cost o
f
Ele
ctr
icity
for C
oal, N
atu
ral G
as, a
nd
CS
P
Gen
eratio
n
Su
percritic
al C
oal
Natu
ral G
as C
om
bin
ed
Cycle
Co
ncen
tratin
g S
ola
r P
ow
er
MEN
A C
ountrie
sSaudi
Ara
bia
Euro
pe
Moro
cco
20
3.2 Power Transmission Costs
We estimate costs for two transmission alternatives. The first is domestic (local)
transmission of electricity from the CSP project site to the closest preferred interconnection with
the existing in-country grid, using high-voltage alternating current (HVAC) lines. Based on
recent construction of such systems in the region and conversations with World Bank staff, we
estimate a cost of $200,000 per km and about $20 million total for two substations on either side
of the line. Losses are assumed to be 12% per 1,000 km and 0.2% per station (DLR, 2006).
For export of power to Europe, we estimate the cost of high-voltage direct current (HVDC)
transmission from the CSP project site to one of three locations on the European mainland.
Using the sea-floor depth analysis described in Section 2 and previous GIS modeling of
environmentally- and technically-preferable transmission corridors from North Africa to Europe,
we calculate the costs for three representative routes (May, 2005). The Moroccan solar site
connects via an overland line to the Strait of Gibraltar, where it makes a submarine cable
crossing, and continues overland to Madrid. The Libyan site connects via an overland line
through Libya and Tunisia, then undersea and overland through Sardinia and Corsica to the
Italian mainland, terminating in Milan. The Jordanian site connects via an exclusively overhead
line traveling through Jordan and Syria and terminating in Ankara, Turkey.
The HVDC transmission routes require the construction of AC-DC converter stations on
both ends of HVDC lines/cables. The assumed cost is $250 million per station, based on
reported expected costs by the Saudi Electricity Company (SEC) for ongoing transmission
projects. Overhead bi-pole HVDC lines are assumed to cost $280,000 per km by the SEC; the
cost of submarine cable is assumed to be five times the cost of overhead line. Power losses are
set to 6% per 1,000 km for overhead line, 3.3% per 1,000 km for submarine cable, and 0.7% per
21
converter station (May, 2005; DLR, 2006). In the case of both AC and DC transmission, annual
operation and maintenance costs are specified as 2% of the total project capital cost (ESMAP,
2007).
For AC configurations, we assume a bi-pole line with a power rating of 500 MW and
voltage of +/- 400 kV. The HVDC specification includes a power rating of 3,000 MW and a
voltage of +/- 500 kV. We assume that initial domestic transmission will be at smaller scale,
while the decision to construct a line for dedicated export will necessitate a considerably larger
power rating.20
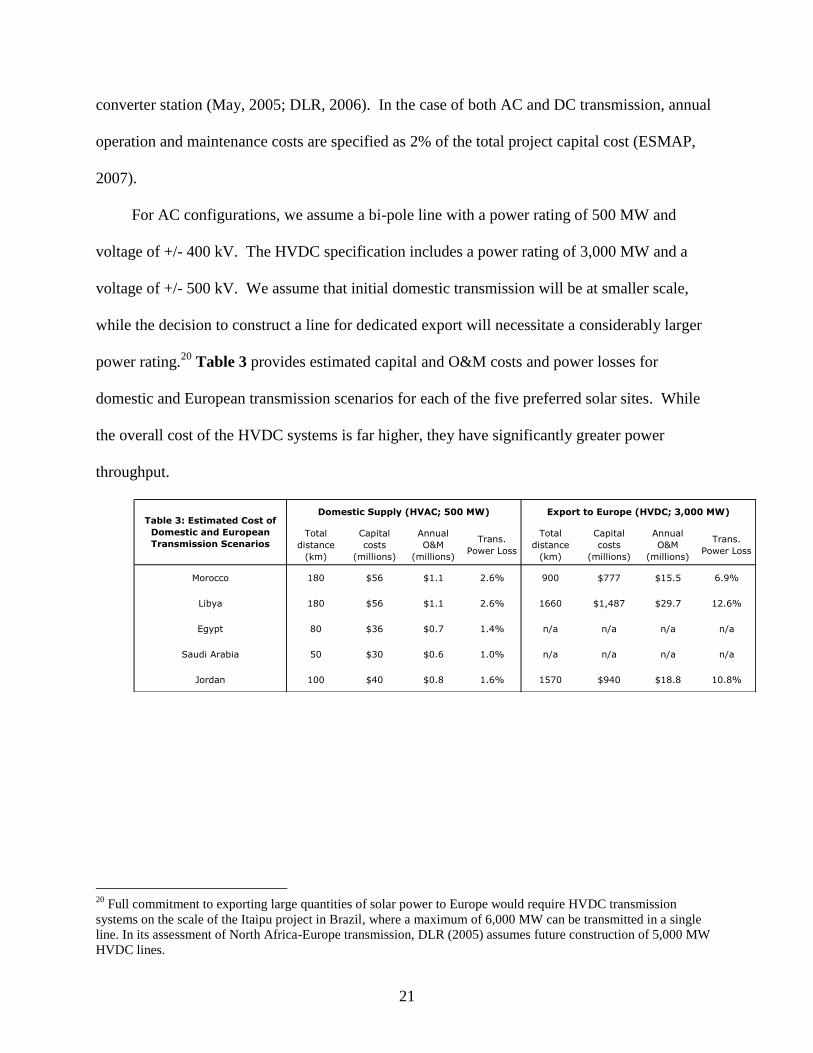
Table 3 provides estimated capital and O&M costs and power losses for
domestic and European transmission scenarios for each of the five preferred solar sites. While
the overall cost of the HVDC systems is far higher, they have significantly greater power
throughput.
20
Full commitment to exporting large quantities of solar power to Europe would require HVDC transmission
systems on the scale of the Itaipu project in Brazil, where a maximum of 6,000 MW can be transmitted in a single
line. In its assessment of North Africa-Europe transmission, DLR (2005) assumes future construction of 5,000 MW
HVDC lines.
Total
distance
(km)
Capital
costs
(millions)
Annual
O&M
(millions)
Trans.
Power Loss
Total
distance
(km)
Capital
costs
(millions)
Annual
O&M
(millions)
Trans.
Power Loss
Morocco 180 $56 $1.1 2.6% 900 $777 $15.5 6.9%
Libya 180 $56 $1.1 2.6% 1660 $1,487 $29.7 12.6%
Egypt 80 $36 $0.7 1.4% n/a n/a n/a n/a
Saudi Arabia 50 $30 $0.6 1.0% n/a n/a n/a n/a
Jordan 100 $40 $0.8 1.6% 1570 $940 $18.8 10.8%
Table 3: Estimated Cost of
Domestic and European
Transmission Scenarios
Domestic Supply (HVAC; 500 MW) Export to Europe (HVDC; 3,000 MW)
22
4. Assessing the Profitability of CSP and Fossil Fuel Alternatives
A key difference between CSP and fossil-fueled power plants is the temporal distribution
of costs. While CSP facilities face higher upfront capital costs, their fuel source (sunlight) is
free. Thermal power plants, on the other hand, typically have lower initial costs but incur annual
fuel costs for the life of the plant. As a result, CSP and fossil fuel projects necessarily pursue
different financing arrangements.
Another important distinction is the nature and timing of power production. CSP facilities
without thermal storage only produce power during daylight hours, while fossil-fueled plants can
operate continuously. Since electricity prices are often higher during the day than at night, CSP
and fossil-fueled plants will typically receive different revenues per unit of electricity delivered
to the grid.
Given these factors, the LCOE will not necessarily provide a suitable means of comparing
CSP project feasibility with fossil fuel alternatives. Appropriate evaluation should be based on
expected profitability. As we mentioned earlier, numerous factors can influence the financial
prospects of a project. Our approach to assessing profitability uses a simple financial model that
takes into account the capital and operating costs for both generation and transmission
infrastructure (detailed in Section 3), as well as key financial variables: the price of electricity,
debt-to-equity ratio, interest rate on debt, corporate income tax rate, and potential subsidies. We
also make adjustments for expected transmission and distribution losses.
Two financial measures are of particular interest. With respect to debt, lenders will only
provide credit if the expected cash flow is sufficient to cover annual debt service payments
(interest and principle) plus a risk premium. The ratio of expected post-tax revenue to annual
debt service (the “annual debt service coverage ratio” (ADSCR)) is typically used to determine
23
whether a loan is sound. Lenders have historically required an ADSCR between 1.2 and 1.5,
depending on project risk and other factors (Kistner and Price, 1999).
For equity stakeholders, the expected internal rate of return (IRR) is the primary means of
determining whether a project is worthy of investment. The IRR is the interest rate required to
set the net present value of an investor’s cash flow (revenues minus expenditures) to zero. The
expected IRR provides a means of comparing the overall profitability of competing power
generation projects (or other investment opportunities) where the LCOE is insufficient.
Generating these metrics requires an estimated revenue stream for each plant configuration.
The retail price of electricity will differ depending on the sale location and (potentially) time of
day. Using information on representative consumers in Spain, Italy, and Morocco, we estimate
the share of nighttime or “off-peak” consumption for both residential and industrial uses
(Eurolectric, 2007). These data also provide the tax component of retail electricity prices and
allow us to deduce differences in prices between daytime and nighttime residential
consumption.21
Combining data on country-specific retail electricity tariffs (World Bank,
forthcoming) and the proportion of total consumption accruing to industry (IEA, 2007), we
estimate average “daytime” and “nighttime” revenue per kWh for southern Europe and each of
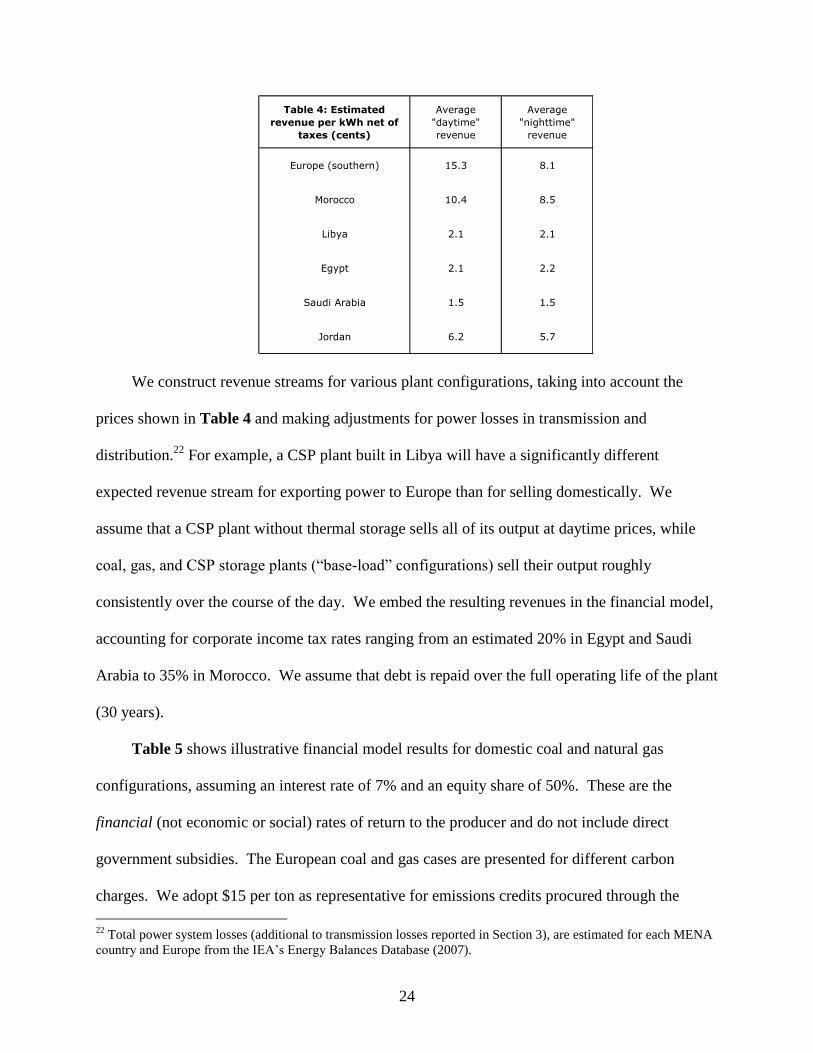
the selected MENA domestic markets (Table 4). Fuel and production subsidies keep tariffs very
low in Libya, Egypt, and Saudi Arabia. Of particular relevance to CSP profitability is the
difference between daytime and nighttime prices. While MENA countries exhibit little diurnal
variation, it is significant in Europe, where time-of-use tariff structures are common.
21
The tax component is typically 20% of the retail price in southern Europe and 14% in Morocco. We assume that
the tax share is negligible in other MENA countries.
24
We construct revenue streams for various plant configurations, taking into account the
prices shown in Table 4 and making adjustments for power losses in transmission and
distribution.22
For example, a CSP plant built in Libya will have a significantly different
expected revenue stream for exporting power to Europe than for selling domestically. We
assume that a CSP plant without thermal storage sells all of its output at daytime prices, while
coal, gas, and CSP storage plants (“base-load” configurations) sell their output roughly
consistently over the course of the day. We embed the resulting revenues in the financial model,
accounting for corporate income tax rates ranging from an estimated 20% in Egypt and Saudi
Arabia to 35% in Morocco. We assume that debt is repaid over the full operating life of the plant
(30 years).
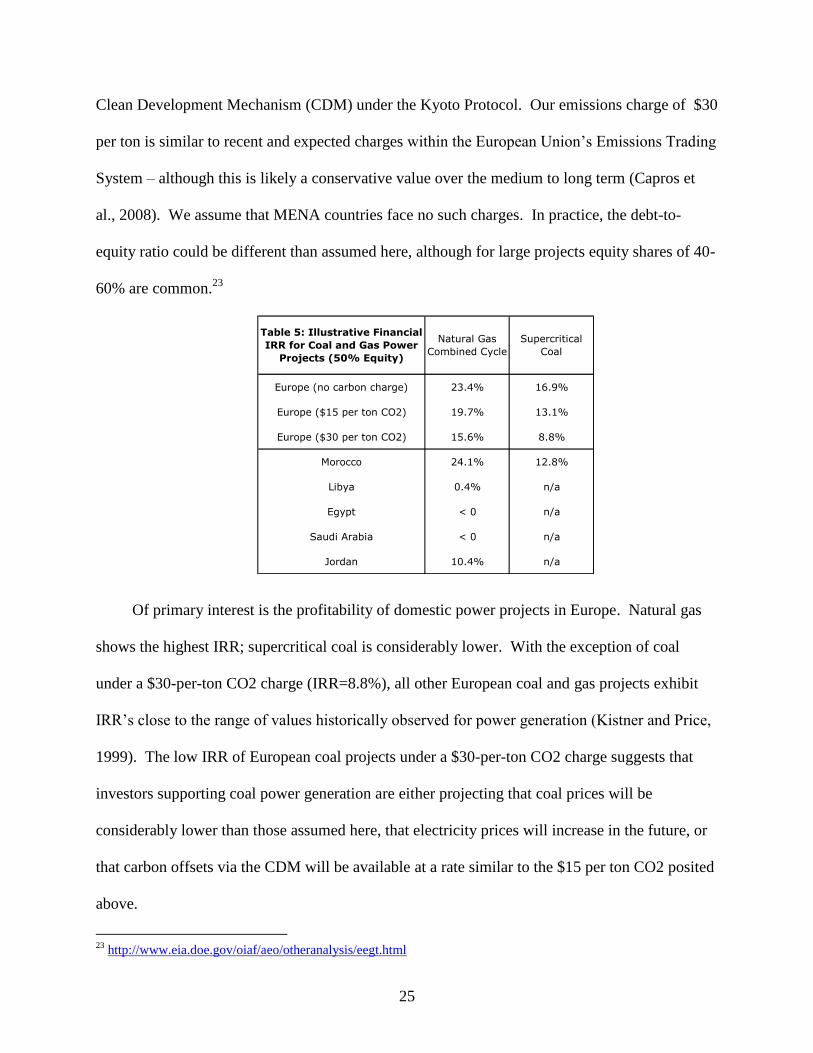
Table 5 shows illustrative financial model results for domestic coal and natural gas
configurations, assuming an interest rate of 7% and an equity share of 50%. These are the
financial (not economic or social) rates of return to the producer and do not include direct
government subsidies. The European coal and gas cases are presented for different carbon
charges. We adopt $15 per ton as representative for emissions credits procured through the
22
Total power system losses (additional to transmission losses reported in Section 3), are estimated for each MENA
country and Europe from the IEA’s Energy Balances Database (2007).
Table 4: Estimated
revenue per kWh net of
taxes (cents)
Average
"daytime"
revenue
Average
"nighttime"
revenue
Europe (southern) 15.3 8.1
Morocco 10.4 8.5
Libya 2.1 2.1
Egypt 2.1 2.2
Saudi Arabia 1.5 1.5
Jordan 6.2 5.7
25
Clean Development Mechanism (CDM) under the Kyoto Protocol. Our emissions charge of $30
per ton is similar to recent and expected charges within the European Union’s Emissions Trading
System – although this is likely a conservative value over the medium to long term (Capros et
al., 2008). We assume that MENA countries face no such charges. In practice, the debt-to-
equity ratio could be different than assumed here, although for large projects equity shares of 40-
60% are common.23
Of primary interest is the profitability of domestic power projects in Europe. Natural gas
shows the highest IRR; supercritical coal is considerably lower. With the exception of coal
under a $30-per-ton CO2 charge (IRR=8.8%), all other European coal and gas projects exhibit
IRR’s close to the range of values historically observed for power generation (Kistner and Price,
1999). The low IRR of European coal projects under a $30-per-ton CO2 charge suggests that
investors supporting coal power generation are either projecting that coal prices will be
considerably lower than those assumed here, that electricity prices will increase in the future, or
that carbon offsets via the CDM will be available at a rate similar to the $15 per ton CO2 posited
above.
23
http://www.eia.doe.gov/oiaf/aeo/otheranalysis/eegt.html
Europe (no carbon charge) 23.4% 16.9%
Europe ($15 per ton CO2) 19.7% 13.1%
Europe ($30 per ton CO2) 15.6% 8.8%
Morocco 24.1% 12.8%
Libya 0.4% n/a
Egypt < 0 n/a
Saudi Arabia < 0 n/a
Jordan 10.4% n/a
Table 5: Illustrative Financial
IRR for Coal and Gas Power
Projects (50% Equity)
Natural Gas
Combined Cycle
Supercritical
Coal
26
The financial return to natural gas generation varies across MENA countries, from a robust
24% in Morocco to actual losses in Saudi Arabia and Egypt. Since the financial model does not
include direct subsidies to producers – some of which could be public power generators
operating at zero or very low profit – the latter result is not surprising.
For CSP configurations, we fold the cost of transmission into the plant-level financial
model. We assume that the plant bears the capital and operating costs of its share of the
transmission system capacity.24
Although in practice the generation and transmission
components would likely be financed separately and owned and operated by different actors, we
combine them here for the purposes of comparing the overall profitability of CSP, which
requires additional transmission infrastructure, to the fossil fuel alternatives.
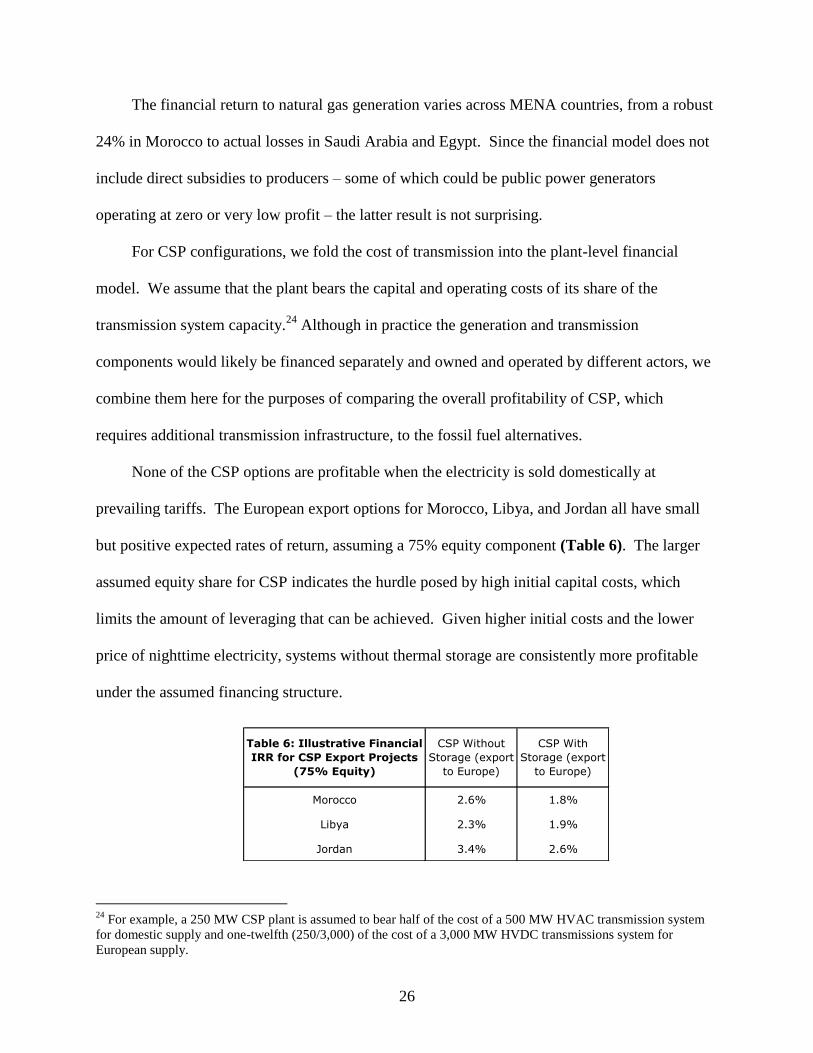
None of the CSP options are profitable when the electricity is sold domestically at
prevailing tariffs. The European export options for Morocco, Libya, and Jordan all have small
but positive expected rates of return, assuming a 75% equity component (Table 6). The larger
assumed equity share for CSP indicates the hurdle posed by high initial capital costs, which
limits the amount of leveraging that can be achieved. Given higher initial costs and the lower
price of nighttime electricity, systems without thermal storage are consistently more profitable
under the assumed financing structure.
24
For example, a 250 MW CSP plant is assumed to bear half of the cost of a 500 MW HVAC transmission system
for domestic supply and one-twelfth (250/3,000) of the cost of a 3,000 MW HVDC transmissions system for
European supply.
Morocco 2.6% 1.8%
Libya 2.3% 1.9%
Jordan 3.4% 2.6%
Table 6: Illustrative Financial
IRR for CSP Export Projects
(75% Equity)
CSP Without
Storage (export
to Europe)
CSP With
Storage (export
to Europe)
27
5. Static Analysis of Grants Required for Initial CSP Project Competitiveness
Numerous public-sector interventions could shift the IRR of CSP projects toward parity
with the fossil fuel alternatives. We focus primarily on the use of upfront or recurring grants
(subsidies) and simply note that concessionary lending or loan guarantees can be thought of as
implicit grants over time. The analytical question is: What grant is required to bring the IRR of
CSP generation to equality with fossil fuel alternatives? We assess this question for electricity
exports to Europe, and for domestic use of CSP within MENA countries.
5.1 Export of Electricity to Europe
For any of the three MENA export options (from Morocco, Libya, or Jordan), we assume
that the investor alternative is coal or gas power in Europe. We take the lowest applicable IRR
to be 13.1% (coal power under a $15-per-ton CO2 charge) and calculate the minimum subsidy
required to bring CSP up to this level. The upfront subsidy is calculated both with and without
the aid of annual CDM financing. Under the CDM scenario, we assume that the CSP project
receives an annual payment of $15 per ton CO2 averted, where coal is the fuel source being
displaced.25
The total subsidy also depends on the debt-to-equity ratio for capital costs not
covered by the grant, with greater leveraging (more debt, lower equity) increasing the rate of
return to equity as long as the financing structure also ensures an ADSCR of 1.5 or higher. We
assume a 7% interest rate.
Figure 8 shows the relationship between the required subsidy and the project equity
component for CSP configurations without thermal storage. Results are shown both with and
25
We recognize that this does not comply with traditional use of the Clean Development Mechanism, where the
project’s output and counterfactual “baseline” are both limited to the developing country in question, and may not be
allowable under existing rules. In our view, which is line with Stern (2008), the scenario we describe should be
allowable, enabling a European coal plant to purchase carbon offsets by financing a CSP project in Morocco (for
example) that will export electricity to Europe. Since the Moroccan government benefits through additional tax
revenue, it can be argued that the “development” component of the CDM remains intact.
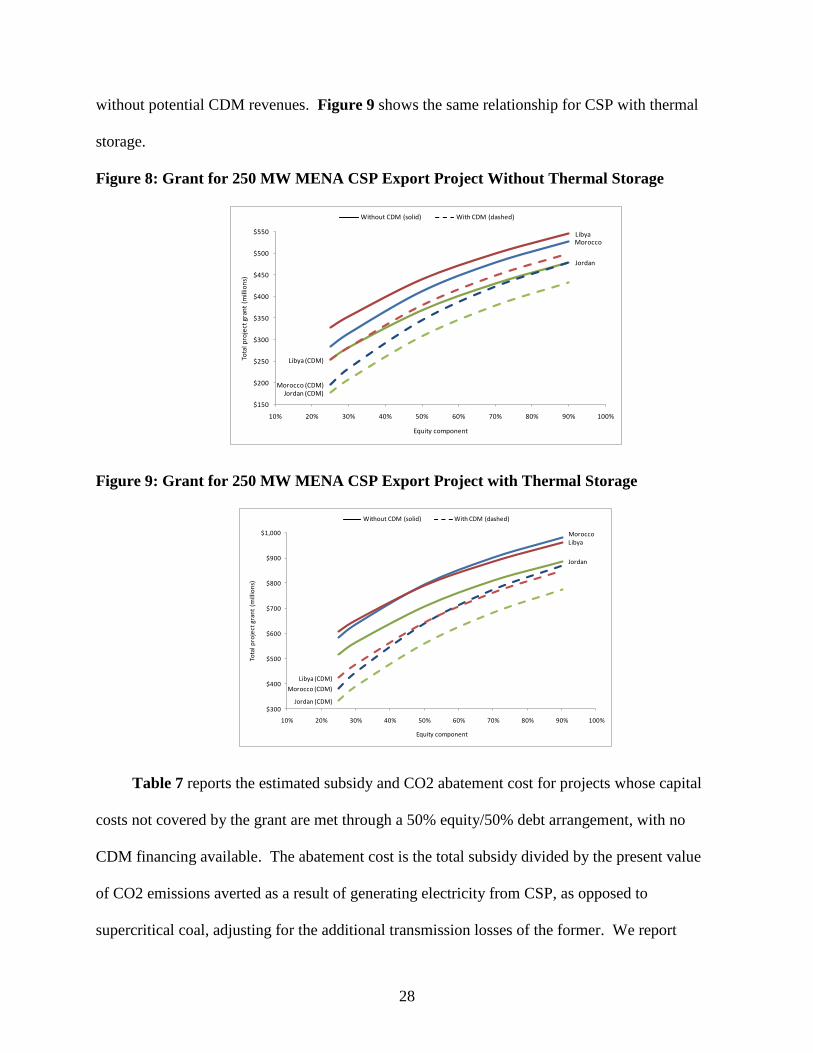
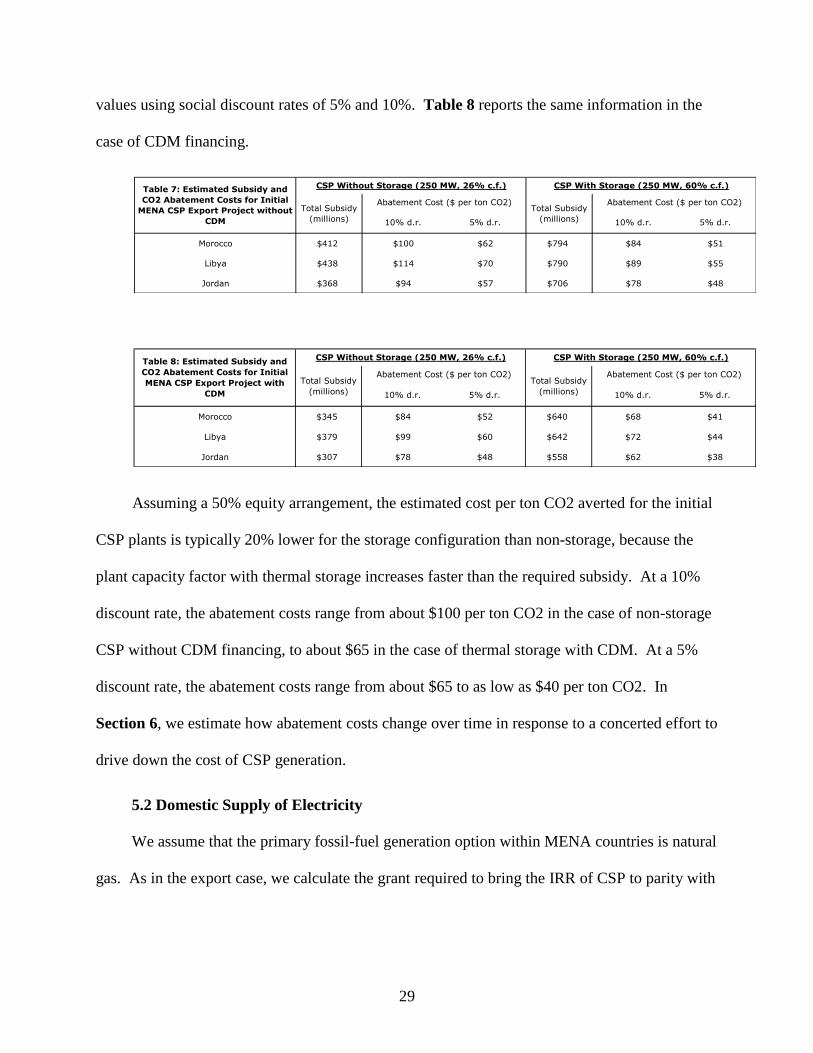
28
without potential CDM revenues. Figure 9 shows the same relationship for CSP with thermal
storage.
Figure 8: Grant for 250 MW MENA CSP Export Project Without Thermal Storage
Figure 9: Grant for 250 MW MENA CSP Export Project with Thermal Storage
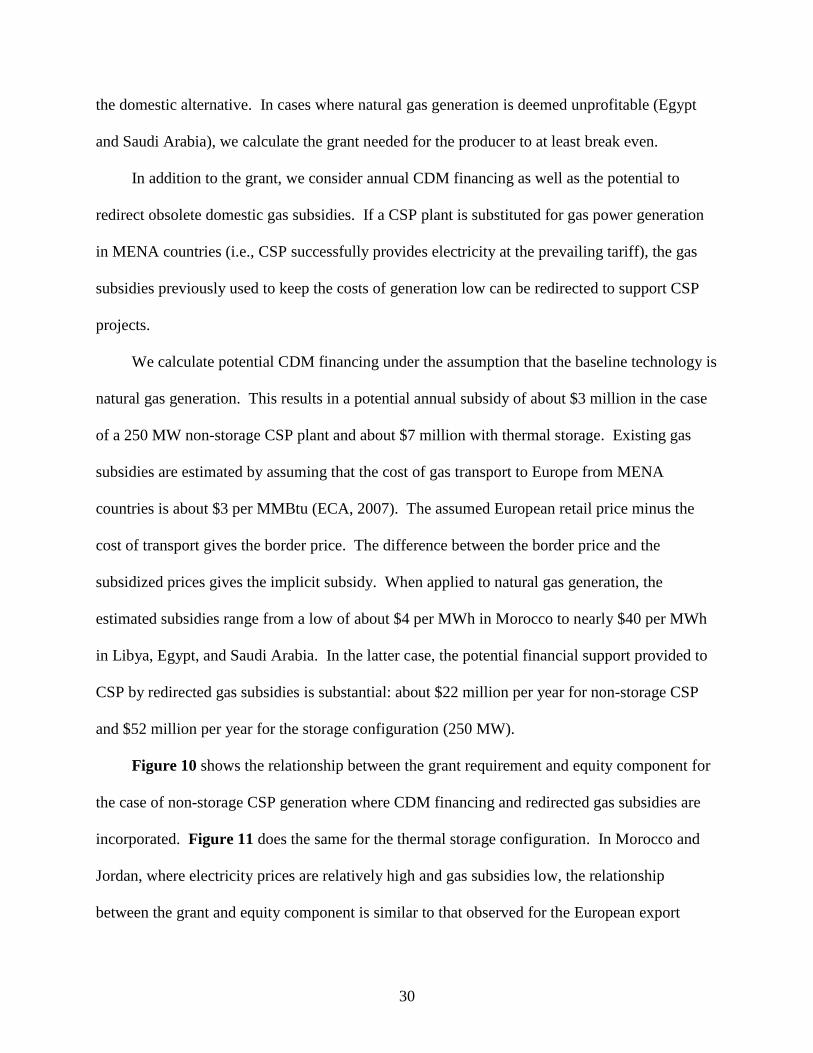
Table 7 reports the estimated subsidy and CO2 abatement cost for projects whose capital
costs not covered by the grant are met through a 50% equity/50% debt arrangement, with no
CDM financing available. The abatement cost is the total subsidy divided by the present value
of CO2 emissions averted as a result of generating electricity from CSP, as opposed to
supercritical coal, adjusting for the additional transmission losses of the former. We report
MoroccoLibya
Jordan
Morocco (CDM)
Libya (CDM)
Jordan (CDM)
$150
$200
$250
$300
$350
$400
$450
$500
$550
10% 20% 30% 40% 50% 60% 70% 80% 90% 100%
Tota
l pro
ject
gra
nt
(mill
ion
s)
Equity component
Without CDM (solid) With CDM (dashed)
MoroccoLibya
Jordan
Morocco (CDM)
Libya (CDM)
Jordan (CDM)$300
$400
$500
$600
$700
$800
$900
$1,000
10% 20% 30% 40% 50% 60% 70% 80% 90% 100%
Tota
l pro
ject
gra
nt
(mill
ion
s)
Equity component
Without CDM (solid) With CDM (dashed)
29
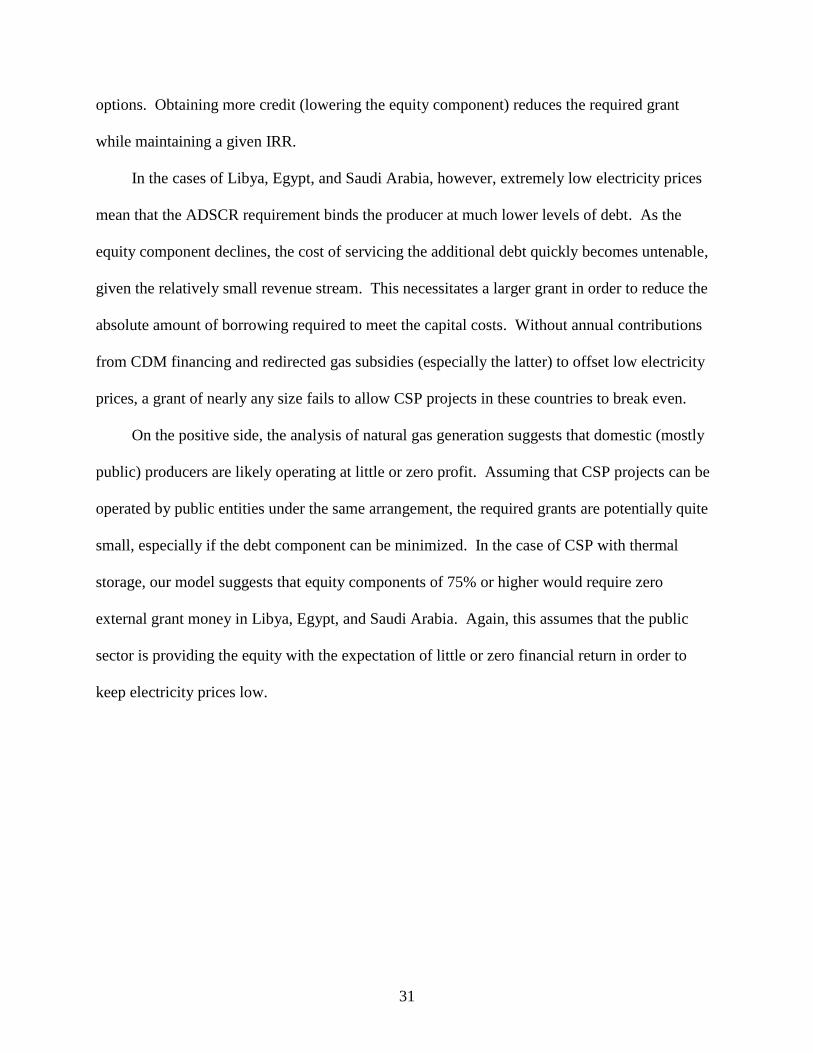
values using social discount rates of 5% and 10%. Table 8 reports the same information in the
case of CDM financing.
Assuming a 50% equity arrangement, the estimated cost per ton CO2 averted for the initial
CSP plants is typically 20% lower for the storage configuration than non-storage, because the
plant capacity factor with thermal storage increases faster than the required subsidy. At a 10%
discount rate, the abatement costs range from about $100 per ton CO2 in the case of non-storage
CSP without CDM financing, to about $65 in the case of thermal storage with CDM. At a 5%
discount rate, the abatement costs range from about $65 to as low as $40 per ton CO2. In
Section 6, we estimate how abatement costs change over time in response to a concerted effort to
drive down the cost of CSP generation.
5.2 Domestic Supply of Electricity
We assume that the primary fossil-fuel generation option within MENA countries is natural
gas. As in the export case, we calculate the grant required to bring the IRR of CSP to parity with
10% d.r. 5% d.r. 10% d.r. 5% d.r.
Morocco $412 $100 $62 $794 $84 $51
Libya $438 $114 $70 $790 $89 $55
Jordan $368 $94 $57 $706 $78 $48
CSP Without Storage (250 MW, 26% c.f.)
Abatement Cost ($ per ton CO2)
Table 7: Estimated Subsidy and
CO2 Abatement Costs for Initial
MENA CSP Export Project without
CDM
Abatement Cost ($ per ton CO2)
CSP With Storage (250 MW, 60% c.f.)
Total Subsidy
(millions)
Total Subsidy
(millions)
10% d.r. 5% d.r. 10% d.r. 5% d.r.
Morocco $345 $84 $52 $640 $68 $41
Libya $379 $99 $60 $642 $72 $44
Jordan $307 $78 $48 $558 $62 $38
Table 8: Estimated Subsidy and
CO2 Abatement Costs for Initial
MENA CSP Export Project with
CDM
CSP Without Storage (250 MW, 26% c.f.) CSP With Storage (250 MW, 60% c.f.)
Total Subsidy
(millions)
Abatement Cost ($ per ton CO2)Total Subsidy
(millions)
Abatement Cost ($ per ton CO2)
30
the domestic alternative. In cases where natural gas generation is deemed unprofitable (Egypt
and Saudi Arabia), we calculate the grant needed for the producer to at least break even.
In addition to the grant, we consider annual CDM financing as well as the potential to
redirect obsolete domestic gas subsidies. If a CSP plant is substituted for gas power generation
in MENA countries (i.e., CSP successfully provides electricity at the prevailing tariff), the gas
subsidies previously used to keep the costs of generation low can be redirected to support CSP
projects.
We calculate potential CDM financing under the assumption that the baseline technology is
natural gas generation. This results in a potential annual subsidy of about $3 million in the case
of a 250 MW non-storage CSP plant and about $7 million with thermal storage. Existing gas
subsidies are estimated by assuming that the cost of gas transport to Europe from MENA
countries is about $3 per MMBtu (ECA, 2007). The assumed European retail price minus the
cost of transport gives the border price. The difference between the border price and the
subsidized prices gives the implicit subsidy. When applied to natural gas generation, the
estimated subsidies range from a low of about $4 per MWh in Morocco to nearly $40 per MWh
in Libya, Egypt, and Saudi Arabia. In the latter case, the potential financial support provided to
CSP by redirected gas subsidies is substantial: about $22 million per year for non-storage CSP
and $52 million per year for the storage configuration (250 MW).
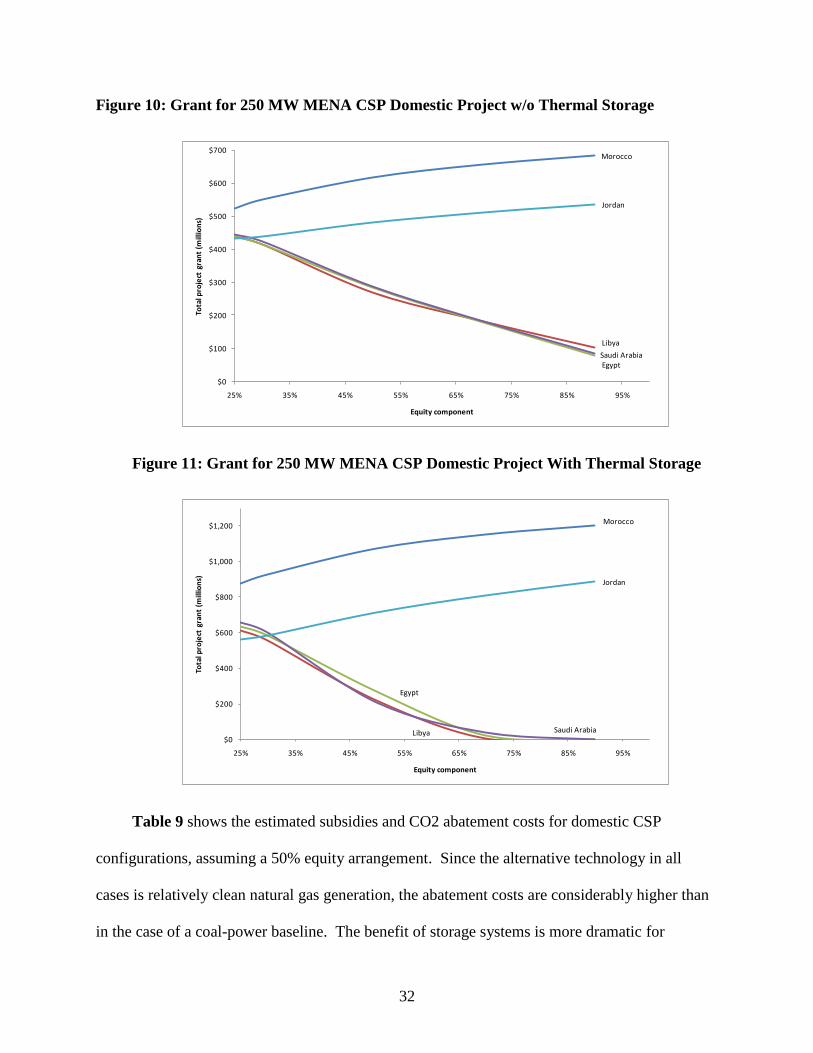
Figure 10 shows the relationship between the grant requirement and equity component for
the case of non-storage CSP generation where CDM financing and redirected gas subsidies are
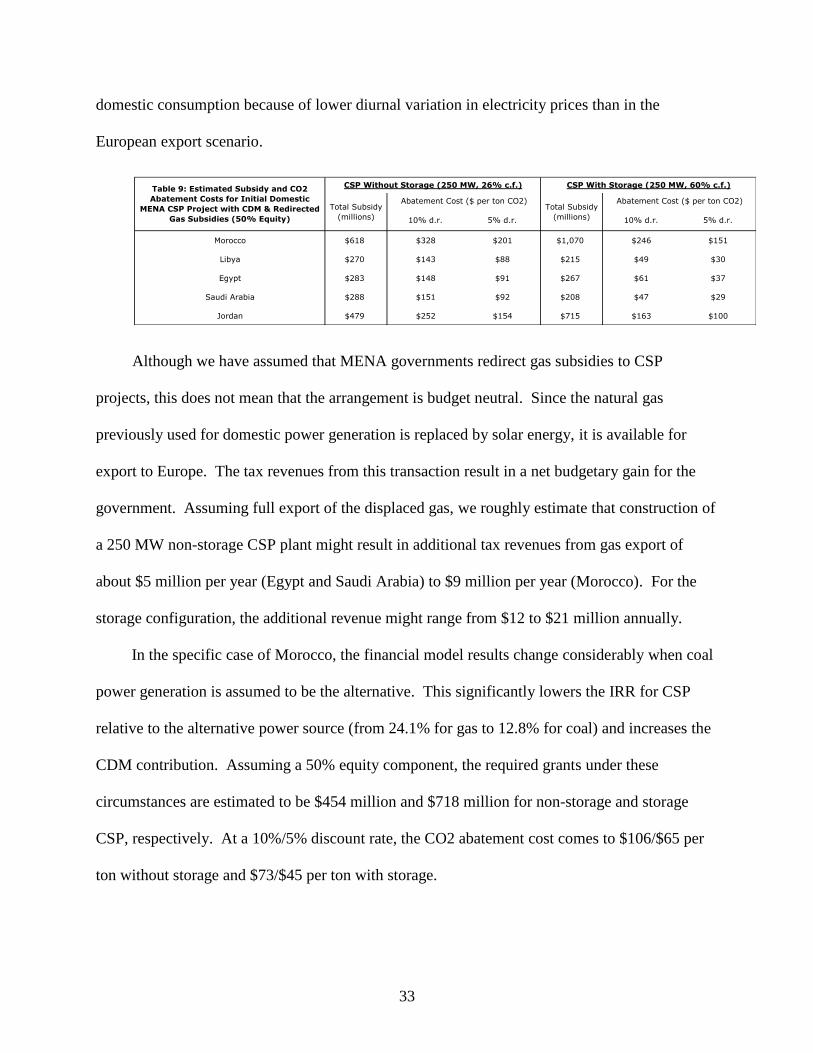
incorporated. Figure 11 does the same for the thermal storage configuration. In Morocco and
Jordan, where electricity prices are relatively high and gas subsidies low, the relationship
between the grant and equity component is similar to that observed for the European export
31
options. Obtaining more credit (lowering the equity component) reduces the required grant
while maintaining a given IRR.
In the cases of Libya, Egypt, and Saudi Arabia, however, extremely low electricity prices
mean that the ADSCR requirement binds the producer at much lower levels of debt. As the
equity component declines, the cost of servicing the additional debt quickly becomes untenable,
given the relatively small revenue stream. This necessitates a larger grant in order to reduce the
absolute amount of borrowing required to meet the capital costs. Without annual contributions
from CDM financing and redirected gas subsidies (especially the latter) to offset low electricity
prices, a grant of nearly any size fails to allow CSP projects in these countries to break even.
On the positive side, the analysis of natural gas generation suggests that domestic (mostly
public) producers are likely operating at little or zero profit. Assuming that CSP projects can be
operated by public entities under the same arrangement, the required grants are potentially quite
small, especially if the debt component can be minimized. In the case of CSP with thermal
storage, our model suggests that equity components of 75% or higher would require zero
external grant money in Libya, Egypt, and Saudi Arabia. Again, this assumes that the public
sector is providing the equity with the expectation of little or zero financial return in order to
keep electricity prices low.
32
Figure 10: Grant for 250 MW MENA CSP Domestic Project w/o Thermal Storage
Figure 11: Grant for 250 MW MENA CSP Domestic Project With Thermal Storage
Table 9 shows the estimated subsidies and CO2 abatement costs for domestic CSP
configurations, assuming a 50% equity arrangement. Since the alternative technology in all
cases is relatively clean natural gas generation, the abatement costs are considerably higher than
in the case of a coal-power baseline. The benefit of storage systems is more dramatic for
Morocco
Libya
EgyptSaudi Arabia
Jordan
$0
$100
$200
$300
$400
$500
$600
$700
25% 35% 45% 55% 65% 75% 85% 95%
Tota
l pro
ject
gra
nt
(mill
ion
s)
Equity component
Morocco
Libya
Egypt
Saudi Arabia
Jordan
$0
$200
$400
$600
$800
$1,000
$1,200
25% 35% 45% 55% 65% 75% 85% 95%
Tota
l pro
ject
gra
nt
(mill
ion
s)
Equity component
33
domestic consumption because of lower diurnal variation in electricity prices than in the
European export scenario.
Although we have assumed that MENA governments redirect gas subsidies to CSP
projects, this does not mean that the arrangement is budget neutral. Since the natural gas
previously used for domestic power generation is replaced by solar energy, it is available for
export to Europe. The tax revenues from this transaction result in a net budgetary gain for the
government. Assuming full export of the displaced gas, we roughly estimate that construction of
a 250 MW non-storage CSP plant might result in additional tax revenues from gas export of
about $5 million per year (Egypt and Saudi Arabia) to $9 million per year (Morocco). For the
storage configuration, the additional revenue might range from $12 to $21 million annually.
In the specific case of Morocco, the financial model results change considerably when coal
power generation is assumed to be the alternative. This significantly lowers the IRR for CSP
relative to the alternative power source (from 24.1% for gas to 12.8% for coal) and increases the
CDM contribution. Assuming a 50% equity component, the required grants under these
circumstances are estimated to be $454 million and $718 million for non-storage and storage
CSP, respectively. At a 10%/5% discount rate, the CO2 abatement cost comes to $106/$65 per
ton without storage and $73/$45 per ton with storage.
10% d.r. 5% d.r. 10% d.r. 5% d.r.
Morocco $618 $328 $201 $1,070 $246 $151
Libya $270 $143 $88 $215 $49 $30
Egypt $283 $148 $91 $267 $61 $37
Saudi Arabia $288 $151 $92 $208 $47 $29
Jordan $479 $252 $154 $715 $163 $100
Table 9: Estimated Subsidy and CO2
Abatement Costs for Initial Domestic
MENA CSP Project with CDM & Redirected
Gas Subsidies (50% Equity)
CSP Without Storage (250 MW, 26% c.f.) CSP With Storage (250 MW, 60% c.f.)
Total Subsidy
(millions)
Abatement Cost ($ per ton CO2)Total Subsidy
(millions)
Abatement Cost ($ per ton CO2)
34
6. Dynamic Analysis of Programmatic Costs over Time
We now consider the potential for learning and cost reductions over time as CSP is
expanded. Although CSP parabolic trough technology has been in commercial operation since
the early 1980’s, global installed capacity remained largely unchanged from the early 1990’s
until a few years ago. The recent growth has incorporated a range of new CSP technologies
whose potential for learning and cost reductions is high.
In 2007, more than 450 MW of CSP generating capacity was in operation worldwide.
Extrapolating near-term estimates of new construction, we conservatively estimate global
capacity of at least 4,000 MW by 2012.26
The CSP cost estimates in Section 3 are based on
projects expected to be in full commercial operation by then.
The speed at which costs fall in response to engineering, construction, and operational
experience, improved material procurement, and manufacturing scale is described by the
learning rate, which specifies the percentage change in unit costs for each doubling of installed
capacity. The literature on technological experience curves and learning rates is extensive. In a
review of the evidence for renewable energy technologies, Neij (2008) suggests plausible
learning rates of 10% to 20% for wind turbines, 20% for photovoltaic modules, and, based
largely on the limited evidence provided by the older California SEGS (parabolic trough) plants,
10% for CSP. Enermodal’s (1999) study of falling capital costs for the SEGS facilities finds a
learning rate of 12%. Given the experience of wind and photovoltaic power and the potential for
greater cost reductions from large-scale CSP facilities across a range of new technologies,
including thermal storage systems, we use illustrative learning rates of 10% and 20%.
26
This is based on a quadratic extrapolation of figures given in IEA (2008), which specify global CSP capacity of
354 MW in 2006, 468 MW in 2007 and 2,000 MW in 2010.
35
We simulate a CSP deployment program in the MENA region designed to export electricity
to Europe, incorporating the potential effects of learning and cost reduction from both regional
and global expansion. The main objective of the program is to displace new coal power facilities
in Europe. There are presently more than 9 GW of coal-fired power plants under construction in
the region (Platts, 2008). The IEA (2008) projects European coal-generating capacity to remain
at about 200 GW for the next two decades under a business-as-usual scenario.
Assuming a maximum operational lifetime of 40 years for coal plants, we estimate that
replacing aging European plants could require as much as 8 GW of new coal capacity each year
between 2010 and 2020. At least 30% of that construction (2.5 GW per year) is likely to occur
in Spain, Italy, Turkey, and Germany – demand centers near terminal points for our preferred
transmission corridors.27
Given the lower capacity factors of CSP plants, the total capacity
required to offset even a small portion of this coal construction is considerable.28
We specify a MENA CSP deployment program that begins construction of plants and
transmission infrastructure by 2010, with commercial operation of the first facilities beginning in
2012. The initial deployment is 500 MW and increases rapidly, reaching 20,000 MW total
installed capacity in 2020. We assume that 25% of the program’s expansion consists of CSP
with thermal storage capability. In this scenario, total delivered electricity is about 55 TWh in
2020 – equal to the total electricity production of Austria. The power and transmission facilities
constructed during this decade-long program would potentially avert 2.7 billion tons of CO2 over
30 years of operation.
The MENA CSP program is additional to a posited “background” expansion of CSP
elsewhere in the world based on extrapolation of recent and planned growth. We compute
27
Figures are based on the authors’ analysis of the Platts (2008) world electric power plant database. 28
Offsetting 2.5 GW of new coal power construction annually would likely require between 3.3 GW (with storage)
and 7.7 GW (without storage) of CSP generating capacity.

36
separate learning effects for the solar array components and storage systems; the power block
and transmission technologies are assumed to be mature. Costs of plant operation and
maintenance also decline in response to the specified learning rate. Figure 12 shows the
resulting levelized costs of electricity for MENA CSP under alternative learning rates given the
expansion schedule described above.
Figure 12: Levelized Cost of MENA CSP with Expansion and Learning Effects
These costs are embedded in the financial model in order to calculate the total subsidies
required to meet the stated deployment schedule. As in Section 4, the financial alterative is
supercritical coal power in Europe, whose profitability also changes slightly over time in
response to projected changes in the price of coal (Figure 7). We calculate required subsidies
for each of the three European transmission options, assuming that CSP capacity is allocated
evenly among the three sites. We model four scenarios, with and without CDM financing and
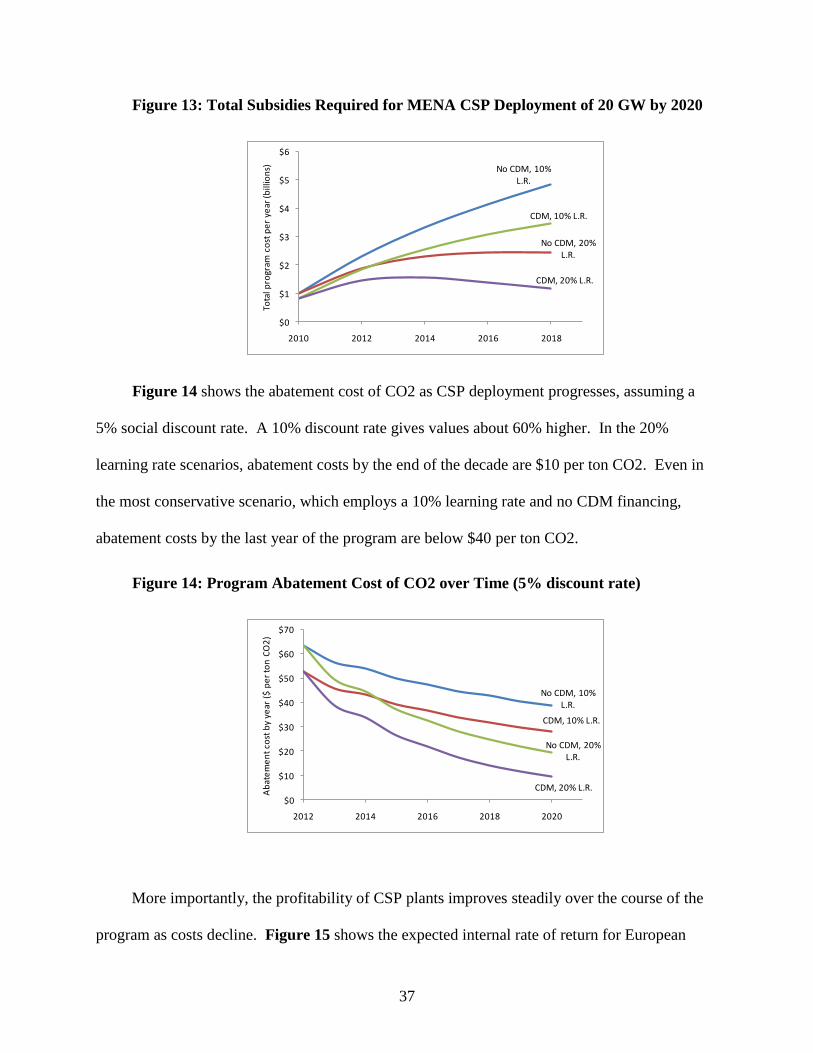
with learning rates of 10% and 20%. Figure 13 shows estimated total project subsidies over
time. Depending on scenario parameters, the total cost over the course of a decade ranges from
$12 to $28 billion.
No storage
Storage
No storage
Storage7
8
9
10
11
12
13
14
15
16
17
2012 2014 2016 2018 2020
Leve
lize
d c
ost
of
ele
ctri
city
(ce
nts
pe
r kW
h)
Year of first full-scale operation
10% learning rate (solid) 20% learning rate (dashed)
37
Figure 13: Total Subsidies Required for MENA CSP Deployment of 20 GW by 2020
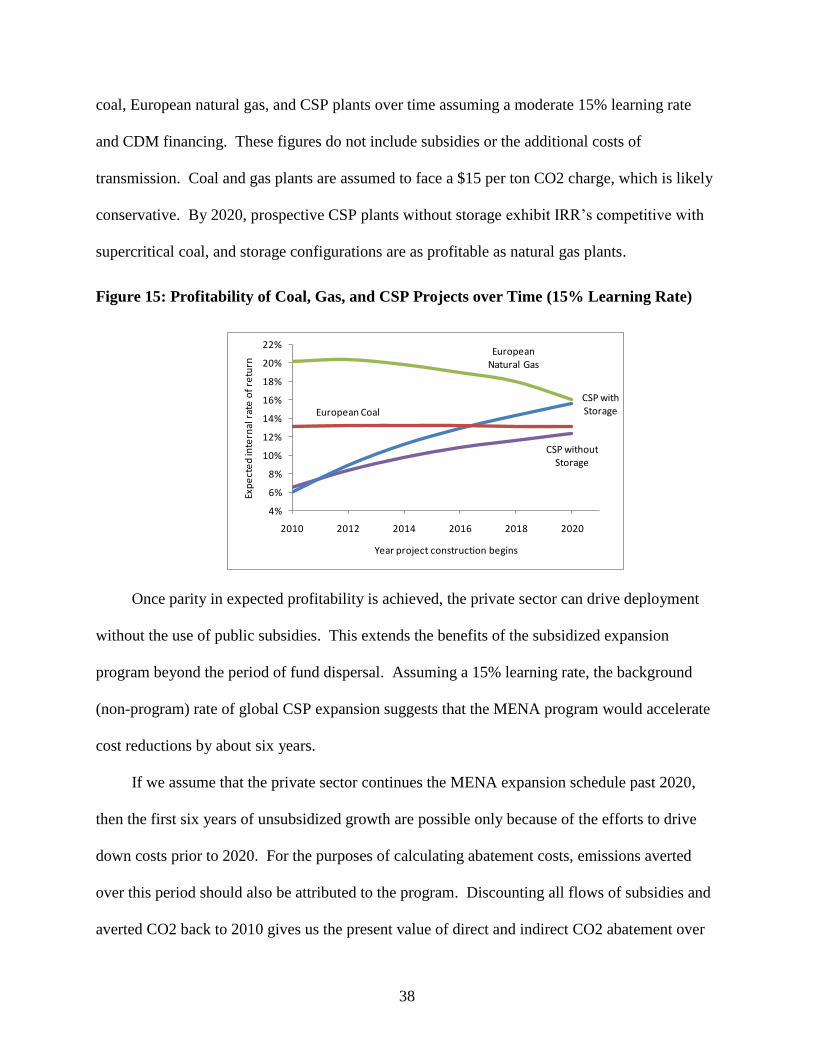
Figure 14 shows the abatement cost of CO2 as CSP deployment progresses, assuming a
5% social discount rate. A 10% discount rate gives values about 60% higher. In the 20%
learning rate scenarios, abatement costs by the end of the decade are $10 per ton CO2. Even in
the most conservative scenario, which employs a 10% learning rate and no CDM financing,
abatement costs by the last year of the program are below $40 per ton CO2.
Figure 14: Program Abatement Cost of CO2 over Time (5% discount rate)
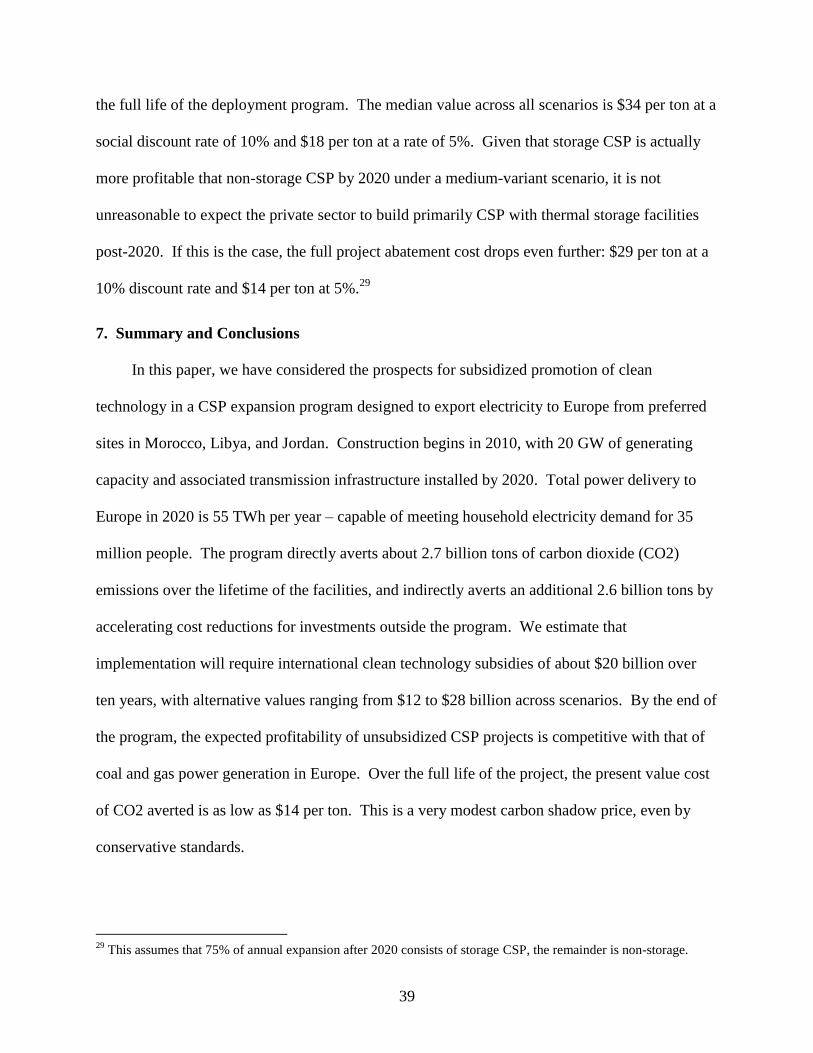
More importantly, the profitability of CSP plants improves steadily over the course of the
program as costs decline. Figure 15 shows the expected internal rate of return for European
No CDM, 10% L.R.
No CDM, 20% L.R.
CDM, 10% L.R.
CDM, 20% L.R.
$0
$1
$2
$3
$4
$5
$6
2010 2012 2014 2016 2018
Tota
l pro
gram
co
st p
er
year
(bill
ion
s)
No CDM, 10% L.R.
CDM, 10% L.R.
No CDM, 20% L.R.
CDM, 20% L.R.
$0
$10
$20
$30
$40
$50
$60
$70
2012 2014 2016 2018 2020
Ab
ate
me
nt
cost
by
year
($
pe
r to
n C
O2
)
38
coal, European natural gas, and CSP plants over time assuming a moderate 15% learning rate
and CDM financing. These figures do not include subsidies or the additional costs of
transmission. Coal and gas plants are assumed to face a $15 per ton CO2 charge, which is likely
conservative. By 2020, prospective CSP plants without storage exhibit IRR’s competitive with
supercritical coal, and storage configurations are as profitable as natural gas plants.
Figure 15: Profitability of Coal, Gas, and CSP Projects over Time (15% Learning Rate)
Once parity in expected profitability is achieved, the private sector can drive deployment
without the use of public subsidies. This extends the benefits of the subsidized expansion
program beyond the period of fund dispersal. Assuming a 15% learning rate, the background
(non-program) rate of global CSP expansion suggests that the MENA program would accelerate
cost reductions by about six years.
If we assume that the private sector continues the MENA expansion schedule past 2020,
then the first six years of unsubsidized growth are possible only because of the efforts to drive
down costs prior to 2020. For the purposes of calculating abatement costs, emissions averted
over this period should also be attributed to the program. Discounting all flows of subsidies and
averted CO2 back to 2010 gives us the present value of direct and indirect CO2 abatement over
CSP without Storage
CSP with StorageEuropean Coal
European Natural Gas
4%
6%
8%
10%
12%
14%
16%
18%
20%
22%
2010 2012 2014 2016 2018 2020
Exp
ect
ed
inte
rnal
rat
e o
f re
turn
Year project construction begins
39
the full life of the deployment program. The median value across all scenarios is $34 per ton at a
social discount rate of 10% and $18 per ton at a rate of 5%. Given that storage CSP is actually
more profitable that non-storage CSP by 2020 under a medium-variant scenario, it is not
unreasonable to expect the private sector to build primarily CSP with thermal storage facilities
post-2020. If this is the case, the full project abatement cost drops even further: $29 per ton at a
10% discount rate and $14 per ton at 5%.29
7. Summary and Conclusions
In this paper, we have considered the prospects for subsidized promotion of clean
technology in a CSP expansion program designed to export electricity to Europe from preferred
sites in Morocco, Libya, and Jordan. Construction begins in 2010, with 20 GW of generating
capacity and associated transmission infrastructure installed by 2020. Total power delivery to
Europe in 2020 is 55 TWh per year – capable of meeting household electricity demand for 35
million people. The program directly averts about 2.7 billion tons of carbon dioxide (CO2)
emissions over the lifetime of the facilities, and indirectly averts an additional 2.6 billion tons by
accelerating cost reductions for investments outside the program. We estimate that
implementation will require international clean technology subsidies of about $20 billion over
ten years, with alternative values ranging from $12 to $28 billion across scenarios. By the end of
the program, the expected profitability of unsubsidized CSP projects is competitive with that of
coal and gas power generation in Europe. Over the full life of the project, the present value cost
of CO2 averted is as low as $14 per ton. This is a very modest carbon shadow price, even by
conservative standards.
29
This assumes that 75% of annual expansion after 2020 consists of storage CSP, the remainder is non-storage.
40
We also assess the potential for domestic use of CSP within MENA countries. We find
good potential for low-cost deployment, but it will depend heavily on country-specific policies
with respect to electricity prices and project financing.
Although we focus on grants for expositional simplicity, we do not mean to suggest that
grants are the only, or even the preferable means of achieving this transition. In practice,
concessionary financing, loan guarantees, equity investments, and/or feed-in tariffs could be used
to bring the profitability of CSP to parity with the relevant fossil fuel alternative in a short period
of time. Our simplifying assumptions -- CSP plants receive per-kWh revenue consistent with the
average price across all fuel sources; prices remain constant in real terms over time – are
probably conservative, on balance. In Spain, for example, the government’s renewable
electricity feed-in tariff is approximately twice what we have assumed for average southern
European rates (Desertec, 2008). Access to preferable electricity prices would dramatically
reduce the amount of explicit clean technology financing required.
For actual deployment, it seems sensible for the first CSP installations to use the much
smaller and technically- and politically-convenient transmission corridor between Morocco and
Spain, especially if the Spanish feed-in tariff is extended to imported electricity. Although it is
not intimidating from an engineering standpoint, moving large quantities of electricity across
multiple borders – as in the case of the Libyan and Jordanian transmission options – might have
political implications that would extend project lead times considerably. Since it is costly to step
down high-voltage direct current, the proposed lines need to run uninterrupted to the terminal
point before distribution can begin.
We have purposely limited the deployment of CSP with storage to 25% of total program
expansion to reflect the fact that storage systems at large scale are not yet in commercial
41
operation. There is a clear need for public support of storage configurations in order to reduce
uncertainty, costs, and risks. That said, the relative underdevelopment of CSP thermal storage
systems does not limit the potential for profitable and effective deployment of CSP without
storage. This is especially true when diurnal variation in electricity prices is significant, either as
a result of time-of-use pricing structures or feed-in tariffs specific to daytime solar power.
For the MENA region, a particularly appealing possibility not assessed here is hybrid CSP-
gas technology for either domestic use or export. CSP plants using sunlight during the day and
piped natural gas at night to run the same power block could achieve 24-hour generation at
potentially low average cost and emissions. This would have the added benefit of reducing the
levelized cost of both generation and associated transmission infrastructure by achieving higher
electricity throughput. Supplemental gas could provide an ideal fuel “bridge” as thermal storage
systems are refined and developed at scale.
For domestic use of CSP, feasibility will depend largely on MENA governments’ approach
to electricity pricing and gas subsidies. At electricity prices as low as those in Libya, Saudi
Arabia, and Egypt, it is difficult to make CSP operations profitable at current costs. However,
redirecting displaced gas subsidies could provide considerable assistance. Preferential tariff
treatment for CSP facilities would provide perhaps the simplest way to increase competitiveness.
The possibility of strong public-sector investment in CSP with the intention of providing power
at little or no financial profitability could allow for rapid deployment at small cost to
international donors. Since the potential economic benefits from the export of electricity or
displaced natural gas to Europe are immense, MENA governments have a stake in seeing CSP
deployed quickly in the region. Indeed, the upside is so large that MENA country self-financing

42
of large-scale pilot projects could make sense, thereby reducing risk and the cost of capital for
future investments.
Overall, large-scale deployment of CSP in the MENA region is clearly attainable at levels
of public subsidy that are modest, given the planetary stakes. The question is not whether CSP is
feasible, but whether programs like the MENA initiative will be operational in time to prevent
catastrophic climate change. For such programs to spur the clean energy revolution, efforts to
arrange financing should begin right away, with site acquisition and construction to follow
within a year.
43
References
Capros, P., Mantzos, L., Papandreou, V., Tasios, N. (2008), “Model-based Analysis of the 2008
EU Policy Package on Climate Change and Renewables,” E3MLab/NTUA.
Cova, B., Pincella, C., Simioli, G., Stigliano, G. Paolo, Vailati, R., Zecca, B. (2005), “HVDC
Interconnections in the Mediterranean Basin,” Inaugural IEEE PES 2005 Conference and
Exposition in Africa.
Desertec (2008), “DESERTEC Concept Note,” Trans-Mediterranean Renewable Energy
Cooperation, The Club of Rome. Available online:
http://www.desertec.org/downloads/summary_en.pdf
DLR (2005). “Concentrating Solar Power for the Mediterranean Region,” German Aerospace
Center. Available online: www.dlr.de/tt/med-csp
DLR (2006), “Trans-Mediterranean Interconnection for Concentrating Solar Power,” German
Aerospace Center. Available online: www.dlr.de/tt/trans-csp
ECA (2007), “Egypt: Economic Costs of Natural Gas,” Economic Consulting Associates and
Parsons Brinckerhoff, prepared for The World Bank.
Enermodal (1999), “Cost reduction study for solar thermal power plants,” Enermodal
Engineering Limited, prepared for The World Bank.
ESMAP (2007), “Technical and Economic Assessment of Off-grid, Mini-grid and Grid
Electrification Technologies,” Energy Sector Management Assistance Program, Technical Paper
121/07. Available online:
http://www.esmap.org/filez/pubs/4172008104859_Mini_Grid_Electrification.pdf
ESMAP (2008), “Study of Equipment Prices in the Power Sector (Draft), Energy Sector
Management Assistance Program. Available online:
http://www.esmap.org/filez/pubs/724200833229_power_prices.pdf
Eurolectric (2007), “Electricity Tariffs as of 1 January 2007,” Tariffs Network of Experts, Union
of the Electricity Industry.
ICP (2008), “Global Purchasing Power Parities and Real Expenditures,” International
Comparison Program, World Bank. Available online:
http://siteresources.worldbank.org/ICPINT/Resources/icp-final.pdf
IEA (2007), “Beyond 2020: Energy Balances of OECD Countries”, International Energy
Agency, Paris.
IEA (2008), “World Energy Outlook 2008,” International Energy Agency, Paris.
44
IPCC (2007), “Working Group III Report: Mitigation of Climate Change.” Intergovernmental
Panel on Climate Change. Chapter 1. Available online: http://www.ipcc.ch/pdf/assessment-
report/ar4/wg3/ar4-wg3-chapter1.pdf.
Kistner, R. and Price, H.W. (1999), “Financing Solar Thermal Power Plants,” National
Renewable Energy Laboratory, Proceedings of the ASME Renewable and Advanced Energy
Systems for the 21st Century Conference.
May, N. (2005), “Eco-balance of Solar Electricity Transmission from North Africa to Europe,”
Technical University of Braunschweig Diploma Thesis.
McCormick, D. (2008), “Remarks by Treasury Under Secretary David H. McCormick on
China’s Journey to Environmentally Sustainable Growth at the West Coast Leadership
Dialogue.” Press Release. January 14. Available online:
www.ustreas.gov/press/releases/hp761.htm.
Mills, D. and Morgan, R. (2008), “Solar Thermal Electricity as the Primary Replacement for
Coal and Oil in U.S. Generation and Transportation,” Ausra, Inc. Available online:
http://www.ausra.com/pdfs/ausra_usgridsupply.pdf
MIT (2007), “The Future of Coal,” Massachusetts Institute of Technology. Available online:
http://web.mit.edu/coal/
Neij, L. (2008), “Cost development of future technologies for power generation – A study based
on experience curves and complementary bottom-up assessments,” Energy Policy, Volume 36,
Issue 6.
NETL (2007), “Fossil Energy Cost and Performance Baseline Studies,” National Energy
Technology Laboratory. Available online: http://www.netl.doe.gov/energy-
analyses/baseline_studies.html
Platts (2008), “World Electric Power Plants (WEPP) Database,” June 2008 version.
Razavi, H. (2008), “Natural Gas Pricing in Countries of the Middle East and North Africa,”
World Bank draft paper.
Stern, N. (2008), “Economics of Climate Change.” American Economic Review 98 (2): 1–37.
Verdin, K.L., Godt, J.W., Funk, C., Pedreros, D., Worstell, B., Verdin, J. (2007), “Development
of a Global Slope Dataset for Estimation of Landslide Occurrence Resulting from Earthquakes,”
U.S. Geologic Survey, Colorado, Open-File Report 2007-1188.
Wheeler, D. and Ummel, K. (2007), “Another Inconvenient Truth: A Carbon-Intensive South
Faces Environmental Disaster, No Matter What the North Does,” Center for Global
Development Working Paper No. 134. Available online:
http://www.cgdev.org/content/publications/detail/14947.

45
World Bank (forthcoming), Untitled draft paper of MENA region energy efficiency and
subsidies.