Embed Size (px)
Citation preview
Work supported in part by US Department of Energy contract DE-AC02-76SF00515. 1
Heterogeneous Catalysis DOI: 10.1002/anie.200((will be filled in by the editorial staff))
Descriptor-based Analysis applied to HCN synthesis from NH3 and CH4** Lars C. Grabow, Felix Studt, Frank Abild-Pedersen, Vivien Petzold, Jesper Kleis, Thomas Bligaard and Jens K. Nørskov*
The design of solid metal catalysts using theoretical methods has been a long-standing goal in heterogeneous catalysis.[1, 2] Recent developments in methodology and computer technology as well as the establishment of a descriptor-based approach for the analysis of reaction mechanisms and trends across the periodic table allow for the fast screening for new catalytic materials and have lead to first examples of computational discoveries of new materials.[3-8] The underlying principles of the descriptor-based approach are the existence of relations between the surface electronic structure, adsorption energies and activation barriers that result in volcano-shaped activity plots as function of simple descriptors, such as atomic binding energies or the d-band center.[1, 6, 9-17] Linear scaling relations have been established between the adsorption energies of hydrogen-containing molecules such as CHx, NHx, OHx and SHx and the C, N O and S adsorption energies on transition-metal surfaces.[18] Transition-state energies have also been shown to scale linearly with adsorption energies in a similar fashion.[9, 16, 19, 20] Recently, a single transition state scaling relation has been identified for a large number of C-C, C-O, C-N, N-O, N-N, and O-O coupling reactions.[21] The scaling relations provide a powerful tool for the investigation of reaction mechanisms and the prediction of potential energy surfaces. They limit the number of independent variables to a few, typically adsorption energies of key atoms. Using this information as input to a microkinetic model provides an understanding of trends in catalytic activity across the transition metals. In most cases a volcano-shaped relation between
activity and the key variables, the descriptors, is observed.[16] In the present paper we will provide an example of the approach outlined above and show how one can obtain an understanding of activity/selectivity trends of a reaction with just a few new calculations. We take the synthesis of hydrogen cyanide (HCN), a versatile synthetic building block in organic chemistry, as an example.[22] For the catalytic production of HCN from methane (CH4) and ammonia (NH3) there exist two main processes: the Andrussow and the Degussa (BMA) process.[23-25] Both processes use Pt gauze catalysts and are run at temperatures up to 1573 K. The main reason for the high reaction temperature is the endothermicity (ΔH0 = 251 kJ/mol(HCN)) of the reaction CH4 + NH3 → HCN + 3 H2, whereas the competing side reaction 2 NH3 → N2 + 3 H2 is less endothermic (ΔH0 = 46 kJ/mol(NH3)). Hence, NH3 decomposition is thermodynamically favored at low temperatures. In contrast to the Degussa process where the necessary heat is supplied externally, O2 is added to the feed of the Andrussow process and its reaction with H2 supplies the necessary energy to drive the endothermic HCN formation.
The industrially used Pt/Rh gauze catalysts reach their optimal activity only after an extended activation period under reaction conditions.[23] SEM[26] and STM[27] characterization of the catalyst have shown that during this activation period the catalysts surface area is increased (roughening) and random faceting occurs. As an approximation of the active site on this surface, we use the stepped (211) facet, which has also been shown to dominate the catalytic activity in other reactions.[28]. Pt is the active catalytic component of the Pt/Rh catalyst, while the role of Rh is to increase the long term stability.[23]
We consider the following elementary steps, including 9 different routes for C-N coupling between CHx and NHy with x,y = 0,1,2, where X* denotes an adsorbed species and * represents an empty surface site:
CH4(g) + 2* → CH3* + H* CH3* + * → CH2* + H* CH2* + * → CH* + H* CH* + * → C* + H* NH3(g) + 2* → NH2* + H* NH2* + * → NH* + H* NH* + * → N* + H* CHx* + NHy* → CHxNHy* + * CHxNHy* + (x+y-1)* → HCN* + (x+y-1)H* HCN* → HCN(g) + * 2H* → H2(g) 2N* → N2(g)
In the present case, we can model the energetics of all CHx and NHy species on transition metal surfaces with the adsorption energies of carbon EC and nitrogen EN using previously discovered scaling relations.[18] Hydrogen adsorption is modeled via EC as previously reported.[29] Thus, the stability of a large fraction of intermediates is given from the literature, and the only missing information is the adsorption energy of CHxNHy species. As we will show here, trends in the stability of CHxNHy intermediates can be
[∗] Dr. L. C. Grabow, Prof. J. K. Nørskov Department of Chemical Engineering Stanford University Stanford, California 94305 (USA) Fax: (+1) 650-926-4100 E-mail: [email protected] Dr. F. Studt, Dr. F. Abild-Pedersen, Prof. J. K. Nørskov Center for Interface Science and Catalysis SLAC National Accelerator Laboratory Menlo Park, California 94025 (USA) V. Petzold, Dr. J. Kleis, Prof. T. Bligaard Center for Atomic-scale Materials Design, Department of
Physics, Building 311 Technical University of Denmark DK-2800 Kgs. Lyngby (Denmark)
[∗∗] Support from the SUNCAT Center for Interface Science and Catalysis, funded by DOE (contract no. XXX), the Center for Atomic-scale Materials Design, funded by the Lundbeck Foundation, and the Catalysis for Sustainable Energy (CASE) initiative which is funded by the Danish Ministry of Science, Technology, and Innovation is greatly acknowledged.
Supporting information for this article is available on the WWW under http://www.angewandte.org or from the author.
SLAC National Accelerator Laboratory, Menlo Park, CA 94025
SLAC-PUB-14385
2
obtained from the energies of the CHx and NHy constituents involved in the coupling reaction. Scaling of CHxNHy vs EC and EN can be found in Figure S-1 and Table S-1 in the Supporting Information.
The dehydrogenation barriers for NH3 and CH4 decomposition follow scaling (or BEP) relations taken from reference [30]. Similarly, activation barriers for the C-N and N-N coupling reactions have also been described recently in terms of scaling relations, linking the transition state energy to the energy of the dissociated products.[21] The dissociated products can then be linked to EC and EN via the scaling relations of adsorption energies of CHx and NHx intermediates.. Assuming that the C-N coupling reactions are slow when compared to the subsequent hydrogen exchange reaction of the CHxNHy backbone the thermodynamics and kinetics of the HCN synthesis process are described entirely by EC and EN leading to a tremendous simplification of the description.
In the following we will use this descriptor-based meta-data to study trends in activity and selectivity of the HCN synthesis reaction by coupling it to a microkinetic model and analyze the results on the basis of volcano-shaped relations. For the parameterization of the microkinetic model we corrected the electronic energies obtained from the scaling relations with the zero point energy EZPE, heat capacity contributions ΔU(T), and entropy, because the temperature range of interest for HCN synthesis is quite high. EZPE, ΔU and S for each specie and all transition states were calculated from the vibrational frequencies on Pt(211) at 1200 K and assumed to be constant. For gas phase species we used the Shomate equation to estimate the temperature correction and entropy contributions to the Gibb’s free energy.[31] Hence, we have the necessary information to calculate rate and equilibrium constants for each elementary step in the reaction mechanism presented above and can find a numerical solution under steady-state conditions. As representative reaction conditions for industrial HCN synthesis we chose P= 1 atm, T = 1373 K with the initial mole fractions y0
NH3 = 0.107, y0CH4 = 0.093
assuming a conversion level of 15% with respect to CH4 and a selectivity of HCN/N2 = 2. Further details of the microkinetic model are given in S2 of the Supporting Information.
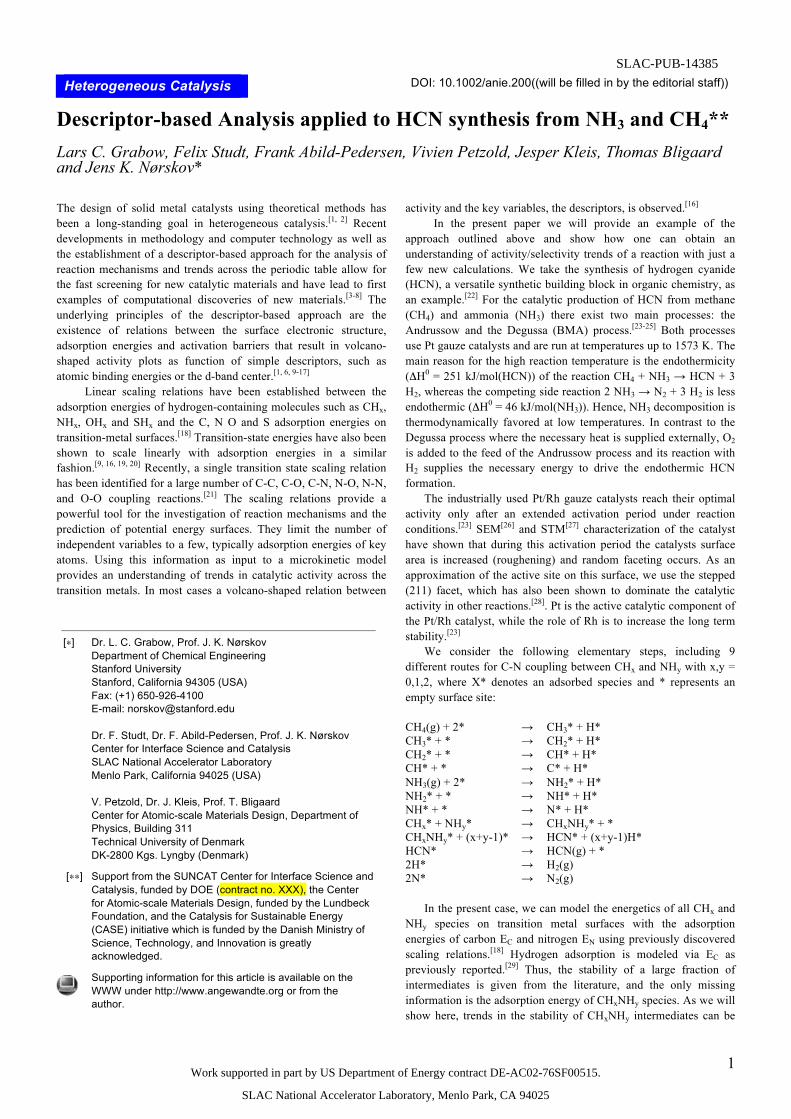
By solving this comprehensive microkinetic model, which allows for multiple reaction pathways and the simultaneous production of HCN and N2 we obtain a volcano for the overall NH3 consumption as a function of EC and EN as displayed in Figure 1a. The position of several (211) transition metal surfaces is indicated along with 0.2 eV error bars for Ec and EN. None of the transition metal surfaces included here lie on the top of the volcano, but we find Co, Ir, and Ni closest to the top. Rh and Pt are also predicted to be active. Since NH3 adsorption leads to both, HCN and N2 it is further important to consider the selectivity shown in Figure 1b. Here we notice that Pt is unique in terms of its selectivity towards HCN production and is the only metal of those considered that produces only HCN.
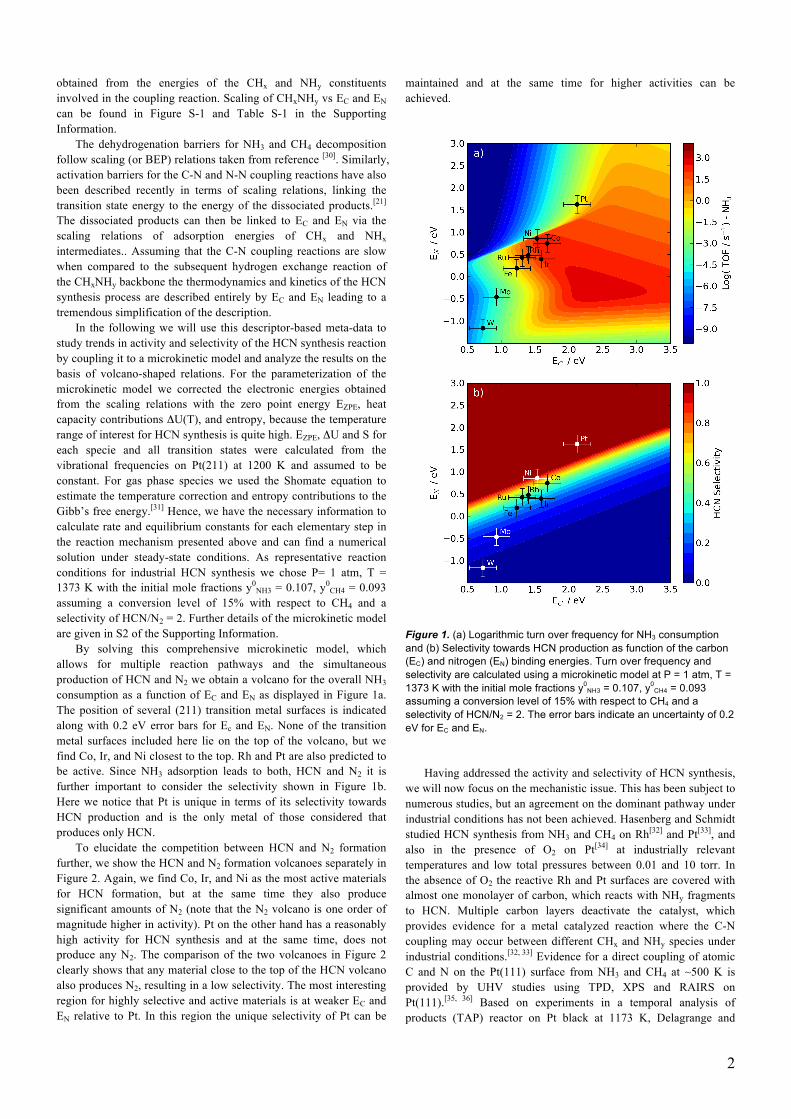
To elucidate the competition between HCN and N2 formation further, we show the HCN and N2 formation volcanoes separately in Figure 2. Again, we find Co, Ir, and Ni as the most active materials for HCN formation, but at the same time they also produce significant amounts of N2 (note that the N2 volcano is one order of magnitude higher in activity). Pt on the other hand has a reasonably high activity for HCN synthesis and at the same time, does not produce any N2. The comparison of the two volcanoes in Figure 2 clearly shows that any material close to the top of the HCN volcano also produces N2, resulting in a low selectivity. The most interesting region for highly selective and active materials is at weaker EC and EN relative to Pt. In this region the unique selectivity of Pt can be
maintained and at the same time for higher activities can be achieved.
Figure 1. (a) Logarithmic turn over frequency for NH3 consumption and (b) Selectivity towards HCN production as function of the carbon (EC) and nitrogen (EN) binding energies. Turn over frequency and selectivity are calculated using a microkinetic model at P = 1 atm, T = 1373 K with the initial mole fractions y0
NH3 = 0.107, y0CH4 = 0.093
assuming a conversion level of 15% with respect to CH4 and a selectivity of HCN/N2 = 2. The error bars indicate an uncertainty of 0.2 eV for EC and EN.
Having addressed the activity and selectivity of HCN synthesis, we will now focus on the mechanistic issue. This has been subject to numerous studies, but an agreement on the dominant pathway under industrial conditions has not been achieved. Hasenberg and Schmidt studied HCN synthesis from NH3 and CH4 on Rh[32] and Pt[33], and also in the presence of O2 on Pt[34] at industrially relevant temperatures and low total pressures between 0.01 and 10 torr. In the absence of O2 the reactive Rh and Pt surfaces are covered with almost one monolayer of carbon, which reacts with NHy fragments to HCN. Multiple carbon layers deactivate the catalyst, which provides evidence for a metal catalyzed reaction where the C-N coupling may occur between different CHx and NHy species under industrial conditions.[32, 33] Evidence for a direct coupling of atomic C and N on the Pt(111) surface from NH3 and CH4 at ~500 K is provided by UHV studies using TPD, XPS and RAIRS on Pt(111).[35, 36] Based on experiments in a temporal analysis of products (TAP) reactor on Pt black at 1173 K, Delagrange and
3
Schuurman suggested an HCN synthesis reaction mechanism where NH3 decomposition is the rate-limiting step and HCN is formed via a C-N or HC-N coupling reaction. However, the TAP experiments do not allow the exclusion of other CHx-NHy coupling mechanisms. Lastly, early coupling reactions of CHx with NHy on the catalysts surface and subsequent dehydrogenation as a homogeneous gas phase reaction have also been discussed.[37, 38]
Figure 2. Logarithmic turn over frequency for (a) HCN production and (b) N2 production as function of the carbon (EC) and nitrogen (EN) binding energies. Turn over frequency and selectivity are calculated using a microkinetic model at P = 1 atm, T = 1373 K with the initial mole fractions y0
NH3 = 0.107, y0CH4 = 0.093 assuming a conversion
level of 15% with respect to CH4 and a selectivity of HCN/N2 = 2. The error bars indicate an uncertainty of 0.2 eV for EC and EN.
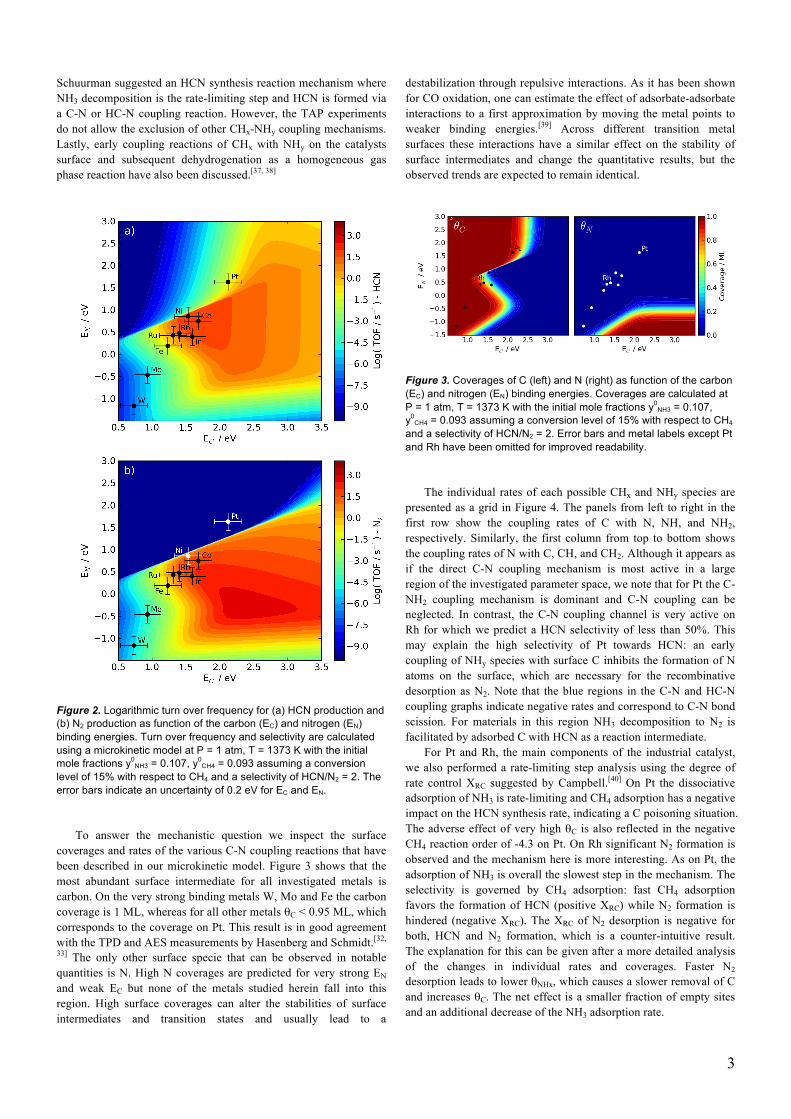
To answer the mechanistic question we inspect the surface coverages and rates of the various C-N coupling reactions that have been described in our microkinetic model. Figure 3 shows that the most abundant surface intermediate for all investigated metals is carbon. On the very strong binding metals W, Mo and Fe the carbon coverage is 1 ML, whereas for all other metals θC < 0.95 ML, which corresponds to the coverage on Pt. This result is in good agreement with the TPD and AES measurements by Hasenberg and Schmidt.[32,
33] The only other surface specie that can be observed in notable quantities is N. High N coverages are predicted for very strong EN and weak EC but none of the metals studied herein fall into this region. High surface coverages can alter the stabilities of surface intermediates and transition states and usually lead to a
destabilization through repulsive interactions. As it has been shown for CO oxidation, one can estimate the effect of adsorbate-adsorbate interactions to a first approximation by moving the metal points to weaker binding energies.[39] Across different transition metal surfaces these interactions have a similar effect on the stability of surface intermediates and change the quantitative results, but the observed trends are expected to remain identical.
Figure 3. Coverages of C (left) and N (right) as function of the carbon (EC) and nitrogen (EN) binding energies. Coverages are calculated at P = 1 atm, T = 1373 K with the initial mole fractions y0
NH3 = 0.107, y0
CH4 = 0.093 assuming a conversion level of 15% with respect to CH4 and a selectivity of HCN/N2 = 2. Error bars and metal labels except Pt and Rh have been omitted for improved readability.
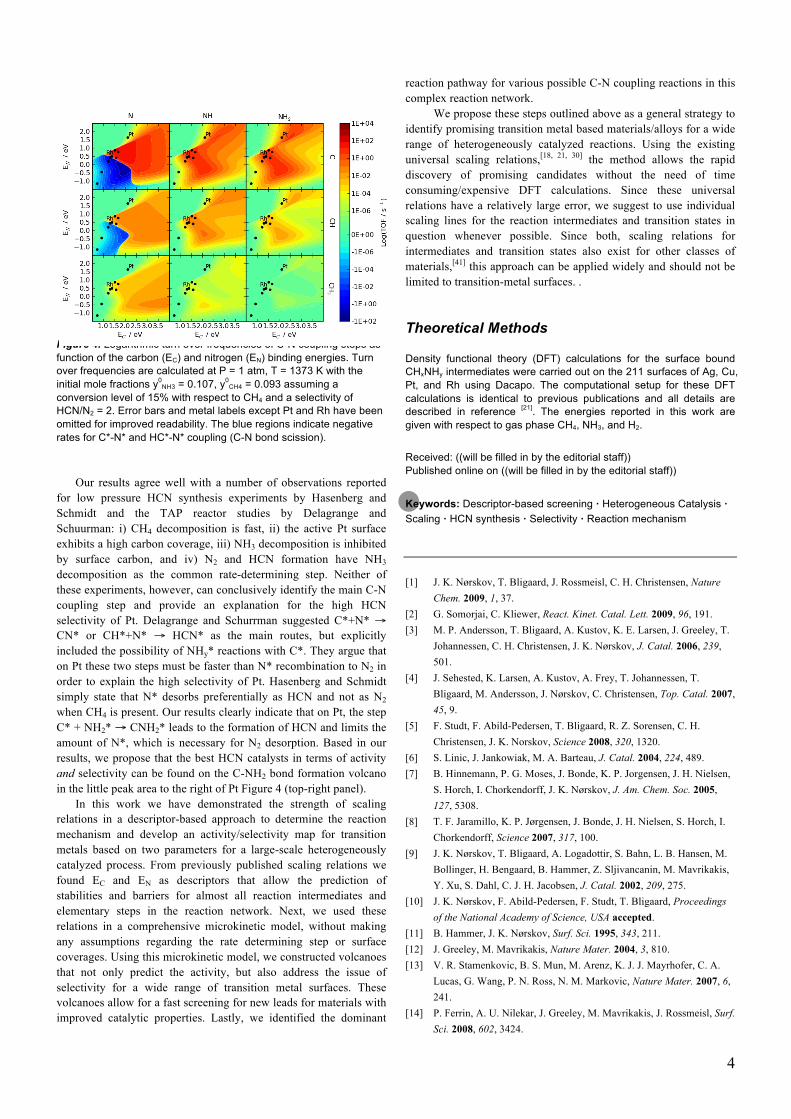
The individual rates of each possible CHx and NHy species are presented as a grid in Figure 4. The panels from left to right in the first row show the coupling rates of C with N, NH, and NH2, respectively. Similarly, the first column from top to bottom shows the coupling rates of N with C, CH, and CH2. Although it appears as if the direct C-N coupling mechanism is most active in a large region of the investigated parameter space, we note that for Pt the C-NH2 coupling mechanism is dominant and C-N coupling can be neglected. In contrast, the C-N coupling channel is very active on Rh for which we predict a HCN selectivity of less than 50%. This may explain the high selectivity of Pt towards HCN: an early coupling of NHy species with surface C inhibits the formation of N atoms on the surface, which are necessary for the recombinative desorption as N2. Note that the blue regions in the C-N and HC-N coupling graphs indicate negative rates and correspond to C-N bond scission. For materials in this region NH3 decomposition to N2 is facilitated by adsorbed C with HCN as a reaction intermediate.
For Pt and Rh, the main components of the industrial catalyst, we also performed a rate-limiting step analysis using the degree of rate control XRC suggested by Campbell.[40] On Pt the dissociative adsorption of NH3 is rate-limiting and CH4 adsorption has a negative impact on the HCN synthesis rate, indicating a C poisoning situation. The adverse effect of very high θC is also reflected in the negative CH4 reaction order of -4.3 on Pt. On Rh significant N2 formation is observed and the mechanism here is more interesting. As on Pt, the adsorption of NH3 is overall the slowest step in the mechanism. The selectivity is governed by CH4 adsorption: fast CH4 adsorption favors the formation of HCN (positive XRC) while N2 formation is hindered (negative XRC). The XRC of N2 desorption is negative for both, HCN and N2 formation, which is a counter-intuitive result. The explanation for this can be given after a more detailed analysis of the changes in individual rates and coverages. Faster N2 desorption leads to lower θNHx, which causes a slower removal of C and increases θC. The net effect is a smaller fraction of empty sites and an additional decrease of the NH3 adsorption rate.
4
Figure 4. Logarithmic turn over frequencies of C-N coupling steps as function of the carbon (EC) and nitrogen (EN) binding energies. Turn over frequencies are calculated at P = 1 atm, T = 1373 K with the initial mole fractions y0
NH3 = 0.107, y0CH4 = 0.093 assuming a
conversion level of 15% with respect to CH4 and a selectivity of HCN/N2 = 2. Error bars and metal labels except Pt and Rh have been omitted for improved readability. The blue regions indicate negative rates for C*-N* and HC*-N* coupling (C-N bond scission).
Our results agree well with a number of observations reported for low pressure HCN synthesis experiments by Hasenberg and Schmidt and the TAP reactor studies by Delagrange and Schuurman: i) CH4 decomposition is fast, ii) the active Pt surface exhibits a high carbon coverage, iii) NH3 decomposition is inhibited by surface carbon, and iv) N2 and HCN formation have NH3 decomposition as the common rate-determining step. Neither of these experiments, however, can conclusively identify the main C-N coupling step and provide an explanation for the high HCN selectivity of Pt. Delagrange and Schurrman suggested C*+N* → CN* or CH*+N* → HCN* as the main routes, but explicitly included the possibility of NHy* reactions with C*. They argue that on Pt these two steps must be faster than N* recombination to N2 in order to explain the high selectivity of Pt. Hasenberg and Schmidt simply state that N* desorbs preferentially as HCN and not as N2 when CH4 is present. Our results clearly indicate that on Pt, the step C* + NH2* → CNH2* leads to the formation of HCN and limits the amount of N*, which is necessary for N2 desorption. Based in our results, we propose that the best HCN catalysts in terms of activity and selectivity can be found on the C-NH2 bond formation volcano in the little peak area to the right of Pt Figure 4 (top-right panel).
In this work we have demonstrated the strength of scaling relations in a descriptor-based approach to determine the reaction mechanism and develop an activity/selectivity map for transition metals based on two parameters for a large-scale heterogeneously catalyzed process. From previously published scaling relations we found EC and EN as descriptors that allow the prediction of stabilities and barriers for almost all reaction intermediates and elementary steps in the reaction network. Next, we used these relations in a comprehensive microkinetic model, without making any assumptions regarding the rate determining step or surface coverages. Using this microkinetic model, we constructed volcanoes that not only predict the activity, but also address the issue of selectivity for a wide range of transition metal surfaces. These volcanoes allow for a fast screening for new leads for materials with improved catalytic properties. Lastly, we identified the dominant
reaction pathway for various possible C-N coupling reactions in this complex reaction network. We propose these steps outlined above as a general strategy to identify promising transition metal based materials/alloys for a wide range of heterogeneously catalyzed reactions. Using the existing universal scaling relations,[18, 21, 30] the method allows the rapid discovery of promising candidates without the need of time consuming/expensive DFT calculations. Since these universal relations have a relatively large error, we suggest to use individual scaling lines for the reaction intermediates and transition states in question whenever possible. Since both, scaling relations for intermediates and transition states also exist for other classes of materials,[41] this approach can be applied widely and should not be limited to transition-metal surfaces. .
Theoretical Methods
Density functional theory (DFT) calculations for the surface bound CHxNHy intermediates were carried out on the 211 surfaces of Ag, Cu, Pt, and Rh using Dacapo. The computational setup for these DFT calculations is identical to previous publications and all details are described in reference [21]. The energies reported in this work are given with respect to gas phase CH4, NH3, and H2.
Received: ((will be filled in by the editorial staff)) Published online on ((will be filled in by the editorial staff))
Keywords: Descriptor-based screening · Heterogeneous Catalysis · Scaling · HCN synthesis · Selectivity · Reaction mechanism
[1] J. K. Nørskov, T. Bligaard, J. Rossmeisl, C. H. Christensen, Nature
Chem. 2009, 1, 37. [2] G. Somorjai, C. Kliewer, React. Kinet. Catal. Lett. 2009, 96, 191. [3] M. P. Andersson, T. Bligaard, A. Kustov, K. E. Larsen, J. Greeley, T.
Johannessen, C. H. Christensen, J. K. Nørskov, J. Catal. 2006, 239, 501.
[4] J. Sehested, K. Larsen, A. Kustov, A. Frey, T. Johannessen, T. Bligaard, M. Andersson, J. Nørskov, C. Christensen, Top. Catal. 2007, 45, 9.
[5] F. Studt, F. Abild-Pedersen, T. Bligaard, R. Z. Sorensen, C. H. Christensen, J. K. Norskov, Science 2008, 320, 1320.
[6] S. Linic, J. Jankowiak, M. A. Barteau, J. Catal. 2004, 224, 489. [7] B. Hinnemann, P. G. Moses, J. Bonde, K. P. Jorgensen, J. H. Nielsen,
S. Horch, I. Chorkendorff, J. K. Nørskov, J. Am. Chem. Soc. 2005, 127, 5308.
[8] T. F. Jaramillo, K. P. Jørgensen, J. Bonde, J. H. Nielsen, S. Horch, I. Chorkendorff, Science 2007, 317, 100.
[9] J. K. Nørskov, T. Bligaard, A. Logadottir, S. Bahn, L. B. Hansen, M. Bollinger, H. Bengaard, B. Hammer, Z. Sljivancanin, M. Mavrikakis, Y. Xu, S. Dahl, C. J. H. Jacobsen, J. Catal. 2002, 209, 275.
[10] J. K. Nørskov, F. Abild-Pedersen, F. Studt, T. Bligaard, Proceedings of the National Academy of Science, USA accepted.
[11] B. Hammer, J. K. Nørskov, Surf. Sci. 1995, 343, 211. [12] J. Greeley, M. Mavrikakis, Nature Mater. 2004, 3, 810. [13] V. R. Stamenkovic, B. S. Mun, M. Arenz, K. J. J. Mayrhofer, C. A.
Lucas, G. Wang, P. N. Ross, N. M. Markovic, Nature Mater. 2007, 6, 241.
[14] P. Ferrin, A. U. Nilekar, J. Greeley, M. Mavrikakis, J. Rossmeisl, Surf. Sci. 2008, 602, 3424.
5
[15] M. P. Humbert, J. G. Chen, J. Catal. 2008, 257, 297. [16] T. Bligaard, J. K. Nørskov, S. Dahl, J. Matthiesen, C. H. Christensen,
J. Sehested, J. Catal. 2004, 224, 206. [17] J. R. Kitchin, J. K. Nørskov, M. A. Barteau, J. G. Chen, J. Chem. Phys.
2004, 120, 10240. [18] F. Abild-Pedersen, J. Greeley, F. Studt, J. Rossmeisl, T. R. Munter, P.
G. Moses, E. Skúlason, T. Bligaard, J. K. Nørskov, Phys. Rev. Lett. 2007, 99, 016105.
[19] A. Michaelides, Z.-P. Liu, C. J. Zhang, A. Alavi, D. A. King, P. Hu, J. Am. Chem. Soc. 2003, 125, 3704.
[20] V. Pallassana, M. Neurock, J. Catal. 2000, 191, 301. [21] S. Wang, B. Temel, G. Jones, L. C. Grabow, F. Studt, T. Bligaard, F.
Abild-Pedersen, C. H. Christensen, J. K. Nørskov, Catal. Lett. 2010, DOI: 10.1007/s10562.
[22] K. Weissermel, J.-H. Arpe, Industrial Organic Chemistry, 4th ed., VCH Wiley, 2003.
[23] J. Sauer, M. Bewersdorf, M. Köstner, M. Rinner, D. Wolf, in Handbook of Heterogeneous Catalysis, 2 ed. (Eds.: G. Ertl, H. Knözinger, F. Schüth, J. Weitkamp), Wiley-VCH Verlag GmbH & Co. KGaA, 2008, pp. 2592.
[24] L. Andrussow, Chem. Ing. Tech. 1955, 27, 469. [25] E. Koberstein, Ind. Eng. Chem. Process Des. Dev. 1973, 12, 444. [26] L. D. Schmidt, D. Luss, J. Catal. 1971, 22, 269. [27] B. A. Cowans, K. A. Jurman, W. N. Delgass, Y. Z. Li, R.
Reifenberger, T. A. Koch, J. Catal. 1990, 125, 501. [28] J. Rostrup-Nielsen, J. Nørskov, Top. Catal. 2006, 40, 45.
[29] G. Jones, J. G. Jakobsen, S. S. Shim, J. Kleis, M. P. Andersson, J. Rossmeisl, F. Abild-Pedersen, T. Bligaard, S. Helveg, B. Hinnemann, J. R. Rostrup-Nielsen, I. Chorkendorff, J. Sehested, J. K. Norskov, J. Catal. 2008, 259, 147.
[30] S. Wang, V. Petzold, V. Tripkovic, J. Kleis, J. G. Howalt, E. Skúlason, E. Fernández, B. Hvolbæk, G. Jones, A. Toftelund, H. Falsig, M. Björketun, F. Studt, F. Abild-Pedersen, J. Rossmeisl, J. K. Nørskov, T. Bligaard, submitted.
[31] http://webbook.nist.gov/chemistry/ [32] D. Hasenberg, L. D. Schmidt, J. Catal. 1985, 91, 116. [33] D. Hasenberg, L. D. Schmidt, J. Catal. 1986, 97, 156. [34] D. Hasenberg, L. D. Schmidt, J. Catal. 1987, 104, 441. [35] E. Herceg, M. Trenary, J. Am. Chem. Soc. 2003, 125, 15758. [36] E. Herceg, M. Trenary, J. Phys. Chem. B 2005, 109, 17560. [37] M. Diefenbach, M. Bronstrup, M. Aschi, D. Schroder, H. Schwarz, J.
Am. Chem. Soc. 1999, 121, 10614. [38] R. Horn, G. Mestl, M. Thiede, F. C. Jentoft, P. M. Schmidt, M.
Bewersdorf, R. Weber, R. Schlogl, PCCP 2004, 6, 4514. [39] L. C. Grabow, B. Hvolbæk, J. K. Nørskov, Top. Catal. 2009, 53, 298. [40] C. T. Campbell, Top. Catal. 1994, 1, 353. [41] E. M. Fernandez, P. G. Moses, A. Toftelund, H. A. Hansen, J. I.
Martinez, F. Abild-Pedersen, J. Kleis, B. Hinnemann, J. Rossmeisl, T. Bligaard, J. K. Nørskov, Angew. Chem.-Int. Edit. 2008, 47, 4683.
6
Entry for the Table of Contents Layout 1:
Heterogeneous Catalysis
Lars C. Grabow, Felix Studt, Frank Abild-Pedersen, Vivien Petzold, Jesper Kleis, Thomas Bligaard and Jens K. Nørskov*__________ Page – Page
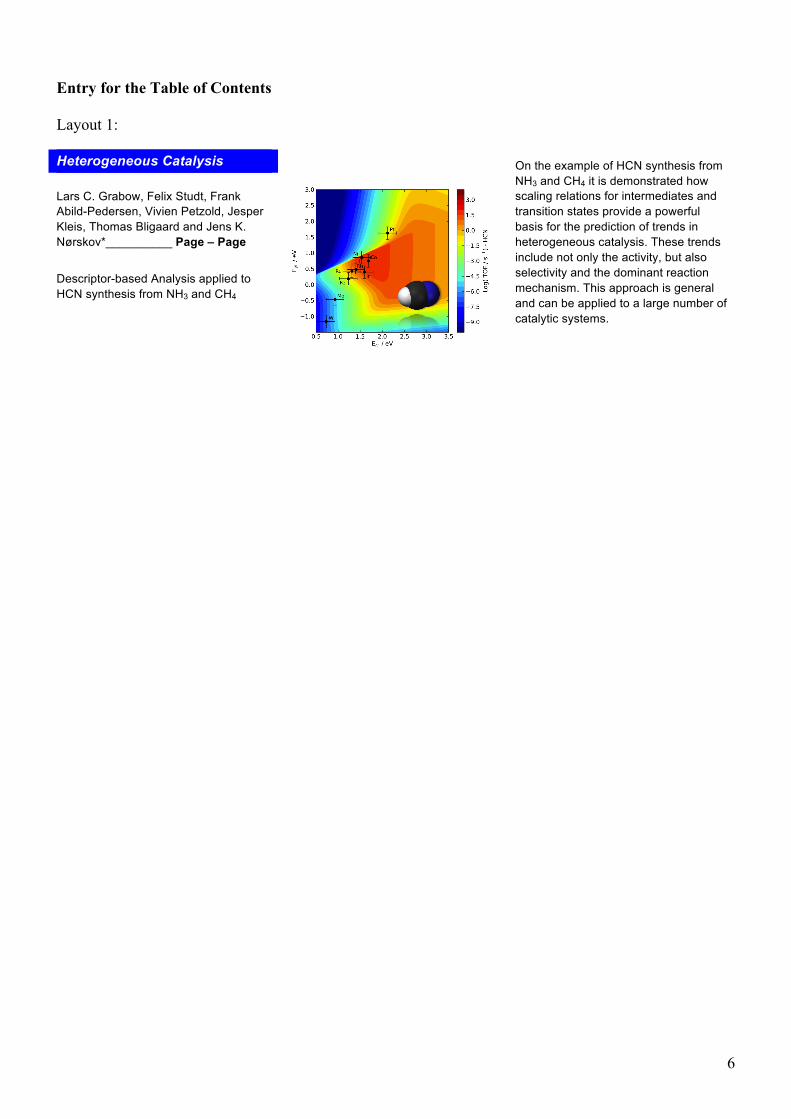
Descriptor-based Analysis applied to HCN synthesis from NH3 and CH4
On the example of HCN synthesis from NH3 and CH4 it is demonstrated how scaling relations for intermediates and transition states provide a powerful basis for the prediction of trends in heterogeneous catalysis. These trends include not only the activity, but also selectivity and the dominant reaction mechanism. This approach is general and can be applied to a large number of catalytic systems.
7
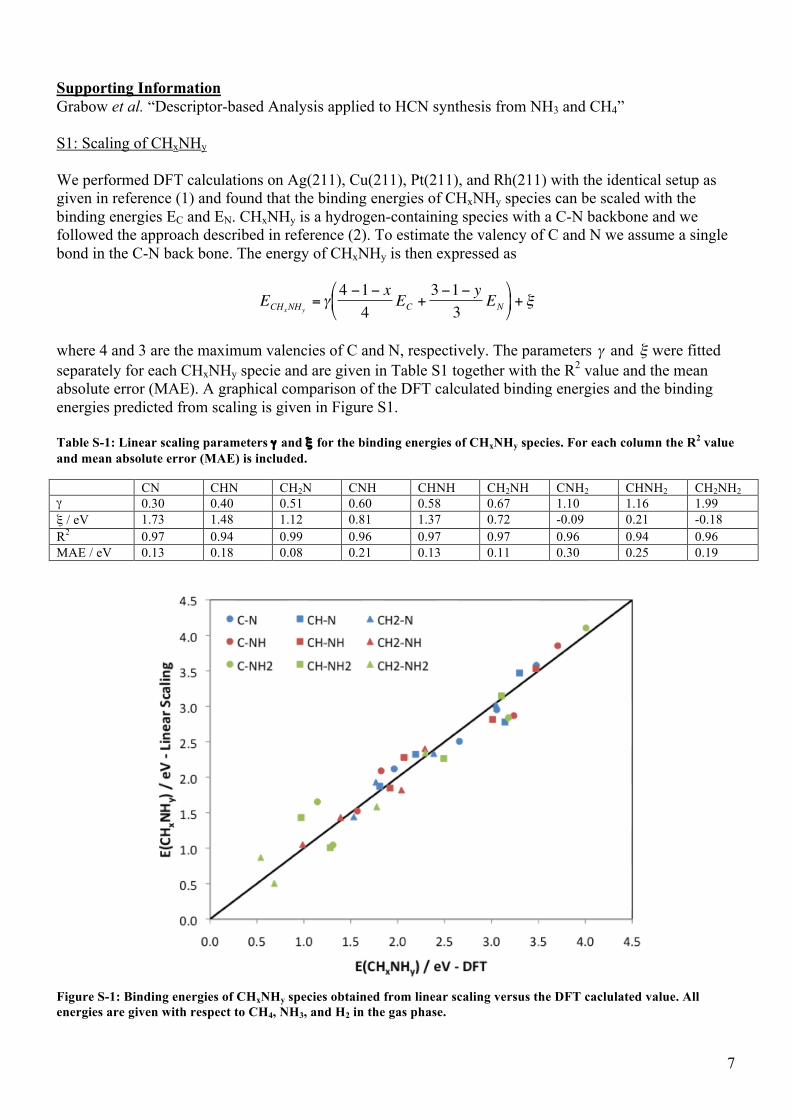
Supporting Information Grabow et al. “Descriptor-based Analysis applied to HCN synthesis from NH3 and CH4” S1: Scaling of CHxNHy We performed DFT calculations on Ag(211), Cu(211), Pt(211), and Rh(211) with the identical setup as given in reference (1) and found that the binding energies of CHxNHy species can be scaled with the binding energies EC and EN. CHxNHy is a hydrogen-containing species with a C-N backbone and we followed the approach described in reference (2). To estimate the valency of C and N we assume a single bond in the C-N back bone. The energy of CHxNHy is then expressed as
€
ECHxNHy= γ
4 −1− x4
EC +3 −1− y3
EN
⎛
⎝ ⎜
⎞
⎠ ⎟ + ξ
where 4 and 3 are the maximum valencies of C and N, respectively. The parameters
€
γ and
€
ξ were fitted separately for each CHxNHy specie and are given in Table S1 together with the R2 value and the mean absolute error (MAE). A graphical comparison of the DFT calculated binding energies and the binding energies predicted from scaling is given in Figure S1. Table S-1: Linear scaling parameters γ and ξ for the binding energies of CHxNHy species. For each column the R2 value and mean absolute error (MAE) is included.
CN CHN CH2N CNH CHNH CH2NH CNH2 CHNH2 CH2NH2 γ 0.30 0.40 0.51 0.60 0.58 0.67 1.10 1.16 1.99 ξ / eV 1.73 1.48 1.12 0.81 1.37 0.72 -0.09 0.21 -0.18 R2 0.97 0.94 0.99 0.96 0.97 0.97 0.96 0.94 0.96 MAE / eV 0.13 0.18 0.08 0.21 0.13 0.11 0.30 0.25 0.19
Figure S-1: Binding energies of CHxNHy species obtained from linear scaling versus the DFT caclulated value. All energies are given with respect to CH4, NH3, and H2 in the gas phase.
8
S2: Detailed description of the microkinetic model The rate and equilibrium constants for all 27 elementary step in the model were calculated using the following standard equations.
€
Ki = exp −ΔGi(T)kT
⎛
⎝ ⎜
⎞
⎠ ⎟
€
kifwd =
kbThexp
−ΔGa,i(T)kT
⎛
⎝ ⎜
⎞
⎠ ⎟
€
kirev =
kifwd
Ki
We assume that the hydrogenation/dehydrogenation steps CHxNHy* + (x+y-1)* → HCN* + (x+y-1)H* are fast and set the activation energy ΔGa,i(T) = 0 for these steps. For all other cases we calculated the temperature dependent Gibb’s free energy for adsorbed species and transition states X* from DFT using the expression
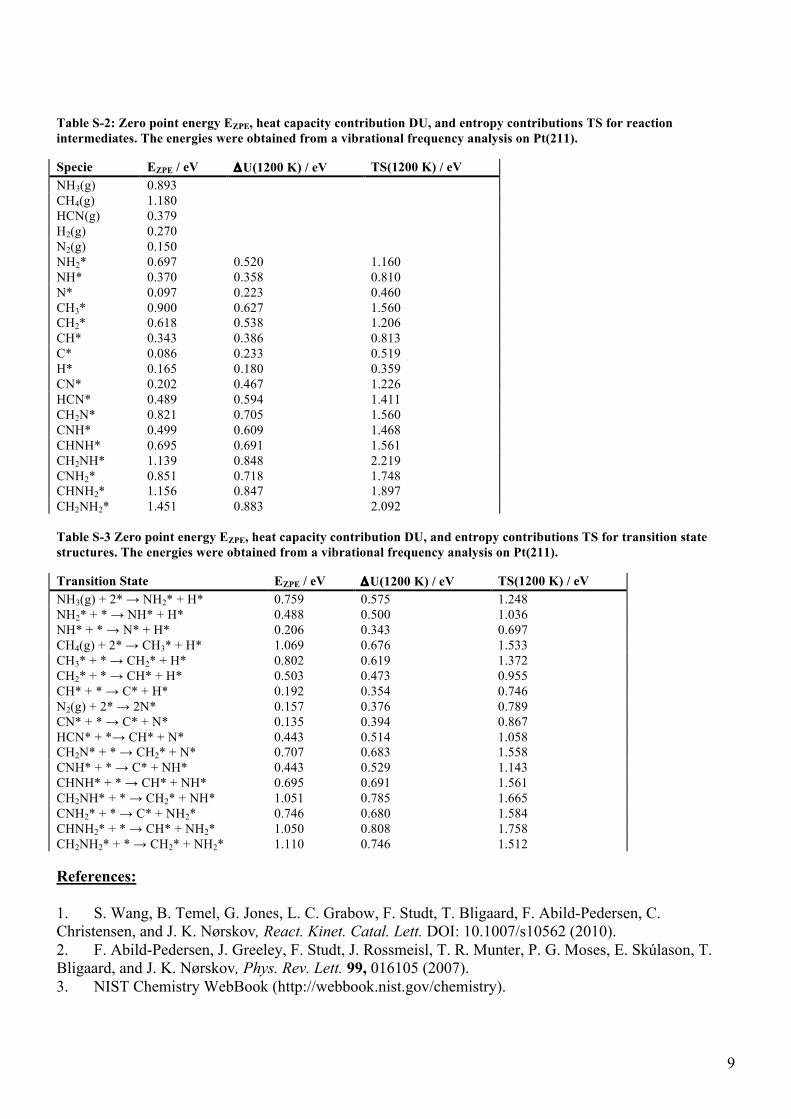
where EX* is the electronic energy and was obtained from the referenced scaling relations. The zero point energy EZPE, internal energy change ΔU and entropy S for each specie and all transition states were calculated from the vibrational frequencies on Pt(211) at 1200 K and assumed to be constant. The values for EZPE, ΔU, and S are summarized in Table S-2 and Table S-3. For gas phase species we used the Shomate equation (3) to estimate the temperature correction and entropy contributions to the Gibb’s free energy. The maximum surface coverage was limited to 1 ML and lateral interactions on the surface were not considered. As representative reaction conditions for industrial HCN synthesis we chose P= 1 atm , T = 1373 K with the initial mole fractions y0
NH3 = 0.107, y0CH4 = 0.093 assuming a conversion level of 15% with respect to
CH4 and a selectivity of HCN/N2 = 2. This results in the following gas phase composition: yNH3 = 0.0767, yCH4 = 0.0766, yHCN = 0.0135, yH2 = 0.0507, yN2 = 0.0068. Steady-state solutions were found by integrating the transient model until steady-state conditions were reached. The numerical integration of the ODE system was done using scipy.integrate.odeint from the SciPy package for python (www.scipy.org)
9
Table S-2: Zero point energy EZPE, heat capacity contribution DU, and entropy contributions TS for reaction intermediates. The energies were obtained from a vibrational frequency analysis on Pt(211).
Specie EZPE / eV ΔU(1200 K) / eV TS(1200 K) / eV NH3(g) 0.893 CH4(g) 1.180 HCN(g) 0.379 H2(g) 0.270 N2(g) 0.150 NH2* 0.697 0.520 1.160 NH* 0.370 0.358 0.810 N* 0.097 0.223 0.460 CH3* 0.900 0.627 1.560 CH2* 0.618 0.538 1.206 CH* 0.343 0.386 0.813 C* 0.086 0.233 0.519 H* 0.165 0.180 0.359 CN* 0.202 0.467 1.226 HCN* 0.489 0.594 1.411 CH2N* 0.821 0.705 1.560 CNH* 0.499 0.609 1.468 CHNH* 0.695 0.691 1.561 CH2NH* 1.139 0.848 2.219 CNH2* 0.851 0.718 1.748 CHNH2* 1.156 0.847 1.897 CH2NH2* 1.451 0.883 2.092 Table S-3 Zero point energy EZPE, heat capacity contribution DU, and entropy contributions TS for transition state structures. The energies were obtained from a vibrational frequency analysis on Pt(211).
Transition State EZPE / eV ΔU(1200 K) / eV TS(1200 K) / eV NH3(g) + 2* → NH2* + H* 0.759 0.575 1.248 NH2* + * → NH* + H* 0.488 0.500 1.036 NH* + * → N* + H* 0.206 0.343 0.697 CH4(g) + 2* → CH3* + H* 1.069 0.676 1.533 CH3* + * → CH2* + H* 0.802 0.619 1.372 CH2* + * → CH* + H* 0.503 0.473 0.955 CH* + * → C* + H* 0.192 0.354 0.746 N2(g) + 2* → 2N* 0.157 0.376 0.789 CN* + * → C* + N* 0.135 0.394 0.867 HCN* + *→ CH* + N* 0.443 0.514 1.058 CH2N* + * → CH2* + N* 0.707 0.683 1.558 CNH* + * → C* + NH* 0.443 0.529 1.143 CHNH* + * → CH* + NH* 0.695 0.691 1.561 CH2NH* + * → CH2* + NH* 1.051 0.785 1.665 CNH2* + * → C* + NH2* 0.746 0.680 1.584 CHNH2* + * → CH* + NH2* 1.050 0.808 1.758 CH2NH2* + * → CH2* + NH2* 1.110 0.746 1.512 References: 1. S. Wang, B. Temel, G. Jones, L. C. Grabow, F. Studt, T. Bligaard, F. Abild-Pedersen, C. Christensen, and J. K. Nørskov, React. Kinet. Catal. Lett. DOI: 10.1007/s10562 (2010). 2. F. Abild-Pedersen, J. Greeley, F. Studt, J. Rossmeisl, T. R. Munter, P. G. Moses, E. Skúlason, T. Bligaard, and J. K. Nørskov, Phys. Rev. Lett. 99, 016105 (2007). 3. NIST Chemistry WebBook (http://webbook.nist.gov/chemistry).