Embed Size (px)
Citation preview

LOCALITY
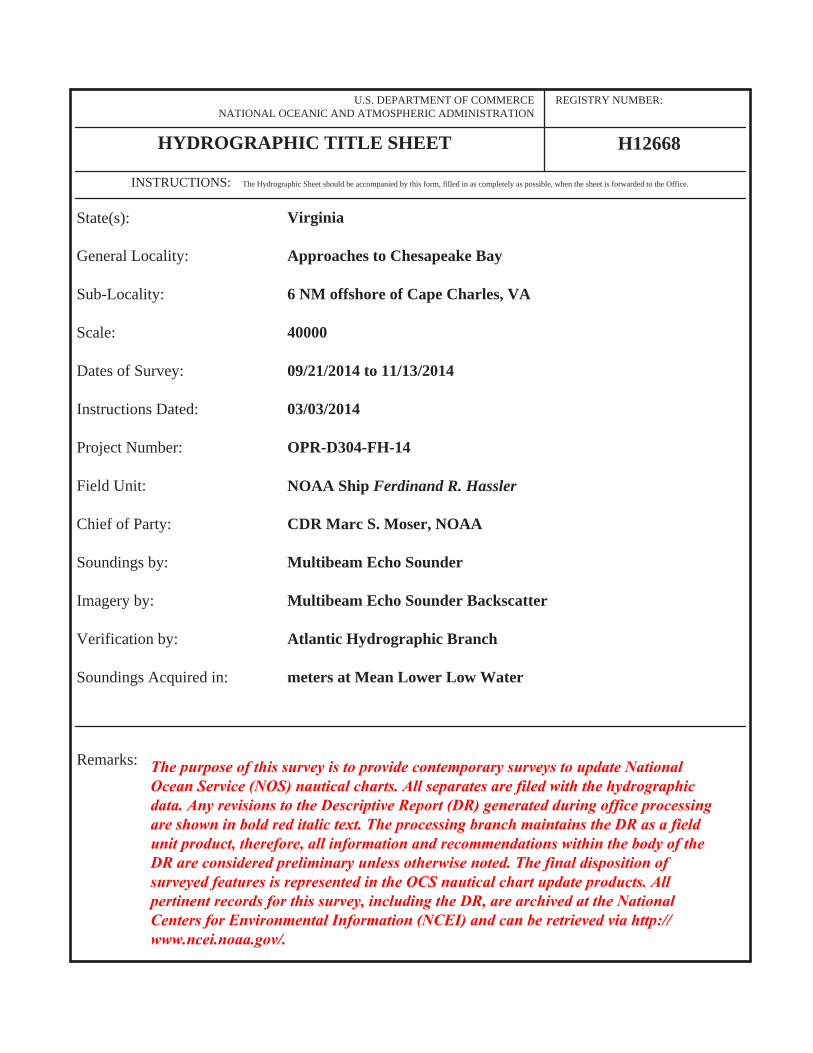
VirginiaState(s):
U.S. Department of CommerceNational Oceanic and Atmospheric Administration
National Ocean Survey
DESCRIPTIVE REPORT
Type of Survey:
2014
CHIEF OF PARTYCDR Marc S. Moser, NOAA
Approaches to Chesapeake Bay
6 NM offshore of Cape Charles, VA
General Locality:
Sub-locality:
Registry Number:
Navigable Area
H12668
LIBRARY & ARCHIVES
Date:
H12
668
U.S. DEPARTMENT OF COMMERCENATIONAL OCEANIC AND ATMOSPHERIC ADMINISTRATION
REGISTRY NUMBER:
H12668HYDROGRAPHIC TITLE SHEET
INSTRUCTIONS: The Hydrographic Sheet should be accompanied by this form, filled in as completely as possible, when the sheet is forwarded to the Office.
State(s):
General Locality:
Scale:
Instructions Dated:
Field Unit:
Chief of Party:
Soundings by:
Imagery by:
Verification by:
Soundings Acquired in:
Dates of Survey:
Project Number:
Virginia
Approaches to Chesapeake Bay
Sub-Locality: 6 NM offshore of Cape Charles, VA
40000
09/21/2014 to 11/13/2014
OPR-D304-FH-14
NOAA Ship Ferdinand R. Hassler
CDR Marc S. Moser, NOAA
Multibeam Echo Sounder
Multibeam Echo Sounder Backscatter
Atlantic Hydrographic Branch
meters at Mean Lower Low Water
Remarks:
03/03/2014
The purpose of this survey is to provide contemporary surveys to update National Ocean Service (NOS) nautical charts. All separates are filed with the hydrographic data. Any revisions to the Descriptive Report (DR) generated during office processing are shown in bold red italic text. The processing branch maintains the DR as a field unit product, therefore, all information and recommendations within the body of the DR are considered preliminary unless otherwise noted. The final disposition of surveyed features is represented in the OCS nautical chart update products. All pertinent records for this survey, including the DR, are archived at the National Centers for Environmental Information (NCEI) and can be retrieved via http://www.ncei.noaa.gov/.
i
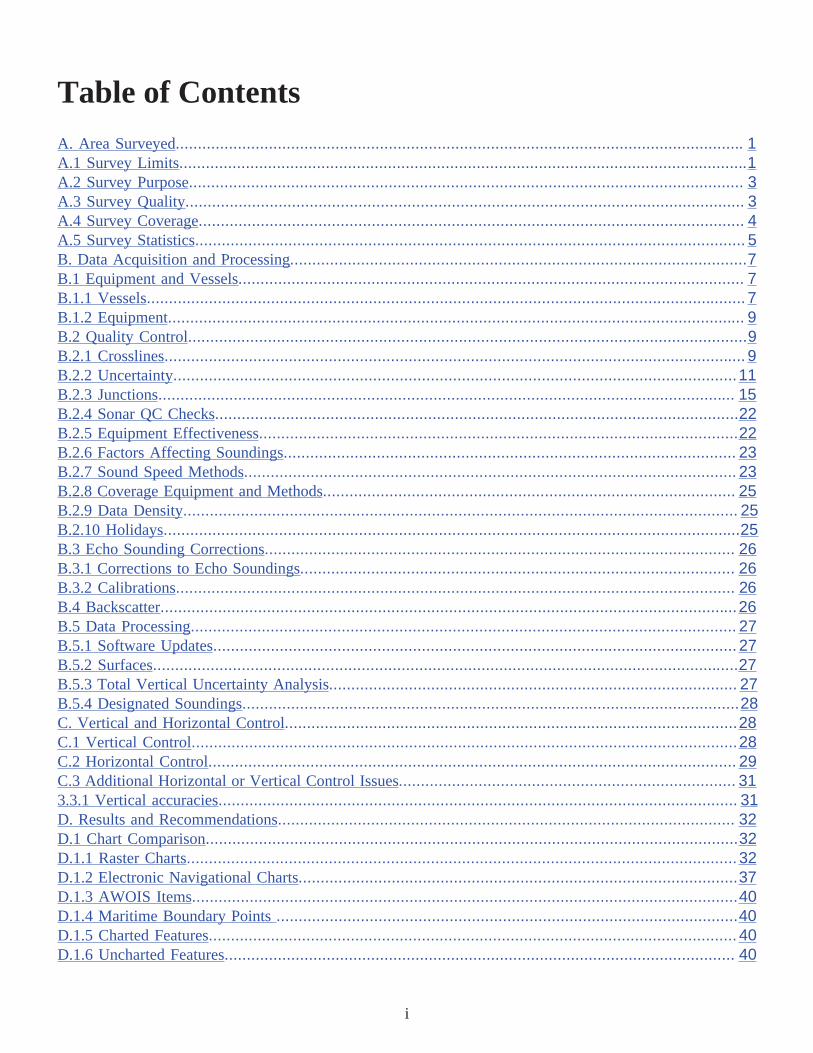
Table of ContentsA. Area Surveyed................................................................................................................................ 1A.1 Survey Limits................................................................................................................................1A.2 Survey Purpose............................................................................................................................. 3A.3 Survey Quality.............................................................................................................................. 3A.4 Survey Coverage........................................................................................................................... 4A.5 Survey Statistics............................................................................................................................ 5B. Data Acquisition and Processing.......................................................................................................7B.1 Equipment and Vessels.................................................................................................................. 7B.1.1 Vessels....................................................................................................................................... 7B.1.2 Equipment.................................................................................................................................. 9B.2 Quality Control..............................................................................................................................9B.2.1 Crosslines................................................................................................................................... 9B.2.2 Uncertainty...............................................................................................................................11B.2.3 Junctions.................................................................................................................................. 15B.2.4 Sonar QC Checks......................................................................................................................22B.2.5 Equipment Effectiveness............................................................................................................22B.2.6 Factors Affecting Soundings...................................................................................................... 23B.2.7 Sound Speed Methods............................................................................................................... 23B.2.8 Coverage Equipment and Methods............................................................................................. 25B.2.9 Data Density............................................................................................................................. 25B.2.10 Holidays..................................................................................................................................25B.3 Echo Sounding Corrections.......................................................................................................... 26B.3.1 Corrections to Echo Soundings.................................................................................................. 26B.3.2 Calibrations.............................................................................................................................. 26B.4 Backscatter..................................................................................................................................26B.5 Data Processing........................................................................................................................... 27B.5.1 Software Updates...................................................................................................................... 27B.5.2 Surfaces....................................................................................................................................27B.5.3 Total Vertical Uncertainty Analysis............................................................................................ 27B.5.4 Designated Soundings................................................................................................................28C. Vertical and Horizontal Control......................................................................................................28C.1 Vertical Control...........................................................................................................................28C.2 Horizontal Control....................................................................................................................... 29C.3 Additional Horizontal or Vertical Control Issues............................................................................ 313.3.1 Vertical accuracies..................................................................................................................... 31D. Results and Recommendations....................................................................................................... 32D.1 Chart Comparison........................................................................................................................32D.1.1 Raster Charts............................................................................................................................ 32D.1.2 Electronic Navigational Charts...................................................................................................37D.1.3 AWOIS Items...........................................................................................................................40D.1.4 Maritime Boundary Points ........................................................................................................40D.1.5 Charted Features....................................................................................................................... 40D.1.6 Uncharted Features................................................................................................................... 40
ii
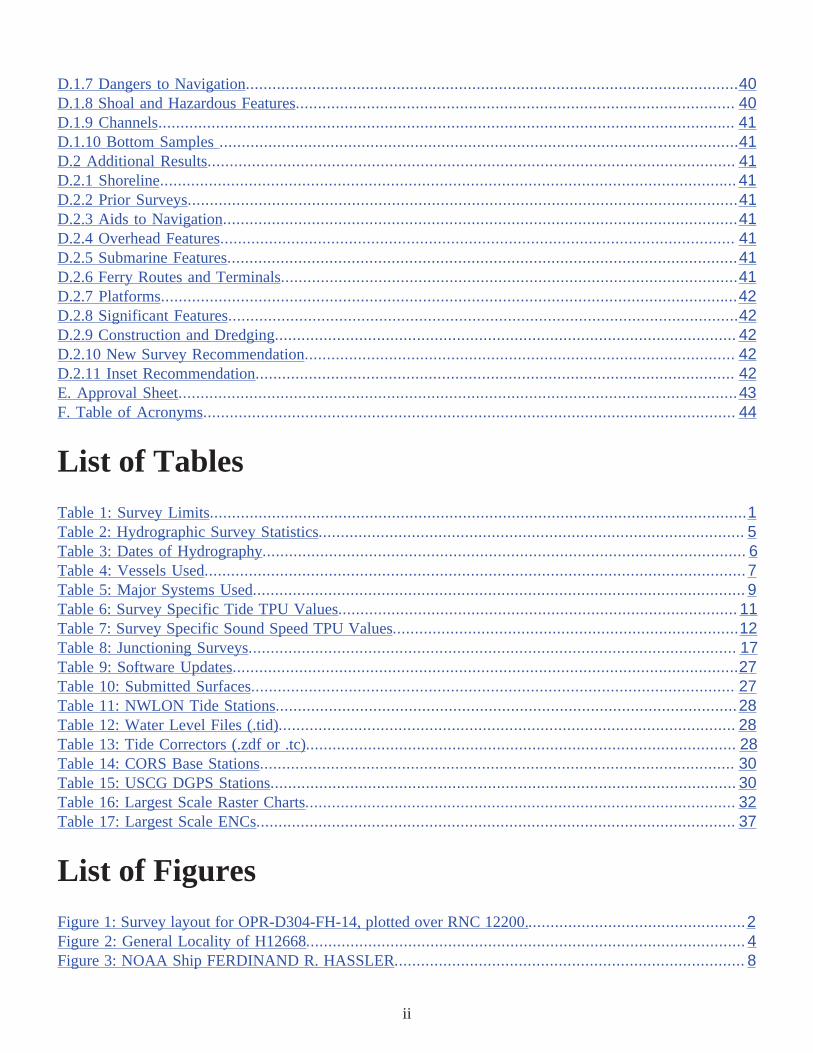
D.1.7 Dangers to Navigation...............................................................................................................40D.1.8 Shoal and Hazardous Features................................................................................................... 40D.1.9 Channels.................................................................................................................................. 41D.1.10 Bottom Samples .....................................................................................................................41D.2 Additional Results....................................................................................................................... 41D.2.1 Shoreline.................................................................................................................................. 41D.2.2 Prior Surveys............................................................................................................................41D.2.3 Aids to Navigation....................................................................................................................41D.2.4 Overhead Features.................................................................................................................... 41D.2.5 Submarine Features...................................................................................................................41D.2.6 Ferry Routes and Terminals.......................................................................................................41D.2.7 Platforms..................................................................................................................................42D.2.8 Significant Features...................................................................................................................42D.2.9 Construction and Dredging........................................................................................................ 42D.2.10 New Survey Recommendation................................................................................................. 42D.2.11 Inset Recommendation............................................................................................................ 42E. Approval Sheet..............................................................................................................................43F. Table of Acronyms........................................................................................................................ 44
List of TablesTable 1: Survey Limits.........................................................................................................................1Table 2: Hydrographic Survey Statistics................................................................................................ 5Table 3: Dates of Hydrography............................................................................................................. 6Table 4: Vessels Used..........................................................................................................................7Table 5: Major Systems Used............................................................................................................... 9Table 6: Survey Specific Tide TPU Values.......................................................................................... 11Table 7: Survey Specific Sound Speed TPU Values..............................................................................12Table 8: Junctioning Surveys.............................................................................................................. 17Table 9: Software Updates..................................................................................................................27Table 10: Submitted Surfaces............................................................................................................. 27Table 11: NWLON Tide Stations........................................................................................................28Table 12: Water Level Files (.tid)....................................................................................................... 28Table 13: Tide Correctors (.zdf or .tc)................................................................................................. 28Table 14: CORS Base Stations........................................................................................................... 30Table 15: USCG DGPS Stations......................................................................................................... 30Table 16: Largest Scale Raster Charts................................................................................................. 32Table 17: Largest Scale ENCs............................................................................................................ 37
List of FiguresFigure 1: Survey layout for OPR-D304-FH-14, plotted over RNC 12200..................................................2Figure 2: General Locality of H12668................................................................................................... 4Figure 3: NOAA Ship FERDINAND R. HASSLER............................................................................... 8
iii
Figure 4: H12668 MBES crossline data overlaid on mainscheme lines................................................... 10Figure 5: H12668 crossline difference statistics: mainscheme minus crossline.........................................11Figure 6: H12668 Line status..............................................................................................................13Figure 7: Example of soundings reduced via VDatum...........................................................................13Figure 8: Example of soundings reduced with a "mixed" solution.......................................................... 14Figure 9: Uncertainty values used for computing TPU on H12668......................................................... 14Figure 10: H12668 junctions...............................................................................................................16Figure 11: Differenced surface statistics - H12668 minus H12559......................................................... 18Figure 12: Differenced surface statistics - H12668 minus H12560......................................................... 19Figure 13: Differenced surface statistics - H12668 minus H12100......................................................... 20Figure 14: Differenced surface statistics - H12668 minus H12037......................................................... 21Figure 15: Differenced surface statistics - H12668 minus H12667......................................................... 22Figure 16: H12668 sound speed profile locations - lines colored by SV profile....................................... 24Figure 17: Example of holidays found within the finalized surface. Holidays have been examined by thehydrographer and are deemed insignificant.......................................................................................... 26Figure 18: CARIS Subset Editor - GPS derived VDatum heights showing better agreement......................31Figure 19: CARIS Subset Editor - Discrete Zoning.............................................................................. 32Figure 20: H12668 surveyed soundings in feet (red < 30, green 30 - 36, blue > 36) overlaid on RNC 12224.Shifting shoals are evident from the comparison...................................................................................33Figure 21: H12668 surveyed soundings in feet (red < 30, green 30 - 36, blue > 36) in the vicinity of SmithIsland Shoal overlaid on RNC 12224. Shifting shoals are evident from the comparison............................ 34Figure 22: H12668 surveyed soundings in feet (red < 30, green 30 - 36, blue > 36) in the vicinity of SmithIsland Shoal overlaid on RNC 12208. Shifting shoals are evident from the comparison............................ 35Figure 23: H12668 surveyed soundings in feet (red < 30, green 30 - 36, blue > 36) in the vicinity of SmithIsland Shoal overlaid on RNC 12221. Shifting shoals are evident from the comparison............................ 36Figure 24: H12668 surveyed soundings in feet (red < 30, green 30 - 36, blue > 36) in the vicinity of SmithIsland Shoal overlaid on RNC 12221. Shifting shoals are evident from the comparison............................ 37Figure 25: ENC US5VA14M comparison............................................................................................ 38Figure 26: Surface generated by interpolating the differenced point cloud between ENC and survey H12668overlaid on the finalized bathymetry with vertical exaggeration. Greater ranges of differences seem to be inareas with sea floor relief................................................................................................................... 39

H12668 NOAA Ship Ferdinand R. Hassler
1
Descriptive Report to Accompany Survey H12668
Project: OPR-D304-FH-14
Locality: Approaches to Chesapeake Bay
Sublocality: 6 NM offshore of Cape Charles, VA
Scale: 1:40000
September 2014 - November 2014
NOAA Ship Ferdinand R. Hassler
Chief of Party: CDR Marc S. Moser, NOAA
A. Area Surveyed
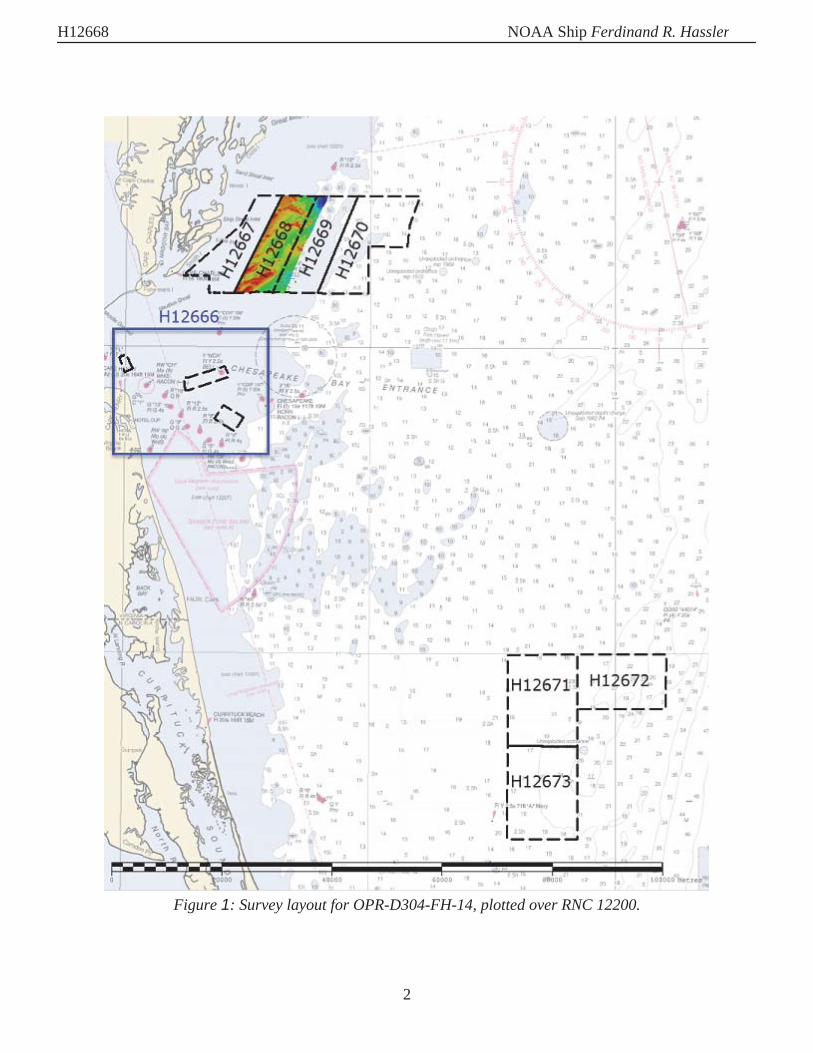
Survey H12668 was conducted near the locality of Approaches to Chesapeake Bay, with a sublocality of 6NM offshore of Cape Charles. Figures 1 and 2 show the general locality of the survey data submitted.
A.1 Survey Limits
Data were acquired within the following survey limits:
Northwest Limit Southeast Limit37° 14' 59.95" N75° 46' 49.53" W
37° 5' 10.44" N75° 35' 11.83" W
Table 1: Survey Limits
H12668 NOAA Ship Ferdinand R. Hassler
2
Figure 1: Survey layout for OPR-D304-FH-14, plotted over RNC 12200.

H12668 NOAA Ship Ferdinand R. Hassler
3
Sheet H12668 extended its sheet limits to encompass the area that was surveyed on the western side of sheetH12669, as shown in Figure 1. Survey time on project expired after beginning H12669 and it was decided toadd the data to H12668 instead of submitting a separate survey.
A.2 Survey Purpose
The purpose of this project is to provide contemporary surveys to update the National Ocean Service (NOS)nautical charting products.
A.3 Survey Quality
The entire survey is adequate to supersede previous data.

H12668 NOAA Ship Ferdinand R. Hassler
4
A.4 Survey Coverage
Figure 2: General Locality of H12668
Some holidays exist in the coverage of the submitted 0.5-meter surface. Additional discussion can be foundin Section B.2.10.
H12668 NOAA Ship Ferdinand R. Hassler
5
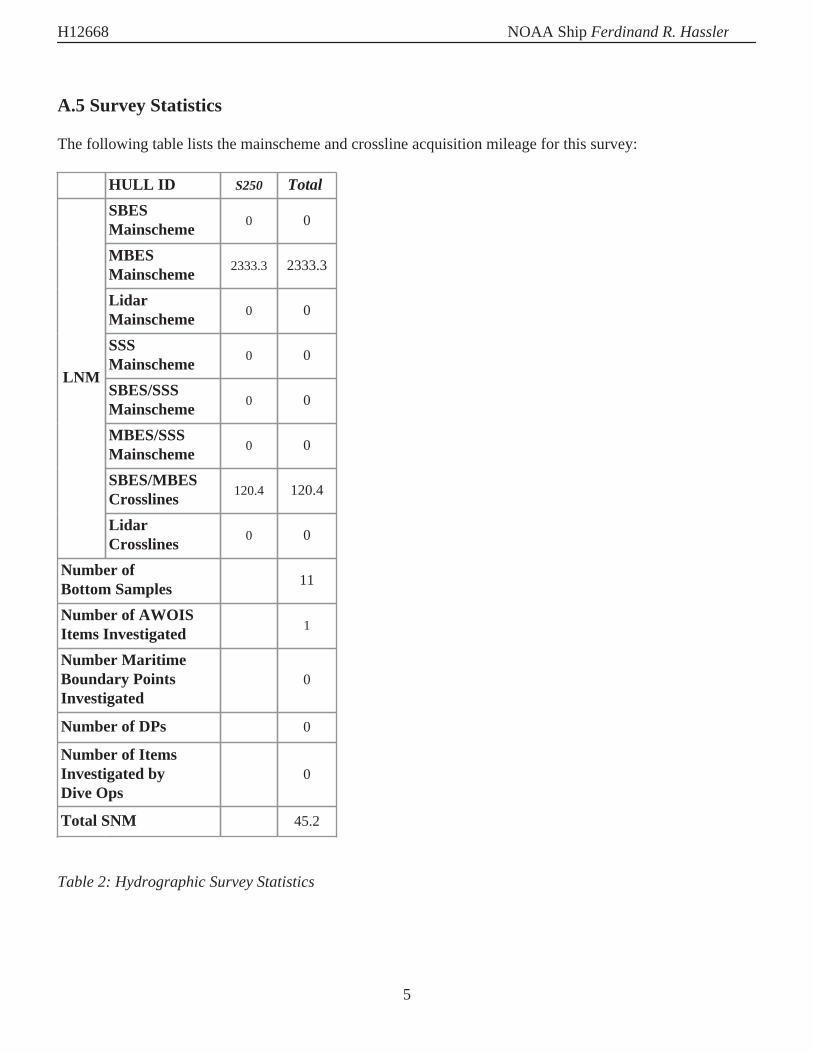
A.5 Survey Statistics
The following table lists the mainscheme and crossline acquisition mileage for this survey:
HULL ID S250 Total SBESMainscheme 0 0
MBESMainscheme 2333.3 2333.3
LidarMainscheme 0 0
SSSMainscheme 0 0
SBES/SSSMainscheme 0 0
MBES/SSSMainscheme 0 0
SBES/MBESCrosslines 120.4 120.4
LNM
LidarCrosslines 0 0
Number ofBottom Samples 11
Number of AWOISItems Investigated 1
Number MaritimeBoundary PointsInvestigated
0
Number of DPs 0
Number of ItemsInvestigated byDive Ops
0
Total SNM 45.2
Table 2: Hydrographic Survey Statistics
H12668 NOAA Ship Ferdinand R. Hassler
6
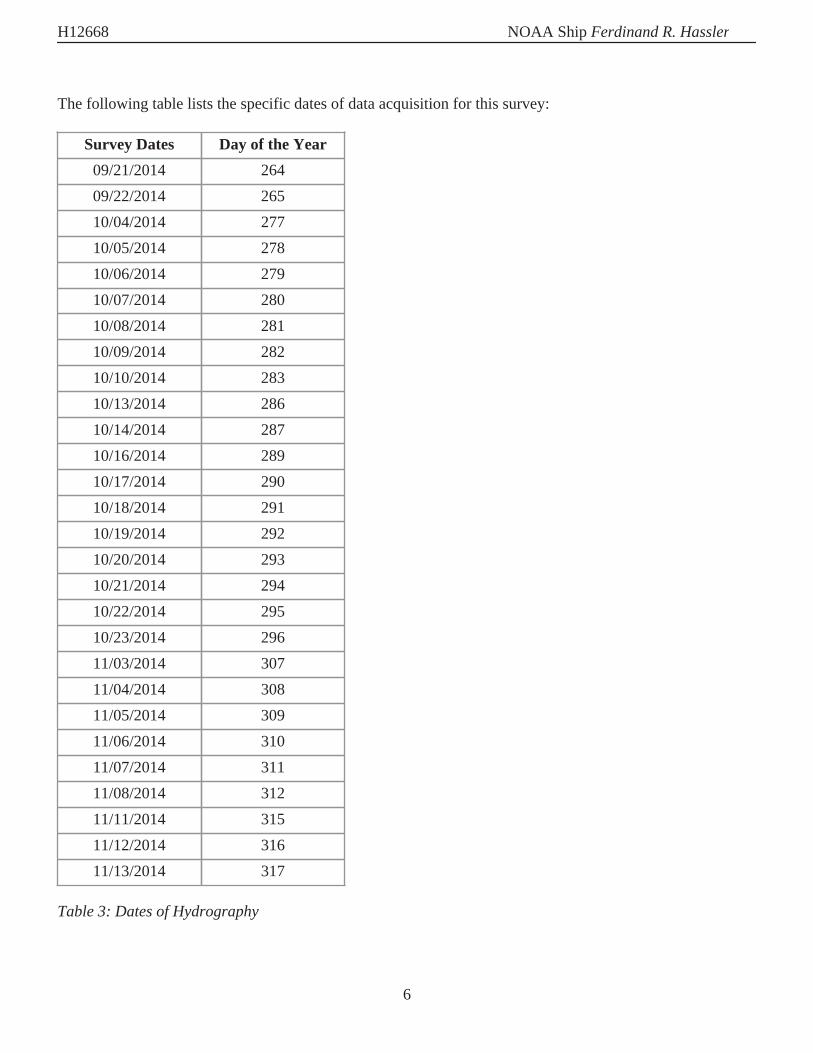
The following table lists the specific dates of data acquisition for this survey:
Survey Dates Day of the Year09/21/2014 26409/22/2014 26510/04/2014 27710/05/2014 27810/06/2014 27910/07/2014 28010/08/2014 28110/09/2014 28210/10/2014 28310/13/2014 28610/14/2014 28710/16/2014 28910/17/2014 29010/18/2014 29110/19/2014 29210/20/2014 29310/21/2014 29410/22/2014 29510/23/2014 29611/03/2014 30711/04/2014 30811/05/2014 30911/06/2014 31011/07/2014 31111/08/2014 31211/11/2014 31511/12/2014 31611/13/2014 317
Table 3: Dates of Hydrography
H12668 NOAA Ship Ferdinand R. Hassler
7
Due to equipment issues, the starboard MBES was not utilized for the entirety of H12668. Additionalinformation can be found in Section B.2.5 and the submitted DAPR. The port MBES exclusively collectedall data being submitted as survey H12668.
B. Data Acquisition and Processing
B.1 Equipment and Vessels
Refer to the Data Acquisition and Processing Report (DAPR) for a complete description of data acquisitionand processing systems, survey vessels, quality control procedures, and data processing methods. Additionalinformation to supplement sounding and survey data, and any deviations from the DAPR are discussed in thefollowing sections.
B.1.1 Vessels
The following vessels were used for data acquisition during this survey:
Hull ID S250LOA 37.7 metersDraft 3.77 meters
Table 4: Vessels Used

H12668 NOAA Ship Ferdinand R. Hassler
8
Figure 3: NOAA Ship FERDINAND R. HASSLER
NOAA Ship FERDINAND R. HASSLER (S250), shown in Figure 3, acquired all data within the limits ofH12668.

H12668 NOAA Ship Ferdinand R. Hassler
9
B.1.2 Equipment
The following major systems were used for data acquisition during this survey:
Manufacturer Model TypeRESON 7125 MBES
Applanix POS M/V 320 V5 Positioning andAttitude System
Hemisphere MBX-4 Positioning SystemBrooke Ocean MVP-200 Sound Speed System
AML MicroCTD Conductivity, Temperature,and Depth Sensor
RESON SVP-70 Sound Speed System
Table 5: Major Systems Used
B.2 Quality Control
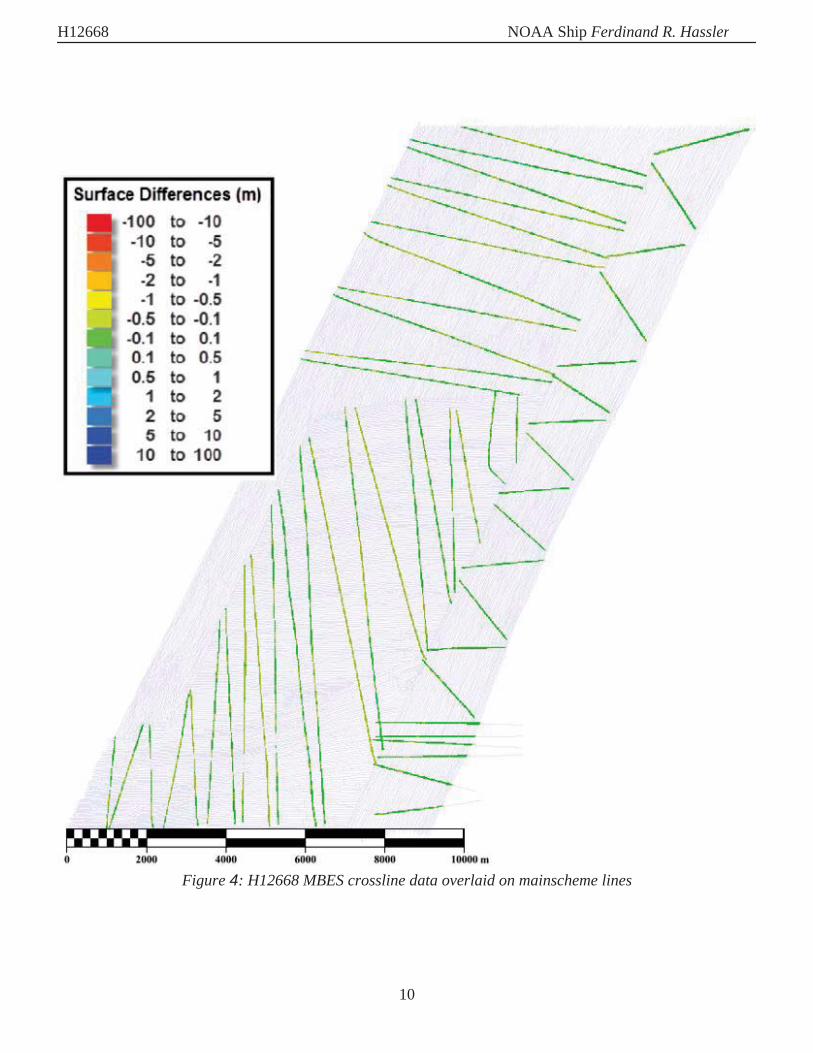
B.2.1 Crosslines
Crosslines acquired for this survey totaled 5% of mainscheme acquisition.
Multibeam crosslines were acquired using the RESON 7125 on Dn309 and Dn316. A geographic plot of thecrosslines is shown in Figure 4. Crosslines were filtered to remove soundings greater than 45 degrees fromnadir. To evaluate crossline agreement, two 1-meter surfaces were created: one from crossline soundings,the other from mainscheme soundings. These two surfaces were differenced using CARIS HIPS and SIPS.The statistical analysis of the differences between the mainscheme and crossline surfaces is shown in Figure5. The average difference between the surfaces is -0.01 meters with a standard deviation of 0.09 meters;95% of all differences were less than 0.17 meters from the mean.
Crosslines in the SE corner of the project were extended to overlap with the autonomous underwater vehicle(AUV) working grounds collected earlier in the project.
H12668 NOAA Ship Ferdinand R. Hassler
10
Figure 4: H12668 MBES crossline data overlaid on mainscheme lines

H12668 NOAA Ship Ferdinand R. Hassler
11
Figure 5: H12668 crossline difference statistics: mainscheme minus crossline
B.2.2 Uncertainty
The following survey specific parameters were used for this survey:
Measured Zoning0.01 meters 0.21 meters0.01 meters 0.102 meters
Table 6: Survey Specific Tide TPU Values
H12668 NOAA Ship Ferdinand R. Hassler
12
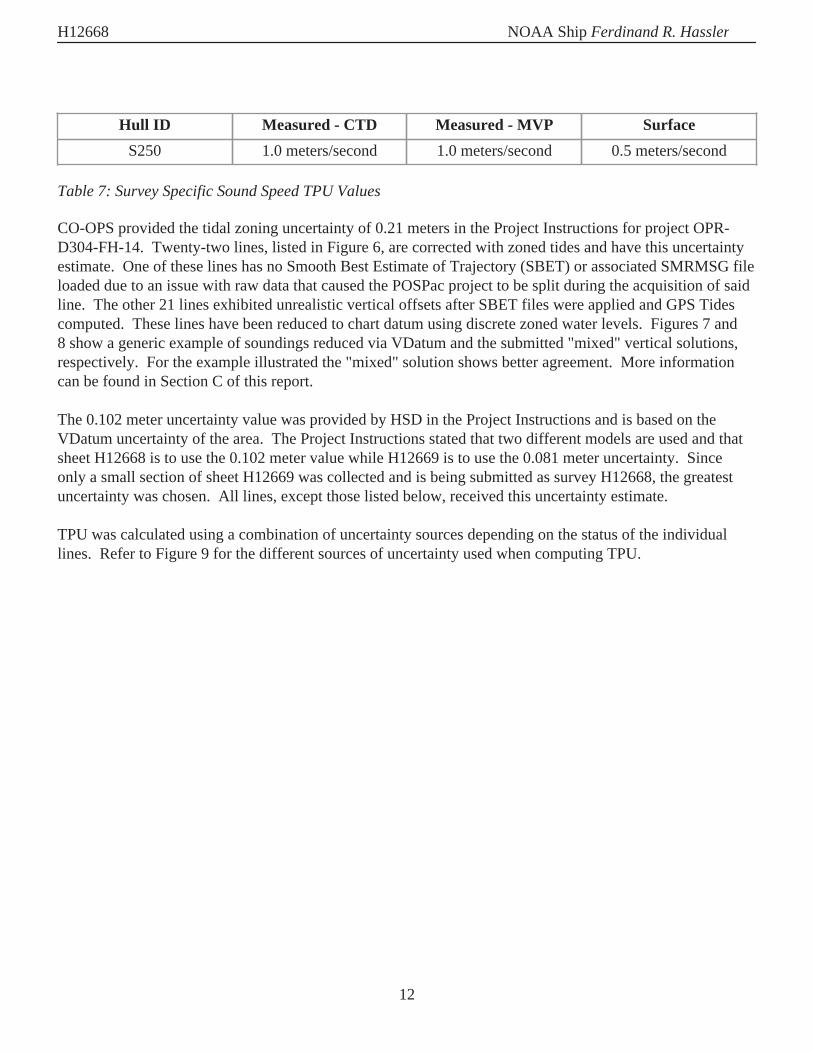
Hull ID Measured - CTD Measured - MVP SurfaceS250 1.0 meters/second 1.0 meters/second 0.5 meters/second
Table 7: Survey Specific Sound Speed TPU Values
CO-OPS provided the tidal zoning uncertainty of 0.21 meters in the Project Instructions for project OPR-D304-FH-14. Twenty-two lines, listed in Figure 6, are corrected with zoned tides and have this uncertaintyestimate. One of these lines has no Smooth Best Estimate of Trajectory (SBET) or associated SMRMSG fileloaded due to an issue with raw data that caused the POSPac project to be split during the acquisition of saidline. The other 21 lines exhibited unrealistic vertical offsets after SBET files were applied and GPS Tidescomputed. These lines have been reduced to chart datum using discrete zoned water levels. Figures 7 and8 show a generic example of soundings reduced via VDatum and the submitted "mixed" vertical solutions,respectively. For the example illustrated the "mixed" solution shows better agreement. More informationcan be found in Section C of this report.
The 0.102 meter uncertainty value was provided by HSD in the Project Instructions and is based on theVDatum uncertainty of the area. The Project Instructions stated that two different models are used and thatsheet H12668 is to use the 0.102 meter value while H12669 is to use the 0.081 meter uncertainty. Sinceonly a small section of sheet H12669 was collected and is being submitted as survey H12668, the greatestuncertainty was chosen. All lines, except those listed below, received this uncertainty estimate.
TPU was calculated using a combination of uncertainty sources depending on the status of the individuallines. Refer to Figure 9 for the different sources of uncertainty used when computing TPU.

H12668 NOAA Ship Ferdinand R. Hassler
13
Figure 6: H12668 Line status
Figure 7: Example of soundings reduced via VDatum

H12668 NOAA Ship Ferdinand R. Hassler
14
Figure 8: Example of soundings reduced with a "mixed" solution
Figure 9: Uncertainty values used for computing TPU on H12668

H12668 NOAA Ship Ferdinand R. Hassler
15
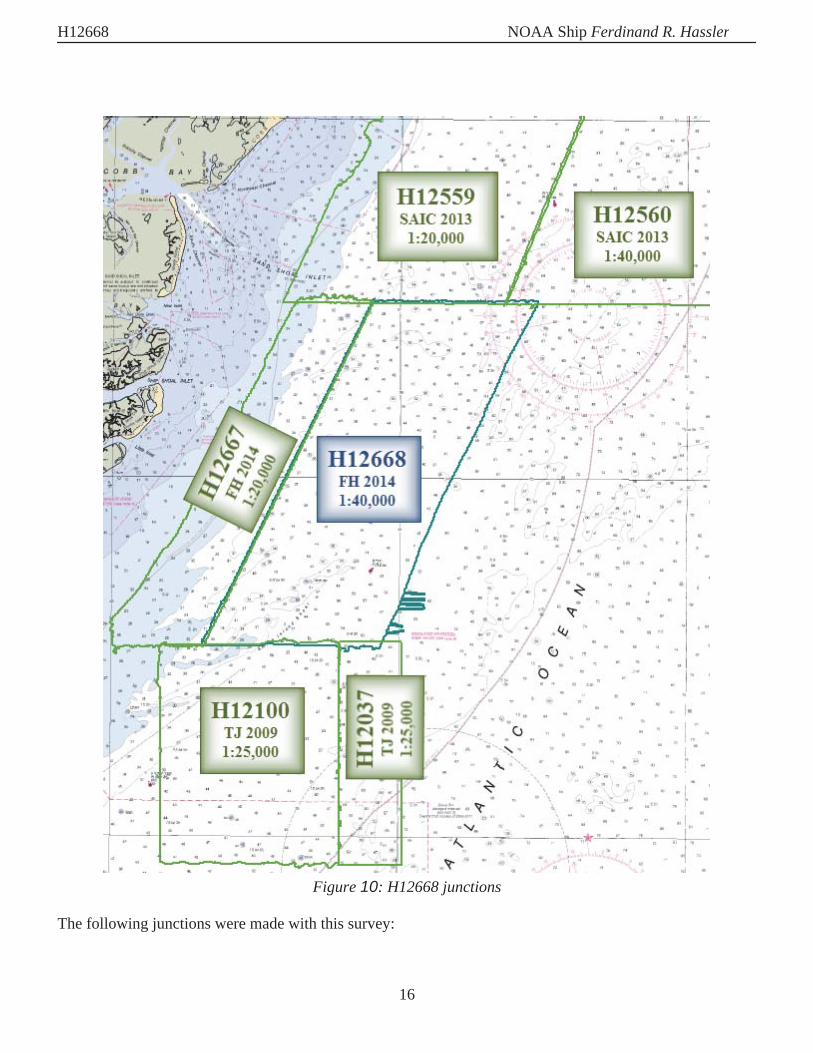
B.2.3 Junctions
Five junction comparisons were completed for H12668 (Figure 10). Two surveys were completed in2009 by NOAA Ship THOMAS JEFFERSON (H12037 and H12100), two in 2013 by SAIC (H12559 andH12560), and one in 2014 by the NOAA Ship FERDINAND R. HASSLER (H12667). The areas of overlapbetween sheet H12668 and its junction sheets were reviewed in CARIS BASE Editor. The junction surfaceswere subtracted from the surface of H12668 to assess sounding consistency.
H12668 NOAA Ship Ferdinand R. Hassler
16
Figure 10: H12668 junctions
The following junctions were made with this survey:

H12668 NOAA Ship Ferdinand R. Hassler
17
RegistryNumber Scale Year Field Unit Relative
LocationH12559 1:20000 2013 SAIC NH12560 1:40000 2013 SAIC NH12100 1:25000 2009 NOAA Ship THOMAS JEFFERSON SH12037 1:25000 2009 NOAA Ship THOMAS JEFFERSON SH12667 1:20000 2014 NOAA Ship FERDINAND R. HASSLER W
Table 8: Junctioning Surveys
H12559
Survey H12559 was conducted by SAIC in 2013. H12559 bathymetric depths were derived from setdistance multibeam. A differenced surface analysis between the H12668 50-centimeter and H12559 2-meterresolution surfaces, which included over 3 million nodes, showed H12668 to be on average 0.02 metersshallower than H12559, with a standard deviation of 0.19 meters. 95% of all differences are less than 0.39meters from the mean.

H12668 NOAA Ship Ferdinand R. Hassler
18
Figure 11: Differenced surface statistics - H12668 minus H12559H12560
Survey H12560 was conducted by SAIC in 2013. H12560 bathymetric depths were derived from setdistance multibeam. A differenced surface analysis between the H12668 50-centimeter and H12560 2-meterresolution surfaces, which included over 1 million nodes, showed H12668 to be on average 0.03 metersshallower than H12560 with a standard deviation of 0.12 meters. 95% of all differences are less than 0.26meters from the mean.
H12668 NOAA Ship Ferdinand R. Hassler
19
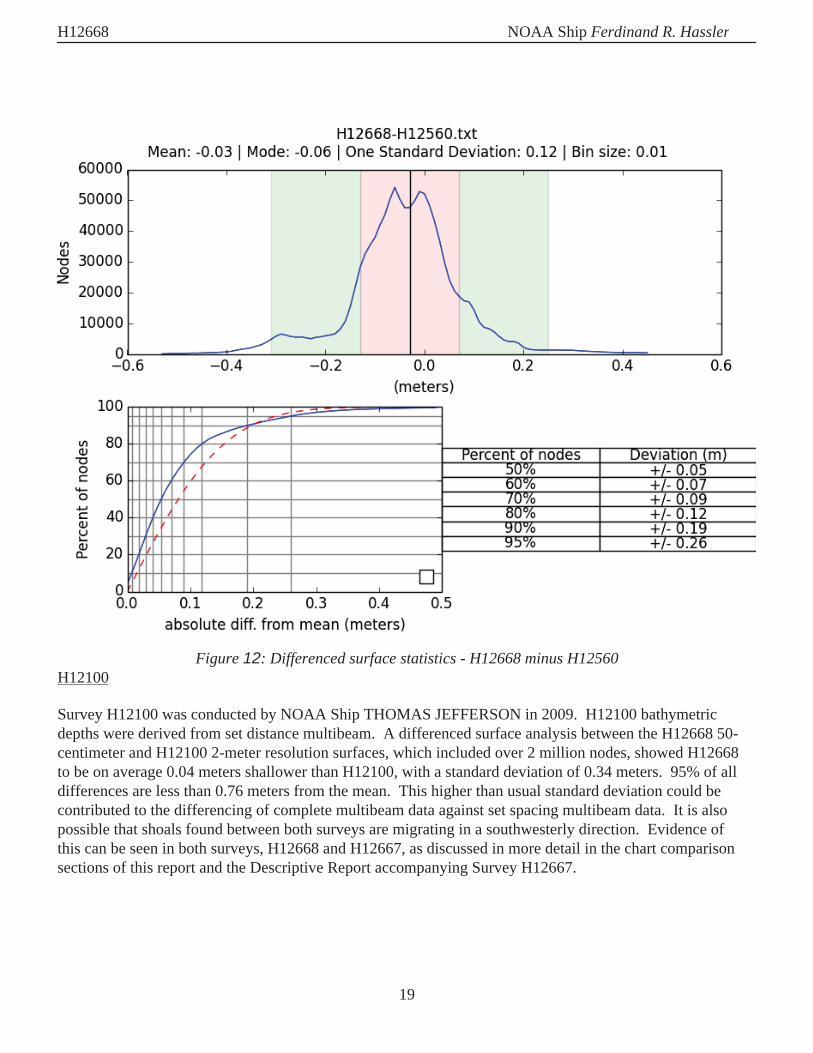
Figure 12: Differenced surface statistics - H12668 minus H12560H12100
Survey H12100 was conducted by NOAA Ship THOMAS JEFFERSON in 2009. H12100 bathymetricdepths were derived from set distance multibeam. A differenced surface analysis between the H12668 50-centimeter and H12100 2-meter resolution surfaces, which included over 2 million nodes, showed H12668to be on average 0.04 meters shallower than H12100, with a standard deviation of 0.34 meters. 95% of alldifferences are less than 0.76 meters from the mean. This higher than usual standard deviation could becontributed to the differencing of complete multibeam data against set spacing multibeam data. It is alsopossible that shoals found between both surveys are migrating in a southwesterly direction. Evidence ofthis can be seen in both surveys, H12668 and H12667, as discussed in more detail in the chart comparisonsections of this report and the Descriptive Report accompanying Survey H12667.

H12668 NOAA Ship Ferdinand R. Hassler
20
Figure 13: Differenced surface statistics - H12668 minus H12100H12037
Survey H12037 was conducted by NOAA Ship THOMAS JEFFERSON in 2009. H12037 bathymetricdepths were derived from set distance multibeam. A differenced surface analysis between the H12668 50-centimeter and H12037 2-meter resolution surfaces, which included over 1 million nodes, showed H12668to be on average 0.11 meters shallower than H12037, with a standard deviation of 0.31 meters. 95% of alldifferences are less than 0.72 meters from the mean. This higher than usual standard deviation could becontributed to the same factors that influenced the previous junction comparison with H12100.

H12668 NOAA Ship Ferdinand R. Hassler
21
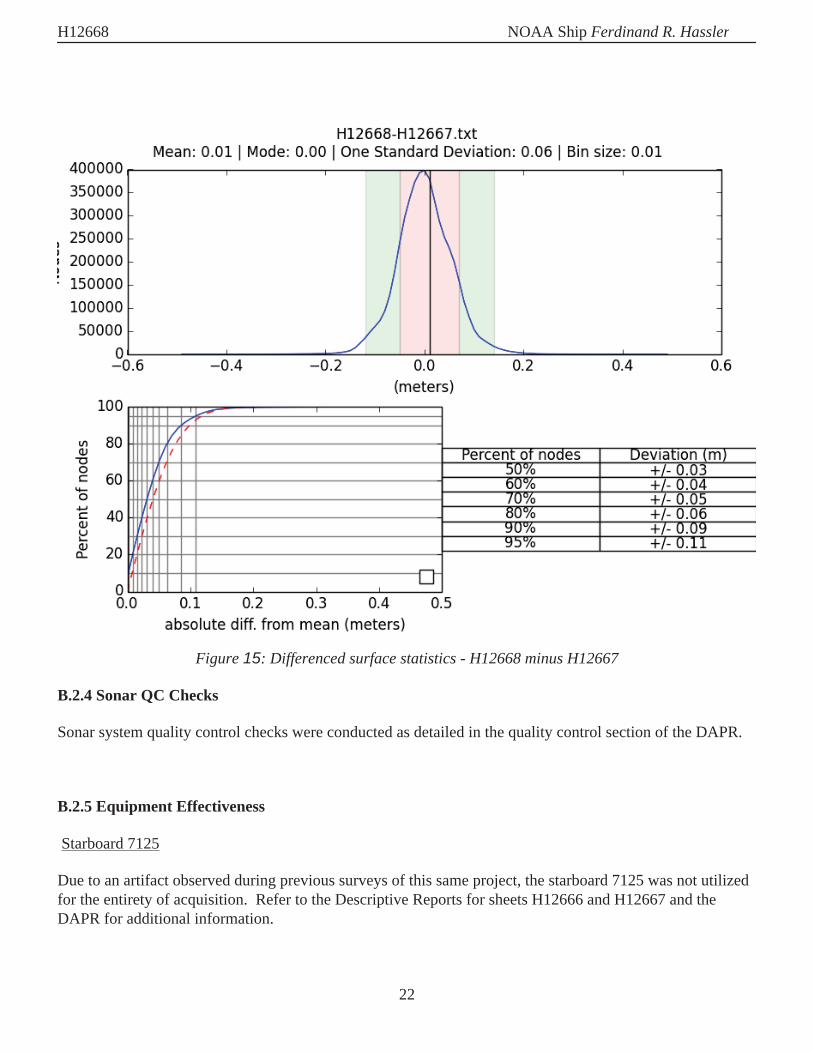
Figure 14: Differenced surface statistics - H12668 minus H12037H12667
Survey H12667 was conducted by NOAA Ship FERDINAND R. HASSLER in 2014 during the course ofproject OPR-D304-FH-14. A differenced surface analysis between the H12668 and H12667 50-centimeterresolution surfaces, which included almost 5 million nodes, showed H12668 to be on average 0.01 metersdeeper than H12667, with a standard deviation of 0.06 meters. 95% of all differences are less than 0.11meters from the mean.
H12668 NOAA Ship Ferdinand R. Hassler
22
Figure 15: Differenced surface statistics - H12668 minus H12667
B.2.4 Sonar QC Checks
Sonar system quality control checks were conducted as detailed in the quality control section of the DAPR.
B.2.5 Equipment Effectiveness
Starboard 7125
Due to an artifact observed during previous surveys of this same project, the starboard 7125 was not utilizedfor the entirety of acquisition. Refer to the Descriptive Reports for sheets H12666 and H12667 and theDAPR for additional information.

H12668 NOAA Ship Ferdinand R. Hassler
23
B.2.6 Factors Affecting Soundings
There were no other factors that affected corrections to soundings.
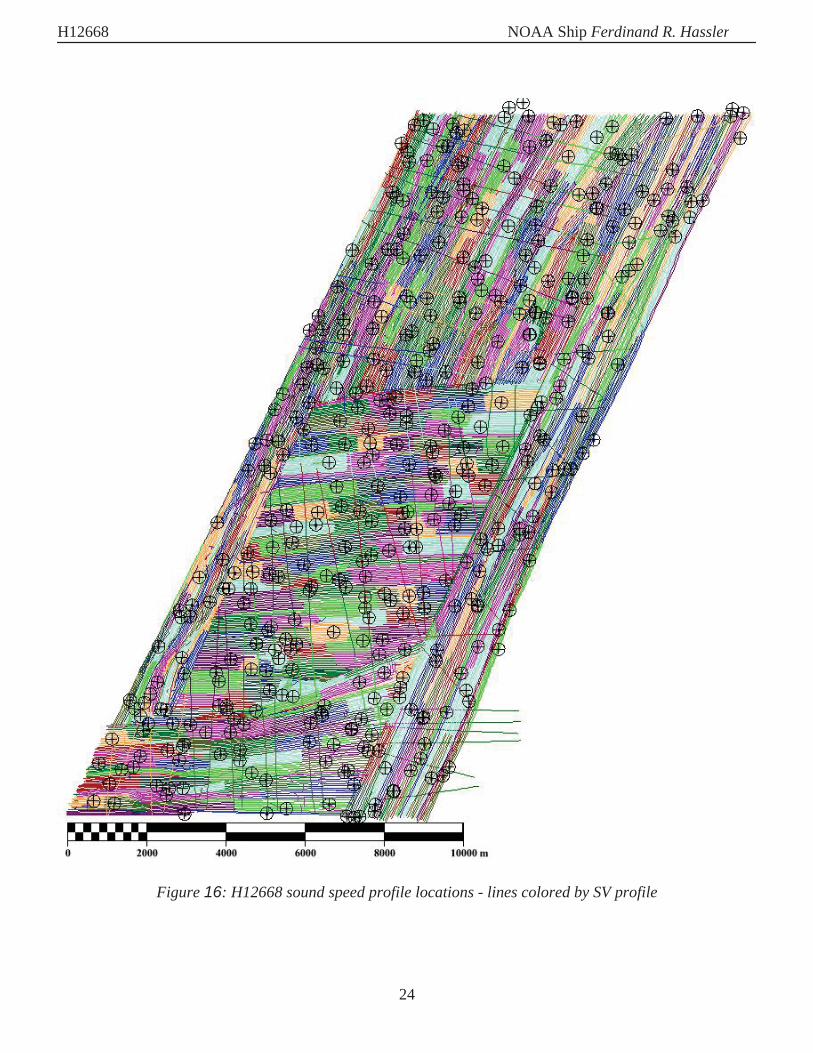
B.2.7 Sound Speed Methods
Sound Speed Cast Frequency: A total of 417 sound speed measurements were taken within the boundaries ofsurvey H12668. These sound speed measurements were collected using the MVP-200 approximately everyhour. Comparisons were made by the survey watch to assess sound speed variation in the water column.The results of these comparisons showed the water column to be well mixed with minimal variance overspace and time.
Sound speed corrections were applied in CARIS using Nearest in Distance Within Time (NIDWT) of 3hours for the entire survey (Figure 16).
H12668 NOAA Ship Ferdinand R. Hassler
24
Figure 16: H12668 sound speed profile locations - lines colored by SV profile

H12668 NOAA Ship Ferdinand R. Hassler
25
B.2.8 Coverage Equipment and Methods
All equipment and survey methods were used as detailed in the DAPR.
B.2.9 Data Density
A density analysis was run to calculate the number of soundings per surface node. The results determinedthat over 99% of all nodes contained five or more soundings. The density analysis was executed on nodeswhich are populated with at least one sounding and did not account for holidays located within the surface.For addition information see the H12668_Standards_Compliance report in Appendix II. Due to limitationsof the Python script, the file to be read for the Standards Compliance report needed to be split into fiveseparate files.
B.2.10 Holidays
There is a high number of small coverage gaps evident in the 50-centimeter surface. These holidays havebeen examined by the hydrographer and are deemed insignificant as they appear in flat featureless areas.Many of these holidays are the result of the RESON MBES system automatically restarting logging once theraw .s7k file reached 1GB in size. Figure 17 shows examples of the extents of holidays present throughoutthe final surface.

H12668 NOAA Ship Ferdinand R. Hassler
26
Figure 17: Example of holidays found within the finalized surface. Holidayshave been examined by the hydrographer and are deemed insignificant.
B.3 Echo Sounding Corrections
B.3.1 Corrections to Echo Soundings
All data reduction procedures conform to those detailed in the DAPR.
B.3.2 Calibrations
All sounding systems were calibrated as detailed in the DAPR.
B.4 Backscatter
Backscatter was logged in RESON datagram 7008 snippets record in the raw .s7k files. The .s7k file alsoholds the navigation record and bottom detections for all lines of Survey H12668. The files were pairedwith the CARIS HDCS data, imported, and processed using Fledermaus Geocoder Toolbox (FMGT). TheFMGT project and backscatter mosaic imagery is included in the field submission. The processed mosaic isformatted as a geo-tiff image per specifications.
H12668 NOAA Ship Ferdinand R. Hassler
27
B.5 Data Processing
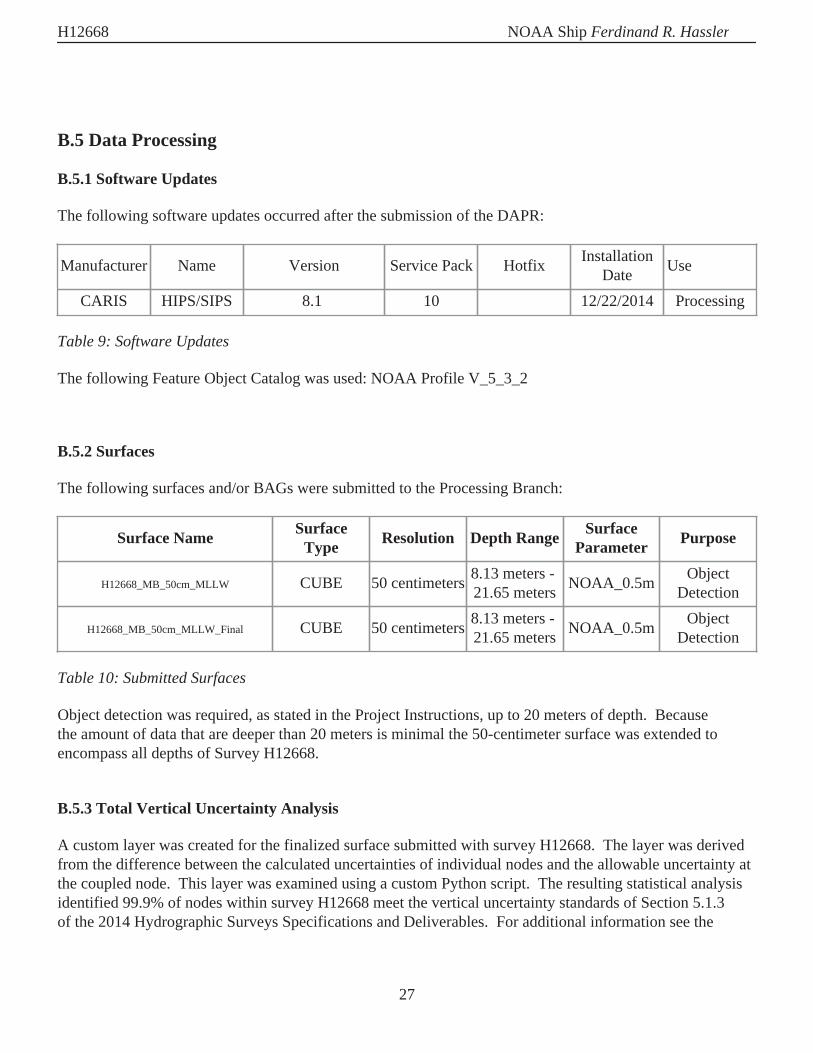
B.5.1 Software Updates
The following software updates occurred after the submission of the DAPR:
Manufacturer Name Version Service Pack Hotfix InstallationDate Use
CARIS HIPS/SIPS 8.1 10 12/22/2014 Processing
Table 9: Software Updates
The following Feature Object Catalog was used: NOAA Profile V_5_3_2
B.5.2 Surfaces
The following surfaces and/or BAGs were submitted to the Processing Branch:
Surface Name SurfaceType Resolution Depth Range Surface
Parameter Purpose
H12668_MB_50cm_MLLW CUBE 50 centimeters 8.13 meters - 21.65 meters NOAA_0.5m Object
Detection
H12668_MB_50cm_MLLW_Final CUBE 50 centimeters 8.13 meters - 21.65 meters NOAA_0.5m Object
Detection
Table 10: Submitted Surfaces
Object detection was required, as stated in the Project Instructions, up to 20 meters of depth. Becausethe amount of data that are deeper than 20 meters is minimal the 50-centimeter surface was extended toencompass all depths of Survey H12668.
B.5.3 Total Vertical Uncertainty Analysis
A custom layer was created for the finalized surface submitted with survey H12668. The layer was derivedfrom the difference between the calculated uncertainties of individual nodes and the allowable uncertainty atthe coupled node. This layer was examined using a custom Python script. The resulting statistical analysisidentified 99.9% of nodes within survey H12668 meet the vertical uncertainty standards of Section 5.1.3of the 2014 Hydrographic Surveys Specifications and Deliverables. For additional information see the
H12668 NOAA Ship Ferdinand R. Hassler
28
H12668_Standards_Compliance report in Appendix II. Due to limitations of the Python script, the file to beread for the Standards Compliance report needed to be split into five separate files.
B.5.4 Designated Soundings
Within the limits of H12668, seven soundings are submitted flagged as designated. Six of these soundingsare designated for the surface to honor the least depth of the data and one is for feature creation.
C. Vertical and Horizontal Control
All vertical and horizontal control activities conducted during the course of this survey are fully addressed inthe following sections. Therefore, no separate HVCR is submitted.
C.1 Vertical Control
The vertical datum for this project is Mean Lower Low Water.
Standard Vertical Control Methods Used:
Discrete Zoning
The following National Water Level Observation Network (NWLON) stations served as datum control forthis survey:
Station Name Station IDDuck, NC 863-1570
Table 11: NWLON Tide Stations
File Name Status8651370.tid Verified Observed
Table 12: Water Level Files (.tid)
File Name StatusD304FH2014CORP_Rev.zdf Final
Table 13: Tide Correctors (.zdf or .tc)
H12668 NOAA Ship Ferdinand R. Hassler
29
A request for final approved tides was sent to N/OPS1 on 11/20/2014. The final tide note was received on11/25/2014.
Preliminary zoning is accepted as the final zoning for project OPR-D304-FH-2014, H12668, during the timeperiod between September 21 - November 13, 2014.
Non-Standard Vertical Control Methods Used:
VDatum
Ellipsoid to Chart Datum Separation File:
2014_D304_VDatum_NAD83_MLLW.csar
VDatum was used to produce corrected depth values for all data except the 22 lines mention in Section B.2.2of this report. For those 22 lines, data was reduced using standard Discrete Zoning methods.
C.2 Horizontal Control
The horizontal datum for this project is North American Datum of 1983 (NAD83).
The projection used for this project is UTM Zone 18N.
The following PPK methods were used for horizontal control:
Smart Base
All data submitted as H12668, with the exception of the one line mentioned in section B.2.2, has SBETs andSMRMSGs applied for post-processed position/attitude and TPU values, respectively.

H12668 NOAA Ship Ferdinand R. Hassler
30
The following CORS Stations were used for horizontal control:
HVCR Site ID Base Station IDChesapeake Light COVX
Millsboro DEMIDriver 6 DRV6
Loyola 2 COOP LOY2Loyola M LOYMLoyola W LOYW
Loyola LS03 LS03Moriches 6 MOR6
Bodie Island NCBIBuxton NCBXDuck 3 NCDU
Elizabeth City NCELGatesville NCGA
Middle Township NJCMRiverhead NYRH
VA Gloucester Pt VAGPWallops Island VAWI
New York WAAS 1 ZNY1
Table 14: CORS Base Stations
All data was collected real-time with DGPS correctors applied to the navigation solution. All except the oneline mentioned in Section B.2.2 are corrected using post-processed horizontal solutions.
The following DGPS Stations were used for horizontal control:
DGPS StationsDriver, Virginia (289kHz)
Table 15: USCG DGPS Stations
H12668 NOAA Ship Ferdinand R. Hassler
31
C.3 Additional Horizontal or Vertical Control Issues
3.3.1 Vertical accuracies
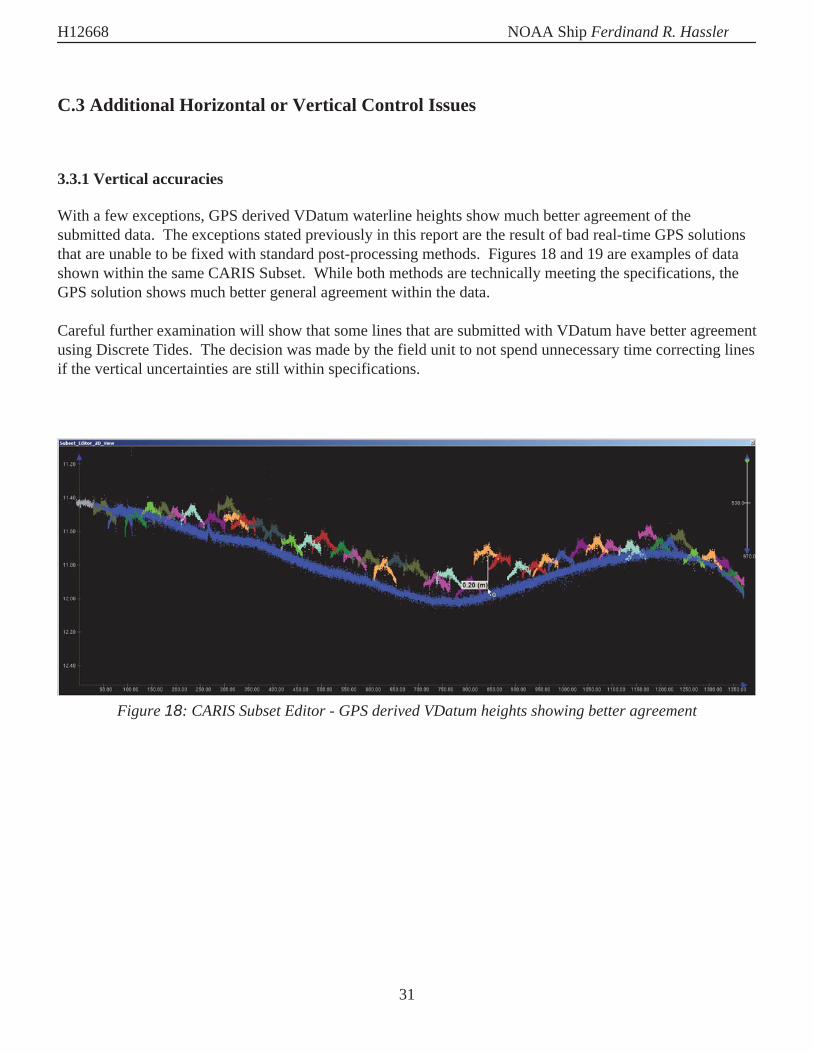
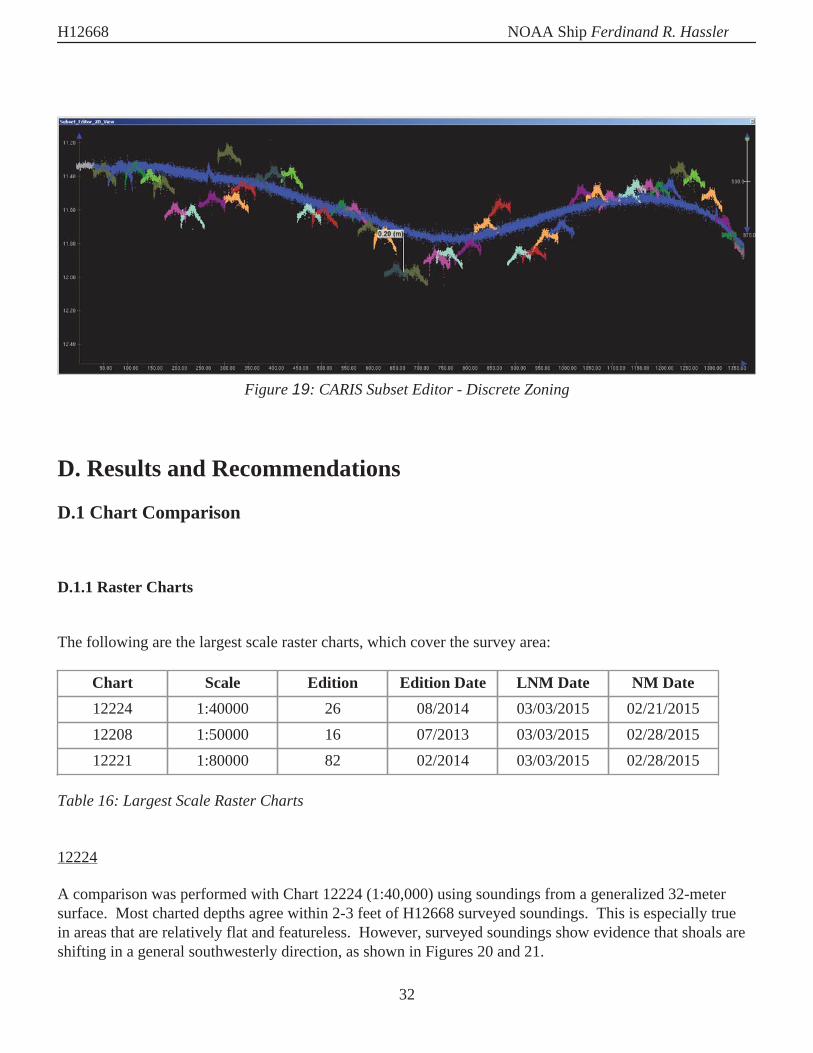
With a few exceptions, GPS derived VDatum waterline heights show much better agreement of thesubmitted data. The exceptions stated previously in this report are the result of bad real-time GPS solutionsthat are unable to be fixed with standard post-processing methods. Figures 18 and 19 are examples of datashown within the same CARIS Subset. While both methods are technically meeting the specifications, theGPS solution shows much better general agreement within the data.
Careful further examination will show that some lines that are submitted with VDatum have better agreementusing Discrete Tides. The decision was made by the field unit to not spend unnecessary time correcting linesif the vertical uncertainties are still within specifications.
Figure 18: CARIS Subset Editor - GPS derived VDatum heights showing better agreement
H12668 NOAA Ship Ferdinand R. Hassler
32
Figure 19: CARIS Subset Editor - Discrete Zoning
D. Results and Recommendations
D.1 Chart Comparison
D.1.1 Raster Charts
The following are the largest scale raster charts, which cover the survey area:
Chart Scale Edition Edition Date LNM Date NM Date12224 1:40000 26 08/2014 03/03/2015 02/21/201512208 1:50000 16 07/2013 03/03/2015 02/28/201512221 1:80000 82 02/2014 03/03/2015 02/28/2015
Table 16: Largest Scale Raster Charts
12224
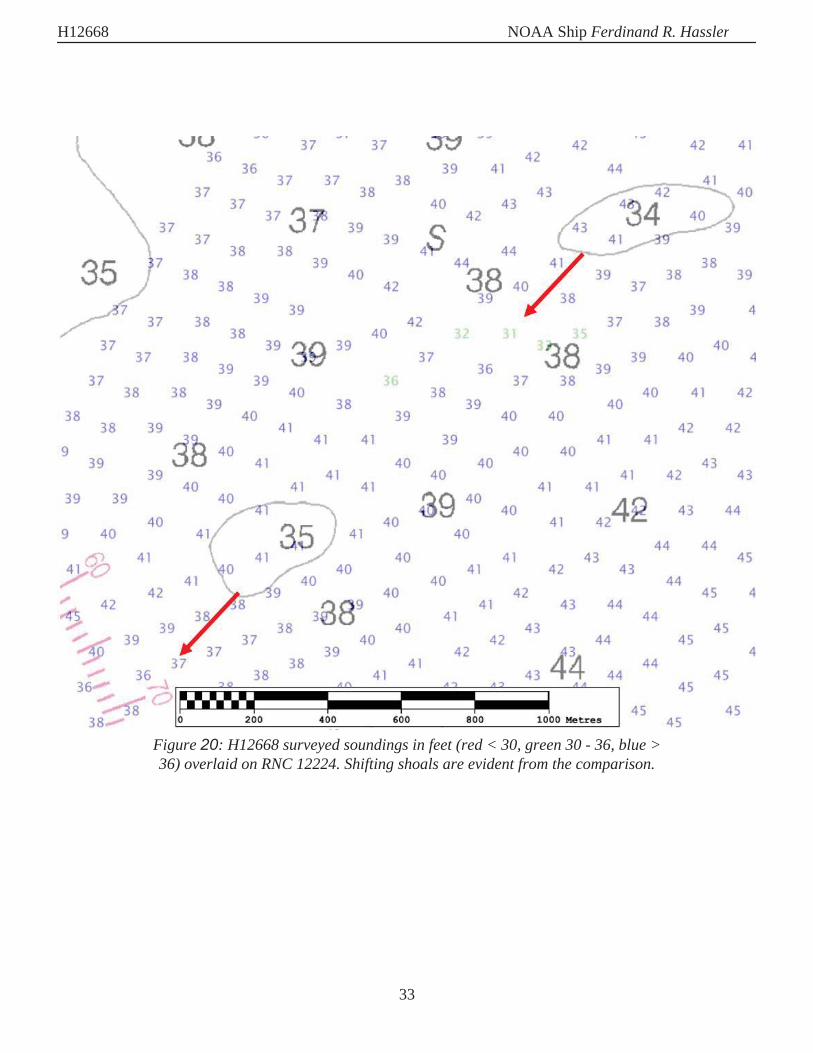
A comparison was performed with Chart 12224 (1:40,000) using soundings from a generalized 32-metersurface. Most charted depths agree within 2-3 feet of H12668 surveyed soundings. This is especially truein areas that are relatively flat and featureless. However, surveyed soundings show evidence that shoals areshifting in a general southwesterly direction, as shown in Figures 20 and 21.
H12668 NOAA Ship Ferdinand R. Hassler
33
Figure 20: H12668 surveyed soundings in feet (red < 30, green 30 - 36, blue >36) overlaid on RNC 12224. Shifting shoals are evident from the comparison.

H12668 NOAA Ship Ferdinand R. Hassler
34
Figure 21: H12668 surveyed soundings in feet (red < 30, green 30 - 36, blue > 36) in the vicinityof Smith Island Shoal overlaid on RNC 12224. Shifting shoals are evident from the comparison.
12208
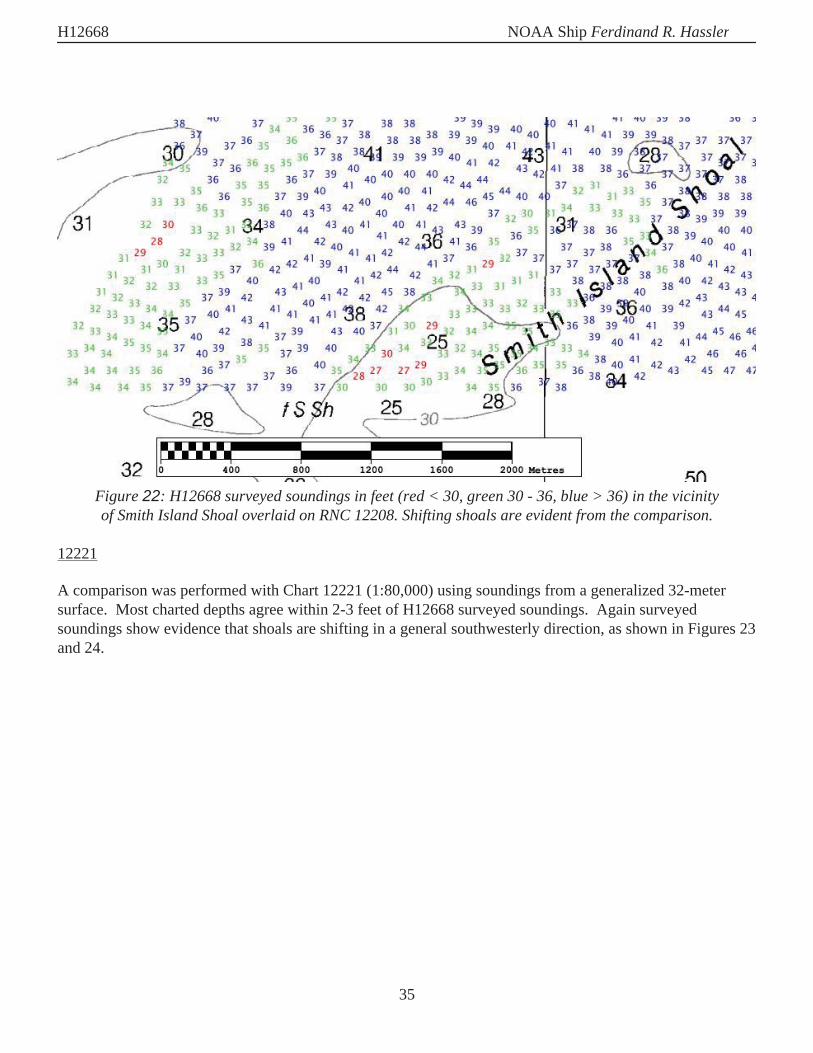
A comparison was performed with Chart 12208 (1:50,000) using soundings from a generalized 32-metersurface. Most charted depths agree within 2-3 feet of H12668 surveyed soundings. However, as mentionedpreviously, surveyed soundings show evidence that shoals are shifting in a general southwesterly direction,as shown in Figure 22.
H12668 NOAA Ship Ferdinand R. Hassler
35
Figure 22: H12668 surveyed soundings in feet (red < 30, green 30 - 36, blue > 36) in the vicinityof Smith Island Shoal overlaid on RNC 12208. Shifting shoals are evident from the comparison.
12221
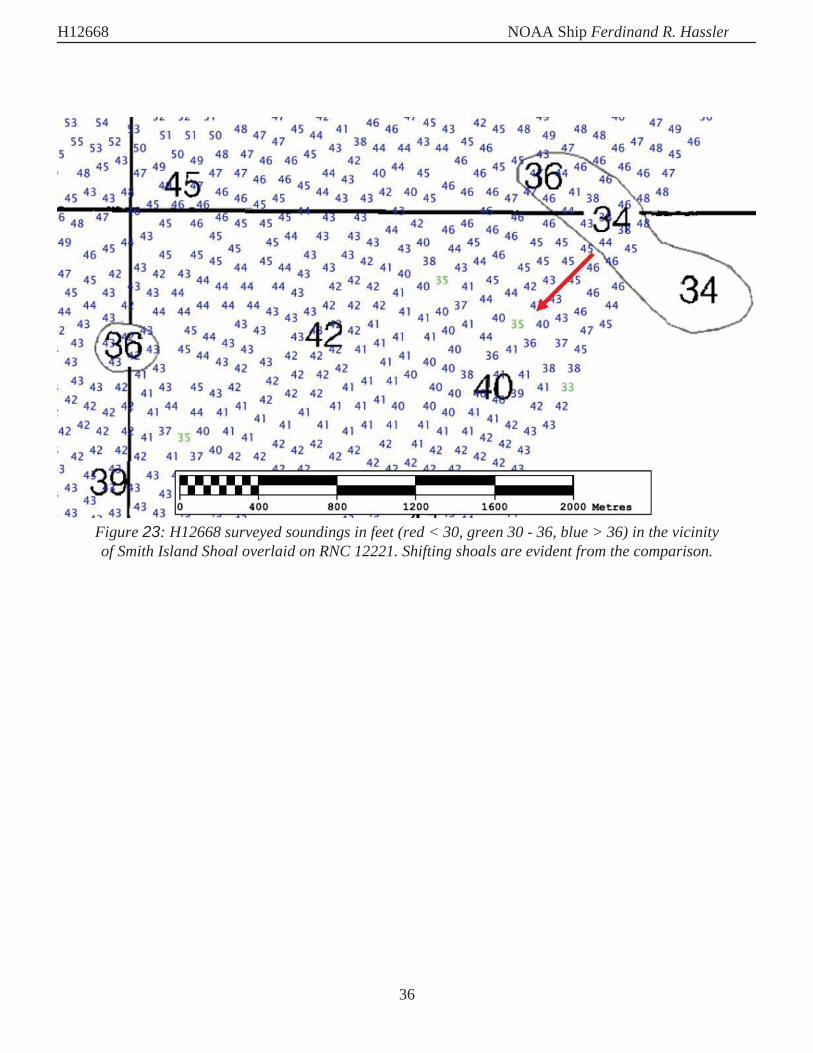
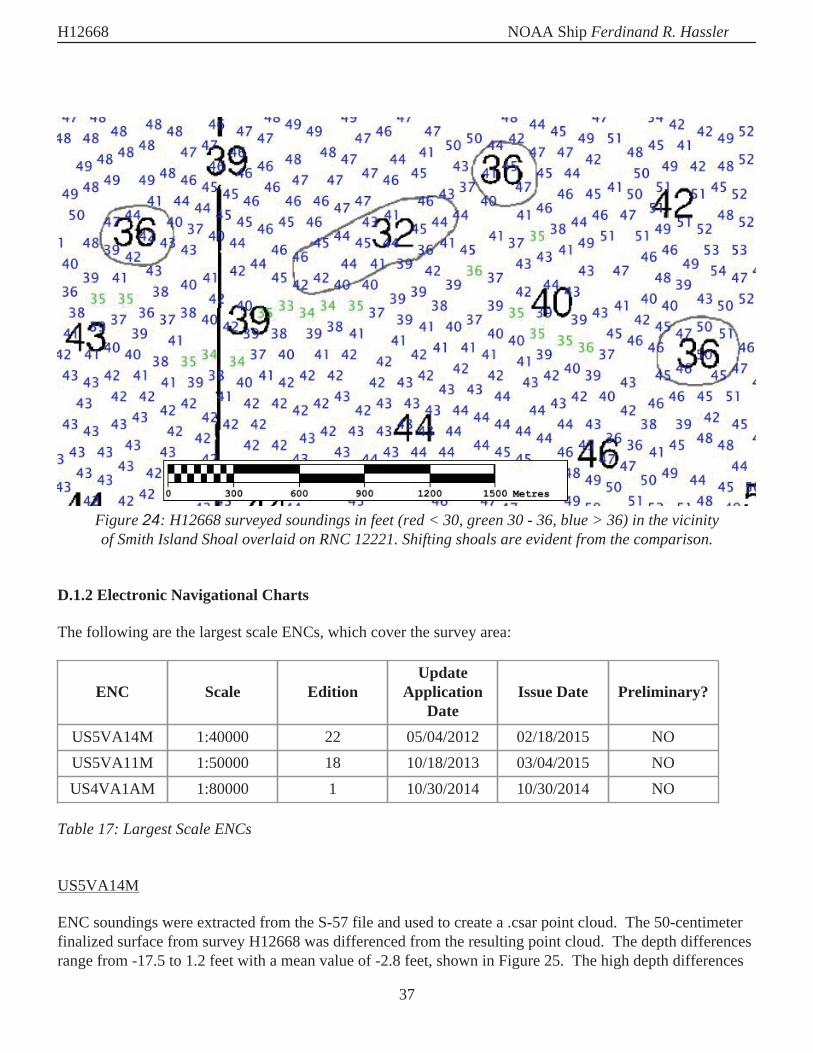
A comparison was performed with Chart 12221 (1:80,000) using soundings from a generalized 32-metersurface. Most charted depths agree within 2-3 feet of H12668 surveyed soundings. Again surveyedsoundings show evidence that shoals are shifting in a general southwesterly direction, as shown in Figures 23and 24.
H12668 NOAA Ship Ferdinand R. Hassler
36
Figure 23: H12668 surveyed soundings in feet (red < 30, green 30 - 36, blue > 36) in the vicinityof Smith Island Shoal overlaid on RNC 12221. Shifting shoals are evident from the comparison.
H12668 NOAA Ship Ferdinand R. Hassler
37
Figure 24: H12668 surveyed soundings in feet (red < 30, green 30 - 36, blue > 36) in the vicinityof Smith Island Shoal overlaid on RNC 12221. Shifting shoals are evident from the comparison.
D.1.2 Electronic Navigational Charts
The following are the largest scale ENCs, which cover the survey area:
ENC Scale EditionUpdate
ApplicationDate
Issue Date Preliminary?
US5VA14M 1:40000 22 05/04/2012 02/18/2015 NOUS5VA11M 1:50000 18 10/18/2013 03/04/2015 NOUS4VA1AM 1:80000 1 10/30/2014 10/30/2014 NO
Table 17: Largest Scale ENCs
US5VA14M
ENC soundings were extracted from the S-57 file and used to create a .csar point cloud. The 50-centimeterfinalized surface from survey H12668 was differenced from the resulting point cloud. The depth differencesrange from -17.5 to 1.2 feet with a mean value of -2.8 feet, shown in Figure 25. The high depth differences

H12668 NOAA Ship Ferdinand R. Hassler
38
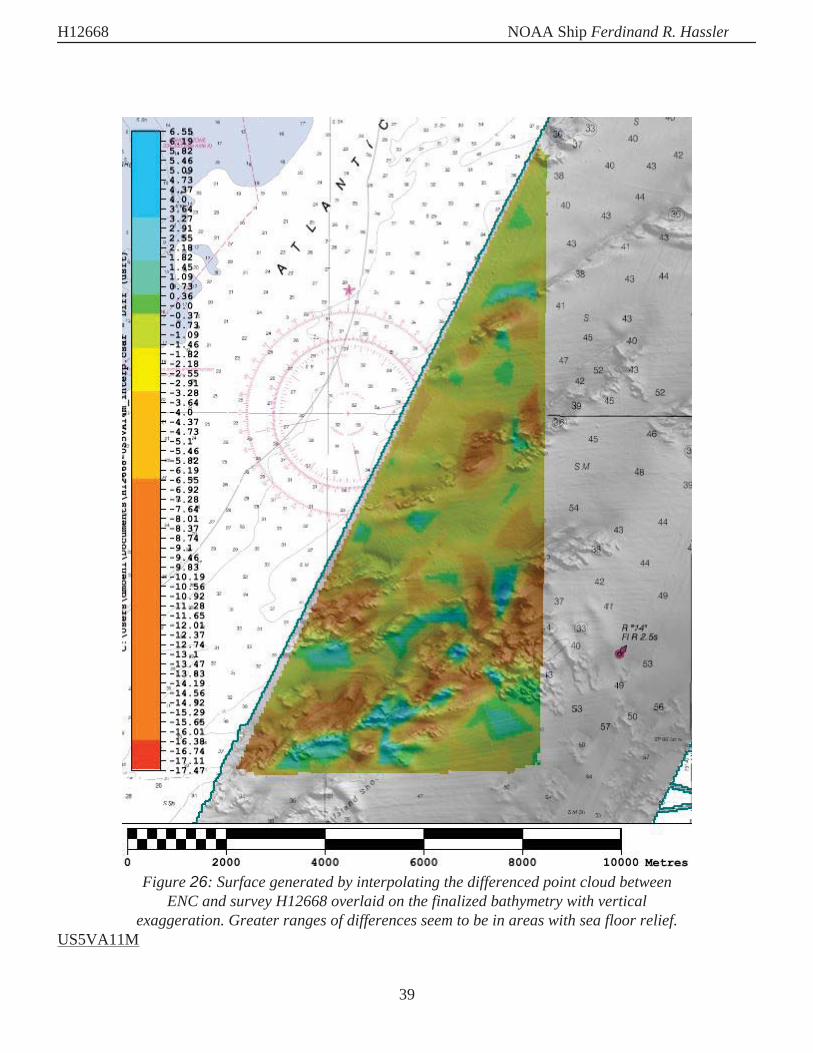
are determined to be the result of coarse resolution and shoal biased soundings extracted from the ENC.Large differences also seem to be constant with the shifting shoals, as there are large positive and negativeranges of differences where sea floor depth changes are present, shown in Figure 26.
Figure 25: ENC US5VA14M comparison
H12668 NOAA Ship Ferdinand R. Hassler
39
Figure 26: Surface generated by interpolating the differenced point cloud betweenENC and survey H12668 overlaid on the finalized bathymetry with vertical
exaggeration. Greater ranges of differences seem to be in areas with sea floor relief.US5VA11M
H12668 NOAA Ship Ferdinand R. Hassler
40
No comparison was performed with ENC US5VA11M as it contains no soundings different than RNC12208. See previous chart comparison with RNC 12208.
US4VA1AM
No comparison was performed with ENC US4VA1AM as it contained no soundings different than RNC12221. See previous chart comparison with RNC 12221.
D.1.3 AWOIS Items
One AWOIS item was assigned for full investigation. The AWOIS item was disproved using objectdetection multibeam sonar techniques. Refer the Final Feature File for additional information.
D.1.4 Maritime Boundary Points
No Maritime Boundary Points were assigned for this survey.
D.1.5 Charted Features
No charted features exist for this survey.
D.1.6 Uncharted Features
One uncharted non-dangerous wreck was discovered during the course of H12668. The wreck was fullydeveloped using object detection multibeam techniques. Refer to the Final Feature File for remarks andrecommendations. Rejected data surrounding the wreck is considered noise and should not be reaccepted.
D.1.7 Dangers to Navigation
No Danger to Navigation Reports were submitted for this survey.
D.1.8 Shoal and Hazardous Features
Smith Island Shoal was fully developed within the limits of Survey H12668. Surveyed soundings suggestthat Smith Island Shoal is migrating in a southwesterly direction.

H12668 NOAA Ship Ferdinand R. Hassler
41
D.1.9 Channels
No channels exist for this survey. There are no designated anchorages, precautionary areas, safety fairways,traffic separation schemes, pilot boarding areas, or channel and range lines within the survey limits.
D.1.10 Bottom Samples
Eleven bottom samples were taken within the limits of H12668 using positions assigned in the ProjectReference File by OPS. These bottom samples are encoded using standard S-57 encoding procedures andincluded in the Final Feature File submission. No video or photograph data are submitted with the surveysubmission.
D.2 Additional Results
D.2.1 Shoreline
Shoreline was not assigned in the Hydrographic Survey Project Instructions or Statement of Work.
D.2.2 Prior Surveys
Prior survey comparisons exist for this survey, but were not investigated.
D.2.3 Aids to Navigation
One ATON (Buoy R "14") was observed during H12668 survey operations. This aid was deemed to serveits intended purpose. No positioning was performed in the field or required from the Project Instructions.
D.2.4 Overhead Features
No overhead features exist for this survey.
D.2.5 Submarine Features
No submarine features exist for this survey.
D.2.6 Ferry Routes and Terminals
No ferry routes or terminals exist for this survey.

H12668 NOAA Ship Ferdinand R. Hassler
42
D.2.7 Platforms
No platforms exist for this survey.
D.2.8 Significant Features
Migrating shoals are present within the coverage of H12668. Evidence of migration has been thoroughlydocumented in previous sections of this report, particularly the junction analysis and chart comparisonsections.
D.2.9 Construction and Dredging
No present or planned construction or dredging exist within the survey limits.
D.2.10 New Survey Recommendation
No new surveys or further investigations are recommended for this area.
D.2.11 Inset Recommendation
No new insets are recommended for this area.

H12668 NOAA Ship Ferdinand R. Hassler
E. Approval Sheet
As Chief of Party, field operations for this hydrographic survey were conducted under my direct supervision,with frequent personal checks of progress and adequacy. I have reviewed the attached survey data andreports.
All field sheets, this Descriptive Report, and all accompanying records and data are approved. All records areforwarded for final review and processing to the Processing Branch.
The survey data meets or exceeds requirements as set forth in the NOS Hydrographic Surveys andSpecifications Deliverables Manual, Field Procedures Manual, Letter Instructions, and all HSD TechnicalDirectives. These data are adequate to supersede charted data in their common areas. This survey is completeand no additional work is required with the exception of deficiencies noted in the Descriptive Report.
Report Name Report Date SentOPR-D304-FH-14 Data
Acquisition and Processing Report 2015-01-15
2014 Hydrographic SystemsReadiness Review Memo 2014-05-06
Approver Name Approver Title Approval Date SignatureCDR Marc S.Moser, NOAA Chief of Party 05/13/2015
LT Adam R. Reed, NOAA Field Operations Officer 05/13/2015LT Jon D. Andvick, NOAA Navigation Officer 05/13/2015
MOSER.MARC.STANTON.1163193902
Digitally signed by MOSER.MARC.STANTON.1163193902 DN: c=US, o=U.S. Government, ou=DoD, ou=PKI, ou=NOAA, cn=MOSER.MARC.STANTON.1163193902 Date: 2015.05.14 06:37:04 -04'00'

F. Table of Acronyms
Acronym DefinitionAHB Atlantic Hydrographic BranchAST Assistant Survey TechnicianATON Aid to NavigationAWOIS Automated Wreck and Obstruction Information SystemBAG Bathymetric Attributed GridBASE Bathymetry Associated with Statistical ErrorCO Commanding OfficerCO-OPS Center for Operational Products and ServicesCORS Continually Operating Reference StaitonCTD Conductivity Temperature DepthCEF Chart Evaluation FileCSF Composite Source FileCST Chief Survey TechnicianCUBE Combined Uncertainty and Bathymetry EstimatorDAPR Data Acquisition and Processing ReportDGPS Differential Global Positioning SystemDP Detached PositionDR Descriptive ReportDTON Danger to NavigationENC Electronic Navigational ChartERS Ellipsoidal Referenced SurveyERZT Ellipsoidally Referenced Zoned TidesFFF Final Feature FileFOO Field Operations OfficerFPM Field Procedures ManualGAMS GPS Azimuth Measurement SubsystemGC Geographic CellGPS Global Positioning SystemHIPS Hydrographic Information Processing SystemHSD Hydrographic Surveys DivisionHSSD Hydrographic Survey Specifications and Deliverables

Acronym DefinitionHSTP Hydrographic Systems Technology ProgramsHSX Hypack Hysweep File FormatHTD Hydrographic Surveys Technical DirectiveHVCR Horizontal and Vertical Control ReportHVF HIPS Vessel FileIHO International Hydrographic OrganizationIMU Inertial Motion UnitITRF International Terrestrial Reference FrameLNM Local Notice to MarinersLNM Linear Nautical MilesMCD Marine Chart DivisionMHW Mean High WaterMLLW Mean Lower Low WaterNAD 83 North American Datum of 1983NAIP National Agriculture and Imagery ProgramNALL Navigable Area Limit LineNM Notice to MarinersNMEA National Marine Electronics AssociationNOAA National Oceanic and Atmospheric AdministrationNOS National Ocean ServiceNRT Navigation Response TeamNSD Navigation Services DivisionOCS Office of Coast SurveyOMAO Office of Marine and Aviation Operations (NOAA)OPS Operations BranchMBES Multibeam EchosounderNWLON National Water Level Observation NetworkPDBS Phase Differencing Bathymetric SonarPHB Pacific Hydrographic BranchPOS/MV Position and Orientation System for Marine VesselsPPK Post Processed KinematicPPP Precise Point PositioningPPS Pulse per second

Acronym DefinitionPRF Project Reference FilePS Physical ScientistPST Physical Science TechnicianRNC Raster Navigational ChartRTK Real Time KinematicSBES Singlebeam EchosounderSBET Smooth Best Estimate and TrajectorySNM Square Nautical MilesSSS Side Scan SonarST Survey TechnicianSVP Sound Velocity ProfilerTCARI Tidal Constituent And Residual InterpolationTPE Total Porpagated ErrorTPU Topside Processing UnitUSACE United States Army Corps of EngineersUSCG United Stated Coast GuardUTM Universal Transverse MercatorXO Executive OfficerZDA Global Positiong System timing messageZDF Zone Definition File
APPENDIX I
TIDES AND WATER LEVELS
UNITED STATES DEPARMENT OF COMMERCE National Oceanic and Atmospheric Administration National Ocean Service
Silver Spring, Maryland 20910
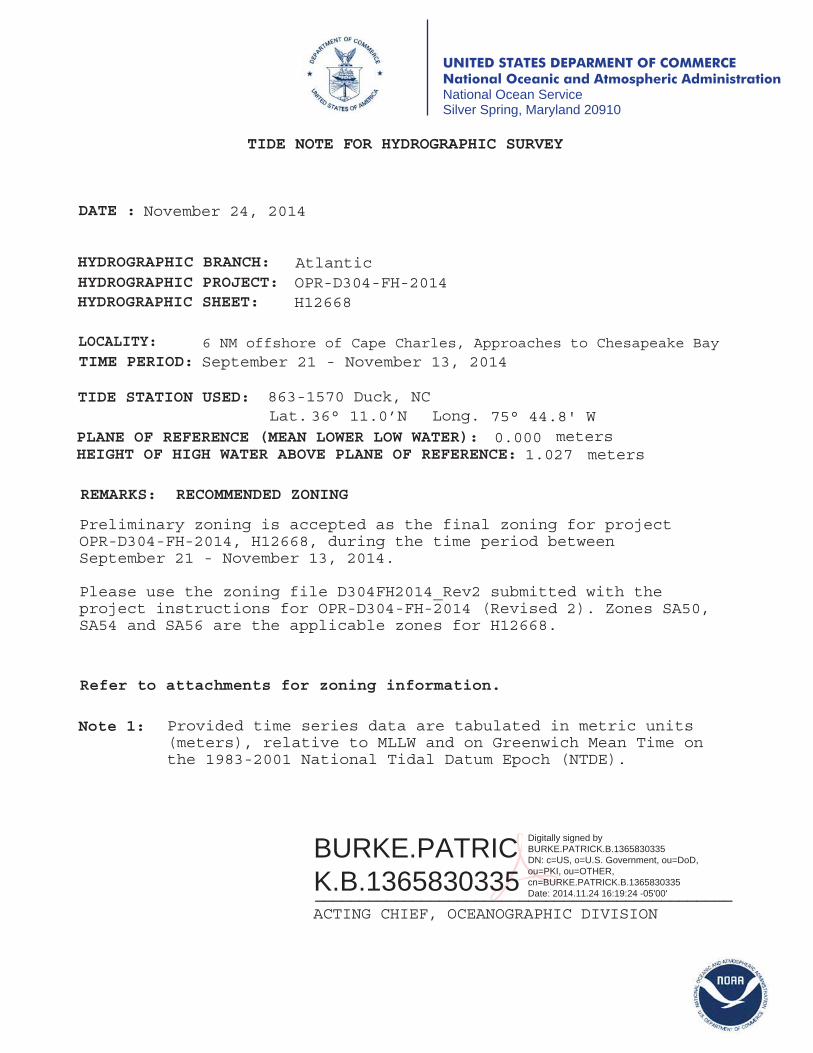
HYDROGRAPHIC BRANCH: AtlanticOPR-D304-FH-2014
LOCALITY:
H12668
6 NM offshore of Cape Charles, Approaches to Chesapeake BaySeptember 21 - November 13, 2014
TIDE STATION USED:
Refer to attachments for zoning information.
HYDROGRAPHIC PROJECT:HYDROGRAPHIC SHEET:
DATE :
TIME PERIOD:
November 24, 2014
863-1570 Duck, NCLat. Long.36° 11.0’N 75° 44.8' W
PLANE OF REFERENCE (MEAN LOWER LOW WATER): 0.000 metersHEIGHT OF HIGH WATER ABOVE PLANE OF REFERENCE: 1.027 meters
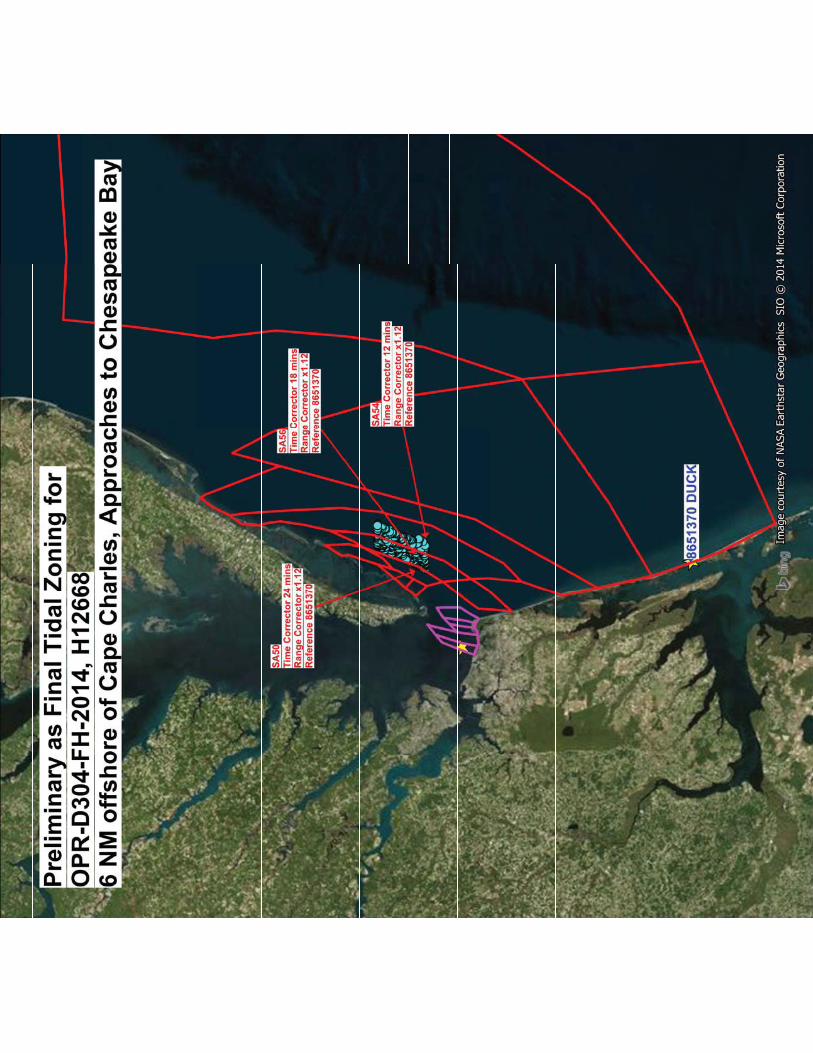
Preliminary zoning is accepted as the final zoning for projectOPR-D304-FH-2014, H12668, during the time period betweenSeptember 21 - November 13, 2014.
Please use the zoning file D304FH2014_Rev2 submitted with theproject instructions for OPR-D304-FH-2014 (Revised 2). Zones SA50,SA54 and SA56 are the applicable zones for H12668.
Note 1: Provided time series data are tabulated in metric units(meters), relative to MLLW and on Greenwich Mean Time onthe 1983-2001 National Tidal Datum Epoch (NTDE).
BURKE.PATRICK.B.1365830335
Digitally signed by BURKE.PATRICK.B.1365830335DN: c=US, o=U.S. Government, ou=DoD, ou=PKI, ou=OTHER, cn=BURKE.PATRICK.B.1365830335Date: 2014.11.24 16:19:24 -05'00'
ACTING CHIEF, OCEANOGRAPHIC DIVISION
TIDE NOTE FOR HYDROGRAPHIC SURVEY
_______________________________________________
REMARKS: RECOMMENDED ZONING

APPENDIX II
SUPPLEMENTAL SURVEY RECORDS AND CORRESPONDENCE

OPS.Ferdinand Hassler - NOAA Service Account <[email protected]>
Extension of H12668 for H12669 Data2 messages
FOO <[email protected]> Thu, Nov 20, 2014 at 12:42 PMTo: Michael Gonsalves - NOAA Federal <[email protected]>
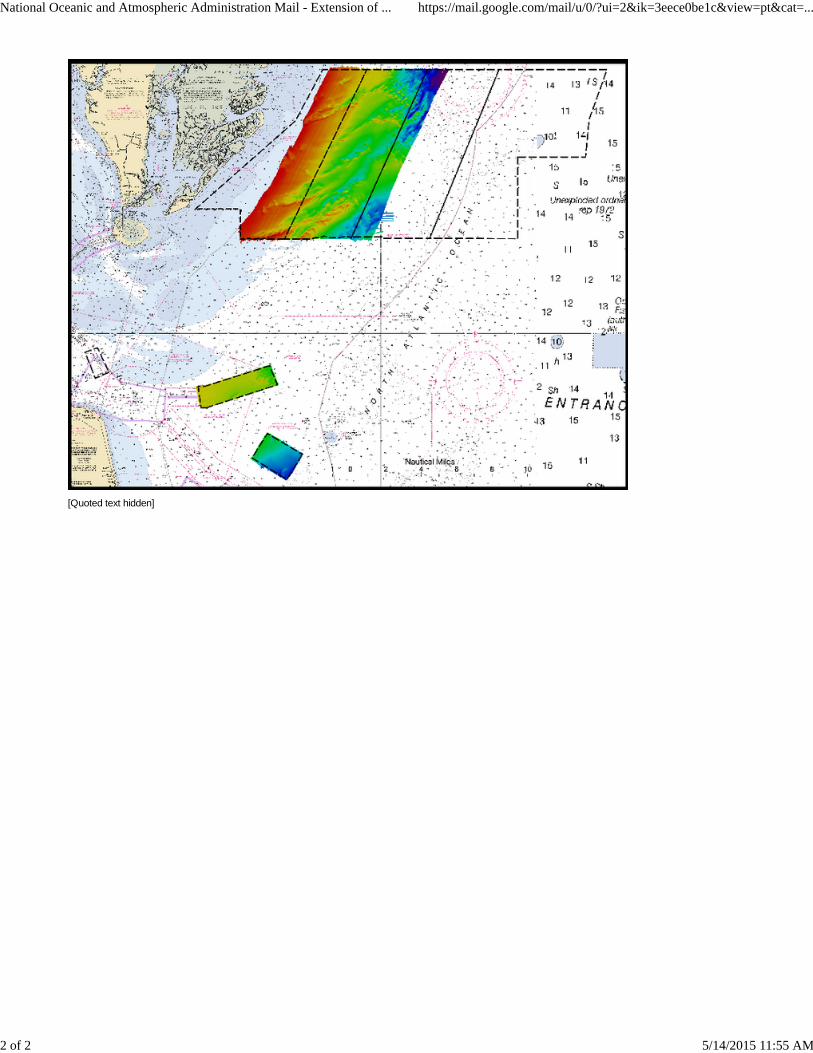
Mike,
As you may recall from a few months ago, we were concerned that we would end up with an odd amount of data(extra data in a new sheet but not completed) at the end of Chesapeake. It did indeed happen as we suspected andwe've ended up with a few squares in to sheet 4 (H12669). I'm attaching a graphic of what all we got finished so youcan see just how much I'm talking about. We would like to combine this extra data into sheet H12668. Do you haveany objections or concerns with this plan?
-V/R,Adam
--Field Operations Officer, NOAA Ship Ferdinand R. Hassler29 Wentworth RoadNew Castle, NH, 03854
Chesapeake Surveyed Area - with sheet limits.tif19431K
Michael Gonsalves - NOAA Federal <[email protected]> Fri, Nov 21, 2014 at 9:07 PMTo: FOO <[email protected]>, Patrick Keown - NOAA Federal <[email protected]>Cc: Lucy Hick - NOAA Federal <[email protected]>
Hey Adam,
Just as an FYI, you should typically work through your Project Manager. My inbox is far too unreliable to depend on atimely response.That said, your plan sounds like a good one to me. Please proceed.
Cheers!~~ mike.g.
National Oceanic and Atmospheric Administration Mail - Extension of ... https://mail.google.com/mail/u/0/?ui=2&ik=3eece0be1c&view=pt&cat=...
1 of 2 5/14/2015 11:55 AM
[Quoted text hidden]
National Oceanic and Atmospheric Administration Mail - Extension of ... https://mail.google.com/mail/u/0/?ui=2&ik=3eece0be1c&view=pt&cat=...
2 of 2 5/14/2015 11:55 AM

OPS.Ferdinand Hassler - NOAA Service Account <[email protected]>
Survey Outline for OPR-D304-FH-14: H12668
OPS.Ferdinand Hassler - NOAA Service Account <[email protected]> Tue, Nov 25, 2014 at 7:55AM
To: _NOS OCS Survey Outlines <[email protected]>Cc: "CO.Ferdinand Hassler - NOAA Service Account" <[email protected]>, Patrick Berube - NOAA Federal<[email protected]>
Good Morning,
Please find attached, the survey outline for OPR-D304-FH-14 survey H12668.
Thank you,Adam
Field Operations Officer, NOAA Ship Ferdinand R. Hassler29 Wentworth RoadNew Castle, NH, 03854
H12668_Survey_Outline.00020K
National Oceanic and Atmospheric Administration Mail - Survey Outline... https://mail.google.com/mail/u/0/?ui=2&ik=3eece0be1c&view=pt&cat=...
1 of 1 5/14/2015 11:54 AM
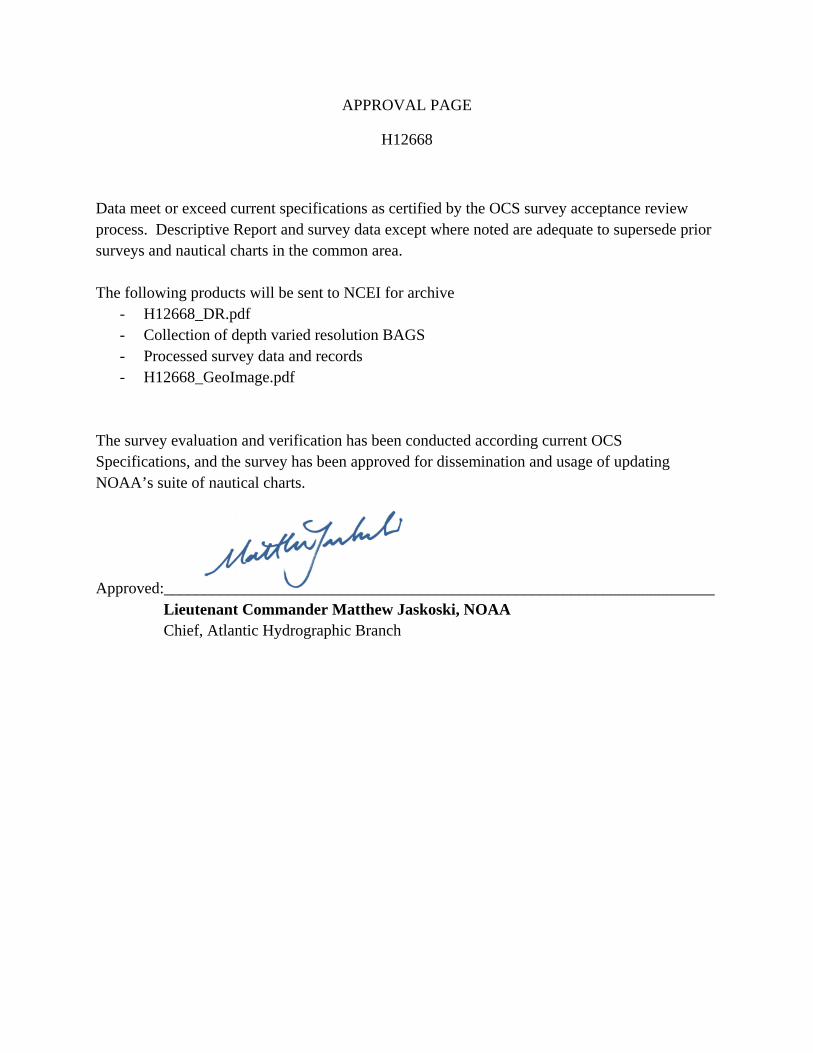
APPROVAL PAGE
H12668
Data meet or exceed current specifications as certified by the OCS survey acceptance review process. Descriptive Report and survey data except where noted are adequate to supersede prior surveys and nautical charts in the common area.
The following products will be sent to NCEI for archive - H12668_DR.pdf - Collection of depth varied resolution BAGS - Processed survey data and records - H12668_GeoImage.pdf
The survey evaluation and verification has been conducted according current OCS Specifications, and the survey has been approved for dissemination and usage of updating NOAA’s suite of nautical charts.
Approved:_____________________________________________________________________ Lieutenant Commander Matthew Jaskoski, NOAA Chief, Atlantic Hydrographic Branch