Embed Size (px)
Citation preview
Calhoun: The NPS Institutional Archive
Theses and Dissertations Thesis Collection
2015-09
Descriptive analysis and strategic options to defeat
commodity-based threat financing methodologies
related to gold
Whitaker, Stuart H.
Monterey, California: Naval Postgraduate School
http://hdl.handle.net/10945/47343
NAVAL POSTGRADUATE
SCHOOL
MONTEREY, CALIFORNIA
THESIS
Approved for public release; distribution is unlimited
DESCRIPTIVE ANALYSIS AND STRATEGIC OPTIONS TO DEFEAT COMMODITY-BASED THREAT
FINANCING METHODOLOGIES RELATED TO GOLD
by
Stuart H. Whitaker
September 2015
Thesis Advisor: Sean Everton Co-Advisor: Matthew Jacobs

THIS PAGE INTENTIONALLY LEFT BLANK
i
REPORT DOCUMENTATION PAGE Form Approved OMB No. 0704–0188
Public reporting burden for this collection of information is estimated to average 1 hour per response, including the time for reviewing instruction, searching existing data sources, gathering and maintaining the data needed, and completing and reviewing the collection of information. Send comments regarding this burden estimate or any other aspect of this collection of information, including suggestions for reducing this burden, to Washington headquarters Services, Directorate for Information Operations and Reports, 1215 Jefferson Davis Highway, Suite 1204, Arlington, VA 22202-4302, and to the Office of Management and Budget, Paperwork Reduction Project (0704-0188) Washington, DC 20503. 1. AGENCY USE ONLY (Leave blank)
2. REPORT DATE September 2015
3. REPORT TYPE AND DATES COVERED Master’s thesis
4. TITLE AND SUBTITLE DESCRIPTIVE ANALYSIS AND STRATEGIC OPTIONS TO DEFEAT COMMODITY-BASED THREAT FINANCING METHODOLOGIES RELATED TO GOLD
5. FUNDING NUMBERS
6. AUTHOR(S) Whitaker, Stuart H. 7. PERFORMING ORGANIZATION NAME(S) AND ADDRESS(ES)
Naval Postgraduate School Monterey, CA 93943-5000
8. PERFORMING ORGANIZATION REPORT NUMBER
9. SPONSORING /MONITORING AGENCY NAME(S) AND ADDRESS(ES)
N/A
10. SPONSORING / MONITORING AGENCY REPORT NUMBER
11. SUPPLEMENTARY NOTES The views expressed in this thesis are those of the author and do not reflect the official policy or position of the Department of Defense or the U.S. Government. IRB Protocol number ____N/A____.
12a. DISTRIBUTION / AVAILABILITY STATEMENT Approved for public release; distribution is unlimited
12b. DISTRIBUTION CODE
13. ABSTRACT (maximum 200 words)
This thesis identifies the contributions of gold from mine to market in financing nefarious organizations, sustaining illicit economies, and impacting national economies. After identifying common practices at all levels of operations and the market participants involved, regional cases from Africa, the Middle East, Indian Subcontinent, and South America are discussed, which illuminate the vulnerabilities in this trade. Nongovernmental organization, intergovernmental organization, and state responses are also discussed in their efforts to counter threat financing, formalize operations, and identify problematic sourcing of this highly liquid commodity. Threat financing being transnational in nature, the international policy environment in the context of the Financial Action Task Force is also analyzed to illuminate network structures and identify at-risk states.
Market operations and the narrative of regional threats were constructed through research into United States and intergovernmental organization publications, foreign state produced publications and legislation, industry trade-group standards, academic literature, and open-source reporting. Published data was also collected from the Financial Action Task Force, the World Bank, the United Nations, industry groups, and auditing firms.
14. SUBJECT TERMS Counter threat finance, commodity-based money laundering, terrorist financing, social network analysis, bright networks, financial regulations
15. NUMBER OF PAGES
125 16. PRICE CODE
17. SECURITY CLASSIFICATION OF REPORT
Unclassified
18. SECURITY CLASSIFICATION OF THIS PAGE
Unclassified
19. SECURITY CLASSIFICATION OF ABSTRACT
Unclassified
20. LIMITATION OF ABSTRACT
UU NSN 7540–01-280-5500 Standard Form 298 (Rev. 2–89) Prescribed by ANSI Std. 239–18

ii
THIS PAGE INTENTIONALLY LEFT BLANK
iii
Approved for public release; distribution is unlimited
DESCRIPTIVE ANALYSIS AND STRATEGIC OPTIONS TO DEFEAT COMMODITY-BASED THREAT FINANCING METHODOLOGIES RELATED
TO GOLD
Stuart H. Whitaker Lieutenant, United States Navy
B.S., United States Merchant Marine Academy, 2008
Submitted in partial fulfillment of the requirements for the degree of
MASTER OF BUSINESS ADMINISTRATION
from the
NAVAL POSTGRADUATE SCHOOL September 2015
Approved by: Dr. Sean Everton Thesis Advisor
CDR Matthew Jacobs, USN Co-Advisor
Dr. William Gates Dean, Graduate School of Business and Public Policy

iv
THIS PAGE INTENTIONALLY LEFT BLANK
v
ABSTRACT
This thesis identifies the contributions of gold from mine to market in financing
nefarious organizations, sustaining illicit economies, and impacting national economies.
After identifying common practices at all levels of operations and the market participants
involved, regional cases from Africa, the Middle East, Indian Subcontinent, and South
America are discussed, which illuminate the vulnerabilities in this trade.
Nongovernmental organization, intergovernmental organization, and state responses are
also discussed in their efforts to counter threat financing, formalize operations, and
identify problematic sourcing of this highly liquid commodity. Threat financing being
transnational in nature, the international policy environment in the context of the
Financial Action Task Force is also analyzed to illuminate network structures and
identify at-risk states.
Market operations and the narrative of regional threats were constructed through
research into United States and intergovernmental organization publications, foreign state
produced publications and legislation, industry trade-group standards, academic
literature, and open-source reporting. Published data was also collected from the
Financial Action Task Force, the World Bank, the United Nations, industry groups, and
auditing firms.

vi
THIS PAGE INTENTIONALLY LEFT BLANK
vii
TABLE OF CONTENTS
I. INTRODUCTION..................................................................................................1 A. BACKGROUND ........................................................................................2 B. SCOPE ........................................................................................................3 C. CTF LITERATURE REVIEW ................................................................5
1. U.S. Government CTF Publications .............................................5 2. IGO and Non-governmental Organizations ................................6 3. Academic .........................................................................................7 4. Independent Reporting and Open Source ...................................9
D. SNA LITERATURE REVIEW ..............................................................10 E. METHODOLOGY AND DATA SOURCES ........................................11
1. Operational Chain and AML/CFT Policy Methodology and Data Sources..........................................................................12
2. SNA Methodology and Data Sources .........................................13
II. THE OPERATIONAL CHAIN ..........................................................................15 A. UPSTREAM OPERATIONS ..................................................................15
1. Legitimate Upstream Operations ...............................................15 a. Legitimate Mining .............................................................16 b. Legitimate Refining...........................................................17
2. Illicit Upstream Operations ........................................................17 a. Illicit Mining .....................................................................18 b. Illicit Refining ...................................................................19
B. DOWNSTREAM OPERATIONS ..........................................................20 1. Legitimate Downstream Operations ..........................................20
a. LBMA ................................................................................20 b. DMCC ................................................................................21
2. Illicit Downstream Operations....................................................22 a. Smuggling..........................................................................23 b. Recycled Gold ....................................................................24
C. SUMMARY ..............................................................................................24
III. REGIONAL THREATS ......................................................................................27 A. AFRICA ....................................................................................................27
1. Democratic Republic of the Congo .............................................28 2. Central African Republic ............................................................29
B. DUBAI .......................................................................................................31 C. SOUTH ASIA ...........................................................................................33
viii
D. SOUTH AMERICA .................................................................................34 E. SUMMARY ..............................................................................................36
IV. POLICY AND REGULATION ..........................................................................37 A. IGOS..........................................................................................................37
1. U.N. ................................................................................................37 2. OECD ............................................................................................39 3. FATF .............................................................................................39
B. STATE-LEVEL........................................................................................40 1. United States .................................................................................40 2. United Arab Emirates..................................................................41 3. Peru ...............................................................................................42
C. SUMMARY ..............................................................................................43
V. SOCIAL NETWORK ANALYSIS OF THE AGGREGATE FATF/FSRB NETWORK ...................................................................................45 A. METHODOLOGY AND ATTRIBUTE DATA ....................................45
1. Network Boundaries ....................................................................46 2. Valuation of Ties ..........................................................................46 3. Ties versus Conduits ....................................................................48 4. Attributes ......................................................................................49
B. NETWORKS AND THE AGGREGATE ..............................................49 1. Financial Action Task Force .......................................................51 2. Asia/Pacific Group on Money Laundering ................................52 3. Caribbean Financial Action Task Force ....................................53 4. Eurasian Group on Combating Money Laundering and
Financing of Terrorism ...............................................................54 5. Eastern and Southern Africa Anti-Money Laundering
Group ............................................................................................55 6. Financial Action Task Force of Latin America .........................56 7. Inter-Governmental Action Group against Money
Laundering in West Africa .........................................................57 8. Middle East and North Africa Financial Action Task
Force ..............................................................................................58 9. Committee of Experts on the Evaluation of Anti-Money
Laundering Measures and the Financing of Terrorism ...........59 10. The Aggregate FATF/FSRB Network ........................................60 11. Network Decay .............................................................................64 12. Network Visualization Using Attributes ....................................67
C. STRATEGIC OPTIONS FOR RESILIENCE AND TARGETING ...........................................................................................70
ix
1. Resilience ......................................................................................70 2. Policy Targeting ...........................................................................71
D. SUMMARY ..............................................................................................72
VI. FINDINGS AND CONCLUSION ......................................................................73 A. FINDINGS ................................................................................................73
1. Operational ...................................................................................73 a. Recognition of Illicit Mining ............................................74 b. Trade Transparency Units ................................................74 c. Dismantling Illicit Economies ..........................................75
2. Policy .............................................................................................75 a. FATF .................................................................................76 b. Government .......................................................................76 c. Industry..............................................................................77
B. CONCLUSION ........................................................................................78
APPENDIX. COMPILED DATASET AND SOCIOGRAM SOURCES ..................81 A. DATASET .................................................................................................81 B. SOCIOGRAMS AND SOURCES OF SELECT METRICS ...............89
LIST OF REFERENCES ................................................................................................91
INITIAL DISTRIBUTION LIST .................................................................................103

x
THIS PAGE INTENTIONALLY LEFT BLANK
xi
LIST OF FIGURES
Figure 1. Sociogram of the FATF network ...............................................................51
Figure 2. Sociogram of the APG network .................................................................52
Figure 3. Sociogram of the CFATF network ............................................................53
Figure 4. Sociogram of the EAG network .................................................................54
Figure 5. Sociogram of the ESAAMLG network ......................................................55
Figure 6. Sociogram of the GAFILAT network ........................................................56
Figure 7. Sociogram of the GIABA network ............................................................57
Figure 8. Sociogram of the MENAFATF network ...................................................58
Figure 9. Sociogram of the MONEYVAL network ..................................................59
Figure 10. Sociogram of the aggregate network .........................................................60
Figure 11. Aggregate network with nodes colored by Newman Groups ....................61
Figure 12. Aggregate network displaying boundary spanner, potential ......................63
Figure 13. Aggregate network with ties of weight less than or equal to 2.0 removed......................................................................................................64
Figure 14. Aggregate network with ties of weight less than or equal to 3.0 removed......................................................................................................65
Figure 15. Aggregate network with ties of weight less than or equal to 5.0 removed......................................................................................................66
Figure 16. Aggregate network with ties of weight less than or equal to 6.0 removed......................................................................................................67
Figure 17. Actors layered by degree centrality ...........................................................68
Figure 18. Sociogram of aggregate network with nodes sized by GDP attributes ......70

xii
THIS PAGE INTENTIONALLY LEFT BLANK
xiii
LIST OF TABLES
Table 1. Isolate States and Jurisdictions ..................................................................46
Table 2. Centrality rankings of top five actors .........................................................69
Table 3. Compiled Dataset .......................................................................................83

xiv
THIS PAGE INTENTIONALLY LEFT BLANK
xv
LIST OF ACRONYMS AND ABBREVIATIONS
3TG cassiterite, columbite and tantalite, wolframite, and gold
AML/CFT anti-money laundering/combating the financing of terrorism
APG Asia/Pacific Group on Money Laundering
ASM artisanal and small-scale mining
AQ Al Qaeda
CAR Central African Republic
CFATF Caribbean Financial Action Task Force
CIA Central Intelligence Agency
CNT National Transitional Council (Democratic Republic of the Congo)
CTF counter threat finance
CTR currency transaction report
DGCX Dubai Gold & Commodities Exchange
DGD Dubai good delivery
DMCC Dubai Multi Commodities Centre
DNFBP designated non-financial bodies and professions
DOD Department of Defense
DoS Department of State
DPRK Democratic People’s Republic of Korea
DRC Democratic Republic of the Congo
EAG Eurasian Group on Combating Money Laundering and Financing of Terrorism
ESAAMLG Eastern and Southern Africa Anti-Money Laundering Group
EY Ernst & Young
FATF Financial Action Task Force
FinCEN Financial Crimes Enforcement Network
FIU Financial intelligence unit
FSRB FATF-style regional body
GAFISUD Financial Action Task Force on Money Laundering in South America
GAFILAT Financial Action Task Force of Latin America
xvi
GAO General Accounting Office (pre-2004), Government Accountability Office (2004-present)
GDP gross domestic product
GEDRC Group of Experts on the Democratic Republic of the Congo
GIABA Inter-Governmental Action Group against Money Laundering in West Africa
GW Global Witness
IGO intergovernmental organization
IMF International Monetary Fund
IVTS informal value transfer systems
KYC know your customer
LBMA London Bullion Market Association
LRA Lord’s Resistance Army
LSM medium and large scale mining
MENAFATF Middle East and North Africa Financial Action Task Force
MINUSCA United Nations Multidimensional Integrated Stabilization Mission in the Central African Republic
MONEYVAL Committee of Experts on the Evaluation of Anti-Money Laundering Measures and the Financing of Terrorism
MONUSCO United Nations Organization Stabilization Mission in the Democratic Republic of the Congo
NGO non-governmental organization
OECD Organisation for Economic Co-operation and Development
OHCHR Office of the High Commissioner for Human Rights
OTC over the counter
PECAR Panel of Experts on the Central African Republic
PwC PricewaterhouseCoopers
RBA risk based assessment
RGG London Bullion Market Association responsible gold guidance
RUF Revolutionary United Front
SAR suspicious activity report
SBS Superintendent of Banking, Insurance, and Private Pension Funds
SNA social network analysis
xvii
TBML trade based money laundering
TCO transnational criminal organizations
TTU trade transparency unit
U.A.E. United Arab Emirates
U.K. United Kingdom
U.N. United Nations
UNEP United Nations Environment Program
USA PATRIOT Act Uniting and Strengthening America by Providing Appropriate Tools Required to Intercept and Obstruct Terrorism Act
VEO violent extremist organizations
WGC World Gold Council

xviii
THIS PAGE INTENTIONALLY LEFT BLANK
xix
ACKNOWLEDGMENTS
I would like to thank CDR Matthew Jacobs, SC, USN for first introducing me to
the subject of CTF and giving me direction, feedback, and counterarguments throughout
the process of writing my thesis; Dr. Sean Everton, for the exposure to the fascinating,
challenging, and intellectually rewarding world of SNA; and to SOCOM J36 for their
assistance in refining my thesis topic, answering questions, and further instilling an
appreciation of the essential value of CTF.

xx
THIS PAGE INTENTIONALLY LEFT BLANK
1
I. INTRODUCTION
The financing of operations and the networks in which they exist are key
components to the business model of transnational criminal (TCO) and violent extremist
organizations (VEO). Complicating the financial operations of these networks, a complex
policy environment exists that regulates money service businesses, allows government
visibility on the transfer of value in the formal sector, and aims to promote the lawful
integrity of the global financial system. As a result of the increased risk for potential
discovery of operations by law enforcement and the intelligence community, transactions
have been driven toward informal value transfer systems (IVTS), fiat currency
alternatives, and a vast laundering network to disguise the source and destination of
funds.
The worldwide scale of money laundering activities is extraordinarily vast. The
United Nations Office on Drugs and Crime (2009, p. 7) conducted an analysis of
previously reported data and estimated that the value of laundered funds from TCOs and
drug trafficking organizations alone “would have been equivalent to around U.S. $650
billion per year in the first decade of the new millennium, equivalent to 1.5% of global
gross domestic product (GDP).” To put this in perspective, utilizing reported 2014 GDP
figures from the World Bank, without even normalizing for inflation, this U.S. $650
billion represents a position between the GDP of Sweden and Saudi Arabia and would be
the 20th largest economy (World Bank, 2015a). It is worth noting that the Financial
Action Task Force (FATF) does not attempt an independent estimate because of the
difficulty in tracking these illegal funds (“F.A.Q.,” n.d., How much money is laundered
per year section, para. 4).
This illicit economy has the power to destabilize governments and economies
through the symbiosis of corruption, kleptocracy, illicit trade, and TCOs in areas with a
weakened rule of law. The National Security Strategy acknowledges these destabilizing
effects, threat financing’s inherently transnational nature, and the need for counter threat
finance (CTF) efforts both domestically and internationally (White House, 2015, pp. 15,
21).
2
CTF has grown alongside the Global War on Terrorism and is viewed as a key
component in the fight against TCOs and VEOs. DOD Directive 5205.14 (2012, pp. 11–
12) states that
DOD activities and capabilities [are to] deny, disrupt, destroy, or defeat finance systems and networks that negatively affect U.S. interests in compliance with all existing authorities and procedures… DOD CTF counters financing used to engage in terrorist activities and illicit networks that traffic narcotics, WMD, Improvised Explosive Devices, other weapons, persons, precursor chemicals, and related activities that support an adversary’s ability to negatively affect U.S. interests.
Understanding the financial systems, methods of IVTS, networks that these
organizations utilize, and the documented nexus between TCOs and VEOs is an essential
precursor to defeating these organizations.
Increased globalization has allowed threats to permeate across borders and
transnational problems have become the norm. Similarly, in threat finance, these
transnational networks are raising and transferring value in a sometimes borderless world.
Leveraging the qualities of this environment, threat finance methodologies often take on
obscure forms and the money trail is convoluted by the intersection of traditional IVTS,
trade based money laundering (TBML) schemes, bulk cash and commodity smuggling,
and revolutionary cryptocurrencies.
A. BACKGROUND
This thesis examines gold and the illicit exploitation of its operations from mine
to market. Its importance to CTF resides in the nature of gold’s value density, anonymity,
and its problematic propensity to exploitation. Like other threat finance methodologies,
its abuse from mine to market does not exist in a vacuum but its illicit economy extends
to hawalas, TBML, direct financing of armed groups and human rights abuses, and
creates ripple effects that are transnational in scale.
The value density of gold refers to its compact size as a monetary vehicle.
Demand for gold is worldwide, and it is bought by individuals, industry, and government
as a store of value. To either satisfy the demand of nefarious actors or integrate illicitly
sourced gold into the legitimate operational supply, its value density allows it to be
3
inconspicuously smuggled in comparison to bulk cash, and its demand-driven liquidity
allows it to be easily sold.
The anonymity of gold also makes it an attractive value storage and transfer
mechanism. Supreme difficulty arises in ascertaining the exact source of raw gold and
gold doré, truthful receipts of sourcing and sale can be easily manipulated to obscure
transfers, and its elemental properties allow it to be easily recast and recycled to obscure
a sometimes suspect vehicle of threat finance.
Gold’s potential for exploitation has horrific results on entire regions. Often
mined in developing nations that sometimes lack the very basic functions of governance,
armed groups can tax subsistence miners or even wrest control of mining operations as a
source of fundraising. The absence of armed groups does not even grant immunity from
exploitation; miners can work in grossly unsafe conditions, debt servitude can be the
standard, sex workers can be trafficked to meet the demand in ad hoc mining
encampments, devastating environmental impacts from toxic chemicals are likely, and
developing governments are deprived of greatly needed tax revenue that could be used
for investment in society and infrastructure.
The transnational legitimate operational chain needs proper regulation and
oversight to avoid the pervasive effects of abuse. On a national scale, policy needs to
address the precursor environments and methodologies of exploitation. On an
international scale, the FATF and FATF-style regional bodies (FSRB), which provide
their recommendations on anti-money laundering and combating the financing of
terrorism (AML/CFT), need to address these same fundamental vulnerabilities to protect
the integrity of financial systems and standardize countermeasures.
B. SCOPE
This thesis discusses gold’s operational chain from miner to market and the
vulnerabilities at the intersection of illicit activities and the legitimate. While there are
definite intersections between the financial misuse of gold and other threat finance
methodologies, this thesis only gives casual mention to these other aspects and only
4
delves further into their symbiosis when necessary to illustrate the full impacts relevant to
the CTF analyst.
Illicit operations are not merely limited to VEOs, TCOs, and other armed groups
for the purposes of this thesis. The greater economic impacts of illicit gold economies
require an examination of illegal mining activity and black markets that are not
necessarily directly tied to violent organizations or criminal enterprises. As an example,
high demand and tariffs in Region A could lead to purchasing gold smuggled from
Region B, which in turn could be gold that was sourced from Region C at a mine
operated by informal subsistence miners. The illicit economy in Region C could then lead
to human trafficking from Region D. In other words, declaring that the buyer in Region A
is outside of the scope as they are not part of a nefarious organization would then
overlook the contribution of demand in Region A to the ongoing issue of human
trafficking in Region D.
This thesis also focuses on proactive operational and policy choices for
countering the illicit operational chain. The FATF and FSRBs are intergovernmental
organizations (IGOs) comprised of member states or jurisdictions creating formal
networks to address and make recommendations on AML/CFT best practices. While
these networks play an important role, the actual benefits reside within the ties produced
between actors within these networks. Scalable ties between members based on network
co-membership can be used to better understand the placement and effectiveness of
actors within the FATF/FSRB aggregate network through social network analysis (SNA).
Many IGOs and entities like the United Nations (U.N.), the World Bank, and the
International Monetary Fund (IMF) are excluded from this analysis because of
AML/CFT being an ancillary function and their almost universal membership that does
not always accurately reflect the nuances of regional, religious, ethnically, historically, or
culturally shared experiences that can add resiliency and strength to ties. The Egmont
Group is also excluded because of its similarly large membership and because it is based
off of financial intelligence unit (FIU) cooperation that is generally more operationally
focused towards reaction instead of proactive policy. A more explicit discussion of the
network boundaries is detailed in Chapter V.
5
C. CTF LITERATURE REVIEW
A large collection of literature exists on the CTF subject published by
governments, IGOs, academics, authors outside of academia, and open source reports. As
interest in the operational utility of CTF and the awareness of its necessity in providing
stability has grown, knowledge acquired in this field is continuously disseminated. The
literature is in large part divided into the categories of individual mechanisms by which
money is laundered and methodologies for value transfer between individuals or groups,
best practices for identifying and restricting the ability for these transfers, and
government and state responses in the CTF realm. This literature review serves as an
introduction to material published in the general field of CTF on commodity based
money laundering, TBML, and state responses.
1. U.S. Government CTF Publications
The 9/11 Commission Report, published in 2004 by the National Commission on
Terrorist Attacks upon the United States, serves as an excellent primer to the raw need for
threat finance intelligence and CTF. This bipartisan report provides a narrative for the
events preceding 9/11, the terrorist attacks themselves, and responses to the attacks prior
to offering recommendations for future reorganization to combat the terrorist threat.
While this report does not focus on the pantheon of terrorist financing, it does offer
insight into the funding mechanisms of bin Laden and Al-Qaeda (AQ). The most relevant
portions come from the diversity of funding sources, transfer mechanisms, and potential
governmental complicity. AQ used zakat—a pillar of Islam with the requirement for
charitable giving- to draw a large quantity of funds for the organization, a network of
hawalas to transfer money, and safe havens in Sudan and Afghanistan to operate.
Additionally, the report touches on the allegations of AQ dealing in blood diamonds as a
store of value but states that there is no “persuasive evidence” (Kean & Hamilton, 2004,
pp. 169–171).
The Office of Terrorism and Financial Intelligence under the U.S. Department of
the Treasury leads the U.S. delegation to the FATF (“Financial Action Task Force,” n.d.).
While the U.S. is the most central state actor in the FATF, the Department of the
6
Treasury also issues reports on findings and best practices in regard to AML/CFT. The
Treasury’s latest National Terrorist Financing Risk Assessment from June 12, 2015 gives
an overview of the myriad threats posed by terrorist financing and general exploitation of
the U.S. financial sector (Department of the Treasury, 2015). In this report, mostly
traditional sources of illicit financing are highlighted in addition to interagency and
international CTF efforts, but a brief description of successful prosecution against a gold-
backed virtual currency exchange, Liberty Reserve, is given (Department of the Treasury,
2015, p. 58). This virtual currency case shows the intersection between fiat, commodity,
and virtual currencies and the international nature of illicit financing.
U.S. Immigration and Customs Enforcement (ICE) under the Department of
Homeland Security has periodically been publishing “The Cornerstone Report” since
2003. Sharing its title with the ICE financial investigation program of the same name,
Cornerstone provides case overviews and highlights vulnerabilities to the U.S. financial
sector. Volume I, Number 3 from July, 2004 addresses “Operation Meltdown,” in which
a black market peso exchange scheme was importing gold bullion to the United States,
purchasing the bullion with drug profits, melting it down at U.S. jewelers into innocuous
items like nuts and bolts, and exporting the gold to Columbia for resale at its gold value
(Immigration and Customs Enforcement, 2004). Not only does this further explain the
crossover of TBML, international threat finance, and commodity exploitation, but it also
illustrates the importance of U.S. government literature to the interagency as it provides
readily available source material to educate the CTF community and provide red flag
indicators.
2. IGO and Non-governmental Organizations
The FATF publishes typology reports, shared case information, best practices
papers, and trend reports in addition to their recommendations (Financial Action Task
Force [FATF], 2012). The Report on Money Laundering Typologies 2002–2003 details
the exploitation of the gold and diamond commodities sectors to enable the laundering of
illicit funds. It gives anonymized examples of international laundering schemes regarding
these commodities, areas prone to exploitation, and rationales for nefarious actors to be
7
inclined to engage in the gold and diamond markets (FATF, 2003). FATF reporting is
essential because of its international forum and ability to disseminate pertinent
information for the protection of financial sectors and national economies.
The World Gold Council (WGC) is a market development agency comprised of
18 mining companies operating on all continents except for Antarctica (“Our Members,”
n.d.). One of their products is the Conflict-Free Gold Standard, which addresses
responsible mining that does not support unlawful armed conflict, protects human rights,
encourages economic development, and promotes transparency in dealings with host
governments to lessen the effects of corruption (World Gold Council [WGC], 2012). This
independent standard of implementation serves to illustrate industry efforts to maintain
compliance with international efforts and acknowledge the effects of mining on
corruption, kleptocracy, conflict support, and human rights.
3. Academic
Terrorism Financing and State Responses offers a collection of terrorism
financing resource literature defining the trade space in which nefarious organizations
choose to make financing decisions and the CTF environment that combats this threat.
While focusing mainly on religiously motivated terrorist groups but still taking into
account the lessons learned from criminal enterprises, the authors offer insight on a range
of issues from terrorism financing intelligence, CTF tradecraft, and emergent threats to
efficacy of response in a variety of regions and the legislative policy environment used to
restrain the threat (Giraldo & Trinkunas, 2007). Anne Clunan discusses international CTF
efforts including those of the FATF, the origins of the 40 recommendations in U.S. and
British anti-money laundering standards (Clunan, 2007, p. 265), the policy environment
that has grown from it, and ultimately that true acceptance of CTF legislative standards
comes reactively after a terrorist attack (Clunan, 2007, p. 263).
Martin Meredith’s tome, The Fate of Africa, offers a historical political narrative
to the African continent since the era of decolonization in the 1960s. While never
suggested to be a monograph on threat finance, the effects of exploitation and chronic
corruption are made explicitly clear. The role of conflict resources and corruption are
8
examined through the 1970s kleptocratic regime of the Central African Republic leader
Jean-Bedel Bokassa, detailed by a $22 million coronation; Liberia and Sierra Leone,
conflict diamonds and corrupt leadership fueling persistent instability; Zimbabwe’s
Robert Mugabe, allegedly sanctioning forced labor in 2008 for diamond extraction;
Rwandan activity in the Democratic Republic of the Congo, operation of massive
resource exploitation in gold, diamonds, and coltan; and other corrupt and kleptocratic
leaders and states (Meredith, 2011, pp. 228, 561–562, 652, 540). Meredith’s contribution
to CTF lies in the detailed discussion of state level corruption and the compounding
effects wrought on regional stability.
Louise Shelley focuses on the interrelations between crime, corruption, and
terrorism in her book Dirty Entanglements. She uses multiple case studies of terrorist
attacks to describe the environments in which terrorism and transnational crime can
flourish and the benefits of terrorist diversification into the criminal sector. Discussing
the myriad ways of obtaining financing, Shelley describes the adoption of legitimate
business techniques by terrorist organizations and their use of geographic competitive
advantage in determining financing methodologies and supply routes (Shelley, 2014, p.
201). She points towards South America and Africa as being regions of resource
exploitation concern because of these natural advantages and the follow-on role, learned
from organized crime, that corruption plays in further movements of these commodities
(Shelley, 2014, p. 201).
Cassara and Jorisch discuss the role of gold and diamonds in CTF and financial
sector security in their book On the Trail of Terror Finance. As a CTF primer for law
enforcement and the intelligence community, they propose a series of questions for
investigators to use to assess the laundering risk of gold dealers, the role of gold in
hawalas, and the myriad of threats that this commodity poses in illicit financing (Cassara
& Jorisch, 2010, pp. 91–102). One of the larger contributions made by Cassara is the
Trade Transparency Unit (TTU) concept that is now used in the United States by
organizations such as ICE. The purpose of TTUs reside in their functions as a
countermeasure to illicit trade and financing by analyzing trade data looking for
9
irregularities in import/export levels that could be indicative of TBML (Cassara &
Jorisch, 2010, p. 68).
4. Independent Reporting and Open Source
Formerly the Washington Post’s West Africa bureau chief in the Ivory Coast from
2000–2001, Douglas Farah broke a 2001 story of AQ dealing in blood diamonds within
the network of Charles Taylor and the Revolutionary United Front (RUF) (Farah, 2001).
The claims of AQ’s linkages to the blood diamond trade is disputed in the 9/11
Commission Report (Kean & Hamilton, 2004, p. 171), but despite the veracity of the
explicit claims of sources involved, the overarching narrative of the network mechanisms
of resource exploitation and masking funds in Sierra Leone and Liberia is unmatched in
its level of detail. Farah’s experiences in West Africa are further detailed in his 2004
book, Blood From Stones, which discusses the route of uncut conflict stones from the
RUF controlled diamond fields of Sierra Leone to European markets and the required
complicity of government officials (Farah, 2004). Farah also describes in this book the
capital flight in gold ingots from Afghanistan to Dubai in 2001, the preference of
hawaladars to utilize gold as a cash settlement method, and the entanglement of the
Emirati gold markets (souks) and criminal elements across the Indian subcontinent
(Farah, 2004, pp. 108–124).
Dubai has also been noted for its centrality in the 9/11 attacks (Kean & Hamilton,
2004), large quantity of hawaladars based out of its gold souks (O’Brien, 2003), generally
unregulated informal banking sector (Central Intelligence Agency [CIA], 2015d),
importing and refining smuggled Congolese conflict gold (Bariyo, Freeman, & Pleven,
2013), misrepresented gold imports (Fitch, 2014), and potential links to organized crime
on the Indian subcontinent (Farah, 2006). Despite significant legislative efforts by the
Central Bank of the U.A.E. and the establishment of the DMCC to provide regulation and
infrastructure for the Dubai commodities market, Dubai maintains a significant role in
terror financing and the processing and transshipment of conflict gold.
10
D. SNA LITERATURE REVIEW
This section discusses SNA and its application to analyzing the networks created
by actor membership in FATF/FSRB organizations. Previous work in the field serves to
provide theory, context, and a foundation for future literature in its multiple applications.
Observer status in membership networks creates weak ties between actors that
lend to connections between various portions of the aggregate network, and Granovetter
(1973) argues that weak ties serve as bridges that enable the diffusion process. Weak ties
assist in the speed of information dissemination and can reduce the path distance between
actors compared to a network that only has strong ties. This is postulated on the
assumption that actors with a weak tie tend to have different actors in their ego networks
and thereby the weak ties create bridges in the network.
Burt’s (1992) theorem on structural holes builds on the work of Granovetter. He
argues that Granovetter’s weak ties serve to bridge structural holes in the network and put
actors who control the gap spanning ties in a brokerage role (Everton, 2012, p. 254). Burt
describes these structural holes as acting like an insulator with non-redundant contacts
providing connection in this network (Burt, 1992, p. 65). In building aggregate network
resilience, the theory regarding structural holes is important as redundancy of ties is
beneficial as no one actor should be in a position of structural brokerage as they can
influence network actions.
In the macro policy network environment, strong ties (full membership) reflect
national self-determination to associate with others in that network. In his case study of a
west coast firm, Krackhardt argues, “Strong ties constitute a base of trust that can reduce
resistance and provide comfort in the face of uncertainty (Krackhardt, 1992, p. 218).”
While not discounting the role that Granovetter’s weak ties play, Krackhardt shows on a
micro level the structural strength and tendencies afforded by the strong ties in times of
crisis. Krackhardt concludes by saying that “philos” (friend) relations are foundational
during times of major change because “change is the product of strong, affective, and
time-honored relationships (Krackhardt, 1992, p. 238).”
11
Underlying network structures in the aggregate exist beyond simple FATF/FSRB
membership. Klerks, an academic with the Dutch National Police Academy, wrote about
the value of network analysis in understanding criminal organizations (Klerks, 2001). His
work centers on the understanding of criminal organizations as organic networks rather
than strict hierarchical structures that are often popular in law enforcement. An enduring
element to his argument for network analysis in understanding criminal organizations can
likewise be applied to the analysis of bright networks; “Social network analysis not only
draws attention to established contacts, but also to relationships to appear not to exist and
are oddly missing (Klerks, 2001, p. 62).”
Network diameter and closeness between actors is also important for the effects
related to the spread of influence and the effects of the network on the actor. Christakis’s
and Fowler’s (2009) discussion on network rules include concepts of how actors seek out
others that are alike, how position in the network shapes the actor, the role of adjacent
actors in shaping the subject actor, how actors are influenced by those separated as far
away as three degrees (“friends’ friends’ friends”), and how network properties affect the
individual (Christakis & Fowler, 2009, pp. 17–26). Their addendum to Stanley Milgram’s
(1967) six degrees of separation, that every actor is linked to another actor through six
degrees, says that all actors are influenced by those up to three degrees away after which
influence dies out similar to the energy dissipation of a spreading wave (Christakis &
Fowler, 2009, p. 28).
E. METHODOLOGY AND DATA SOURCES
The methodology of this thesis is broken into four main parts: gold’s operational
chain from miner to market, AML/CFT policy, SNA of the FATF/FSRB aggregate
network, and proactive operational strategies and policies that can be applied. Out of
these four segments, SNA is unique in its intensive application of the social sciences, the
description of the operational chain and policy are both qualitative and quantitative in
their research intensive approaches, and the strategy and policy recommendations serve
as the findings based off of the previous work conducted.
12
1. Operational Chain and AML/CFT Policy Methodology and Data Sources
The first requirement to describe the applications of gold to threat financing is to
describe the parallel illicit and legitimate operational chains. This gives insight into the
fundamental operations and allows for a discussion of the generic vulnerabilities
encountered at all levels. This section draws heavily on publications from the
Organisation for Economic Co-operation and Development (OECD), major markets like
the Dubai Multi Commodities Center (DMCC) and the London Bullion Market
Association (LBMA), and industry groups like the World Gold Council (WGC).
After a general presentation of the operational chain, a narrative of specific
regional examples is given to illustrate the impacts of illicit economies and the
transnational threats they create. This second part focuses on the environments whether
political, social, or economic, the threat financing methods used, the actors who employ
these methods, and the markets that can be infiltrated by illicit commodities. This section
is diverse in its information sources and draws on publications from three of the “Big
Four” auditing firms, U.N. expert panels, IGOs, non-governmental organizations (NGO),
and independent reporting. Immense value is contributed from independent reporting as it
often gives a hyper-focused view of individual issues and an on-the-ground perspective
that is sometimes not available to larger and more formal organizations. Sometimes
inaccuracy is a risk in independent reporting and therefore multiple sources are often
cross-referenced to ascertain competing claims to the greatest extent possible.
Policy is the third section with a heavy research methodology. This section offers
a sample of national level policies aimed at maintaining the integrity of the financial
sector as it pertains to gold and of IGO recommendations. This section is research
focused and includes legislation and central bank regulations. This bridges the divide
between specific operations and state responses to a transnational issue.
13
2. SNA Methodology and Data Sources
The purpose of Chapter V is to use SNA to better inform strategies of enhancing
network resilience and policy targeting within the aggregate FATF/FSRB network. Sean
Everton (2012, p. 5) describes SNA as, “a collection of theories and methods that
assumes that the behavior of actors (whether individuals, groups, or organizations) is
profoundly affected by their ties to others and the networks in which they are embedded.”
An examination of the macro (state/jurisdiction) level network created by the
FATF/FSRBs leads to an illumination of the underlying structures and identifies
interactions that can be leveraged to direct the introduction and efficient targeting of
policy. Identification of the underlying structures can also be utilized to identify
problematic actors in the network and issues that affect network resilience. A more in-
depth discussion of SNA methodology is included in Chapter V to give more granularity
and collocate the analysis’s processes with the results.
The dataset compiled for this chapter is a membership network of 212 states and
jurisdictions and is presented with sources and an in-depth explanation in the Appendix.
The term “membership network” means that the compiled network reflects 212 states’ or
jurisdictions’ individual participation in one of the nine FATF/FSRB networks. When
this dataset is “folded,” thereby turning actor-by-organization networks into an
aggregated actor-by-actor network, ties are now established between states or
jurisdictions. This reflects the understanding that membership in a single network creates
ties between all actors within the network because voluntary membership is a conscious
decision reflecting an underlying reason to be a network member (Everton, 2012, p. 86).
The primary source of data is the FATF website’s list of country membership in
the FATF or FSRBs (“Countries,” n.d., data included in table). This provides three
statuses of affiliation: “member,” “observer,” or “other.” Occasionally, this list is not
current so individual FSRB websites are consulted for an accurate list of membership.
However extensive this list seems, it is not all inclusive of the international community.
As an example, the Islamic Republic of Iran is included in the FATF’s regional body
matrix despite no status in any organization; but other nations such as Chad, Cameroon,
14
the Central African Republic, Republic of the Congo, and the Democratic Republic of the
Congo are excluded. These nations are at high risk for the movement of illicit funds due
to poor governance and are equally important to include in the aggregate network.
The World Bank is another intergovernmental organization with responsibilities
to the security of the international financial sector and its resilience. The World Bank
periodically publishes a ranking of nation-states’ and certain sub-state entities’ gross
domestic products (GDP). Data from the document on April 14, 2015 was also included
to expand the network of actors (World Bank, 2015b). This dataset also contributes
valuable attribute data to enable the visualization of network membership combined with
economic data.
Despite the volume of data included in the World Bank’s report, GDP data was
not covered for all FATF/FSRB jurisdictions and some nations did not report data. For
the 19 nations/jurisdictions that did not have data reported to the World Bank, the most
recent information was instead pulled from the CIA’s The World Factbook. It should be
noted that the Holy See (Vatican City) does not have a GDP listed in the data set
ultimately compiled because of exclusion from both World Bank and CIA resources and
taking data from a third source for a single actor would also be unnecessary because of
the small economic size.
15
II. THE OPERATIONAL CHAIN
In 2003, the U.S. General Accounting Office (GAO) published a report on threat
financing and the use of alternative remittance systems in which they identified gold as
being a method for moving and storing value, but not earning value (GAO, 2003, p. 10).
While gold may often be used to settle account balances among hawaladars, transfer
value outside government oversight of the formal financial sector, and obscure the money
trail (Cassara & Jorisch, 2010, pp. 98–101), it must not be overlooked that the sourcing of
gold can represent a means to earn value for nefarious groups or individuals.
This chapter explores the supply chain of gold from mining operations through
placement on the large international markets or sale to the purchaser. Throughout the
supply chain, opportunities exist for illicitly sourced gold to be integrated into the
legitimate supply, directly earn value for groups utilizing substandard or forced labor
practices, or indirectly fund groups through illicit taxation and corruption.
A. UPSTREAM OPERATIONS
The origin of commodities in threat financing is the initial point at which value
can be gained. The OECD cites three sources for gold: mining, recycling, and
grandfathered stocks (OECD, 2013, pp. 67–68). All three sources hold a degree of
significance to the CTF analyst but mining and recycling are the two primary methods of
generating value. Grandfathered stocks primarily are a concern to larger bullion markets
and their efforts to ensure a conflict-free origin of the marketed commodity. This section
focuses on the upstream operations –processes from mining to refining- of both
legitimate and illicit gold production (OECD, 2013, p. 70).
1. Legitimate Upstream Operations
There is a vacuity of a universal definition of a legitimate mining operation; for
the purposes of this thesis it should be assumed that a legitimate operation is one that
complies with international human rights legislation, maintains oversight on the
processes throughout its supply chain, is not assisting in the prolonging of illegal armed
16
conflict, and is not intentionally evading state regulations (OECD, 2013, pp. 20–24;
WGC, 2012, p. 10). This subsection focuses on legitimate mining and refining operations
while identifying select points where corruption and illegal practices affect its integrity.
a. Legitimate Mining
PricewaterhouseCoopers (2013a, p. 1) estimated that in 2012 around 66% of the
4,477 metric tons of gold produced came from mined sources while the other
approximately 33% came from recycled gold. From this, the total gross value added from
production by the top 15 gold producing countries alone was estimated around U.S. $78.4
billion (PricewaterhouseCoopers [PwC], 2013a, p. 1). This total represents the production
of mainly medium and large scale mines (LSM) and, to a far lesser extent, some artisanal
and small-scale mines (ASM).
The OECD defines ASM by their small scale and often labor intensive extraction
processes. Alluvial deposits (surface deposits embedded in sand or gravel) are often
exploited in streams, rivers, and areas abandoned by LSM where remnants of former
deposits are now more accessible (OECD, 2013, p. 67). LSM by the OECD definition
refers to any mining operation that is not considered to be ASM and uses far more
sophisticated extraction processes enabling a larger output (OECD, 2013, pp. 65, 67).
Focusing on the contributions of LSM to the total output of legitimate and
regulated mining operations, open-pit and underground mines are the two primary
mechanisms used. Open-pit mining utilizes a series of steps blasted into rock from which
gold-bearing ore and waste are segregated and then hauled away for initial processing.
Underground mining utilizes a series of shafts and tunnels to exploit deposits deeper
underground before ore and waste can be segregated before processing (“Mining,” n.d.,
Underground mines section). After mining, ore is processed and gold is extracted most
often through the practices of cyanidation or floatation. The output of these initial
processes is gold doré (85%-90% purity), which is then sent to a refinery for further
processing (“Mining,” n.d., Cyanidation section; OECD, 2013, p. 67).
In the early phases of mining and initial refinement, financing of illicit activity by
legitimate mining operations generally comes in the form of corruption by government
17
officials or illegal taxation assessed by non-state groups (OECD, 2013, p. 71). Another
possible weakness in this phase is when initial processing of gold-bearing ore occurs at a
location outside the mines area of control (WGC, 2012, p. 4). In this case, it is not
necessarily evident that ore contains gold or other valuable elements and avoidance or
evasion of tariffs may occur by the company or individual actors seeking to make
financial gain (WGC, 2012, pp. 28–29).
b. Legitimate Refining
Dependent on geography and infrastructure, gold doré may be produced either by
the mine on-site or at separate refineries (WGC, 2012, p. 28). Following arrival at the
refinery, gold doré is then refined from its initial 85%-90% purity to a purity of 99.5% or
higher depending on its planned end state purposes (“Refining,” n.d.). After this point,
the refined gold then enters the downstream chain as it moves to the market.
The highly alterable nature of elemental gold causes refining to be one of the
intersections where illicitly-sourced gold can be integrated into the legitimately-sourced
pipeline. Initiatives such as the Conflict-Free Gold Standard intend to codify due
diligence procedures among mining operations to ensure the integrity of the upstream
supply chain, but refiners should also ensure that sourced gold doré comes from
legitimate mining operations (WGC, 2012, p. 30). Refiners are also susceptible to bribery
in order to conceal the origin of gold being refined, invoice manipulation, and general
product misrepresentation (Cassara & Jorisch, 2010, pp. 98–99; OECD, 2013, p. 71).
2. Illicit Upstream Operations
Illicit upstream operations may be more easily defined as they contain the inverse
characteristics of legitimate operations and generally disregards sanctions, rule of law,
human rights, and may serve to fund and enable the continuation of illegal conflict
(OECD, 2013, pp. 20–24; WGC, 2012, p. 10). This subsection focuses on illicit ASM, its
characteristics, and its impact on the integrity of the supply chain.
18
a. Illicit Mining
All ASM operations are not illicit but ASM is more likely to be an indicator of
illegal activity. PwC summarizes the potential benefits and economic impact of ASM
operations “particularly in low income and Highly Indebted Poor Countries” but also
acknowledges that “the sector faces some key challenges, including weak controls and
regulations, poor social and environmental practices, the use of child labour and
smuggling of gold involving criminal networks” (PwC, 2013a, p. 17). Even though ASM
operations may be a readily available source of employment in impoverished areas and
have a positive economic impact, monitoring for substandard conditions must be
maintained and ASM must serve as a risk factor for illicit financing.
As previously discussed, a characteristic of ASM is its low technological methods
and small scale (OECD, 2013). The low level of investment required to start an operation
leads to choosing areas that are economically viable without the use of heavy machinery
and on-site infrastructure like processing facilities for the production of gold doré.
Alluvial gold mining, being a cheap and readily accessible source that can be conducted
without infrastructure, serves as a high risk indicator for potentially illegally sourced gold
(FATF, 2008, p. 24).
A common method of initial extraction of gold from the silt of alluvial mining or
milled ore is mercury amalgamation. In this process mercury is mixed with a gold-
containing silt or slurry, the amalgam is then strained through a cloth to further remove
impurities, and the resultant ball of mercury gold amalgam is approximately 80%
mercury by weight and 20% precious metal (Blacksmith Institute, 2010). After the
amalgam is obtained it is heated with a blowtorch or in an open flame oven to vaporize
the mercury and leave the gold particles behind (“Artisanal Gold Mining,” n.d.,
Description section, para. 2). Gold cyanidation may be used instead of mercury
amalgamation or as an additional method to further extract particles from the waste
product. In this process, the silt or slurry is mixed with cyanide forming a water soluble
compound and then zinc is added to extract the gold (Blacksmith Institute, 2010;
“Mining,” n.d., Cyanidation section).
19
The adverse effects upon the health of mine workers and the environment are
readily apparent. Workers often have no respiratory or skin protection suitable to guard
against the effects of mercury vapors and waste products of both processes are commonly
released directly into the environment.
ASM is not a substitute term for illicit mining practices but the low investment,
readily available sources, and ease of starting an operation without drawing attention to
lack of regulations in force loans itself to being easily exploited by nefarious groups. The
small quantities processed on site can also easily be integrated into other stocks of
legitimately mined gold or smuggled across borders to obscure its origin (OECD, 2013,
p. 71).
b. Illicit Refining
Refining of the processed gold from illicitly mined sources does not differ from
the processes of legitimate operations. The products of mercury amalgamation or gold
cyanidation may have a similar purity to gold doré but the ease of transport of an ASM’s
product versus the large quantities produced by LSM are the differentiating factor in how
easily the product can be integrated into legitimate supply chains.
An ASM with extremely lax regulation sits in the Peruvian Andes in the village of
La Rinconada at approximately 16,700 feet above sea level (“La Rinconada, Peru,” n.d.,
Elevation in right margin). In these mines, payment comes in the form of cachorreo in
which no official wage is paid by the company but instead workers can pocket all the
gold-bearing ore they can carry on one day per month (Finnegan, 2015; Verité, 2012).
These miners in turn take the gold flake they have to a middleman who pays a rate off of
the daily spot price, melts the week’s take into doré, and then smuggles the product on
foot across the border into La Paz, Bolivia for Bolivian and Brazilian buyers (Finnegan,
2015).
While the ASM operations in La Rinconada may have disputable levels of
legitimacy, lax regulation and substandard wage practices contribute to avenues where a
legitimate product may be diverted to unknown buyers. These buyers knowingly engage
20
in illegal smuggling practices and then integrate the product into the greater gold supply,
possibly using the proceeds off of a bargain purchase for further criminal activities.
B. DOWNSTREAM OPERATIONS
Downstream operations refer to the second portion of the operational chain, from
refiner to end user (OECD, 2013, p. 70). At this point in the operational chain, onus is
often placed on the retailer or bullion market to ensure legitimacy of the gold source
whether it is from a bullion refiner or an individual seller of bullion or other gold vehicle.
1. Legitimate Downstream Operations
The legitimate world demand for gold in 2012 stood at 3,611 tons with jewelry,
investment, and official sector purchases accounting for approximately 90% of the
demand (PwC, 2013a, pp.27, 29). This subsection focuses primarily on describing the
market in two locations through the LBMA and the DMCC.
a. LBMA
London is the largest market for gold bullion and the LBMA regulates the Good
Delivery List, wholly owns Precious Metals Prices Ltd which sets the twice daily London
spot price, and published the Responsible Gold Guidance (RGG) which accredits refiners
as having sufficient quality in their product and ensures that they have met responsible
source criteria (LBMA, 2015, pp. 2–4). The services offered and functions conducted by
the LBMA and its participating members include over the counter (OTC) trades between
individual investors or central banks, vaulting services for traded gold, clearing and
settling of accounts through paper transfers in order to not have to transfer physical
metal, and the setting of spot prices in U.S. dollars (“The London Bullion Market,” n.d.).
The Good Delivery bar is the highest standard for bullion and is the common unit
of trade on the LBMA. Allowed to specified tolerances, the Good Delivery bar is
generally 400 troy ounces in weight with a minimum 995.0 parts per thousand fine gold
(“Good Delivery Rules,” n.d., Specifications for a good delivery gold bar section).
Refiners are certified for production and allowed to supply the LBMA after meeting
certain criteria including five years in operation, a minimum 10 tons annual production,
21
£15 million net worth, and adherence to the RGG (LBMA, n.d.). These controls require
third party audits of both refining processes and adherence to due diligence sourcing
requirements and know your customer (KYC) regulatory compliance (LBMA, 2015, p.
4).
In the London OTC market, the Market Makers conduct the transactions on behalf
of their clients with the five full members (ability to sell spots, forwards, and options)
being Barclays Bank Plc, Goldman Sachs International, HSBC Bank USA NA, JP
Morgan Chase Bank, and UBS AG while an additional nine Market Makers without the
ability to sell all three products include members such as Citibank NA, Credit Suisse, and
Deutsche Bank AG (“Membership,” n.d., Market-making members section). The
minimum transaction size is 1,000 troy ounces of gold creating frequent sizable
transactions (LBMA, 2008, p. 5).
Opportunities for illicit financing on this major market come in two forms:
refiners’ sourcing and customers’ objectives. While responsible sourcing guidance is in
place through the LBMA RGG in accordance with the OECD due diligence guidance, it
is still possible for illegally sourced gold to be integrated into the legitimate supply chain
at some refiners because of the sheer quantity of gold being refined (LBMA, 2015, p. 4).
The second threat of customers’ objectives is partially mitigated through KYC
regulations but storing and transferring illicit funds is possible when banks are not able to
catch evidence of possible red flags.
b. DMCC
The DMCC is a Government of Dubai strategic initiative founded in 2002 to
regulate and encourage growth in the Dubai commodities market through infrastructure
management (“DMCC—Who We Are,” n.d., Who we are section). In 2011, 754 tons of
gold was imported into Dubai and the sum value of imports and exports totaled
approximately U.S. $56 billion, solidifying Dubai as the largest gold market in the
Middle East (“Dubai Gold Trade Statistics,” n.d.).
The DMCC has also created the Dubai Good Delivery (DGD) to its own
specifications of 995 parts per thousand fine gold with a standard weight of 1 kg within
22
specified tolerances (“Accreditation Initiatives,” n.d., About DGD section). The DGD list
is similar to the one produced by London in that it specifies accredited refiners and
requires compliance to quality standards and responsible sourcing guidelines.
The DMCC has majority ownership of the Dubai Gold & Commodities Exchange
(DGCX). The DGCX offers clients the ability to trade in gold futures and across a range
of other commodities including hydrocarbons, silver, and copper. This commodities
exchange benefits from Emirati market regulations, the transnational business
environment of Dubai, and the geographical situation of Dubai between the markets of
Europe and Asia (“About DGCX,” n.d., Benefits of trading on DGCX section).
The DMCC has implemented the OECD due diligence guidance and requires
participating refineries to adhere to these risk based countermeasures (DMCC, 2012, p.
1). The DMCC’s guidance is comparable to the LBMA RGG as both are based off of the
OECD’s five-step guidance, require risk identification, risk response, and third-party
auditing (SGS United Kingdom Ltd, 2014, pp. 7, 16–17).
Opportunities for illicit financing through the DMCC and the DGCX are very
similar to the LBMA. Due diligence processes mandated by market regulations are only
as strong as the due diligence by the upstream operations of the refiners and miners. KYC
regulations, AML/CFT regulations, and willingness of the government to prosecute
violators remain the key mechanisms to maintain market legitimacy.
Third-party audit compliance mandated by the DMCC’s guidance has had its
successes. In May, 2015, Al Kaloti Jewellers Factory LTD was delisted from the DGD
list for failures in responsible sourcing compliance (DMCC, 2015; McAuley, 2015).
While responsible sourcing policies and accreditation mechanisms for large markets
incentivize transparency, large throughput at both individual companies and the Dubai
commodities market make enforcement difficult.
2. Illicit Downstream Operations
This subsection focuses on illicit operations from the refiner to the end user by
highlighting small smuggling operations and gold recycling. The OECD guidance refers
23
to recycled gold as taking an unprocessed form –returned gold products to the refiner,
melted gold—gold products that have been melted into gold stock by the refiner, or
industrial byproduct—gold that is a secondary output from the mining of another metal
(OECD, 2013, p. 68). It should be noted that recycled gold products are not illegal and
represented 36% of sourced gold in 2012 (PwC, 2013a, p. 4), but it is a potential
weakness in downstream operations that could be used to transfer value and obscure the
financial trail.
a. Smuggling
The weight and mutability of gold makes it an excellent vehicle to discreetly
transport value. At a July 29, 2015 approximate spot price of U.S. $1,100 per troy ounce,
a one kg bar of 0.995 fineness gold is worth over U.S. $35,000. This illustrates the ease in
which couriers can smuggle bullion compared to cash. Further benefitting the smuggler,
the spot prices are easily accessible, demand is always present, and gold is immune to
inflationary pressures present in unstable economies when smuggling bulk cash (Cassara
& Jorisch, 2010, pp. 92–96).
Farah (2002) documented the allegation that the Taliban used gold to smuggle
assets out of Afghanistan to Karachi, Pakistan in late 2001 in order to move assets away
from coalition forces. Estimated at U.S. $10 million in a three week period, this gold was
then further smuggled or exchanged through hawalas where funds were then obscured in
the greater Dubai market (Farah, 2002). This quantity is relatively easy to move with
porous borders and ineffective governance. The relationship between gold and hawala
should also be noted in downstream operations as gold smuggling can be used to balance
accounts between hawaladars (Cassara & Jorisch, 2010, pp. 100–101).
In the Dubai market, an Ernst and Young (EY) whistleblower conducting a third-
party audit of Kaloti found multiple problems in their sourcing. On the DGD list since
February, 2010 (DMCC, 2015), Kaloti was found to have made U.S. $5.2 billion in
payments without documentation, imported four tons of gold into the U.A.E. that was
spray-painted silver to avoid scrutiny, and allegedly was conflict sourced from the
Democratic Republic of the Congo (Verity, 2014). Eventually delisted from the DGD in
24
2015, this case of smuggled commodities from a listed and previously vetted organization
shows the extent to which gold can be brazenly smuggled into a large market.
India, the largest consumer of gold (PwC, 2013a, p. 29), has seen a surge in
smuggled gold being imported. To avoid customs and import tariffs on the precious
metal, smugglers have begun recasting the metal into objects like belt buckles and
flashlight batteries (Ray, 2014). The primary rationale for smuggling gold into India may
be tax avoidance but the ease and inventiveness of smugglers should peak the awareness
of CTF analysts.
b. Recycled Gold
Gold recycling is another point at which illicit funds may be integrated into the
legitimate supply. By receiving finished gold products and reprocessing them for future
sale to industry, investors, or jewelers, the origin is obscured and anonymity of the
participants is secured. While recycled gold represents an approximate one-third share of
sourced gold (PwC, 2013a, p. 4), there is a high level of risk in this market.
The OECD guidance recommends consistency in a risk-based approach for
recyclers, adherence to KYC regulations, and adoption of an accounting system to match
inputs to outputs (OECD, 2013, pp. 86–96). The myriad of sources and suppliers of
legitimate recycled gold can easily allow the integration of smuggled and illicitly sourced
metal. The product can contain multiple origins that become more difficult to ascertain as
it flows from recyclers to refiners and back to the market with potentially inadequate due
diligence processes (OECD, 2013, p. 71).
C. SUMMARY
The gold supply chain from source to ultimate consumer contains numerous
independent entities each with their own inherent vulnerabilities. The operational chain
provides opportunities to generate, store, and transfer value for nefarious actors and
contribute to the perpetuation of conflict. Industry groups and regulatory bodies have
worked towards mitigating these risks through due diligence guidelines and licensing of
market participants but abuses are still bound to occur in such a large market.
25
Chapter III builds upon the foundations of the operational chain in this chapter.
By presenting regional threats of illicit financing utilizing gold, gaps in policy and red-
flags for abuses may be illuminated.

26
THIS PAGE INTENTIONALLY LEFT BLANK
27
III. REGIONAL THREATS
Gold is a crucial part of state level financial policy, a mechanism of investment
for many banks and individuals, and a show of wealth and status in most parts of the
world. While policies and regulations are set in place to protect the integrity of these
markets, integration of illicitly sourced gold into legitimate supplies and the store of
value in a generally anonymous commodity by nefarious groups prove to be salient
threats.
Felbab-Brown (2010, pp. 175–177) discusses three contributing factors to the
formation and continuing operation of illicit economies: the provision of an ungoverned
space, governments that are unwilling or unable to stop the illicit activities, and an
existing demand for the product. This chapter discusses regional threats emanating from
some of these ungoverned or under-governed spaces. While this chapter is not all
inclusive in its presentation of where illicit markets operate, it does serve to relate the
illicit market operations discussed in the previous chapter to specific regional
occurrences.
A. AFRICA
This section discusses the upstream operations in the Democratic Republic of the
Congo (DRC) and the Central African Republic (CAR). Situated in the African Great
Lakes Region (“About the Great Lakes Region,” n.d.), the DRC has been noted as a
hotbed of instability with warring factions controlling mines, taxing miners and
smugglers, and directly conducting a myriad of human rights abuses (CIA, 2015b). In the
eastern DRC, South Kivu is a major center for this activity and as much as 50% of the
DRC’s gold production comes from here (The Enough Project [Enough], 2012, p. 4). The
DRC, along with its neighboring countries including the CAR, were singled out in
section 1502 of the Dodd-Frank Wall Street Reform and Consumer Protection Act of
2010. This legislation requires disclosure of all minerals sourced from this conflict region
and an independent audit of the purchasing entities due diligence procedures to ensure
that the purchase of mined products does not fund or aid armed groups.
28
1. Democratic Republic of the Congo
In the DRC, mining that drives further conflict comes from cassiterite –used in the
production of tin, coltan –a portmanteaux of colombite and tantalite, wolframite –an ore
that contains tungsten, and gold (de Koning, 2011, p. 5). These minerals are often
collectively referred to by the acronym 3TG. In the eastern DRC a perpetual state of
conflict has seen Congolese military forces, Rwandan Patriotic Army, Rwandan proxy
forces, Ugandan and Lebanese dealers, and Congolese rebel groups involved in the
extraction and supply chain of 3TG. Resource concessions were also granted by the
Kabila regime to Angola and Zimbabwe in exchange for assistance (Meredith, 2011, pp.
537–544). The dynamics of the conflict have led to persistent instability, lack of rule of
law, and systemic corruption.
Estimating the size of the conflict gold trade in the DRC is problematic because of
the lack of accurate figures, number of groups involved, and ever-changing pipelines for
smuggling gold out of the region. Utilizing figures from the IMF’s 2010–2011 country
report and those reported by Yager in the U.S. Geological Survey’s 2007 Minerals
Yearbook, the IMF shows the scale of the illicit gold trade in the DRC where official
gold exports totaled 150 kg but its estimated production was approximately 10 metric
tons (IMF, 2014, p. 5). In his policy paper, de Koning (2011, p. 11–12) arrives at a
Congolese production figure of 10 metric tons for 2006 by calculating the difference of
exports and domestic production in the neighboring countries of Burundi and Uganda. De
Koning also notes a drop off in exports from Uganda and Burundi following 2008 and
attributes this to being indicative of different smuggling methods being used.
In the Congolese supply chain, the critical market participants are négociants—
who are the individual traders, and comptoirs—the larger buying houses (de Koning,
2011, p. 5). These market participants may be aligned with certain groups in the conflict
or may be taking protection from these groups to further fund the conflict and evade
sanctions on Congolese exports. The négociants often buy from the ASM operations and
then bring the raw gold to the cities of Bukavu and Butembo, being taxed by armed
groups and the Congolese army while enroute, and then sell the gold to the comptoirs
(Bafilemba and Lezhnev, 2015, p. 7).
29
After being collected in the larger cities, gold is then smuggled to Uganda,
Burundi, and Tanzania where the origin of gold is obscured through a false declaration of
sourcing and sold to a smuggler who then takes the gold on to Dubai or even allegedly
sold to conflict linked companies like Berkenrode (operating out of Belgium) (Enough
Team, 2012, p. 8). Gold can also be directly smuggled from the DRC to locations like
Dubai where consumer products are bought and repatriated to the DRC in a TBML style
of operation (de Koning, p. 2011, p. 13).
The trade in conflict gold is extremely damaging to the Congolese economy
where the 2014 GDP was U.S. $55.8 billion and the GDP per capita was estimated at
around U.S. $700 (CIA, 2015b). The economic contributions by the conflict gold industry
to the DRC is difficult to quantify as value is not dispersed in an illicit economy in a
manner similar to what could be seen in a formal mining sector. Child labor, trade control
by armed factions, cross-incentives by corrupt governments and kleptocratic officials,
and an inability for governments to enforce rule of law all lead to a continuing crisis in
the upstream operations.
2. Central African Republic
The CAR is another nation in the expanded African Great Lakes region beset with
a tumultuous political history and mired by extreme violence. Currently operating under a
presidency emplaced by the National Transitional Council (CNT), elections are expected
to be held in the final quarter of 2015 (CIA, 2015a). The United Nations
Multidimensional Integrated Stabilization Mission in the CAR (MINUSCA) which has
approximately 11,000 U.N. uniformed personnel is tasked with protecting the civilian
population, human rights, and supporting the CNT (“MINUSCA Facts and Figures,” n.d.,
Strength section; Security Council, 2015). The French military also conducts
deployments to the CAR.
The major non-state armed groups in the ongoing conflict in the CAR are the ex-
Séléka and the anti-balaka. The ex-Séléka are comprised of mainly Muslim forces of
multi-origin militias that integrated with the Séléka movement before it dissolved,
becoming the ex-Séléka. The anti-balaka are Christian civilians formed into ad hoc
30
militias in response to the ex-Séléka (Mellgard, 2015). A third player in the conflict is the
Lord’s Resistance Army (LRA), led by Joseph Kony who also conducts operations in
Uganda and the DRC (CIA, 2015a).
Michel Djotodia, the head of the Séléka before he officially disbanded it, seized
power in 2013. He became the first Muslim President in an 80% Christian nation, and
subsequently was pressured into resignation in January, 2014 (CAR interim president
Michel Djotodia resigns, 2014). The ex-Séléka have since moved their headquarters from
the capital of Bangui in the south to Bambari in the central region of the CAR where
there is a majority Muslim population.
One ex-Séléka controlled mining town is Ndassima. Located approximately four
hours from Bambari, this mine was formerly owned by Canadian exploration company
Axmin Inc. before being abandoned in 2012 (Gridneff, 2015). Currently, artisanal miners
use this location and are illegally taxed and are even issued mining licenses by the ex-
Séléka (Flynn, 2014). Under extremely dangerous and completely unregulated
conditions, the ex-Séléka allegedly net 15 kg of gold on a monthly basis. This is reported
to be valued at U.S. $350,000 on the local market (Dembassa-Kette, 2014).
After the ore goes through mercury amalgamation to produce raw gold, it is then
smuggled out to neighboring countries and sold in exchange for weapons (Gridneff,
2015). The conflict in the CAR has produced approximately 140,000 refugees of which
106,000 have fled to Cameroon (Kitidi, 2014). This diaspora has allowed established
smuggling pipelines to form and aid the illegal export of raw gold.
The LRA has also diversified into raw gold. Reports involve business deals
between the LRA and an ex-Séléka officer named Ahmed Sherif (Enough, 2014, p. 2;
PECAR, 2014, Annex 19). Raw gold has also been allegedly used by the LRA to
purchase weapons from the Janjaweed in Sudan (Enough, 2014, p. 2).
The ongoing conflict in the CAR is devastating in the deaths produced, human
rights abuses by the anti-balaka and the ex-Séléka, and economically. With a 2014 GDP
of U.S. $1.79 billion and a GDP per capita of $600, resource exploitation to perpetuate
the conflict dominates the economy (CIA, 2015a). Official exports are extremely low
31
while the estimated production is about 2 metric tons, worth approximately U.S. $60
million or what would be over 3% of the economy (PECAR, 2014, para. 135). In 2014,
Badica and the National Union of Mining Cooperatives of Central Africa were the only
two companies to officially export gold with a sum total official export figure of 1.7 kg
(PECAR, 2014). The largest gold buyer in the CAR, Badica, only purchased 1 kg which
it then turned into lightweight necklaces so that it could avoid export tariffs on raw gold
(PECAR, 2014, paras. 135–136). The opportunity cost of the illicit economy supplanting
legitimate companies like Axmin Inc. is immeasurable in all factors to include worker
safety, potential exports lost, mining capacity, and regional investment.
B. DUBAI
This section focuses on downstream operations and how illicitly sourced gold is
integrated into the legitimate market. While downstream operations are by definition the
segment of the supply chain from refiner to consumer, for this section it is also helpful to
include the segment of operations from the smuggling/illegal exporter to the refiner. This
section does not insinuate that Dubai’s market is entirely or even majority illicit, but
instead uses a case example of how a developing market can be exploited for nefarious
ends.
In contrast to the impoverished states of the DRC and CAR, the thriving and
diversified nature of Dubai’s financial sector is one of the reasons that it is at a
heightened risk for money laundering and terrorist financing (Department of State [DoS],
2015, pp. 458–459). The growing Dubai gold market makes up approximately 20–25% of
world gold trade and is at a heightened risk to money laundering and terrorist financing
through its scale (Asfour, 2015; Bowers, 2014; Global Witness [GW], 2014, p. 2).
A peculiar factor affecting the legitimacy of the Dubai market is the souks. The
gold souks are a marketplace of approximately 250 jewelers, gold dealers, assayers, and
refiners who have the capacity and means to buy, sell, and recycle raw gold, coinage,
bullion, and jewelry (Enough Team, 2012, p. 10). This is a significant contributing factor
to the ease of which money can be laundered and the movement of funds can be obscured
32
through multiple transactions across a combination of highly liquid commodity and fiat
currencies.
In the souk, cash-for-gold dealers can be a significant threat for the integration of
illicit gold. Enough (2012, p. 10) points toward these souk dealers paying approximately
10% below spot price for undocumented gold. After purchasing the raw gold, they are
then able to recycle it into ingots or bullion before selling it to jewelers or larger
companies. The U.N. Group of Experts on the DRC’s investigation into the trail of
conflict gold through Dubai noted that souk merchants were able to easily purchase gold
from the DRC in cash and no questions were asked about the origins of the gold (Group
of Experts on the Democratic Republic of the Congo [GEDRC], 2015, paras. 210–215).
Illicit finance becomes more entangled when gold is bought from unknown
sources in the souks. Dubai is a global center for hawala (Cassara & Jorisch, 2010, pp.
125–126; O’Brien, 2003) and the souk has the capital and liquidity to maintain
operations. With conflict gold being bought at premiums and recycled into anonymously
sourced bullion, hawala being frequently settled with gold shipments (Cassara & Jorisch,
2010, pp. 100–101), and TBML often being used to repatriate value to the countries of
origin, it is truly a transnational problem.
Larger Dubai gold market participants are not immune to dealing in illegally
sourced gold either. The GEDRC’s narrative on DRC-sourced conflict gold in Dubai
said:
The Dubai Multi Commodities Centre told the Group about its continuous efforts to make the gold trade in Dubai more responsible, mainly through the Responsible Market Participant initiative. In response to a Group request for more information, the United Arab Emirates stated that, as at 18 November, only one company, Kaloti Jewellery International, was involved in the initiative. (GEDRC, 2015, para. 213)
Kaloti Jewellery International is a part of Kaloti Precious Metals. As previously
mentioned, Kaloti’s Sharjah refinery has been delisted from the DMCC for due diligence
failures in their sourcing (DMCC, 2015; McAuley, 2015). During the EY audit of Kaloti,
it was discovered by the auditors that 2.4 tons of gold were acquired by the company via
33
cash-for-gold transactions in the souk without counterparty names or gold origin being
recorded (Bowers, 2014).
Certain allegations have also been brought against the DMCC itself in the Kaloti
case. These include the DMCC telling EY that the non-compliance results should be kept
confidential (Bowers, 2014) and giving instructions on the report verbiage such as how
findings of “‘non-compliant low-risk’ are now to be termed by the auditor as ‘compliant
with low-risk deviations’ (GW, 2014, p. 8).”
As Dubai develops a reputation as a global financial and commodities center,
major issues still stand in the way. The light government management, number of free
trade zones, and anonymity of business transactions lends itself to be a potential haven
for money laundering and terrorist financing. Despite the growth of conflict-sourced
commodity regulation, complacent or complicit actors can derail the positive goals and
have far reaching consequences affecting legitimacy of international investment in
bullion, entanglement with dark hawala transactions spanning the Middle East and South
Asia, and funding armed non-state actors in Africa that prolong conflict and oppress the
citizenry.
C. SOUTH ASIA
This section brings a third region into the equation of illicit gold operations.
While illicit downstream operations are found throughout most economies, with a higher
prevalence in the developing world, high demand coupled with imperfect controls can
fuel illicit economies. The scale of business operations and ties between India and Dubai
assist in the movement of gold between nations often outside of the formal market sector.
India is not alone in the South Asian illicit market for gold but it does represent the
greatest level of demand from a population that only has 53% participation in bank
accounts of any type (World Bank, 2015c).
India is the world’s largest consumer of gold with consumption demand in 2012
at approximately 864 metric tons and fabrication demand at 942 metric tons per year
(PwC, 2013a, p. 29). For this same year, production of gold decreased by more than 10%
with estimated reserves of only 67 metric tons (U.S. Geological Survey, 2014, pp. 10.1,
34
10.14). In a nation where gold holds such strong cultural, religious, and general financial
significance (Farah, 2004, p. 111), this imbalance shows the complete reliance on
imported gold to satisfy demand.
A constant theme in Indian gold smuggling is the state’s tariffs on imports. Given
India’s high demand and the price of gold being set in U.S. dollars, both a strong U.S.
dollar and raising import tariffs result in gold becoming more expensive for the consumer
(Shumsky & Mukherji, 2015). As an effect from the rising prices, smuggling then
becomes more attractive (WGC, 2015, p. 8).
The annual quantity of gold smuggled into India is generally estimated at just
below 200 metric tons (Afonso, 2015; Sharma & Das, 2015; WGC, 2015, p. 8). Reports
of smuggling from Dubai often involve small scale movements via individual couriers on
flights. This gold is reportedly smuggled to India in the form of finished jewelry, often
concealed in body cavities, and even Indian workers in the U.A.E. are used as impromptu
couriers in exchange for airfare (Afonso, 2015; Sloan, 2014).
A reliance on imports, enormous and steady demand, and imposition of import
tariffs leads to a growing market for smuggling operations. Threats arise from the scale of
the smuggling operations, with potential conservative estimates of smuggled gold
accounting for 25% of the quantity of official imports, a developing government and
economy is losing out on a substantial stream of revenues and an environment that can
foster corruption through issue avoidance is being established. The pull from consumers
on the demand side also may pressure middlemen and refiners in Dubai to pull on the
suppliers from conflict affected regions, thus taking on additional risk to potentially fund
armed groups and prolong conflict.
D. SOUTH AMERICA
South America is home to a host of developing economies and contains three
countries that are among the top 15 gold producers: Peru, Brazil, and Argentina (PwC,
2013a, p. 13). In the context of this discussion, the effects of ASM operations are
highlighted in a discussion of illegal and informal mining operations in Peru outside the
confines of conflict sourcing.
35
Peru is a resource rich nation that in 2012 was ranked sixth in gold production and
second in silver production (KPMG, 2013, p. 2). Peru has a GDP per capita of U.S.
$11,800, but as of 2012, 25.8% of the population lived beneath the poverty level and 6%
lived in extreme poverty (CIA, 2015c; PwC, 2013b, p. 7). ASM does provide a living for
an impoverished segment of the population but it also introduces criminal elements,
grossly substandard worker conditions and exploitation, human trafficking, takes revenue
away from the state that could be used for investment purposes, and has profound
environmental impacts. A 2013 Peruvian government publication and article in El
Mercurio (as cited in Verité, 2012, p. 18) estimated that ASM directly employs 100,000
people with another five times the amount indirectly supporting the industry.
Further quantifying the scale of this illicit economy, EY estimated that illegal
mining constitutes 20% of Peruvian gold production (EY, 2014, p. 36). In response to this
growing threat, the government under President Ollanta Humala took a carrot-and-stick
approach to illegal ASM operations by offering a deadline of April, 2014 for these
operations to begin the process of becoming legal and in the interstitial time period before
they are formalized, to continue operations (Dube & Kozak, 2014; EY, 2014, p. 37;
Jamasmie, 2014). Despite these measures, informal operations continue to occur in the
Peruvian Andes and the low-lying Amazon basin in the environmentally sensitive and
protected region of Madre de Dios.
In 2013, PwC stated, “six mining companies and the small producers of the region
of Madre de Dios concentrate 62% of [gold] production (PwC, 2013b, p. 16).” While not
discussing the total implications of this statement, most of the problems lie with the
“small producers” mentioned. The Peruvian government defines the legality of operations
by their concession permits, registration, environmental impact surveys, consultation with
the indigenous to ascertain the social impacts, and labor practices (EY, 2014, pp. 35–37;
KPMG, 2013, pp. 9–11; PwC, 2013b, pp. 34–37; Verité, 2012, p. 17). In practice, illegal
mining operations occur throughout Madre de Dios without attempts at formalization.
In Madre de Dios, forests are clear cut of vegetation and then the ground is
blasted with water so the resulting silt can then be exploited through filtration and
mercury amalgamation. This process destroys jungle habitats, puts high levels of
36
sediment into the rivers where all life dies, and pollutes the groundwater and downstream
areas with mercury (Elbein, 2015; Verité, 2012, pp. 24–25). The worst effects of the
illegal operations come from the indirect operations needed to support this illicit
economy. Debt bondage (known locally as habilitación-enganche), human trafficking for
labor, support, and sexual services, child labor, laundering, smuggling, and payment
through cachorreo (as discussed in the example of ASM in La Rinconada) all occur
(Finnegan, 2015; Verité, 2012, pp. 21–27, 63).
Integration of illicitly mined gold occurs through sales to larger refineries, cash-
for-gold shops, and smuggling to Bolivia for export (Finnegan, 2015; Verité, 2012, pp.
25–27, 48–50, 54, 63, 74–76). As a result, tax revenue from corporate income tax,
mineral taxes, value added taxes, royalties, and concession rights are all lost (KPMG,
2013, p. 11; PwC, 2013b, p. 37). El Mercurio (as cited by Verité, 2012, p. 25) reported
that Peru has lost tax revenue of U.S. $450 million each year because of illegal
operations. This loss only quantifies the potential tax revenue; the benefits to formalized
mining operations could also stop the illicit support economy thereby increasing tax
revenue from these businesses, increase worker and environmental safety, and lessen the
market for human trafficking.
E. SUMMARY
Illicit economies can develop around all operations leading to human rights
abuses, financing of conflict, depriving the state of much needed tax revenues, and
producing a vehicle for money to be laundered, transferred, and obscured. As this illicit
market is transnational in nature, policy needs to be formulated that addresses external
vulnerabilities in addition to the internal. This next chapter presents the policy
environment of select states, IGOs, and industry groups aimed at stopping this illicit
economy from a macro perspective.
37
IV. POLICY AND REGULATION
This chapter details select policy and legislation of IGOs and states as they relate
to precious metals, and more specifically, gold. While similar to a literature review on
policy, this chapter bridges the broad operational chain dynamics and specific regional
cases of illicit finance related to gold and addresses relevant policy to address these major
issues. Individual state responses are important to stymie these illicit flows, but as a
majority transnational issue, IGO recommendations assessing regional risks and
attempting to create standardization is essential.
A. IGOS
This section details gold-related CTF policy and recommendations created by the
U.N., OECD, and the FATF. The U.N. is selected because of the global scope of its
membership, positive action that may be taken through peace operations and sanctioning,
a broad range of published materials related to international stability, and the
international forum created for member states. The OECD is selected because of its work
in producing tailored policy recommendations aimed at economic development. While
AML/CFT is not a primary purpose of the OECD, the gold supplement of their due
diligence guidance (OECD, 2013) is the basis for LBMA and DMCC sourcing policies
and the WGC’s conflict-free gold standard (WGC, 2012). Much of the OECD’s work on
countering corruption, bribery, and corporate misconduct also has relevance to CTF
efforts as it pressures the market makers of illicit economies. The FATF is the final
organization selected because of its central-founding purpose of AML/CFT and its
keystone work on promulgating recommendations that are the international standard for
financial sector integrity.
1. U.N.
The United Nations Environment Programme ([UNEP], 2009, p. 5) states that
40% of conflict globally in the last 60 years has at least in part been fueled by resource
access. While only a minority of these conflicts are attributable to gold, this resource’s
ability to fund and sustain conflict, negatively impact the environment, and create large
38
illicit economies further destabilizing impoverished regions requires a summation of the
individual impacts to be able to assess its net effects.
One of the major impacts of illicit economies surrounding gold relates to human
rights abuses. The Office of the High Commissioner for Human Rights ([OHCHR], 2011)
describes the idealized responsibilities that industries have in ensuring protections to their
workers and the responsibilities that governments have in providing oversight, ensuring
compliance, and establishing an environment where worker rights can be enforced. The
significance of worker protections in CTF comes from the attempt to deny the growth of
illicit economies instead of merely the predicate effects of funding conflict and nefarious
activities. Like other IGO products, this document is not enforceable in international law
but does create a foundation upon which policy and legislation can be based.
The U.N. also maintains the capability to sanction individuals, groups, or states
under the U.N. Charter (1945, Chapter VII). Exercising this capability, the U.N. has
sanctioned ex-Séléka and anti-balaka individuals in the CAR under U.N. resolution 2127
(Security Council Committee concerning the CAR, 2015) and armed Congolese actors in
the DRC under U.N. resolution 1533 (Security Council Committee concerning the DRC,
2015) which were highlighted in Chapter III of this thesis. The freezing of assets and
bearing down on sanctioned entities’ means of support and continuance can be effective
in denying formal sector access and providing a deterrence for non-sanctioned entities
considering doing business with them, but it does not necessarily starve the illicit
economies.
U.N. peace operations can also affect illicit financing. The United Nations
Organization Stabilization Mission in the Democratic Republic of the Congo’s
(MONUSCO) U.N. mandate contains directed efforts to put mining activities in the
eastern DRC under government control (Security Council, 2014). The rebuilding of
government and economic institutions during and after conflict may be difficult because
of power dynamics, persistent instability, and systemic corruption, but providing
oversight of mining and export activities and the groups and workers engaged in these
does produce a net benefit if rule of law can be attained.
39
2. OECD
The OECD (2011) published their Guidelines for Multinational Enterprises,
which is in line with the work of the OHCHR and UNEP referenced in the previous
section. Significantly, these guidelines address corporate roles in relation to human rights,
the environment, bribery, and taxation (OECD, 2011). The economic effects of tax
revenue deprivation on governments can be particularly devastating in the developing
world as it expands the cycle of poverty in already dispossessed populations by denying
them government services. The OECD views tax compliance as an essential portion of
“corporate citizenship” (OECD, 2011, p. 60) and this can be related to the operational
chain of gold from source to market as informal ASM operations, obscured exports and
imports, and refiners integrating illicitly sourced gold all stunt the additional benefits
from taxation.
The OECD’s gold supplement in their Due Diligence Guidance (OECD, 2013, pp.
61-113) is the basis for industry action by the WGC (2012), LBMA (2013), and DMCC
(2012). This guidance provides a five-step framework which accents the requirements for
committed management, a risk-based approach to supply chain management, operations
to mitigate these risks, independent audits, and transparency in corporate reporting
(OECD, 2013, pp. 72-113). While not legally binding, the adoption of this guidance by
industry has provided it with its effectiveness.
3. FATF
The FATF Recommendations is the seminal work on AML/CFT regulation and
policy. Rooted in anti-laundering mechanisms for drug money in the early 1990s, the
Recommendations have evolved with the global environment and have expanded to over
180 signatories across the FATF and eight FSRBs (FATF, 2012, p. 7). The aggregate
FATF network is structured as the premier forum for AML/CFT and its promotion is
stressed by the United States as an implement to global economic security (White House,
2015, p. 15).
Recommendations 1, 22, 23, 28, 32, and 34 have been highlighted by the IMF as
having direct relevance to the precious metals and stones markets (IMF, 2012, pp. 27–
40
28). The first recommendation, implementing a risk based approach (RBA) (FATF, 2012,
p. 11), is further developed in the FATF’s (2008) RBA Guidance for Dealers in Precious
Metal and Stones and may be the most substantive recommendation with applicability to
precious metals dealers. The RBA guidance was written prior to the latest publication of
The FATF Recommendations, which creates asymmetry in the recommendation
numbering; but the intent, and especially the RBA intent on country and geographic risks
(FATF, 2008, pp. 20–22) gives the most holistic AML/CFT appraisal of illicitly sourced,
exported, and laundered gold. Recommendations 22 and 23 both discuss designated non-
financial bodies and profession’s (DNFBP) responsibilities in conducting due diligence
and alerting in suspicious transactions (FATF, 2012, pp. 19–20), recommendation 28
highlights the creation of DNFBP regulatory bodies such as the DMCC or LBMA
(FATF, 2012, p. 23), recommendation 32 discusses cash couriers which is often seen in
cash-for-gold and illicit sales (FATF, 2012, p. 25), and recommendation 36 discusses
feedback on the efficacy of solutions and the scope of money laundering and illicit
financing issues (FATF, 2012, p. 26).
B. STATE-LEVEL
This section gives an overview of regulation and legislation in the United States,
U.A.E., and Peru. The rationale for using these three countries relates to their respective
impacts on gold supply and demand, the variance in risks faced and government
capability in enforcement, and approaches to combating the respective illicit economies.
These examples are narrowly focused on gold-based AML/CFT unless immediate
application of strengthening legislation in an adjacent AML/CFT category is necessary;
though it must be remembered that illicit gold transactions do not exist in a vacuum and
other forms of illicit finance are generally incorporated.
1. United States
The United States has an extensive system of AML/CFT legislation and
transparency of financial operations is regulated through laws such as the Bank Secrecy
Act of 1970, Money Laundering Control Act of 1986, Title III of the Uniting and
Strengthening America by Providing Appropriate Tools Required to Intercept and
41
Obstruct Terrorism Act of 2001 (USA PATRIOT Act) and a multitude of Executive
Orders and Federal Statutes which allow the interagency to collect intelligence, track
illicit finance, and prosecute primary and predicate offenses. Further, the FATF (2006, p.
4) has pointed out an increase in compliance since the USA PATRIOT Act. Following
the third round of mutual evaluations by the FATF, section 1502 of the Dodd-Frank Wall
Street Reform and Consumer Protection Act of 2010 also provided legislation on the
sourcing of materials from conflict-affected regions.
The last mutual evaluation by the FATF (2006, p. 12) estimated “approximately
20,000 dealers in precious metals” servicing a portion of the industry which by 2012 had
expanded to an industry satisfying a nationwide consumption demand of 162 metric tons
and a fabrication demand of 147 metric tons (PwC, 2013a, p. 29). The FATF (2006, p.
200) noted the legislated requirements to establish anti-money laundering programs by
precious metals dealers but gave ratings of “non-compliant” based on the lack of
requirements for DNFBP record keeping (FATF, 2006, p. 205) and suspicious activity
report (SAR) submission (FATF, 2006, p. 210).
Currently, gold dealers are subject to the regulations enforced by the Financial
Crimes Enforcement Network (FinCEN) (FinCEN, Department of the Treasury, 2015)
and specifically parts 1010 and 1027. Part 1010 gives general provisions and the
requirements for anti-money laundering programs, SARs, currency transaction reports
(CTR), due diligence, and record keeping requirements (General provisions, 2015). Part
1027 specifically provides regulation for gold dealers and to qualify as a precious metals
dealer in the United States, annual purchases and receipts must exceed $50,000 of 50%
purity alloy of precious metals as defined in part 1027.100 (Rules for dealers in precious
metals, precious stones, or jewels, 2015). Together, these parts generally affect reporting
requirements to the intersection of fiat currency purchases of a commodity.
2. United Arab Emirates
As a federation of seven emirates, control varies on different issues between the
federal government level and the individual emirate level (CIA, 2015d, Government
section). The Central Bank of the U.A.E., a federal organ, was founded by Union Law
42
No. (10) of 1980 Concerning the Central Bank, the Monetary System and Organization of
Banking (1980) and oversees the Anti-Money Laundering and Suspicious Cases Unit, the
Emirate’s FIU, that was established by article 7 of Federal Law No. (4) of 2002
Regarding Criminalization of Money Laundering.
The last FATF mutual evaluation of the U.A.E., conducted in 2008, cited certain
issues with respect to gold. In this report, prevalence of sales and purchase of gold
followed by transshipment of gold or large quantities of cash was considered “not
uncommon” and declaration on export was considered a customs duty concern and not an
AML/CFT concern (Middle East and North Africa Financial Action Task Force
[MENAFATF], FATF, & IMF, 2008, p. 54) and record keeping was not conducted for
AML/CFT purposes (MENAFATF et al., 2008, p. 118). The requirement for third party
audits (DMCC, 2012) by the DMCC since this mutual evaluation does enforce
transparency and adequate record keeping but cash-for-gold operations still remain a
potential issue for the integration of illicit gold.
The intersection of hawala and gold may also open the door for laundering.
Hawaladars are prevalent in the souk (Cassara & Jorisch, 2010; O’Brien, 2003) and
efforts have been made since 2003 to regulate these businesses (Central Bank of the
United Arab Emirates, 2003). Hawala licensing through the Central Bank requires a no-
charge application for the hawaladar with information on their occupation and a
standardized ledger of remittances (Central Bank of the United Arab Emirates, 2003,
slides 5, 8, 12 & 14). However, the method expected to be used in settling accounts is
notably absent from the registration form and record keeping (Central Bank of the United
Arab Emirates, 2003, slides 8, 12 & 14) while opportunity is still provided for the transfer
of value through settlement imbalance.
3. Peru
An excellent primer to AML/CFT policy in Peru is the National Plan for Fighting
Money Laundering and Terrorist Financing (Superintendent of Banking, Insurance, and
Private Pension Funds [SBS], 2011). This plan was enacted by Supreme Decree No. 057-
2011-PCM. The National Plan addresses the transnational effects of money laundering
43
and threat finance, provides overarching purpose for an AML/CFT plan, assesses risks
and vulnerabilities, provides a way ahead for AML/CFT measures, and identifies the
governmental stakeholders (SBS, 2011, pp. 9, 12, 19,27, and Annex). With a large cross
over to gold-based threat finance, the National Plan identifies the risk associated with
informal businesses in the Peruvian economy and the delicate formalization process that
must occur to fully implement AML/CFT measures (SBS, 2011, p. 21).
The Financial Action Task Force on Money Laundering in South America
(GAFISUD; later renamed GAFILAT), published a 2011 risk assessment of DNFBPs in
GAFISUD. The risk level for money laundering and threat finance was assigned a four
out of five for DNFBPs (GAFISUD, 2011, p. 16), citing low registration rates across
South America (GAFISUD, 2011, p. 9), low supervision in this sector, and the anonymity
that allows for manipulation of exports and smuggling (GAFISUD, 2011, p. 18).
However, mere regulation of DNFBPs in downstream operations does not address the
thriving illicit economy of the informal ASM sector discussed in Chapter III.
The Peruvian government (as cited by Valencia, 2013) has attempted to formalize
ASM operations, especially in the Madre de Dios region, through Law 27651 in 2002, the
National Plan for the Formalization of Artisanal Mining in 2011, and legislative Act
1100. Throughout this, efforts have been made to encourage ASM miners to file
declarations of intent, mineral concession rights, authorizations for land usage,
authorization for water usage, and submit environmental plans, especially throughout
2013 (Ministerio de Energía y Minas, 2013). However, Peru still faces a high level of
difficulty in formalization because of the large profits, remote locations (Verité, 2012),
and generally informal nature of the economy (SBS, 2011, p. 21) where the illicit mining
economy provides one of the only ways to earn money.
C. SUMMARY
The unique factors in many countries place an emphasis on tailored risk-based
strategies and initiatives to counter illicit finance and the economies that are grown out of
them. Dependent on government legislation and capability, risk borne out of the specific
economy, and intersections with other money laundering and threat finance typologies
44
within a state, the results of an individual risk-based approach must be thorough, tailored,
and acknowledge the transnational nature of threat finance.
45
V. SOCIAL NETWORK ANALYSIS OF THE AGGREGATE FATF/FSRB NETWORK
This chapter explores the network structure of the FATF/FSRBs at the state and
jurisdiction level (both referred to as actors for standardization and proper
methodological terminology) and its potential effects on policy targeting and
identification of at-risk states and jurisdictions. Furthermore, insight into network
structures will be addressed and strategies for enhancing network resilience and policy
targeting will be discussed.
The FATF itself is structured around 34 nations, the GCC, the European
Commission, one state observer, and an exhaustive list of IGOs and agencies (“FATF
members and observers,” n.d.). In association with the FATF are eight additional FSRBs
that address common issues related to the exploitation of the financial sector for nefarious
purposes and the potentially destabilizing effects economically, financially, and
physically.
IGOs are effective in the common forum created, and they enable the construction
of conduits for information to pass and ties between actors to form. As illustrated by the
nature of the FATF/FSRB networks, recommendations can be made, but there is no
mechanism of enforcement other than on the individual member level. The network does
reinforce norms, values, and procedures but cannot entirely shoulder the burden.
A. METHODOLOGY AND ATTRIBUTE DATA
Chapter I presents an overview of the methodology for this chapter and the
sources used for the compiled dataset. This section gives further definition to the
methodology by explaining the network boundaries, the logic behind the valuation of ties,
a discussion of the difference between ties and conduits, and purpose for inclusion of
GDP data in the compiled dataset. The compiled dataset and an in-depth discussion of its
sources are presented in the Appendix.
46
1. Network Boundaries
This chapter presents individual networks and the aggregate network formed from
actors’ membership in multiple FSRBs and the FATF. The value of the aggregate
network lies in its broad scope to capture the international AML/CFT policy network.
Individual networks include all actors with varying degrees of membership status but
non-members are also included to enable direct comparison between individual networks.
Sub-state actors or jurisdictions are also included in the individual networks and
the aggregate (e.g., Aruba, Curaçao, Macao, and Hong Kong). Not only do they often
have membership in FATF/FSRB networks (see Appendix), but economic latitude
inherent in their statuses as either special administrative regions (e.g., Hong Kong) or
subordinate parts of a larger entity (e.g., Aruba as a part of the Kingdom of the
Netherlands) are important to include.
Isolates are actors with no ties to other actors. In the aggregate network, 11
isolates are included as shown in Table 1. These actors are important to include in the
analysis because their absence from network membership may indicate a higher risk of
criminal and terrorist financing, unwillingness to cooperate with international norms, or
general inability of governance. Isolates may be excluded from some sociograms for ease
of visualization but their presence is still included in calculating various metrics.
Table 1. Isolate States and Jurisdictions
Cameroon CAR Chad DRC Rep. of Congo Djibouti Equatorial Guinea Eritrea Gabon Islamic Rep. of Iran Kosovo
List of isolate states and jurisdictions that are not members of the FATF or any FSRB. See Appendix for sources.
2. Valuation of Ties
Ties between actors within each individual network and the aggregate network are
coded based on four categories with the value of the tie strength shown in parentheses: no
status/no tie (zero), other (one), observer (two), and member (three). All ties coded are
undirected, meaning that if an actor has some degree of affiliation within a network, the
47
tie strength between that actor and all other network members is equal regardless of that
actor’s contribution to the network.
A counterargument exists to this method of valuing ties in that it is an
oversimplified approach. Giving all ties a strength between one and three and an
undirected nature may minimize the nuances of membership. The simplified allocation of
strength values implies that a full member state has one and a half times the contribution
of an observer and three times the contribution of an actor with ‘other’ status. This may
not adequately reflect the importance of contributions from members’ signatory
abilities—possibly undervaluing membership, or possible nominal membership status
where a tie value may be overvalued (e.g., the DPRK’s observer status since 2014
[“Democratic Peoples’ Republic of Korea,” n.d.] in the Asia/Pacific Group on Money
Laundering (APG) gives ties to other APG members including the Republic of Korea and
the United States). This problem is also present in the undirected nature of the ties
because it insinuates that all members’ contributions are equal regardless of capability
(e.g., Yemen and Saudi Arabia both have full membership in the Middle East and North
Africa Financial Action Task Force [MENAFATF] [“About MENAFATF: Members and
observers,” n.d.] meaning there is an equal tie strength and therefore equal capability and
cooperation between Yemen and Saudi Arabia).
The tie strength being put in four categories means that it is ordinal data instead of
continuous. To accurately reflect the contributions and nuances of intra-network relations
would require quantifying an individual subjective assessment of all 201 actors that have
some degree of network membership. Not only is this difficult to capture and contains its
own inherent risks, but international relations outside the bounds of the AML/CFT
network precludes the ability for a temporal snapshot to maintain protracted relevancy
(e.g., the Arab Spring’s effects on intra-network relations between actors in
MENAFATF). To simplify the analysis of FATF/FSRB network resilience and policy
targeting, simplified and undirected ties are adequate to map the network.
48
3. Ties versus Conduits
The nature of the relationship networks documented in this chapter captures the
interrelations on an actor-by-actor basis. All nine networks also contain some degree of
outside IGO membership (e.g., the OECD’s status in the FATF [“FATF members and
observers,” n.d.] or the FATF’s observer status in MENAFATF [“About MENAFTF:
Members and observers,” n.d.]). These IGO networks would provide a more robust
general nature to the network but their membership generally reflects a conduit whether
real, potential, or nominal, rather than a relation that is realized by a tie.
An example of a conduit versus a tie is the Egmont Group, an IGO based on
cooperation between FIUs (http://www.egmontgroup.org). While ties may exist within
this network such as between the United States’ FinCEN and the United Kingdom’s
National Crime Agency resulting in tangible cooperation, other relations could best be
described as nominal, such as Lebanon’s Special Investigation Commission Fighting
Money Laundering and Israel’s Money Laundering Prohibition Authority (“List of
members,” n.d.). For this reason, the Egmont Group is not included in assuming actor-by-
actor AML/CFT ties. Similar logic is used in the exclusion of the U.N.’s observer status
in FATF/FSRB networks (“FATF members and observers,” n.d.) and individual FSRB
observer status in other FSRBs. This means that conduits are excluded from the network
because they only could be used to identify a potential for information transfer and do not
necessarily contain the resiliency of a tie. The sole exceptions are Kuwait, Bahrain, Saudi
Arabia, Qatar, United Arab Emirates, and Oman membership in the FATF represented by
the Gulf Cooperation Council (GCC) and Dutch Caribbean states’ memberships in the
FATF under the auspices of the Kingdom of the Netherlands (“FATF members and
observers,” n.d.).
Defining the nature of ties while excluding conduits also has the added benefit of
viewing the AML/CFT policy world through the lens of national self-determination.
Membership in the U.N. is practically universal with 193 states in the U.N. General
Assembly (“Member states of the United Nations,” n.d.) and relations ranging from
nominal conduits to robust ties. Individual issues faced regionally, religiously, ethnically,
historically, or culturally are often reflected in membership (e.g., the Arabic speaking
49
world’s prominence in MENAFATF [“About MENAFATF: Members and observers,”
n.d.] or the former Soviet bloc and Central Asian membership in the Eurasian Group on
Combating Money Laundering and Financing of Terrorism [EAG] [“Eurasian Group on
Combating Money Laundering and Financing of Terrorism,” n.d.]) and may actually add
resiliency in ties and network strength because of this self-determination.
4. Attributes
The compiled dataset includes the GDP for 211 states/entities derived from the
World Bank and the CIA’s The World Factbook. In this chapter GDP data is mainly used
for the purpose of visualizing node’s (actor’s) size based on continuous GDP data. This
same data could be further used to show correlation between economic size and other
attributes such as degree centrality (number of ties to other actors). GDP data sources are
further described in the Appendix.
B. NETWORKS AND THE AGGREGATE
This section introduces the individual FATF/FSRB networks through sociograms
(network maps), select metrics, and a brief network description. While the individual
visualizations exclude all isolates (any actor that has no level of network membership),
isolate presence is still included in descriptive metrics to enable ease of comparison
between networks. The benefit to a consistent 212 actor network size is reflected in
the measure of network density, which is calculated by the number of ties in a network
divided by the number of potential ties (Everton, 2012, p. 399). The output is on a scale
of zero (sparse/cosmopolitan) to one (dense/provincial) and can only be used to compare
equally sized networks. With increasing actor membership, potential ties reflected in the
denominator increases exponentially while an actor can realistically only maintain a
limited number of ties (Everton, 2012, p. 399), effectively causing larger networks to be
naturally more cosmopolitan. An alternative method for measuring network density is
average degree centrality (sum of all ties in a network divided by number of actors)
(Everton, 2012, p. 397), but by consistently maintaining a 212 actor network other
benefits are realized such as the decrease in format errors in SNA programs when
visualizing the aggregate network.
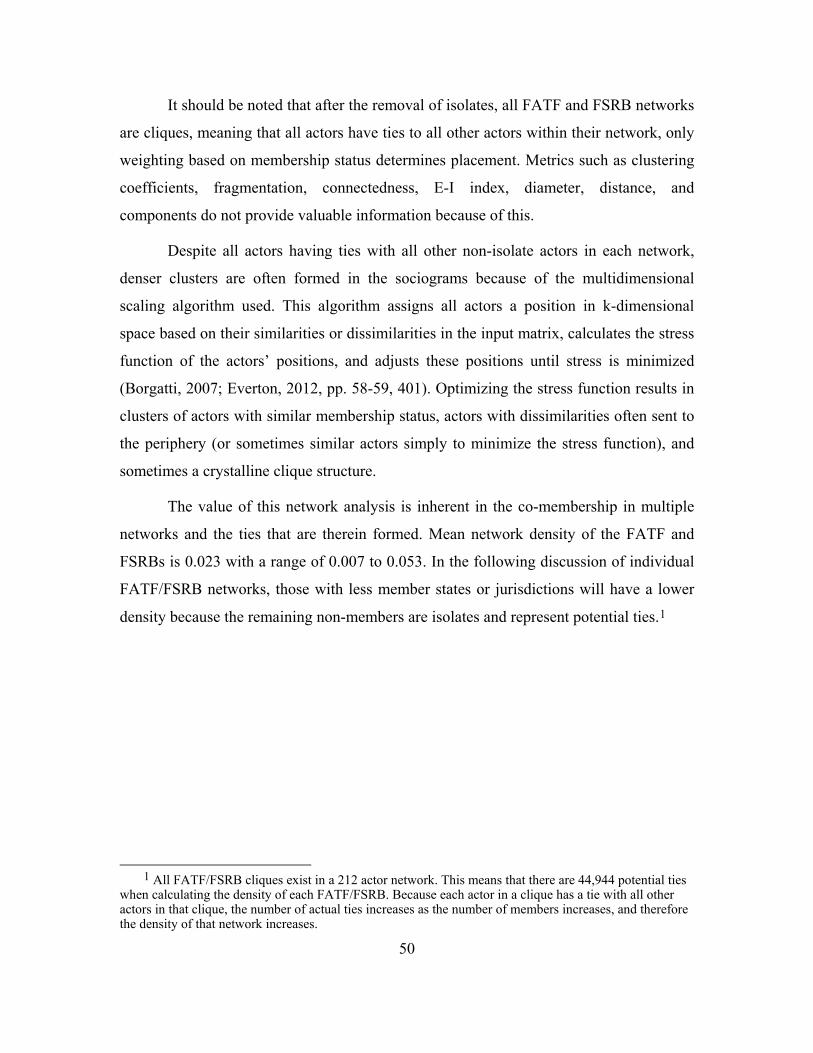
50
It should be noted that after the removal of isolates, all FATF and FSRB networks
are cliques, meaning that all actors have ties to all other actors within their network, only
weighting based on membership status determines placement. Metrics such as clustering
coefficients, fragmentation, connectedness, E-I index, diameter, distance, and
components do not provide valuable information because of this.
Despite all actors having ties with all other non-isolate actors in each network,
denser clusters are often formed in the sociograms because of the multidimensional
scaling algorithm used. This algorithm assigns all actors a position in k-dimensional
space based on their similarities or dissimilarities in the input matrix, calculates the stress
function of the actors’ positions, and adjusts these positions until stress is minimized
(Borgatti, 2007; Everton, 2012, pp. 58-59, 401). Optimizing the stress function results in
clusters of actors with similar membership status, actors with dissimilarities often sent to
the periphery (or sometimes similar actors simply to minimize the stress function), and
sometimes a crystalline clique structure.
The value of this network analysis is inherent in the co-membership in multiple
networks and the ties that are therein formed. Mean network density of the FATF and
FSRBs is 0.023 with a range of 0.007 to 0.053. In the following discussion of individual
FATF/FSRB networks, those with less member states or jurisdictions will have a lower
density because the remaining non-members are isolates and represent potential ties.1
1 All FATF/FSRB cliques exist in a 212 actor network. This means that there are 44,944 potential ties
when calculating the density of each FATF/FSRB. Because each actor in a clique has a tie with all other actors in that clique, the number of actual ties increases as the number of members increases, and therefore the density of that network increases.
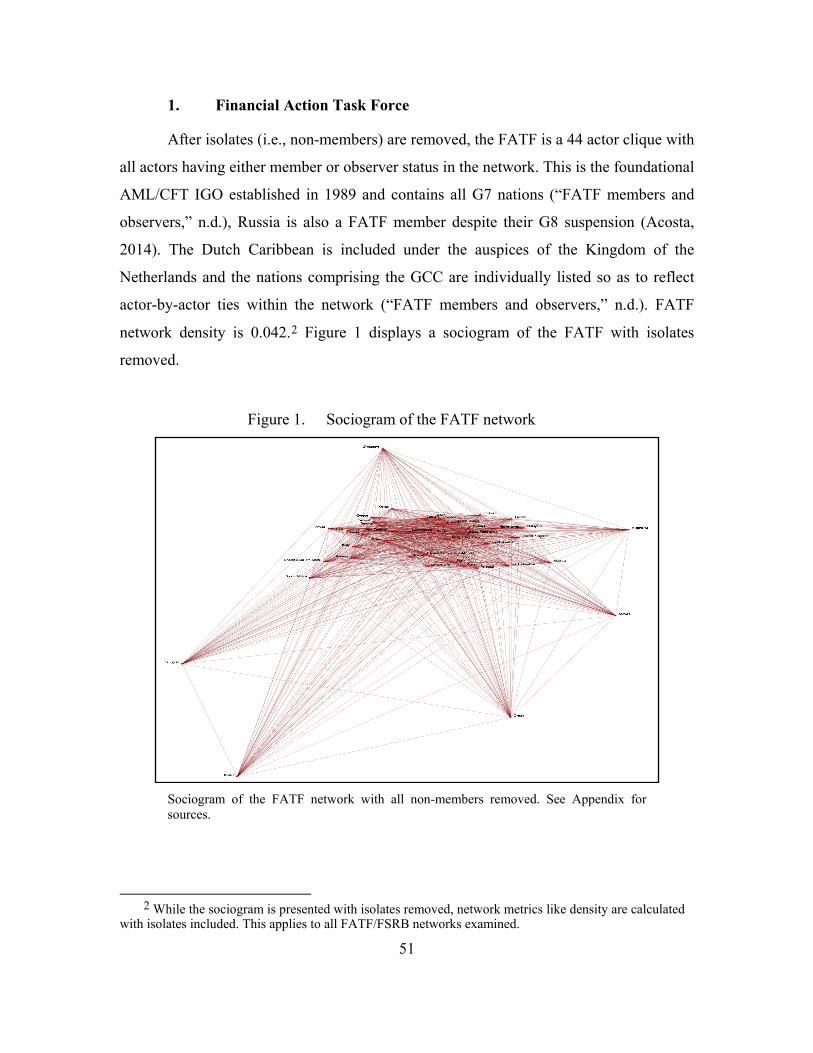
51
1. Financial Action Task Force
After isolates (i.e., non-members) are removed, the FATF is a 44 actor clique with
all actors having either member or observer status in the network. This is the foundational
AML/CFT IGO established in 1989 and contains all G7 nations (“FATF members and
observers,” n.d.), Russia is also a FATF member despite their G8 suspension (Acosta,
2014). The Dutch Caribbean is included under the auspices of the Kingdom of the
Netherlands and the nations comprising the GCC are individually listed so as to reflect
actor-by-actor ties within the network (“FATF members and observers,” n.d.). FATF
network density is 0.042.2 Figure 1 displays a sociogram of the FATF with isolates
removed.
Figure 1. Sociogram of the FATF network
Sociogram of the FATF network with all non-members removed. See Appendix for sources.
2 While the sociogram is presented with isolates removed, network metrics like density are calculated
with isolates included. This applies to all FATF/FSRB networks examined.
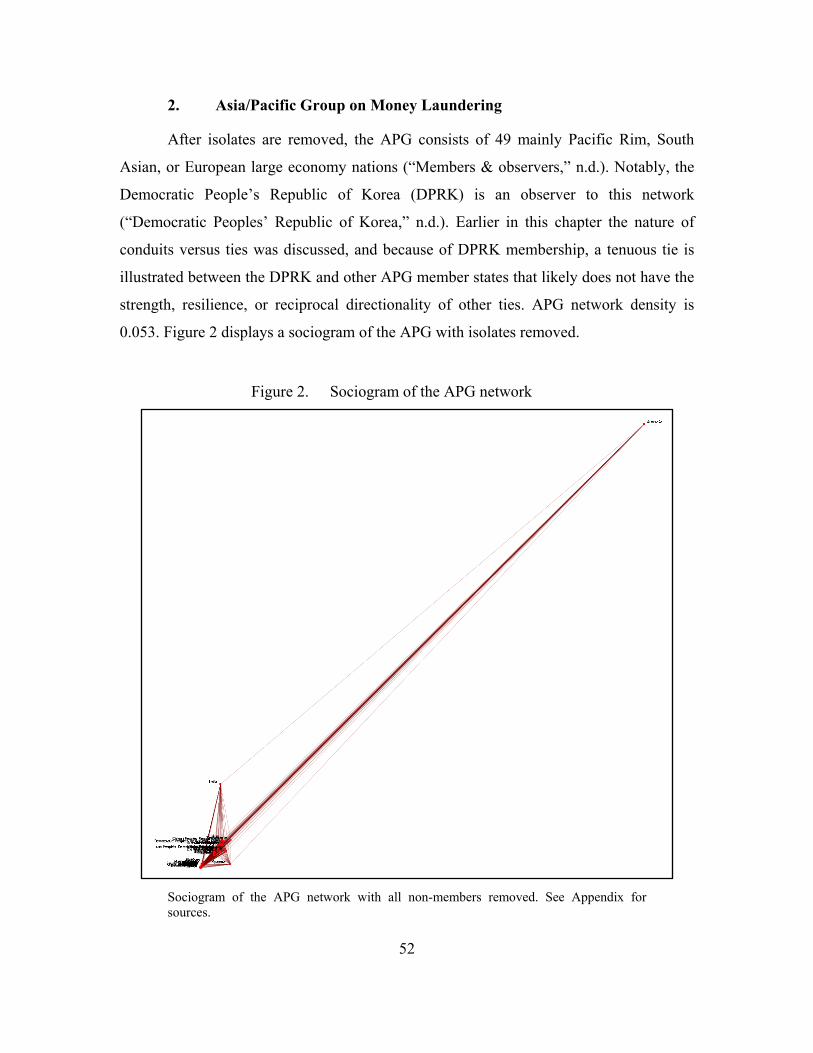
52
2. Asia/Pacific Group on Money Laundering
After isolates are removed, the APG consists of 49 mainly Pacific Rim, South
Asian, or European large economy nations (“Members & observers,” n.d.). Notably, the
Democratic People’s Republic of Korea (DPRK) is an observer to this network
(“Democratic Peoples’ Republic of Korea,” n.d.). Earlier in this chapter the nature of
conduits versus ties was discussed, and because of DPRK membership, a tenuous tie is
illustrated between the DPRK and other APG member states that likely does not have the
strength, resilience, or reciprocal directionality of other ties. APG network density is
0.053. Figure 2 displays a sociogram of the APG with isolates removed.
Figure 2. Sociogram of the APG network
Sociogram of the APG network with all non-members removed. See Appendix for sources.
53
3. Caribbean Financial Action Task Force
After isolates are removed, the Caribbean Financial Action Task Force (CFATF)
consists of 35 nations or sub-state entities mainly in the Caribbean and Americas
(“Member countries,” n.d.). Because of the presence of European possessions in the
Caribbean, many actors also have ties to the FATF and Committee of Experts on the
Evaluation of Anti-Money Laundering Measures and the Financing of Terrorism
(MONEYVAL) networks (e.g., Curaçao is an actor in this network and a possession of
the Kingdom of the Netherlands, therefore sharing membership in these other two
networks [“FATF members and observers,” n.d.; “Council of Europe,” n.d.]). CFATF
network density is 0.027. Figure 3 is a sociogram of the CFATF with isolates removed.
Figure 3. Sociogram of the CFATF network
Sociogram of the CFATF network with all non-members removed. See Appendix for sources.
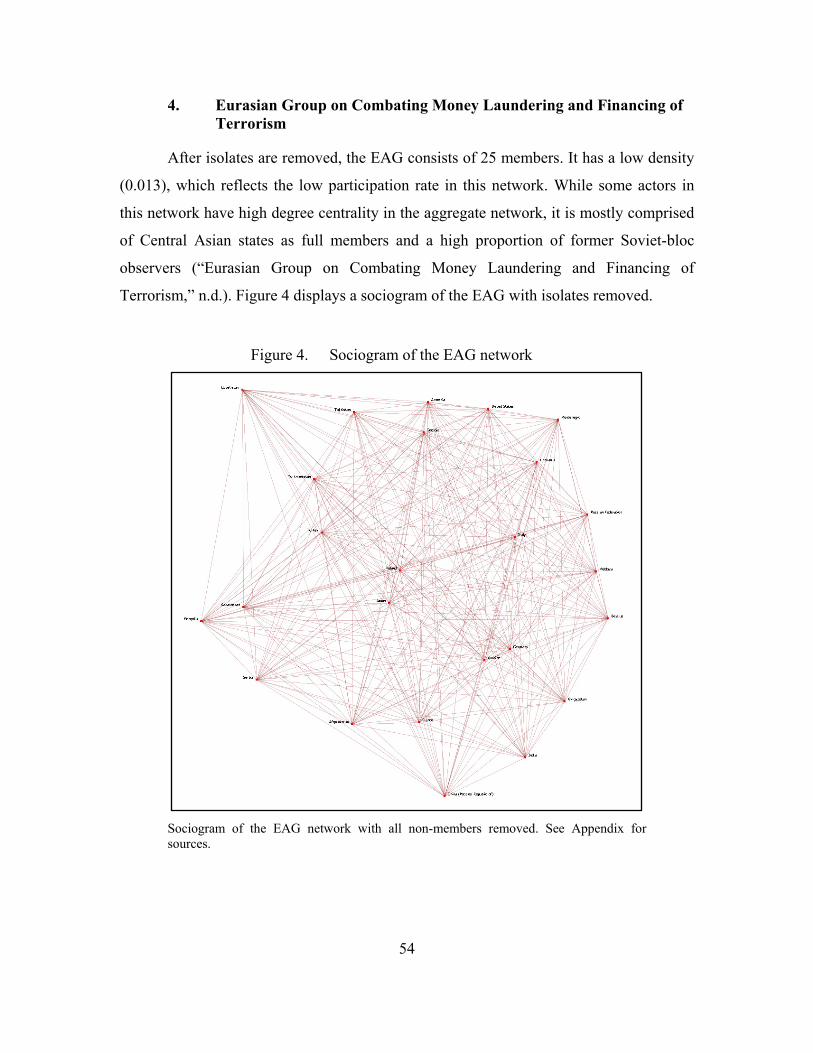
54
4. Eurasian Group on Combating Money Laundering and Financing of Terrorism
After isolates are removed, the EAG consists of 25 members. It has a low density
(0.013), which reflects the low participation rate in this network. While some actors in
this network have high degree centrality in the aggregate network, it is mostly comprised
of Central Asian states as full members and a high proportion of former Soviet-bloc
observers (“Eurasian Group on Combating Money Laundering and Financing of
Terrorism,” n.d.). Figure 4 displays a sociogram of the EAG with isolates removed.
Figure 4. Sociogram of the EAG network
Sociogram of the EAG network with all non-members removed. See Appendix for sources.
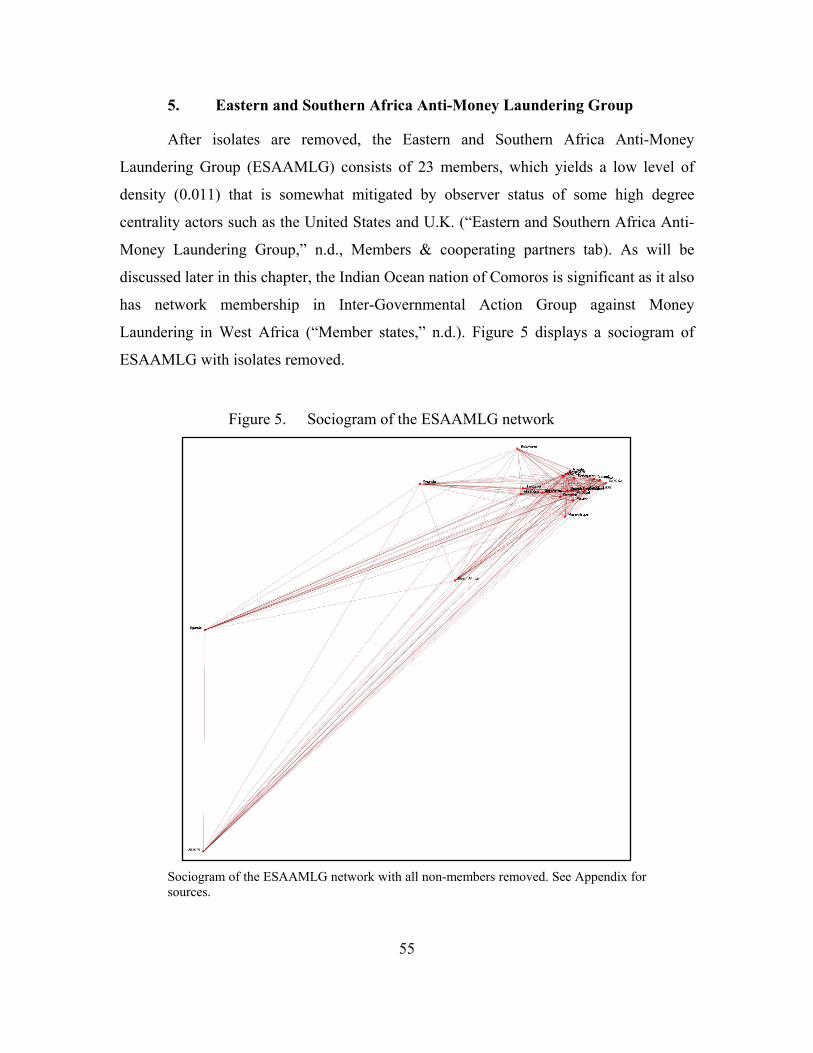
55
5. Eastern and Southern Africa Anti-Money Laundering Group
After isolates are removed, the Eastern and Southern Africa Anti-Money
Laundering Group (ESAAMLG) consists of 23 members, which yields a low level of
density (0.011) that is somewhat mitigated by observer status of some high degree
centrality actors such as the United States and U.K. (“Eastern and Southern Africa Anti-
Money Laundering Group,” n.d., Members & cooperating partners tab). As will be
discussed later in this chapter, the Indian Ocean nation of Comoros is significant as it also
has network membership in Inter-Governmental Action Group against Money
Laundering in West Africa (“Member states,” n.d.). Figure 5 displays a sociogram of
ESAAMLG with isolates removed.
Figure 5. Sociogram of the ESAAMLG network
Sociogram of the ESAAMLG network with all non-members removed. See Appendix for sources.
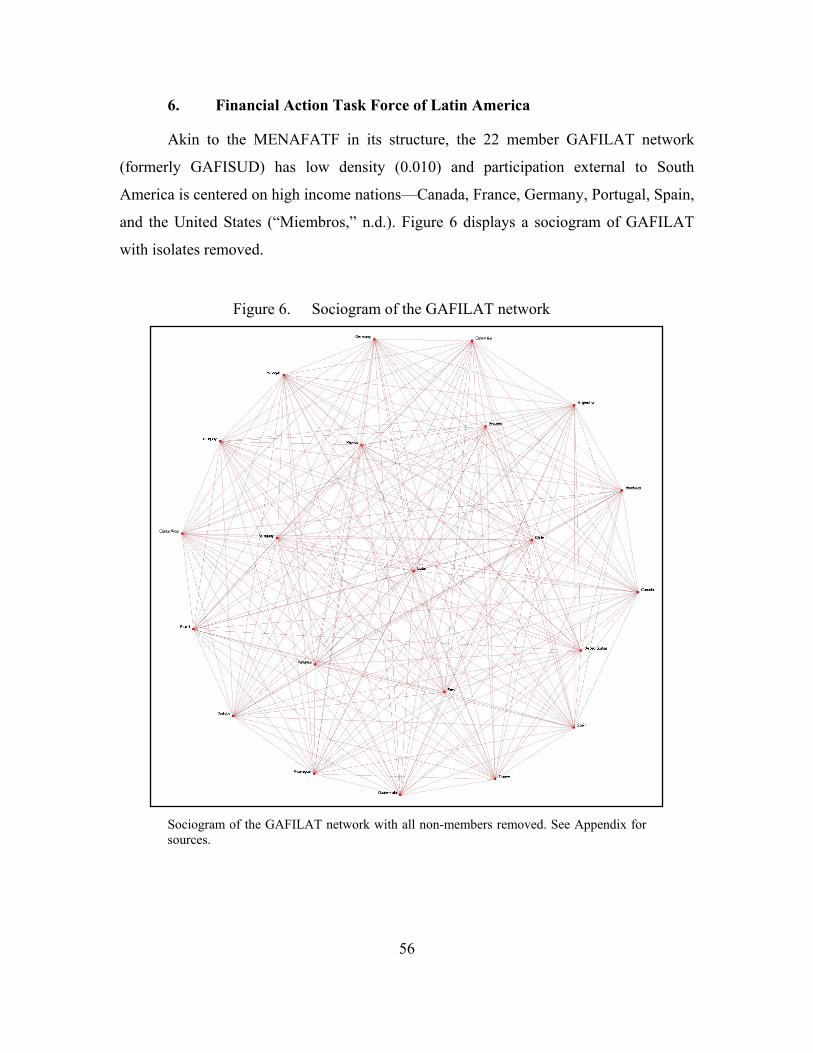
56
6. Financial Action Task Force of Latin America
Akin to the MENAFATF in its structure, the 22 member GAFILAT network
(formerly GAFISUD) has low density (0.010) and participation external to South
America is centered on high income nations—Canada, France, Germany, Portugal, Spain,
and the United States (“Miembros,” n.d.). Figure 6 displays a sociogram of GAFILAT
with isolates removed.
Figure 6. Sociogram of the GAFILAT network
Sociogram of the GAFILAT network with all non-members removed. See Appendix for sources.
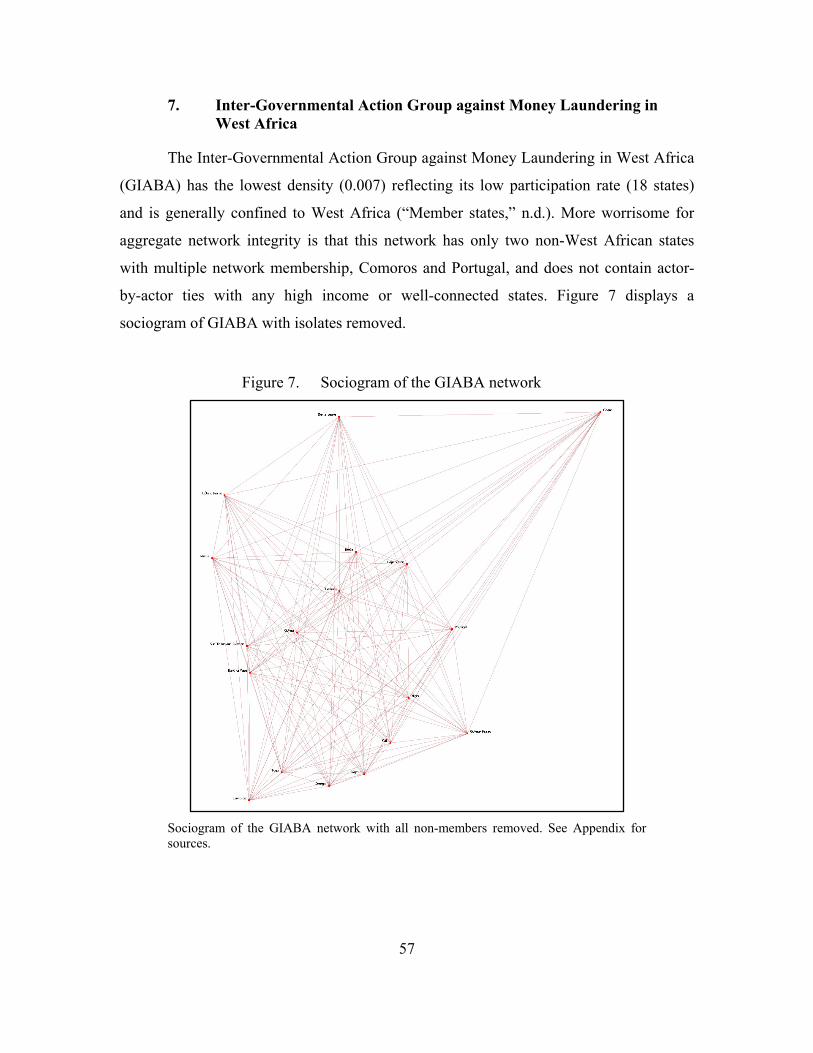
57
7. Inter-Governmental Action Group against Money Laundering in West Africa
The Inter-Governmental Action Group against Money Laundering in West Africa
(GIABA) has the lowest density (0.007) reflecting its low participation rate (18 states)
and is generally confined to West Africa (“Member states,” n.d.). More worrisome for
aggregate network integrity is that this network has only two non-West African states
with multiple network membership, Comoros and Portugal, and does not contain actor-
by-actor ties with any high income or well-connected states. Figure 7 displays a
sociogram of GIABA with isolates removed.
Figure 7. Sociogram of the GIABA network
Sociogram of the GIABA network with all non-members removed. See Appendix for sources.
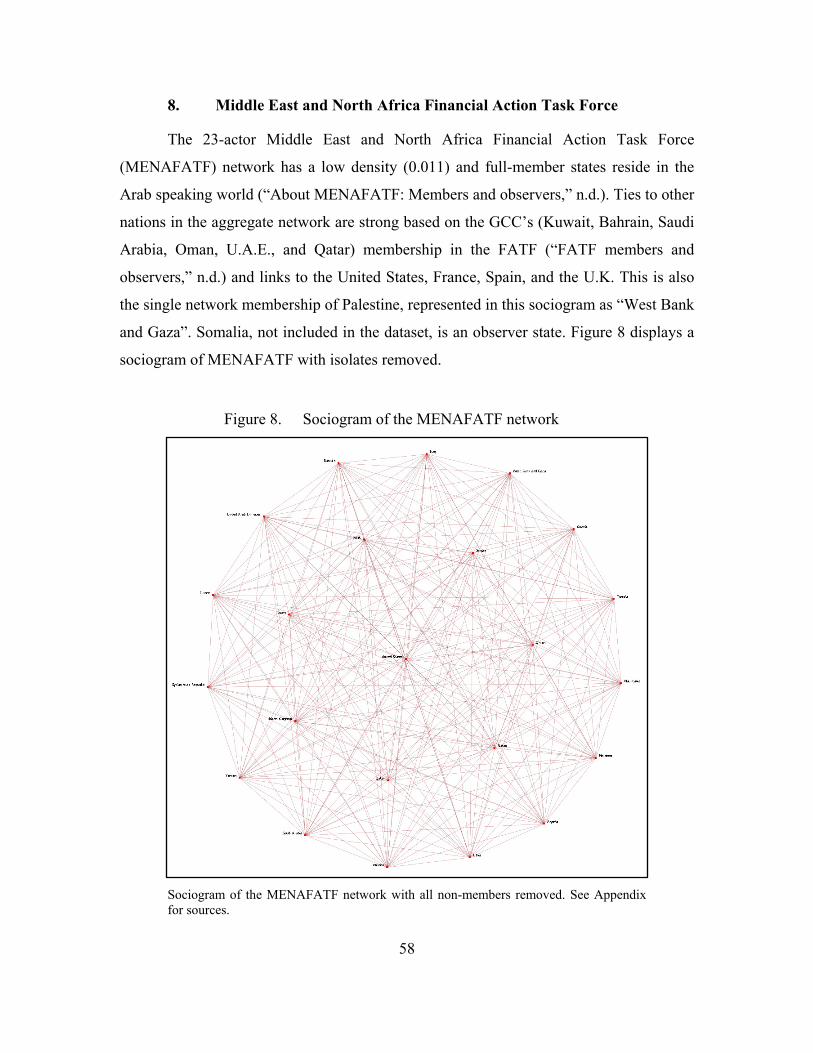
58
8. Middle East and North Africa Financial Action Task Force
The 23-actor Middle East and North Africa Financial Action Task Force
(MENAFATF) network has a low density (0.011) and full-member states reside in the
Arab speaking world (“About MENAFATF: Members and observers,” n.d.). Ties to other
nations in the aggregate network are strong based on the GCC’s (Kuwait, Bahrain, Saudi
Arabia, Oman, U.A.E., and Qatar) membership in the FATF (“FATF members and
observers,” n.d.) and links to the United States, France, Spain, and the U.K. This is also
the single network membership of Palestine, represented in this sociogram as “West Bank
and Gaza”. Somalia, not included in the dataset, is an observer state. Figure 8 displays a
sociogram of MENAFATF with isolates removed.
Figure 8. Sociogram of the MENAFATF network
Sociogram of the MENAFATF network with all non-members removed. See Appendix for sources.
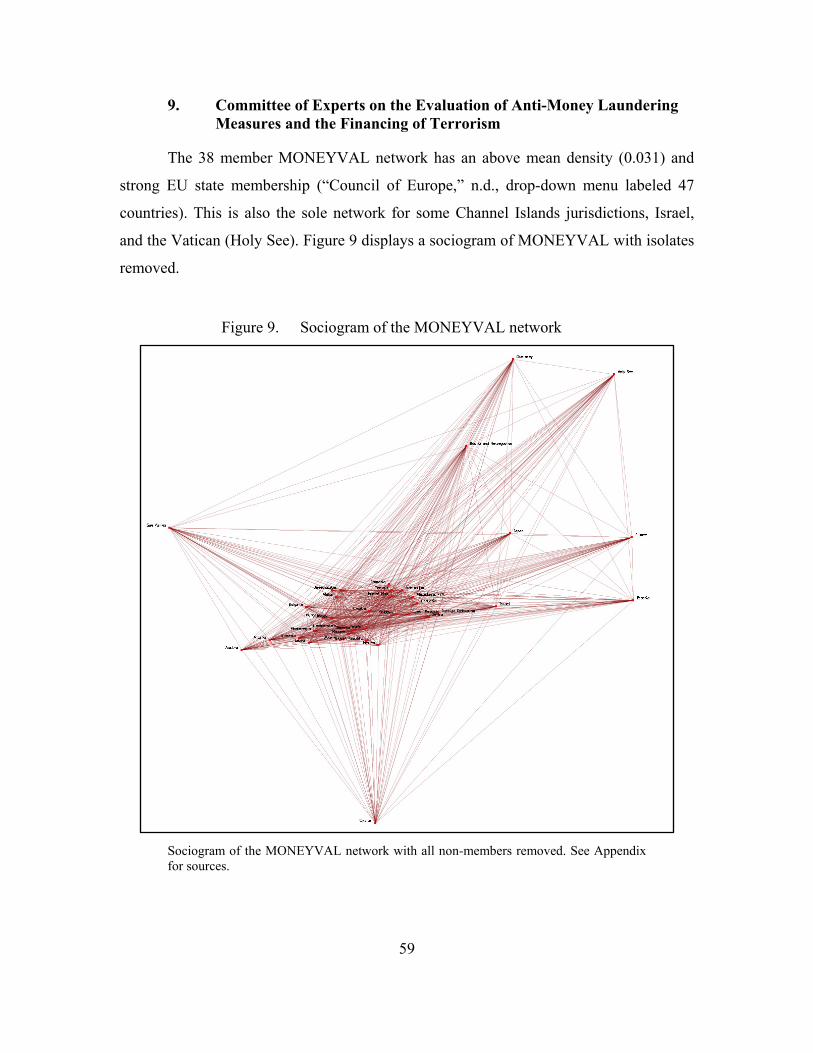
59
9. Committee of Experts on the Evaluation of Anti-Money Laundering Measures and the Financing of Terrorism
The 38 member MONEYVAL network has an above mean density (0.031) and
strong EU state membership (“Council of Europe,” n.d., drop-down menu labeled 47
countries). This is also the sole network for some Channel Islands jurisdictions, Israel,
and the Vatican (Holy See). Figure 9 displays a sociogram of MONEYVAL with isolates
removed.
Figure 9. Sociogram of the MONEYVAL network
Sociogram of the MONEYVAL network with all non-members removed. See Appendix for sources.
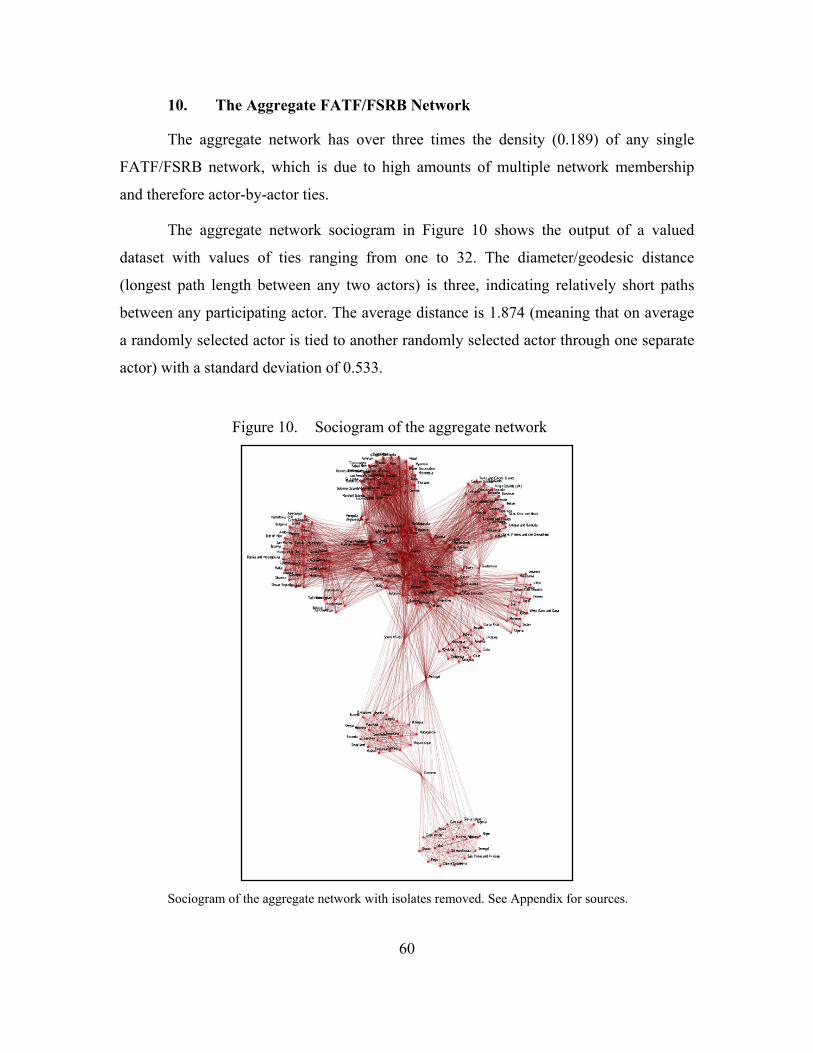
60
10. The Aggregate FATF/FSRB Network
The aggregate network has over three times the density (0.189) of any single
FATF/FSRB network, which is due to high amounts of multiple network membership
and therefore actor-by-actor ties.
The aggregate network sociogram in Figure 10 shows the output of a valued
dataset with values of ties ranging from one to 32. The diameter/geodesic distance
(longest path length between any two actors) is three, indicating relatively short paths
between any participating actor. The average distance is 1.874 (meaning that on average
a randomly selected actor is tied to another randomly selected actor through one separate
actor) with a standard deviation of 0.533.
Figure 10. Sociogram of the aggregate network
Sociogram of the aggregate network with isolates removed. See Appendix for sources.
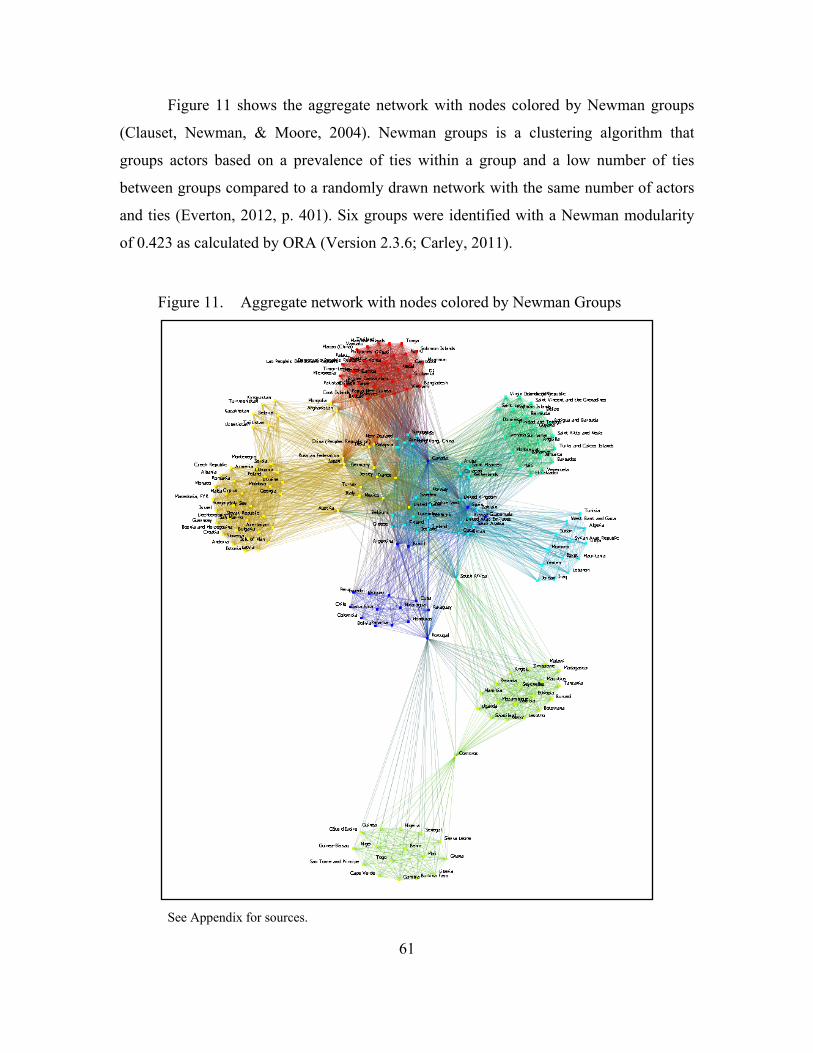
61
Figure 11 shows the aggregate network with nodes colored by Newman groups
(Clauset, Newman, & Moore, 2004). Newman groups is a clustering algorithm that
groups actors based on a prevalence of ties within a group and a low number of ties
between groups compared to a randomly drawn network with the same number of actors
and ties (Everton, 2012, p. 401). Six groups were identified with a Newman modularity
of 0.423 as calculated by ORA (Version 2.3.6; Carley, 2011).
Figure 11. Aggregate network with nodes colored by Newman Groups
See Appendix for sources.
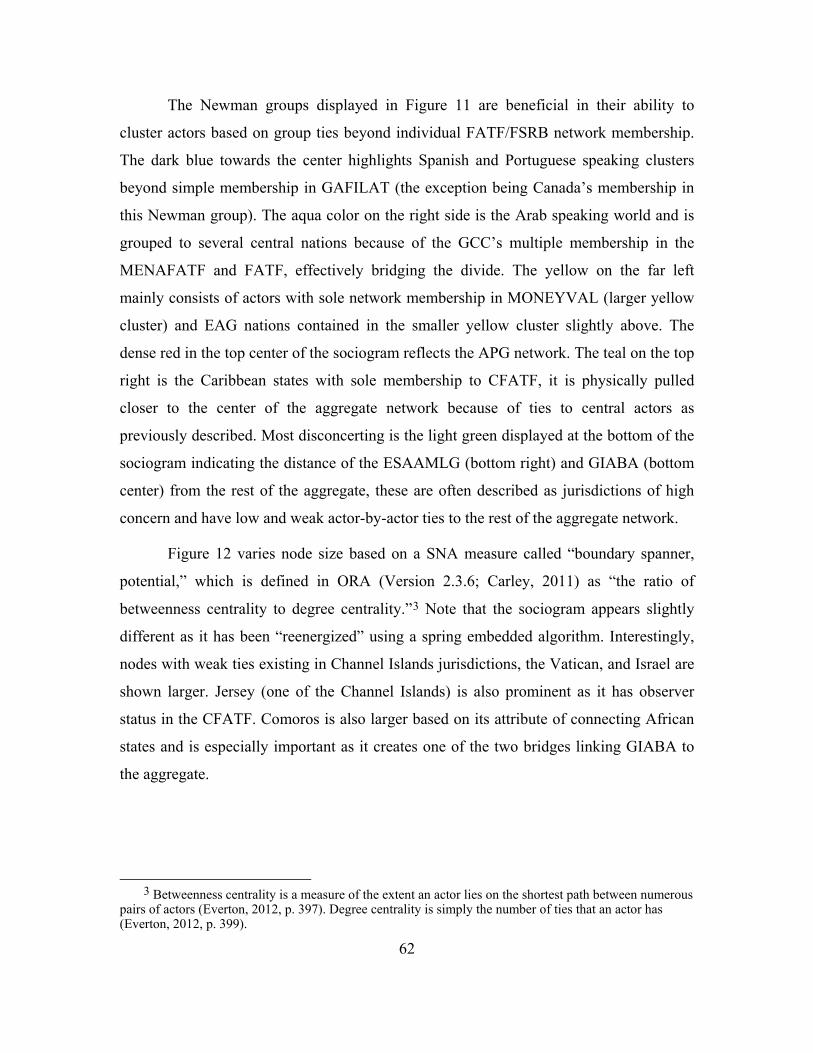
62
The Newman groups displayed in Figure 11 are beneficial in their ability to
cluster actors based on group ties beyond individual FATF/FSRB network membership.
The dark blue towards the center highlights Spanish and Portuguese speaking clusters
beyond simple membership in GAFILAT (the exception being Canada’s membership in
this Newman group). The aqua color on the right side is the Arab speaking world and is
grouped to several central nations because of the GCC’s multiple membership in the
MENAFATF and FATF, effectively bridging the divide. The yellow on the far left
mainly consists of actors with sole network membership in MONEYVAL (larger yellow
cluster) and EAG nations contained in the smaller yellow cluster slightly above. The
dense red in the top center of the sociogram reflects the APG network. The teal on the top
right is the Caribbean states with sole membership to CFATF, it is physically pulled
closer to the center of the aggregate network because of ties to central actors as
previously described. Most disconcerting is the light green displayed at the bottom of the
sociogram indicating the distance of the ESAAMLG (bottom right) and GIABA (bottom
center) from the rest of the aggregate, these are often described as jurisdictions of high
concern and have low and weak actor-by-actor ties to the rest of the aggregate network.
Figure 12 varies node size based on a SNA measure called “boundary spanner,
potential,” which is defined in ORA (Version 2.3.6; Carley, 2011) as “the ratio of
betweenness centrality to degree centrality.”3 Note that the sociogram appears slightly
different as it has been “reenergized” using a spring embedded algorithm. Interestingly,
nodes with weak ties existing in Channel Islands jurisdictions, the Vatican, and Israel are
shown larger. Jersey (one of the Channel Islands) is also prominent as it has observer
status in the CFATF. Comoros is also larger based on its attribute of connecting African
states and is especially important as it creates one of the two bridges linking GIABA to
the aggregate.
3 Betweenness centrality is a measure of the extent an actor lies on the shortest path between numerous
pairs of actors (Everton, 2012, p. 397). Degree centrality is simply the number of ties that an actor has (Everton, 2012, p. 399).
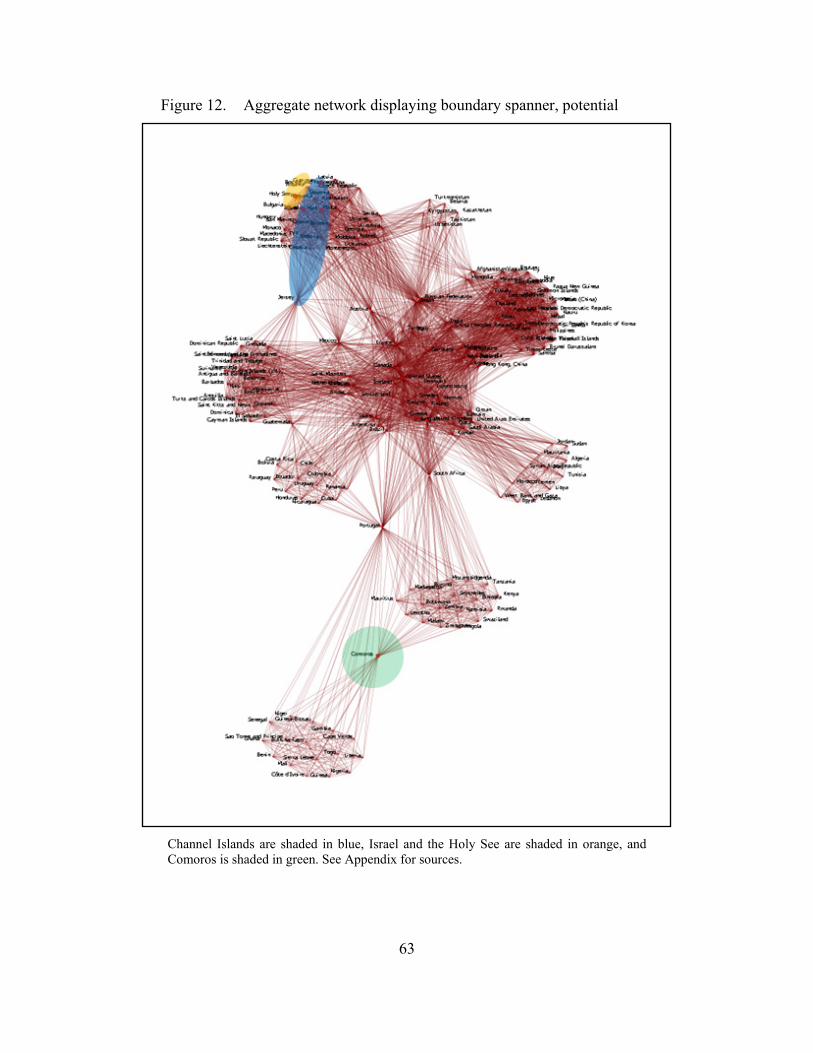
63
Figure 12. Aggregate network displaying boundary spanner, potential
Channel Islands are shaded in blue, Israel and the Holy See are shaded in orange, and Comoros is shaded in green. See Appendix for sources.
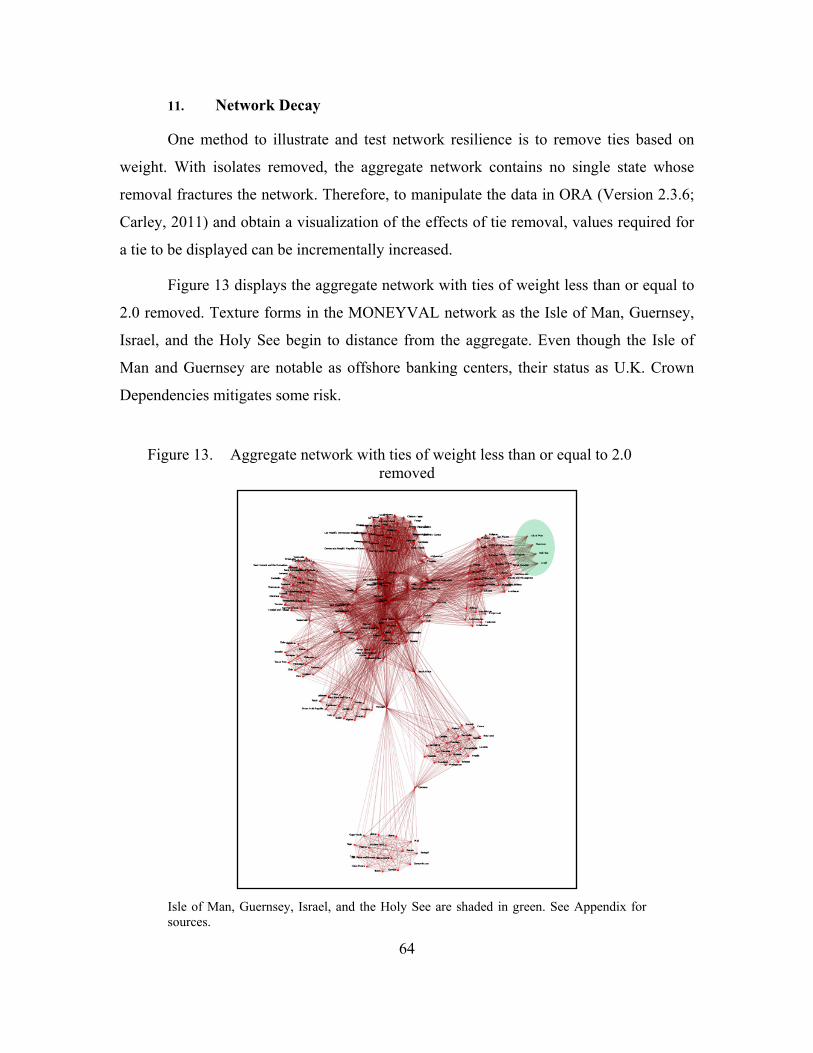
64
11. Network Decay
One method to illustrate and test network resilience is to remove ties based on
weight. With isolates removed, the aggregate network contains no single state whose
removal fractures the network. Therefore, to manipulate the data in ORA (Version 2.3.6;
Carley, 2011) and obtain a visualization of the effects of tie removal, values required for
a tie to be displayed can be incrementally increased.
Figure 13 displays the aggregate network with ties of weight less than or equal to
2.0 removed. Texture forms in the MONEYVAL network as the Isle of Man, Guernsey,
Israel, and the Holy See begin to distance from the aggregate. Even though the Isle of
Man and Guernsey are notable as offshore banking centers, their status as U.K. Crown
Dependencies mitigates some risk.
Figure 13. Aggregate network with ties of weight less than or equal to 2.0 removed
Isle of Man, Guernsey, Israel, and the Holy See are shaded in green. See Appendix for sources.
65
Figure 14 displays the aggregate network with ties of weight less than or equal to
3.0 removed. Isolates appear as they are distanced from the aggregate network (“former”
MONEYVAL members discussed in the previous paragraph). CFATF shows a distance
comparable to the African states but benefits from multiple strong ties to well-connected
countries.
Figure 14. Aggregate network with ties of weight less than or equal to 3.0 removed
New isolates appear on the right. CFATF is shaded in blue, African states are shaded in green, and well-connected states or jurisdictions with membership in CFATF are shaded in orange. See Appendix for sources.
Figure 15 displays the aggregate network with ties of weight less than or equal to
5.0 removed. The resultant effect is texturing appearing in the APG with distancing of the
DPRK because of its sole weak tie inherent in its observer status being stressed and West
Bank and Gaza likewise beginning to separate from the MENAFATF network.
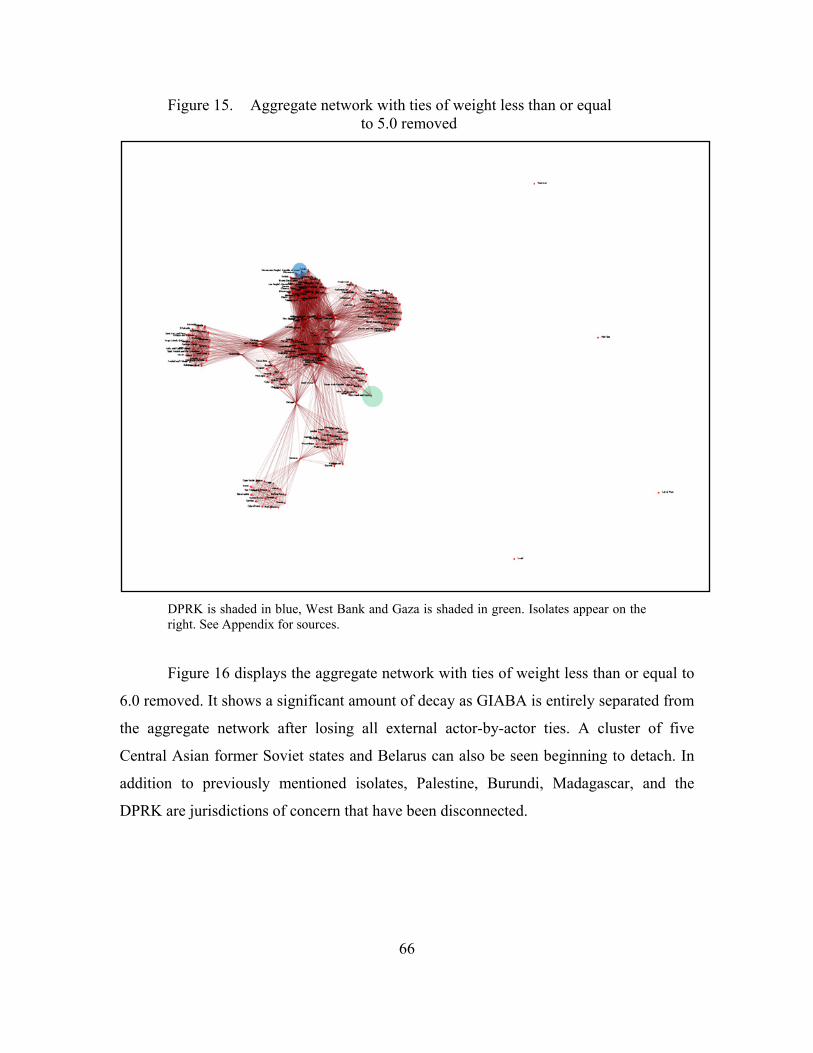
66
Figure 15. Aggregate network with ties of weight less than or equal to 5.0 removed
DPRK is shaded in blue, West Bank and Gaza is shaded in green. Isolates appear on the right. See Appendix for sources.
Figure 16 displays the aggregate network with ties of weight less than or equal to
6.0 removed. It shows a significant amount of decay as GIABA is entirely separated from
the aggregate network after losing all external actor-by-actor ties. A cluster of five
Central Asian former Soviet states and Belarus can also be seen beginning to detach. In
addition to previously mentioned isolates, Palestine, Burundi, Madagascar, and the
DPRK are jurisdictions of concern that have been disconnected.
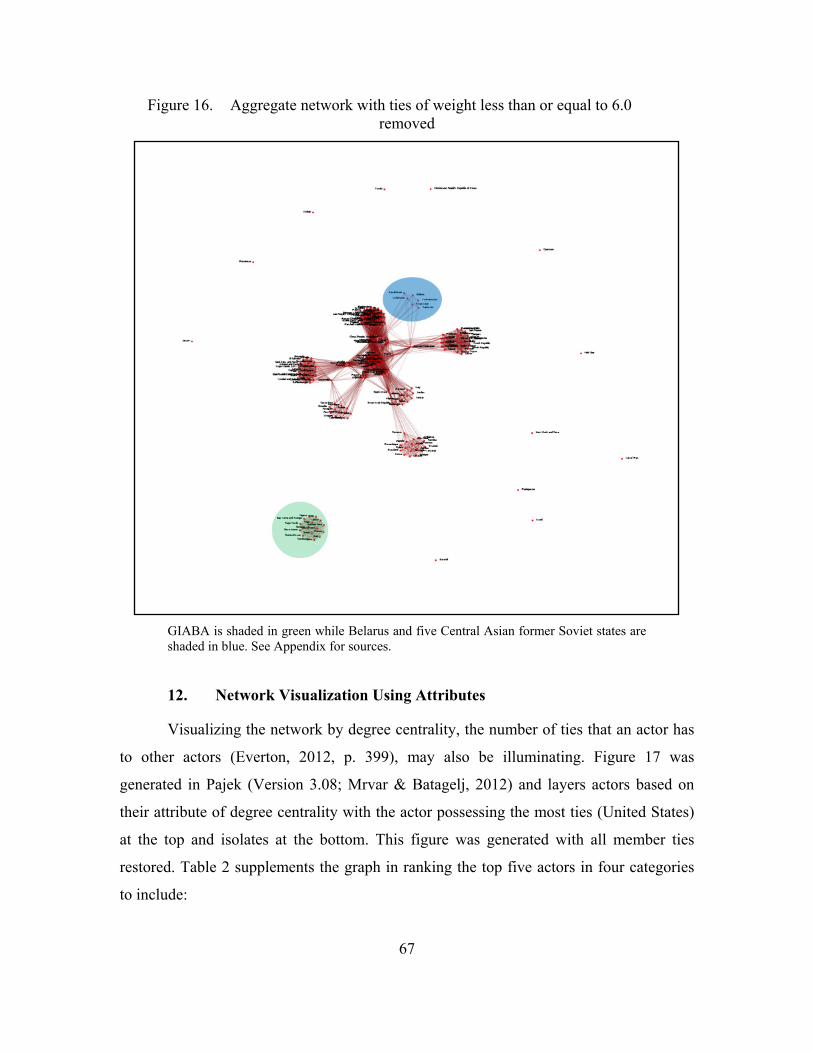
67
Figure 16. Aggregate network with ties of weight less than or equal to 6.0 removed
GIABA is shaded in green while Belarus and five Central Asian former Soviet states are shaded in blue. See Appendix for sources.
12. Network Visualization Using Attributes
Visualizing the network by degree centrality, the number of ties that an actor has
to other actors (Everton, 2012, p. 399), may also be illuminating. Figure 17 was
generated in Pajek (Version 3.08; Mrvar & Batagelj, 2012) and layers actors based on
their attribute of degree centrality with the actor possessing the most ties (United States)
at the top and isolates at the bottom. This figure was generated with all member ties
restored. Table 2 supplements the graph in ranking the top five actors in four categories
to include:
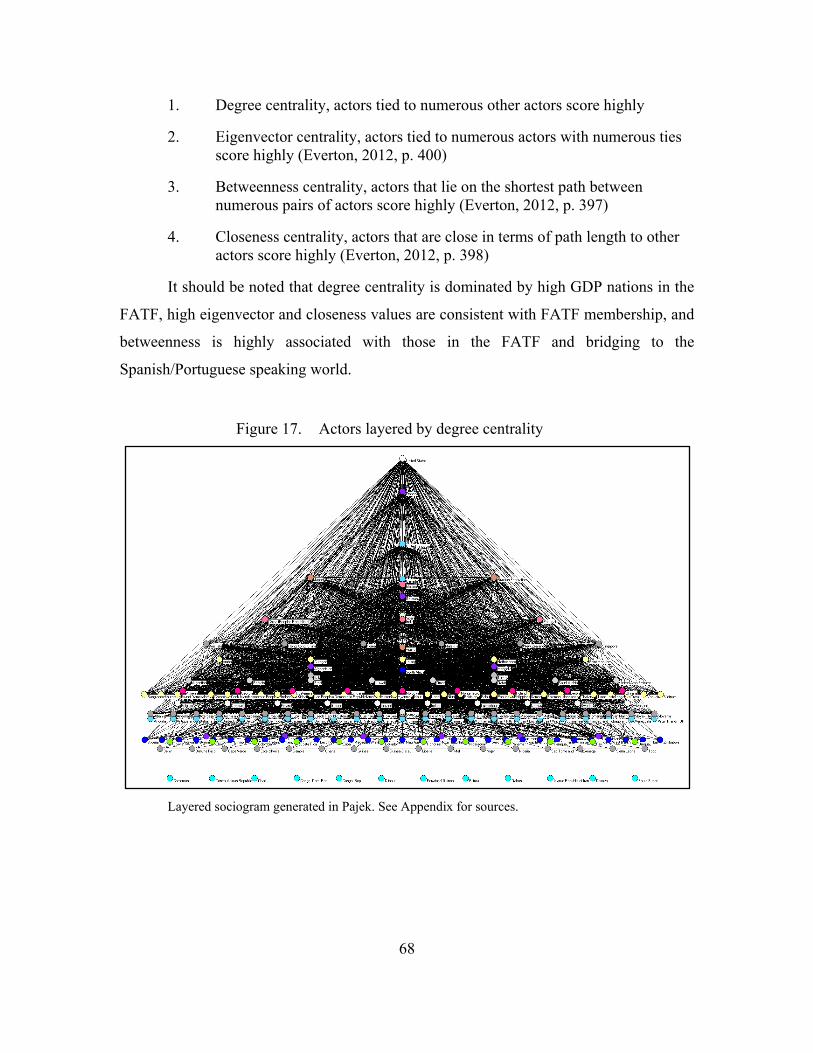
68
1. Degree centrality, actors tied to numerous other actors score highly
2. Eigenvector centrality, actors tied to numerous actors with numerous ties score highly (Everton, 2012, p. 400)
3. Betweenness centrality, actors that lie on the shortest path between numerous pairs of actors score highly (Everton, 2012, p. 397)
4. Closeness centrality, actors that are close in terms of path length to other actors score highly (Everton, 2012, p. 398)
It should be noted that degree centrality is dominated by high GDP nations in the
FATF, high eigenvector and closeness values are consistent with FATF membership, and
betweenness is highly associated with those in the FATF and bridging to the
Spanish/Portuguese speaking world.
Figure 17. Actors layered by degree centrality
Layered sociogram generated in Pajek. See Appendix for sources.
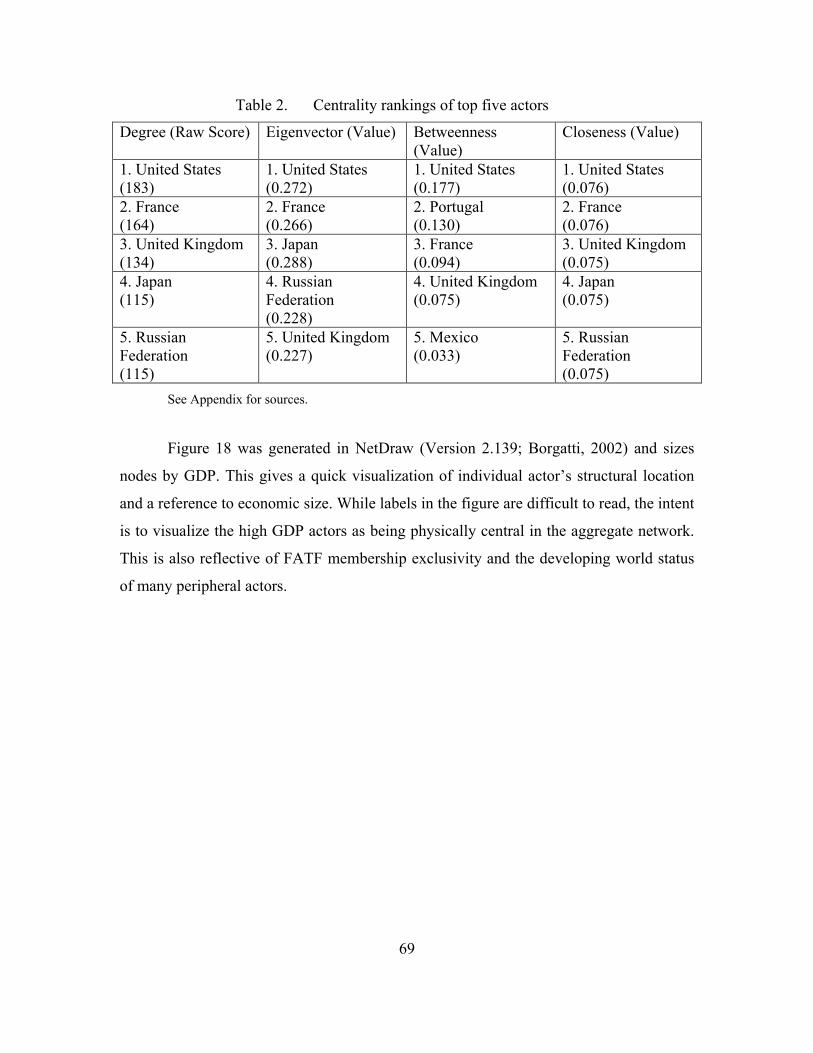
69
Table 2. Centrality rankings of top five actors
Degree (Raw Score) Eigenvector (Value) Betweenness (Value)
Closeness (Value)
1. United States (183)
1. United States (0.272)
1. United States (0.177)
1. United States (0.076)
2. France (164)
2. France (0.266)
2. Portugal (0.130)
2. France (0.076)
3. United Kingdom (134)
3. Japan (0.288)
3. France (0.094)
3. United Kingdom (0.075)
4. Japan (115)
4. Russian Federation (0.228)
4. United Kingdom (0.075)
4. Japan (0.075)
5. Russian Federation (115)
5. United Kingdom (0.227)
5. Mexico (0.033)
5. Russian Federation (0.075)
See Appendix for sources.
Figure 18 was generated in NetDraw (Version 2.139; Borgatti, 2002) and sizes
nodes by GDP. This gives a quick visualization of individual actor’s structural location
and a reference to economic size. While labels in the figure are difficult to read, the intent
is to visualize the high GDP actors as being physically central in the aggregate network.
This is also reflective of FATF membership exclusivity and the developing world status
of many peripheral actors.
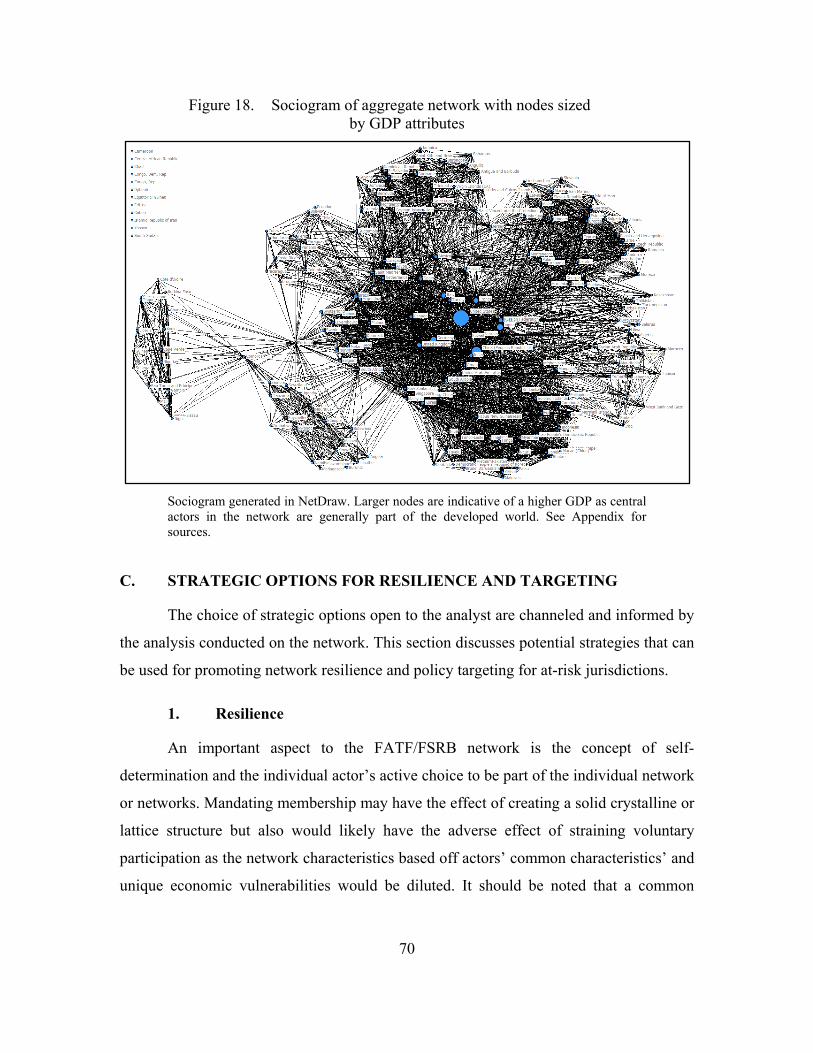
70
Figure 18. Sociogram of aggregate network with nodes sized by GDP attributes
Sociogram generated in NetDraw. Larger nodes are indicative of a higher GDP as central actors in the network are generally part of the developed world. See Appendix for sources.
C. STRATEGIC OPTIONS FOR RESILIENCE AND TARGETING
The choice of strategic options open to the analyst are channeled and informed by
the analysis conducted on the network. This section discusses potential strategies that can
be used for promoting network resilience and policy targeting for at-risk jurisdictions.
1. Resilience
An important aspect to the FATF/FSRB network is the concept of self-
determination and the individual actor’s active choice to be part of the individual network
or networks. Mandating membership may have the effect of creating a solid crystalline or
lattice structure but also would likely have the adverse effect of straining voluntary
participation as the network characteristics based off actors’ common characteristics’ and
unique economic vulnerabilities would be diluted. It should be noted that a common
71
thread to the following three strategies emphasize the value of observer membership, or
weak ties.
1. Observer status on an actor level could be encouraged in order to strengthen the network by bridging various sections of the aggregate network. When looking at the aggregate network on an actor-by-actor level, it can be easily noted that “all bridges are weak ties (Granovetter, 1973, p. 1364).” This is apparent in the observer membership of Comoros bridging the two African FSRBs or the tenuous nature inherent in single network status (e.g., Israel’s single weak tie to MONEYVAL). Observer status may not weaken the characteristics inherent in many networks and would effectively bridge FSRBs and allow for more actor-by-actor ties.
2. The negative effect of structural holes in the aggregate network could be mitigated by encouraging redundancy of ties. While some FSRBs contain multiple strong connections to the aggregate (e.g., APG), other networks with high risk actors like GIABA have a very low quantity of actor-by-actor ties. When the network decays as shown in Figures 13 through 16, CFATF can be shown increasing its distance from central actors but does not result in the same dire effects as GIABA because of a redundancy in ties. While Burt (1992) argues the advantages of brokerage nested in a lack of redundant ties, a resilient policy network could be at a great risk of destabilizing effects by allowing too much influence in a single actor.
3. Reach out to isolate actors and encourage application to a FSRB. This is the “low-hanging fruit” of strategies to bring in at-risk jurisdictions. The benefits include encouragement of state level AML/CFT legislation, implementing efforts based off of FATF recommendations, actor-by-actor ties to these same at-risk jurisdictions, and how the networks and other actors already present in these networks can shape and influence the new member similar to the network rules of Christakis and Fowler (2009). The major hurdle in this third strategy is the willingness of the isolate or current network members to allow the new tie. Prior to 2014, the DPRK was an isolate until it received observer status in the APG (“Democratic Peoples’ Republic of Korea,” n.d.). Regardless of its affiliation, the strength of the weak tie is questionable as it possibly only creates nominal actor-by-actor ties. Using the same logic, integrating Iran may be questionable in its ultimate benefits and potential state reluctance to join.
2. Policy Targeting
The FATF frequently conducts mutual evaluations of member jurisdictions,
publishes and updates recommendations, and publishes typology reports highlighting
vulnerabilities. A single strategy for exhaustive identification of all at risk jurisdictions
simply does not exist but SNA can provide a method of identification for probable high
72
threat regions. While all actors have some level of vulnerability to their financial systems
being exploited by nefarious groups or persons, actors identified as only having weak ties
and actors that are isolated can be readily identified as being at a higher risk. Using a
risk-based analysis, individual FSRBs can also respond to unique economic and financial
threats.
Based upon Christakis and Fowler’s (2009) theories on influence and the value of
closeness, actor-by-actor ties can be utilized to strengthen at-risk jurisdictions. Working
on the postulate that influence spreads and the network’s characteristics shape the actors
within, policy and recommendations can also be targeted to actors close to those that are
at-risk.
D. SUMMARY
SNA is not a perfect tool for understanding the complexities and nuances of
international relations and the AML/CFT environment, but it does allow in depth analysis
of the underlying structures and characteristics of networks. Theory developed in the
field through extensive research also assists in the explanation of the constraints and
influence placed on actors, network efficiencies and effects, and enables an analysis of
structural characteristics that may not be readily apparent.
While the presence of IGO representation in regional networks is valuable in
creating a robust network and fruitful cooperation, follow-up action and legislation must
be taken by the individual actor. Analyzing the aggregate FATF/FSRB network on an
actor-by-actor basis yields the potential for viable strategies in shaping the AML/CFT
landscape and further increasing its resilience.
73
VI. FINDINGS AND CONCLUSION
A robust policy network and recognition of factors contributing to the illicit use of
gold throughout the operational chain greatly assists in financial sector stability and
defining responses to tangible threats. This chapter presents available responses to
counter the illicit use of gold, identifies current policy vulnerabilities affecting this
commodity, potential methods to promote operational chain stability, and areas of further
research that can be developed.
A. FINDINGS
This section presents research-based findings and methods to identify and disrupt
the use of gold in threat financing operations, and policy suggestions to guide potential
IGO recommendations and government policy implementation. A risk-based approach
dominates the tactics that are used; regions with difficulty presented from informal or
illicit economies in upstream operations are frequently those suffering from ungoverned
spaces and lax controls, while downstream markets with large demand are often found in
regions of at least relatively capable governance. Because of this dichotomy, varying
approaches must be used to individual combat the ills of the operational chain while
realizing that even informal economies may have positive contributions.
1. Operational
Recognition of the precursors to illicit mining activities and the effects created by
its presence is likely the most important step to ensuring legitimacy throughout the
operational chain. While smuggling operations, laundering activities, and the shadowy
transfer of funds between criminal and terrorist enterprises can be highly damaging, the
scale of government tax revenue lost, legitimate industry avoidance in developing
economies, and propensity for illicit economies to flourish in this environment far
outweigh the downstream risks. Recognizing the presence of these illicit economies,
conducting analysis of trade discrepancies, and dismantling peripheral activities are all
potential opportunities for promoting a secure market and preventing its misuse.
74
a. Recognition of Illicit Mining
Recognition of illicit mining activities is necessary in a risk-based approach to
counter fundraising in upstream operations. While not illegal in all circumstances, ASM
operations are higher-risk activities that are often found alongside human-rights
violations (Verité, 2012), damaging environmental processes (Blacksmith Institute,
2010), potential exploitation by armed groups, and exposure to smuggling operations
(OECD, 2013, p. 71).
Observable indicators of local ASM operations may take the form of small-scale
mercury sales catering to ASM miners using mercury amalgamation (Blacksmith
Institute, 2010), cash-for-gold operations accepting raw gold or gold doré (Verité, 2012),
and environmental damage including clear-cutting of vegetation, scarring of resource-
exploited land, and animal die-off from mercury pollution (Elbein, 2015; Verité, 2012).
While these operations are prone to occur in areas of lax or absent governance, these cues
to illegal ASM operations are readily apparent.
b. Trade Transparency Units
TTUs can be used to identify discrepancies in trade data between countries
(Cassara & Jorisch, 2010, p. 68). Occurring in downstream operations, smuggling and
misrepresentation of goods and quantities shipped may easily allow for value to be
siphoned off and used for nefarious purposes, obscure the quantity imported from a
questionable origin, or used to evade import taxes. The examination of corresponding
import and export documentation provides the opportunity to analyze discrepancies and
patterns of misrepresentation that may be indicative of TBML or smuggling (Cassara &
Jorisch, 2010, pp. 69-74).
Data gathered by TTUs and shared with FIUs may also present indicators of illicit
sourcing. In the case of the greater African Great Lakes region where gold is smuggled
from the source country to an intermediate stop before export, TTU data on exports can
be matched to mining estimates to establish if the claimed origin is likely false. The
OECD (2013, p. 79) highlights excessively-claimed origin in a country with low output
as one of their red flag indicators for illicit sourcing.
75
c. Dismantling Illicit Economies
The displacement of large populations to former sparsely populated regions and
capital investment on any scale can form illicit economies that surround mining
operations. Verité (2012) gives an in-depth description of human trafficking for
prostitution and menial labor, debt bondage, and services provided at ad hoc mining
encampments. Illegal mining operations attract an informal economy that operates
without regulation.
Combating the activities surrounding illegal mining may limit production
capabilities. As evidenced in informal mining towns like La Rinconada (Finnegan, 2015),
inhospitable climates and remote locations necessitate ancillary operations whose
regulation can stifle the primary operation. Second-order effects on illegal mining
operations can also be achieved through efforts at combating human trafficking and
blocking the import of necessary machinery and chemicals to at-risk regions.
2. Policy
Operational capabilities are generally focused on financial sector security through
the denial of informal and illicit economies that are most vulnerable to laundering
activities and illicit finance. This hardline approach of focusing on denial presents short-
term positive effects (i.e., enforcing formalization of miners in Peru and destroying
equipment of those whom are non-compliant), but intermediate effects may result in
recidivism to informal or illegal practices and long-term effects may include a further
economic depression in a region with few legitimate alternatives and possible social
upheaval causing further instability.
Policy efforts are often contingent on the established presence of rule of law and
the capability of governance. They also create a stable market environment that can affect
the upstream operations by focusing demand on legitimate sourcing options and
discouraging the use of questionable activities. The FATF, individual governments, and
industry groups all have the ability to promote legitimacy and can take on a nuanced
approach that combats illicit activities while defending the opportunities of those workers
and disadvantaged populations with few legitimate alternatives.
76
a. FATF
FSRB membership should be universally encouraged, especially for high-risk
states. Four of the eleven isolate states, the DRC, CAR, Republic of the Congo, and
Cameroon, are all within the greater African Great Lakes region or are used as gold
smuggling routes from the region. While FATF recommendations do not carry the weight
of law, exposure through regional forums and mutual evaluations of existing economic
environments and legislation could increase transparency and promote the establishment
of stronger AML/CFT efforts.
The FATF Recommendations are also incomplete in countering illicit financing
with gold and other commodities. Recommendations 22 and 23 apply specifically to
DNFBPs (FATF, 2012, pp. 19-20), but focus entirely on the dealers in downstream
operations and gold’s intersection with cash transactions. While it is useful to file CTRs
and SARs with FIUs, much of the risk of terrorist and criminal financing comes from
upstream operations in locations where CTRs and SARs are not practicable and among
parties that would never file these reports. Recommendations should be added to ensure
that downstream DNFBPs are required to follow due-diligence procedures in their
sourcing.
b. Government
Government policy needs to reflect how gold is a high-liquidity currency that
easily intersects with other forms of threat financing, how it establishes vast illicit
economies, and how it may be the only source of livelihood for workers from
disadvantaged populations. Unfortunately, there is immense difficulty in balancing these
imperatives with large demand, lack of legitimate economic opportunities, and ineffective
governance.
The U.A.E.’s ongoing attempt at registering the hawala system recognizes the
need for accountability in documenting the direction, parties, and amounts of funds
transferred, but neglects the key question of how the books are balanced between
hawaladars. Gold being a common method of account settlement (Cassara & Jorisch,
2010, pp. 100–101), the hawala registration documentation and reports on remittances
77
(Central Bank of the United Arab Emirates, 2003, slides 8, 12, and 14) do track
customers and require the hawaladar to report the nature of their business, but they do not
require specifics on account settlement methods. While it may be assumed that a souk
merchant would use gold imports and exports for settlement of hawala accounts, the
valuation of these transactions needs to be monitored to reduce the likelihood of tariff
avoidance, money laundering, and terrorist financing.
Attacking the constituent elements of illicit economies is an indirect approach to
reducing the supply of illicitly mined gold, but may have the additional benefits of
blocking exploitation by criminal elements. Even in the primitive conditions of ASM
operations in the CAR, DRC, and parts of Peru, large support operations for the miners
and intricate smuggling networks for integration of illicitly mined gold into the legitimate
supply is necessary. As laundering activities and illicit finance are often predicate
offences for illegal operations, there must be awareness that the predicate functions
required to be in place for mining operations are often also controlled by criminal
elements and nefarious groups.
A balance must also be made between completely shutting off illegal and informal
mining operations and letting them run freely. While efforts like the Dodd-Frank Wall
Street Reform Act of 2010 make it attractive to entirely avoid sourcing 3TG minerals
from conflict-affected regions, conflict-free ASM operations within the African Great
Lakes region also provides one of the only sources of livelihood in an otherwise
economically desolate area. PwC (2013a, p. 17) documented this economic question in
that they estimate the approximately five-million ASM gold miners worldwide make an
assumed U.S. $10 per day which is generally well above other wage sources in depressed
communities. Efforts to formalize mining operations (e.g., Peru) or create obstacles to
sourcing from conflict-affected regions must take precautions to avoid extinguishing all
economic opportunity.
c. Industry
Adoption of industry best practices from mine to market is beneficial when they
are used throughout the operational chain. The WGC’s (2012) Conflict-Free Gold
78
Standard, the DMCC’s (2012) Practical Guidance, the LBMA’s (2013) Responsible Gold
Guidance, and the Responsible Jewellery Council’s (2013) Code of Practices all
champion a risk-based approach to identifying conflict sourcing, human rights abuses,
and the potential for terrorist financing. Industry self-regulation and policing efforts
shoulder some of the burden of AML/CFT efforts, can assist in the starvation of demand
from illicit economies, and provide practical solutions from industry experts.
Adoption of these standards should be encouraged whenever possible. A leading
risk to their failure is a break in due-diligence; if miners and refiners are not upholding
their due-diligence efforts or misrepresenting their claims, downstream markets’ and
other operations’ due-diligence efforts will likewise be negatively impacted.
B. CONCLUSION
Gold can be used to launder criminal proceeds, transfer value between nefarious
actors with a high degree of anonymity, settle accounts in IVTS, fund armed insurgencies
through the control of mining activities, destroy workers health and the environment,
contribute to human trafficking, and stunt positive infrastructure growth in developing
economies. It also provides a means of diversification for central banks, a multi-billion
dollar global trade, a hedge against inflation for investors, and an income source, both
direct and indirect, for millions of workers. Unique risks are present in all segments of
the operational chain from mine to market and among different geographic regions. The
misuse of gold, like in many CTF subjects, has the major commonality of being
transnational in scope.
This thesis presented an overview of the operational chain and its vulnerabilities,
specific regional cases of abuse throughout the chain, policy efforts aimed at promoting a
stable market supporting legitimate activity, the FATF/FSRB network that promotes this
stability, and research-based findings. While this research was intentionally limited in
scope to the operations, vulnerabilities, and policies related to gold; additional research
could be conducted into the intersection of gold with other money laundering and
terrorist financing methods, the net effects of shutting down or criminalizing informal
79
economies, the instability caused by 3TG and other resources, or the effectiveness of
present AML/CFT efforts in combating a highly liquid and anonymous commodity.

80
THIS PAGE INTENTIONALLY LEFT BLANK
81
APPENDIX. COMPILED DATASET AND SOCIOGRAM SOURCES
This appendix describes the 212 actor dataset compiled from multiple online
sources that is extensively used throughout Chapter V and the SNA software that was
used to generate sociograms and select metrics. The intent is not to provide new
information, but instead to provide credit for the information and provide insight into the
data used to generate the figures.
A. DATASET
The compiled dataset consists of 212 actors (state or jurisdiction) and are listed in
Table 3. The first column of the table gives the name of the state or jurisdiction, while the
last column presents its GDP in millions of U.S. dollars. The nine columns in between
represent the FATF or one of the FSRBs with the first row providing labels one through
nine and the following rows are assigned a blank, or the number one, two, or three. One
represents “other” status, two represents “observer” status, and three represents
“member” status. Table 1 in Chapter V was created by naming the states or jurisdictions
that are not a FATF/FSRB member in the compiled dataset.
Information collected for the center nine columns comes from 10 websites.
Multiple sources were used in all cases except the FATF network membership to check if
there was a discrepancy between information, and in the case that they were not identical,
the membership lists were combined. The following list is numbered to indicate the
column number matching the dataset, the name of the body, and a reference of where the
information was obtained:
1. FATF
FATF members and observers. (n.d.). Retrieved May 3, 2015, from http://www.fatf-gafi.org/pages/aboutus/membersandobservers/
2. APG
Members & observers. (n.d.). Retrieved May 30, 2015, from http://apgml.org/members-and-observers/page.aspx?p=8c32704a-5829-4671-873c-7b5a23ced347
3. CFATF
82
Member countries. (n.d.). Retrieved May 30, 2015, from https://www.cfatf-gafic.org/index.php/member-countries
4. EAG
Eurasian Group on Combating Money Laundering and Financing of Terrorism. (n.d.). Retrieved May 30, 2015, from http://www.eurasiangroup.org/
5. ESAAMLG
Eastern and Southern Africa Anti-Money Laundering Group. (n.d.). Retrieved May 30, 2015, from http://esaamlg.org/
6. GAFILAT
Miembros. (n.d.). Retrieved May 30, 2015, from http://www.gafilat.org/content/observadores/
7. GIABA
Member states. (n.d.). Retrieved May 30, 2015, from http://www.giaba.org/member-states/index_653.html
8. MENAFATF
About MENAFATF: Members and observers. (n.d.). Retrieved May 30, 2015, from http://menafatf.org/topiclist.asp?ctype=about&id=430
9. MONEYVAL
Council of Europe. (n.d.) Retrieved May 30, 2015, from http://www.coe.int/t/dghl/monitoring/moneyval/
The table at the following source was also a reference for all columns in the
compiled dataset:
Countries. (n.d.). Retrieved May 3, 2015, from http://www.fatf-gafi.org/pages/aboutus/membersandobservers/
The GDP data was taken from two sources: the World Bank and the CIA’s The
World Factbook. The World Bank’s dataset was consulted first but was missing data on
19 actors used in the compiled dataset. These countries or jurisdictions missing were
Anguilla, Aruba, Cayman Islands, Cook Islands, Curaçao, DPRK, Guernsey, Holy See,
Isle of Man, Jersey, Monaco, Montserrat, Nauru, Niue, San Marino, Sint Maarten, Syrian
Arab Republic, Turks and Caicos, and the Virgin Islands (U.K.). Their GDP data was
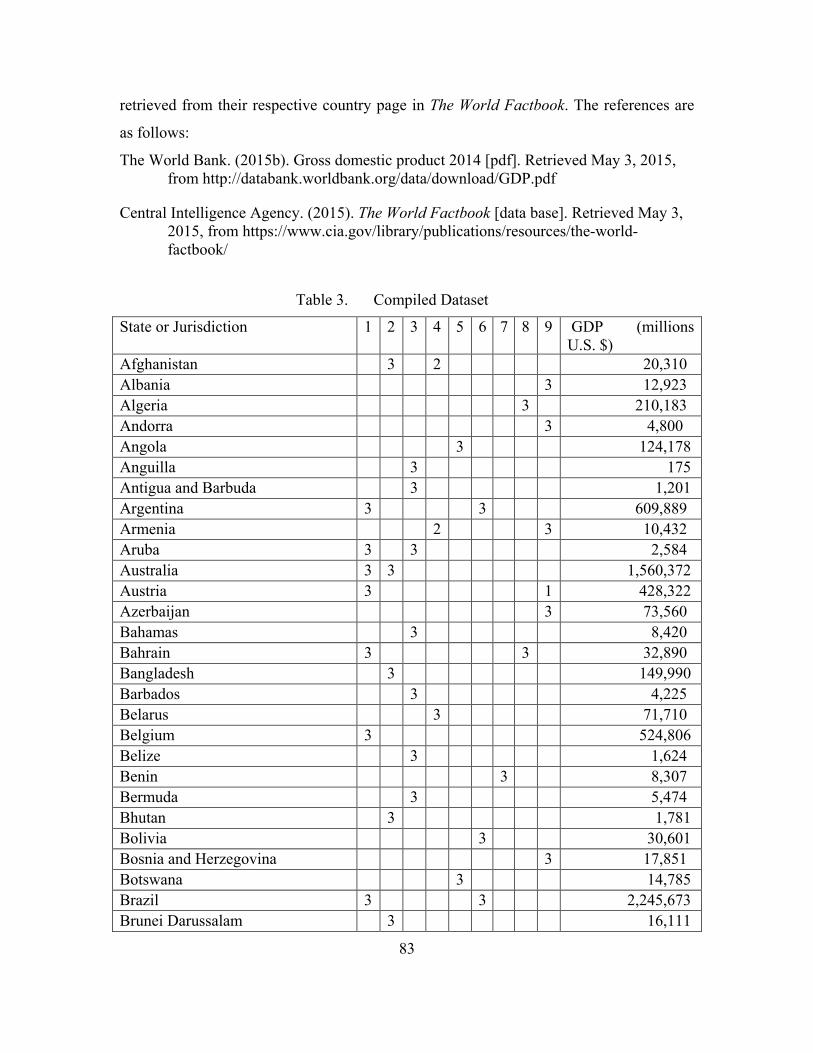
83
retrieved from their respective country page in The World Factbook. The references are
as follows:
The World Bank. (2015b). Gross domestic product 2014 [pdf]. Retrieved May 3, 2015, from http://databank.worldbank.org/data/download/GDP.pdf
Central Intelligence Agency. (2015). The World Factbook [data base]. Retrieved May 3, 2015, from https://www.cia.gov/library/publications/resources/the-world-factbook/
Table 3. Compiled Dataset
State or Jurisdiction 1 2 3 4 5 6 7 8 9 GDP (millions U.S. $)
Afghanistan 3 2 20,310 Albania 3 12,923 Algeria 3 210,183 Andorra 3 4,800 Angola 3 124,178 Anguilla 3 175 Antigua and Barbuda 3 1,201 Argentina 3 3 609,889 Armenia 2 3 10,432 Aruba 3 3 2,584 Australia 3 3 1,560,372 Austria 3 1 428,322 Azerbaijan 3 73,560 Bahamas 3 8,420 Bahrain 3 3 32,890 Bangladesh 3 149,990 Barbados 3 4,225 Belarus 3 71,710 Belgium 3 524,806 Belize 3 1,624 Benin 3 8,307 Bermuda 3 5,474 Bhutan 3 1,781 Bolivia 3 30,601 Bosnia and Herzegovina 3 17,851 Botswana 3 14,785 Brazil 3 3 2,245,673 Brunei Darussalam 3 16,111
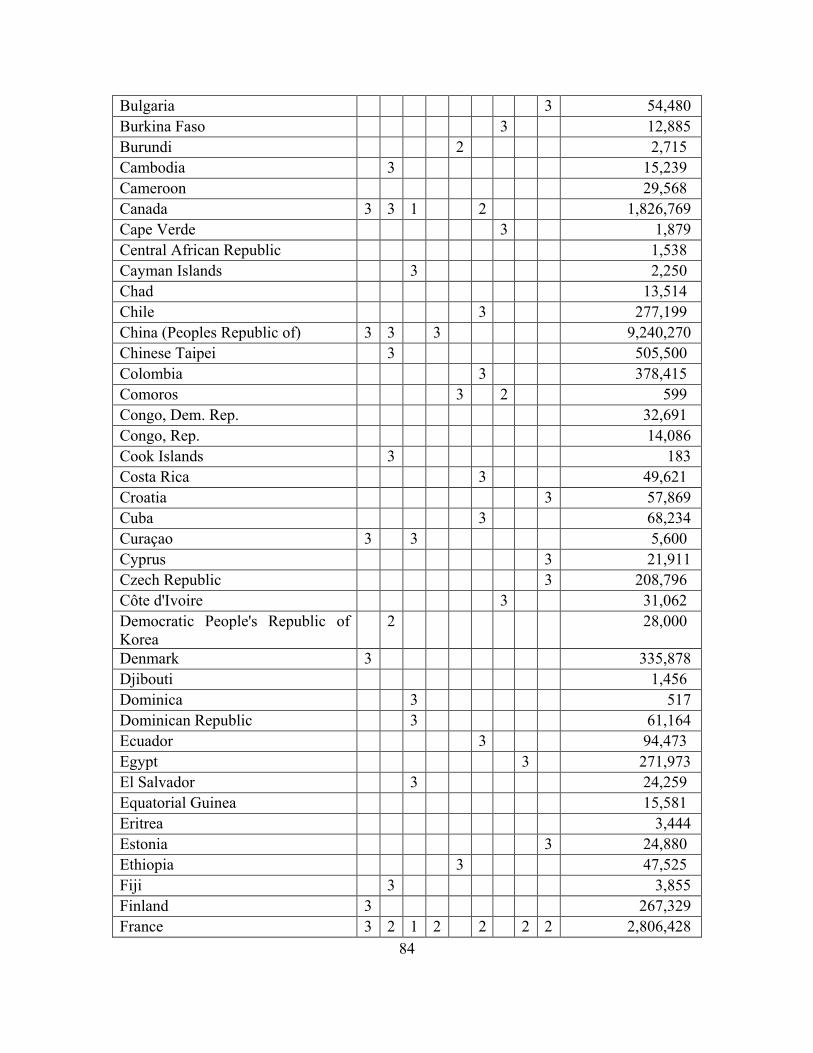
84
Bulgaria 3 54,480 Burkina Faso 3 12,885 Burundi 2 2,715 Cambodia 3 15,239 Cameroon 29,568 Canada 3 3 1 2 1,826,769 Cape Verde 3 1,879 Central African Republic 1,538 Cayman Islands 3 2,250 Chad 13,514 Chile 3 277,199 China (Peoples Republic of) 3 3 3 9,240,270 Chinese Taipei 3 505,500 Colombia 3 378,415 Comoros 3 2 599 Congo, Dem. Rep. 32,691 Congo, Rep. 14,086 Cook Islands 3 183 Costa Rica 3 49,621 Croatia 3 57,869 Cuba 3 68,234 Curaçao 3 3 5,600 Cyprus 3 21,911 Czech Republic 3 208,796 Côte d'Ivoire 3 31,062 Democratic People's Republic of Korea
2 28,000
Denmark 3 335,878 Djibouti 1,456 Dominica 3 517 Dominican Republic 3 61,164 Ecuador 3 94,473 Egypt 3 271,973 El Salvador 3 24,259 Equatorial Guinea 15,581 Eritrea 3,444 Estonia 3 24,880 Ethiopia 3 47,525 Fiji 3 3,855 Finland 3 267,329 France 3 2 1 2 2 2 2 2,806,428
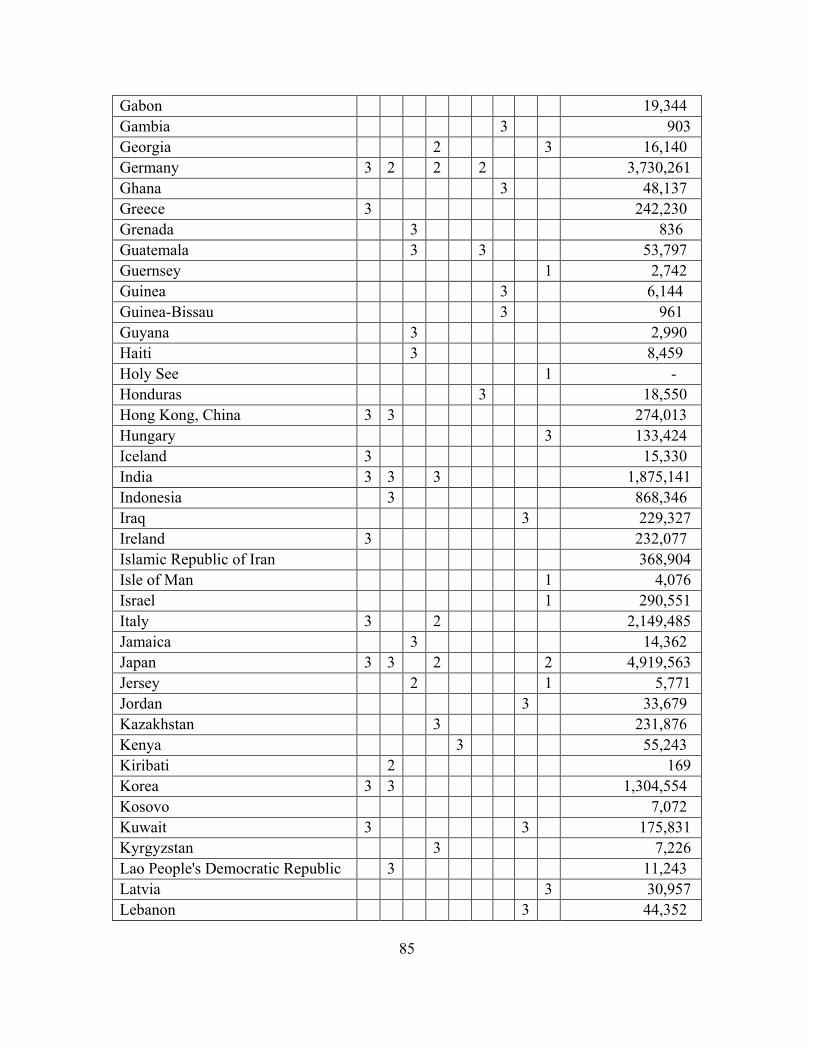
85
Gabon 19,344 Gambia 3 903 Georgia 2 3 16,140 Germany 3 2 2 2 3,730,261 Ghana 3 48,137 Greece 3 242,230 Grenada 3 836 Guatemala 3 3 53,797 Guernsey 1 2,742 Guinea 3 6,144 Guinea-Bissau 3 961 Guyana 3 2,990 Haiti 3 8,459 Holy See 1 - Honduras 3 18,550 Hong Kong, China 3 3 274,013 Hungary 3 133,424 Iceland 3 15,330 India 3 3 3 1,875,141 Indonesia 3 868,346 Iraq 3 229,327 Ireland 3 232,077 Islamic Republic of Iran 368,904 Isle of Man 1 4,076 Israel 1 290,551 Italy 3 2 2,149,485 Jamaica 3 14,362 Japan 3 3 2 2 4,919,563 Jersey 2 1 5,771 Jordan 3 33,679 Kazakhstan 3 231,876 Kenya 3 55,243 Kiribati 2 169 Korea 3 3 1,304,554 Kosovo 7,072 Kuwait 3 3 175,831 Kyrgyzstan 3 7,226 Lao People's Democratic Republic 3 11,243 Latvia 3 30,957 Lebanon 3 44,352
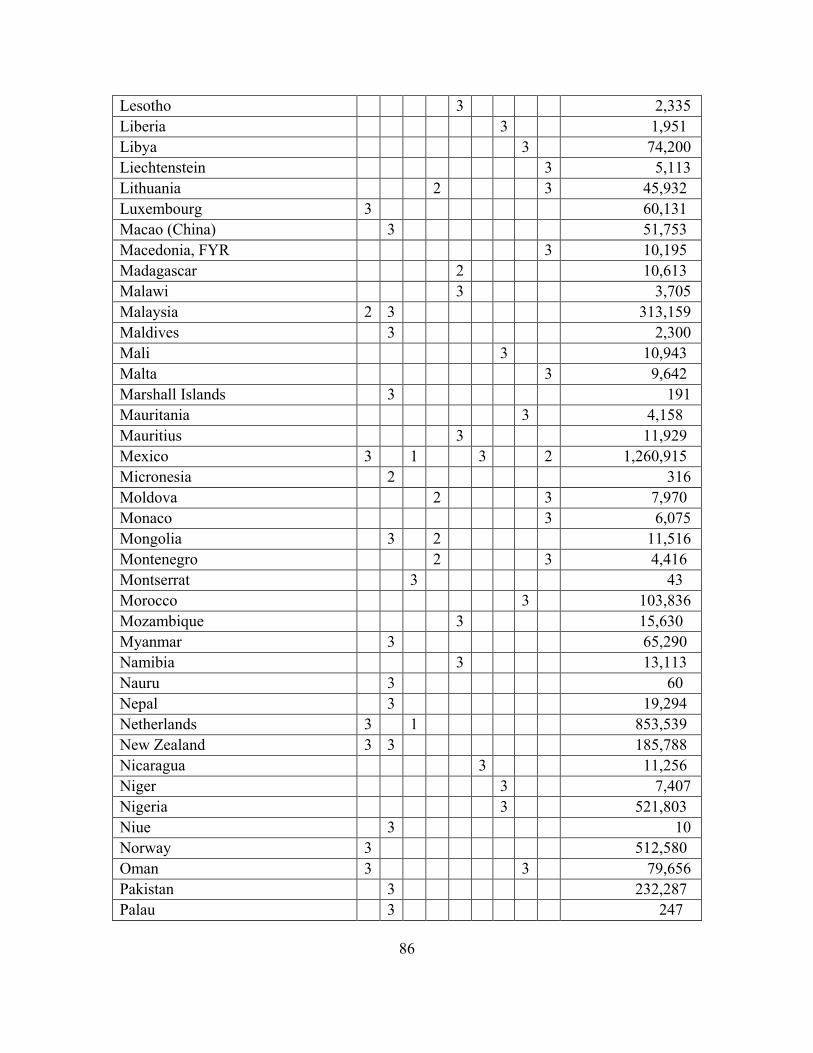
86
Lesotho 3 2,335 Liberia 3 1,951 Libya 3 74,200 Liechtenstein 3 5,113 Lithuania 2 3 45,932 Luxembourg 3 60,131 Macao (China) 3 51,753 Macedonia, FYR 3 10,195 Madagascar 2 10,613 Malawi 3 3,705 Malaysia 2 3 313,159 Maldives 3 2,300 Mali 3 10,943 Malta 3 9,642 Marshall Islands 3 191 Mauritania 3 4,158 Mauritius 3 11,929 Mexico 3 1 3 2 1,260,915 Micronesia 2 316 Moldova 2 3 7,970 Monaco 3 6,075 Mongolia 3 2 11,516 Montenegro 2 3 4,416 Montserrat 3 43 Morocco 3 103,836 Mozambique 3 15,630 Myanmar 3 65,290 Namibia 3 13,113 Nauru 3 60 Nepal 3 19,294 Netherlands 3 1 853,539 New Zealand 3 3 185,788 Nicaragua 3 11,256 Niger 3 7,407 Nigeria 3 521,803 Niue 3 10 Norway 3 512,580 Oman 3 3 79,656 Pakistan 3 232,287 Palau 3 247
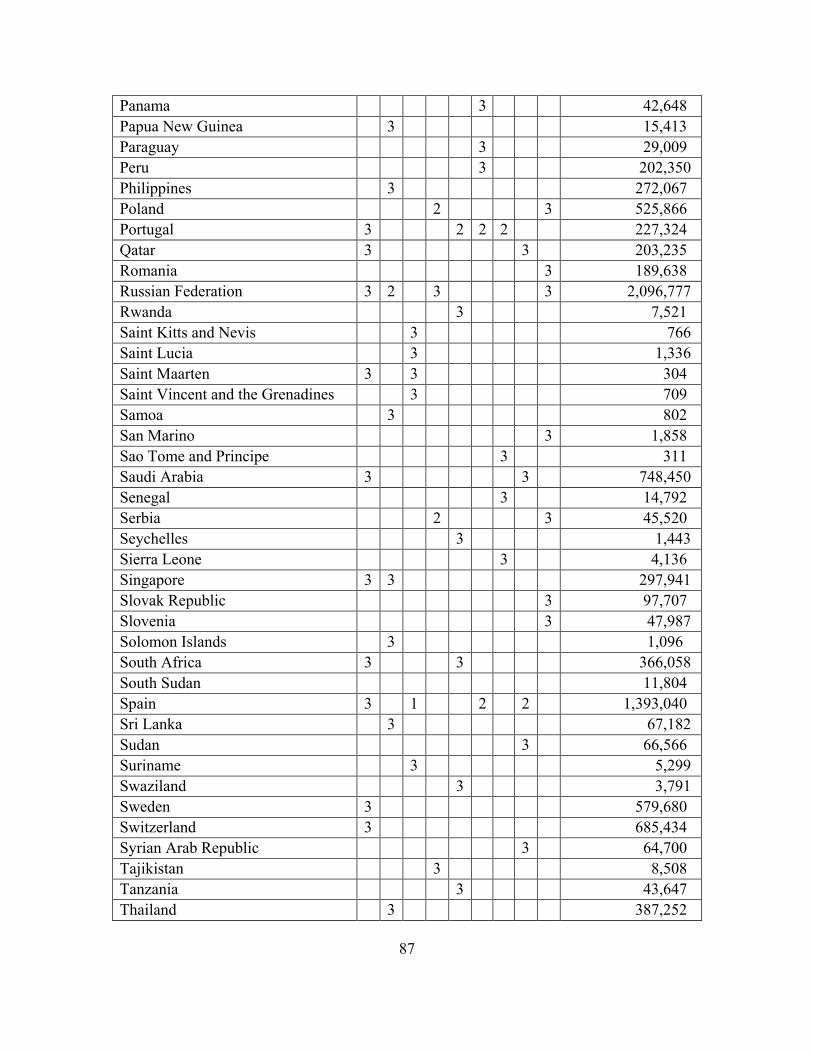
87
Panama 3 42,648 Papua New Guinea 3 15,413 Paraguay 3 29,009 Peru 3 202,350 Philippines 3 272,067 Poland 2 3 525,866 Portugal 3 2 2 2 227,324 Qatar 3 3 203,235 Romania 3 189,638 Russian Federation 3 2 3 3 2,096,777 Rwanda 3 7,521 Saint Kitts and Nevis 3 766 Saint Lucia 3 1,336 Saint Maarten 3 3 304 Saint Vincent and the Grenadines 3 709 Samoa 3 802 San Marino 3 1,858 Sao Tome and Principe 3 311 Saudi Arabia 3 3 748,450 Senegal 3 14,792 Serbia 2 3 45,520 Seychelles 3 1,443 Sierra Leone 3 4,136 Singapore 3 3 297,941 Slovak Republic 3 97,707 Slovenia 3 47,987 Solomon Islands 3 1,096 South Africa 3 3 366,058 South Sudan 11,804 Spain 3 1 2 2 1,393,040 Sri Lanka 3 67,182 Sudan 3 66,566 Suriname 3 5,299 Swaziland 3 3,791 Sweden 3 579,680 Switzerland 3 685,434 Syrian Arab Republic 3 64,700 Tajikistan 3 8,508 Tanzania 3 43,647 Thailand 3 387,252
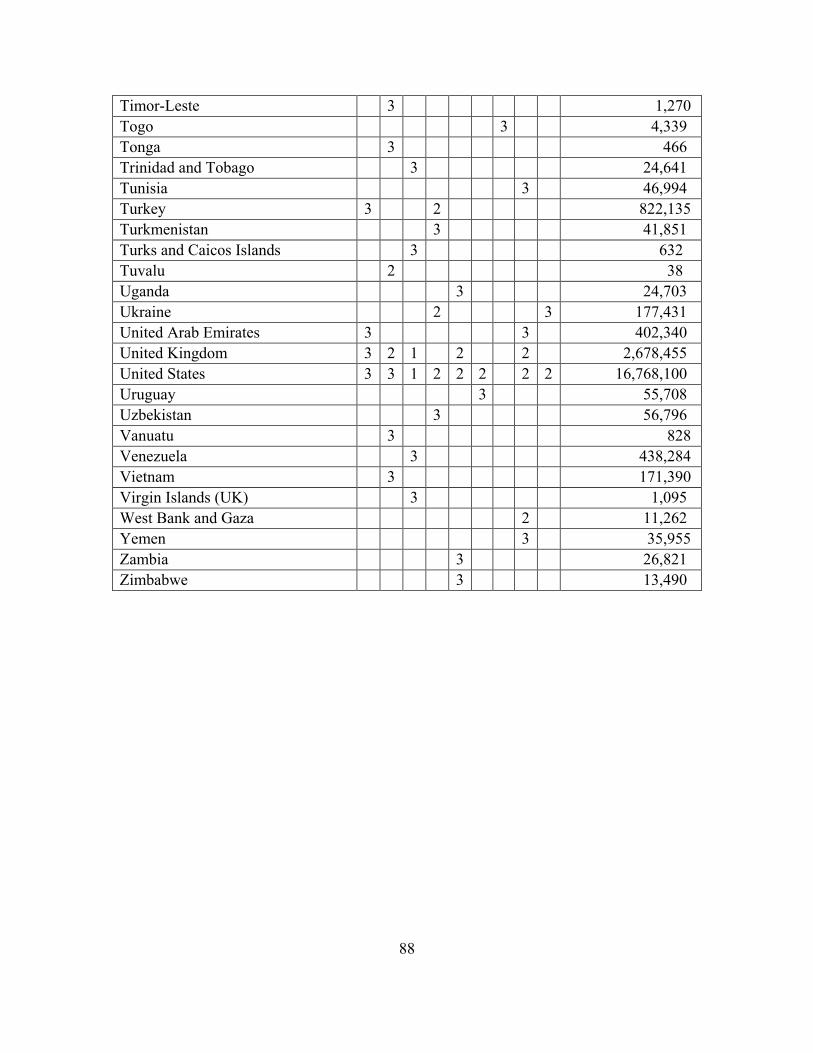
88
Timor-Leste 3 1,270 Togo 3 4,339 Tonga 3 466 Trinidad and Tobago 3 24,641 Tunisia 3 46,994 Turkey 3 2 822,135 Turkmenistan 3 41,851 Turks and Caicos Islands 3 632 Tuvalu 2 38 Uganda 3 24,703 Ukraine 2 3 177,431 United Arab Emirates 3 3 402,340 United Kingdom 3 2 1 2 2 2,678,455 United States 3 3 1 2 2 2 2 2 16,768,100 Uruguay 3 55,708 Uzbekistan 3 56,796 Vanuatu 3 828 Venezuela 3 438,284 Vietnam 3 171,390 Virgin Islands (UK) 3 1,095 West Bank and Gaza 2 11,262 Yemen 3 35,955 Zambia 3 26,821 Zimbabwe 3 13,490
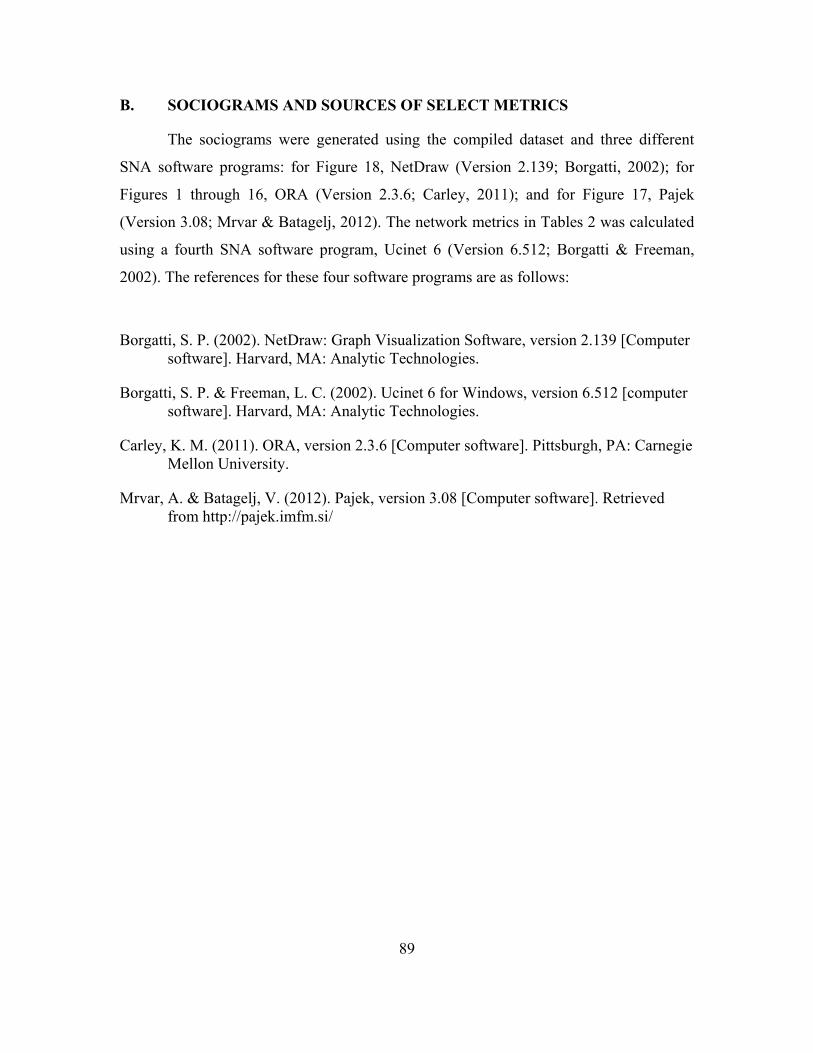
89
B. SOCIOGRAMS AND SOURCES OF SELECT METRICS
The sociograms were generated using the compiled dataset and three different
SNA software programs: for Figure 18, NetDraw (Version 2.139; Borgatti, 2002); for
Figures 1 through 16, ORA (Version 2.3.6; Carley, 2011); and for Figure 17, Pajek
(Version 3.08; Mrvar & Batagelj, 2012). The network metrics in Tables 2 was calculated
using a fourth SNA software program, Ucinet 6 (Version 6.512; Borgatti & Freeman,
2002). The references for these four software programs are as follows:
Borgatti, S. P. (2002). NetDraw: Graph Visualization Software, version 2.139 [Computer software]. Harvard, MA: Analytic Technologies.
Borgatti, S. P. & Freeman, L. C. (2002). Ucinet 6 for Windows, version 6.512 [computer software]. Harvard, MA: Analytic Technologies.
Carley, K. M. (2011). ORA, version 2.3.6 [Computer software]. Pittsburgh, PA: Carnegie Mellon University.
Mrvar, A. & Batagelj, V. (2012). Pajek, version 3.08 [Computer software]. Retrieved from http://pajek.imfm.si/

90
THIS PAGE INTENTIONALLY LEFT BLANK
91
LIST OF REFERENCES
About DGCX. (n.d.). Retrieved July 29, 2015, from http://www.dgcx.ae/index.php/en/home-1/about-dgcx
About the Great Lakes Region. (n.d.). Retrieved August 2, 2015, from http://www.state.gov/s/greatlakes_drc/191417.htm
About MENAFATF: Members and observers. (n.d.). Retrieved May 30, 2015, from http://menafatf.org/topiclist.asp?ctype=about&id=430
Accreditation initiatives. (n.d.). Retrieved July 29, 2015, from http://www.dmcc.ae/gold-dubai-good-delivery
Acosta, J. (2014, March 24). U.S., other powers kick Russia out of G8. CNN. Retrieved September 1, 2015, from http://www.cnn.com/2014/03/24/politics/obama-europe-trip/
Afonso, S. (2015, February 11). India smugglers, and their bodies, take a break from gold. Bloomberg. Retrieved August 8, 2015, from http://www.bloomberg.com/news/articles/2015-02-11/india-smugglers-and-their-bodies-take-a-break-from-gold
Artisanal gold mining. (n.d.). Retrieved July 25, 2015, from http://www.worstpolluted.org/projects_reports/display/56
Asfour, L. (2015, January 21). UAE still allowing trade in ‘conflict gold’. Al-Araby. Retrieved August 6, 2015, from http://www.alaraby.co.uk/english/news/2015/1/21/uae-still-allowing-trade-in-conflict-gold
Bafilemba, F. & Lezhnev, S. (2015). Congo’s conflict gold rush: Bringing gold into the legal trade in the Democratic Republic of the Congo [pdf report]. Washington, DC: The Enough Project. Retrieved from http://www.enoughproject.org/files/April 29 2015 Congo Conflict Gold Rush reduced.pdf
Bank Secrecy Act of 1970, Pub. L. No. 91-508 (1970). Retrieved from http://www.gpo.gov/fdsys/pkg/STATUTE-84/pdf/STATUTE-84-Pg1114-2.pdf
Bariyo, N., Freeman, F., & Pleven, L. (2013, April 14). Inside Congo’s link in the gold chain. The Wall Street Journal. Retrieved from http://www.wsj.com
Blacksmith Institute. (2010, January 13). Mercury: The burning issue (part 1) [Video file]. Retrieved from https://www.youtube.com/watch?v=FIbhwaw5PQg
92
Borgatti, S. P. (2002). NetDraw: Graph Visualization Software, version 2.139 [Computer software]. Harvard, MA: Analytic Technologies.
Borgatti, S. P. (2007). Multidimensional scaling [web document]. Retrieved from http://www.analytictech.com/borgatti/mds.htm
Borgatti, S. P. & Freeman, L. C. (2002). Ucinet 6 for Windows, version 6.512 [Computer software]. Harvard, MA: Analytic Technologies.
Bowers, S. (2014, February 25). Billion dollar gold market in Dubai where not all was as it seemed. The Guardian. Retrieved August 6, 2015, from http://www.theguardian.com/business/2014/feb/25/billion-dollar-gold-market-dubai-kaloti
Burt, R. S. (1992). The social structure of competition. In N. Nohria & R. G. Eccles (Eds.), Networks and organizations: Structure, form, and actions (pp. 57–91). Boston, MA: Harvard Business School Press.
CAR interim President Michel Djotodia resigns. (2014, January 11). BBC. Retrieved August 5, 2015, from http://www.bbc.com/news/world-africa-25683279
Carley, K. M. (2011). ORA, version 2.3.6 [Computer software]. Pittsburgh, PA: Carnegie Mellon University.
Cassara, J. & Jorisch, A. (2010). On the trail of terror finance: What law enforcement officers need to know. Arlington, VA: Red Cell Publishing.
Central Bank of the United Arab Emirates. (2003). Hawala regulations system in the U.A.E. [PowerPoint press release]. Retrieved from http://www.centralbank.ae/en/pdf/amlscu/HawalaSystemEnglish-2005.pdf
Central Intelligence Agency. (2015a). Central African Republic. In The World Factbook. Retrieved from https://www.cia.gov/library/publications/resources/the-world-factbook/geos/ct.html
Central Intelligence Agency. (2015b). Democratic Republic of the Congo. In The World Factbook. Retrieved from https://www.cia.gov/library/publications/resources/the-world-factbook/geos/cg.html
Central Intelligence Agency. (2015c). Peru. In The World Factbook. Retrieved from https://www.cia.gov/library/publications/resources/the-world-factbook/geos/pe.html
Central Intelligence Agency. (2015d). United Arab Emirates. In The World Factbook. Retrieved from https://www.cia.gov/library/publications/resources/the-world-factbook/geos/ae.html
93
Christakis, N. & Fowler, J. (2009) Connected: The surprising power of our social networks and how they shape our lives. London, UK: Little, Brown and Company.
Clauset, A., Newman, M. E. J., & Moore, C. (2004). Finding community structure in very large networks. Phys. Rev. E 70, 066111. Retrieved from, http://dx.doi.org/10.1103/PhysRevE.70.066111
Clunan, A. L. (2007). U.S. and international responses to terrorist financing. In J. K. Giraldo, & H. A. Trinkunas (Eds.), Terrorism financing and state responses (pp. 260–281). Stanford, CA: Stanford University Press.
Council of Europe. (n.d.). Retrieved May 30, 2015, from http://www.coe.int/t/dghl/monitoring/moneyval/
Countries. (n.d.). Retrieved May 3, 2015, from http://www.fatf-gafi.org/pages/aboutus/membersandobservers/
Dembassa-Kette, C. (2014, August 22). Rebel-held mine collapses in Central African Republic, killing 25. Reuters. Retrieved August 5, 2015, from http://www.reuters.com/article/2014/08/22/us-centralafrica-mine-idUSKBN0GM0Q420140822
Democratic Peoples’ Republic of Korea. (n.d.). Retrieved September 1, 2015, from http://apgml.org/members-and-observers/observers/details.aspx?o=4efd25ce-b7f3-4bc1-9c18-5598fa8b8cf5
Department of Defense. (2012, November 16). DOD counter threat finance (CTF) policy (DOD Directive 5205.14). Washington, DC: Author.
Department of State. (2015). Money laundering and financial crimes country database (June 2015) [pdf database and report]. Washington, DC: Bureau for International Narcotics and Law Enforcement Affairs. Retrieved from http://www.state.gov/documents/organization/211396.pdf
Department of the Treasury. (2015). National terrorist financing risk assessment 2015 [pdf report]. Retrieved from http://www.treasury.gov/resource-center/terrorist-illicit-finance/Documents/National Terrorist Financing Risk Assessment %E2%80%93%2006-12-2015.pdf
DMCC—who we are. (n.d.). Retrieved July 28, 2015, from http://www.dmcc.ae/dmcc-who-we-are
Dodd-Frank Wall Street Reform and Consumer Protection Act of 2010, Pub. L. No. 111–203 § 1502(a) (2010).
94
Dubai Gold Trade Statistics. (n.d.). Retrieved July 28, 2015, from http://www.dmcc.ae/dubai-gold-trade-statistics
Dubai Multi Commodities Centre. (2012). Practical guidance for market participants in the gold and precious metals industry [pdf report]. Retrieved from www.dmcc.ae/DMCC-Guidance-ENG.pdf?v=1
Dubai Multi Commodities Centre (2015). Active DGD gold members [pdf]. Retrieved July 29, 2015, from www.dmcc.ae/dgd-gold-members.pdf?v=1
Dube, R. & Kozak, R. (2014, April 21). Peru efforts to end illegal mining has some success. The Wall Street Journal. Retrieved August 9, 2015, from http://www.wsj.com/articles/SB10001424052702304279904579516100077000622
Eastern and Southern Africa Anti-Money Laundering Group. (n.d.). Retrieved May 30, 2015, from http://esaamlg.org/
Elbein, S. (2015, August 7). Poor enticed by gold and better life, leave behind environmental ruin. Mongabay.com. Retrieved, August 9, 2015, from http://news.mongabay.com/2015/08/poor-enticed-by-gold-and-better-life-leave-behind-environmental-ruin/
The Enough Project. (2014). Kony to LRA: Bring me ivory, gold, and diamonds. Retrieved from http://www.enoughproject.org/files/publications/LRA-Trafficking-Presser-Enough-TheResolve-InvisibleChildren-Nov2014.pdf
Enough Team. (2012). From child miner to jewelry store: The six steps of Congo’s conflict gold [pdf report]. Washington, DC: The Enough Project. Retrieved from http://www.enoughproject.org/files/Conflict-Gold.pdf
Ernst & Young. (2014). Peru’s mining & metals investment guide 2014/2015 [pdf report]. Retrieved from http://www.ey.com/Publication/vwLUAssets/EY-Peru-mining-metals-investment-guide-14-15/$FILE/EY-Peru-mining-and-metals-investment-guide-2014-2015.pdf
Eurasian Group on Combating Money Laundering and Financing of Terrorism. (n.d.). Retrieved May 30, 2015, from http://www.eurasiangroup.org/
Everton, S. F. (2012). Disrupting dark networks. Cambridge, UK: Cambridge University Press.
F.A.Q. (n.d.). Retrieved August 13, 2015, from http://www.fatf-gafi.org/pages/faq/moneylaundering/
Farah, D. (2001, November 2). Al Qaeda cash tied to diamond trade. The Washington Post. Retrieved from http://www.washingtonpost.com
95
Farah, D. (2002, February 17). Al Qaeda’s road paved with gold. The Washington Post. Retrieved from https://www.library.cornell.edu/colldev/mideast/qdagold.htm
Farah, D. (2004). Blood from stones: The secret financial network of terror. New York, NY: Broadway.
Farah, D. (2006, December 19). ARY gold and terrorist finance [Blog post]. Retrieved from http://blog.douglasfarah.com/article/50/ary-gold-and-terrorist-finance
FATF members and observers. (n.d.). Retrieved May 3, 2015, from http://www.fatf-gafi.org/pages/aboutus/membersandobservers/
Federal Law No. (4) of 2002 Regarding Criminalization of Money Laundering (2002) [U.A.E. law]. Retrieved from http://www.centralbank.ae/en/pdf/amlscu/Federal-Law-No.4-2002-English.pd
Felbab-Brown, V. (2010). Rules and regulations in ungoverned spaces. In A. L. Clunan and H. A. Trinkunas (Eds.), Ungoverned spaces: Alternatives to state authority in an era of softened sovereignty (pp. 175–192). Stanford, CA: Stanford University Press.
Financial Action Task Force. (2003). Report on money laundering typologies 2002–2003 [pdf report]. Retrieved from http://www.fatf-gafi.org/media/fatf/documents/reports/2002_2003_ML_Typologies_ENG.pdf
Financial Action Task Force. (2006). Third mutual evaluation report on anti-money laundering and combating the financing of terrorism: United States of America [pdf report]. Retrieved from http://www.fatf-gafi.org/media/fatf/documents/reports/mer/MER US full.pdf
Financial Action Task Force. (2008). RBA guidance for dealers in precious metal and stone [pdf report]. Retrieved from http://www.fatf-gafi.org/media/fatf/documents/reports/RBA for Dealers in Precious Metal and Stones.pdf
Financial Action Task Force. (2012). The FATF recommendations [pdf report]. Retrieved from http://www.fatf-gafi.org/media/fatf/documents/recommendations/pdfs/FATF_Recommendations.pdf
Financial Action Task Force. (n.d.). Retrieved July 10, 2015, from http://www.treasury.gov/resource-center/terrorist-illicit-finance/Pages/Financial-Action-Task-Force.aspx
Financial Action Task Force on Money Laundering in South America. (2011). Project on the designated non-financial businesses and professions: DNFBPs risk assessment in the GAFISUD Member States (GAFISUD 11/I GTCD 8) [pdf
96
report]. Retrieved from http://www.gafilat.org/UserFiles/documentos/en/cooperacion/DNFBPs_Risk_Assessment_in_the_GAFISUD_Member_States.pdf
Financial Crimes Enforcement Network, Department of the Treasury, 31 C.F.R. Chapter X (2015). Retrieved from http://www.ecfr.gov
Finnegan, W. (2015, April 20). Tears of the sun: The gold rush at the top of the world. The New Yorker. Retrieved from http://www.newyorker.com/magazine/2015/04/20/tears-of-the-sun
Fitch, A. (2014, February 26). Kaloti case lifts curtain on Dubai gold trade. The Wall Street Journal. Retrieved from http://www.blogs.wsj.com
Flynn, D. (2014, November 5). Gold, diamonds fueling conflict in Central African Republic: U.N. panel. Reuters. Retrieved August 5, 2015, from http://www.reuters.com/article/2014/11/05/us-centralafrica-un-panel-idUSKBN0IO21420141105
General Accounting Office. (2003). Terrorist financing: U.S. agencies should systematically assess terrorists’ use of alternative financing mechanisms (GAO-04-163). Washington, DC: Author. Retrieved from http://gao.gov/products/GAO-04-163.
General provisions, 31 C.F.R. § 1010 (2015). Retrieved from http://www.ecfr.gov
Giraldo, J. K. & Trinkunas, H. A. (Eds.) (2007). Terrorism financing and state responses. Stanford, CA: Stanford University Press.
Global Witness. (2014). City of gold: Why Dubai’s first conflict gold audit never saw the light of day [pdf report]. Retrieved from https://www.globalwitness.org/sites/default/files/library/dubai_gold_layout_lr.pdf
Good Delivery Rules. (n.d.). Retrieved July 28, 2015, from http://www.lbma.org.uk/good-delivery-rules
Granovetter, M. S. (1973). The strength of weak ties. The American Journal of Sociology, 78(6), pp. 1360–1380.
Gridneff, I. (2015, March 8). Blood gold flows illegally from Central African Republic. Bloomberg. Retrieved August 5, 2015, from http://www.bloomberg.com/news/articles/2015-03-08/blood-gold-exports-pour-illegally-from-central-african-republic
Group of Experts on the Democratic Republic of the Congo. (2015). Final report of the Group of Experts on the Democratic Republic of the Congo (S/2015/19). New York, NY: United Nations. Retrieved from
97
http://www.securitycouncilreport.org/atf/cf/%7B65BFCF9B-6D27-4E9C-8CD3-CF6E4FF96FF9%7D/s_2015_19.pdf
Immigration and Customs Enforcement. (2004). The Cornerstone Report, Vol I: No. 3, July 2004 [pdf report]. Retrieved from http://www.ice.gov/doclib/news/library/reports/cornerstone/cornerstone1-3.pdf
International Monetary Fund. (2014). Implementing AML/CFT measures in the precious minerals sector: Preventing crime while increasing revenue [pdf report]. Retrieved from http://www.imf.org/external/pubs/ft/tnm/2014/tnm1401a.pdf
Jamasmie, C. (2014, April 23). About 40,000 illegal miners ignore Peru’s deadline to formalize status. Mining.com. Retrieved August 9, 2015, from http://www.mining.com/about-40000-illegal-miners-ignore-perus-deadline-to-formalize-status-81664/
Kitidi, A. (2014, June 27). Thousands flee fresh violence in Central African Republic town of Bambari. The U.N. Refugee Agency. Retrieved August 5, 2015, from http://www.unhcr.org/53ad374c6.html
Klerks, P. (2001). The network paradigm applied to criminal organisations: Theoretical nitpicking or a relevant doctrine for investigators? Recent developments in the Netherlands. Connections. 24(3), pp. 53–65.
de Koning, R. (2011). Conflict minerals in the Democratic Republic of the Congo: Aligning trade and security interventions (Policy Paper 27) [pdf]. Retrieved from http://books.sipri.org/files/PP/SIPRIPP27.pdf
KPMG. (2013). Peru: Country mining guide [pdf report]. Retrieved from http://www.kpmg.com/PE/es/IssuesAndInsights/ArticlesPublications/Documents/Country-Mining-Guide-Peru.pdf
Krackhardt, D. (1992). The strength of strong ties: The importance of philos in organizations. In N. Nohria & R. G. Eccles (Eds.), Networks and organizations: Structure, form, and action (pp. 216–239). Boston, MA: Harvard Business School Press.
La Rinconada. (n.d.). In Wikipedia. Retrieved July 26, 2015 from https://en.wikipedia.org/wiki/La_Rinconada,_Peru
List of members. (n.d.). Retrieved September 1, 2015, from http://www.egmontgroup.org/membership/list-of-members
The London Bullion Market. (n.d.). Retrieved July 28, 2015 from http://www.lbma.org.uk/the-london-bullion-market
98
London Bullion Market Association. (2008). A guide to the London precious metals market [pdf]. Retrieved from http://www.lbma.org.uk/assets/market/OTCguide20081117.pdf
London Bullion Market Association. (2013). LBMA Responsible Gold Guidance [pdf]. Retrieved from http://www.lbma.org.uk/assets/market/gdl/RGG20130118_v5.pdf
London Bullion Market Association. (2015). A guide to the London Bullion Market Association [pdf report]. Retrieved from http://www.lbma.org.uk/assets/market/gdl/LBMA Brochure Final 20150501.pdf
London Bullion Market Association. (n.d.). Criteria for gold and silver refiners [pdf]. Retrieved July 28, 2015, from http://www.lbma.org.uk/assets/downloads/gooddelivery/Criteria for Gold and Silver Refiners.pdf
McAuley, A. (2015, April 13). DMCC removes Kaloti from Dubai Good Delivery list over gold sourcing. The National. Retrieved from http://thenational.ae
Mellgard, E. (2015, January 29). What is the Antibalaka? Tony Blair Faith Foundation. Retrieved August 5, 2015, from http://tonyblairfaithfoundation.org/religion-geopolitics/commentaries/backgrounder/what-antibalaka
Membership. (n.d.). Retrieved July 28, 2014, from http://www.lbma.org.uk/membership
Member countries. (n.d.). Retrieved May 30, 2015, from https://www.cfatf-gafic.org/index.php/member-countries
Members & observers. (n.d.). Retrieved May 30, 2015, from http://apgml.org/members-and-observers/page.aspx?p=8c32704a-5829-4671-873c-7b5a23ced347
Member states. (n.d.). Retrieved May 30, 2015, from http://www.giaba.org/member-states/index_653.html
Member states of the United Nations. (n.d.). Retrieved September 1, 2015, from http://www.un.org/en/members/
Meredith, M. (2011). The fate of Africa. New York, NY: PublicAffairs.
Middle East and North Africa Financial Action Task Force, Financial Action Task Force, & International Monetary Fund. (2008). Mutual evaluation report on anti-money laundering and combating the financing of terrorism: United Arab Emirates [pdf report]. Retrieved from http://www.fatf-gafi.org/media/fatf/documents/reports/mer/MER UAE full.pdf
Miembros. (n.d.). Retrieved May 30, 2015, from http://www.gafilat.org/content/observadores/
99
Milgram, S. (1967). The small-world problem. Psychology Today, 1, pp. 61–67.
Mining. (n.d.). Retrieved July 24, 2015, from http://www.goldfacts.org/en/supply_chain/mining/
Ministerio de Energía y Minas. (2013). Formalización de la minería a pequeña escala: Una oportunidad de progreso para todos [Peruvian government initiative, calendar, Spanish language]. Retrieved from http://www.responsiblemines.org/attachments/288_CALENDARIO2013 FORMALIZACION DE LA MINEROS ARTESANALES (2).pdf
MINUSCA Facts and Figures. (n.d.). Retrieved August 5, 2015, from http://www.un.org/en/ peacekeeping/missions/minusca/facts.shtml
Money Laundering Control Act of 1986, Pub. L. 99-570 Subtitle H (1986). Retrieved from www.gpo.gov/fdsys/pkg/STATUTE-100/pdf/STATUTE-100-Pg3207.pdf
Mrvar, A. & Batagelj, V. (2012). Pajek, version 3.08 [Computer software]. Retrieved from http://pajek.imfm.si/
National Commission on Terrorist Attacks upon the United States., Kean, T. H., & Hamilton, L. (2004). The 9/11 commission report: Final report of the National Commission on Terrorist Attacks upon the United States. Washington, D.C.: National Commission on Terrorist Attacks upon the United States.
O’Brien, T. L. (2003, October 5). U.S. focusing on Dubai as a terrorist financial center. The Washington Post. Retrieved from http://www.washingtonpost.com
Office of the High Commissioner for Human Rights. (2011). Guiding principles on business and human rights: Implementing the United Nations “protect, respect, and remedy” framework (HR/PUB/11/04). New York, NY & Geneva, Switzerland: Author. Retrieved from http://www.ohchr.org/Documents/Publications/GuidingPrinciplesBusinessHR_EN.pdf
Organisation for Economic Co-operation and Development. (2011). OECD guidelines for multinational enterprises: 2011 edition [pdf report]. Paris, France: Author. Retrieved from http://dx.doi.org/10.1787/9789264115415-en
Organisation for Economic Co-operation and Development. (2013). OECD due diligence guidance for responsible supply chains of minerals from conflict-affected and high-risk areas: Second edition [pdf report]. Paris, France: Author. Retrieved from http://dx.doi.org/10.1787/9789264185050-en
Our Members. (n.d.). Retrieved July 11, 2015, from http://www.gold.org/about-us/our-members
100
Panel of Experts on the Central African Republic. (2014). Final report of the Panel of Experts on the Central African Republic established pursuant to Security Council resolution 2127 (2013) (S/2014/762). New York, NY: United Nations. Retrieved from http://www.un.org/ga/search/view_doc.asp?symbol=S/2014/762
PricewaterhouseCoopers. (2013a). The direct economic impact of gold [pdf report]. Retrieved from http://www.gold.org/sites/default/files/documents/PWC_direct_economic_impact_of_gold.pdf
PricewaterhouseCoopers. (2013b). Doing business in Peru: Mining industry 2013 [pdf report]. Retrieved from http://www.pwc.com/pe/es/doing-business/assets/pwc-doing-business-mining-2013.pdf
Ray, S. (2014, March 14). Why gold smuggling is on the rise in India. BBC. Retrieved from http://www.bbc.com
Refining. (n.d.). Retrieved July 24, 2015, from http://www.goldfacts.org/en/supply_chain/refining/
Responsible Jewellery Council. (2013). Code of Practices [pdf]. Retrieved from http://www.responsiblejewellery.com/files/RJC_Code_of_Practices_2013_eng.pdf
Rules for dealers in precious metals, precious stones, or jewels, 31 C.F.R. § 1027 (2015). Retrieved from http://www.ecfr.gov
Security Council. (2014). Resolution 2147 (S/RES/2147). New York, NY: United Nations. Retrieved from http://monusco.unmissions.org/Portals/monuc/Document/280314 MONUSCO adopted res (E) 2147.pdf
Security Council. (2015). Resolution 2217 (S/RES/2217). New York, NY: United Nations. Retrieved from http://www.un.org/en/ga/search/view_doc.asp?symbol=S/RES/2217(2015)
Security Council Committee concerning the Central African Republic. (2015). The list established and maintained by the 2127 (2003) committee [U.N. sanctions list]. Retrieved 25 August, 2015, from http://www.un.org/sc/committees/2127/2127.pdf
Security Council Committee concerning the Democratic Republic of the Congo. (2015). The list established and maintained by the 1533 (2004) committee [U.N. sanctions list]. Retrieved 25 August, 2015, from http://www.un.org/sc/committees/1533/pdf/1533.pdf
SGS United Kingdom Ltd. (2014). Comparative analysis of the DMCC responsible sourcing guidance and other relevant initiatives [pdf report, audit]. Retrieved
101
from www.dmcc.ae/SGSDMCC-Comparative-Analysis-Report-V2Aug2014.pdf?v=2
Sharma, M. & Das, K. N. (2015, February 28). India to launch gold accounts, keep import duty at record high. Reuters India. Retrieved August 8, 2015, from http://in.reuters.com/article/2015/02/28/india-budget-gold-idINKBN0LW0A720150228
Shelley, L. I. (2014). Dirty entanglements: Corruption, crime, and terrorism. Cambridge, England: Cambridge University Press.
Shumsky, T. & Mukherji, B. (2015, March 2). India’s failure to cut import duty on gold hurts prices. The Wall Street Journal. Retrieved from http://wsj.com
Sloan, A. (2014, November 24). Gold smuggling increases to beat new tariffs. Middle East Monitor. Retrieved August 8, 2015, from https://www.middleeastmonitor.com/articles/middle-east/15422-gold-smuggling-increases-to-beat-new-tariffs
Superintendent of Banking, Insurance, and Private Pension Funds. (2011). National plan for fighting money laundering and terrorist financing [Peruvian national plan]. Retrieved from http://www.sbs.gob.pe/repositorioaps/0/2/jer/ala_cft_eng/AML_CFT_National_Plan.pdf
Supreme Decree No. 057-2011-PCM (2011) [Peruvian law, Spanish language]. Retrieved from http://www.sbs.gob.pe/repositorioaps/0/2/jer/ala_cft_esp/DS_Plan_Nacional.pdf
Union Law No. (10) of 1980 Concerning the Central Bank, the Monetary System and Organization of Banking (1980) [U.A.E. law]. Retrieved from http://www.centralbank.ae/en/pdf/Law-10-English.pdf
United Nations. (1945). The charter of the United Nations. San Francisco, CA: Author.
United Nations Environment Programme. (2009). From conflict to peacebuilding: The role of natural resources and the environment [pdf report]. Nairobi, Kenya: Author. Retrieved from http://postconflict.unep.ch/publications/pcdmb_policy_01.pdf
United Nations Office on Drugs and Crime. (2011). Estimating illicit financial flows resulting from drug trafficking and other transnational organized crimes [pdf research report]. Vienna: Author. Retrieved from http://www.unodc.org/documents/data-and-analysis/Studies/Illicit_financial_flows_2011_web.pdf
102
United States Geological Survey. (2014). 2012 Minerals yearbook: India (advance release) [pdf report]. Washington, D.C.: Department of the Interior. Retrieved from http://minerals.usgs.gov/minerals/pubs/country/2012/myb3-2012-in.pdf
Uniting and Strengthening America by Providing Appropriate Tools Required to Intercept and Obstruct Terrorism Act of 2001, Pub. L. 107-56 (2001). Retrieved from http://www.gpo.gov/fdsys/pkg/PLAW-107publ56/pdf/PLAW-107publ56.pdf
Valencia, G. (2013, November 5). Formalizing the unknown: The stalemate over formalizing small-scale mining in Madre de Dios. The Broker. Retrieved from http://thebrokeronline.eu/Articles/Formalizing-the-unknown
Verité. (2012). Risk analysis of indicators of forced labor and human trafficking in illegal gold mining in Peru [pdf report]. Retrieved from http://www.verite.org/sites/default/files/images/Indicators of Forced Labor in Gold Mining in Peru_0.pdf
Verity, A. (2014, February 25). Gold market breaches ‘covered up’. BBC. Retrieved from http://www.bbc.com
White House. (2015). National security strategy. Retrieved from https://www.whitehouse.gov/sites/default/files/docs/2015_national_security_strategy.pdf
The World Bank. (2015a). GDP (current US$) [data set]. Retrieved August 13, 2015, from http://data.worldbank.org/indicator/NY.GDP.MKTP.CD
The World Bank. (2015b). Gross domestic product 2014 [pdf]. Retrieved May 3, 2015, from http://databank.worldbank.org/data/download/GDP.pdf
The World Bank. (2015c). India [data set]. Retrieved August 7, 2015, from http://datatopics. worldbank.org/financialinclusion/country/india
World Gold Council. (2012). Conflict-free gold standard [pdf report]. Retrieved from http://www.gold.org/sites/default/files/documents/Conflict_Free_Gold_Standard_English.pdf
World Gold Council. (2015). Gold demand trends: Full year 2014 [pdf report]. Retrieved from www.gold.org/download/file/3691/GDT_Q4_2014.pdf
103
INITIAL DISTRIBUTION LIST
1. Defense Technical Information Center Ft. Belvoir, Virginia 2. Dudley Knox Library Naval Postgraduate School Monterey, California