Embed Size (px)
Citation preview

2nd workshop with TA authoritiesIspra, November 24, 2016
Description ofWLTP/NEDC Correlation
Procedure
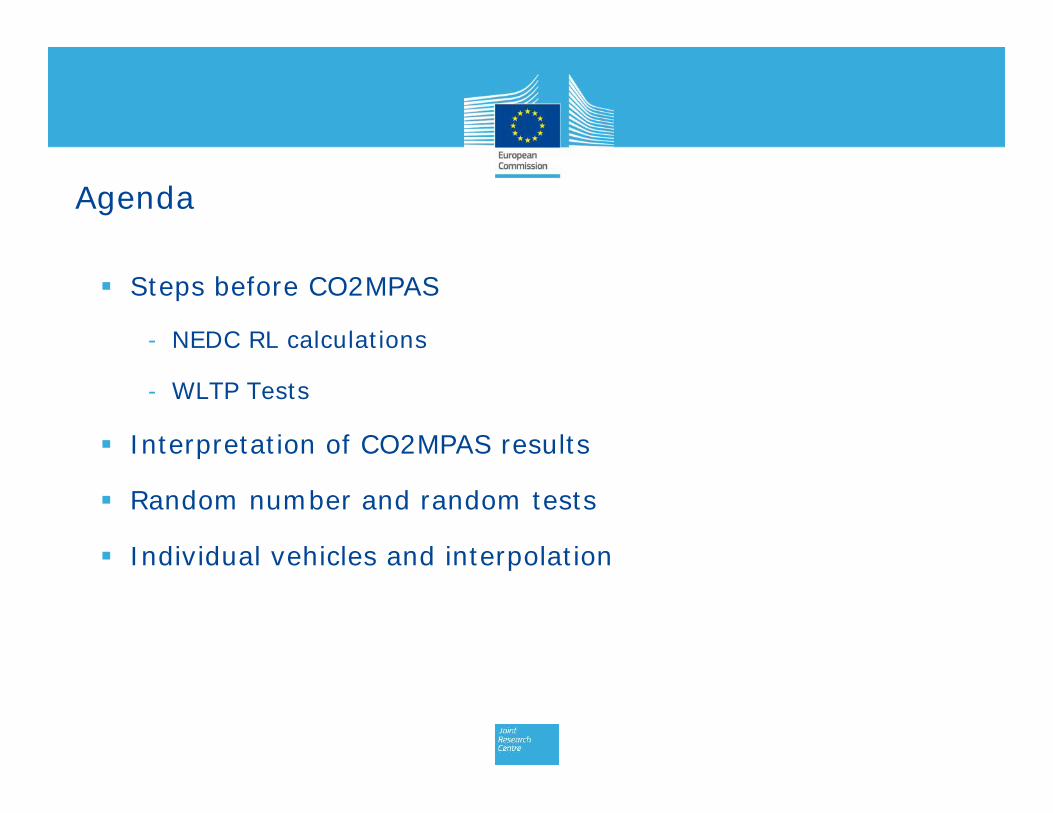
Agenda
Steps before CO2MPAS
- NEDC RL calculations
- WLTP Tests
Interpretation of CO2MPAS results
Random number and random tests
Individual vehicles and interpolation
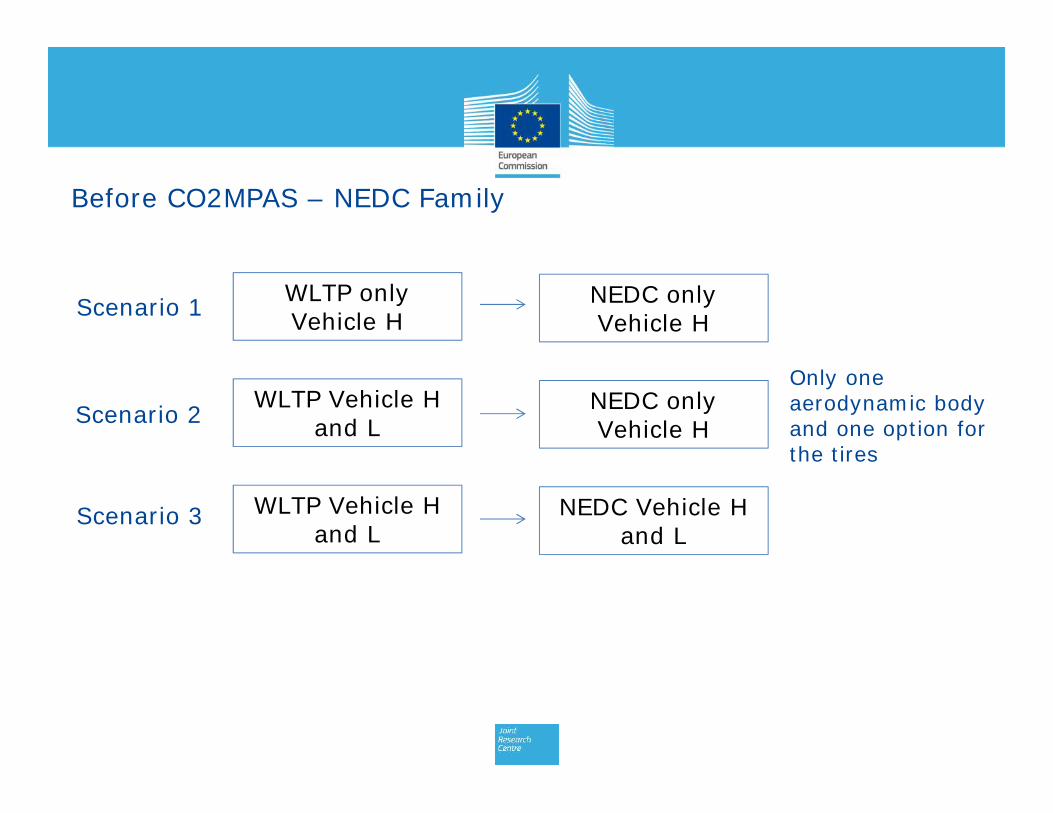
Before CO2MPAS – NEDC Family
WLTP onlyVehicle H
NEDC onlyVehicle HScenario 1
Scenario 2 WLTP Vehicle Hand L
NEDC onlyVehicle H
Scenario 3 WLTP Vehicle Hand L
NEDC Vehicle Hand L
Only oneaerodynamic bodyand one option forthe tires
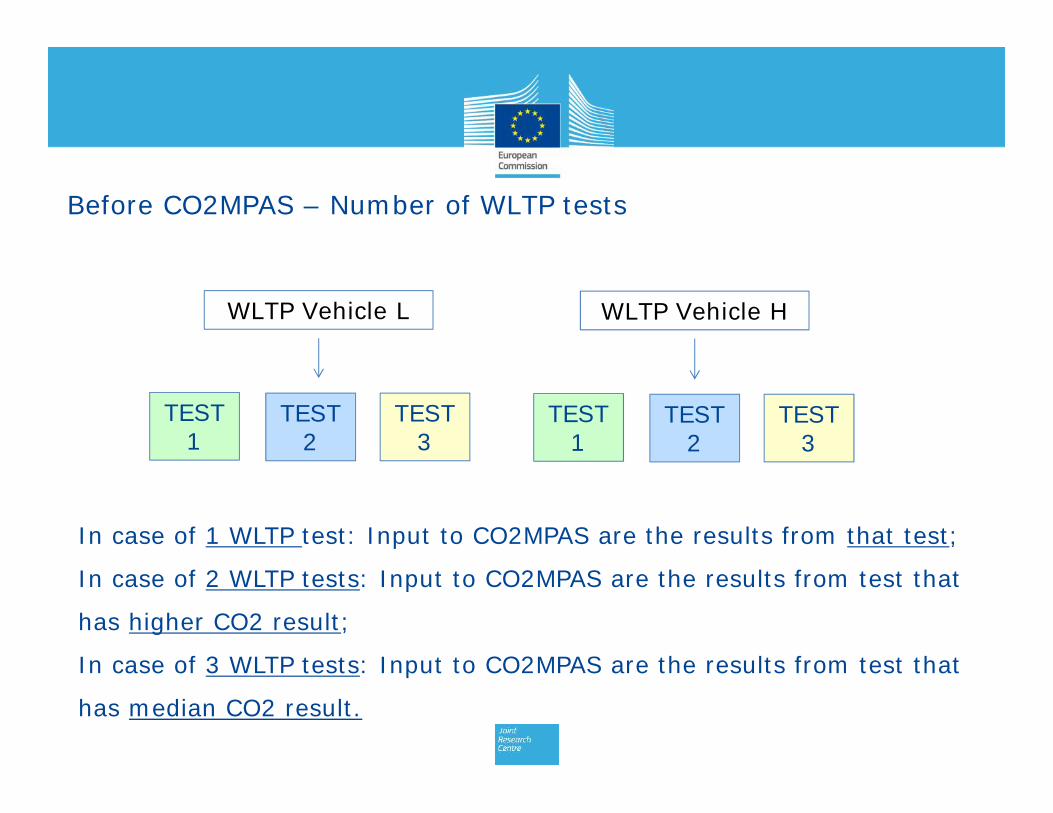
Before CO2MPAS – Number of WLTP tests
WLTP Vehicle L WLTP Vehicle H
In case of 1 WLTP test: Input to CO2MPAS are the results from that test;
In case of 2 WLTP tests: Input to CO2MPAS are the results from test that
has higher CO2 result;
In case of 3 WLTP tests: Input to CO2MPAS are the results from test that
has median CO2 result.
TEST1
TEST2
TEST3
TEST1
TEST2
TEST3
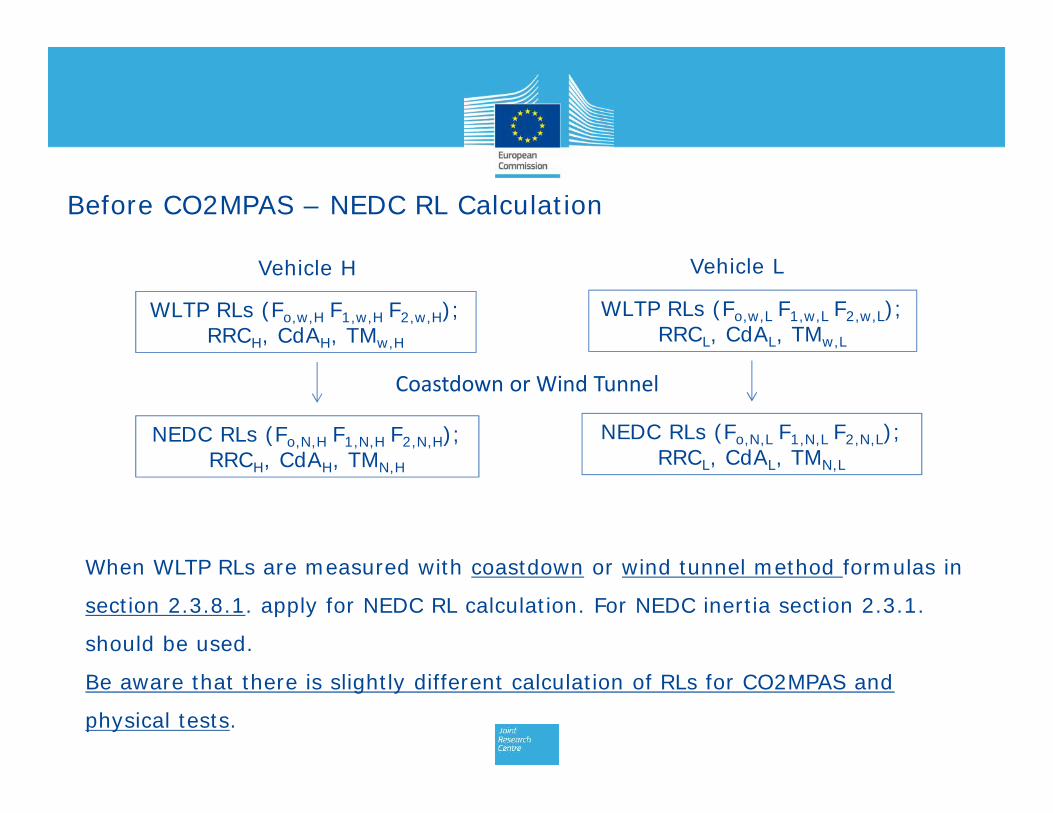
Before CO2MPAS – NEDC RL Calculation
When WLTP RLs are measured with coastdown or wind tunnel method formulas in
section 2.3.8.1. apply for NEDC RL calculation. For NEDC inertia section 2.3.1.
should be used.
Be aware that there is slightly different calculation of RLs for CO2MPAS and
physical tests.
WLTP RLs (Fo,w,H F1,w,H F2,w,H);RRCH, CdAH, TMw,H
WLTP RLs (Fo,w,L F1,w,L F2,w,L);RRCL, CdAL, TMw,L
Vehicle H Vehicle L
NEDC RLs (Fo,N,H F1,N,H F2,N,H);RRCH, CdAH, TMN,H
NEDC RLs (Fo,N,L F1,N,L F2,N,L);RRCL, CdAL, TMN,L
Coastdown or Wind Tunnel
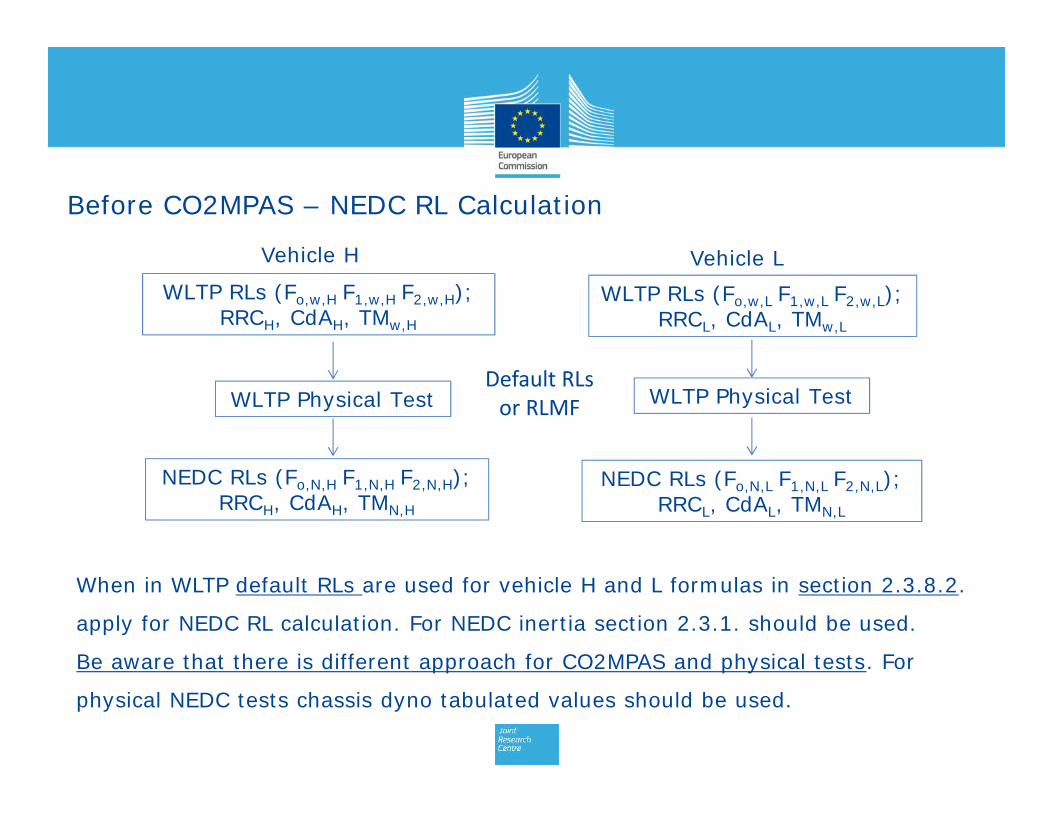
Before CO2MPAS – NEDC RL Calculation
When in WLTP default RLs are used for vehicle H and L formulas in section 2.3.8.2.
apply for NEDC RL calculation. For NEDC inertia section 2.3.1. should be used.
Be aware that there is different approach for CO2MPAS and physical tests. For
physical NEDC tests chassis dyno tabulated values should be used.
WLTP RLs (Fo,w,H F1,w,H F2,w,H);RRCH, CdAH, TMw,H
WLTP RLs (Fo,w,L F1,w,L F2,w,L);RRCL, CdAL, TMw,L
Vehicle H Vehicle L
NEDC RLs (Fo,N,H F1,N,H F2,N,H);RRCH, CdAH, TMN,H
NEDC RLs (Fo,N,L F1,N,L F2,N,L);RRCL, CdAL, TMN,L
WLTP Physical Test WLTP Physical TestDefault RLs
or RLMF
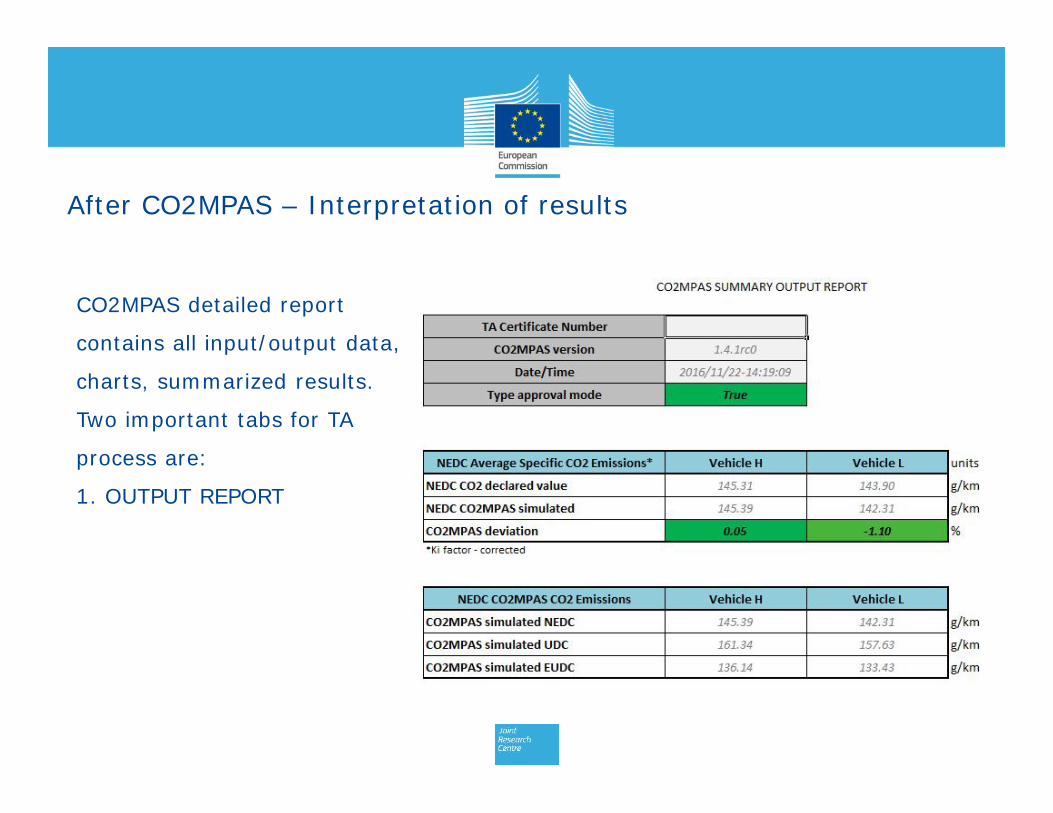
After CO2MPAS – Interpretation of results
CO2MPAS detailed report
contains all input/output data,
charts, summarized results.
Two important tabs for TA
process are:
1. OUTPUT REPORT
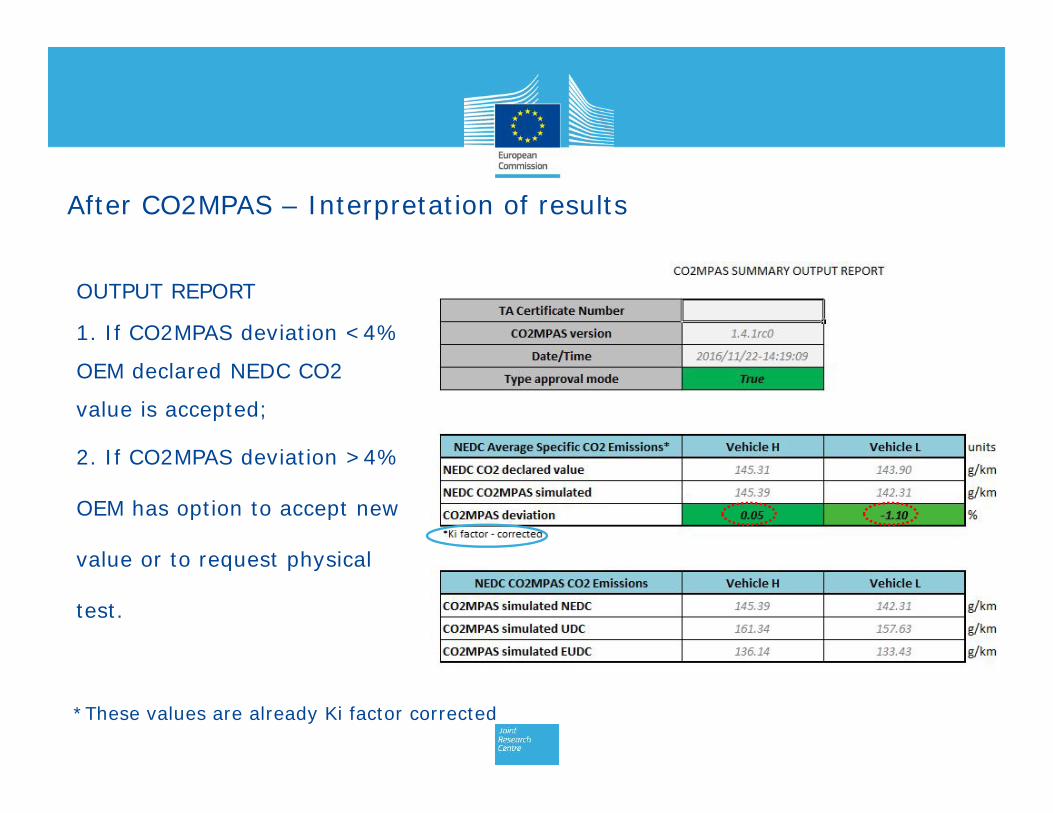
After CO2MPAS – Interpretation of results
OUTPUT REPORT
1. If CO2MPAS deviation <4%
OEM declared NEDC CO2
value is accepted;
2. If CO2MPAS deviation >4%
OEM has option to accept new
value or to request physical
test.
*These values are already Ki factor corrected
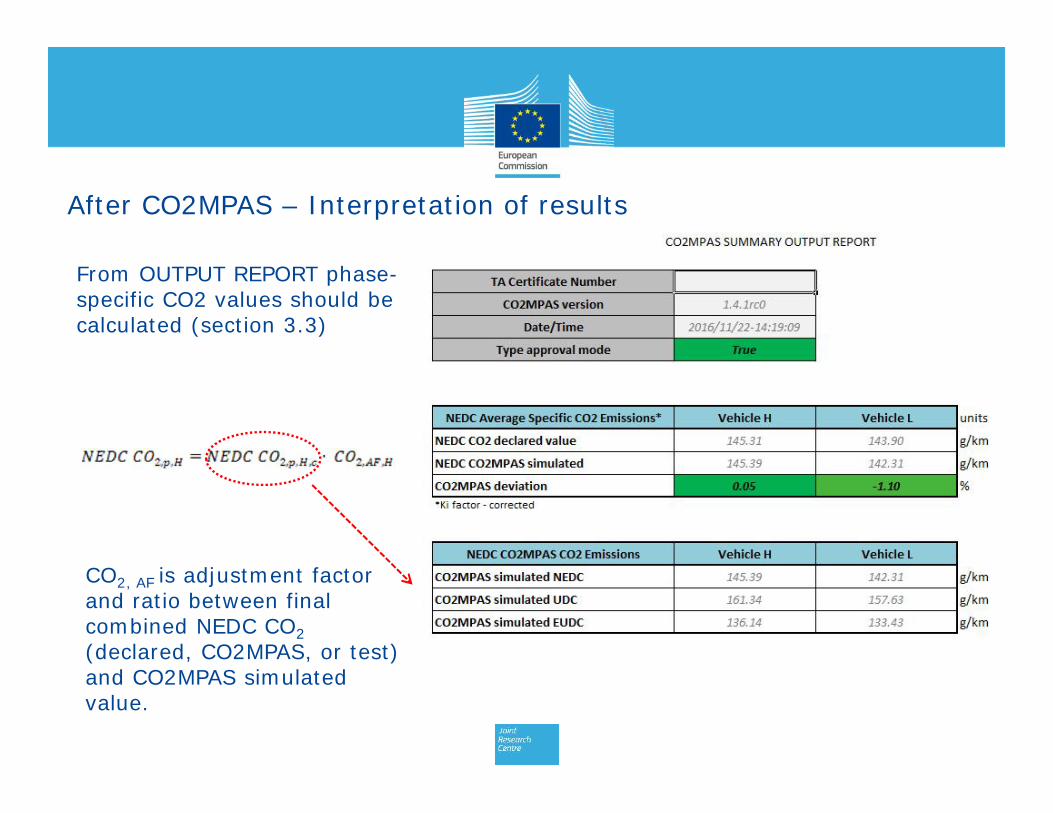
After CO2MPAS – Interpretation of results
From OUTPUT REPORT phase-specific CO2 values should becalculated (section 3.3)
CO2, AF is adjustment factorand ratio between finalcombined NEDC CO2(declared, CO2MPAS, or test)and CO2MPAS simulatedvalue.
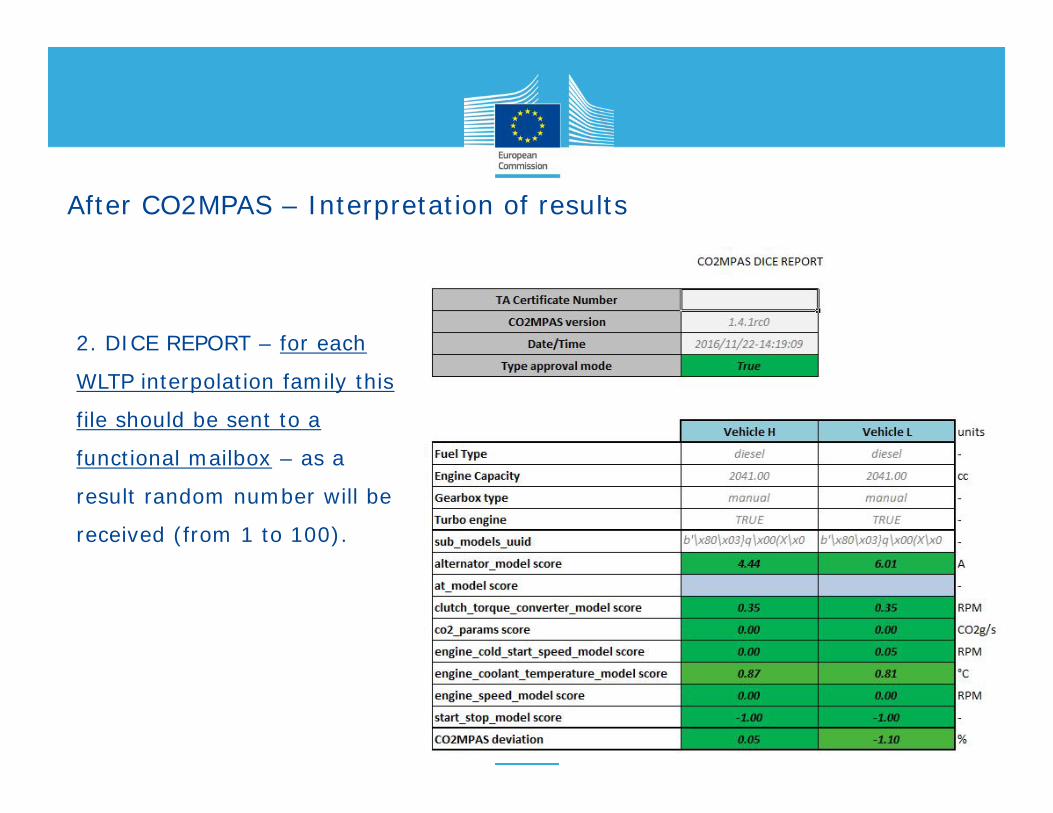
After CO2MPAS – Interpretation of results
2. DICE REPORT – for each
WLTP interpolation family this
file should be sent to a
functional mailbox – as a
result random number will be
received (from 1 to 100).
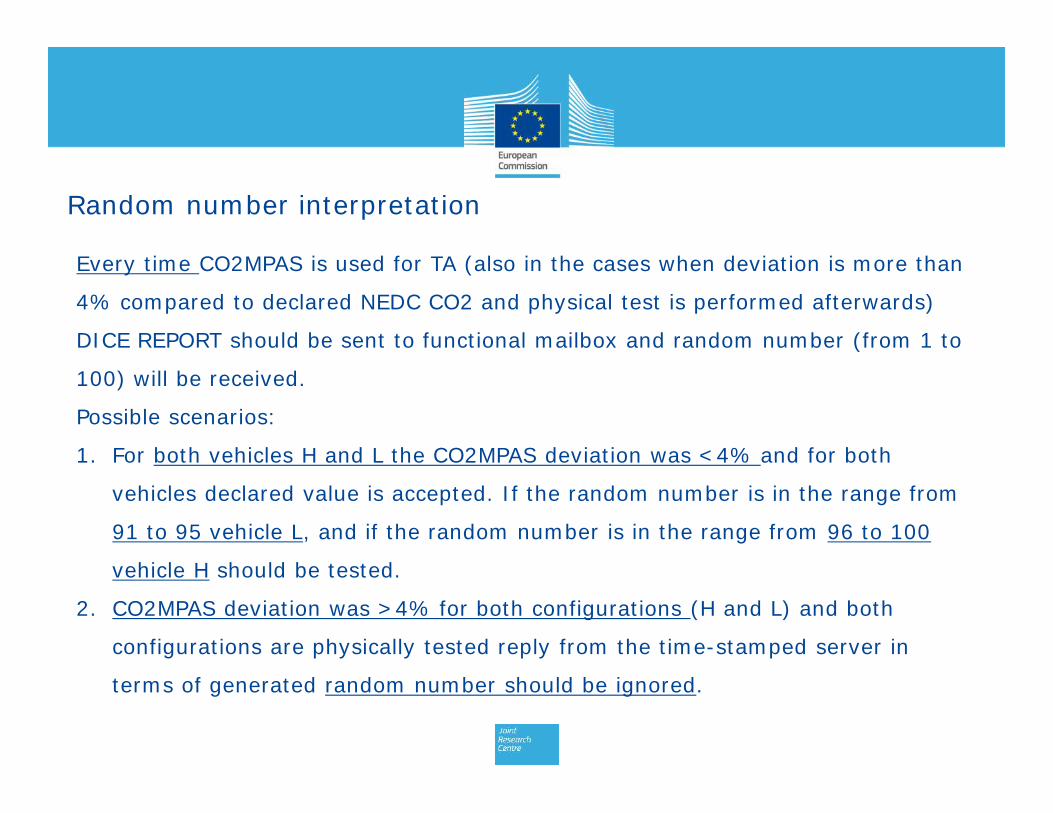
Random number interpretation
Every time CO2MPAS is used for TA (also in the cases when deviation is more than
4% compared to declared NEDC CO2 and physical test is performed afterwards)
DICE REPORT should be sent to functional mailbox and random number (from 1 to
100) will be received.
Possible scenarios:
1. For both vehicles H and L the CO2MPAS deviation was <4% and for both
vehicles declared value is accepted. If the random number is in the range from
91 to 95 vehicle L, and if the random number is in the range from 96 to 100
vehicle H should be tested.
2. CO2MPAS deviation was >4% for both configurations (H and L) and both
configurations are physically tested reply from the time-stamped server in
terms of generated random number should be ignored.
Random number interpretation
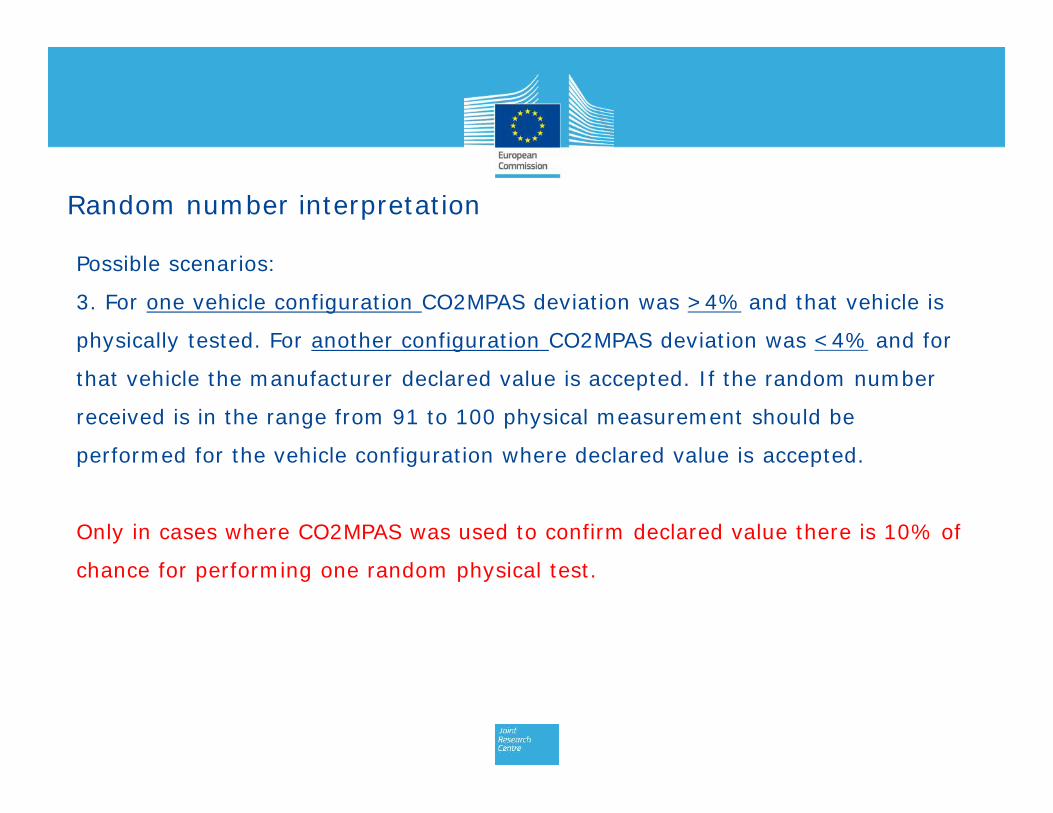
Possible scenarios:
3. For one vehicle configuration CO2MPAS deviation was >4% and that vehicle is
physically tested. For another configuration CO2MPAS deviation was <4% and for
that vehicle the manufacturer declared value is accepted. If the random number
received is in the range from 91 to 100 physical measurement should be
performed for the vehicle configuration where declared value is accepted.
Only in cases where CO2MPAS was used to confirm declared value there is 10% of
chance for performing one random physical test.
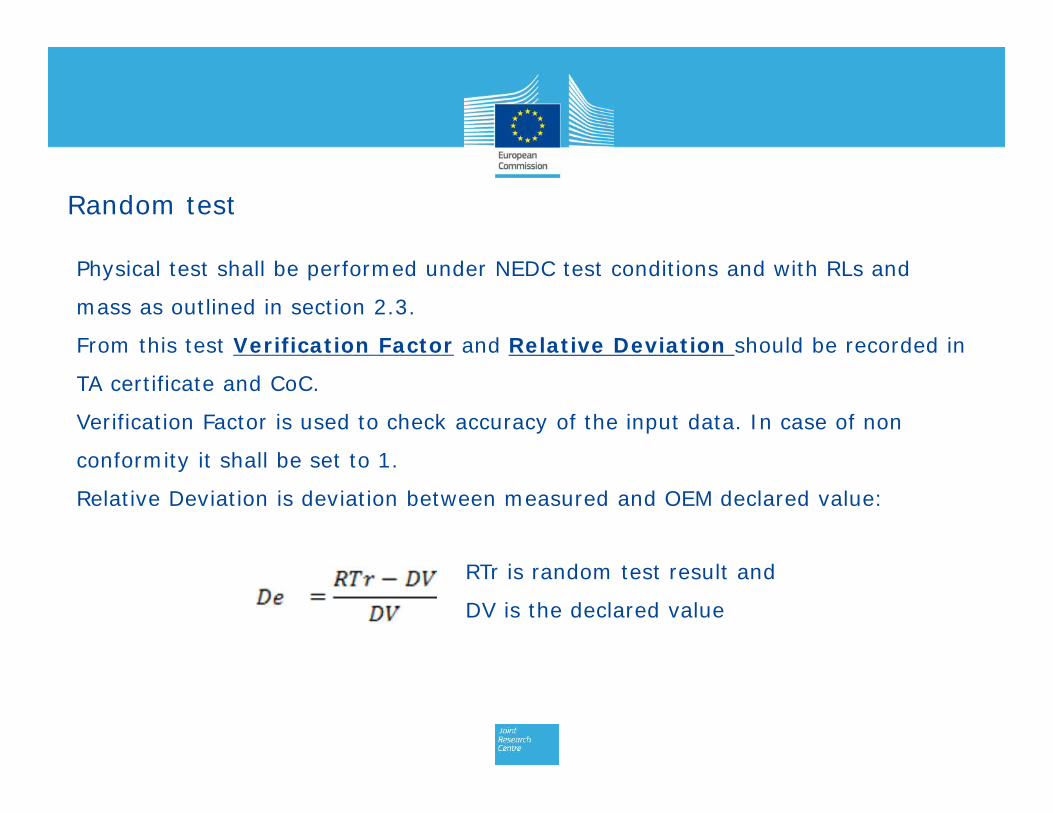
Random test
Physical test shall be performed under NEDC test conditions and with RLs and
mass as outlined in section 2.3.
From this test Verification Factor and Relative Deviation should be recorded in
TA certificate and CoC.
Verification Factor is used to check accuracy of the input data. In case of non
conformity it shall be set to 1.
Relative Deviation is deviation between measured and OEM declared value:
RTr is random test result and
DV is the declared value
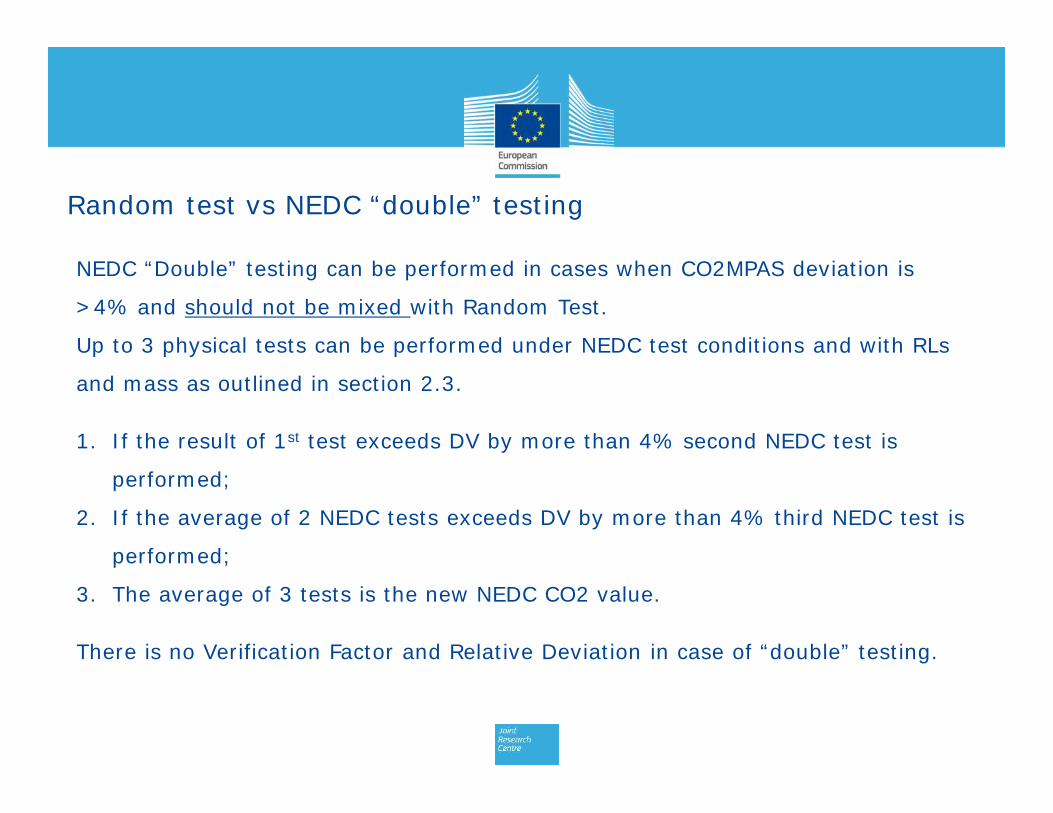
Random test vs NEDC “double” testing
NEDC “Double” testing can be performed in cases when CO2MPAS deviation is
>4% and should not be mixed with Random Test.
Up to 3 physical tests can be performed under NEDC test conditions and with RLs
and mass as outlined in section 2.3.
1. If the result of 1st test exceeds DV by more than 4% second NEDC test is
performed;
2. If the average of 2 NEDC tests exceeds DV by more than 4% third NEDC test is
performed;
3. The average of 3 tests is the new NEDC CO2 value.
There is no Verification Factor and Relative Deviation in case of “double” testing.
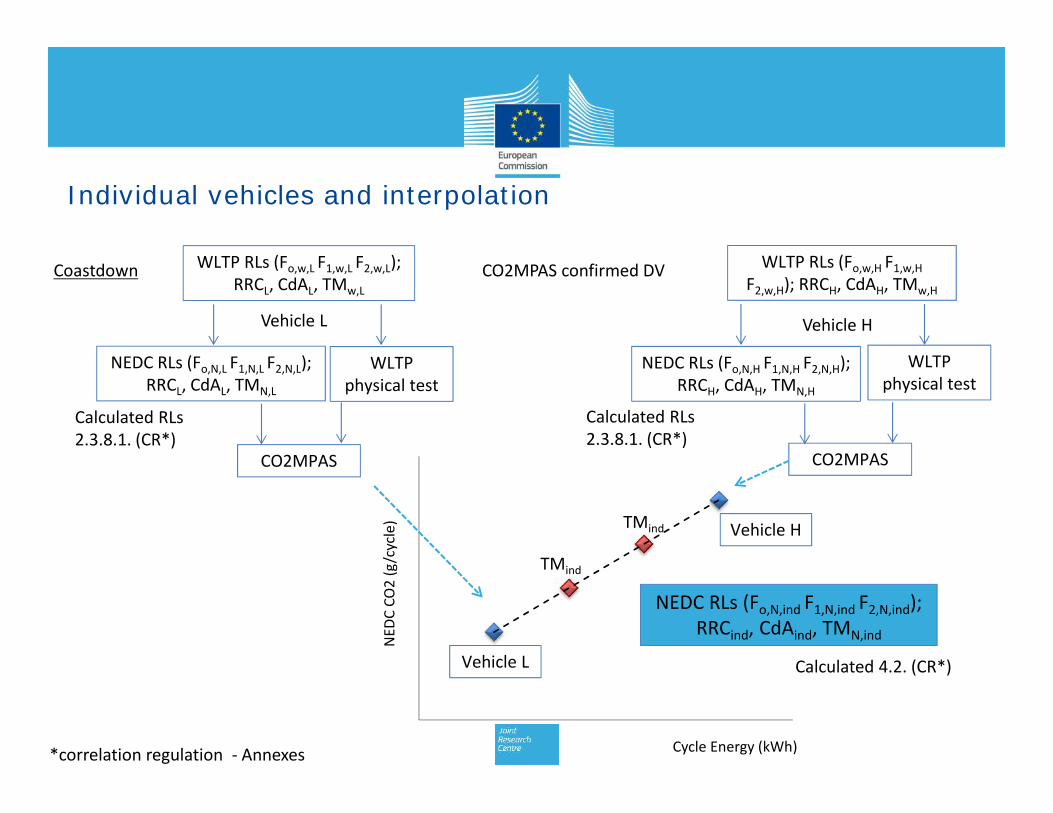
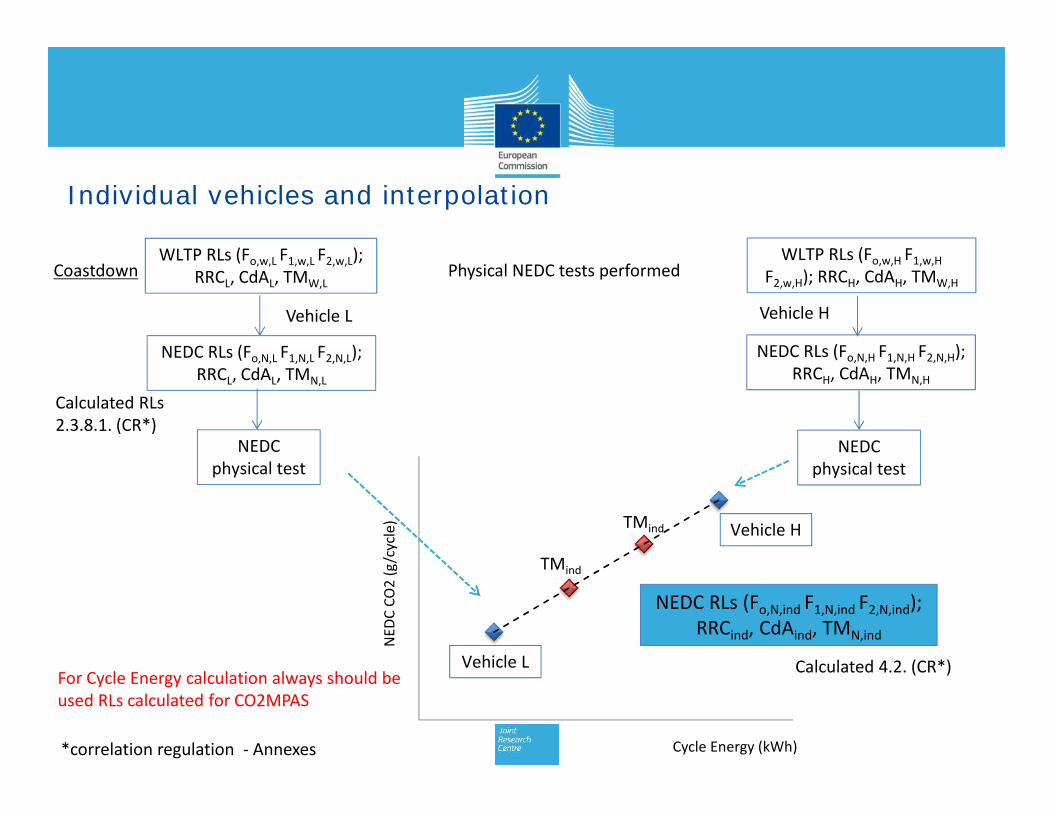
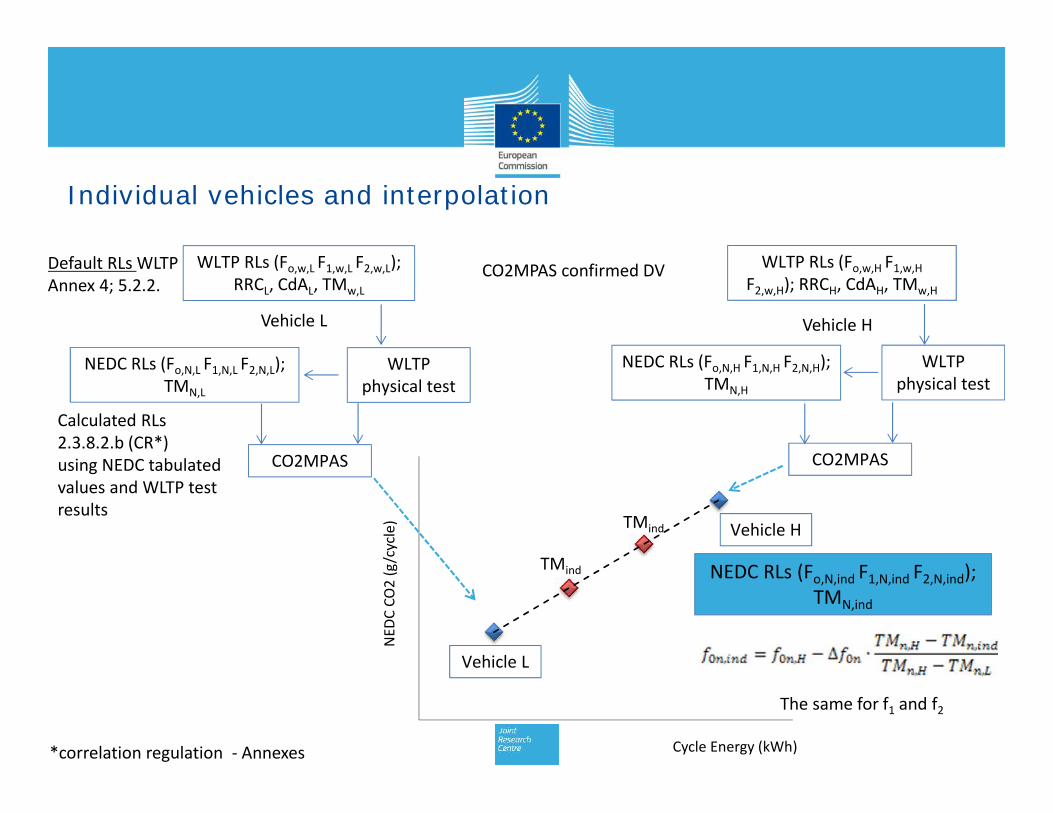
Individual vehicles and interpolation
Coastdown WLTP RLs (Fo,w,H F1,w,HF2,w,H); RRCH, CdAH, TMw,H
WLTP RLs (Fo,w,L F1,w,L F2,w,L);RRCL, CdAL, TMw,L
Vehicle HVehicle L
NEDC RLs (Fo,N,H F1,N,H F2,N,H);RRCH, CdAH, TMN,H
Calculated RLs2.3.8.1. (CR*)
WLTPphysical test
*correlation regulation - Annexes
NEDC RLs (Fo,N,L F1,N,L F2,N,L);RRCL, CdAL, TMN,L
WLTPphysical test
CO2MPAS CO2MPAS
TMind
TMind
NEDC
CO2
(g/c
ycle
)
Cycle Energy (kWh)
NEDC RLs (Fo,N,ind F1,N,ind F2,N,ind);RRCind, CdAind, TMN,ind
Vehicle L
Vehicle H
Calculated RLs2.3.8.1. (CR*)
Calculated 4.2. (CR*)
CO2MPAS confirmed DV
Individual vehicles and interpolation
Coastdown
*correlation regulation - Annexes
TMind
TMind
NEDC
CO2
(g/c
ycle
)
Cycle Energy (kWh)
NEDC RLs (Fo,N,ind F1,N,ind F2,N,ind);RRCind, CdAind, TMN,ind
Vehicle L
Vehicle H
Calculated 4.2. (CR*)
Physical NEDC tests performedWLTP RLs (Fo,w,H F1,w,H
F2,w,H); RRCH, CdAH, TMW,H
WLTP RLs (Fo,w,L F1,w,L F2,w,L);RRCL, CdAL, TMW,L
Vehicle HVehicle L
NEDC RLs (Fo,N,H F1,N,H F2,N,H);RRCH, CdAH, TMN,H
Calculated RLs2.3.8.1. (CR*)
NEDC RLs (Fo,N,L F1,N,L F2,N,L);RRCL, CdAL, TMN,L
NEDCphysical test
NEDCphysical test
For Cycle Energy calculation always should beused RLs calculated for CO2MPAS
Individual vehicles and interpolation
Default RLs WLTPAnnex 4; 5.2.2.
WLTP RLs (Fo,w,H F1,w,HF2,w,H); RRCH, CdAH, TMw,H
WLTP RLs (Fo,w,L F1,w,L F2,w,L);RRCL, CdAL, TMw,L
Vehicle HVehicle L
NEDC RLs (Fo,N,H F1,N,H F2,N,H);TMN,H
Calculated RLs2.3.8.2.b (CR*)using NEDC tabulatedvalues and WLTP testresults
WLTPphysical test
*correlation regulation - Annexes
NEDC RLs (Fo,N,L F1,N,L F2,N,L);TMN,L
WLTPphysical test
CO2MPAS CO2MPAS
TMind
TMind
NEDC
CO2
(g/c
ycle
)
Cycle Energy (kWh)
NEDC RLs (Fo,N,ind F1,N,ind F2,N,ind);TMN,ind
Vehicle L
Vehicle H
CO2MPAS confirmed DV
The same for f1 and f2
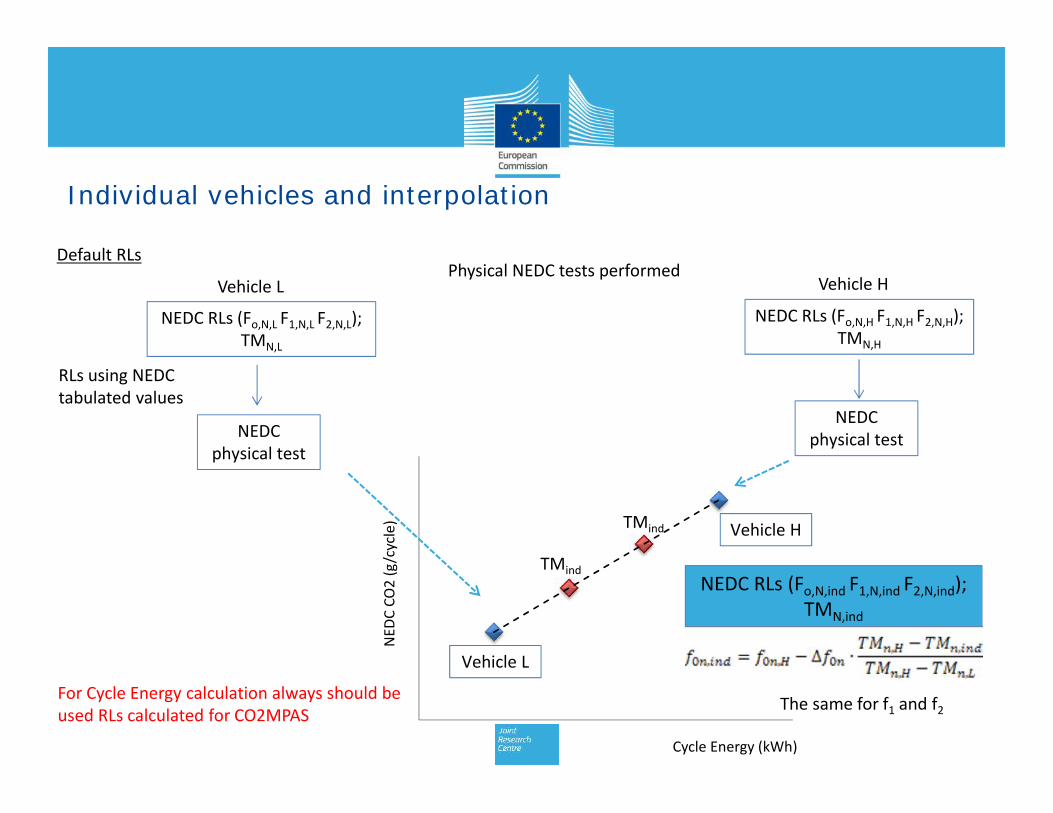
Individual vehicles and interpolation
TMind
TMind
NEDC
CO2
(g/c
ycle
)
Cycle Energy (kWh)
NEDC RLs (Fo,N,ind F1,N,ind F2,N,ind);TMN,ind
Vehicle L
Vehicle H
Physical NEDC tests performedVehicle HVehicle L
NEDC RLs (Fo,N,H F1,N,H F2,N,H);TMN,H
NEDC RLs (Fo,N,L F1,N,L F2,N,L);TMN,L
NEDCphysical test
NEDCphysical test
For Cycle Energy calculation always should beused RLs calculated for CO2MPAS
Default RLs
RLs using NEDCtabulated values
The same for f1 and f2

JRC Science Hub: www.ec.europa.eu/jrc
Twitter: @EU_ScienceHub
LinkedIn: european-commission-joint-research-centre
YouTube: JRC Audiovisuals
Vimeo: Science@EC
Stay in touch

Questions ?