Embed Size (px)
Citation preview

Describing Immigrant Communities
Randy Capps, Jeffrey S. Passel
Immigration Studies Program The Urban Institute
The Urban InstituteWashington, DC — December 2004
FOUNDATION forCHILD DEVELOPMENT
This presentation includes results frompast and present work (in some cases stillbeing drafted) on immigrant populationsusing several data sources for national,state and local-level analyses. Much ofthis work has been supported by theAnnie E. Casey Foundation, althoughother foundations and federal agenciescontributing funding to support the workas well.
The authors would like to acknowledgeJason Ost and Dan Perez-Lopez for theirassistance in producing some of the chartsand figures in this presentation.
A full copy of The New Neighbors can beobtained from the Urban Institute website(www.urban.org) or by contacting theauthors at the Urban Institute (Please seelast slide in this presentation).

FOUNDATION forCHILD DEVELOPMENT
Describing Immigrant CommuinitiesRandy Capps, Jeffrey S. Passel
Page 2
0.1 0.6
1.7
2.62.3
2.8
5.2
3.7
10
7
3.8
2.5
1.00.5
4.1
6.0
9.0
15Millions of Immigrants
*Additional immigrants are mostly illegals and legalized aliens
Europe/Canada (Legal)
Additional*
All Other (Legal)
14-16+(est.)
1820s 1840s 1860s 1880s 1900s 1920s 1940s 1960s 1980s 2000s
Current In-Flows are Very High
This presentation begins with the large scale of recentimmigration flows to the United States.
Although some uncertainty remains over the number ofimmigrants coming to the United States during the 1990s,there are indications that at least 14 million and perhaps asmany as 16 million immigrants entering the country duringthe decade (according to our estimates based on Census2000); this figure far exceeds flows in any decade in thenation’s history.
Given the overall levels of legal immigration (about 800,000 orso per year), it is likely that the net in-flow of undocumentedimmigrants averaged about 500,000 per year over the decade,but the level of undocumented entries was much higher, sincemany undocumented immigrants return to their home countries.Legal immigration averaged close to 1 million per year duringthe 1990s.
Barring a major change in the nation’s immigration policy or asustained deterioration in the economy, we project the entry ofat least another 15 million immigrants between 2000 and 2010.
The pattern of immigration before the 1960s reflects economicupturns and downturns of the U.S. economy and those ofmajor sending areas. Other fluctuations can be traced to warsand restrictions in U.S. policy. For instance, U.S. immigrationfell substantially following the National Origin Quotas Act of 1924, which substantially reduced legal immigration fromEurope and Asia. The two decades with the least immigrationwere the 1930s and 1940s, immediately following this legislationand corresponding with the Great Depression and WorldWar II.
In 1965, the National Origin Quotas were repealed, legalimmigration quotas were increased substantially, and a newsystem emphasizing family reunification was enacted. Sincethen, increasing immigration flows have proved largelyimpervious to changes in economic conditions and foreignwars, although flows have decreased somewhat sinceSeptember 11, 2001.
Sources: Department of Homeland Security Yearbook ofImmigration Statistics (various years); Urban Institute estimates and projections.
Immigrant Numbers at Peak — Percentage is Not
0
10
20
30
40
1840 1860 1880 1900 1920 1940 1960 1980 2000
Foreign-Born Population (millions)
Percent Foreign-Born of Total
14.8 Percent
34.2Million
(2004 CPS)
4.7 Percent11.9 Percent
(2004)
42-43 Million
13.5 Percent
Source: Decennial censuses for 1850-2000; Current Population Surveys (CPS) for 1990-99 and 2000-04; Urban Institute projections (2004) for 2010.
FOUNDATION forCHILD DEVELOPMENT
Describing Immigrant CommuinitiesRandy Capps, Jeffrey S. Passel
Page 3
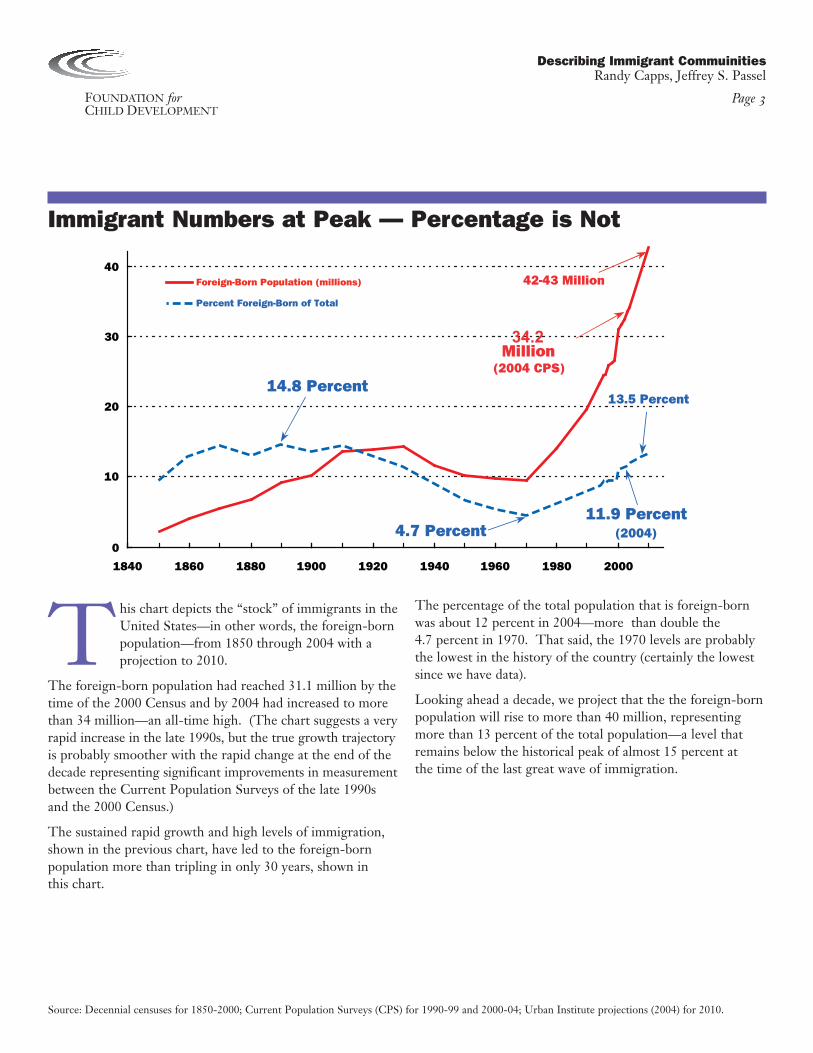
This chart depicts the “stock” of immigrants in theUnited States—in other words, the foreign-bornpopulation—from 1850 through 2004 with aprojection to 2010.
The foreign-born population had reached 31.1 million by thetime of the 2000 Census and by 2004 had increased to morethan 34 million—an all-time high. (The chart suggests a veryrapid increase in the late 1990s, but the true growth trajectoryis probably smoother with the rapid change at the end of thedecade representing significant improvements in measurementbetween the Current Population Surveys of the late 1990sand the 2000 Census.)
The sustained rapid growth and high levels of immigration,shown in the previous chart, have led to the foreign-bornpopulation more than tripling in only 30 years, shown in this chart.
The percentage of the total population that is foreign-bornwas about 12 percent in 2004—more than double the 4.7 percent in 1970. That said, the 1970 levels are probablythe lowest in the history of the country (certainly the lowestsince we have data).
Looking ahead a decade, we project that the the foreign-bornpopulation will rise to more than 40 million, representingmore than 13 percent of the total population—a level thatremains below the historical peak of almost 15 percent at the time of the last great wave of immigration.

FOUNDATION forCHILD DEVELOPMENT
Describing Immigrant CommuinitiesRandy Capps, Jeffrey S. Passel
Page 4
Citizenship and Legal Status Definitions
This slide defines the four large legal status groupsthat we usually describe when analyzing the U.S.immigrant population: legal permanent residents,naturalized citizens, undocumented immigrants,
and refugees. There are also small numbers of immigrantswho are in the United States legally on a temporary basis(e.g., students and temporary workers).
Legal permanent residents (LPRs, also know as “green card”holders) are admitted through family reunification provisions(for instance, parents, spouses or children of U.S. citizens),employment provisions and several other smaller categories.They may also have their status adjusted, for instance fromrefugee, after living in the United States for some time. Afterfive years—three years in the case of those married to U.S.citizens—LPRs are eligible to become U.S. citizens, but theymust first apply and pass background checks, civics andEnglish tests.
Naturalized citizens are those LPRs who have passed the testand become U.S. citizens (or children who became citizenswhen their parents became citizens).
Undocumented immigrants are those who overstayed validtemporary visas (for instance, student or tourist visas) or whoentered the U.S. illegally, often across the border withMexico.
Refugees are those who were admitted to the United Statesbased on a well-founded fear of persecution, and represent arelatively small share of the total.
Legal permanent residents = noncitizens admittedfor permanent residency (“green card” holders)
Naturalized citizens = immigrants who have becomeU.S. citizens
Undocumented immigrants = entered illegally or overstayed visas
Refugees = admitted for “well founded fear of persecution”
FOUNDATION forCHILD DEVELOPMENT
Describing Immigrant CommuinitiesRandy Capps, Jeffrey S. Passel
Page 5
Undocumented over One Quarter of Immigrants
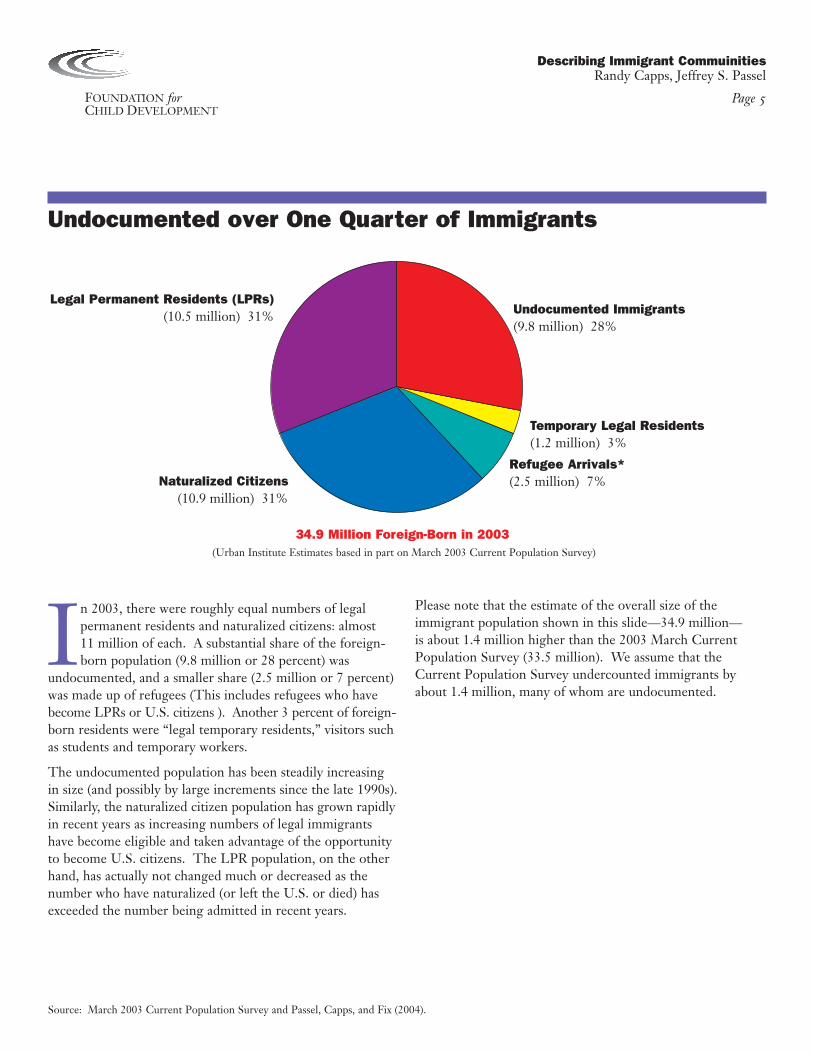
In 2003, there were roughly equal numbers of legal permanent residents and naturalized citizens: almost 11 million of each. A substantial share of the foreign-born population (9.8 million or 28 percent) was
undocumented, and a smaller share (2.5 million or 7 percent)was made up of refugees (This includes refugees who havebecome LPRs or U.S. citizens ). Another 3 percent of foreign-born residents were “legal temporary residents,” visitors suchas students and temporary workers.
The undocumented population has been steadily increasing in size (and possibly by large increments since the late 1990s).Similarly, the naturalized citizen population has grown rapidlyin recent years as increasing numbers of legal immigrantshave become eligible and taken advantage of the opportunityto become U.S. citizens. The LPR population, on the otherhand, has actually not changed much or decreased as thenumber who have naturalized (or left the U.S. or died) hasexceeded the number being admitted in recent years.
Please note that the estimate of the overall size of the immigrant population shown in this slide—34.9 million—is about 1.4 million higher than the 2003 March CurrentPopulation Survey (33.5 million). We assume that theCurrent Population Survey undercounted immigrants byabout 1.4 million, many of whom are undocumented.
Source: March 2003 Current Population Survey and Passel, Capps, and Fix (2004).
Legal Permanent Residents (LPRs)(10.5 million) 31%
Naturalized Citizens(10.9 million) 31%
Refugee Arrivals*(2.5 million) 7%
Temporary Legal Residents(1.2 million) 3%
Undocumented Immigrants(9.8 million) 28%
34.9 Million Foreign-Born in 2003(Urban Institute Estimates based in part on March 2003 Current Population Survey)
FOUNDATION forCHILD DEVELOPMENT
Describing Immigrant CommuinitiesRandy Capps, Jeffrey S. Passel
Page 6
Who Comes to the U.S.?
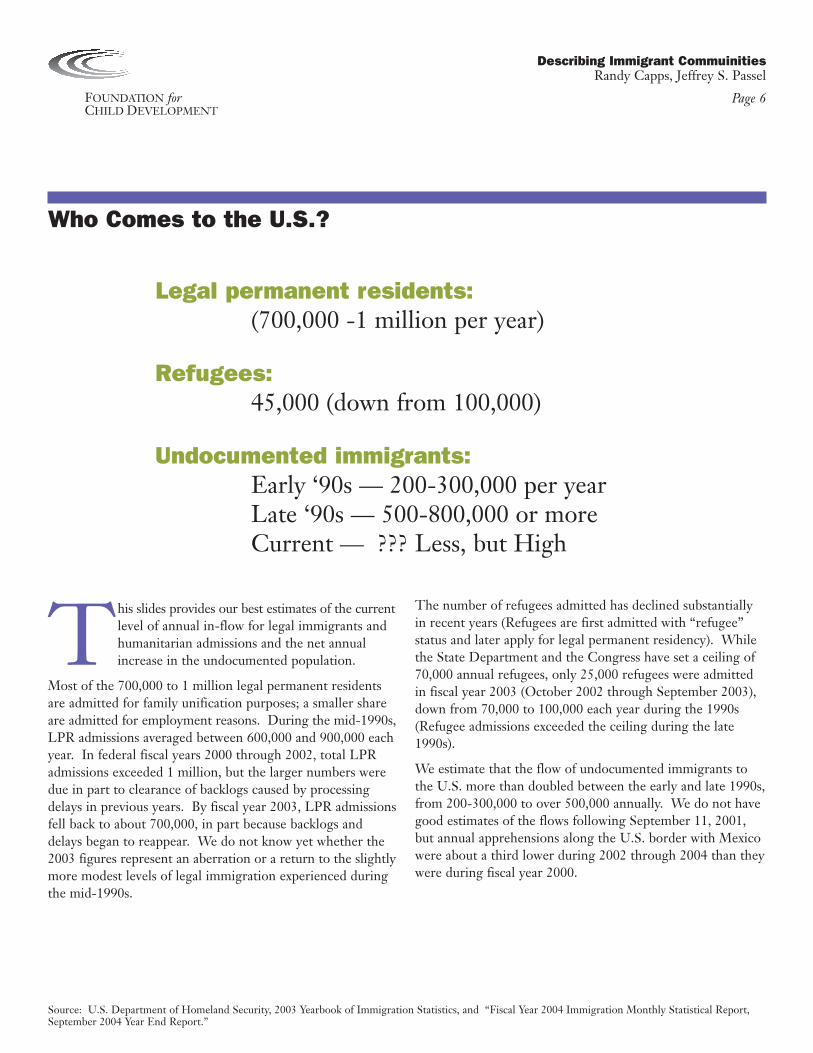
This slides provides our best estimates of the currentlevel of annual in-flow for legal immigrants andhumanitarian admissions and the net annualincrease in the undocumented population.
Most of the 700,000 to 1 million legal permanent residentsare admitted for family unification purposes; a smaller shareare admitted for employment reasons. During the mid-1990s,LPR admissions averaged between 600,000 and 900,000 eachyear. In federal fiscal years 2000 through 2002, total LPRadmissions exceeded 1 million, but the larger numbers weredue in part to clearance of backlogs caused by processingdelays in previous years. By fiscal year 2003, LPR admissionsfell back to about 700,000, in part because backlogs anddelays began to reappear. We do not know yet whether the2003 figures represent an aberration or a return to the slightlymore modest levels of legal immigration experienced duringthe mid-1990s.
The number of refugees admitted has declined substantiallyin recent years (Refugees are first admitted with “refugee”status and later apply for legal permanent residency). Whilethe State Department and the Congress have set a ceiling of70,000 annual refugees, only 25,000 refugees were admittedin fiscal year 2003 (October 2002 through September 2003),down from 70,000 to 100,000 each year during the 1990s(Refugee admissions exceeded the ceiling during the late1990s).
We estimate that the flow of undocumented immigrants tothe U.S. more than doubled between the early and late 1990s,from 200-300,000 to over 500,000 annually. We do not havegood estimates of the flows following September 11, 2001,but annual apprehensions along the U.S. border with Mexicowere about a third lower during 2002 through 2004 than theywere during fiscal year 2000.
Source: U.S. Department of Homeland Security, 2003 Yearbook of Immigration Statistics, and “Fiscal Year 2004 Immigration Monthly Statistical Report,September 2004 Year End Report.”
Legal permanent residents: (700,000 -1 million per year)
Refugees: 45,000 (down from 100,000)
Undocumented immigrants:Early ‘90s — 200-300,000 per yearLate ‘90s — 500-800,000 or moreCurrent — ??? Less, but High
FOUNDATION forCHILD DEVELOPMENT
Describing Immigrant CommuinitiesRandy Capps, Jeffrey S. Passel
Page 7
Admissions Status of Legal Immigrants
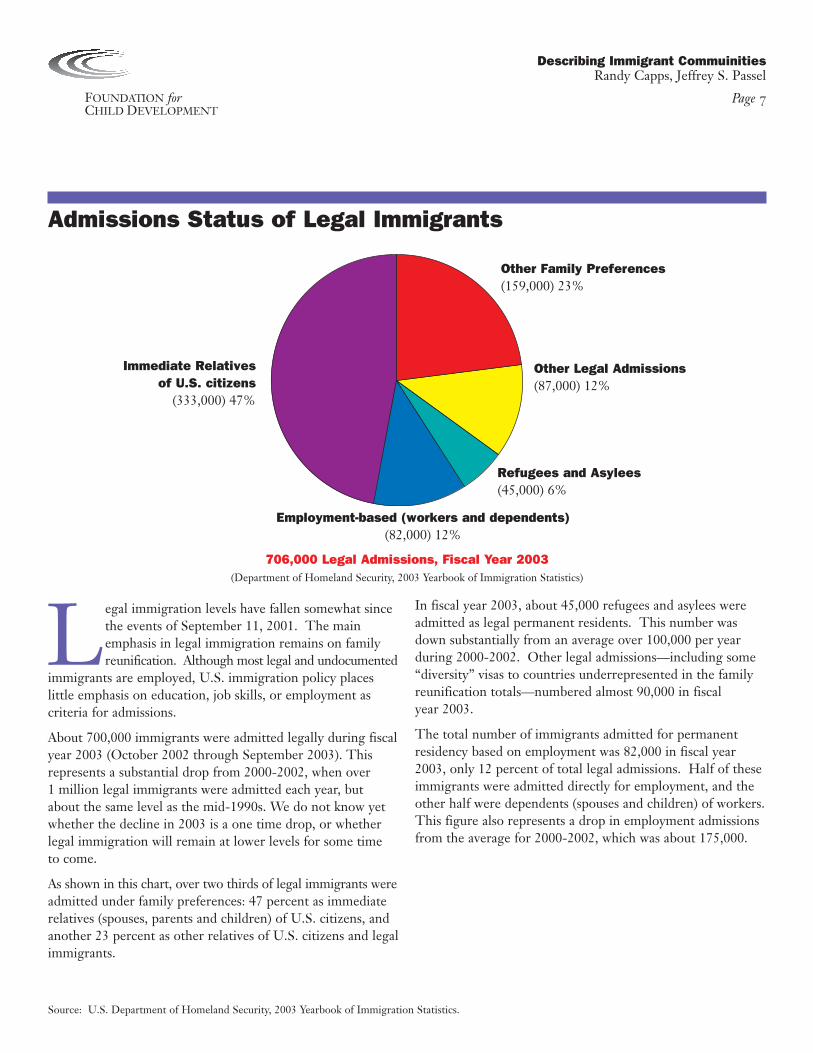
Legal immigration levels have fallen somewhat sincethe events of September 11, 2001. The mainemphasis in legal immigration remains on familyreunification. Although most legal and undocumented
immigrants are employed, U.S. immigration policy places little emphasis on education, job skills, or employment as criteria for admissions.
About 700,000 immigrants were admitted legally during fiscalyear 2003 (October 2002 through September 2003). Thisrepresents a substantial drop from 2000-2002, when over 1 million legal immigrants were admitted each year, but about the same level as the mid-1990s. We do not know yetwhether the decline in 2003 is a one time drop, or whetherlegal immigration will remain at lower levels for some time to come.
As shown in this chart, over two thirds of legal immigrants wereadmitted under family preferences: 47 percent as immediaterelatives (spouses, parents and children) of U.S. citizens, andanother 23 percent as other relatives of U.S. citizens and legalimmigrants.
In fiscal year 2003, about 45,000 refugees and asylees wereadmitted as legal permanent residents. This number wasdown substantially from an average over 100,000 per yearduring 2000-2002. Other legal admissions—including some“diversity” visas to countries underrepresented in the familyreunification totals—numbered almost 90,000 in fiscal year 2003.
The total number of immigrants admitted for permanent residency based on employment was 82,000 in fiscal year2003, only 12 percent of total legal admissions. Half of theseimmigrants were admitted directly for employment, and theother half were dependents (spouses and children) of workers.This figure also represents a drop in employment admissionsfrom the average for 2000-2002, which was about 175,000.
Source: U.S. Department of Homeland Security, 2003 Yearbook of Immigration Statistics.
706,000 Legal Admissions, Fiscal Year 2003 (Department of Homeland Security, 2003 Yearbook of Immigration Statistics)
Immediate Relatives of U.S. citizens
(333,000) 47%
Employment-based (workers and dependents)(82,000) 12%
Other Family Preferences(159,000) 23%
Other Legal Admissions(87,000) 12%
Refugees and Asylees(45,000) 6%
FOUNDATION forCHILD DEVELOPMENT
Describing Immigrant CommuinitiesRandy Capps, Jeffrey S. Passel
Page 8
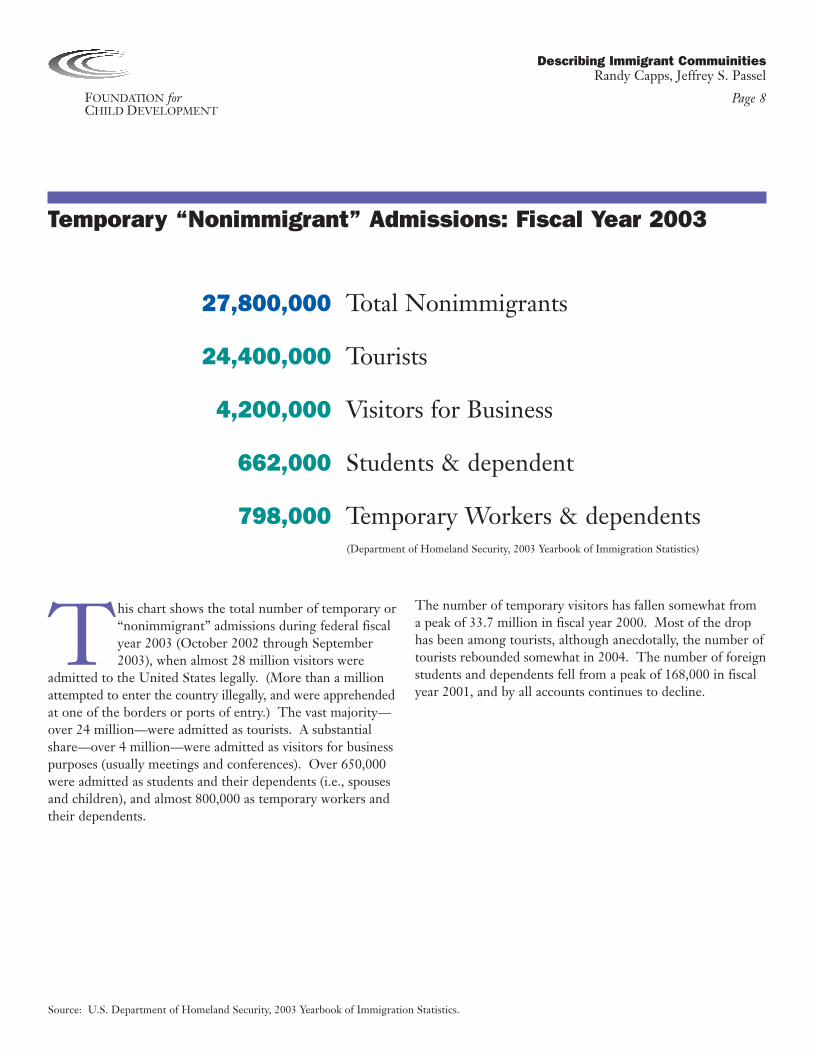
Temporary “Nonimmigrant” Admissions: Fiscal Year 2003
This chart shows the total number of temporary or“nonimmigrant” admissions during federal fiscalyear 2003 (October 2002 through September2003), when almost 28 million visitors were
admitted to the United States legally. (More than a millionattempted to enter the country illegally, and were apprehendedat one of the borders or ports of entry.) The vast majority—over 24 million—were admitted as tourists. A substantialshare—over 4 million—were admitted as visitors for businesspurposes (usually meetings and conferences). Over 650,000were admitted as students and their dependents (i.e., spousesand children), and almost 800,000 as temporary workers andtheir dependents.
The number of temporary visitors has fallen somewhat froma peak of 33.7 million in fiscal year 2000. Most of the drophas been among tourists, although anecdotally, the number oftourists rebounded somewhat in 2004. The number of foreignstudents and dependents fell from a peak of 168,000 in fiscalyear 2001, and by all accounts continues to decline.
Source: U.S. Department of Homeland Security, 2003 Yearbook of Immigration Statistics.
(Department of Homeland Security, 2003 Yearbook of Immigration Statistics)
27,800,000 Total Nonimmigrants
24,400,000 Tourists
4,200,000 Visitors for Business
662,000 Students & dependent
798,000 Temporary Workers & dependents
FOUNDATION forCHILD DEVELOPMENT
Describing Immigrant CommuinitiesRandy Capps, Jeffrey S. Passel
Page 9
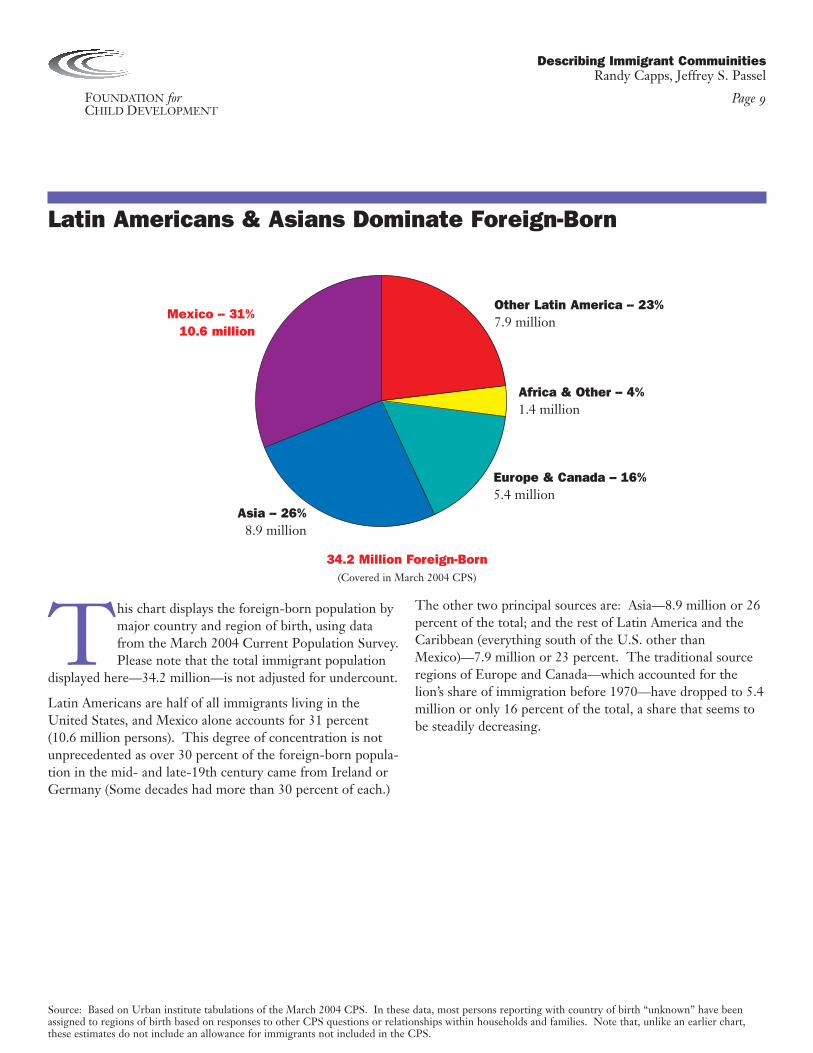
Latin Americans & Asians Dominate Foreign-Born
This chart displays the foreign-born population bymajor country and region of birth, using datafrom the March 2004 Current Population Survey.Please note that the total immigrant population
displayed here—34.2 million—is not adjusted for undercount.
Latin Americans are half of all immigrants living in theUnited States, and Mexico alone accounts for 31 percent(10.6 million persons). This degree of concentration is notunprecedented as over 30 percent of the foreign-born popula-tion in the mid- and late-19th century came from Ireland orGermany (Some decades had more than 30 percent of each.)
The other two principal sources are: Asia—8.9 million or 26percent of the total; and the rest of Latin America and theCaribbean (everything south of the U.S. other thanMexico)—7.9 million or 23 percent. The traditional sourceregions of Europe and Canada—which accounted for thelion’s share of immigration before 1970—have dropped to 5.4million or only 16 percent of the total, a share that seems tobe steadily decreasing.
Source: Based on Urban institute tabulations of the March 2004 CPS. In these data, most persons reporting with country of birth “unknown” have beenassigned to regions of birth based on responses to other CPS questions or relationships within households and families. Note that, unlike an earlier chart,these estimates do not include an allowance for immigrants not included in the CPS.
34.2 Million Foreign-Born(Covered in March 2004 CPS)
Other Latin America -- 23%7.9 million
Africa & Other -- 4%1.4 million
Europe & Canada -- 16%5.4 million
Asia -- 26%8.9 million
Mexico -- 31%10.6 million
FOUNDATION forCHILD DEVELOPMENT
Describing Immigrant CommuinitiesRandy Capps, Jeffrey S. Passel
Page 10
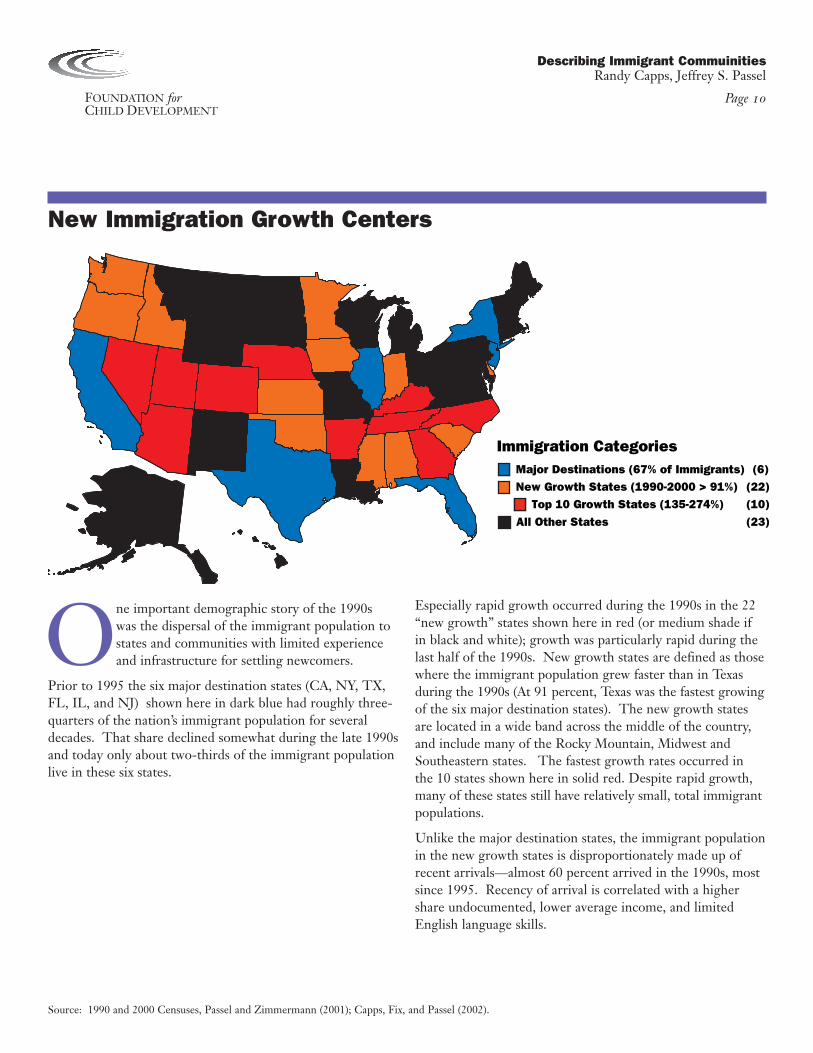
New Immigration Growth Centers
One important demographic story of the 1990s was the dispersal of the immigrant population tostates and communities with limited experienceand infrastructure for settling newcomers.
Prior to 1995 the six major destination states (CA, NY, TX,FL, IL, and NJ) shown here in dark blue had roughly three-quarters of the nation’s immigrant population for severaldecades. That share declined somewhat during the late 1990sand today only about two-thirds of the immigrant populationlive in these six states.
Especially rapid growth occurred during the 1990s in the 22“new growth” states shown here in red (or medium shade ifin black and white); growth was particularly rapid during thelast half of the 1990s. New growth states are defined as thosewhere the immigrant population grew faster than in Texasduring the 1990s (At 91 percent, Texas was the fastest growingof the six major destination states). The new growth statesare located in a wide band across the middle of the country,and include many of the Rocky Mountain, Midwest andSoutheastern states. The fastest growth rates occurred in the 10 states shown here in solid red. Despite rapid growth,many of these states still have relatively small, total immigrantpopulations.
Unlike the major destination states, the immigrant populationin the new growth states is disproportionately made up ofrecent arrivals—almost 60 percent arrived in the 1990s, mostsince 1995. Recency of arrival is correlated with a highershare undocumented, lower average income, and limitedEnglish language skills.
Source: 1990 and 2000 Censuses, Passel and Zimmermann (2001); Capps, Fix, and Passel (2002).
Immigration CategoriesMajor Destinations (67% of Immigrants) (6)
All Other States (23)
New Growth States (1990-2000 > 91%) (22)
Top 10 Growth States (135-274%) (10)
FOUNDATION forCHILD DEVELOPMENT
Describing Immigrant CommuinitiesRandy Capps, Jeffrey S. Passel
Page 11
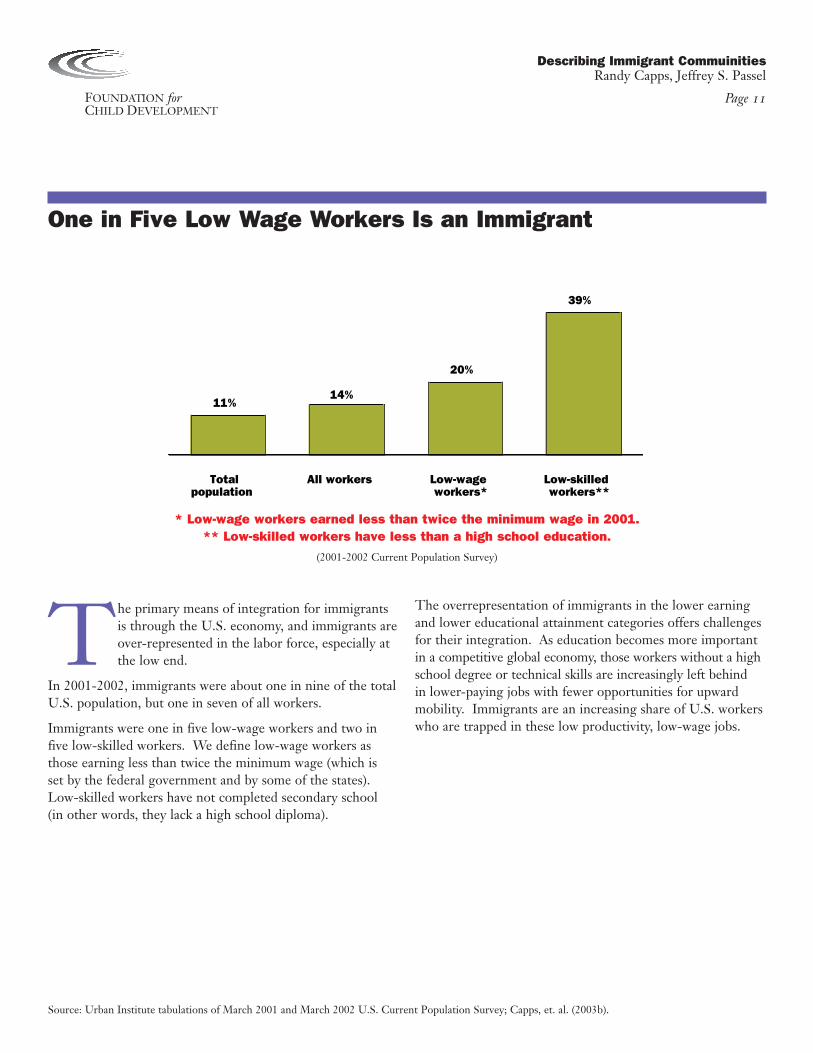
One in Five Low Wage Workers Is an Immigrant
20%
39%
14%11%
Totalpopulation
All workers Low-wageworkers*
Low-skilledworkers**
The primary means of integration for immigrantsis through the U.S. economy, and immigrants areover-represented in the labor force, especially atthe low end.
In 2001-2002, immigrants were about one in nine of the totalU.S. population, but one in seven of all workers.
Immigrants were one in five low-wage workers and two infive low-skilled workers. We define low-wage workers asthose earning less than twice the minimum wage (which is set by the federal government and by some of the states).Low-skilled workers have not completed secondary school (in other words, they lack a high school diploma).
The overrepresentation of immigrants in the lower earningand lower educational attainment categories offers challengesfor their integration. As education becomes more importantin a competitive global economy, those workers without a highschool degree or technical skills are increasingly left behind in lower-paying jobs with fewer opportunities for upwardmobility. Immigrants are an increasing share of U.S. workerswho are trapped in these low productivity, low-wage jobs.
Source: Urban Institute tabulations of March 2001 and March 2002 U.S. Current Population Survey; Capps, et. al. (2003b).
* Low-wage workers earned less than twice the minimum wage in 2001.** Low-skilled workers have less than a high school education.
(2001-2002 Current Population Survey)
FOUNDATION forCHILD DEVELOPMENT
Describing Immigrant CommuinitiesRandy Capps, Jeffrey S. Passel
Page 12
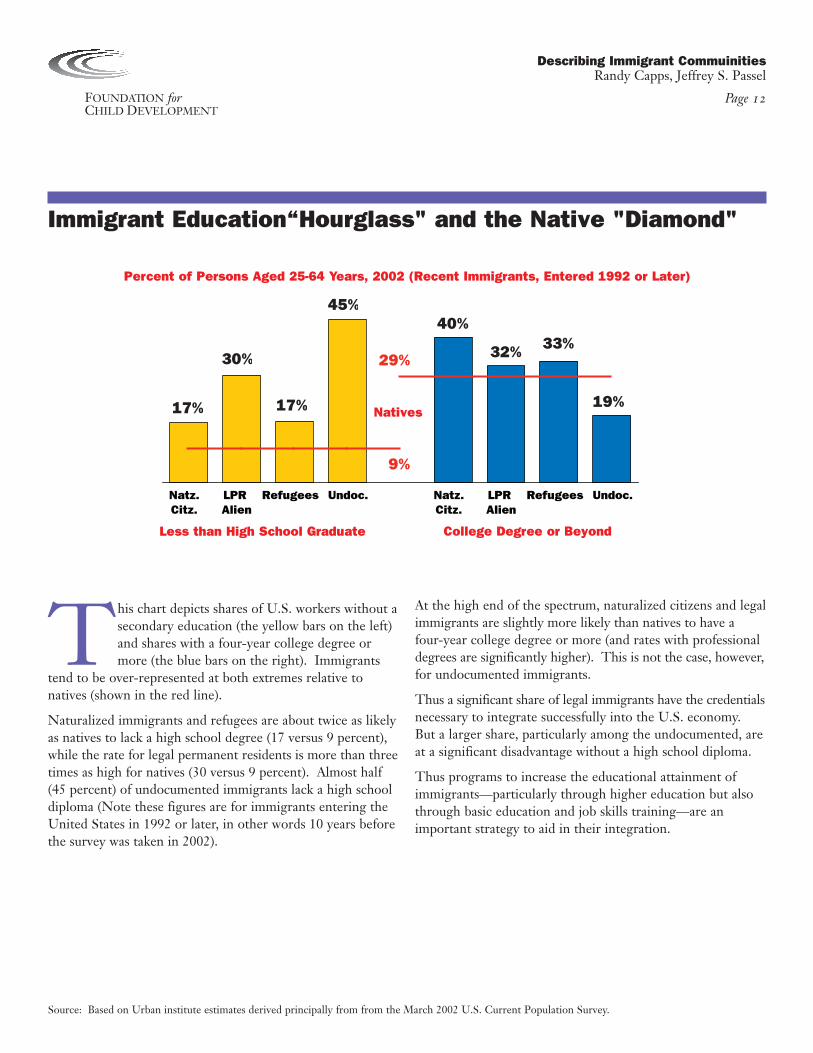
Immigrant Education“Hourglass" and the Native "Diamond"
17%
45%
17%
30%33%
19%
32%
40%
9%
29%
Natz.Citz.
LPR Alien
Refugees Undoc. Natz.Citz.
LPR Alien
Refugees Undoc.
This chart depicts shares of U.S. workers without asecondary education (the yellow bars on the left)and shares with a four-year college degree ormore (the blue bars on the right). Immigrants
tend to be over-represented at both extremes relative tonatives (shown in the red line).
Naturalized immigrants and refugees are about twice as likelyas natives to lack a high school degree (17 versus 9 percent),while the rate for legal permanent residents is more than threetimes as high for natives (30 versus 9 percent). Almost half(45 percent) of undocumented immigrants lack a high schooldiploma (Note these figures are for immigrants entering theUnited States in 1992 or later, in other words 10 years beforethe survey was taken in 2002).
At the high end of the spectrum, naturalized citizens and legalimmigrants are slightly more likely than natives to have afour-year college degree or more (and rates with professionaldegrees are significantly higher). This is not the case, however,for undocumented immigrants.
Thus a significant share of legal immigrants have the credentialsnecessary to integrate successfully into the U.S. economy.But a larger share, particularly among the undocumented, areat a significant disadvantage without a high school diploma.
Thus programs to increase the educational attainment ofimmigrants—particularly through higher education but alsothrough basic education and job skills training—are animportant strategy to aid in their integration.
Source: Based on Urban institute estimates derived principally from from the March 2002 U.S. Current Population Survey.
Percent of Persons Aged 25-64 Years, 2002 (Recent Immigrants, Entered 1992 or Later)
Less than High School Graduate College Degree or Beyond
Natives

FOUNDATION forCHILD DEVELOPMENT
Describing Immigrant CommuinitiesRandy Capps, Jeffrey S. Passel
Page 13
Incomes Increase with Time in U.S.
$23,000
UnauthorizedAliens
Refugees (post-1980)
LPRAliens
NaturalizedLPRs
In U.S. <10 Years
$35,000
$27,800 $26,800
$54,900
$43,800
$31,500
$41,000
Natives $45,900
In U.S. 10+ Years
This chart shows that the longer they reside in theUnited States, the higher the income for mostimmigrants. Among legal permanent residents,family income rises to reach near parity with
natives (show here in the red line) after about 10 years.Those immigrants who have become naturalized citizens andlived in the United States at least 10 years actually have higherfamily incomes than U.S.-born natives, by about $10,000 on average. (In this slide the lighter, yellow bars representimmigrants arriving within 10 years before the survey wastaken; the darker, blue bars are immigrants who have been in the country for more than 10 years).
Family income also rises for refugees, but remains slightlylower than that for natives.
Undocumented immigrants also show some progress overtime; however, their income remains at about two-thirds ofaverage income for natives even after 10 years in the country.
Thus economic integration occurs at a reasonably fast pacefor the average legal immigrant family, but somewhat moreslowly for refugees. The undocumented, who represent over aquarter of all U.S. immigrants, show the slowest improvement,suggesting that their lack of legal status is a serious impedimentto economic integration.
Source: Based on Urban institute estimates derived from the 2000 Census.
Average Family Income, 1999
Source: Census 2000

FOUNDATION forCHILD DEVELOPMENT
Describing Immigrant CommuinitiesRandy Capps, Jeffrey S. Passel
Page 14
One in Six U.S. Adults Speaks a Non-English Language
Another important factor in integration is Englishlanguage acquisition. The vast majority of alladults in the United States (83 percent) only speak English, and almost business is transacted in
English outside of New York, Los Angeles, Miami, and ahandful of other major cities.
Only about 17 percent of all adults speak a language otherthan English in the home, and of these about half speakEnglish very well. We term this group (about 20 million people) “bilingual.”
Another 18 million adults do not speak English very well; weterm them “limited English proficient” (LEP). Immigrantswith limited English skills are at a serious disadvantage in thelabor force and generally in terms of their interaction withU.S. society.
Source: 2000 Census.
English only -- 83%178.1 million
Bilingual -- 9%19.4 million
Limited English Proficient-- 8%17.8 million
215 Million Adults Ages 18 and Over(Census 2000)
FOUNDATION forCHILD DEVELOPMENT
Describing Immigrant CommuinitiesRandy Capps, Jeffrey S. Passel
Page 15
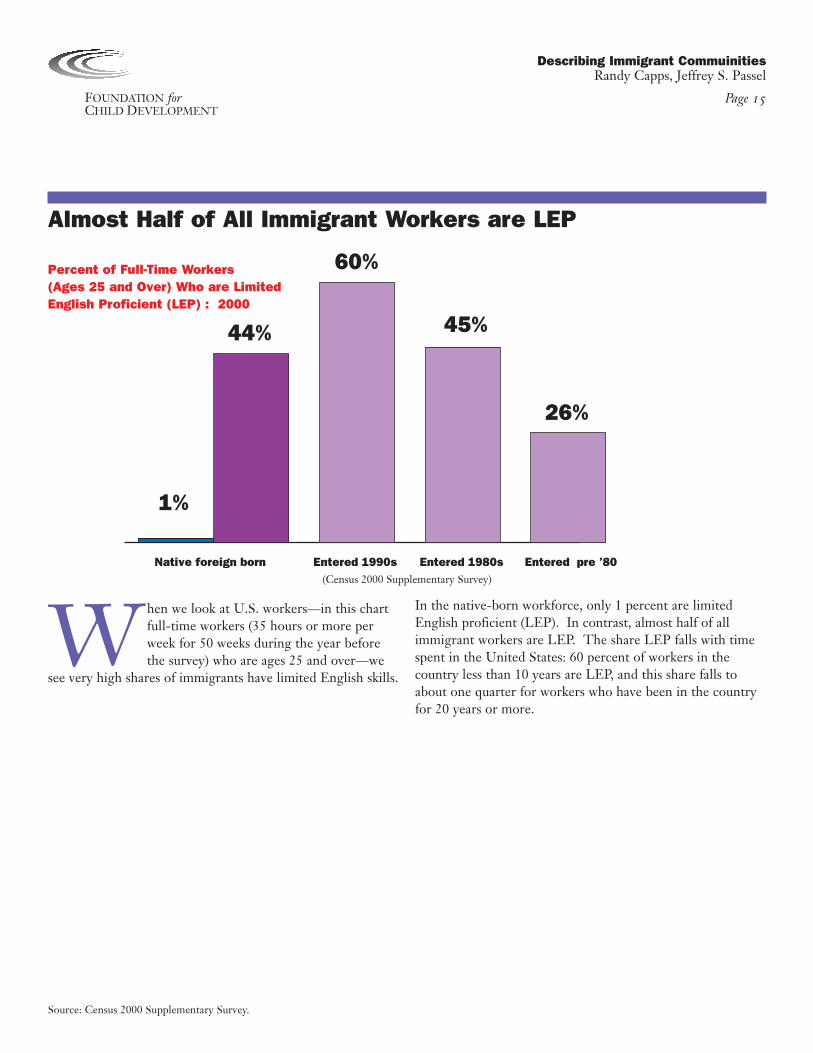
Almost Half of All Immigrant Workers are LEP
Native foreign born Entered 1990s Entered 1980s Entered pre ’80
1%
44%
60%
45%
26%
When we look at U.S. workers—in this chartfull-time workers (35 hours or more perweek for 50 weeks during the year beforethe survey) who are ages 25 and over—we
see very high shares of immigrants have limited English skills.
In the native-born workforce, only 1 percent are limitedEnglish proficient (LEP). In contrast, almost half of allimmigrant workers are LEP. The share LEP falls with timespent in the United States: 60 percent of workers in thecountry less than 10 years are LEP, and this share falls toabout one quarter for workers who have been in the countryfor 20 years or more.
Source: Census 2000 Supplementary Survey.
(Census 2000 Supplementary Survey)
Percent of Full-Time Workers (Ages 25 and Over) Who are Limited English Proficient (LEP) : 2000
FOUNDATION forCHILD DEVELOPMENT
Describing Immigrant CommuinitiesRandy Capps, Jeffrey S. Passel
Page 16
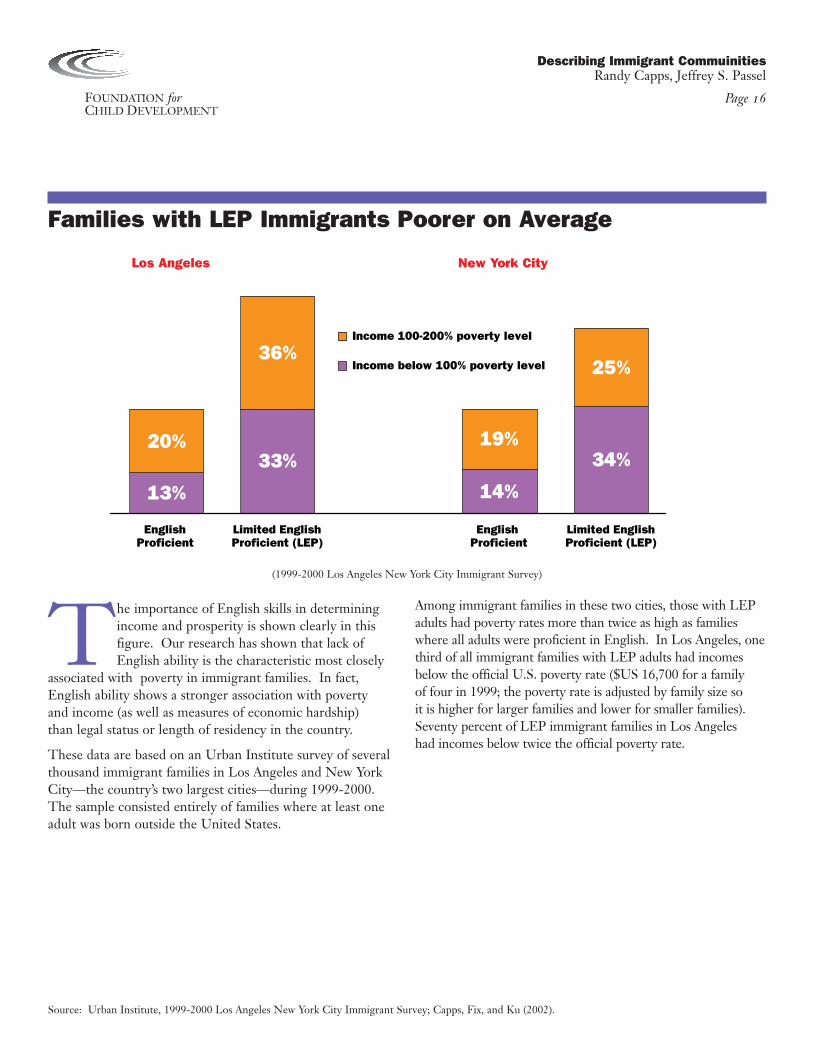
Families with LEP Immigrants Poorer on Average
13%
33%
14%
20%
36%
19%34%
25%
EnglishProficient
Limited EnglishProficient (LEP)
EnglishProficient
Limited EnglishProficient (LEP)
Income 100-200% poverty level
Income below 100% poverty level
The importance of English skills in determiningincome and prosperity is shown clearly in thisfigure. Our research has shown that lack ofEnglish ability is the characteristic most closely
associated with poverty in immigrant families. In fact,English ability shows a stronger association with poverty and income (as well as measures of economic hardship) than legal status or length of residency in the country.
These data are based on an Urban Institute survey of severalthousand immigrant families in Los Angeles and New YorkCity—the country’s two largest cities—during 1999-2000.The sample consisted entirely of families where at least oneadult was born outside the United States.
Among immigrant families in these two cities, those with LEPadults had poverty rates more than twice as high as familieswhere all adults were proficient in English. In Los Angeles, onethird of all immigrant families with LEP adults had incomesbelow the official U.S. poverty rate ($US 16,700 for a family of four in 1999; the poverty rate is adjusted by family size so it is higher for larger families and lower for smaller families).Seventy percent of LEP immigrant families in Los Angeles had incomes below twice the official poverty rate.
Source: Urban Institute, 1999-2000 Los Angeles New York City Immigrant Survey; Capps, Fix, and Ku (2002).
(1999-2000 Los Angeles New York City Immigrant Survey)
Los Angeles New York City


![Action-Items CCXXI [Israel, Illegals]](https://img.pdfslide.us/doc/110x75/577cc6a01a28aba7119eb54a/action-items-ccxxi-israel-illegals.jpg)


![Action-Items CCXVII [Israel, Illegals, Politics, Media]](https://img.pdfslide.us/doc/110x75/577cc6b21a28aba7119eeeb3/action-items-ccxvii-israel-illegals-politics-media.jpg)


![Action-Items CCXII [Israel, Gaza, Illegals, BHO, guns]](https://img.pdfslide.us/doc/110x75/577cc6d71a28aba7119f462c/action-items-ccxii-israel-gaza-illegals-bho-guns.jpg)


![Thoughts - XL - [Midterms, Kurdistan, Common Core, Events, Illegals Corbett, JoePa, Iran]](https://img.pdfslide.us/doc/110x75/577cc39f1a28aba711969a78/thoughts-xl-midterms-kurdistan-common-core-events-illegals-corbett.jpg)