Embed Size (px)
Citation preview
Real Options Analysis for Investment in Organic Wheat and Barley Production in South Central North Dakota Using Precision Agriculture Technology
Mariah Tanner Ehmke, Alla A. Golub, Anetra L. Harbor, and Michael D. Boehlje*
Selected Paper Presented at the 2004 AAEA Annual Meeting
Denver, CO August 1-4, 2004
ABSTRACT: Real options theory is employed to measure the value of investing in organic wheat production using precision agriculture technology. Results reveal that an option to wait until market uncertainty is resolved is valuable. Information obtained via precision agriculture technology is also valuable to producers seeking organic certification. Keywords: organic wheat production, real options theory, precision agriculture technology Copyright 2004 by Mariah Tanner Ehmke, Alla A. Golub, Anetra L. Harbor, and Michael D. Boehlje. All rights reserved. Readers may make verbatim copies of this document for non-commercial purposes by any means, provided that this copyright notice appears on all such copies. _____________________________________________________________________________________*Ehmke, Golub, and Harbor are graduate students in the Department of Agricultural Economics, Purdue University. Dr. Boehlje is a Professor in the Department of Agricultural Economics, Purdue University.
1
Real Options Analysis for Investment in Organic Wheat and Barley Production in South Central North Dakota Using Precision Agriculture Technology
Introduction In response to rising consumer demand for organically grown foods, organic production in the
United States has increased dramatically over the last ten years. Between 1992 and 1997, and again
between 1997 and 2001, acreage certified as organic for major crop production, pasture, and ranchland
more than doubled. By the end of 2001, a total of 2.35 million acres in 48 states were certified organic
(U.S. Department of Agriculture 2002).
A number a factors has contributed to an increase in consumer interest in organic products.
Environmental regulations and consumer food safety concerns stemming from outbreaks such as Mad
Cow Disease have boosted demand for products grown naturally. Human health concerns, the availability
of greater information and education, and the introduction of GMO’s have also contributed to the
expansion of organic markets in the United States and countries abroad.
In the U.S., organically grown products typically earn price premiums that are 10 to 20 percent
higher than their non-organic counterparts (United Nations 2002), and organic food sales only account for
2% of total food sales (Greene and Dobbs 2001). Price premiums coupled with the possibility of
potentially expanding markets provide an economic incentive for producers to invest in growing organic
food products. However, to enter the organic market as a certified producer, U.S. farmers have to meet
specific production requirements and undergo a three-year transition period. Producers who want to
eventually capture organic premiums may also incur a short term loss due to possible yield differences
between organic crops and their non-organic counterparts. In addition, transitional producers typically do
not receive premiums for their products during the three-year period.
The U. S. Department of Agriculture, consumer groups, organic farmers, and other interested
parties have developed guidelines for the certification of organic production. Under these guidelines,
prospective organic producers are required to keep three years of detailed records on the methods and
inputs used in crop production (U.S. Department of Agriculture 2003). Documentation of these
2
management practices and other indicators are used by accredited certifiers to ensure that farm operations
that seek and acquire organic status comply with National Organic Program (NOP) regulations.
Information management, therefore, is vital to obtaining and maintaining organic certification.
Further, the ability to accurately track activities in fields set aside as organic has value to every farmer
that wants to grow and market organic products. This places an implied value on the information that
needs to be collected, maintained, and updated during the certification process.
For larger organic growers, the value placed on information management is even greater.
Documentation efforts for smaller organic farmers can be as simple as updating several paper forms. As
farms and fields become larger, data management becomes more difficult and time consuming.
Alternative means of recording management techniques and inputs used on organic acres become
important for larger organic producers.
The adoption of new precision agriculture technology (PA) as a data management tool can give
potential organic producers the ability to efficiently meet documentation requirements and maintain
valuable information databases on their organic and non-organic fields. Through the use of computers
and global satellite systems, precision agriculture technology brings a new level of precision to
information gathering that would have traditionally been done with pencil, paper, and manual
measurement instruments. (Further details covering the certification process and precision agriculture
technology will be discussed later in the paper).
Successful participation in organic markets or successful investment into data management tools
to facilitate penetration of such markets is not guaranteed. There is inherent uncertainty in the organic
food market. Although the future of organics appears strong in the U.S., market conditions can
potentially erode during the three-year period that growers are in transition. Organic premiums are
currently supported by demand outstripping supply, but demand shifts, increased supplies, and changes in
consumer preferences can alter the organic markets.
Thus, a producer has an option: he or she can decide to grow organic products and begin the
transition process today with the aid of precision agriculture technology, or the producer can decide to
3
delay growing organic products for a few years to see how market conditions evolve, possibly delaying
the investment forever. The problem is that producers face uncertainty in the organic market, and given
this uncertainty, they must be able to successfully evaluate and choose among alternate investment
options.
Because many organic markets are new and emerging, accurate historic data on production and
prices is not readily available for many products. An exception is the case of organic Durum wheat in
south central North Dakota. Crop budget data is available through North Dakota State University
Extension Service and production information is accessible. It has been established, for example, that
organic yields are approximately 6 bushels lower per acre than non-organic yields of Durum wheat. The
production of durum wheat is geographically concentrated to North Dakota and surrounding areas, and
North Dakota produces approximated three-fourths of the U.S. durum crop (North Dakota Wheat
Commission 2004). Given the availability of pertinent organic production data and the potential for
expansion of the organic wheat market in North Dakota, an analysis of investment options in this
particular market should prove useful.
The objective of this research is to measure the real option value an average farmer in south
central North Dakota holds for entering the organic Durum wheat and barley market. An application of
real options theory is employed to measure the value of investing in organic Durum wheat production and
precision agriculture technology now versus a future date. Real options theory enables further
understanding of how future risk and uncertainty play into the farmer’s decision today. Further, the study
allows us to address the question: What value does the information obtained from using PA technology
have for an organic farmer?
The following section provides information about the demand for organic food products in the
United States, certified organic production requirements, and a description of precision agriculture and its
role in organic food production. The next section lays out the methodology for the real options analysis,
including background information on real options theory, and the data. Results are then reported and
4
discussed in the third section. They are followed by final conclusions and recommendations for future
research.
Section 1. Organic Food Demand, Certified Production, and Precision Agriculture
Organic Food Demand Demand for organic food is growing. The United States has the world’s largest market for organic
products with retail sales of organic food and beverages amounting to about $8 billion in 2000. Retail
sales are expected to reach about $ 9.5 billion in 2001 and $20 billion in 2005. Sales of U.S.
manufactured organic products grew 38 percent during the past year and 36 percent annually over the past
five years, compared with an estimated 20 to 25 percent annual growth for the organic market in general
(United Nations 2002).
Traditionally, organic food products have been sold outside the conventional distribution system
through alternative channels (e.g. farm gate sales and open-air markets). However, as the organic food
market has grown strongly in recent years, sales have also moved into mainstream retail trade. The
conventional food industry has also increasingly become involved in organic product sales. While small
and medium sized processing companies still play a major role in the organic industry, major food
manufacturers and mainstream food markets, including big multinational companies are now developing
and marketing organic product lines (United Nations 2002; Pollan 2001).
The scale of organic food production in the United States is increasing. For example, in California,
the five largest organic farms produce half of the state’s $400 million organic production (Pollan 2001).
For example, the Pavich Family Farms in California has over 4000 acres of 100% certified organic soil
and an additional 500 acres in transition to organic (United Nations 2001).
The future market for certain organic products has much potential. Recent production trends indicate
a strong increase in organic product demand. For example, there was very large increase over 1992-97 of
organic milk cows (469%), layer hens (1,123%) and also broilers (120%). However, over the same period
the number of certified beef cows decreased by 35%, hogs and pigs by 65% and sheep and lamps by 42%.
5
In all, less then one percent of U.S. livestock production is certified organic, which can be explained by
the fact that there was no organic label for meat and poultry until February 1999, when USDA approved a
provisional label. After that, the market for organic meat started to grow (United Nations 2002).
According to Organic Trade Association’s (OTA) Export Study for U.S. Organic Products to Asia
and Europe, annual exports of organic products to the United Kingdom and Japan are currently valued at
$40 million and $40-60 million, respectively. U.S organic exports to Europe are growing approximately
15 percent per year, while exports to Japan are increasing by 30 to 50 percent a year (United Nations
2002).
Organic wheat markets appeared in the United States within the past decade (Greene and Dobbs
2001). Between 1995 and 1997, certified organic wheat production acres increased 31% from 96,100
acres to 125,687 acres. North Dakota is among the nation’s top producing states of organic wheat as well
as for organic products in general (Greene and Dobbs 2001).
Certified Organic Production Requirements The United States Department of Agriculture maintains rules for organic food production under
The Organic Food Production Act of 1990 (OFPA) that every organic food producing or handling
organization must follow. These rules define which operations may produce food that may be labeled
“100 percent organic,” “organic,” or “made with organic (specified ingredients or food group(s)).” Each
operation must have an organic system plan to be certified as an organic operation. The organic system
plan must include the following six parts:
1. The practices and procedures used in the certified operation,
2. A list and characterization of each substance used in production or handling,
3. The identification of the monitoring techniques used to verify that this production plan is being
implemented,
4. An explanation of the recordkeeping system used to preserve the identity of organic products
through the supply chain to the customer,

6
5. A description of the management practices used to prevent organic and non-organic products
from mixing during production and handling, and
6. Additional information necessary to evaluate site-specific compliance issues (United States
Department of Agriculture 2003).
In order to qualify as organic, a crop producer’s records must verify that the parcel of land or
field to be used to produce the crop has been managed in accordance with OFPA guidelines for at least 3
years. In addition, the organic fields must have distinct boundaries with buffer zones from other non-
organic fields to prevent the production process from being contaminated with any prohibitive substances.
The farmer must also ensure that soil fertility, including tillage and cultivation practices, is
conducted in a sustainable manner. Practices cannot destroy the physical, chemical, or biological
condition of the soil. The producer must use animal and plant materials that do not increase crop, soil, or
water contamination from plant nutrients, pathogenic organisms, heavy metals, or residues of prohibited
substances.
Further, the producer can only use pre-approved crop nutrient and soil amendments that include
those on the national list of synthetic substances allowed in organic crop production. All of the seedlings
and seeds used in the production process must be organically propagated. Crop rotations must be used to
maintain and improve the soil organic matter, manage pests in perennial crops, manage deficient or
excess plant nutrients, prevent crop pests, weeds and diseases, and control erosion when applicable
(United States Department of Agriculture 2003).
Total certified organic farmland increased from 935,000 acres in 1992 to 1,347,000 acres in 1997,
corresponding to an increase of 44%. Though organic cropland has increased rapidly in recent years, only
0.23% of all U.S. cropland was certified organic in 1997. At this time, 125,687 acres of land were
certified as organic wheat land (United Nations 2002).

7
Precision Agriculture Technology Precision Agriculture Technology or Site-Specific Management allows farmers to match
“resource application and agronomic practices with soil attributes and crop requirements as they vary
across a field” (University of Sydney 2003). The technology makes precise, strategic responses to minute
variation in soil quality and nutrition, weather (moisture and sunlight), and other environmental factors
(including susceptibility to insect infestation) across and within fields. Computers and global satellite
systems bring new levels of precision to information gathering that would have traditionally been done
with pencil, paper, and manual measure instruments. This is especially true for farmers with larger areas
of land where it would be difficult to monitor crop needs and variability on a meter by meter basis
(Lowenberg-Deboer 2003).
The different types of precision agriculture include Variable Rate Technology (VRT), Soil
Sensing, Yield Monitoring, Global Positioning Satellites (GPS), and Geographic Information Systems
(GIS). The key technology that coordinates the others is GPS. A system of 24 satellites is used to map
out and pin point locations anywhere on the earth. It can then be used to create field maps using GIS
software that include information about soil moisture and quality, crop yield levels, pesticide and
herbicide application levels, and seeding rates. The Soil Sensing technology is attached to field
implements and can monitor soil health characteristics as the implement moves through the field. This
can then be used to determine the level of fertilizers to be used at different locations in the field using
VRT. VRT is integrated into the implement system to adjust the farming methods used in different parts
of the field. For example, if it is part of the planting system it will control the seeding rate across the
field, varying it as needed in different areas of the field. VRT can also be used to control tillage depth,
fertilizer application rates, and the amount of irrigation used in different parts of the field. The yield
monitor system is attached to the harvesting machinery (e.g. combine in a wheat harvest situation) to
measure the amount of grain produced in different parts of the field as it comes into the combine (John
Deere 2003; Clark and McGuckin 1996).

8
An outline of the precision agriculture process and its technical value to the farming process is
outlined in Figure 1. Spatial referencing or the ability to convert GPS information into tangible mapping
systems using GIS is central to precision agriculture. This enables farmers to map how attributes vary
across their fields and monitor changes in soil and climate differences across the fields. The VRT is used
for differential action or to implement site-specific production practices across the field. The different
technologies combine to provide the farmer with a decision support system that can then be used to
decide how different fields and areas within those fields should be treated. The outcomes of these
management decisions can then be monitored using the other systems post-decision (University of
Sydney 2003).
Figure 1: The Integration of Precision Agriculture systems
Source: The University of Sydney (2003)
9
Why this is important for organic wheat production? The information requirements for organic
food production are high. As was mentioned earlier, to be certified organic, a farmer must keep three
years of records verifying that he has complied with organic production requirements. It is possible for
the farmer to keep these records without the aid of precision agriculture. However, the labor and time
involved with doing this becomes great as farm size increases. For example, if a farmer is growing a few
acres of garden vegetables for a local farmers’ market it is not difficult to track and measure how much
pesticide and fertilizer and how many seeds are used on a per foot or per meter bases. One can take a
notebook and measuring instruments out to the field on a regular basis and write down the needed
information. However, as the farm size grows, this becomes a cumbersome task. In South Central North
Dakota, the average farm size is 1,063 acres (National Agricultural Statistics 2003a). It would be
difficult, if not impossible, to manually monitor the soil and crop characteristics precisely, within field, on
a farm of this size. Therefore, precision agriculture technology would have great value to farmers who
are trying to gather the information and gain organic certification for their wheat.
Section 2: Review of Real Options Theory and Research Methodology and Data
Review of Real Options Theory and Research Methodology Although the price premiums and market growth rates for organic commodities are attractive, the
decision to become an organic producer is not straight forward. It is costly to enter organic production.
A farmer must give up revenue associated with conventional wheat and barley production for the first
three years. During this time, he will be producing lower, organic yield levels and receiving the standard
market price without the organic premium because their products are not certified yet. The farmer will
also spend more valuable time marketing his crop to organic markets (North Dakota State University
Extension 2002b). In addition, the farmer does not know if the price premiums for the organic
commodity he or she plans to produce will still exist after the transitional period. There is uncertainty
about the strength of the organic premium due to the following factors:
10
• As more farmers try to take advantage of the organic premium over the next three years,
oversupply may reduce price premiums (United Nations 2002).
• Prices of most organic products tend to fluctuate over time and market requirements change
frequently. There is increased volatility in organic premiums and they may be low or
negative three years from now (North Dakota State University Extension 2002b; United
Nations 2002)
• Developing countries consider the U.S. as a possible large buyer of organic products and thus
may seek to capture considerable organic market shares in the U.S. It is especially relevant
for fruits and vegetables, sugars and other sweeteners, organic wine, food additives, and
processed food products. It is less relevant for meat, dairy products and eggs because there
does not seem to be much import demand for most of these products. With respect to grains,
the U.S. is a large producer of organic traditional grains such as wheat, rice, millet, kamut,
buckwheat, and etc. Nevertheless, it is large importer of rice and of non-traditional cereals
like amaranth and quinoa, mostly produced in Latin America (e.g. Bolivia, Brazil, Mexico
and Peru) (United Nations 2002).
A net present value (NPV) analysis can be used to access whether the decision to begin producing
organic food is a viable one. However, it is not easy to account for the uncertainty surrounding the
organic price premium after three years of production. Furthermore, the traditional NPV analysis
assumes that investments are reversible and the current decision is a now or never opportunity (Dixit and
Pindyck 1994). The three transitional years during which a producer awaits certification are irreversible.
Forgone revenue cannot be recovered and the grower does not receive from another source a salvage
value for his time and money spent to become certified organic. The farmer does, however, have a choice
as to when he or she enters the organic wheat and barley market. Depending on the particular producer’s
perception of uncertainty about future price premiums, the farmer can wait and delay an investment until
more is known.
11
This analysis will use Real Options theory to analyze the farmer’s decision to invest in organic
food production. Real options methodology differs from NPV analysis because it puts value on the ability
to delay investment under uncertainty. The NPV rules states “invest when the value of a unit of capital is
at least as large as its purchase and installation costs” (Dixit and Pindyck 1994). Real options modifies
the rule to invest when “the value of the unit [of capital] must exceed the purchase and installation costs
by an amount equal to the value of keeping the investment option alive” (Dixit and Pindyck 1994).
When a firm decides to invest now and not wait for new information, the lost option value is an
opportunity cost that must be included as a part of the cost of the investment. According to Dixit and
Pindyck (1994), this opportunity cost of investment can be large and the NPV rule should be modified in
order to account for this cost. If you could delay investment until some period in the future when
uncertainty will be resolved, the NPV of the project may be larger than if you start investment now.
Using the real options framework, the firms with an investment opportunity are holding “options” that are
analogous to a financial call option. The option gives the firm the opportunity to make an investment
now or in the future. When it does make an irreversible investment, it exercises its option.
Following Dixit and Pindyck (1994), we could develop an expected NPV based on the probability (q)
of receiving a high (H) or low (L) present value of future cash flows from organic production (e.g. with
and without a future organic price premium) where
NPV = - initial outlay + q(H) + (1-q)(L). (Equation 1)
However, this assumes there is no opportunity to wait to make the decision to start organic
production later. If the farmer decides not to invest today, he or she can delay the investment in organic
production for some period t until uncertainty about the future of the organic market is resolved. At that
point, he or she will only start to produce organic products if there is a price premium for organic
production. This creates a new NPV. In this NPV, both the initial investment and future cash flows are
discounted to the present by the cost of capital (r), but there is still only the probability q that the
investment will occur or
12
NPV = q[(-initial outlay + H)/(1+r)t] (Equation 2)
where t represents length of delay (assuming this NPV is higher then the farmer’s initial NPV). The
difference between the NPV of waiting until period t to invest and the NPV of investing today creates an
option value. The flexibility of waiting adds value to the investment project.
Different forces within the market may limit the option value (e.g. if there is limited room in the
market and time to invest (Dixit and Pindyck 1994)). In our problem, this is a high priority concern. The
size of our farm relative to the market is small. Also, agriculture is a relatively competitive industry so it
will be hard to gain market share. There are, however, some time limitations set by the organic
certification requirements. If a farmer achieves them too late, he or she may enter the organic market
when it is declining instead of growing and there is no or a reduced price premium for organic durum
wheat.
In this study we adopt an approach developed by Luehrman (1998) to evaluate the investment
project with an option to postpone investment. In his approach the probability distribution over future
cash flows generated by the project is represented by variance of project returns. That is, we do not need
to explicitly assign probabilities to all possible states.
We assume that the investment project has two stages. The first stage starts now, at period zero.
The second stage starts period td1 from now and requires initial outlay X. This second stage will be started
only if there is a good state in period td. In our case, the good state corresponds to high organic premiums.
The farm has an option to wait and see what happens in period td. If the farmer decides not to start in the
second stage, he or she will continue with the first stage conventional production decision and receive the
NPV associated with it.
In order to calculate the value of the option to invest in second stage, one must know the variance
of returns generated by the second stage (σ2), the present value of the assets acquired through the
investment (S), the expenditure or opportunity cost of acquiring the assets (X), the length of time the
1 The subscript d comes from the “deterrent” investment.
13
decision may be deferred (td), and the time value of money (Luehrman 1998). In our analysis, instead of
using time value of money, we use cost of capital2 r. Traditional NPV analysis would say that if the
difference between S and X is positive, then invest. The real options approach changes the relationship
between S and X to S divided by the present value of X or PV(X) or
NPVq = )(XPV
S, (Equation 3)
where PV(X) = X/(1+r)td. PV(X) takes account for the fact that X, the cost of the investment or
exercising the option, can be delayed until the next phase. It is the present value of the money needed for
the investment td from now.
The next step in calculating the value of the real option is to incorporate the cumulative volatility
of the returns on the asset, or on the investment project. Real options theory takes into account that
volatility increases over time. In order to account for this we use the variation in net farm income in
North Dakota (σ2) as a proxy for the variation of the returns from the project, and multiply it by the
amount of time until the beginning of phase two (t). The σ2t allows us to measure the probability that the
prices (because farm income is derived in part from the production prices) will be far away from average
prices (Luehrman 1998). We take the square root of σ2t and work with it because it is in the same units
(dollars instead of dollars squared) as the cash flows we are concerned about. In our analysis we then
multiply σ t by some coefficient larger than one (1+Ω) to reflect the fact that organic production is
more risky than agricultural production in general. Using NPVq and our adjusted measure of cumulative
volatility ((1+Ω)σ t ), we calculated the option value using the Black-Scholes option pricing model to
2 As will be shown later, the initial outlay to start the second stage is represented by the negative cash flows from organic production plus forgone cash flows from conventional production during the first three years of organic production. One cannot put this money in the bank and earn a time value of money over period td. That is why cost of capital, not time value of money, is more appropriate opportunity cost for this initial outlay.
14
get the value of the option as a percentage of asset price S.3 Then, the NPV of the project is equal to the
sum of the NPV of the first stage and the option value to start the second stage.
Several production scenarios were evaluated and compared. The first scenario is simply the
conventional production of barley and durum wheat over the next 10 years. The second scenario includes
the adoption of PA technology to grow conventional barley and durum. The third scenario is the
investment into PA technology with the simultaneous start of organic production of durum wheat and
barley today without an option to delay organic production. The fourth scenario incorporates investment
into PA technology to grow conventional products with an option to start organic production when
uncertainty about the future of organic products market will be resolved in the future. To analyze the first
three scenarios we use a simple NPV approach and for the fourth scenario we adopt a real options
approach.
Data Crop budget information from the North Dakota State Extension Service (2002a, 2002b) is used
to determine the net cash flows of organic farming and conventional farming with and without precision
agriculture. Organic and non-organic budgets for a five year crop rotation of barley, wheat, and fallow
are developed. During the first four years, there are alternating rotations of wheat and barley. In the fifth
year, the land is planted to sweet clover; green manure is spread (it is assumed to be free), and then it is
left to lay fallow until the sixth year planting season. In the non-organic rotation green manure is spread
without planting green clover during the fallow year because nitrogen can be delivered through nitrogen
fertilizer. The crop budgets employed in the real options analysis are displayed in Appendix 1 (Tables 3-
6). We assume that the farm size is 1,063 acres, which corresponds to the average farm size in North
Dakota (National Agricultural Statistics Service 2003).
3 The Black – Scholes model was not explicitly used. Luerhman (1998) provides a table which shows for each (σ t ) and NPVq the corresponding Black-Scholes value of a European call option, expressed as a percentage of underlying asset value.
15
Cost information for precision agriculture technology came from a variety of sources. The GIS
and GPS technology costs are those of Farmworks.com (2003). The cost of GIS software is $500 and the
cost of GPS technology is $300. They are included in the initial outlay along with the VRT and yield
monitor. VRT is expected to cost a minimum of $15,000 and the yield monitor will cost a minimum of
$7,000 (Casady et al. 1999). Soil sensing cost information is assumed to be included in the annual
average net return from precision agriculture management used for the different crops (Goodwin et al.
1999; Carr et al. 1999). We assume that these net returns from PA are the same for conventional and
organic production. The NPV analysis is done in real terms. The discount rate r = 0.11 represents
weighted average cost of capital in real terms:
r = (1+ rn)/(1+i) -1,
where: the nominal discount rate is rn = (1- t)*wd*rd + we*re with
t = tax rate and is 15% ,
wd = debt to asset ratio is 0.4,
rd = nominal interest rate is 6.5%,
wd = equity to asset ratio is 0.6,
re = cost of equity is 16% .
wd, rd , we and re are taken from North Dakota Farm Business Management Education Program
State Report and represent average for upper 20% farms ranged by profitability. 15% tax rate correspond
to farm with annual net farm income less than $40 000. The rate of inflation is 3% (Federal Reserve
Bank, 2003).
Section 3: Results and Analysis
The scenarios that we consider are: 1) conventional production, 2) conventional production with
PA, 3) organic production with PA, 4) conventional production with PA and an option to switch to
organic production with PA when uncertainty about the future of the organic products market will be

16
resolved. The NPVs of the four scenarios are shown in Table 1. In the NPV analyses, we do not include a
salvage value for the farm land at the end of 10 years in any of the scenarios. It is assumed that the value
of land itself stays the same across scenarios. What is important, however, is that there is an implied value
of information resulting from precision farming. This information should be more valuable for the
organic production scenarios than for the conventional production scenario.
Table 1: Net present values of different scenarios
Scenario Project NPV
(Dollars) 1 Conventional Production 30,510 2 Conventional Production with PA 43,849
3 Organic production with PA if organic production is started 19,750
4 Conventional production with PA and an option to enter organic production in 3 years 54,839
In the first scenario, conventional production of durum wheat and barley without the precision
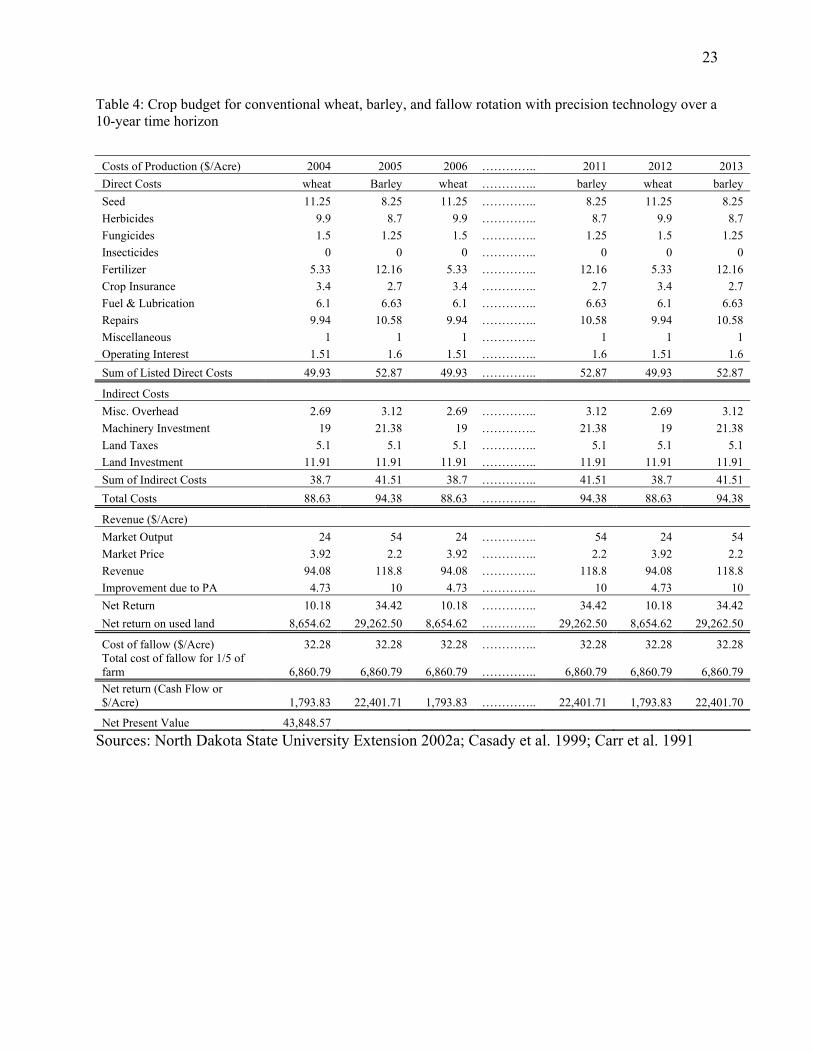
agriculture (PA) technology, has an NPV of $30,510 (Table 3). In the second scenario, we consider the
implementation of PA technology with conventional production on the farm over the same investment
horizon. The initial investment outlay to implement PA technology in 2004 is $22,800 and consists of
purchase prices of equipment for VRT, yield monitoring, GPS and GIS. The implementation of PA on
the farm yields an NPV of $43,849 (Table 4), which is higher than the NPV for conventional production.
Hence, a $13,339 gain in NPV is achieved because of better yields attributed to the implementation of PA
via VRT.
This gain also represents an implicit value of the information gained from adopting PA to
improve yields through better management of field applications (fertilizer, insecticides, seeding rates,
etc.). Also, it should be pointed out that there is an option to invest into PA technology later, and this
option does not have any value. The cost of PA equipment is stable over time and the postponed decision

17
to invest leads to lost positive net returns from PA. That is, the farmer will only lose by postponing
investment into PA.
The third scenario considers that the farm starts organic production in 2004 and has also
implemented PA into its production practices. The time horizon for the investment analysis is 10 years.
While the crop is transitioned to meet organic specification during the first three years, organic premiums
will not be received and the grower’s output will be sold at the lower conventional product price level. In
addition, yields will be lower than with conventional production (see Table 5 for details). These two
factors lead to negative cash flows in first three years of the NPV analysis.
However, the transition period (2004-2006) remains valuable because of a learning curve effect.
As the grower gains experience with growing organic wheat and barley, he also begins to understand the
nuances of organic production. In this study, the “positive learning effect” is measured by a coefficient
arbitrarily chosen as 1.05. It is assumed that learning leads to a more efficient production and we multiply
each yield by this coefficient starting in 2007.
Once the grower becomes certified as an organic producer, he then receives the organic premium
for his crop. An organic premium provides large cash flows starting in 2007 until 2013. But, the premium
is only available if the organic product market still exists and prices are relatively higher than those
received for non-organic wheat and barley. Assuming these conditions for a favorable organic market
exists in the future, then the NPV of this scenario is $66,096.
However, if market conditions turn out to be worse than anticipated, and organic products can not
be sold at a premium, or taking the extreme, could only be sold at conventional products price levels, then
this scenario results in disaster. The continuation of organic production in such unfavorable conditions
leads to an NPV of - $114,608 for the 10-year investment horizon (assuming the conventional prices are
being received for similar organic products, i.e. no premium) (see Table 6). If organic prices remain low
and the wheat producer decides to “cut his losses” and switches back to conventional production after
three years, NPV will be -$26,956.
18
Assigning probability 0.5 to the favorable state (NPV of $66,096) and 0.5 to the unfavorable state
(NPV of -$26,956) yields an expected NPV of $19,750 (Table 6). When compared with the NPV of
conventional production with PA (NPV of $43,849), the comparison reveals that organic production with
PA should not be undertaken.
However, this conclusion is somewhat incorrect because the decision to enter organic production
can be postponed. Let’s assume that the uncertainty of the future of an organic market for wheat is
resolved by the end of 2003. Then, given the prices and market size at the end of 2003, the decision to
enter the organic product segment or not can be made. The producer has an option to wait until
uncertainty is resolved, and this option has value. To estimate an investment NPV, which incorporates the
option to invest in organic production, we adopt the NPVq approach proposed by Luehrman (1998).
This fourth scenario begins with the grower producing his product using a conventional method
through the use of PA technology. After three years, if market conditions appear to be unfavorable for
organic production, the farmer will continue to produce conventional products. If organic market
conditions appear to be favorable, the farmer switches from conventional production to organic
production in 2007 and has negative cash flows for the 2007, 2008, and 2009 because of the mandatory
three year waiting period before certification. Then, in 2009 the grower sees positive payoffs from
organic production. Again, the period 2007-2009 is valuable because of the knowledge the producer is
gaining from organic production. Each annual yield is then multiplied by the learning coefficient of 1.05
starting in 2010.
Following Luehrman (1998), we divide our fourth scenario into two phases. The first phase
corresponds to conventional production with PA starting in 2004 and continuing until 2013 if organic
production is not undertaken. The first phase is equivalent to scenario 2 and yields a net present value of
the first phase (NPV1) of $43,489 (Table 2). The second phase starts in 2007 and begins only if market
conditions are favorable for organic production. We treat the negative cash flows from organic production
during 2007-2009 plus forgone cash flows from conventional production during 2007-2009 as the initial
investment into organic production. This initial outlay is then discounted back to the beginning of 2004.
19
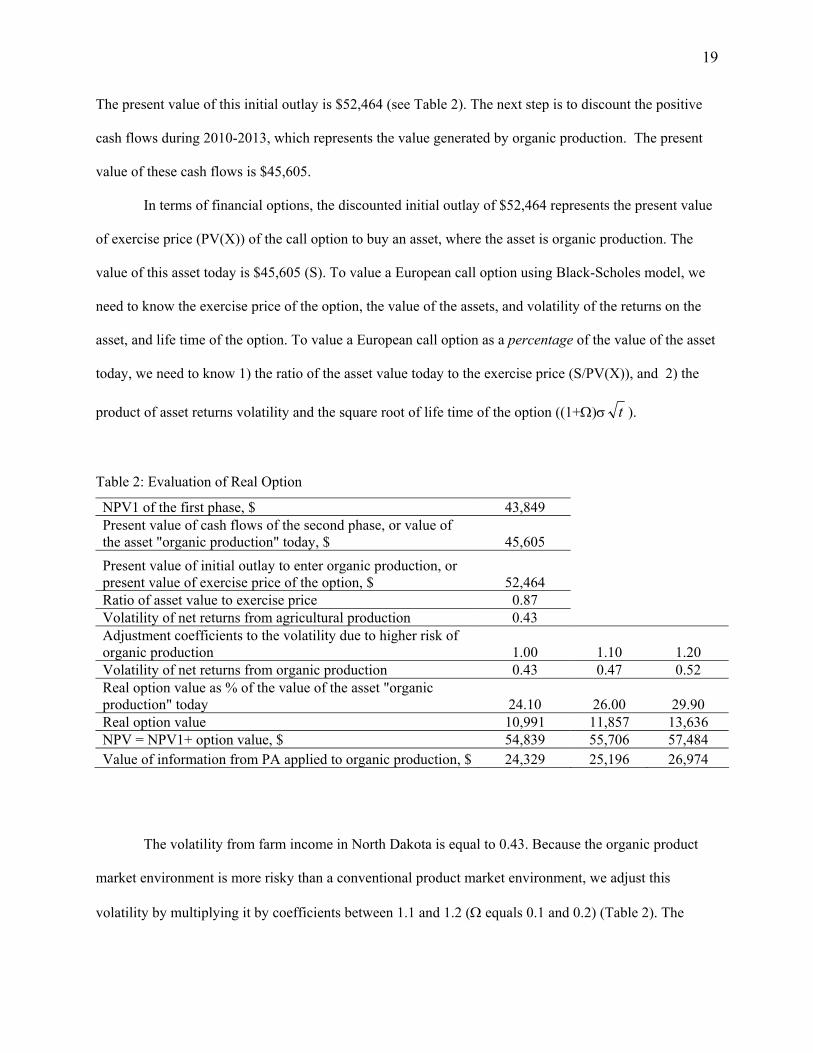
The present value of this initial outlay is $52,464 (see Table 2). The next step is to discount the positive
cash flows during 2010-2013, which represents the value generated by organic production. The present
value of these cash flows is $45,605.
In terms of financial options, the discounted initial outlay of $52,464 represents the present value
of exercise price (PV(X)) of the call option to buy an asset, where the asset is organic production. The
value of this asset today is $45,605 (S). To value a European call option using Black-Scholes model, we
need to know the exercise price of the option, the value of the assets, and volatility of the returns on the
asset, and life time of the option. To value a European call option as a percentage of the value of the asset
today, we need to know 1) the ratio of the asset value today to the exercise price (S/PV(X)), and 2) the
product of asset returns volatility and the square root of life time of the option ((1+Ω)σ t ).
Table 2: Evaluation of Real Option
NPV1 of the first phase, $ 43,849 Present value of cash flows of the second phase, or value of the asset "organic production" today, $ 45,605 Present value of initial outlay to enter organic production, or present value of exercise price of the option, $ 52,464 Ratio of asset value to exercise price 0.87 Volatility of net returns from agricultural production 0.43 Adjustment coefficients to the volatility due to higher risk of organic production 1.00 1.10 1.20 Volatility of net returns from organic production 0.43 0.47 0.52 Real option value as % of the value of the asset "organic production" today 24.10 26.00 29.90 Real option value 10,991 11,857 13,636 NPV = NPV1+ option value, $ 54,839 55,706 57,484 Value of information from PA applied to organic production, $ 24,329 25,196 26,974
The volatility from farm income in North Dakota is equal to 0.43. Because the organic product
market environment is more risky than a conventional product market environment, we adjust this
volatility by multiplying it by coefficients between 1.1 and 1.2 (Ω equals 0.1 and 0.2) (Table 2). The
20
lifetime of the option is three years. For our project, the ratio of the underlying asset value to the exercise
price is 0.87 (S/PV(X)) (Table 2).
According to Luehrman (1998), the value of the call option with 1) a life time of three years, 2) a
ratio of asset value to exercise price of 0.87, and 3) a volatility of returns equal to 0.43, 0.47, 0.52 is
24.1%, 26% and 29.9% of the present value of the asset, respectively. Depending on the volatility of the
returns generated by the project, the value of the option to wait is $10,991 if volatility of returns is 0.43,
$11,857 if volatility is 0.47, and $13,636 if volatility is 0.52.
Values for Phase 1 and the option to invest in Phase 2 have now been identified. The value of the
first phase of the project (which again is equivalent to conventional production with PA) plus the value of
the option is equal to the value of the investment project. When the volatility of the project returns is
0.43, 0.47 and 0.52, corresponding NPVs of the project are $54,839, $55,706 and $57,484 (Table 2). In
other words, the higher the level of uncertainty, the higher the option value. In turn, there is a higher
value for the project.
The implicit value of the information obtained through the use of PA for growing organic crops
varies with the level of uncertainty as well. The value of information is determined to be the difference
between NPV of the conventional production project with an option to start organic production and the
NPV of the first scenario (which is conventional production only). The implied value of information is
$24,330, $25,196, and $26,975 for the three levels of uncertainty, respectively (Table 2).
Section 4: Concluding Remarks
The objective of this research was to measure the real options value an average farmer in south
central North Dakota holds for entering the organic Durum wheat and barley market. An application of
real options theory was employed to measure the value of investing in organic Durum wheat and barley
production using precision agriculture technology now versus a future date.
While the option to postpone an investment into PA doesn’t have any value, the option to wait
until uncertainty surrounding organic production environment is resolved is valuable. For different levels
21
of uncertainty (0.43, 0.47, and 0.52), this option value is $10,991, $11,857 and $13,636, respectively. The
Net Present Values of the conventional production with PA with an option to enter organic production are
$54,839, $55,706 and $57,484 for the respective levels of uncertainty.
It is important to note that the option value doesn’t account for any salvage value at the end of the
10-year period. If a farmer begins organic production, at the end of the 10-year horizon he will have
gained a market position and have established a reputation as an organic producer. This market position
has value and can be approximated by a present value of future organic premiums that could be obtained.
Moreover, the value of this market position will be enhanced by the detailed data provided by PA
technology. Hence, the value of the option that found in the study represents only lower bound.
As a direction for research, we suggest that future studies not only consider the option to
postpone an investment in order to gain information about the future of organic markets, but also an
option to grow. The “dueling” options approach proposed by Folta and O’Brien (2002) can be explored.
In their approach, an option to postpone discourages entry in the presence of uncertainty, while an option
to grow may encourage entry in the presence of uncertainty when there is an earlier mover advantage.

22
Appendix 1
Table 3: Crop budget for conventional wheat, barley, and fallow rotation without precision technology over a 10-year time horizon
Costs of Production ($/Acre) 2004 2005 2006 ………… 2012 2013 2014 Direct Costs durum barley durum ………… durum barley durum Seed 11.25 8.25 11.25 ………… 11.25 8.25 11.25 Herbicides 9.90 8.70 9.90 ………… 9.90 8.70 9.90 Fungicides 1.50 1.25 1.50 ………… 1.50 1.25 1.50 Insecticides 0.00 0.00 0.00 ………… 0.00 0.00 0.00 Fertilizer 5.33 12.16 5.33 ………… 5.33 12.16 5.33 Crop Insurance 3.40 2.70 3.40 ………… 3.40 2.70 3.40 Fuel & Lubrication 6.10 6.63 6.10 ………… 6.10 6.63 6.10 Repairs 9.94 10.58 9.94 ………… 9.94 10.58 9.94 Miscellaneous 1.00 1.00 1.00 ………… 1.00 1.00 1.00 Operating Interest 1.51 1.60 1.51 ………… 1.51 1.60 1.51 Sum of Listed Direct Costs 49.93 52.87 49.93 ………… 49.93 52.87 49.93 Indirect Costs Misc. Overhead 2.69 3.12 2.69 ………… 2.69 3.12 2.69 Machinery Investment 19.00 21.38 19.00 ………… 19.00 21.38 19.00 Land Taxes 5.10 5.10 5.10 ………… 5.10 5.10 5.10 Land Investment 11.91 11.91 11.91 ………… 11.91 11.91 11.91 Sum of Indirect Costs 38.70 41.51 38.70 ………… 38.70 41.51 38.70 Total Costs 88.63 94.38 88.63 ………… 88.63 94.38 88.63 Revenue ($/Acre) Market Output (Bushels/Acre) 24 54 24.00 ………… 24.00 54.00 24.00 Market Price 3.92 2.2 3.92 ………… 3.92 2.20 3.92 Revenue 94.08 118.8 94.08 ………… 94.08 118.80 94.08 Net Return 5.45 24.42 5.45 ………… 5.45 24.42 5.45 Net return on used land 4,633.37 20,760.91 4,633.37 ………… 4,633.37 20,760.91 4,633.37 Cost of fallow ($/acre) 32.28 32.28 32.28 ………… 32.28 32.28 32.28 (Total cost for 1/5 of farm) 6,860.79 6,860.79 6,860.79 ………… 6,860.79 6,860.79 6,860.79 Net farm return (Cash Flow) ($/Acre) -2,227.42 13,900.12 -2,227.42 ………… -2,227.42 13,900.12
-2,227.42
Net Present Value 30,509.87 Source: North Dakota State University Extension 2002a.
23
Table 4: Crop budget for conventional wheat, barley, and fallow rotation with precision technology over a 10-year time horizon
Costs of Production ($/Acre) 2004 2005 2006 ………….. 2011 2012 2013 Direct Costs wheat Barley wheat ………….. barley wheat barley Seed 11.25 8.25 11.25 ………….. 8.25 11.25 8.25 Herbicides 9.9 8.7 9.9 ………….. 8.7 9.9 8.7 Fungicides 1.5 1.25 1.5 ………….. 1.25 1.5 1.25 Insecticides 0 0 0 ………….. 0 0 0 Fertilizer 5.33 12.16 5.33 ………….. 12.16 5.33 12.16 Crop Insurance 3.4 2.7 3.4 ………….. 2.7 3.4 2.7 Fuel & Lubrication 6.1 6.63 6.1 ………….. 6.63 6.1 6.63 Repairs 9.94 10.58 9.94 ………….. 10.58 9.94 10.58 Miscellaneous 1 1 1 ………….. 1 1 1 Operating Interest 1.51 1.6 1.51 ………….. 1.6 1.51 1.6 Sum of Listed Direct Costs 49.93 52.87 49.93 ………….. 52.87 49.93 52.87
Indirect Costs Misc. Overhead 2.69 3.12 2.69 ………….. 3.12 2.69 3.12 Machinery Investment 19 21.38 19 ………….. 21.38 19 21.38 Land Taxes 5.1 5.1 5.1 ………….. 5.1 5.1 5.1 Land Investment 11.91 11.91 11.91 ………….. 11.91 11.91 11.91 Sum of Indirect Costs 38.7 41.51 38.7 ………….. 41.51 38.7 41.51 Total Costs 88.63 94.38 88.63 ………….. 94.38 88.63 94.38
Revenue ($/Acre) Market Output 24 54 24 ………….. 54 24 54 Market Price 3.92 2.2 3.92 ………….. 2.2 3.92 2.2 Revenue 94.08 118.8 94.08 ………….. 118.8 94.08 118.8 Improvement due to PA 4.73 10 4.73 ………….. 10 4.73 10 Net Return 10.18 34.42 10.18 ………….. 34.42 10.18 34.42 Net return on used land 8,654.62 29,262.50 8,654.62 ………….. 29,262.50 8,654.62 29,262.50
Cost of fallow ($/Acre) 32.28 32.28 32.28 ………….. 32.28 32.28 32.28 Total cost of fallow for 1/5 of farm 6,860.79 6,860.79 6,860.79 ………….. 6,860.79 6,860.79 6,860.79 Net return (Cash Flow or $/Acre) 1,793.83 22,401.71 1,793.83 ………….. 22,401.71 1,793.83 22,401.70
Net Present Value 43,848.57 Sources: North Dakota State University Extension 2002a; Casady et al. 1999; Carr et al. 1991

24
Table 5: Crop budget for an organic wheat, barley and fallow rotation with precision technology with persistent organic price premiums over a 10-year time horizon
Costs of Production ($/Acre) 2004 2005 2006 ………….. 2011 2012 2013 Direct Costs durum Barley durum ………….. barley durum barley Seed 21 15 21 ………….. 15 21 15 Crop Insurance 3.4 2.7 3.4 ………….. 2.7 3.4 2.7 Fuel & Lubrication 6.37 6.77 6.37 ………….. 6.77 6.37 6.77 Repairs 10.25 10.74 10.25 ………….. 10.74 10.25 10.74 Hauling To Market 9 16.4 9 ………….. 16.4 9 16.4 Operating Interest 1.56 1.61 1.56 ………….. 1.61 1.56 1.61 Sum of Listed Direct Costs 51.58 53.22 51.58 ………….. 53.22 51.58 53.22
Indirect Costs ($/Acre) Misc. Overhead 4.67 5.01 4.67 ………….. 5.01 4.67 5.01 Machinery Investment 19.35 21.18 19.35 ………….. 21.18 19.35 21.18 Land Taxes 5.1 5.1 5.1 ………….. 5.1 5.1 5.1 Land Investment 11.91 11.97 11.91 ………….. 11.97 11.91 11.97 Sum of Indirect Costs 41.03 43.26 41.03 ………….. 43.26 41.03 43.26 Total costs ($/Acre) 92.61 96.48 92.61 ………….. 96.48 92.61 96.48
Revenue Market Output (bu/acre) 18 41 18 ………….. 43.05 18.9 43.05 Market Price ($/bu) 3.92 2.2 3.92 ………….. 3.6 7.5 3.6 Revenue ($/Acre) 70.56 90.2 70.56 ………….. 154.98 141.75 154.98 Improvement due to PA ($/acre) 4.73 10 4.73 ………….. 10 4.73 10 Net return ($/Acre) -17.32 3.72 -17.32 ………….. 68.5 53.87 68.5 Net return on used land -14,724.77 3,162.59 -14,724.77 ………….. 58,235.96 45,798.11 58,235.96
Cost of fallow ($/Acre) 54.76 54.76 54.76 ………….. 54.76 54.76 54.76 Total cost of fallow for 1/5 of farm 11,638.69 11,638.69 11,638.69 ………….. 11,638.69 11,638.69 11,638.69
Net return ($/Acre cash flow) -26,363.46 -8,476.09 -26,363.46 ………….. 46,597.26 34,159.42 46,597.26
Net Present Value 66,096.10 Sources: North Dakota State University Extension 2002b; Casady et al. 1999; Carr et al. 1991

25
Table 6: Crop budget for an organic wheat, barley and fallow rotation with precision technology with diminishing organic price premiums over a 10-year time horizon
Costs of Production ($/acre) 2004 2005 2006 ……. 2011 2012 2013 Direct Costs durum barley durum …… barley durum Barley Seed 21 15 21 …… 15 21 15 Crop Insurance 3.4 2.7 3.4 …… 2.7 3.4 2.7 Fuel & Lubrication 6.37 6.77 6.37 …… 6.77 6.37 6.77 Repairs 10.25 10.74 10.25 …… 10.74 10.25 10.74 Hauling To Market 9 16.4 9 …… 16.4 9 16.4 Operating Interest 1.56 1.61 1.56 …… 1.61 1.56 1.61 Sum of Listed Direct Costs 51.58 53.22 51.58 …… 53.22 51.58 53.22
Indirect Costs ($/acre) Misc. Overhead 4.67 5.01 4.67 …… 5.01 4.67 5.01 Machinery Investment 19.35 21.18 19.35 …… 21.18 19.35 21.18 Land Taxes 5.1 5.1 5.1 …… 5.1 5.1 5.1 Land Investment 11.91 11.97 11.91 …… 11.97 11.91 11.97 Sum of Indirect Costs 41.03 43.26 41.03 …… 43.26 41.03 43.26 Total costs ($/Acre) 92.61 96.48 92.61 …… 96.48 92.61 96.48 Revenue Market Output (bu/acre) 18 41 18 …… 43.05 18.9 43.05 Market Price ($/acre) 3.92 2.2 3.92 …… 2.2 3.92 2.2 Revenue ($/acre) 70.56 90.2 70.56 …… 94.71 74.088 94.71 Improvement due to PA ($/acre) 4.73 10 4.73 …… 10 4.73 10 Net return ($/acre) -17.32 3.72 -17.32 …… 8.23 -13.792 8.23 Net return on used land -14,724.77 3,162.59 -14,724.77 …… 6,996.81 -11,725.40 6,996.81
Cost of fallow ($/acre) 54.76 54.76 54.76 …… 54.76 54.76 54.76 Total Cost of fallow for 1/5 of farm 11,638.69 11,638.69 11,638.69 …… 11,638.69 11,638.69 11,638.69 Net return ($/acre cash flow) -26,363.46 -8,476.09 -26,363.46 …… -4,641.87 -23,364.09 -4,641.87 Net Present Value -114,607.56
Sources: North Dakota State University Extension 2002a, 2002b; Casady et al. 1999; Carr et al. 1991
26
References Carr, P.M., G.R. Carlson, J.S. Jacobson, G.A. Nielson, and E.O. Skogley. 1991. Farming soils, not fields:
a strategy for increasing fertilizer profitability. Journal of Production Agriculture, 4 (1): 57-67. Quoted in Lambert, D. and J. Lowenberg-DeBoer. 2000. Precision Agriculture Profitability Review. Purdue University Site Specific Management Center. West Lafayette.
Casaday, William W., and Raymond E. Massey. 1999. The growth and development of precision
agriculture service providers. Precision agriculture: proceedings of the 4th international conference, July 19-22, 1757-1765, ASA/CSSA/SSSA. Quoted in Lambert, D. and J. Lowenberg-DeBoer. 2000. Precision Agriculture Profitability Review. Purdue University Site Specific Management Center. West Lafayette.
Clark, R.L., and R.L. McGuckin. 1996. Variable Rate Application Equipment for Precision Agriculture.
Retrieved from <http://www.engr.uga.edu/research/groups/precisionfarming/clark_vrt.html> on April 19, 2003.
Dixit, Avinash K. and Robert S. Pindyck. 1994. Investment under Uncertainty. Princeton: Princeton
University Press. Farmworks. 2003. Retrieved from <http://www.farmworks.com/> on April 19, 2003. Folta, Timothy B. and Jonathan P O’Brien. 2002. Entry in the Presence of Dueling Options. Krannert
Graduate School of Management, Purdue University. Manuscript submitted for editorial review. Goodwin, R.J., I. T. James, J. P. Welsh, and R. Earl. 1999. Managing spatially variable nitrogen – a
practical approach. Presented at the Annual ASEA meeting, Paper No. 99-142, 2950 Niles Road, St. Joseph, MI 49058-9659, USA. Quoted in Lambert, D. and J. Lowenberg-DeBoer. 2000. Precision Agriculture Profitability Review. Purdue University Site Specific Management Center. West Lafayette.
Greene, Catherine and Thomas Dobbs. “Organic Wheat Production in the United States: Expanding
Markets and Supplies.” Economic Research Service, Unites States Department of Agriculture. 2001.
John Deere. 2003. Sales and system information retrieved from
<http://www.deere.com/en_US/ag/servicesupport/ams/mobilecomponents.html?sidenavstate=100000000000001> on April 19, 2003.
Lowenberg-DeBoer, Jess. 2003. Conversations and consultation, 31 January to 5 May. Luehrman, Timothy A. 1998. Investment Opportunities as Real Options: Getting Started on the
Numbers. Harvard Business Review 76 (4): 51-61. National Agricultural Statistics Service. 2003. 1997 Census of Agriculture: Farm Numbers, Land in
Farms, and Coverage Size of Farms. Retrieved from <http://www.nass.usda.gov/census/census97/county/farms/index.htm> on May 3, 2003.
North Dakota State University Extension Service. 2002a. Projected 2003 Crop Budgets South Central
North Dakota, by Andrew Swenson and Ron Haugen. Fargo.
27
North Dakota State University Extension Service. 2002b. Projected 2003 Organic Crop Budgets South
Central North Dakota, by Andrew Swenson, Brad Brummond, and Ron Haugen. Fargo. North Dakota State University Extension Service. 2003. Crop Rotations for Managing Plant Disease.
Retrieved from <http://www.ext.nodak.edu/extpubs/plantsci/pests/pp705w.htm> April 26, 2003. North Dakota Wheat Commission. 2004. About Durum Wheat. <http://www.ndwheat.com/wi/durum/> Pollan, Michael. 2001. Behind the Organic-Industrial Complex. The New York Times. 14 April, on the
web edition. University of Sydney. 2003. Precision Agriculture Website. Retrieved from
http://www.usyd.edu.au/su/agric/acpa/pag.htm on April 16, 2002. United Nations. World Trade Organization. United Nations Conference on Trade and Development.
2002. The United States Market for Organic Food and Beverages. Prepared by Mr. Rudy Kortbech-Olesen, Senior Market Development Advisor.
U.S. Department of Agriculture. Economic Research Service. 2001. Organic Wheat Production in the
United States: Expanding Markets and Supplies, by Catherine Greene and Thomas Dobbs. Washington D.C.
U. S. Department of Agriculture. 2003. The National Organic Program. Retrieved from
<http://www.ams.usda.gov/nop/NOP/standards /ProdHandPre.html> on April 2, 2003. U. S. Department of Agriculture. 2003a. 1997 Census of Agriculture: Farm Numbers, Land in Farms,
and Average Size of Farms. Retrieved from <http://www.nass.usda.gov/census/census97/county/farms/index.htm> on April 19, 2003.


![Descargar Microsoft Office 2013 Full + Activador 2014 [Mediafire Mega] Descargar Gratis](https://img.pdfslide.us/doc/110x75/55cf94c8550346f57ba459af/descargar-microsoft-office-2013-full-activador-2014-mediafire-mega-descargar.jpg)