Embed Size (px)
Citation preview
Desalination in Pacific Island Countries.
A Preliminary Overview
Alan Freshwater
Coordinator, Drinking Water Safety Planning,
SOPAC Water and Sanitation Programme
Deveraux Talagi
Attaché SOPAC Natural Resource Economics
Photo: AF
1
Contents
Acknowledgements .................................................................................................................................... 3 Acronyms ................................................................................................................................................... 3 Executive Summary ................................................................................................................................... 4
1. Introduction ................................................................................................................................................ 5
1.1 Desalination ............................................................................................................................................. 7
2. Desalination Technology............................................................................................................................ 8
2.1 Flash Distillation ................................................................................................................................... 8 2.2 Multistage Flash Distillation.................................................................................................................. 9 2.3 Multiple-effect Distillation...................................................................................................................... 9 2.4 Reverse Osmosis ............................................................................................................................... 10 2.5 Electrodialysis .................................................................................................................................... 11 2.6 Solar Distillation.................................................................................................................................. 11 2.7 Ion Exchange Desalination................................................................................................................. 15 2.8 Other Technologies ............................................................................................................................ 15 2.9 Alternative Energy Sources................................................................................................................ 15 2.10 Developments .................................................................................................................................. 15 2.11 Environmental issues: ...................................................................................................................... 17
3. Economics of Desalination....................................................................................................................... 19
3.1 Financial Feasibility ............................................................................................................................ 19 3.2 Economic Feasibility........................................................................................................................... 20 3.2.1 Economic Impacts ........................................................................................................................... 20 3.2.2 Social Impacts ................................................................................................................................. 21 3.3 Policy Implications.............................................................................................................................. 21
4. Desalination in the Pacific........................................................................................................................ 22
4.1 Tuvalu................................................................................................................................................. 22 4.2 Republic of Marshall Islands .............................................................................................................. 24 4.3 Nauru.................................................................................................................................................. 25 4.4 Kiribati ................................................................................................................................................ 27 4.5 Tonga ................................................................................................................................................. 28
5. Case studies ............................................................................................................................................ 31
5.1 Assessing the Financial Cost of Alternative Technologies................................................................. 31 5.2 Case Study 1 – Portable Reverse Osmosis Unit............................................................................... 32 5.3 Case Study 2 – Solar Desalination Stills ............................................................................................ 37 5.4 Cost Comparisons.............................................................................................................................. 38
6.0 Findings ................................................................................................................................................. 40
Conclusion and Recommendations.......................................................................................................... 43 References: .............................................................................................................................................. 45
Appendix A – Rain Water Harvesting .......................................................................................................... 47
2
Acknowledgements The authors would like to thank the following for their assistance, and information provided: Paula Holland, Manager, Natural Resources Governance, SOPAC Peter Sinclair, HYCOS, Water and Sanitation Programme, SOPAC Edwin Liava’a, HYCOS, Water and Sanitation Programme, SOPAC Llyod Smith, HYCOS, Water and Sanitation Programme, SOPAC Chelsea Giles-Hansen, WDM, Water and Sanitation Programme, SOPAC Robert Smith, Geophysicist, SOPAC Mr. Neil Towner, of Oceania Water Treatment Ltd. Mr. Stuart Eastaugh, of F-Cubed Australia Pty Ltd Bunnings Warehouse NZ Plumbing World NZ
NOTE Mention of specific companies or products in this paper does not imply any endorsement or recommendation by the authors or SOPAC and does not indicate any preference over others of a similar nature not mentioned.
Acronyms CBA Cost benefit analysis
CSIRO Commonwealth Scientific and Industrial Research Organisation
FEMA United States Federal Emergency Management Agency
KWH Kilo-Watt Hours
MED Multi Effect Distillation
MSF Multi stage flash
MW Megawatt
NUA Nauru Utilities Authority
PIC Pacific Island Countries
PV Photo-voltaic
RMI Republic of Marshall Islands
RO Reverse Osmosis
SOPAC Pacific Islands Applied Geo-Science Commission
UNEP United Nations Environment Program
WHO World Health Organization
m3 Cubic metre
m2 Square metre
3
Executive Summary The purpose of this paper is to provide an overview of current desalination technology and a
preliminary assessment of the potential for desalination in developing Pacific Island Countries.
Historical and current methods of desalination are discussed, with an overview of known desalination
plants in the Pacific. Two case studies are described, based on two different desalination technologies
with a baseline financial cost comparison of the two systems along with a preliminary assessment (in
appendix A), of the estimated cost of rehabilitating a typical community rainwater harvesting catchment,
for comparison.
The paper identifies that desalination technologies capable of producing significant quantities of water
generally have high capital and operational costs, the latter appearing to be a critical factor, directly
resulting in sustainability problems arising from difficulty in maintaining a budget for maintenance and
servicing. Indications are that a significant number of desalination plants fail in relatively short times
after commissioning. Reasons for failure are likely to include;
• Little or no operational or maintenance planning
• High running/maintenance costs (eg distillation and RO plants),
• Lack of technical expertise
• Lack of manufacturer support
From data for the cases presented and from the experience of Pacific Island Countries to date,
desalination plants in the Pacific appear excessively costly. It would be prudent to fully explore
alternatives before committing to desalination technology. The limited potential for desalination use in
Pacific countries at this time is mainly as a last resort where all other options have failed, or as an
emergency measure kept in readiness against a natural disaster. Governments, utilities and donor
agencies should be fully aware that for continued use over extended periods of time any water
treatment plant, but particularly a high technology, high cost system such as desalination, requires a
sound sustainability plan to be prepared and implemented as part of drinking water safety planning. A
more in-depth study should be undertaken of known desalination units in the Pacific, to identify the
factors which contribute to their success or failure. An economic analysis of each would also add
important data to the information which can be made available to use in future decision making to
ensure the viability and sustainability of future plans. It is also proposed that consideration be given to
developing guidelines to assist donors, agencies, Pacific island countries, utilities and communities in
evaluating and choosing appropriate technology to meet their specific drinking water needs.
4
1. Introduction Water, water, everywhere, nor any drop to drink.
The purpose of this paper is to provide an overview of current desalination technology and a
preliminary assessment of the potential for desalination in developing Pacific Island countries.
Only 2.5 percent of the water on Earth is fresh water. Approximately 37% of this is frozen; in glaciers
and at the poles. Another 62% is in underground aquifers, leaving the remaining 1% (0.06% of the
earth’s total reserves of water) available as fresh water on the surface, in streams, rivers and lakes.
Much of the underground and surface water is not conveniently located where it is needed, particularly
in the Pacific.
The US Geological Survey (2004) estimated that of the approximately 35 million km3 fresh water on, in
or above the earth, only around half, or 18 million km3, is available to humanity. 85% of this is
concentrated in 28 lakes, of which 12 are in North America. Canada alone has 20% of the world fresh
water reserves. The atmosphere contains an estimated 3,100 cubic miles (12,900 km3)) of water, as
invisible vapour and cloud. This is enough water to cover the entire surface of the Earth (land and
ocean) with almost one inch, (2.5 cm) of rain. However, where and when rain falls and becomes
available is unpredictable.
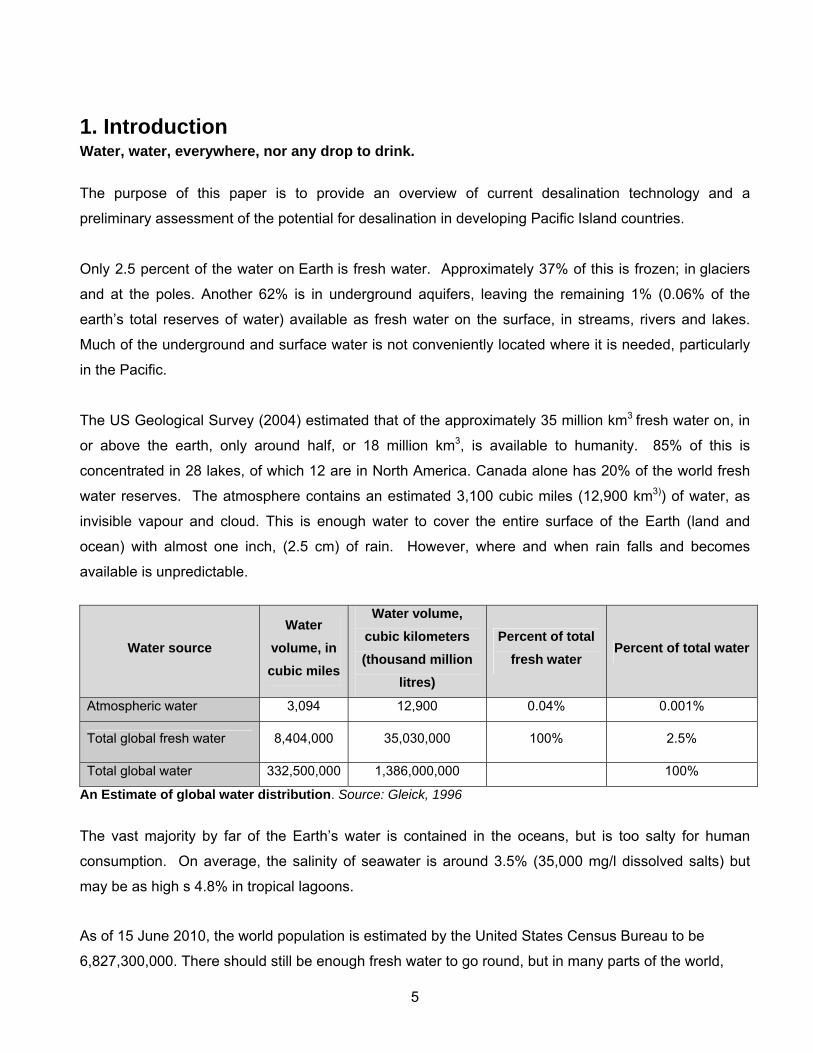
Water source Water
volume, in cubic miles
Water volume, cubic kilometers (thousand million
litres)
Percent of total fresh water
Percent of total water
Atmospheric water 3,094 12,900 0.04% 0.001%
Total global fresh water 8,404,000 35,030,000 100% 2.5%
Total global water 332,500,000 1,386,000,000 100%
An Estimate of global water distribution. Source: Gleick, 1996
The vast majority by far of the Earth’s water is contained in the oceans, but is too salty for human
consumption. On average, the salinity of seawater is around 3.5% (35,000 mg/l dissolved salts) but
may be as high s 4.8% in tropical lagoons.
As of 15 June 2010, the world population is estimated by the United States Census Bureau to be
6,827,300,000. There should still be enough fresh water to go round, but in many parts of the world,
5
there is not. The Stockholm Environment Institute (1997) has estimated that, allowing for predicted
population growth and assuming moderate projections of development and climate change, the
proportion of the world’s population living in countries of significant water stress will increase from
approximately 34% in 1995 to 63% in 2025.
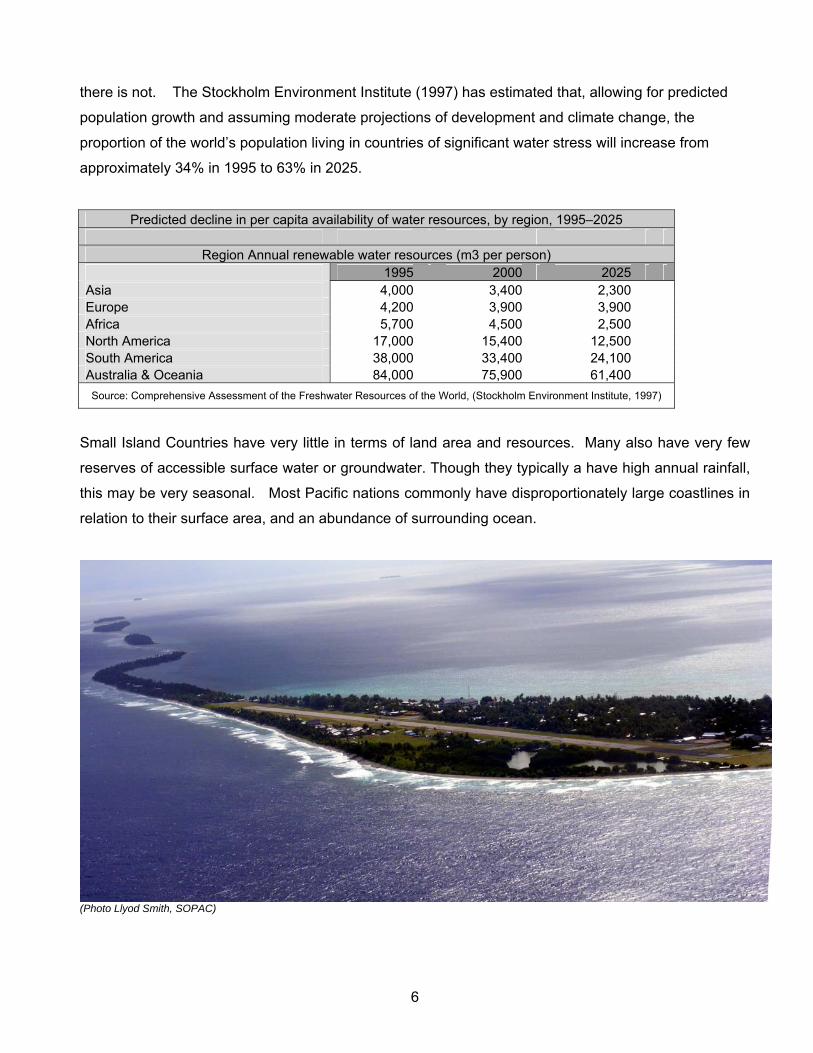
Predicted decline in per capita availability of water resources, by region, 1995–2025 Region Annual renewable water resources (m3 per person)
1995 2000 2025 Asia 4,000 3,400 2,300 Europe 4,200 3,900 3,900 Africa 5,700 4,500 2,500 North America 17,000 15,400 12,500 South America 38,000 33,400 24,100 Australia & Oceania 84,000 75,900 61,400 Source: Comprehensive Assessment of the Freshwater Resources of the World, (Stockholm Environment Institute, 1997)
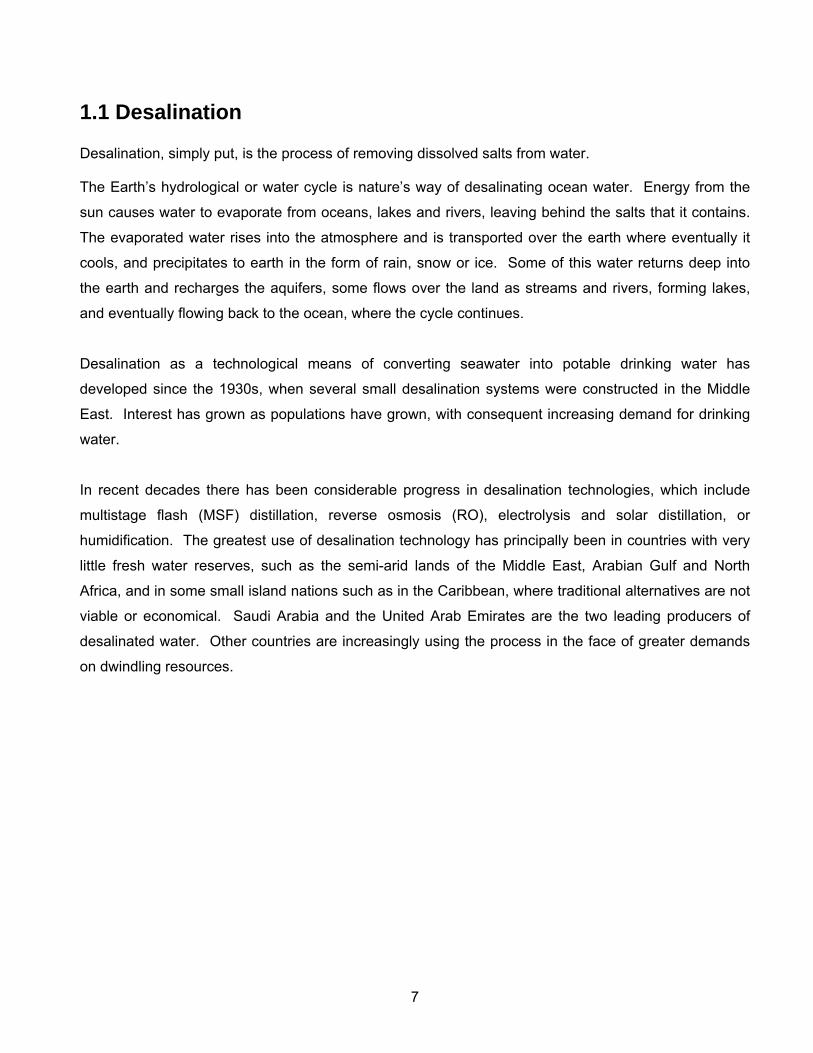
Small Island Countries have very little in terms of land area and resources. Many also have very few
reserves of accessible surface water or groundwater. Though they typically a have high annual rainfall,
this may be very seasonal. Most Pacific nations commonly have disproportionately large coastlines in
relation to their surface area, and an abundance of surrounding ocean.
(Photo Llyod Smith, SOPAC)
6
1.1 Desalination Desalination, simply put, is the process of removing dissolved salts from water. The Earth’s hydrological or water cycle is nature’s way of desalinating ocean water. Energy from the
sun causes water to evaporate from oceans, lakes and rivers, leaving behind the salts that it contains.
The evaporated water rises into the atmosphere and is transported over the earth where eventually it
cools, and precipitates to earth in the form of rain, snow or ice. Some of this water returns deep into
the earth and recharges the aquifers, some flows over the land as streams and rivers, forming lakes,
and eventually flowing back to the ocean, where the cycle continues.
Desalination as a technological means of converting seawater into potable drinking water has
developed since the 1930s, when several small desalination systems were constructed in the Middle
East. Interest has grown as populations have grown, with consequent increasing demand for drinking
water.
In recent decades there has been considerable progress in desalination technologies, which include
multistage flash (MSF) distillation, reverse osmosis (RO), electrolysis and solar distillation, or
humidification. The greatest use of desalination technology has principally been in countries with very
little fresh water reserves, such as the semi-arid lands of the Middle East, Arabian Gulf and North
Africa, and in some small island nations such as in the Caribbean, where traditional alternatives are not
viable or economical. Saudi Arabia and the United Arab Emirates are the two leading producers of
desalinated water. Other countries are increasingly using the process in the face of greater demands
on dwindling resources.
7
2. Desalination Technology This section contains a brief overview of the most common desalination methods, and recent developments in the technology.
2.1 Flash Distillation
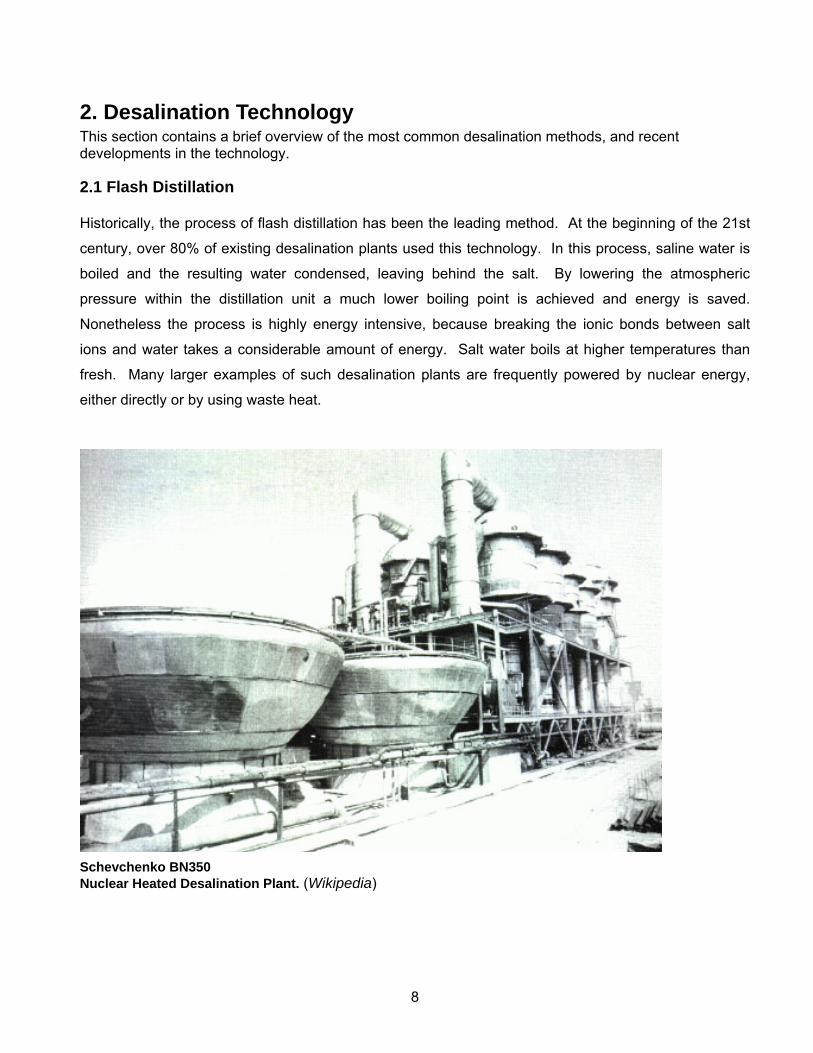
Historically, the process of flash distillation has been the leading method. At the beginning of the 21st
century, over 80% of existing desalination plants used this technology. In this process, saline water is
boiled and the resulting water condensed, leaving behind the salt. By lowering the atmospheric
pressure within the distillation unit a much lower boiling point is achieved and energy is saved.
Nonetheless the process is highly energy intensive, because breaking the ionic bonds between salt
ions and water takes a considerable amount of energy. Salt water boils at higher temperatures than
fresh. Many larger examples of such desalination plants are frequently powered by nuclear energy,
either directly or by using waste heat.
Schevchenko BN350 Nuclear Heated Desalination Plant. (Wikipedia)
8
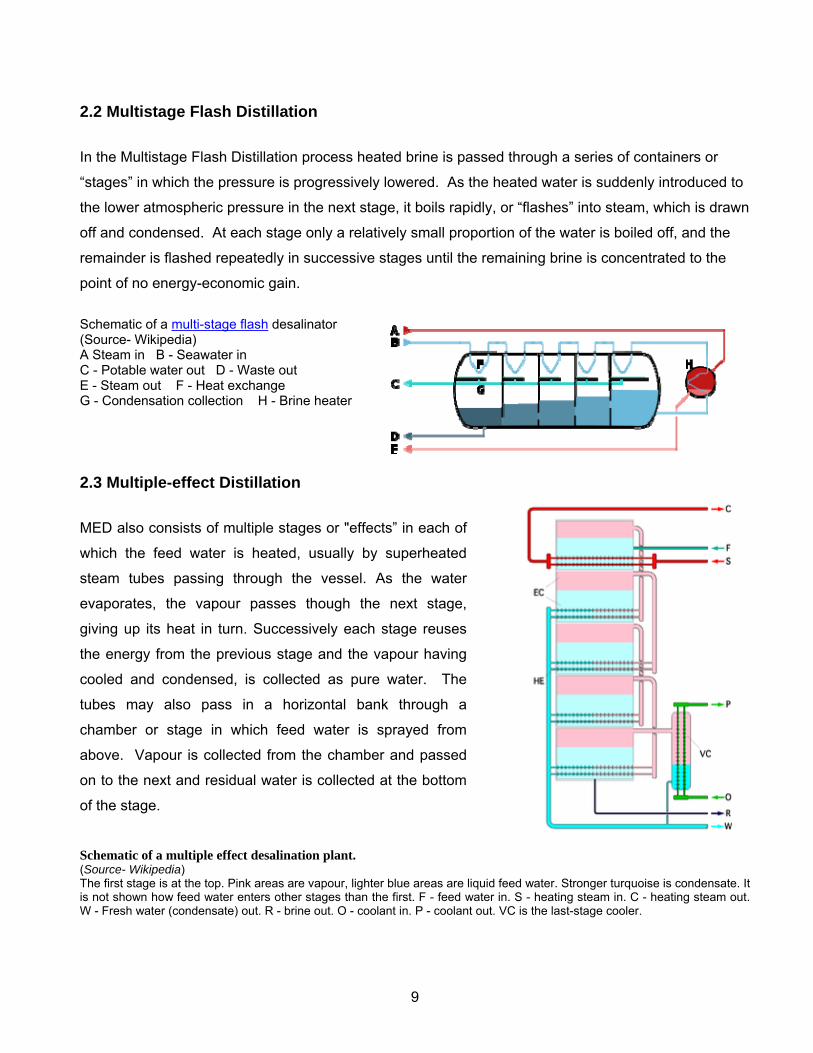
2.2 Multistage Flash Distillation
In the Multistage Flash Distillation process heated brine is passed through a series of containers or
“stages” in which the pressure is progressively lowered. As the heated water is suddenly introduced to
the lower atmospheric pressure in the next stage, it boils rapidly, or “flashes” into steam, which is drawn
off and condensed. At each stage only a relatively small proportion of the water is boiled off, and the
remainder is flashed repeatedly in successive stages until the remaining brine is concentrated to the
point of no energy-economic gain.
Schematic of a multi-stage flash desalinator (Source- Wikipedia) A Steam in B - Seawater in C - Potable water out D - Waste out E - Steam out F - Heat exchange G - Condensation collection H - Brine heater
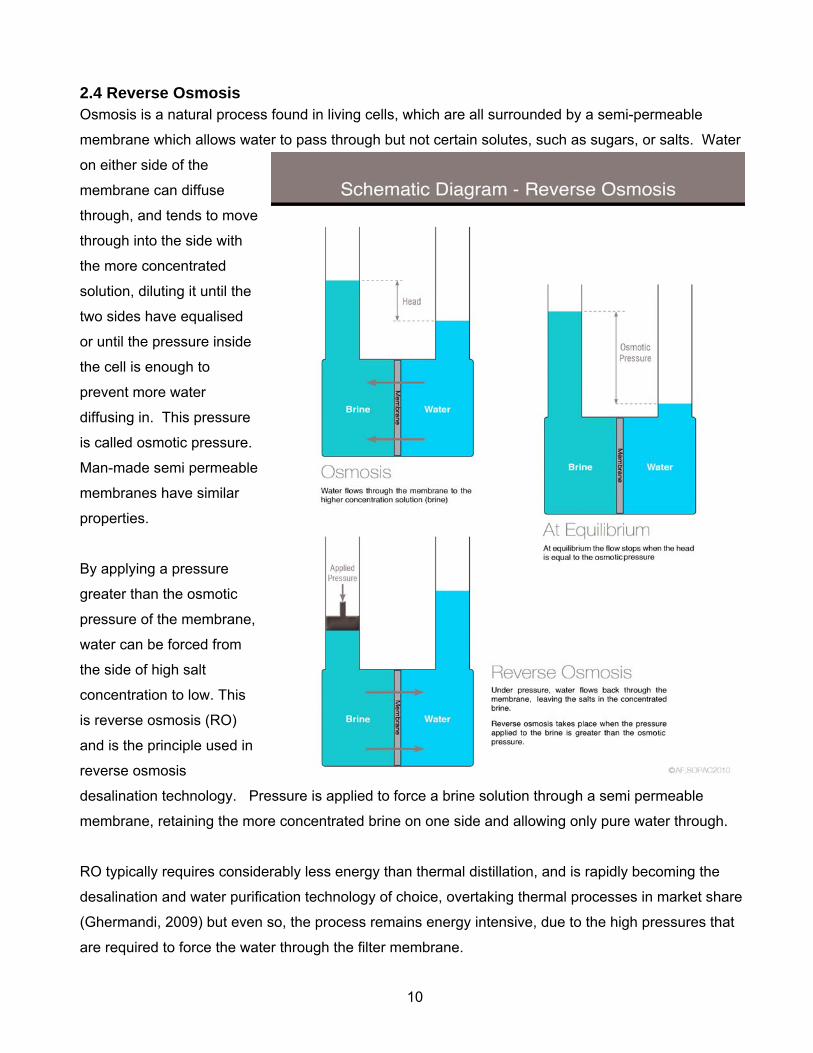
2.3 Multiple-effect Distillation
MED also consists of multiple stages or "effects” in each of
which the feed water is heated, usually by superheated
steam tubes passing through the vessel. As the water
evaporates, the vapour passes though the next stage,
giving up its heat in turn. Successively each stage reuses
the energy from the previous stage and the vapour having
cooled and condensed, is collected as pure water. The
tubes may also pass in a horizontal bank through a
chamber or stage in which feed water is sprayed from
above. Vapour is collected from the chamber and passed
on to the next and residual water is collected at the bottom
of the stage.
Schematic of a multiple effect desalination plant. (Source- Wikipedia) The first stage is at the top. Pink areas are vapour, lighter blue areas are liquid feed water. Stronger turquoise is condensate. It is not shown how feed water enters other stages than the first. F - feed water in. S - heating steam in. C - heating steam out. W - Fresh water (condensate) out. R - brine out. O - coolant in. P - coolant out. VC is the last-stage cooler.
9
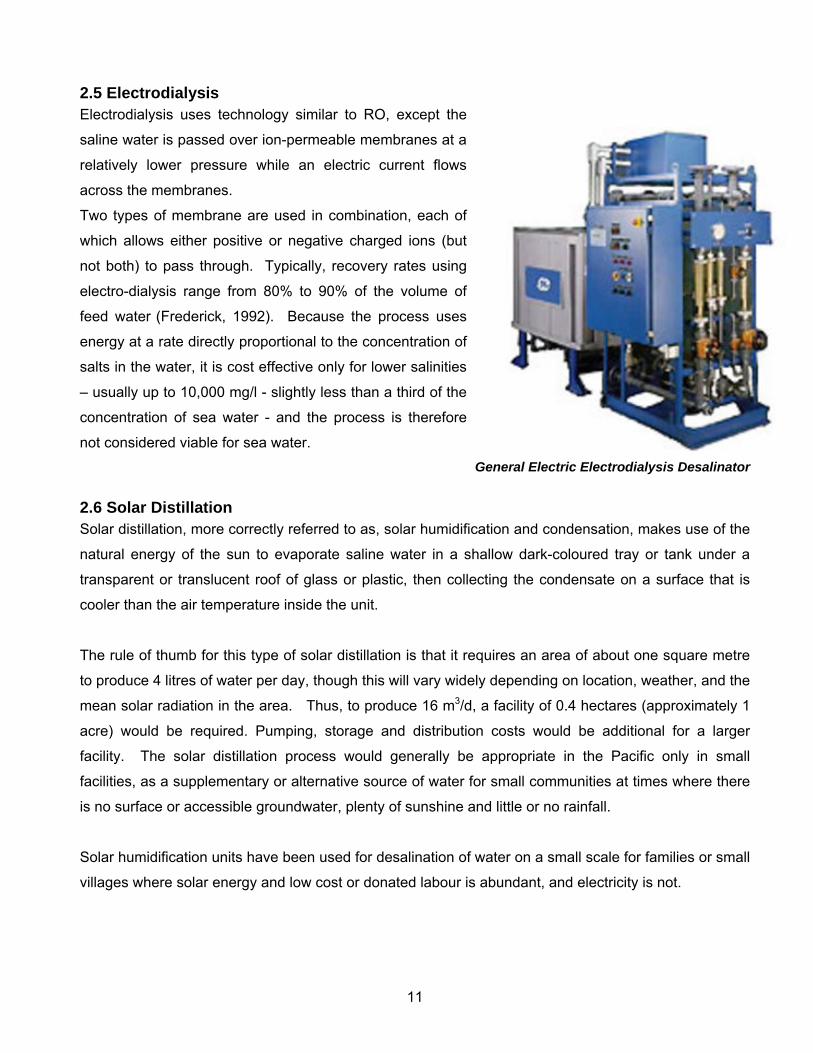
2.4 Reverse Osmosis Osmosis is a natural process found in living cells, which are all surrounded by a semi-permeable
membrane which allows water to pass through but not certain solutes, such as sugars, or salts. Water
on either side of the
membrane can diffuse
through, and tends to move
through into the side with
the more concentrated
solution, diluting it until the
two sides have equalised
or until the pressure inside
the cell is enough to
prevent more water
diffusing in. This pressure
is called osmotic pressure.
Man-made semi permeable
membranes have similar
properties.
By applying a pressure
greater than the osmotic
pressure of the membrane,
water can be forced from
the side of high salt
concentration to low. This
is reverse osmosis (RO)
and is the principle used in
reverse osmosis
desalination technology. Pressure is applied to force a brine solution through a semi permeable
membrane, retaining the more concentrated brine on one side and allowing only pure water through.
RO typically requires considerably less energy than thermal distillation, and is rapidly becoming the
desalination and water purification technology of choice, overtaking thermal processes in market share
(Ghermandi, 2009) but even so, the process remains energy intensive, due to the high pressures that
are required to force the water through the filter membrane.
10
2.5 Electrodialysis Electrodialysis uses technology similar to RO, except the
saline water is passed over ion-permeable membranes at a
relatively lower pressure while an electric current flows
across the membranes.
Two types of membrane are used in combination, each of
which allows either positive or negative charged ions (but
not both) to pass through. Typically, recovery rates using
electro-dialysis range from 80% to 90% of the volume of
feed water (Frederick, 1992). Because the process uses
energy at a rate directly proportional to the concentration of
salts in the water, it is cost effective only for lower salinities
– usually up to 10,000 mg/l - slightly less than a third of the
concentration of sea water - and the process is therefore
not considered viable for sea water. General Electric Electrodialysis Desalinator
2.6 Solar Distillation Solar distillation, more correctly referred to as, solar humidification and condensation, makes use of the
natural energy of the sun to evaporate saline water in a shallow dark-coloured tray or tank under a
transparent or translucent roof of glass or plastic, then collecting the condensate on a surface that is
cooler than the air temperature inside the unit.
The rule of thumb for this type of solar distillation is that it requires an area of about one square metre
to produce 4 litres of water per day, though this will vary widely depending on location, weather, and the
mean solar radiation in the area. Thus, to produce 16 m3/d, a facility of 0.4 hectares (approximately 1
acre) would be required. Pumping, storage and distribution costs would be additional for a larger
facility. The solar distillation process would generally be appropriate in the Pacific only in small
facilities, as a supplementary or alternative source of water for small communities at times where there
is no surface or accessible groundwater, plenty of sunshine and little or no rainfall.
Solar humidification units have been used for desalination of water on a small scale for families or small
villages where solar energy and low cost or donated labour is abundant, and electricity is not.
11
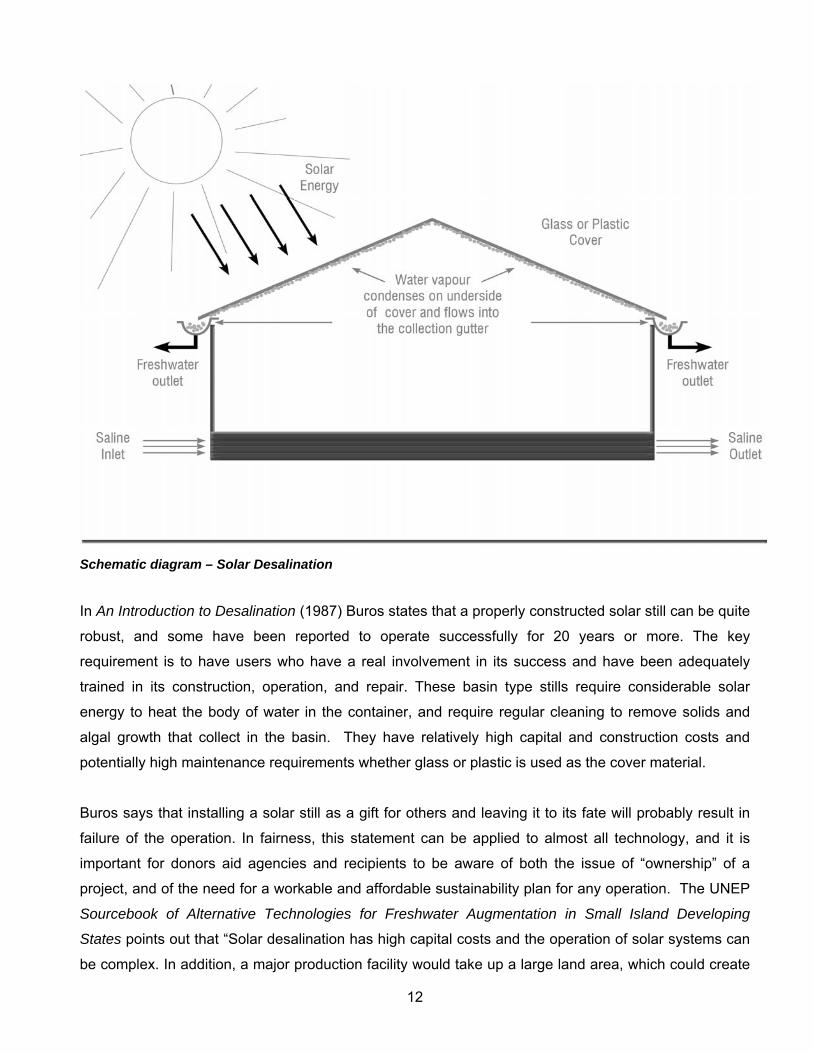
Schematic diagram – Solar Desalination
In An Introduction to Desalination (1987) Buros states that a properly constructed solar still can be quite
robust, and some have been reported to operate successfully for 20 years or more. The key
requirement is to have users who have a real involvement in its success and have been adequately
trained in its construction, operation, and repair. These basin type stills require considerable solar
energy to heat the body of water in the container, and require regular cleaning to remove solids and
algal growth that collect in the basin. They have relatively high capital and construction costs and
potentially high maintenance requirements whether glass or plastic is used as the cover material.
Buros says that installing a solar still as a gift for others and leaving it to its fate will probably result in
failure of the operation. In fairness, this statement can be applied to almost all technology, and it is
important for donors aid agencies and recipients to be aware of both the issue of “ownership” of a
project, and of the need for a workable and affordable sustainability plan for any operation. The UNEP
Sourcebook of Alternative Technologies for Freshwater Augmentation in Small Island Developing
States points out that “Solar desalination has high capital costs and the operation of solar systems can
be complex. In addition, a major production facility would take up a large land area, which could create
12
problems if the facility was located on an island where land was scarce and/or expensive. Desalination
plants should only be installed after the capacity of the community to finance, operate and maintain the
units is established. In the case of solar desalination, land ownership issues could become a problem”
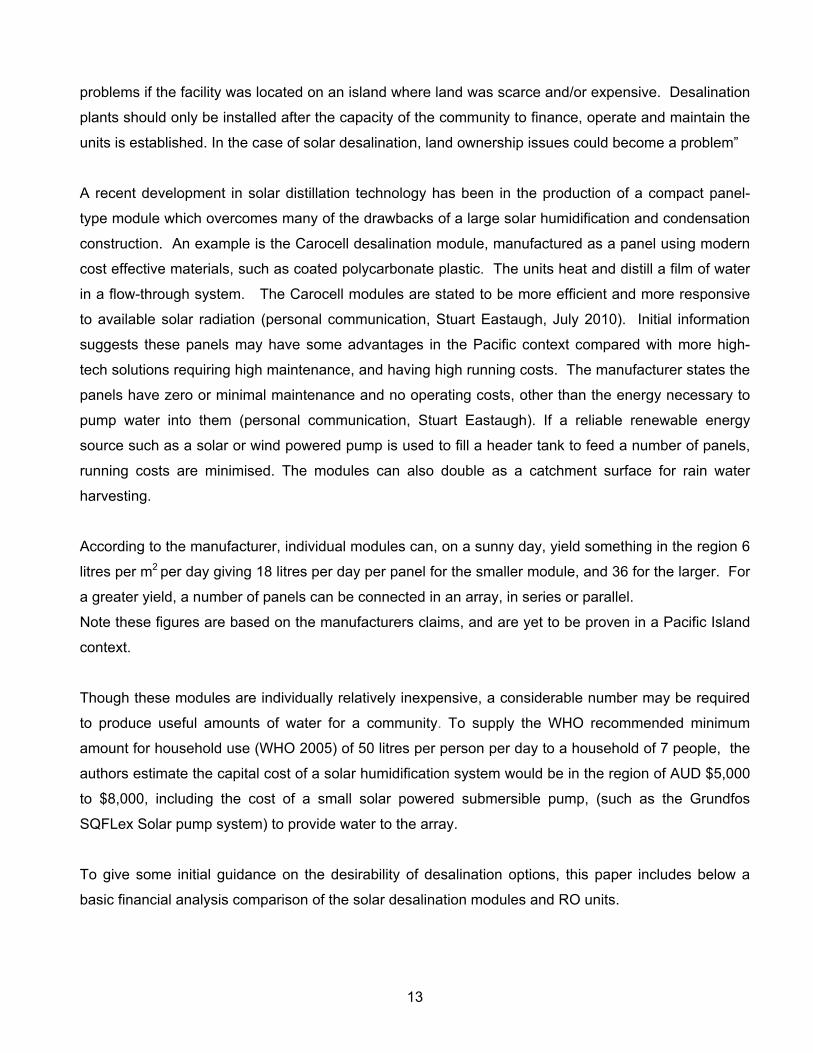
A recent development in solar distillation technology has been in the production of a compact panel-
type module which overcomes many of the drawbacks of a large solar humidification and condensation
construction. An example is the Carocell desalination module, manufactured as a panel using modern
cost effective materials, such as coated polycarbonate plastic. The units heat and distill a film of water
in a flow-through system. The Carocell modules are stated to be more efficient and more responsive
to available solar radiation (personal communication, Stuart Eastaugh, July 2010). Initial information
suggests these panels may have some advantages in the Pacific context compared with more high-
tech solutions requiring high maintenance, and having high running costs. The manufacturer states the
panels have zero or minimal maintenance and no operating costs, other than the energy necessary to
pump water into them (personal communication, Stuart Eastaugh). If a reliable renewable energy
source such as a solar or wind powered pump is used to fill a header tank to feed a number of panels,
running costs are minimised. The modules can also double as a catchment surface for rain water
harvesting.
According to the manufacturer, individual modules can, on a sunny day, yield something in the region 6
litres per m2 per day giving 18 litres per day per panel for the smaller module, and 36 for the larger. For
a greater yield, a number of panels can be connected in an array, in series or parallel.
Note these figures are based on the manufacturers claims, and are yet to be proven in a Pacific Island
context.
Though these modules are individually relatively inexpensive, a considerable number may be required
to produce useful amounts of water for a community. To supply the WHO recommended minimum
amount for household use (WHO 2005) of 50 litres per person per day to a household of 7 people, the
authors estimate the capital cost of a solar humidification system would be in the region of AUD $5,000
to $8,000, including the cost of a small solar powered submersible pump, (such as the Grundfos
SQFLex Solar pump system) to provide water to the array.
To give some initial guidance on the desirability of desalination options, this paper includes below a
basic financial analysis comparison of the solar desalination modules and RO units.
13
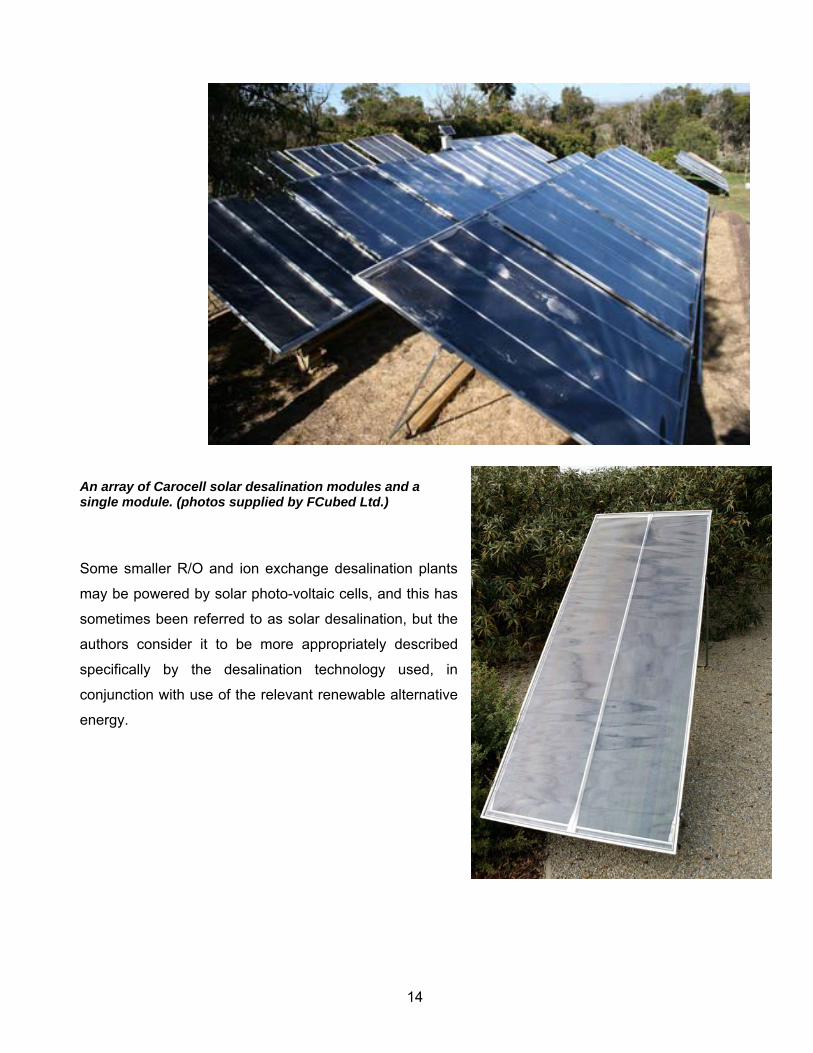
An array of Carocell solar desalination modules and a single module. (photos supplied by FCubed Ltd.)
Some smaller R/O and ion exchange desalination plants
may be powered by solar photo-voltaic cells, and this has
sometimes been referred to as solar desalination, but the
authors consider it to be more appropriately described
specifically by the desalination technology used, in
conjunction with use of the relevant renewable alternative
energy.
14
2.7 Ion Exchange Desalination Recent work has been carried out testing staged monovalent and divalent ion exchange resins for
desalination but little has yet been published about the effectiveness or the costs and suitability of the
technology for large scale production of drinking water. From available information, it appears that the
method is more suited to lower salinity ranges of raw water and may not be appropriate for tropical
seawater desalination.
2.8 Other Technologies Freezing can be used to desalinate water. When water freezes, the salt remains in solution. However,
the little available information indicates the technology has not proven to be practical despite theoretical
energy savings compared with distillation.
2.9 Alternative Energy Sources In 1998 the International Desalination Association recorded about 100 wind and solar powered
desalination plants of low capacity in around 25 countries (Buros, 2000). It appears that the major
limitation is the low capacity achievable with such technology, making such units mainly suitable only
for small communities or households. Even so, the plants still require some technical ability to operate,
with the usual associated maintenance and sustainability problems.
Buros (2000) states that unless there is a great increase in interest in this technology, the economy of
scale will keep these units unaffordable for the very people most likely to benefit most from them. This
still appears so.
Ghermandi and Messalem (2009) write that with current technology it should be possible to achieve
potential economically cost-competitive photovoltaic (PV) powered reverse osmosis unit with costs as
low as US$ 2 to 3/m3. However Energy conversion efficiencies of PV modules remain low, rarely
exceeding 15–16% and are still expensive, at US$4.83 per Watt (ibid). Whether such technology is
appropriate for use in the Pacific would depend on sustainability in terms of maintenance and repair,
and operator training.
2.10 Developments Recent developments in desalination technology have mainly been improvements in the efficiencies
and cost effectiveness of existing technologies and pre-treatment processes, and in exploring potential
combinations of technology. It has proven beneficial, for example, to co-site desalination plants with
electricity generation, and other processes which produce waste energy, such as heat.
15
In October 2009, Saltworks Technologies, of Canada, announced at http://www.saltworkstech.com/ a
new Thermo-Ionic™ technology, which is claimed to use up to 80% less electrical/mechanical energy at
lower temperatures by taking advantage of the “gradient energy” of a concentrated brine solution and
using solar or other source of heat to drive an ionic current to “push” the reverse osmosis process.
Limited information was available at the time of writing this paper, but from information on the
company’s website it can be inferred that this technology is more appropriate for hot dry climates, than
in the humid region of the Pacific islands.
A recent development in solar distillation has been in the manufacture of simple robust low
maintenance modular units of 3 or 6 square metres, weighing 20 to 30 kg each, that individually
produce relatively low daily quantities of pure water of around 16 to 40 litres per day, but which can be
combined to create solar distillation farms capable of producing sufficient quantities to supply a village
or community. This development is examined further below as a case study.
A relatively old and simple concept has recently become an increasingly attractive option in connection
with the necessity to develop sources of clean energy production in preparation for the time reserves of
fossil fuels are depleted. Several pilot projects have confirmed the potential viability of Ocean Thermal
Energy Conversion (OTEC) which makes use of the thermal difference between surface layers of
ocean which are up to 20 degrees or more warmer than layers at thousand metres depth (Magesh
2010). OTEC plants can be land based where deep water is relatively close to shore, or floating. One
potential by-product of the process is desalinated water, condensed from flash evaporated warm
seawater. Potentially 2.28 million litres of desalinated water could be produced for every Megawatt of
power generated by a hybrid OTEC plant. Though this technology has considerable potential, so far,
development has not progressed beyond experimental plants sized at about 0.25 MW (Vega, 1995).
The enormous capital cost suggests that development is likely to depend on increasing economic
viability as fossil fuel prices rise. The very high technological expertise required suggests these plants
will not be appropriate technology for developing nations.
According to a study by Curry, Dickson and Yashayev (1993) and reported in the magazine Nature the
salinity of tropical ocean waters has been steadily increasing over the past 40 years, an effect believed
to be caused by climate change. This will inevitably affect the energy costs associated with
desalination, with a relatively small increment in salinity of source water significantly increasing the
energy used.
16
2.11 Environmental issues: This section provides a brief summary of environmental matters that are important to take into
consideration when contemplating the use of desalination. Readers are recommended to seek expert
advice on issues that may be relevant to their own circumstances.
2.11.1 Intakes and Pre-Treatment Munke (2008) points out that raw sea water contains organisms, substances and particles, which
generally preclude the possibility of a simple open water intake and direct processing of sea water,
without some form of screening, filtration and pre-treatment. This paper does not examine this issue in
depth and readers are referred to Munke’s paper for closer examination of the matters of significance.
There are complexities involved in dealing with the problems associated with excluding organic matter
and suspended particles, and managing fouling, scaling, corrosion and foaming by such methods as
screening, filtration and chemical pretreatment. These all add widely variable but potentially significant
costs to plant construction and design, use of resources, operation and maintenance, and training
requirements.
2.11.2 Discharge of Effluent Munke (2008) describes a considerable list of potential environmental impacts arising from discharging
the concentrated effluent of a desalination plant back to the marine environment. Effluent is typically
concentrated brine that may contain a mixture of pre-treatment or other chemicals used in the process.
The potential seriousness of the impact of the effluent and chemicals on the environment may range
from minor to extremely significant, depending on the concentrations, amount and type of chemicals
used in the technology and processes. Again, this paper, as a general overview, does not examine
these matters closely and readers are referred to Munke (2008) and other references for more detail.
Environmental matters are a most important concern for the fragile ecosystems of most small Pacific
nations, and should be borne in mind along with other costs and benefits when evaluating the use of
desalination technology.
17
18
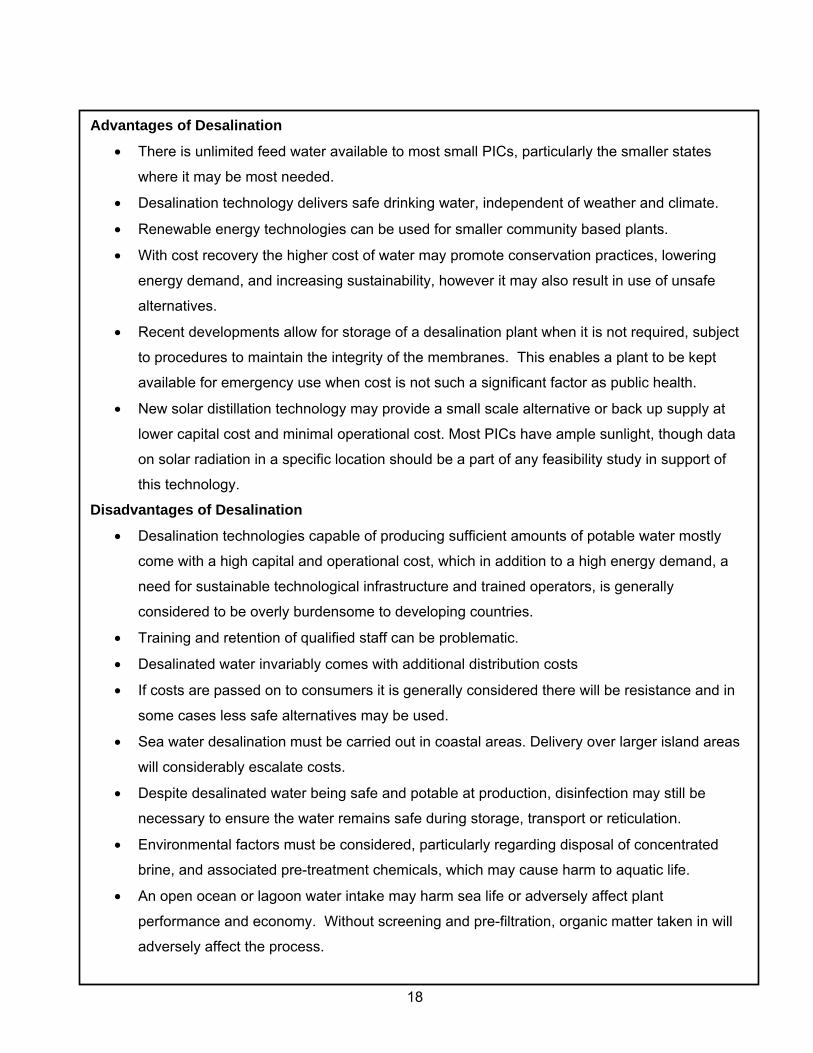
Advantages of Desalination
• There is unlimited feed water available to most small PICs, particularly the smaller states
where it may be most needed.
• Desalination technology delivers safe drinking water, independent of weather and climate.
• Renewable energy technologies can be used for smaller community based plants.
• With cost recovery the higher cost of water may promote conservation practices, lowering
energy demand, and increasing sustainability, however it may also result in use of unsafe
alternatives.
• Recent developments allow for storage of a desalination plant when it is not required, subject
to procedures to maintain the integrity of the membranes. This enables a plant to be kept
available for emergency use when cost is not such a significant factor as public health.
• New solar distillation technology may provide a small scale alternative or back up supply at
lower capital cost and minimal operational cost. Most PICs have ample sunlight, though data
on solar radiation in a specific location should be a part of any feasibility study in support of
this technology.
Disadvantages of Desalination
• Desalination technologies capable of producing sufficient amounts of potable water mostly
come with a high capital and operational cost, which in addition to a high energy demand, a
need for sustainable technological infrastructure and trained operators, is generally
considered to be overly burdensome to developing countries.
• Training and retention of qualified staff can be problematic.
• Desalinated water invariably comes with additional distribution costs
• If costs are passed on to consumers it is generally considered there will be resistance and in
some cases less safe alternatives may be used.
• Sea water desalination must be carried out in coastal areas. Delivery over larger island areas
will considerably escalate costs.
• Despite desalinated water being safe and potable at production, disinfection may still be
necessary to ensure the water remains safe during storage, transport or reticulation.
• Environmental factors must be considered, particularly regarding disposal of concentrated
brine, and associated pre-treatment chemicals, which may cause harm to aquatic life.
• An open ocean or lagoon water intake may harm sea life or adversely affect plant
performance and economy. Without screening and pre-filtration, organic matter taken in will
adversely affect the process.
3. Economics of Desalination This section contains a brief outline of the economics of desalination, and considers the factors which
determine its suitability as a water supply.
3.1 Financial Feasibility Desalination could be considered to be financially feasible if the financial value (or revenues) of water
generated from it exceed the costs. For desalination, revenue may be generated from sale of the water,
and costs will include operational and maintenance costs including labour and rent. Infrastructure and
installation are critical factors to be considered.
Despite claims that in recent years, the average cost of desalinating water has fallen - thus potentially
improving financial feasibility for desalination in the Pacific - desalination technology remains very
costly relative to traditional methods of water supply, requiring large capital investment and involving
high operational and maintenance expenses (AWA, 2008). Although the cost of a specific unit depends
on various factors such as plant type, size and location, proximity to the ocean and to a power source,
and feed-water salinity, universally the energy cost of desalination remains the greatest challenge
(Pacific Institute, 2006).
For example, a Commonwealth Scientific and Industrial Research Organisation (CSIRO) analysis for
the Water Services Association of Australia identified that desalination plants use seven times more
electricity than conventional water treatment plants and energy constitutes a quarter of the total cost of
building and running a desalination plant (The Australian 2010). Other estimates place the energy
costs of a typical RO plant at up to 44 percent of the total (Pacific Institute 2006). If the energy used for
desalination is derived from conventional power generation, the cost of running a desalination plant in
the Pacific will inevitably rise with increases in the cost of fuel (Pacific Institute 2006).
Some plants use renewable energy to offset the high energy cost of desalination. For example,
Sydney’s new AUD$2.4bn desalination plant, capable of producing 250,000m3 per day (250 million
litres per day) - equivalent to 15% of Sydney’s water demand - will be 100% offset by wind energy
(NSW GOV 2010). This means the wind farm will be contributing to the power grid the equivalent
amount of energy that the desalination plant will be withdrawing, effectively offsetting carbon emissions.
However use of renewable energy for desalination presents a set of problems common to all high level
technology applications used in the Pacific; lack of capital, infrastructure and technological expertise to
effectively manage and maintain such systems.
19
Plant capacity also affects the financial operation of a desalination plant. Large and medium scale
desalination plants (6,600 m3/day and 2,600 – 5,300 m3/day respectively) benefit from economies of
scale, resulting in lower cost per unit of water than the smaller scale operations commonly used in
Pacific countries (AWA 2008). No medium to large scale plants currently operate in the Pacific;
however there are several examples of small scale units in Pacific countries as outlined in the next
section. Pacific Institute (2006) estimates these smaller plants produce water at a cost 50% -100%
more per unit than might be achieved by larger plants.
3.2 Economic Feasibility Desalination might be considered economically feasible if the environmental and social benefits are
greater than the costs. In this respect the economic benefits of desalination include not only the
monetary price that consumers might be willing to pay for water but also other gains, such as improved
health, improved environment, sufficient availability for consumption and savings from less bottled
water purchases. By comparison the costs of desalination include the financially adjusted costs of
producing the water, as well as any negative environmental or social impacts resulting from the
operation.
Conventional economic assessment of water supply options normally involve a cost benefit analysis,
comparing the benefits and cost of water supply using desalination with benefits and costs of
alternative means of providing water. Unfortunately the difficulties in predicting and valuing the various
impacts of water supply mean that in some cases it may be practical only to measure and compare the
financially adjusted costs of desalination with those of other water supply options. In such a case the
economic feasibility of desalination may rely on whether it offers the least cost option.
Such least-cost or cost effectiveness analysis can be useful to explore desalination as a supplement to,
or as a substitute for, other water sources. However, a cost benefit analysis is ideally more suitable
since desalination has the potential to generate a wide range of potential impacts. Critically, cost
benefit analysis goes beyond financial costs to include assessments of the value of any social and
environmental changes that may be generated.
3.2.1 Environmental Impacts Several factors may determine the extent to which desalination plants can impact the environment. A
few are specifically applicable to small island countries – land and coastal characteristics, plant type,
plant location, proximity to the ocean, location of feed-water source and waste water disposal.
Detrimental impacts on the environment may be hard to prove, quantify and measure, but such impacts
must be taken into consideration because most small island countries have very sensitive and fragile
20
ecosystems. Disregarding environmental considerations may result in unacceptably high environmental
costs.
3.2.2 Social Impacts No feasibility assessment would be complete without an assessment of social acceptance. There may
be considerable social costs or benefits from installation and use of desalination plants affecting the
degree to which desalination is a workable or sustainable option in any given situation. Most social
implications of desalination would be specific to each country and location and may be affected by
factors such as availability of alternative sources of water, or the culture and values of society. For
example, there is direct social benefit in knowing that desalinated water, no matter how expensive, is
safe to drink and is constantly available, provided the system is well maintained and operated . On the
other hand, where safe alternative sources of water are available at a lower cost, the use of a
desalination plant may have indirect social costs to society, for example in public health, where
resources may have been better used in the public health system for purchasing medicine or other
necessary interventions. These social benefits and costs can, in theory, be quantified in monetary
terms using CBA, but are difficult to measure in practice because they are qualitative or emotional in
nature.
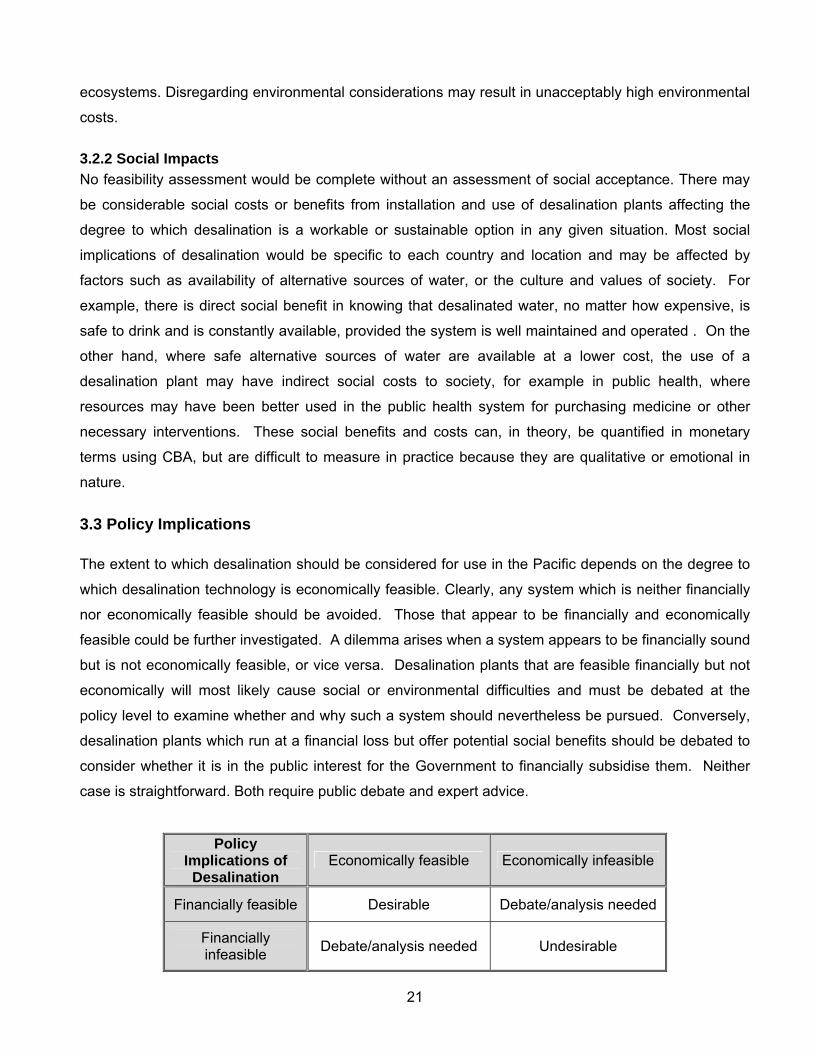
3.3 Policy Implications The extent to which desalination should be considered for use in the Pacific depends on the degree to
which desalination technology is economically feasible. Clearly, any system which is neither financially
nor economically feasible should be avoided. Those that appear to be financially and economically
feasible could be further investigated. A dilemma arises when a system appears to be financially sound
but is not economically feasible, or vice versa. Desalination plants that are feasible financially but not
economically will most likely cause social or environmental difficulties and must be debated at the
policy level to examine whether and why such a system should nevertheless be pursued. Conversely,
desalination plants which run at a financial loss but offer potential social benefits should be debated to
consider whether it is in the public interest for the Government to financially subsidise them. Neither
case is straightforward. Both require public debate and expert advice.
Policy Implications of
Desalination Economically feasible Economically infeasible
Financially feasible Desirable Debate/analysis needed
Financially infeasible Debate/analysis needed Undesirable
21
4. Desalination in the Pacific Although desalination has been in use in the Pacific since the 1990’s, there appears to be very little
available detailed documented information, and so it has been difficult to gather reliable and
comprehensive contemporary information on the current status of many of the desalination plants in the
Pacific region. There is certainly no single reference to which potential users can turn to see how
Pacific Island Countries have fared. Though it is known that a considerable number of desalination
units are in current use in private enterprise, particularly in the tourism and manufacturing industries,
this paper does not examine their use in this context and thus they are not included.
The following is a brief summary of known desalination plants that have been, or are currently being,
used in Pacific Island countries.
4.1 Tuvalu Desalination was originally reserved for emergency use in Tuvalu, but is now used as one of the
primary sources of fresh water, especially on Funafuti. The first desalination unit was installed in
Funafuti in the early 1980’s and had the capacity to extract 27 m3 of freshwater per day (SOPAC
2007a). Further information regarding this unit was not found.
In response to emergency assistance during a very severe drought in 1990, two RO desalination plants
were supplied to Tuvalu by the Australian Investment Development Assistance Bureau (AIDAB). The
desalination plants served their purpose and were not used again because they proved too expensive
to operate and difficult to maintain in the Tuvaluan environment. The units remain but were reported as
inoperative (SOPAC 1998a).
According to SOPAC (2007a) more desalination plants were installed during the 1999 drought,
including one in Funafuti capable of extracting 65 m3 per day. This plant produced water at a unit cost
of AU$3.50 per m3. The tariff used in Funafuti recovered less than half of the operational and
maintenance costs. The Public Works Department (PWD) considered these costs unsustainable as it
was not possible to recover any capital investment costs for replacement of the plant. SOPAC (2007a)
further indicated that smaller plants were also installed in other parts of the group, Vaitupu and
Nanumaga (both 30 m³/d). These plants were donated by the Japanese Government as measures to
counter the water shortage problem during the state of emergency proclaimed in August 1999. The
current condition of these plants is not known.
22
n 2006, another unit valued at US$89,900 and rated as capable of producing 65 m³/d, was donated by
the Japanese government to assist efforts in alleviating the current severe water shortage in Funafuti
(Japan Embassy 2006). However the feed water is extracted from the lagoon and it has since been
reported SOPAC (2007a) that its quality is uncertain due to its proximity to the village. This has an
unknown effect on the life expectancy of the filtration unit.
In an August 2009 email communication (Need for new desalination plant) from Tuvalu Public Works
Department, it was reported that Funafuti was experiencing water shortages. There were two
desalination plants respectively capable of producing 27 and 65 kilolitres of water per day; however the
smaller machine was inoperative at the time due to electrical problems. The operational plant was
running 24 hours a day, producing water that was being delivered to households by a water tanker at a
rate of 2,000 litres per delivery. Funafuti has a population of approximately 5,000, occupying 640
households in nine main villages, distributed on three of the islands around the atoll (Government of
Tuvalu Central Statistics Division, (2009). The capacity of the delivery tanker was 10,000 litres, allowing
a theoretical maximum number of around five households to be supplied each trip to a maximum of 30
households per day. However logistics of water production, loading and delivery meant that from 16 to
a maximum of 20 houses were supplied each 18 hour period. A tanker down-time of 6 hours allowed
for desalinated water to accumulate in holding tanks; ensuring deliveries did not outpace production.
The email memo also notes that extra desalination capacity would not significantly increase the
efficiency of supplying water to the community without increased transport capacity. This is an
important point that illustrates the potentially significant additional capital and operational costs
associated with distribution of desalinated water.
SOPAC (1998a) reports that based on the Tuvalu experiences in the 1990s, desalination units must be
operated on semi-continuous basis if they are to be maintained for emergency purposes, and that the
high energy cost to run the units usually minimises their operation outside of dry periods. The
Integrated Water Resources Management Plan recommends that due to the high cost of desalination,
less expensive methods should be identified to meet public demand with minimal dependence on
desalinated water (SOPAC 2007a).
23
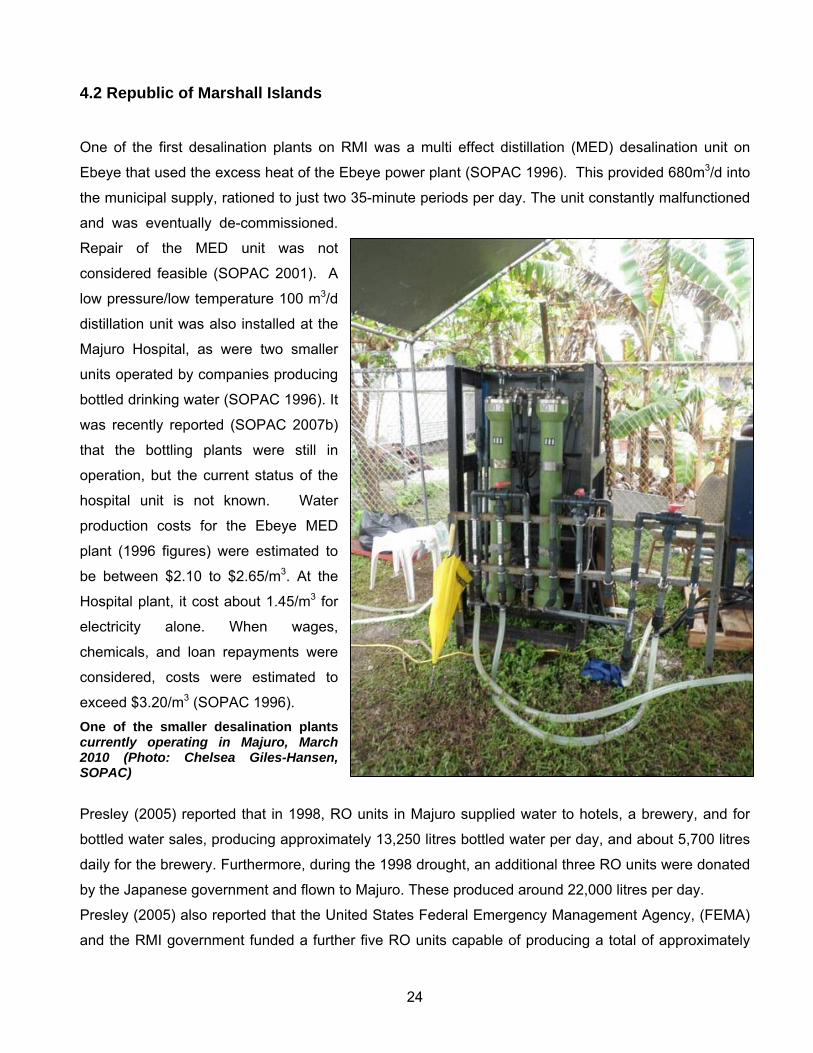
4.2 Republic of Marshall Islands One of the first desalination plants on RMI was a multi effect distillation (MED) desalination unit on
Ebeye that used the excess heat of the Ebeye power plant (SOPAC 1996). This provided 680m3/d into
the municipal supply, rationed to just two 35-minute periods per day. The unit constantly malfunctioned
and was eventually de-commissioned.
Repair of the MED unit was not
considered feasible (SOPAC 2001). A
low pressure/low temperature 100 m3/d
distillation unit was also installed at the
Majuro Hospital, as were two smaller
units operated by companies producing
bottled drinking water (SOPAC 1996). It
was recently reported (SOPAC 2007b)
that the bottling plants were still in
operation, but the current status of the
hospital unit is not known. Water
production costs for the Ebeye MED
plant (1996 figures) were estimated to
be between $2.10 to $2.65/m3. At the
Hospital plant, it cost about 1.45/m3 for
electricity alone. When wages,
chemicals, and loan repayments were
considered, costs were estimated to
exceed $3.20/m3 (SOPAC 1996). One of the smaller desalination plants currently operating in Majuro, March 2010 (Photo: Chelsea Giles-Hansen, SOPAC)
Presley (2005) reported that in 1998, RO units in Majuro supplied water to hotels, a brewery, and for
bottled water sales, producing approximately 13,250 litres bottled water per day, and about 5,700 litres
daily for the brewery. Furthermore, during the 1998 drought, an additional three RO units were donated
by the Japanese government and flown to Majuro. These produced around 22,000 litres per day.
Presley (2005) also reported that the United States Federal Emergency Management Agency, (FEMA)
and the RMI government funded a further five RO units capable of producing a total of approximately
24
475 m3 per day into the municipal water system but these were all decommissioned when no longer
needed.
EU-SOPAC reported (2006) that during the 1998 El-Niňo, Majuro imported an unknown number of
desalination units, but due to lack of maintenance, all have since broken down. It was also reported
that one small mobile unit was still working at a Marshall Islands Resort. A subsequent report (SOPAC
2007b) states that several RO units were made available to Majuro by the US Government and Japan
and that these were used during the drought. No more recent information regarding these units was
found. The report also states that in 2006 on Ebeye, two desalination units were providing some 380 m3
(100,000 gallons) of water daily, with a maximum capacity of 735 m3 (200,000 gallons) on which 32
percent of households relied. However recent communications with Marshall Islands representatives
indicate only one of the units is currently operational.
The (SOPAC 2007b) report recommended the Republic of Marshall Islands consider emerging and
alternative technology for potable water production, including such non-conventional sources as large
scale desalination and the possible use of oceanic thermal energy conversion, which can produce
potable water as a byproduct.
4.3 Nauru Desalination is the main source of potable water for Nauru. SOPAC (2010) states that 80% of
households identified the desalinated supply as their main source of drinking water, 14% identified
rainwater, and less than 1% (10 households) said groundwater was their main source (see table 1).
Households Main source
Number Percentage Desalinated water 1,340 81% Rainwater 236 14% Groundwater 10 0.6% Other/not stated 66 4% Total 1,652 100%
Table 1 Nauru water sources. (Source: SOPAC 2010) The first desalination plant on Nauru was commissioned in 1992 by the Nauru Phosphate Company
(NPC) as part of its power plant. Waste heat from the generators was used in a six stage distillation
process to produce desalinated water from seawater (SOPAC 1998b). Though the desalination unit
was rated to produce 1,100 m3 per day, the generators were aging and could not be operated at full
capacity. As a result, daily output from the desalination plant in 2001 was in the range of 900 to 1,000
25
m3 of desalinated water. The unit operated from 1994 until 2002 when it was decommissioned.
(SOPAC 2007c)
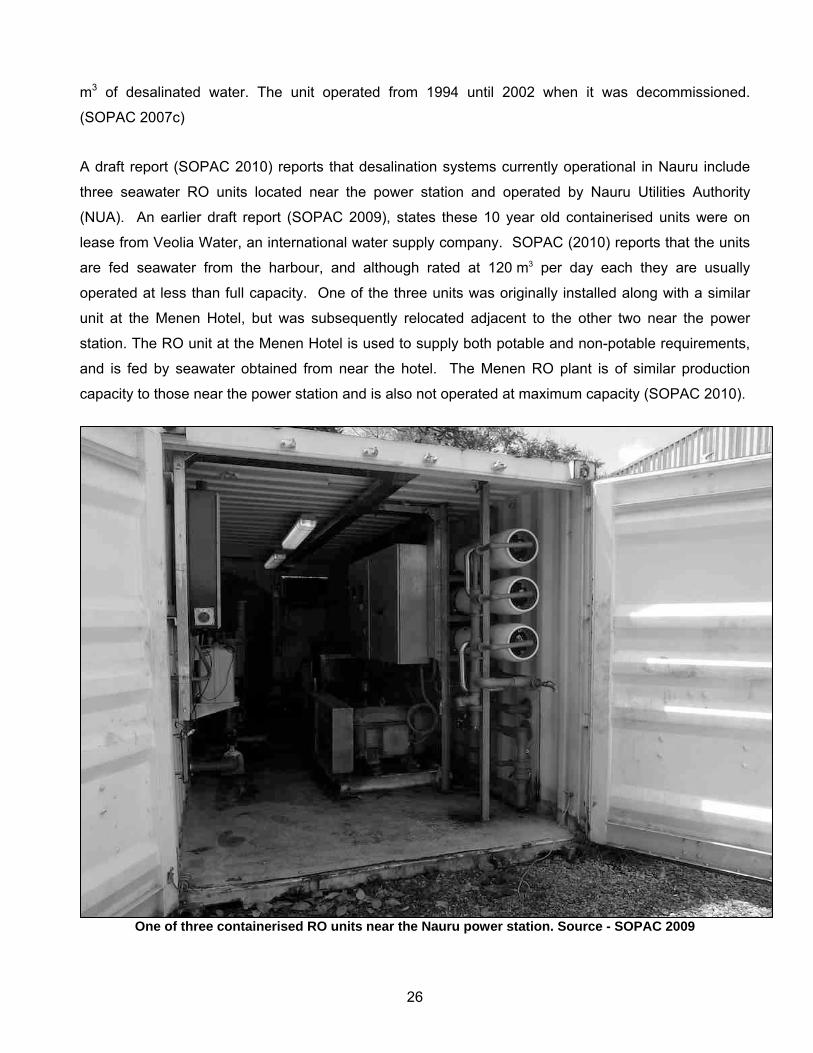
A draft report (SOPAC 2010) reports that desalination systems currently operational in Nauru include
three seawater RO units located near the power station and operated by Nauru Utilities Authority
(NUA). An earlier draft report (SOPAC 2009), states these 10 year old containerised units were on
lease from Veolia Water, an international water supply company. SOPAC (2010) reports that the units
are fed seawater from the harbour, and although rated at 120 m3 per day each they are usually
operated at less than full capacity. One of the three units was originally installed along with a similar
unit at the Menen Hotel, but was subsequently relocated adjacent to the other two near the power
station. The RO unit at the Menen Hotel is used to supply both potable and non-potable requirements,
and is fed by seawater obtained from near the hotel. The Menen RO plant is of similar production
capacity to those near the power station and is also not operated at maximum capacity (SOPAC 2010).
One of three containerised RO units near the Nauru power station. Source - SOPAC 2009
26
The report further stated that a smaller (15 m3/day) RO unit was installed at the Republic of Nauru
hospital. This was installed as a brackish water RO unit, using water pumped from a nearby borehole;
however as the salinity of the groundwater exceeded the brackish water limit for the membranes, this
unit was being converted into a seawater RO unit. It was not in use in September 2009 and all water to
the hospital was being supplied by rainwater collected locally, or desalinated water via pipelines and
tank from the RO units near the power station. Small RO units are also installed at various locations for
accommodation and at some private houses. (SOPAC 2010).
The operation and maintenance costs of desalinated water from the RO units run by Nauru Utilities
Authority (NUA) is not known with certainty, however the SOPAC (2010) report estimated the current
operation and maintenance costs for the NUA RO units at AUD $5 or more per m3, and reported that
operation and maintenance of the RO units is subsidised by the government. The report also estimated
that operation and maintenance costs for a possible new 500 m3/day RO unit in Nauru in the vicinity of
AUD $3.10 to $5.82 per m3.
In Nauru, desalinated water can be collected without cost or restriction in containers from a public storage
tank, Delivery by truck to households can be arranged on request, for a modest charge, which was recently
increased from AUD$1.50/m3, to AU$3.00/m3 (SOPAC 2007c). Actual cost of production and delivery in
2006 was estimated to be in the vicinity of AU$7.00/m3 (SOPAC 2009).
4.4 Kiribati In early 1999, the first two desalination plants in Kiribati were funded by the government to help in times
of drought. One plant with the capacity of 10m3 per day was installed on Banaba Island to alleviate the
water shortage there, and another plant with the capacity of 110m3 per day was installed on Betio, the
most populated islet of South Tarawa. Metutera (2002), reports that the Betio desalination plant was
still working well in 2002. No recent reference to the status of the Banaba plant has been found. Water
produced from the Betio plant is pumped direct to the Betio reservoir and is available only for Betio
residents. Toward the end of 1999, two further desalination plants, each with a capacity of 50m3/day,
were donated by the Government of China. One was installed at the Central Hospital, and one at the
government-owned Otuitaii Hotel in South Tarawa. At the time of the report neither were operational
due to mechanical and electrical faults (Metutera 2002). Bottled water was also produced in South
Tarawa from a privately owned seawater reverse osmosis plant which is no longer operational due to
water quality problems (SOPAC 2007d).
27
A SOPAC mission in August 2000 found that on Banaba there were three RO Desalination Units,
which had been delivered after droughts hit there in 1997/1998. However, the meters showed that the
units had logged only 72 and 128 working hours, which meant they had malfunctioned shortly after
arrival, and were not used again. Two of the units were repaired and resumed operation during the
mission. Water from the desalination units is stored in three 5m3 PVC tanks located near the boat
harbour, and subsequently delivered to individual houses by tanker truck at a cost of AUD$15 per trip of
2000 litres (Overmars and Butcher, SOPAC Technical Report 334).
On Kiribati it has been estimated that seawater desalination is 16 times more expensive than
groundwater extraction in terms of energy consumption (Metutera 2002). It is considered much more
economic, and considerably less risky, to develop groundwater extraction and rainwater collection
systems before resorting to desalination (SOPAC 2007d).
Metutera (2002) states the desalination plant on Betio had been working well because it was quite
simple to operate and maintain, as long as spare parts were readily available, and states also that the
problem with the desalination plants at the Central Hospital and the Otintaai Hotel was that it was very
difficult to contact the manufacturer for spare parts and technical advice. Metutera further advised that
choosing a reputable manufacturer with a long history of success, and implementing a sound
preventive maintenance schedule are two very important factors in achieving sustainability in a
desalination system. SOPAC (2007d) reports that the viability of desalination in many developing
Pacific Island nations is limited by problems with maintenance, the expense of spare parts, and the
costs of supplying power.
4.5 Tonga The Kingdom of Tonga recently purchased a new “18TS” portable desalination unit from Oceania Water
Treatment, at a cost close to TOP$90,000.00 (approx. AUD$51,000). The unit has a stated production
capacity of 16m3/day. The desalination unit is portable and is maintained on standby at the naval base
so it can be deployed to the outer islands at need in times of drought or disaster, such as after a
tsunami, or cyclone. The unit is powered by a generator but can be connected to mains power (TBC
2009). Enquiries have established that the plant can be effectively shut down and stored without use
for periods of time, subject to following a pre-shutdown treatment procedure. To ensure sustainability,
Tonga has a contract with the suppliers to provide regular maintenance and a training programme
(private communication, Oceania Water treatment Ltd). This 18TS unit is the basis of a cost
comparison case study presented in Section 5.
28
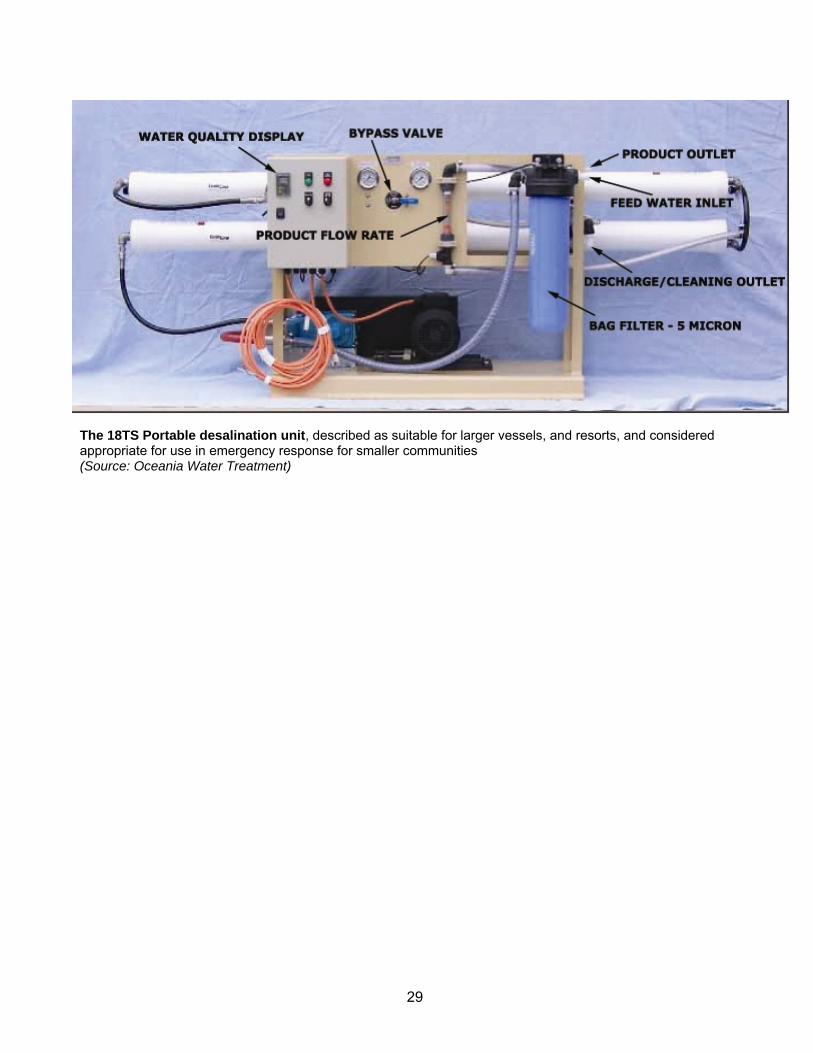
The 18TS Portable desalination unit, described as suitable for larger vessels, and resorts, and considered appropriate for use in emergency response for smaller communities (Source: Oceania Water Treatment)
29
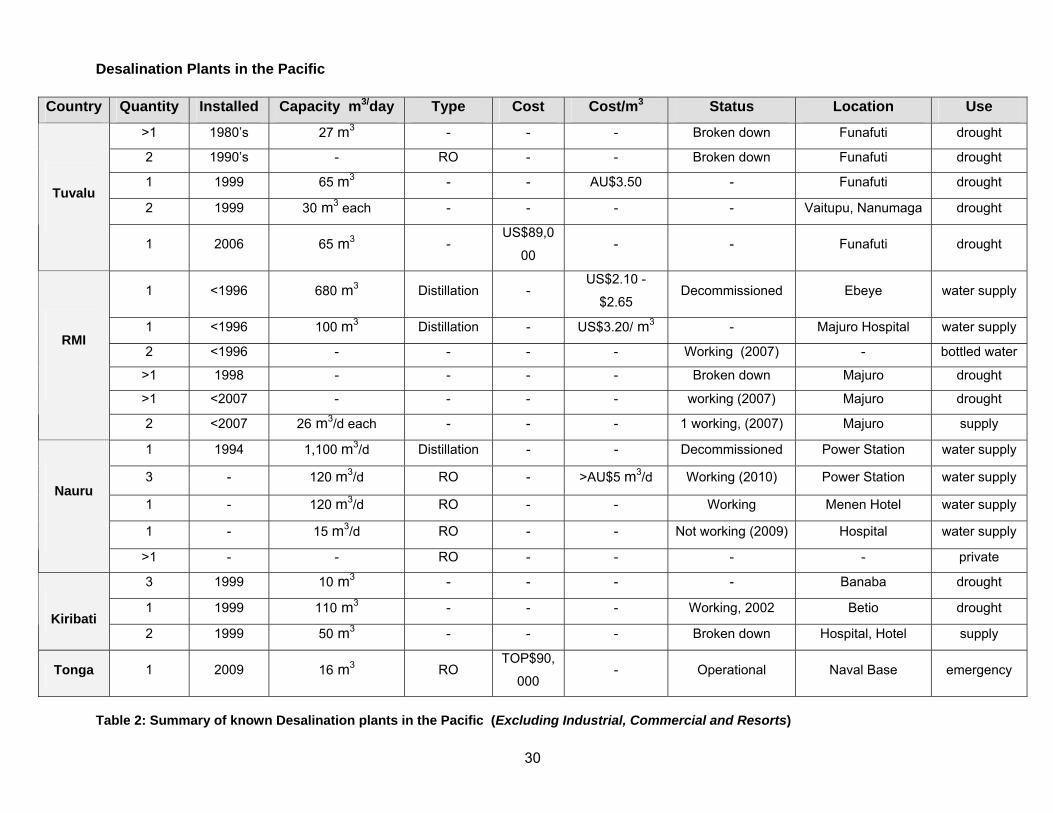
Desalination Plants in the Pacific
Country Quantity Installed Capacity m3/day Type Cost Cost/m3 Status Location Use
>1 1980’s 27 m3 - - - Broken down Funafuti drought
2 1990’s - RO - - Broken down Funafuti drought
1 1999 65 m3 - - AU$3.50 - Funafuti drought
2 1999 30 m3 each - - - - Vaitupu, Nanumaga drought
Tuvalu
1 2006 65 m3 - US$89,0
00 - - Funafuti drought
1 <1996 680 m3 Distillation - US$2.10 -
$2.65 Decommissioned Ebeye water supply
1 <1996 100 m3 Distillation - US$3.20/ m3 - Majuro Hospital water supply
2 <1996 - - - - Working (2007) - bottled water
>1 1998 - - - - Broken down Majuro drought
>1 <2007 - - - - working (2007) Majuro drought
RMI
2 <2007 26 m3/d each - - - 1 working, (2007) Majuro supply
1 1994 1,100 m3/d Distillation - - Decommissioned Power Station water supply
3 - 120 m3/d RO - >AU$5 m3/d Working (2010) Power Station water supply
1 - 120 m3/d RO - - Working Menen Hotel water supply
1 - 15 m3/d RO - - Not working (2009) Hospital water supply
Nauru
>1 - - RO - - - - private
3 1999 10 m3 - - - - Banaba drought
1 1999 110 m3 - - - Working, 2002 Betio drought
Kiribati 2 1999 50 m3 - - - Broken down Hospital, Hotel supply
Tonga 1 2009 16 m3 RO TOP$90,
000 - Operational Naval Base emergency
Table 2: Summary of known Desalination plants in the Pacific (Excluding Industrial, Commercial and Resorts)
30
5. Case studies
In this section are two case studies based on two different desalination technologies - a small portable
reverse osmosis unit as supplied by Oceania Water Treatment, and solar desalination stills as
supplied by FCubed Ltd. The financial cost effectiveness of the two systems presented will be
compared and a general comparison can be made with a preliminary assessment (in appendix A), of
the estimated cost of rehabilitating a typical community rainwater harvesting catchment, to give an
idea of their relative cost competitiveness.
As this is a desk study, some information relevant to each country and necessary for a comprehensive
analysis, is not available, The following studies are based on available information, and present only
the purchase and operational costs of the technologies to illustrate the minimum costs that might be
expected, without consideration of other incidental and associated costs such as shipping charges or
duty, or the infrastructure and operational costs required for pumping water to the units, cost of
creating and maintaining an intake, effluent discharge costs, or storage and distribution of the product.
5.1 Assessing the Financial Cost of Alternative Technologies
Assessments are made on the basis of cost per cubic metre of desalinated water produced, as the
long term benefits from desalination can be more easily appraised. The costs of infrastructure
acquisition, installation, and distribution of product are not included because these are variable and
difficult to assess. However, these costs should not be overlooked when considering desalination, as
acquisition and installation costs of new technologies can be high, and implications for efficiency will
be considered in Section 6. Due to the differences of the two desalination methods provided,
comparisons will be based on per unit costs of providing a specified water output. The 18TS Portable
desalination unit, used in the first case study, has a standard output of 16 m3 per day; enough to serve
a population 320 people each 50 litres per day, the WHO recommended minimum amount for
household use (WHO 2005). This will be used as the output rate for comparison.
The three countries chosen for the comparison are Nauru, Tuvalu, and Kiribati. These three countries
were selected because they are all currently using desalination technologies to provide water, have
very similar geographical characteristics, and also because they all operate on the same currency,
which allows for easier and more practical comparison.
31
It is important to note that the following is a preliminary overview and is provided only as a means to
illustrate basic financial costs that can be expected when operating desalination plants. It is by no
means a definitive or comprehensive analysis and excludes a variety of economic and social
considerations that must also be taken into account in order to best determine the feasibility of
desalination as a means to provide drinking water. The figures for the following were provided with
confidence by the manufacturers of the respective products, and are presented as is. All care has
been taken to ensure accurate and reliable figures are presented, using the best available data.
5.2 Case Study 1 – Portable Reverse Osmosis Unit
The following hypothetical example is estimated based on figures kindly provided by Oceania Water
Treatment based on their Model 18TS RO Portable desalination unit, which produces approximately
16m3/day or 504m3/month. The unit purchase cost is approximately $51,000 AUD (2010). The
energy consumption of the unit is rated at 106kWh/day, or 2,968kWh/month to produce approximately
16m3/day or 504m3/month. The membranes require replacement on average every 3 years, at a cost
of approximately AUD$3,000, or AUD$83.30 per month. Chemicals for cleaning the membranes
come to about AUD$240/year, or $20/month. The unit requires an estimated 12 hours per month of
local labour for daily monitoring and monthly cleaning. Depending on local capability, the
recommended service calls by company staff may be at either 3 or 6 monthly intervals, requiring one
full service day per visit. The manufacturer’s service fees are currently AUD$500 per day in travel and
AUD$850 per day on site. The last major operational cost is for pre-filtration and chlorination,
averaging AUD$132/month.
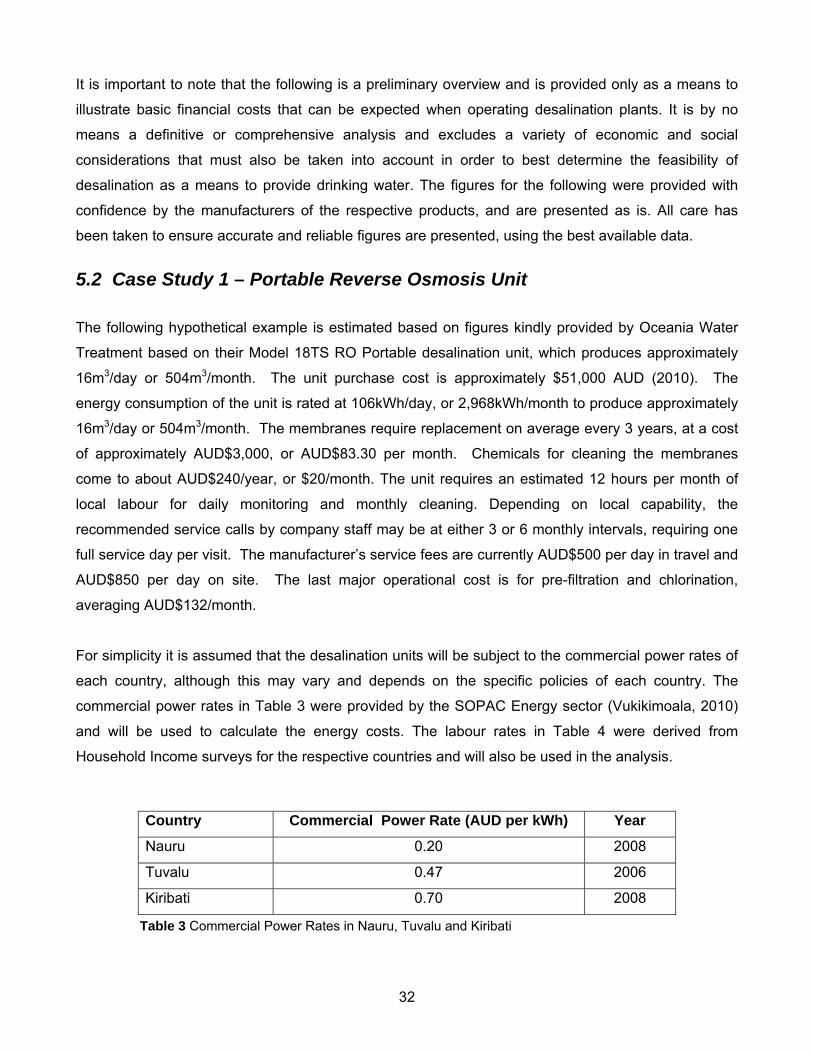
For simplicity it is assumed that the desalination units will be subject to the commercial power rates of
each country, although this may vary and depends on the specific policies of each country. The
commercial power rates in Table 3 were provided by the SOPAC Energy sector (Vukikimoala, 2010)
and will be used to calculate the energy costs. The labour rates in Table 4 were derived from
Household Income surveys for the respective countries and will also be used in the analysis.
Country Commercial Power Rate (AUD per kWh) Year
Nauru 0.20 2008
Tuvalu 0.47 2006
Kiribati 0.70 2008
Table 3 Commercial Power Rates in Nauru, Tuvalu and Kiribati
32
Country Average hourly income (AUD) Year
Nauru1 2.55 2004 - 2005
Tuvalu2 3.38 2006
Kiribati3 1.79 2006
Table 4 Average hourly incomes in Nauru, Tuvalu and Kiribati
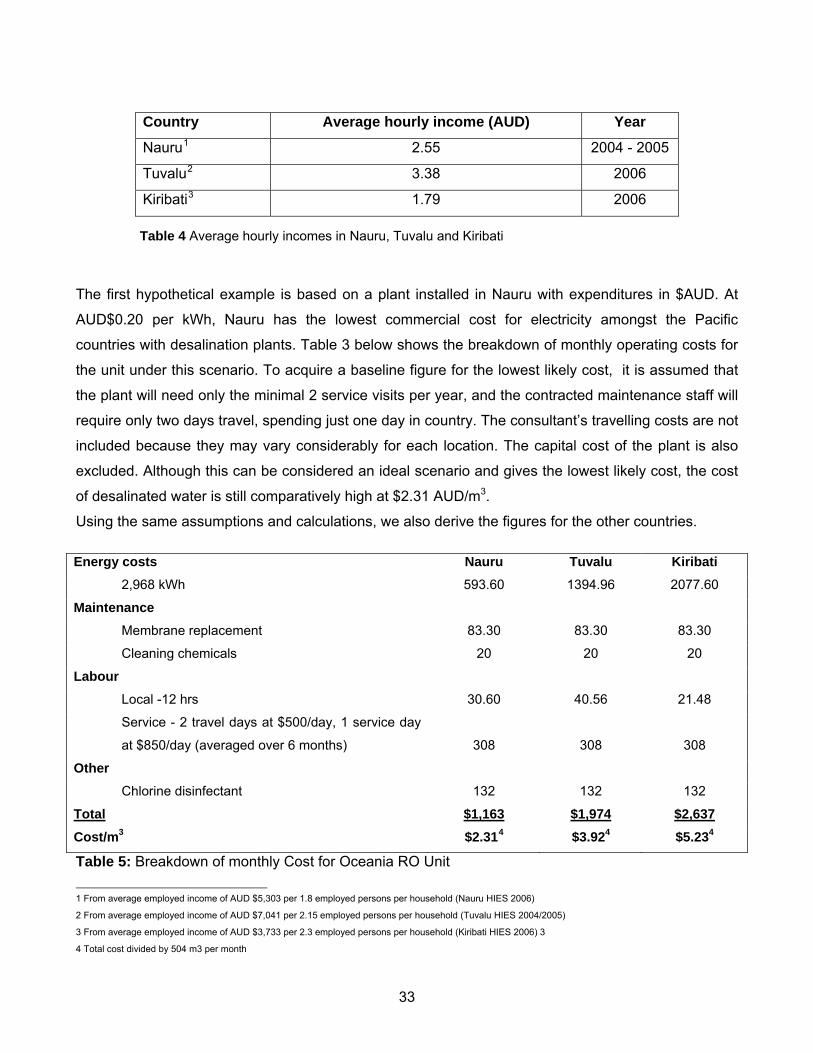
The first hypothetical example is based on a plant installed in Nauru with expenditures in $AUD. At
AUD$0.20 per kWh, Nauru has the lowest commercial cost for electricity amongst the Pacific
countries with desalination plants. Table 3 below shows the breakdown of monthly operating costs for
the unit under this scenario. To acquire a baseline figure for the lowest likely cost, it is assumed that
the plant will need only the minimal 2 service visits per year, and the contracted maintenance staff will
require only two days travel, spending just one day in country. The consultant’s travelling costs are not
included because they may vary considerably for each location. The capital cost of the plant is also
excluded. Although this can be considered an ideal scenario and gives the lowest likely cost, the cost
of desalinated water is still comparatively high at $2.31 AUD/m3.
Using the same assumptions and calculations, we also derive the figures for the other countries. Energy costs Nauru Tuvalu Kiribati
2,968 kWh 593.60 1394.96 2077.60
Maintenance
Membrane replacement 83.30 83.30 83.30
Cleaning chemicals 20 20 20
Labour
Local -12 hrs 30.60 40.56 21.48
Service - 2 travel days at $500/day, 1 service day
at $850/day (averaged over 6 months)
308
308
308
Other
Chlorine disinfectant 132 132 132
Total $1,163 $1,974 $2,637 Cost/m3 $2.314 $3.924 $5.234
Table 5: Breakdown of monthly Cost for Oceania RO Unit
1 From average employed income of AUD $5,303 per 1.8 employed persons per household (Nauru HIES 2006)
2 From average employed income of AUD $7,041 per 2.15 employed persons per household (Tuvalu HIES 2004/2005)
3 From average employed income of AUD $3,733 per 2.3 employed persons per household (Kiribati HIES 2006) 3
4 Total cost divided by 504 m3 per month
33
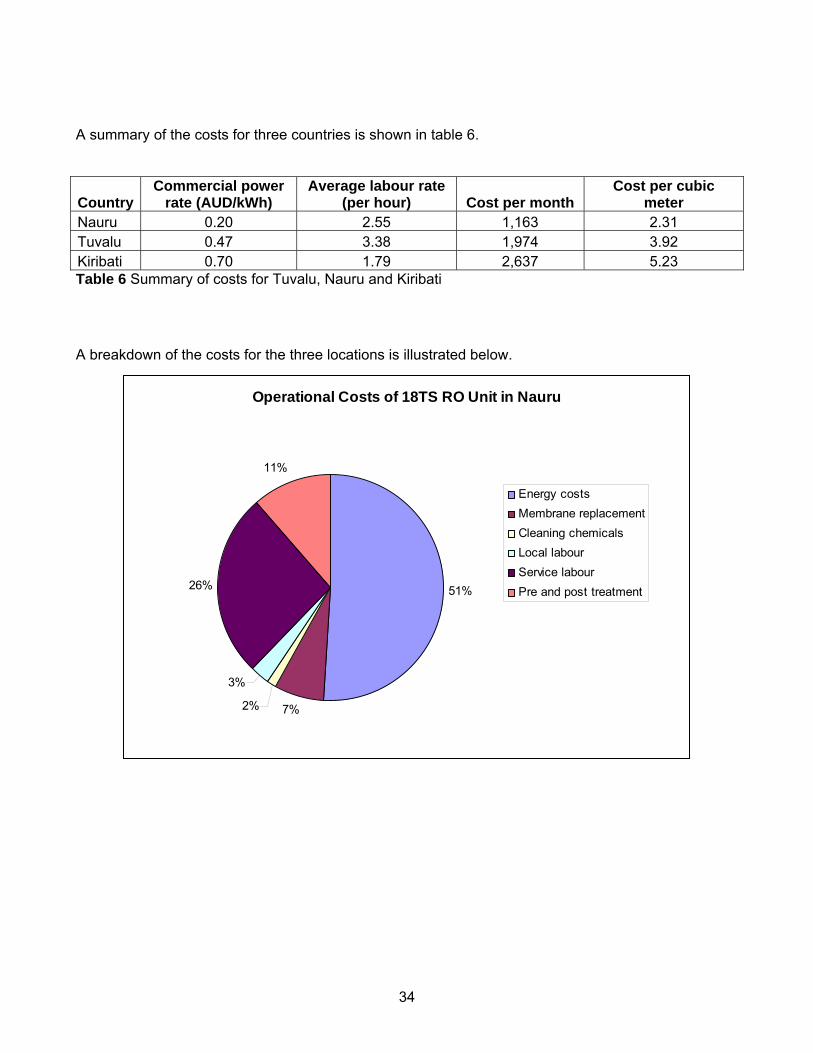
A summary of the costs for three countries is shown in table 6.
Country Commercial power
rate (AUD/kWh) Average labour rate
(per hour) Cost per month Cost per cubic
meter Nauru 0.20 2.55 1,163 2.31 Tuvalu 0.47 3.38 1,974 3.92 Kiribati 0.70 1.79 2,637 5.23 Table 6 Summary of costs for Tuvalu, Nauru and Kiribati
A breakdown of the costs for the three locations is illustrated below.
Operational Costs of 18TS RO Unit in Nauru
51%
7%2%
3%
26%
11%
Energy costs Membrane replacementCleaning chemicalsLocal labourService labourPre and post treatment
34
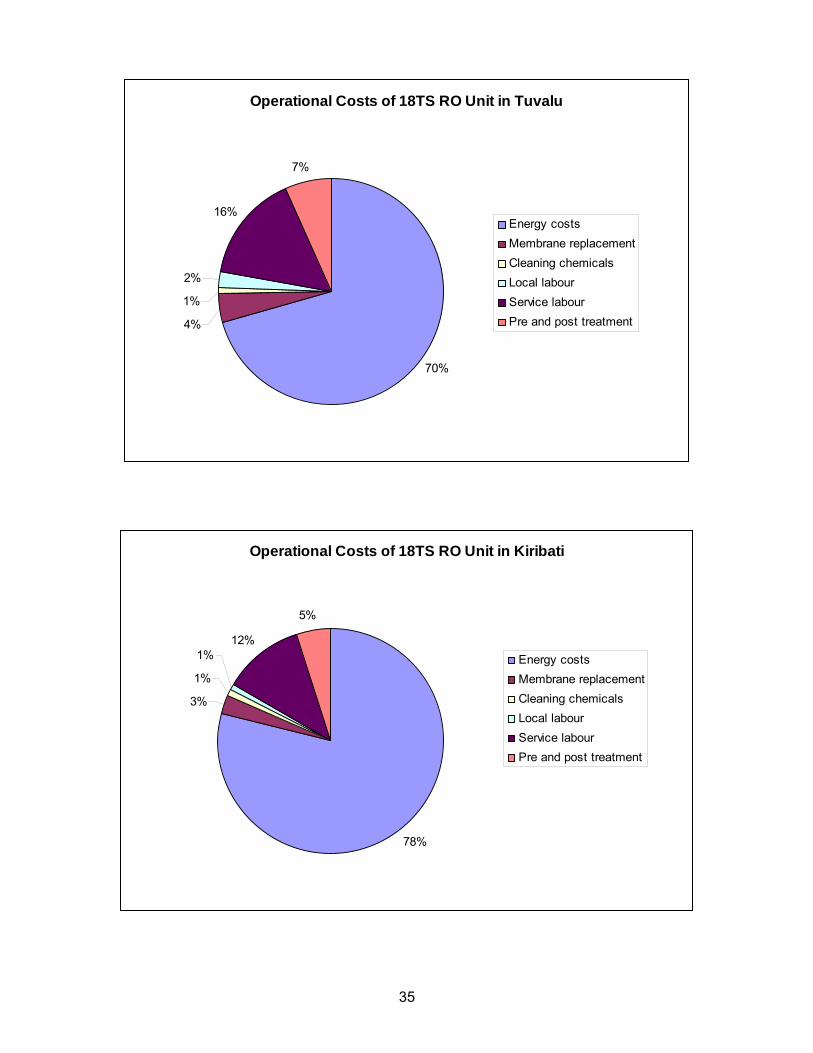
Operational Costs of 18TS RO Unit in Tuvalu
70%
4%
1%
2%
16%
7%
Energy costs Membrane replacementCleaning chemicalsLocal labourService labourPre and post treatment
Operational Costs of 18TS RO Unit in Kiribati
78%
3%
1%
1%12%
5%
Energy costs Membrane replacementCleaning chemicalsLocal labourService labourPre and post treatment
35
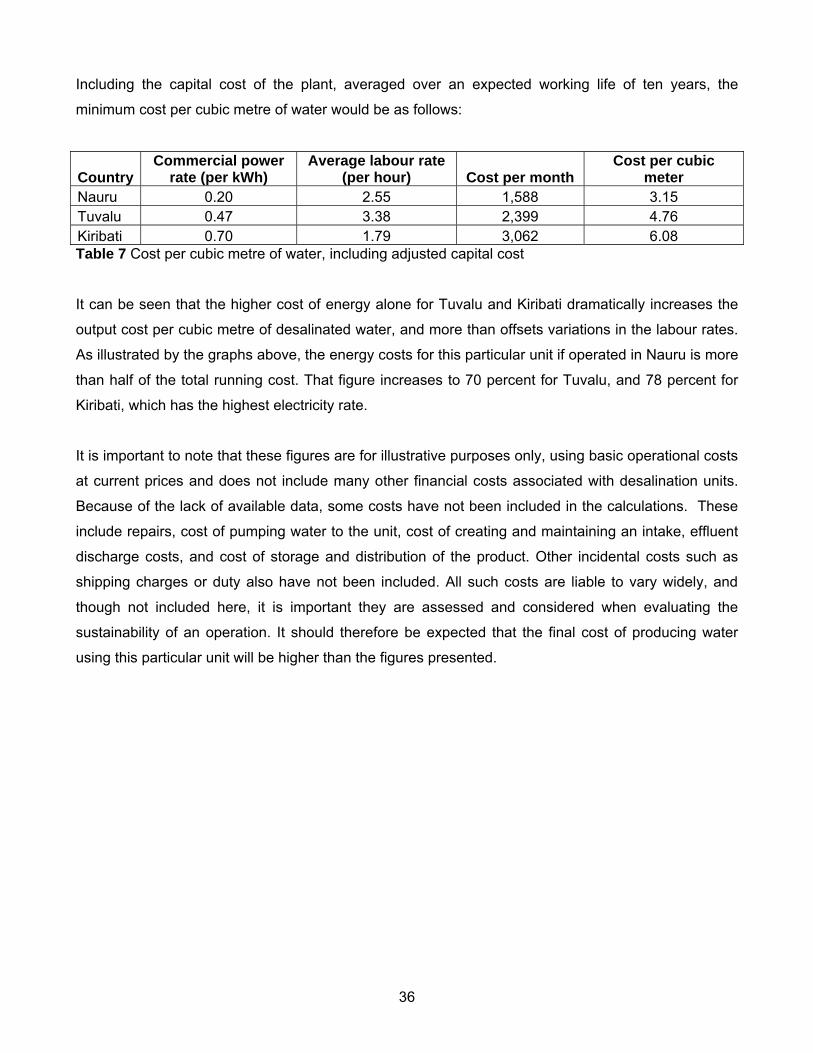
Including the capital cost of the plant, averaged over an expected working life of ten years, the
minimum cost per cubic metre of water would be as follows:
Country Commercial power
rate (per kWh) Average labour rate
(per hour) Cost per month Cost per cubic
meter Nauru 0.20 2.55 1,588 3.15 Tuvalu 0.47 3.38 2,399 4.76 Kiribati 0.70 1.79 3,062 6.08 Table 7 Cost per cubic metre of water, including adjusted capital cost
It can be seen that the higher cost of energy alone for Tuvalu and Kiribati dramatically increases the
output cost per cubic metre of desalinated water, and more than offsets variations in the labour rates.
As illustrated by the graphs above, the energy costs for this particular unit if operated in Nauru is more
than half of the total running cost. That figure increases to 70 percent for Tuvalu, and 78 percent for
Kiribati, which has the highest electricity rate.
It is important to note that these figures are for illustrative purposes only, using basic operational costs
at current prices and does not include many other financial costs associated with desalination units.
Because of the lack of available data, some costs have not been included in the calculations. These
include repairs, cost of pumping water to the unit, cost of creating and maintaining an intake, effluent
discharge costs, and cost of storage and distribution of the product. Other incidental costs such as
shipping charges or duty also have not been included. All such costs are liable to vary widely, and
though not included here, it is important they are assessed and considered when evaluating the
sustainability of an operation. It should therefore be expected that the final cost of producing water
using this particular unit will be higher than the figures presented.
36
5.3 Case Study 2 – Solar Desalination Stills The second hypothetical example is based on the Carocell Solar Desalination module developed by
FCubed Ltd. of Australia, as outlined above. For comparison with the RO unit in Case Study 1, the
scenario considers a setup capable of providing the equivalent production of 16 m3 of water per day in
Kiribati and Tuvalu. No analysis has been done for Nauru, due to lack of reliable sunlight data.
An advantage proposed for this particular product is the capability to use the panels as a surface
catchment to harvest rainwater as well as desalinating sea water. The following provides cost per
cubic meter based on yield with and without making use of the rainwater harvesting capability. To
maintain consistency with the Case Study 1, installation and distribution costs (water to and from the
stills) are not included. The manufacturer states the stills require minimal minor maintenance such as
cleaning and does not provide cost estimates. For simplicity, it is assumed that the cost is negligible
and has been excluded.
Based on the mean solar radiation figures for Kiribati and Tuvalu, 6 kWh/m2/day and 5.5 kWh/m2/day
respectively (SOPAC 2009d), and the efficiency of the unit, the manufacturer advises an average
desalination production rate of 6.21 litres per m2 for Kiribati, and 5.70 litres per m2 for Tuvalu
(Eastaugh 2010). The mean average annual rainfall is 3,549 mm for Tuvalu and 2,000 mm for Kiribati
(SOPAC-HYCOS 2010) which yields an average of 9.72 litres/day/m2 and 5.48 litres/day/m2 of
rainwater respectively. A standard runoff coefficient of 0.8 is included in the calculations to account
for water not collected, for such reasons as wind evaporation, splash, and the ability of the material to
retain water. These average rainfall yields are not comprehensively representative of actual daily
rainfall, which varies throughout the year, but average yields are sufficient for the purpose of
discussion. These figures, summarised in table 8, enable calculation of the required area of still -
shown in tables 9 and 10 below.
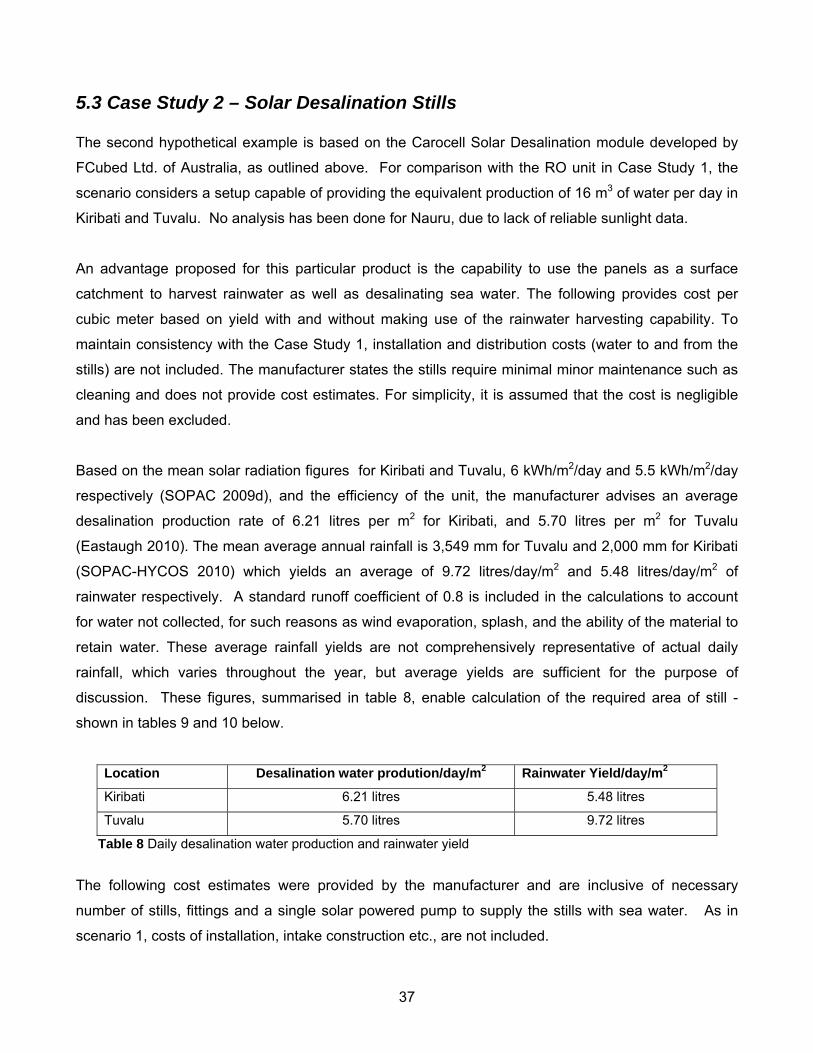
Location Desalination water prodution/day/m2 Rainwater Yield/day/m2
Kiribati 6.21 litres 5.48 litres
Tuvalu 5.70 litres 9.72 litres
Table 8 Daily desalination water production and rainwater yield
The following cost estimates were provided by the manufacturer and are inclusive of necessary
number of stills, fittings and a single solar powered pump to supply the stills with sea water. As in
scenario 1, costs of installation, intake construction etc., are not included.
37
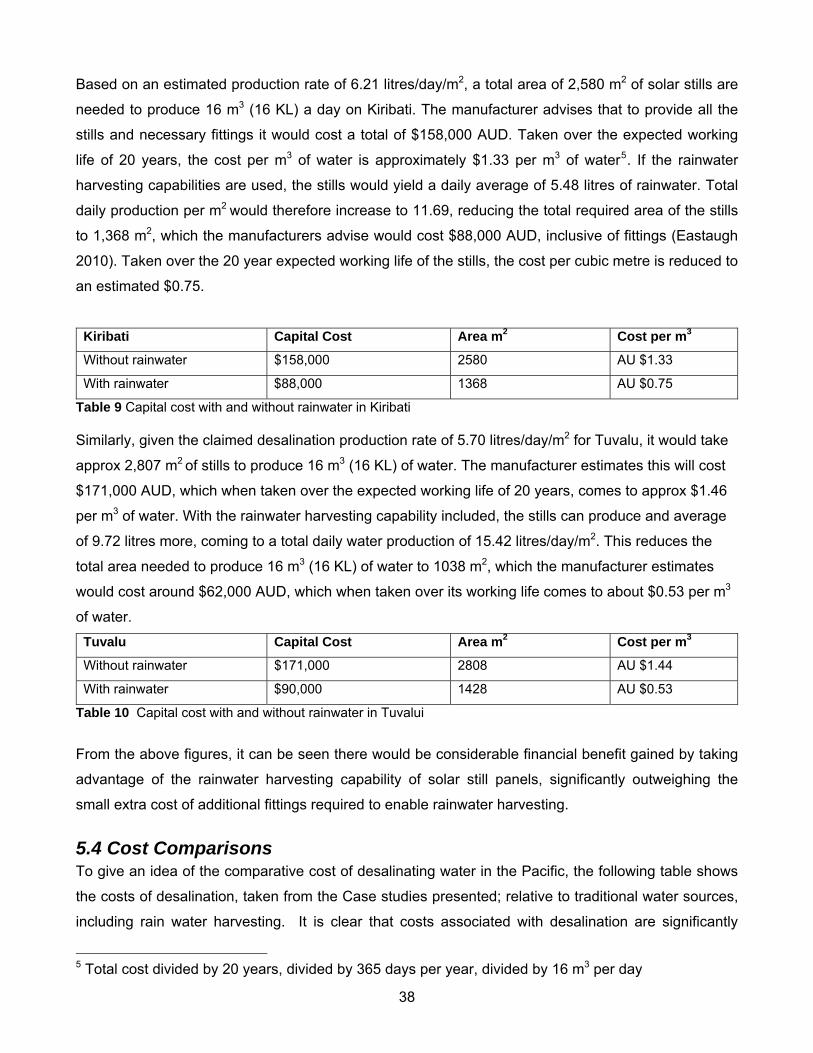
Based on an estimated production rate of 6.21 litres/day/m2, a total area of 2,580 m2 of solar stills are
needed to produce 16 m3 (16 KL) a day on Kiribati. The manufacturer advises that to provide all the
stills and necessary fittings it would cost a total of $158,000 AUD. Taken over the expected working
life of 20 years, the cost per m3 of water is approximately $1.33 per m3 of water5. If the rainwater
harvesting capabilities are used, the stills would yield a daily average of 5.48 litres of rainwater. Total
daily production per m2 would therefore increase to 11.69, reducing the total required area of the stills
to 1,368 m2, which the manufacturers advise would cost $88,000 AUD, inclusive of fittings (Eastaugh
2010). Taken over the 20 year expected working life of the stills, the cost per cubic metre is reduced to
an estimated $0.75.
Kiribati Capital Cost Area m2 Cost per m3
Without rainwater $158,000 2580 AU $1.33
With rainwater $88,000 1368 AU $0.75
Table 9 Capital cost with and without rainwater in Kiribati Similarly, given the claimed desalination production rate of 5.70 litres/day/m2 for Tuvalu, it would take
approx 2,807 m2 of stills to produce 16 m3 (16 KL) of water. The manufacturer estimates this will cost
$171,000 AUD, which when taken over the expected working life of 20 years, comes to approx $1.46
per m3 of water. With the rainwater harvesting capability included, the stills can produce and average
of 9.72 litres more, coming to a total daily water production of 15.42 litres/day/m2. This reduces the
total area needed to produce 16 m3 (16 KL) of water to 1038 m2, which the manufacturer estimates
would cost around $62,000 AUD, which when taken over its working life comes to about $0.53 per m3
of water.
Tuvalu Capital Cost Area m2 Cost per m3
Without rainwater $171,000 2808 AU $1.44
With rainwater $90,000 1428 AU $0.53
Table 10 Capital cost with and without rainwater in Tuvalui
From the above figures, it can be seen there would be considerable financial benefit gained by taking
advantage of the rainwater harvesting capability of solar still panels, significantly outweighing the
small extra cost of additional fittings required to enable rainwater harvesting.
5.4 Cost Comparisons To give an idea of the comparative cost of desalinating water in the Pacific, the following table shows
the costs of desalination, taken from the Case studies presented; relative to traditional water sources,
including rain water harvesting. It is clear that costs associated with desalination are significantly
5 Total cost divided by 20 years, divided by 365 days per year, divided by 16 m3 per day
38
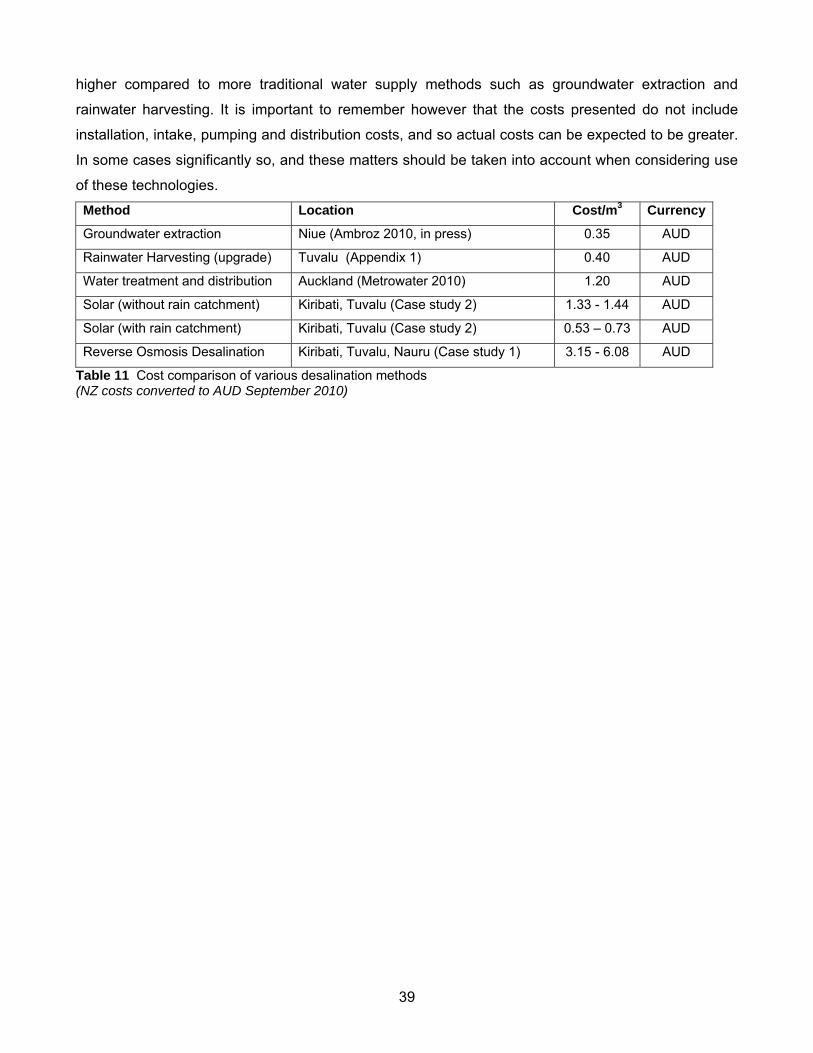
higher compared to more traditional water supply methods such as groundwater extraction and
rainwater harvesting. It is important to remember however that the costs presented do not include
installation, intake, pumping and distribution costs, and so actual costs can be expected to be greater.
In some cases significantly so, and these matters should be taken into account when considering use
of these technologies.
Method Location Cost/m3 Currency
Groundwater extraction Niue (Ambroz 2010, in press) 0.35 AUD
Rainwater Harvesting (upgrade) Tuvalu (Appendix 1) 0.40 AUD
Water treatment and distribution Auckland (Metrowater 2010) 1.20 AUD
Solar (without rain catchment) Kiribati, Tuvalu (Case study 2) 1.33 - 1.44 AUD
Solar (with rain catchment) Kiribati, Tuvalu (Case study 2) 0.53 – 0.73 AUD
Reverse Osmosis Desalination Kiribati, Tuvalu, Nauru (Case study 1) 3.15 - 6.08 AUD
Table 11 Cost comparison of various desalination methods (NZ costs converted to AUD September 2010)
39
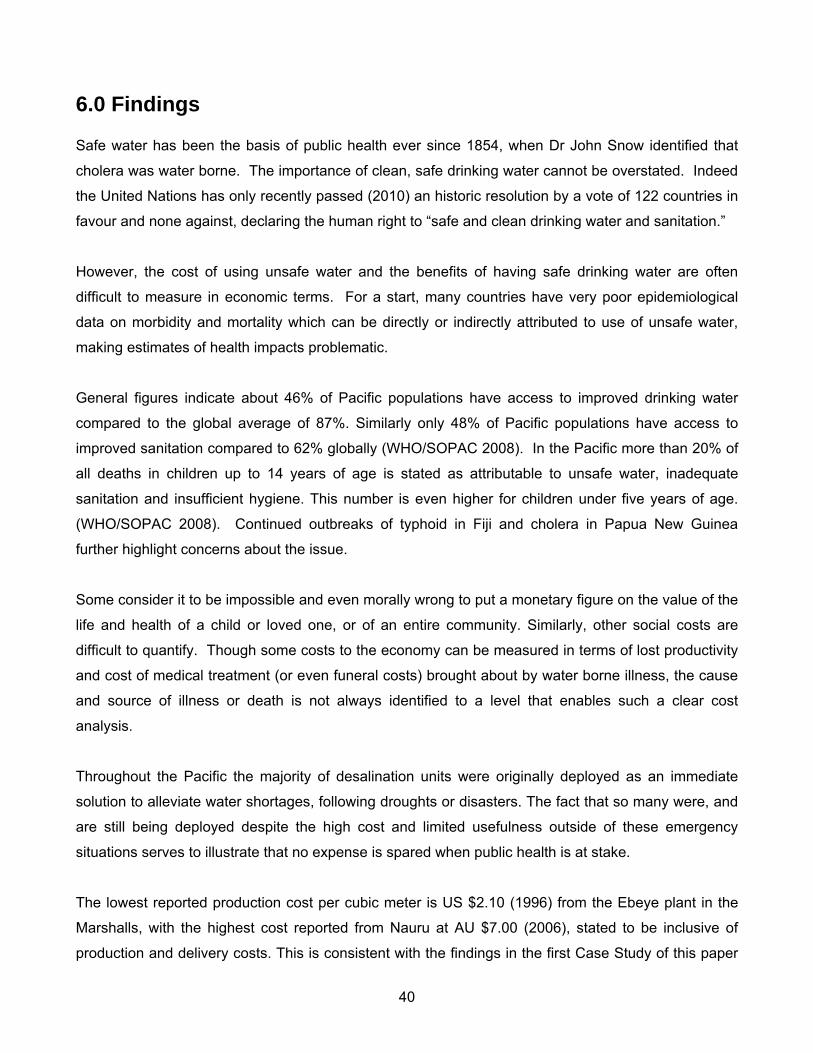
6.0 Findings Safe water has been the basis of public health ever since 1854, when Dr John Snow identified that
cholera was water borne. The importance of clean, safe drinking water cannot be overstated. Indeed
the United Nations has only recently passed (2010) an historic resolution by a vote of 122 countries in
favour and none against, declaring the human right to “safe and clean drinking water and sanitation.”
However, the cost of using unsafe water and the benefits of having safe drinking water are often
difficult to measure in economic terms. For a start, many countries have very poor epidemiological
data on morbidity and mortality which can be directly or indirectly attributed to use of unsafe water,
making estimates of health impacts problematic.
General figures indicate about 46% of Pacific populations have access to improved drinking water
compared to the global average of 87%. Similarly only 48% of Pacific populations have access to
improved sanitation compared to 62% globally (WHO/SOPAC 2008). In the Pacific more than 20% of
all deaths in children up to 14 years of age is stated as attributable to unsafe water, inadequate
sanitation and insufficient hygiene. This number is even higher for children under five years of age.
(WHO/SOPAC 2008). Continued outbreaks of typhoid in Fiji and cholera in Papua New Guinea
further highlight concerns about the issue.
Some consider it to be impossible and even morally wrong to put a monetary figure on the value of the
life and health of a child or loved one, or of an entire community. Similarly, other social costs are
difficult to quantify. Though some costs to the economy can be measured in terms of lost productivity
and cost of medical treatment (or even funeral costs) brought about by water borne illness, the cause
and source of illness or death is not always identified to a level that enables such a clear cost
analysis.
Throughout the Pacific the majority of desalination units were originally deployed as an immediate
solution to alleviate water shortages, following droughts or disasters. The fact that so many were, and
are still being deployed despite the high cost and limited usefulness outside of these emergency
situations serves to illustrate that no expense is spared when public health is at stake.
The lowest reported production cost per cubic meter is US $2.10 (1996) from the Ebeye plant in the
Marshalls, with the highest cost reported from Nauru at AU $7.00 (2006), stated to be inclusive of
production and delivery costs. This is consistent with the findings in the first Case Study of this paper
40
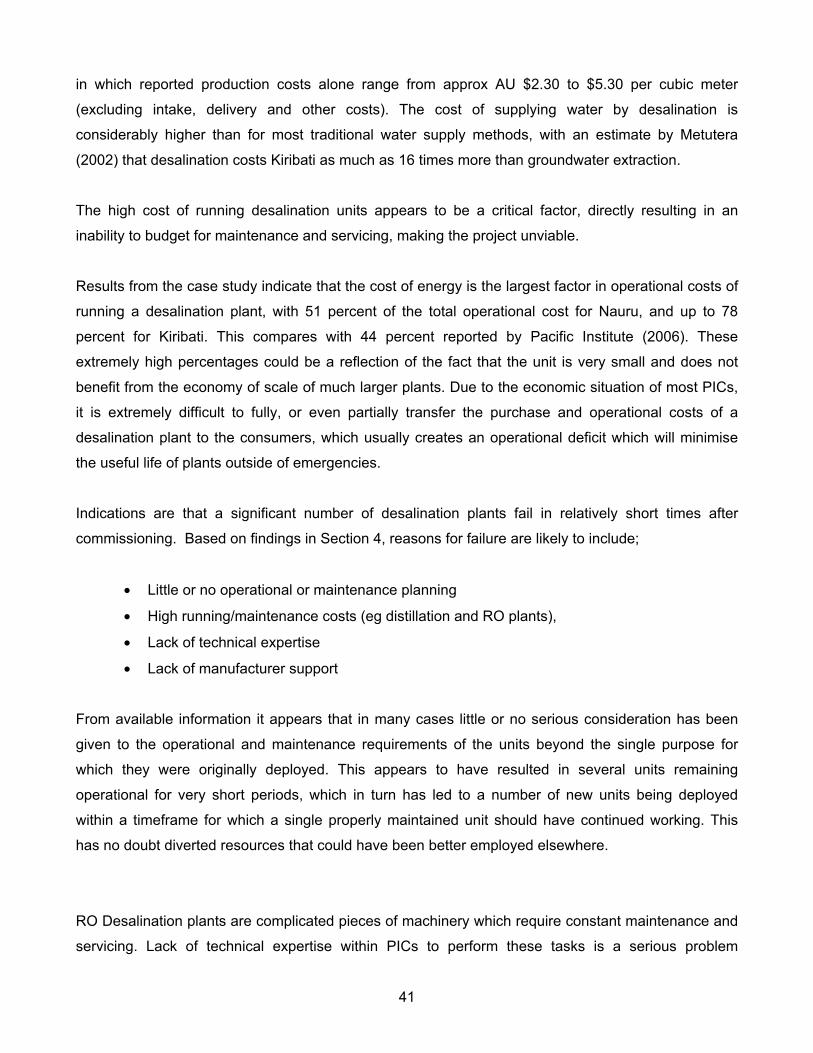
in which reported production costs alone range from approx AU $2.30 to $5.30 per cubic meter
(excluding intake, delivery and other costs). The cost of supplying water by desalination is
considerably higher than for most traditional water supply methods, with an estimate by Metutera
(2002) that desalination costs Kiribati as much as 16 times more than groundwater extraction.
The high cost of running desalination units appears to be a critical factor, directly resulting in an
inability to budget for maintenance and servicing, making the project unviable.
Results from the case study indicate that the cost of energy is the largest factor in operational costs of
running a desalination plant, with 51 percent of the total operational cost for Nauru, and up to 78
percent for Kiribati. This compares with 44 percent reported by Pacific Institute (2006). These
extremely high percentages could be a reflection of the fact that the unit is very small and does not
benefit from the economy of scale of much larger plants. Due to the economic situation of most PICs,
it is extremely difficult to fully, or even partially transfer the purchase and operational costs of a
desalination plant to the consumers, which usually creates an operational deficit which will minimise
the useful life of plants outside of emergencies.
Indications are that a significant number of desalination plants fail in relatively short times after
commissioning. Based on findings in Section 4, reasons for failure are likely to include;
• Little or no operational or maintenance planning
• High running/maintenance costs (eg distillation and RO plants),
• Lack of technical expertise
• Lack of manufacturer support
From available information it appears that in many cases little or no serious consideration has been
given to the operational and maintenance requirements of the units beyond the single purpose for
which they were originally deployed. This appears to have resulted in several units remaining
operational for very short periods, which in turn has led to a number of new units being deployed
within a timeframe for which a single properly maintained unit should have continued working. This
has no doubt diverted resources that could have been better employed elsewhere.
RO Desalination plants are complicated pieces of machinery which require constant maintenance and
servicing. Lack of technical expertise within PICs to perform these tasks is a serious problem
41
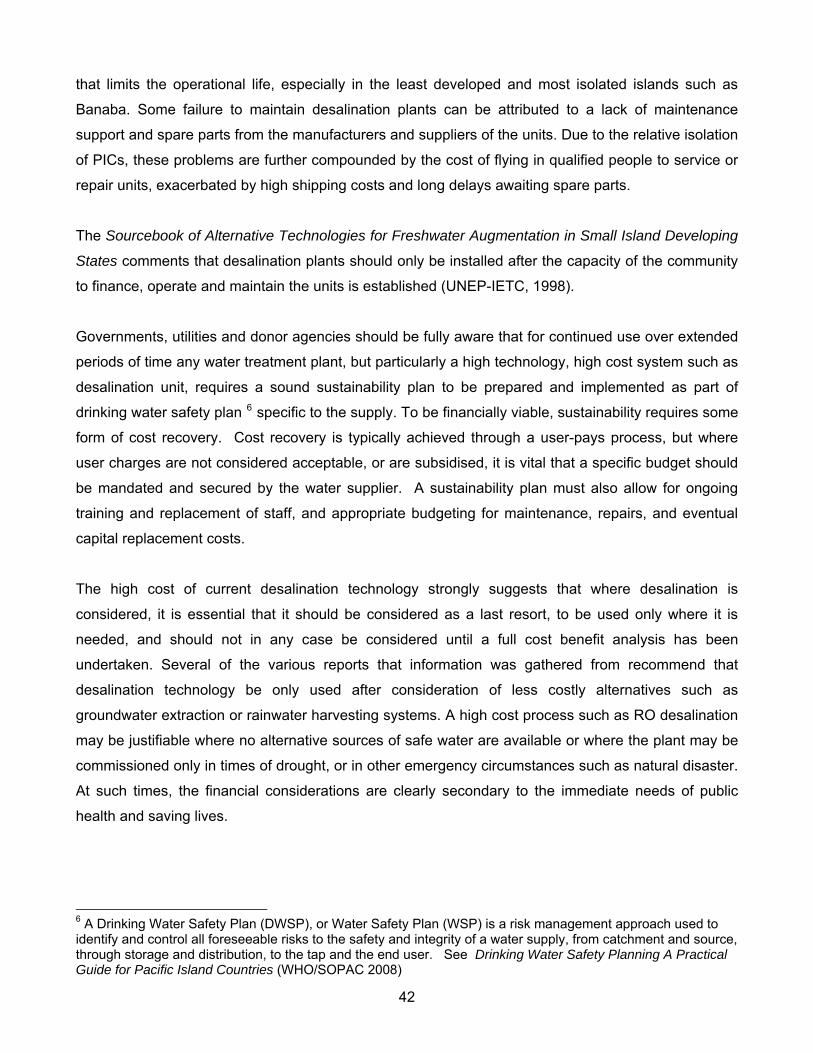
that limits the operational life, especially in the least developed and most isolated islands such as
Banaba. Some failure to maintain desalination plants can be attributed to a lack of maintenance
support and spare parts from the manufacturers and suppliers of the units. Due to the relative isolation
of PICs, these problems are further compounded by the cost of flying in qualified people to service or
repair units, exacerbated by high shipping costs and long delays awaiting spare parts.
The Sourcebook of Alternative Technologies for Freshwater Augmentation in Small Island Developing
States comments that desalination plants should only be installed after the capacity of the community
to finance, operate and maintain the units is established (UNEP-IETC, 1998).
Governments, utilities and donor agencies should be fully aware that for continued use over extended
periods of time any water treatment plant, but particularly a high technology, high cost system such as
desalination unit, requires a sound sustainability plan to be prepared and implemented as part of
drinking water safety plan 6 specific to the supply. To be financially viable, sustainability requires some
form of cost recovery. Cost recovery is typically achieved through a user-pays process, but where
user charges are not considered acceptable, or are subsidised, it is vital that a specific budget should
be mandated and secured by the water supplier. A sustainability plan must also allow for ongoing
training and replacement of staff, and appropriate budgeting for maintenance, repairs, and eventual
capital replacement costs.
The high cost of current desalination technology strongly suggests that where desalination is
considered, it is essential that it should be considered as a last resort, to be used only where it is
needed, and should not in any case be considered until a full cost benefit analysis has been
undertaken. Several of the various reports that information was gathered from recommend that
desalination technology be only used after consideration of less costly alternatives such as
groundwater extraction or rainwater harvesting systems. A high cost process such as RO desalination
may be justifiable where no alternative sources of safe water are available or where the plant may be
commissioned only in times of drought, or in other emergency circumstances such as natural disaster.
At such times, the financial considerations are clearly secondary to the immediate needs of public
health and saving lives.
6 A Drinking Water Safety Plan (DWSP), or Water Safety Plan (WSP) is a risk management approach used to identify and control all foreseeable risks to the safety and integrity of a water supply, from catchment and source, through storage and distribution, to the tap and the end user. See Drinking Water Safety Planning A Practical Guide for Pacific Island Countries (WHO/SOPAC 2008)
42
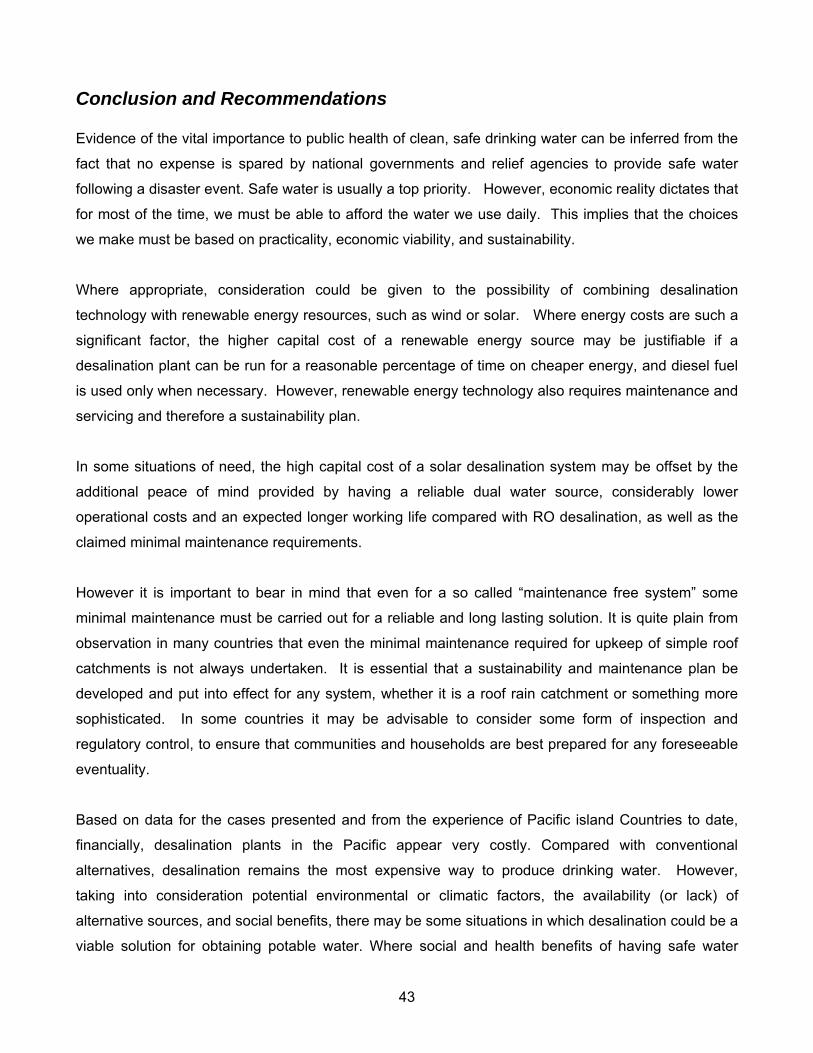
Conclusion and Recommendations Evidence of the vital importance to public health of clean, safe drinking water can be inferred from the
fact that no expense is spared by national governments and relief agencies to provide safe water
following a disaster event. Safe water is usually a top priority. However, economic reality dictates that
for most of the time, we must be able to afford the water we use daily. This implies that the choices
we make must be based on practicality, economic viability, and sustainability.
Where appropriate, consideration could be given to the possibility of combining desalination
technology with renewable energy resources, such as wind or solar. Where energy costs are such a
significant factor, the higher capital cost of a renewable energy source may be justifiable if a
desalination plant can be run for a reasonable percentage of time on cheaper energy, and diesel fuel
is used only when necessary. However, renewable energy technology also requires maintenance and
servicing and therefore a sustainability plan.
In some situations of need, the high capital cost of a solar desalination system may be offset by the
additional peace of mind provided by having a reliable dual water source, considerably lower
operational costs and an expected longer working life compared with RO desalination, as well as the
claimed minimal maintenance requirements.
However it is important to bear in mind that even for a so called “maintenance free system” some
minimal maintenance must be carried out for a reliable and long lasting solution. It is quite plain from
observation in many countries that even the minimal maintenance required for upkeep of simple roof
catchments is not always undertaken. It is essential that a sustainability and maintenance plan be
developed and put into effect for any system, whether it is a roof rain catchment or something more
sophisticated. In some countries it may be advisable to consider some form of inspection and
regulatory control, to ensure that communities and households are best prepared for any foreseeable
eventuality.
Based on data for the cases presented and from the experience of Pacific island Countries to date,
financially, desalination plants in the Pacific appear very costly. Compared with conventional
alternatives, desalination remains the most expensive way to produce drinking water. However,
taking into consideration potential environmental or climatic factors, the availability (or lack) of
alternative sources, and social benefits, there may be some situations in which desalination could be a
viable solution for obtaining potable water. Where social and health benefits of having safe water
43
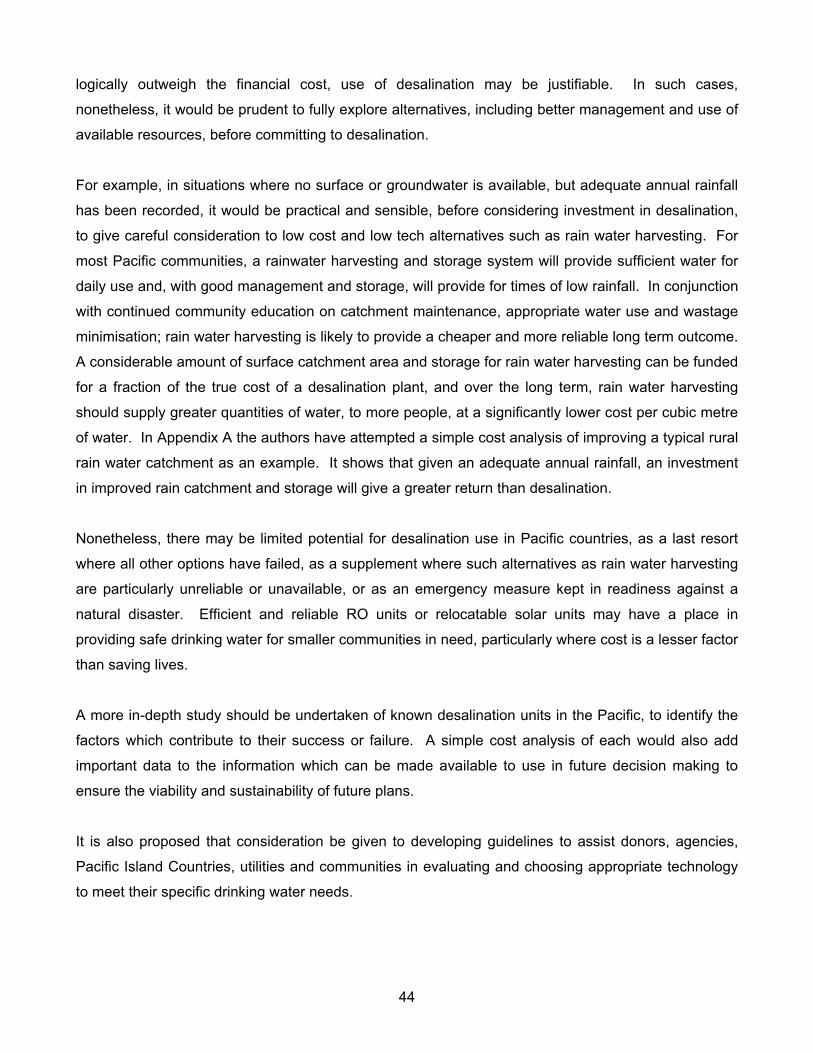
logically outweigh the financial cost, use of desalination may be justifiable. In such cases,
nonetheless, it would be prudent to fully explore alternatives, including better management and use of
available resources, before committing to desalination.
For example, in situations where no surface or groundwater is available, but adequate annual rainfall
has been recorded, it would be practical and sensible, before considering investment in desalination,
to give careful consideration to low cost and low tech alternatives such as rain water harvesting. For
most Pacific communities, a rainwater harvesting and storage system will provide sufficient water for
daily use and, with good management and storage, will provide for times of low rainfall. In conjunction
with continued community education on catchment maintenance, appropriate water use and wastage
minimisation; rain water harvesting is likely to provide a cheaper and more reliable long term outcome.
A considerable amount of surface catchment area and storage for rain water harvesting can be funded
for a fraction of the true cost of a desalination plant, and over the long term, rain water harvesting
should supply greater quantities of water, to more people, at a significantly lower cost per cubic metre
of water. In Appendix A the authors have attempted a simple cost analysis of improving a typical rural
rain water catchment as an example. It shows that given an adequate annual rainfall, an investment
in improved rain catchment and storage will give a greater return than desalination.
Nonetheless, there may be limited potential for desalination use in Pacific countries, as a last resort
where all other options have failed, as a supplement where such alternatives as rain water harvesting
are particularly unreliable or unavailable, or as an emergency measure kept in readiness against a
natural disaster. Efficient and reliable RO units or relocatable solar units may have a place in
providing safe drinking water for smaller communities in need, particularly where cost is a lesser factor
than saving lives.
A more in-depth study should be undertaken of known desalination units in the Pacific, to identify the
factors which contribute to their success or failure. A simple cost analysis of each would also add
important data to the information which can be made available to use in future decision making to
ensure the viability and sustainability of future plans.
It is also proposed that consideration be given to developing guidelines to assist donors, agencies,
Pacific Island Countries, utilities and communities in evaluating and choosing appropriate technology
to meet their specific drinking water needs.
44
References: Ambroz, A. 2010, Least cost analysis of water supply options in Niue, SOPAC Technical Report, SOPAC, Suva, Fiji
Buros O K, (2000) The ABCs of Desalting, Second Ed. International Desalination Association. http://www.elkhornslough.org/desal/ABCs.pdf
Buros, O.K. 1987. An Introduction to Desalination. In: Non-conventional Water Resources Use in Developing Countries, United Nations Natural Resources/Water Series No. 22, 37-53.
UNEP Sourcebook of Alternate Technologies for Freshwater Augmentation in Small Island Developing States http://www.unep.or.jp/ietc/publications/techpublications/techpub-8e/desalination.asp
Heather Cooley, Peter H. Gleick, and Gary Wolff, Desalination, With A Grain Of Salt, A California Perspective JUNE 2006 http://www.pacinst.org/reports/desalination/desalination_report.pdf
Promotional Page – Saltworks Technology. http://www.saltworkstech.com/
Munke, Frank: Ecological and economic analysis of seawater desalination plants - Diploma Thesis. Matri. No.: 1157140 Karlsruhe, April 2008.
AWA 2008. Australian Water Association: Desalination. 23-Jun-2008. http://www.awa.asn.au/am/printertemplate.cfm?section=desalination
The Australian. 2010. Water charges are set to spiral in desalination squeeze. January 23,2010 12:00AM. http://www.theaustralian.com.au/news/nation/water-charges-are-set-to-spiral-in-desalination-squeeze/story-e6frg6nf-1225822705341
NSW GOV. 2010. Sydney’s Wind Powered Desalination Plant Now Online, News release Premier of NSW. Thursday, 28 January 2010
http://www.premier.nsw.gov.au/sites/default/files/100128-desalination-plant-switch-on.pdf
Gleick, P. H., 1996: Water resources. Encyclopedia of Climate and Weather, ed. by S. H. Schneider, Oxford University Press
Pacific Institute, 2006, Desalination with a grain of salt, A California Perspective. Pacific Institute for Studies in Development, Environment, and Security.Oakland, California.
SOPAC, 2007a, Management Diagnostic Report – Tuvalu, National Integrated Water Resource, Draft SOPAC Miscellaneous Report 647, Fiji.
SOPAC, 1998a, Demand Management and Conservation Investigations in Funafuti, Tuvalu Demand Management Project, SOPAC Technical Report 269, Fiji
Japan Embassy, 2006, Japan Provides Desalination Plant to relieve Tuvalu’s water problems, Embassy of Japan in the Republic of the Fiji islands, http://www.fj.emb-japan.go.jp/pr_Japan_Provides_Desalination_Plant_to_relieve_Tuvalus_water_problems.html
EU-SOPAC, 2006, Reducing Vulnerability of Pacific ACP States: RMI, EDF9 Project Report 86
SOPAC, 1996, RMI Water and Sanitation Sector Strategy and Action Plan, SOPAC Technical Report 236, Fiji
SOPAC, 2007b, RMI National Integrated Water Resource Management Diagnostic Report, SOPAC Miscellaneous Report 639, Fiji
SOPAC, 2001, Report of Visit to Ebeye, Kwajalein, Marshall Islands, SOPAC Preliminary Report 134, Fiji
Presley, T.K., 2005, Effects of the 1998 drought on the freshwater lens in the Laura area, Majuro Atoll, Republic of the Marshall Islands: U.S. Geological Survey Scientific Investigations Report 2005-5098,
45
SOPAC, 2007c, Management Diagnostic Report - Nauru, National Integrated Water Resource, Draft SOPAC Miscellaneous Report 640, Fiji
SOPAC, 2010, Country Implementation Plan for Improving Water Security in the Republic of Nauru (Draft)
SOPAC, 1998b, Nauru Reconnaissance Report, SOPAC Water Resources Unit, SOPAC Miscellaneous Report 303, Fiji
SOPAC, 2009, Initiating Integrated Water Resources Management in the Republic of Nauru (Draft)
Metutera, T. 2002. Water management in Kiribati with special emphasis on groundwater development using infiltration galleries. Case study presented as part of Theme 1, Water Resources Management, at the Pacific Regional Consultation Meeting on Water in Small Island Countries, Sigatoka, Fiji , 29 July - 3 August 2002
SOPAC, 2007d, Management Diagnostic Report - Kiribati, National Integrated Water Resource, Draft SOPAC Miscellaneous Report 638, Fiji
SOPAC, 2009d, Poster – Solar Cooking in the Pacific Islands, http://www.sopac.org/Solar+Cooking accessed July 20 2010
TBC, 2009, Princess Regent launches desalination machine 21 January 2010 18:28:11, Tonga Broadcasting Commission, Nukualofa,
[http://69.64.79.247/index.php?option=com_content&task=view&id=2232&Itemid=57]
UNEP-IETC, 1998, Sourcebook of Alternative Technologies for Freshwater Augmentation in Small Island Developing States, IETC Technical Publication Series Issue 8, International Environmental Technology Centre, United Nations Environment Programme and Water Branch, United Nations Environment Programme
UNESCO, 1991. Hydrology and water resources of small islands, a practical guide. Studies and reports on hydrology No 49. prepared by A. Falkland (ed.) and E. Custodio with contributions from A. Diaz Arenas and L. Simler and case studies submitted by others. Paris, France, 435pp.
WHO Technical Note no. 9, draft revised 7.1.05, Minimum Water Quantities Needed for Domestic Use in Emergencies.
WHO/SOPAC, 2008 Sanitation, Hygiene and Drinking-water in Pacific Island Countries: Converting Commitment to Action
Approppedia: Desalination Plants, http://www.appropedia.org/Desalination_plants_%28original%29
Desalination: A National Perspective, Committee on Advancing Desalination Technology, National Research Council, http://www.nap.edu/catalog/12184.html
Magesh, R. OTEC Technology- A World of Clean Energy and Water Proceedings of the World Congress on Engineering 2010 Vol II WCE 2010, June 30 - July 2, 2010, London, U.K. Ghermandi and Messalem; Solar-driven desalination with reverse osmosis: the state of the art. Ben-Gurion University of the Negev, Zuckerberg Institute for Water Research, Desalination & Water Treatment
46
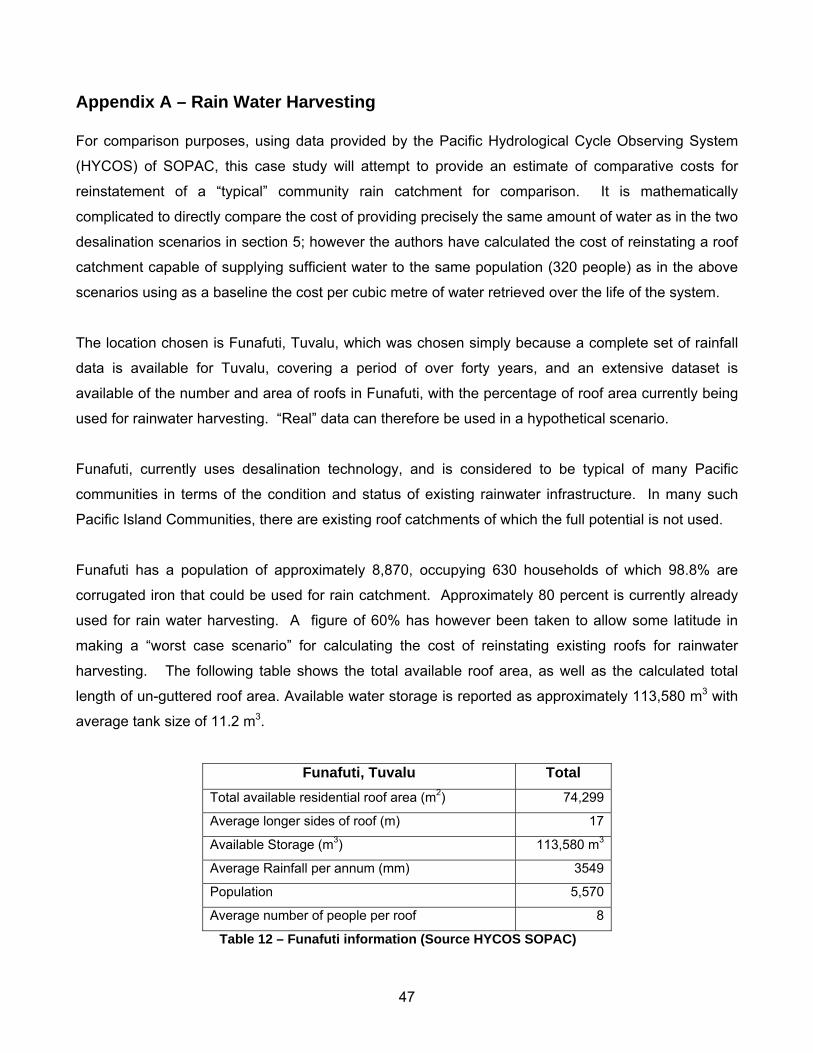
Appendix A – Rain Water Harvesting For comparison purposes, using data provided by the Pacific Hydrological Cycle Observing System
(HYCOS) of SOPAC, this case study will attempt to provide an estimate of comparative costs for
reinstatement of a “typical” community rain catchment for comparison. It is mathematically
complicated to directly compare the cost of providing precisely the same amount of water as in the two
desalination scenarios in section 5; however the authors have calculated the cost of reinstating a roof
catchment capable of supplying sufficient water to the same population (320 people) as in the above
scenarios using as a baseline the cost per cubic metre of water retrieved over the life of the system.
The location chosen is Funafuti, Tuvalu, which was chosen simply because a complete set of rainfall
data is available for Tuvalu, covering a period of over forty years, and an extensive dataset is
available of the number and area of roofs in Funafuti, with the percentage of roof area currently being
used for rainwater harvesting. “Real” data can therefore be used in a hypothetical scenario.
Funafuti, currently uses desalination technology, and is considered to be typical of many Pacific
communities in terms of the condition and status of existing rainwater infrastructure. In many such
Pacific Island Communities, there are existing roof catchments of which the full potential is not used.
Funafuti has a population of approximately 8,870, occupying 630 households of which 98.8% are
corrugated iron that could be used for rain catchment. Approximately 80 percent is currently already
used for rain water harvesting. A figure of 60% has however been taken to allow some latitude in
making a “worst case scenario” for calculating the cost of reinstating existing roofs for rainwater
harvesting. The following table shows the total available roof area, as well as the calculated total
length of un-guttered roof area. Available water storage is reported as approximately 113,580 m3 with
average tank size of 11.2 m3.
Funafuti, Tuvalu Total Total available residential roof area (m2) 74,299
Average longer sides of roof (m) 17
Available Storage (m3) 113,580 m3
Average Rainfall per annum (mm) 3549
Population 5,570
Average number of people per roof 8
Table 12 – Funafuti information (Source HYCOS SOPAC)
47
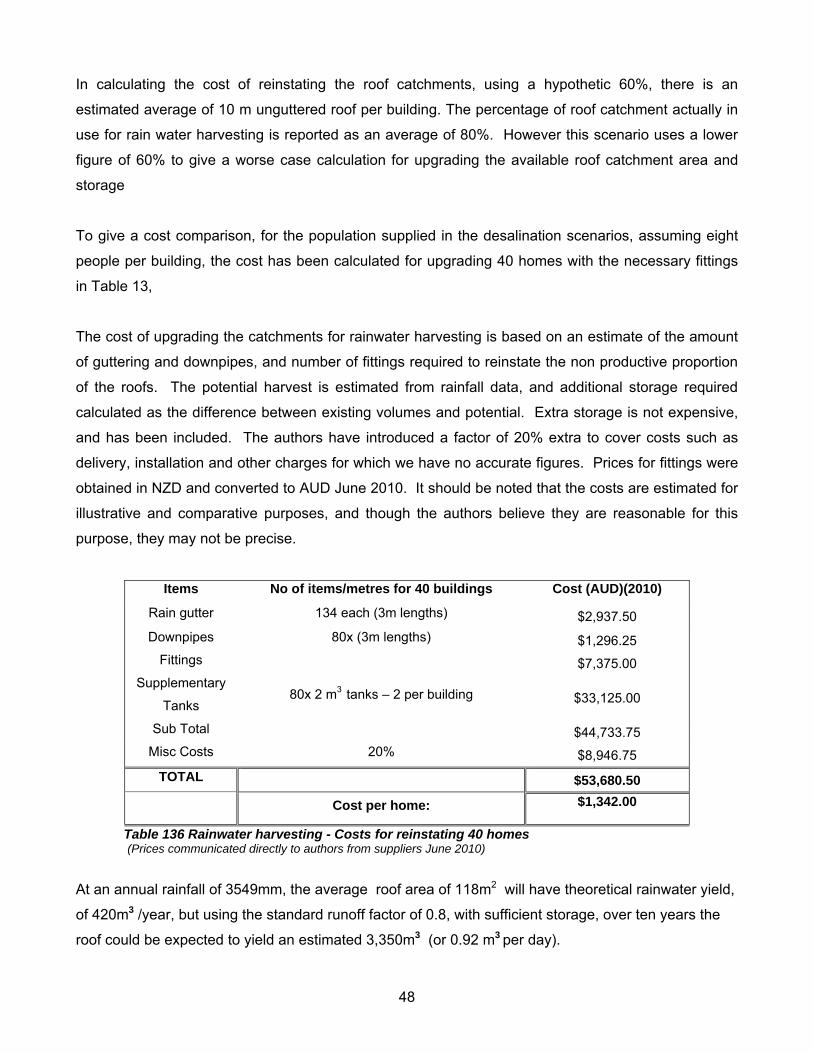
In calculating the cost of reinstating the roof catchments, using a hypothetic 60%, there is an
estimated average of 10 m unguttered roof per building. The percentage of roof catchment actually in
use for rain water harvesting is reported as an average of 80%. However this scenario uses a lower
figure of 60% to give a worse case calculation for upgrading the available roof catchment area and
storage
To give a cost comparison, for the population supplied in the desalination scenarios, assuming eight
people per building, the cost has been calculated for upgrading 40 homes with the necessary fittings
in Table 13,
The cost of upgrading the catchments for rainwater harvesting is based on an estimate of the amount
of guttering and downpipes, and number of fittings required to reinstate the non productive proportion
of the roofs. The potential harvest is estimated from rainfall data, and additional storage required
calculated as the difference between existing volumes and potential. Extra storage is not expensive,
and has been included. The authors have introduced a factor of 20% extra to cover costs such as
delivery, installation and other charges for which we have no accurate figures. Prices for fittings were
obtained in NZD and converted to AUD June 2010. It should be noted that the costs are estimated for
illustrative and comparative purposes, and though the authors believe they are reasonable for this
purpose, they may not be precise.
Items No of items/metres for 40 buildings Cost (AUD)(2010)
Rain gutter 134 each (3m lengths) $2,937.50 Downpipes 80x (3m lengths) $1,296.25
Fittings $7,375.00 Supplementary
Tanks 80x 2 m3 tanks – 2 per building $33,125.00
Sub Total $44,733.75 Misc Costs 20% $8,946.75
TOTAL $53,680.50
Cost per home: $1,342.00
Table 136 Rainwater harvesting - Costs for reinstating 40 homes (Prices communicated directly to authors from suppliers June 2010)
At an annual rainfall of 3549mm, the average roof area of 118m2 will have theoretical rainwater yield,
of 420m3 /year, but using the standard runoff factor of 0.8, with sufficient storage, over ten years the
roof could be expected to yield an estimated 3,350m3 (or 0.92 m3 per day).
48
49
At an average occupation of 8 per household, this gives 0.115 m3 or 115 litres per person per day,
assuming sufficient storage. This is well in excess of the WHO (2005) minima of 20 litres for drinking
and cooking, or 50 litres for all household use per person per day. With sensible conservation and
management the rain should provide continuous sufficient water for the average household in excess
of the minimal amounts.
By making use of all buildings - domestic, government and commercial - to harvest and store water, it
is possible to achieve a reserve supply.
The cost per cubic metre over the expected life of the system (10 years with maintenance) is therefore
$13,420/3350, or approximately AU$0.40 (assuming full harvesting, and negligible maintenance
costs).
As with any technology, even simple rainwater harvesting is not without problems, such as the
unpredictable nature of rainfall. Extra storage is likely always to be a good investment.
Rainwater harvesting equipment such as tanks and gutters require maintenance, however minimal
compared with other technologies. However, in travels around the Pacific the authors have noted that
even the minimal maintenance and care necessary to maintain rain water harvesting and storage
systems is frequently neglected.
The UNEP Sourcebook of Alternate Technologies advises that ‘ensuring adequate operation and
maintenance of the rainwater systems may be a problem. Continuous and repetitive public information
campaigns and training are required.’ (UNEP-IETC, 1998).