Embed Size (px)
Citation preview

Desalination from an Integrated Water Resources Management Perspective
Frahad Yazdandoost
K.N.Toosi University of Technology
International Conference on
Desalination, Environment and Marine Outfall Systems
Sultan Qaboos University, Muscat, Sultanate of Oman
13-16 April, 2014
Global Water Challenges More than a billion people lack access to safe
water supplies
Almost three billion do not have access to adequate sanitation
Five to ten million people die each year from water-related diseases or inadequate sanitation
Twenty percent of the world's irrigated lands are salt-laden, affecting crop production
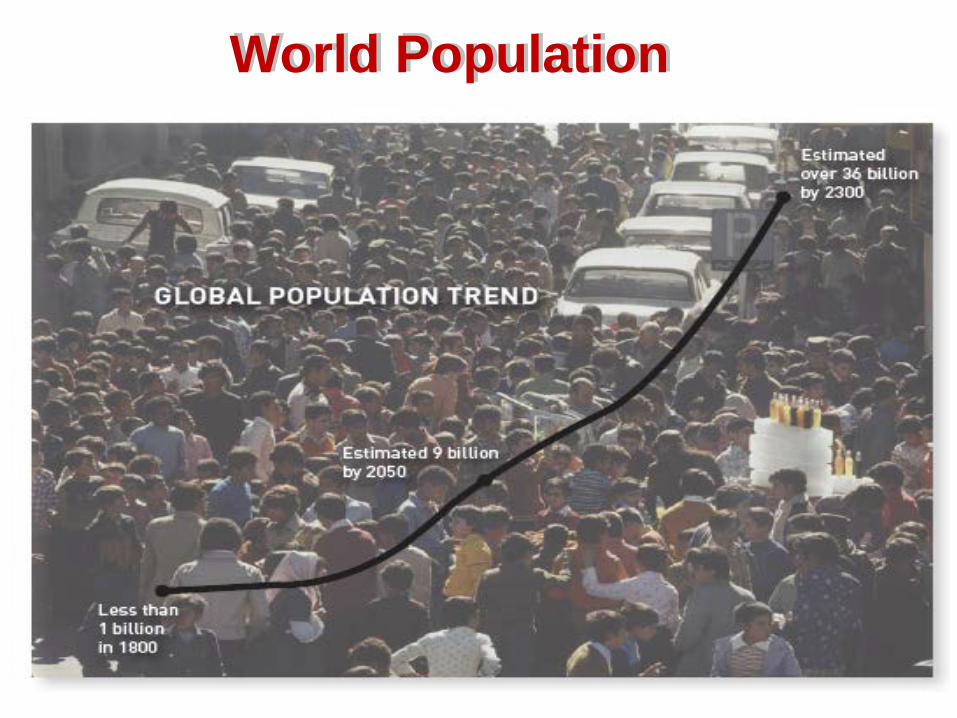
World Population

World Population

World Population Distribution

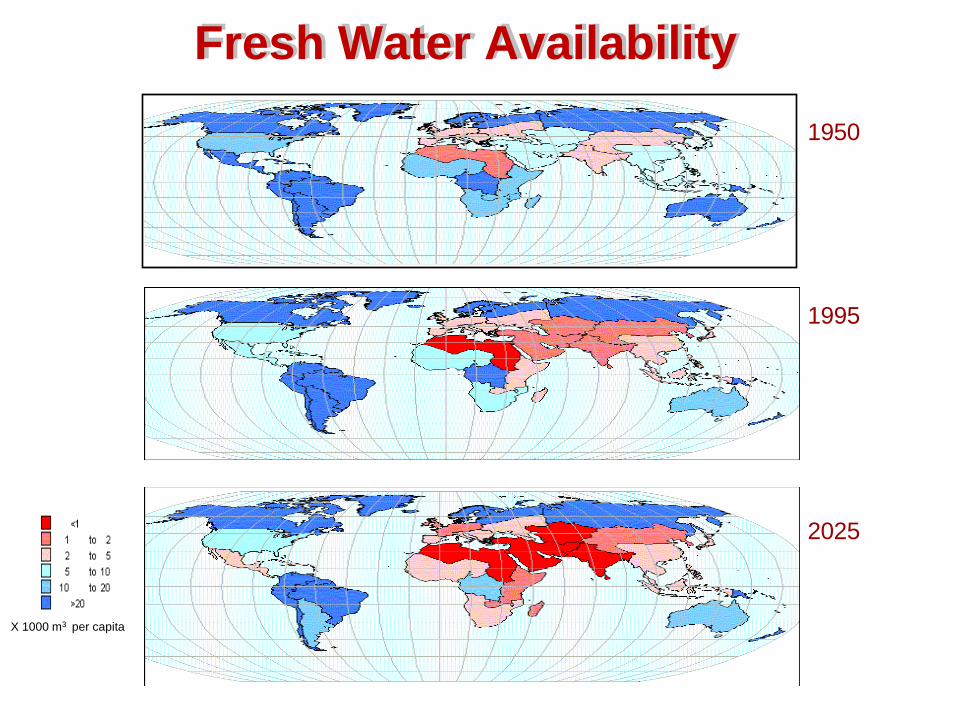
Fresh Water Availability

Global Water Consumption

Annual Available Water Resources
Source: Wangnick 2004

Water Scarcity
1950
1995
2025
Fresh Water Availability
X 1000 m3 per capita

36% 60%
26% 6%
15% 8%
11% 13%
8% 13%
5% 1%
Approximate percentage of global water supply
Approximate percentage of global population
MENA
Fresh Water Availability Global distribution
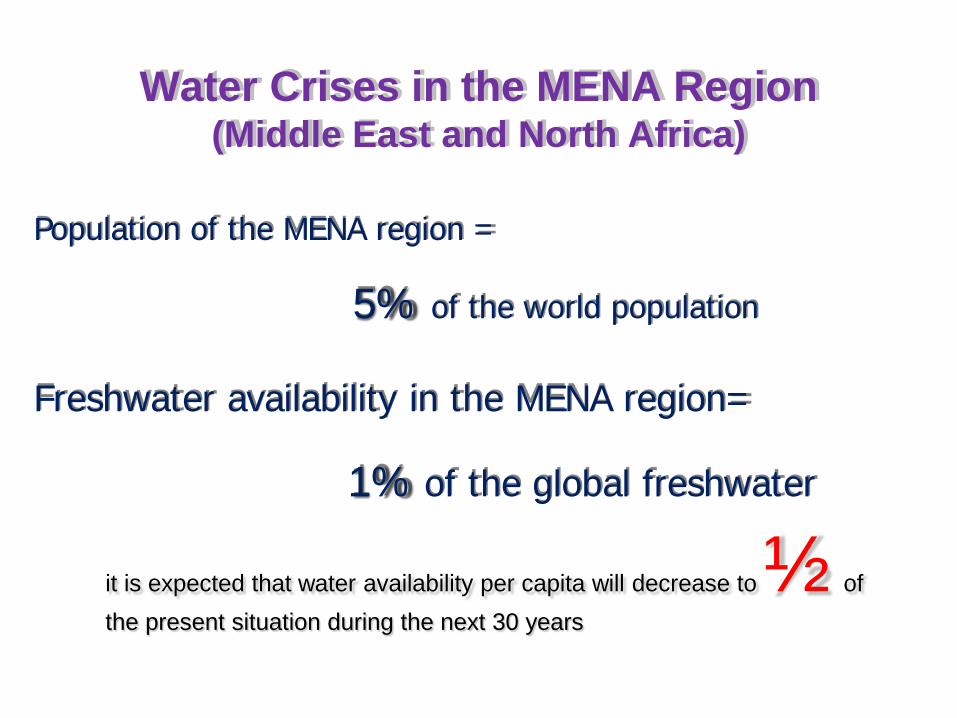
it is expected that water availability per capita will decrease to ½ of the present situation during the next 30 years
Water Crises in the MENA Region (Middle East and North Africa)
Population of the MENA region = 5% of the world population
Freshwater availability in the MENA region= 1% of the global freshwater
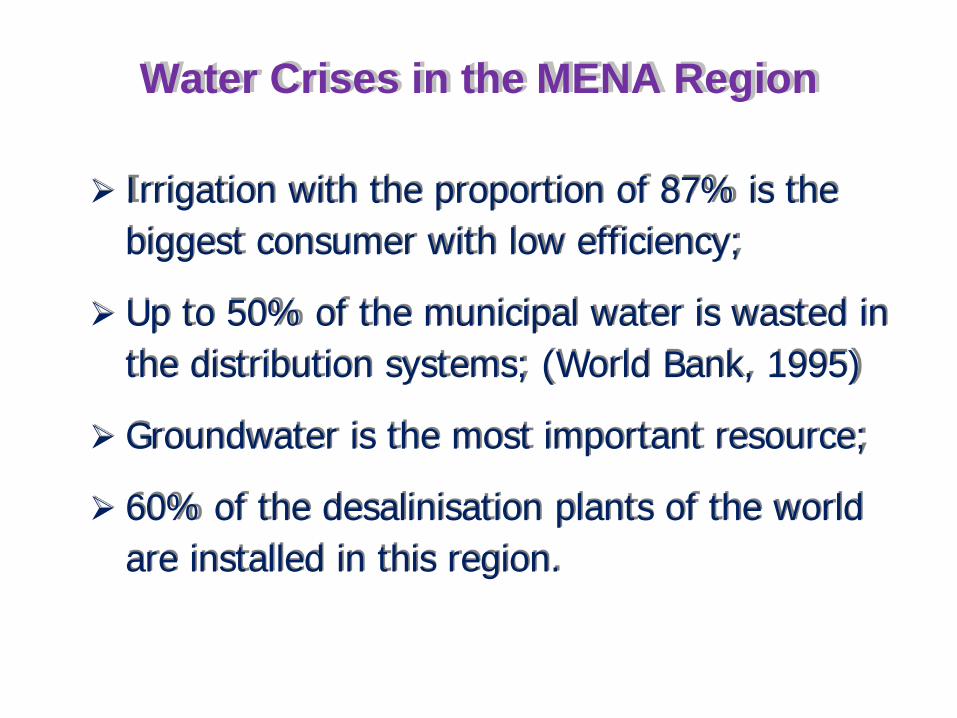
Irrigation with the proportion of 87% is the biggest consumer with low efficiency;
Up to 50% of the municipal water is wasted in the distribution systems; (World Bank, 1995)
Groundwater is the most important resource;
60% of the desalinisation plants of the world are installed in this region.
Water Crises in the MENA Region

0 10 20 30 40
Middle East & North Africa
South Asia
Western Europe
East Asia & Pacific (incl. Japan&Koreas)
Sub-Saharan Africa
Europe & Central Asia
North America
Latin America & Caribbean
Australia & New Zealand
1000 m^3 / year
MENA has the lowest per capita water resources worldwide…it’s dwindling fast!
Annual renewable water resources per capita Source: FAO AQUASTAT (2007)
a) Average annual renewable water resources for MENA (2007) was 1,200 m3/capita, compared to 7,000 m3/capita globally..
b) 14 out of the top 20 Water Scarce Countries are in MENA
c) Water scarcity will become a challenge to growth

…today’s water deficit in MENA is met by overexploitation of groundwater and—to a lesser degree—by fossil-fuelled
desalination, but this is not sustainable…

Groundwater
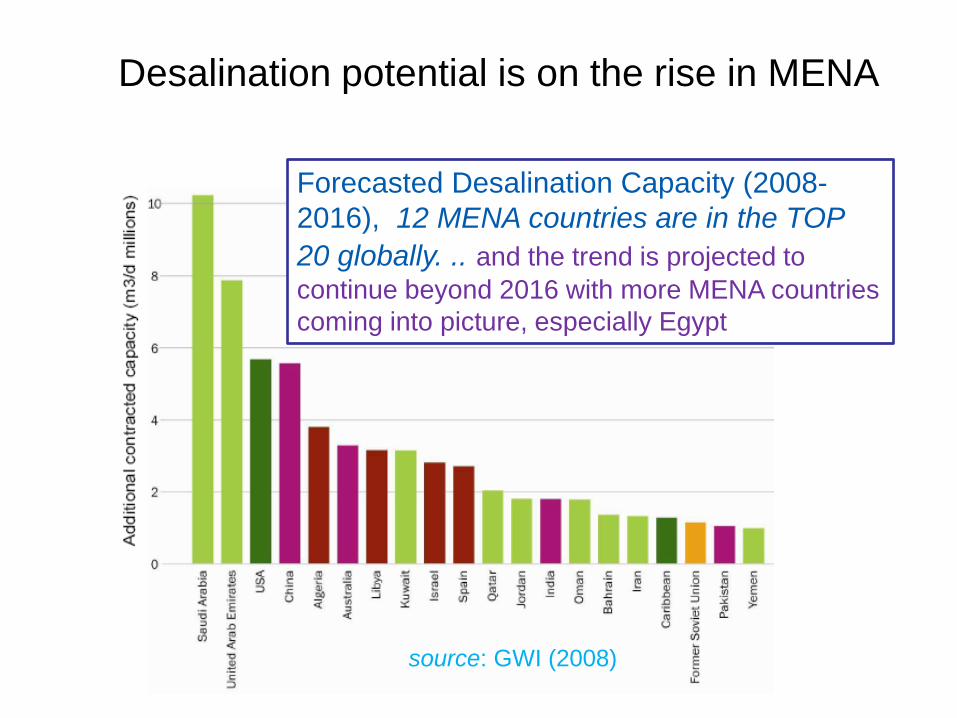
Desalination potential is on the rise in MENA
Forecasted Desalination Capacity (2008-2016), 12 MENA countries are in the TOP 20 globally. .. and the trend is projected to continue beyond 2016 with more MENA countries coming into picture, especially Egypt
source: GWI (2008)


0 20 % 40 % 60 % 80 % 100 %
Israel Tunesia Jordan
Gaza Egypt
Iran Morocco
Turkey
Bahrain Malta Oman
Saudi Arabia Cyprus Yemen Algeria
UAE Qatar
Kuwait
Percentage of M&I water supply
Source: A. Macoun
Desalinated Water as share of municipal and industrial water supply

Sea water desalination capacity in the world

Seawater desalination capacity in the Middle East
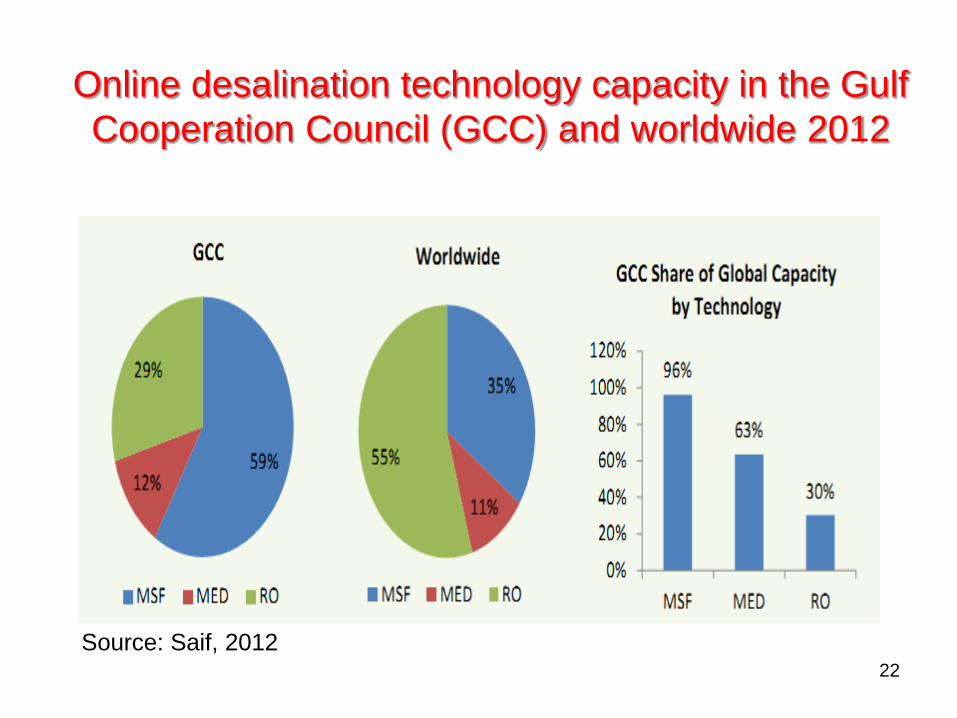
Source: Saif, 2012
Online desalination technology capacity in the Gulf Cooperation Council (GCC) and worldwide 2012
22

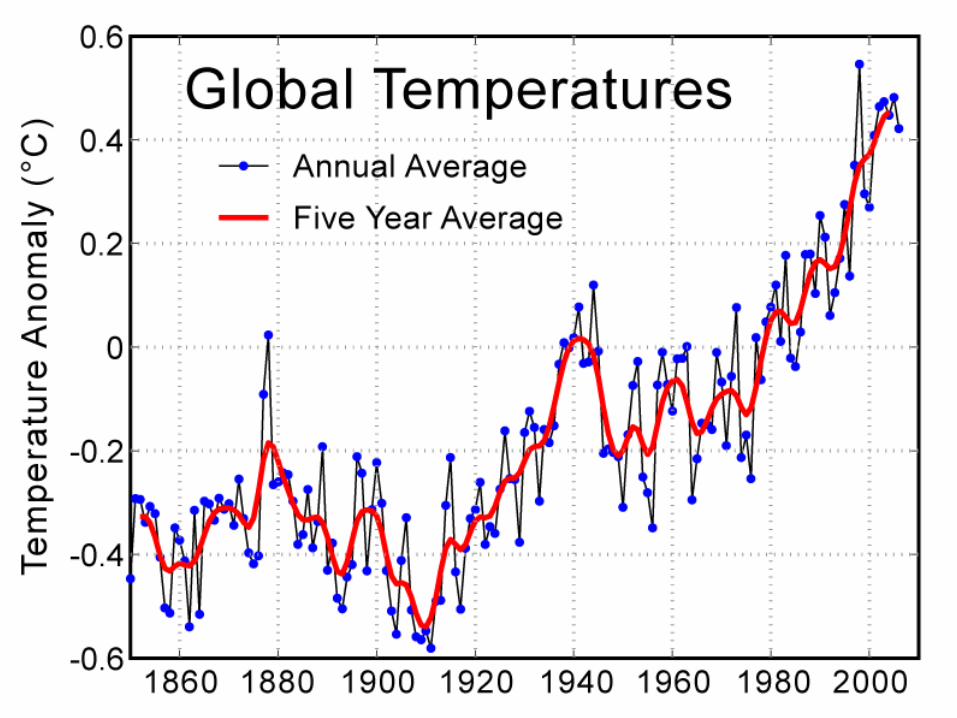
Global Warming
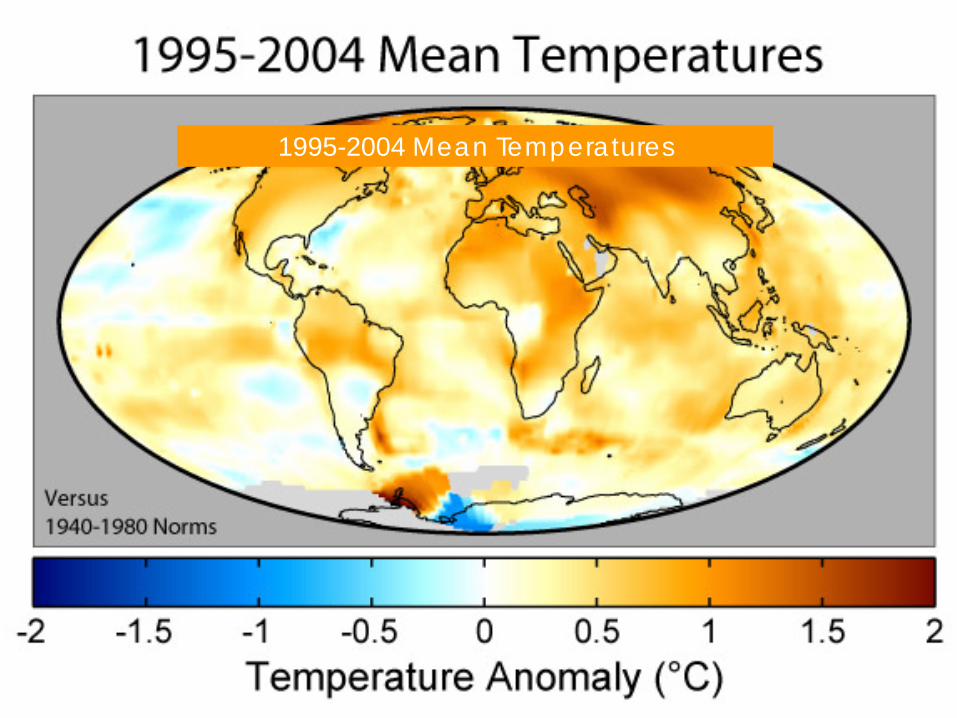
1995-2004 Mean Temperatures

Climate Change is effecting our environment, our societies and our cultures

What does the future hold…..? WATER: • Water deficit is projected to increase from 50 BCM per year today to 150- to 235
BCM per year by 2050, based on the level of water use efficiency and wastewater reuse adopted, 2/3 times the physical volume of the Nile River flow…scary!
ENERGY: • Correspondingly, about 31 billion barrels of fuel is needed to desalinate about
150 BCM of water per year by 2050 (e.g., KSA today uses > 1.5 million bbls/day for desal)…not sustainable
Environmental impacts/GHG Emissions: • Which corresponds to 9.6 GtC (gigatonnes of carbon) of CO2 emissions per
year by 2050….not sustainable (global good)
And food security…? • 60 % of food from irrigated agr. (21 Mha, consuming 251BCM+) • In some areas, fossil groundwater is being exploited for irrigation…not
sustainable…rainfed plays a good role but threatened by Climate Change.

The Nexus approach
Water has moved from a marginal input towards a central enabler of food, energy and climate security – and a vital prerequisite for growth.
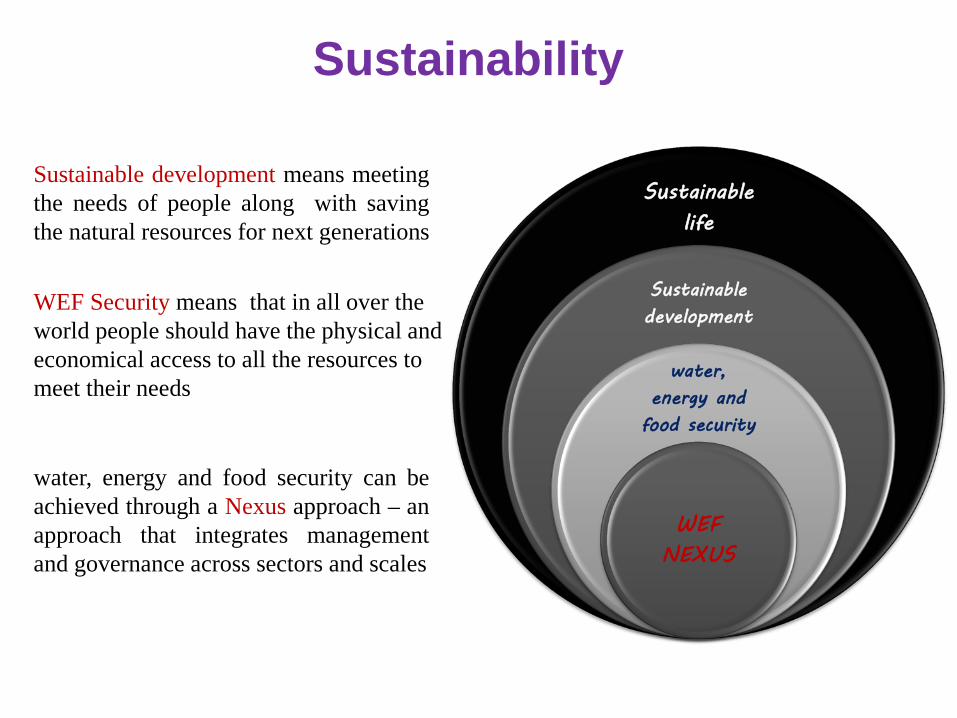
Sustainable life
Sustainable development
water, energy and
food security
WEF NEXUS
Sustainability
Sustainable development means meeting the needs of people along with saving the natural resources for next generations
WEF Security means that in all over the world people should have the physical and economical access to all the resources to meet their needs
water, energy and food security can be achieved through a Nexus approach – an approach that integrates management and governance across sectors and scales
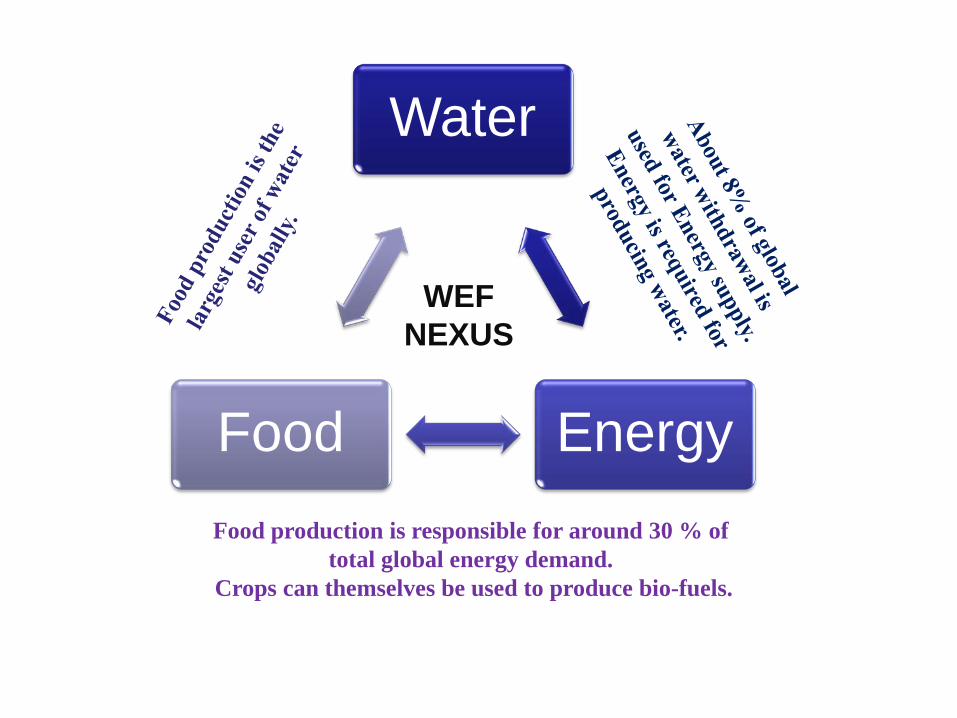
Water
Energy Food Food production is responsible for around 30 % of
total global energy demand. Crops can themselves be used to produce bio-fuels.
WEF NEXUS

WEF Nexus & Desalination • Desalination is one of the biggest energy users in the world
(about 1 ton of oil is required for every 20 tons of freshwater produced even if all the heat can be extracted from the oil)
• Over the last 50 years Fossil fuels account for the most of
energy which is being used in such process • Depletion of fossil fuels, air pollution and greenhouse gases
emission are desalination consequences
• These pollutants will make changes in ecosystems, destroy some kinds of animals or plants or change their normal existence as a part of the food chain.
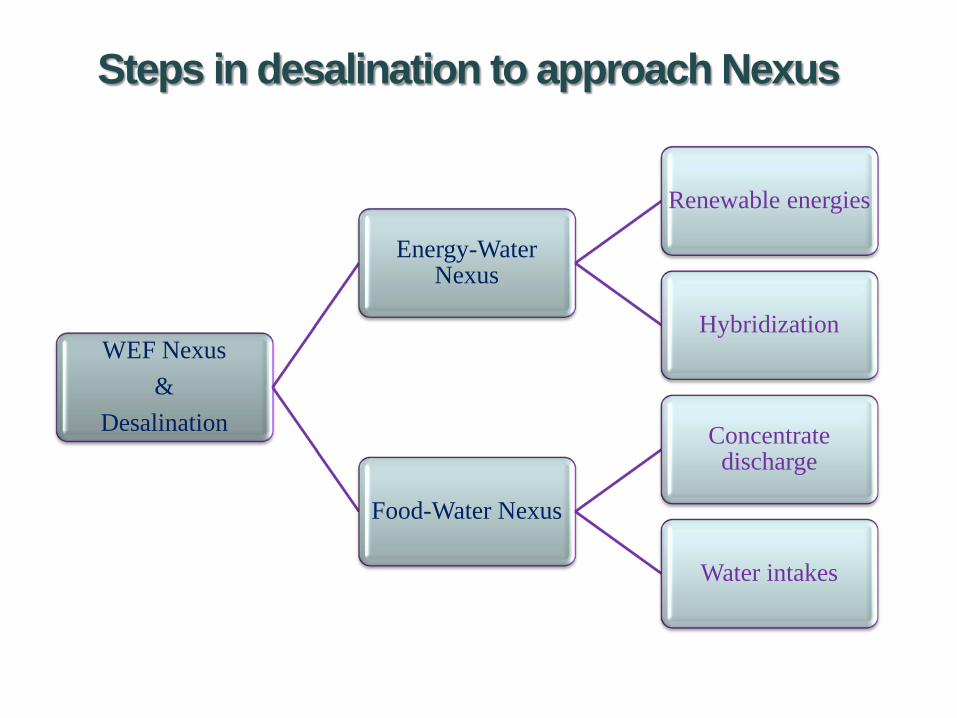
WEF Nexus &
Desalination
Energy-Water Nexus
Renewable energies
Hybridization
Food-Water Nexus
Concentrate discharge
Water intakes
Steps in desalination to approach Nexus
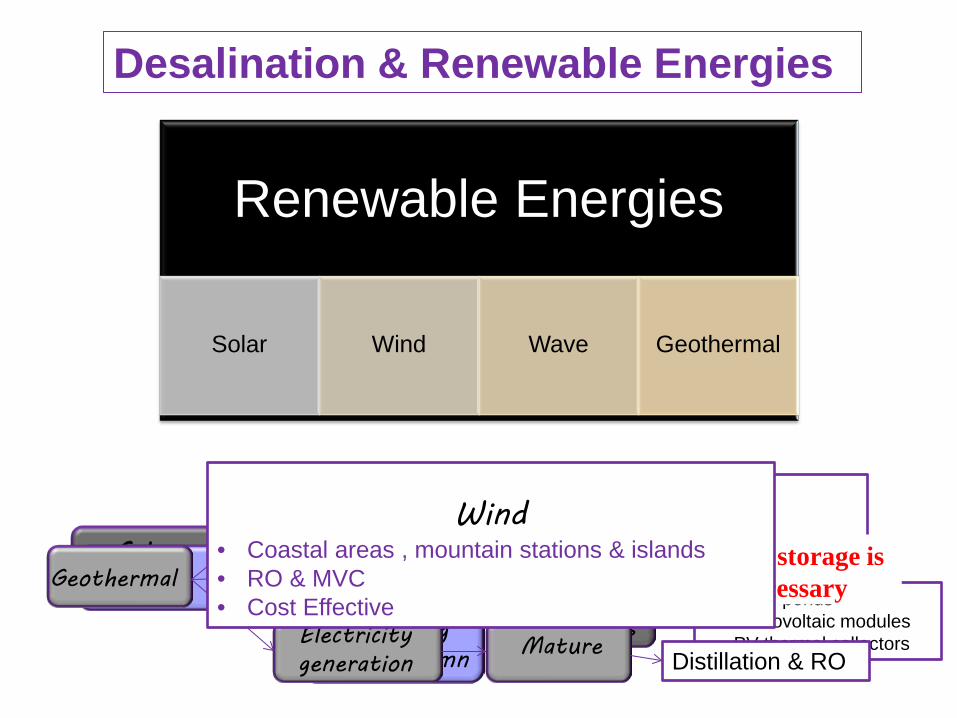
Desalination & Renewable Energies
Renewable Energies
Solar Wind Wave Geothermal
Indirect
Direct
Solar Collectors
Solar Stills
Solar
• Solar ponds • Photovoltaic modules • PV thermal collectors
• RV & VC • Coastal Areas • wind-wave hybrid system
connected to a distiller(Heath)
Oscillating water column
Buoy
Wave Geothermal
Electricity generation
Geopressurized energy
Magma Under
Research
Mature Distillation & RO
Thermal storage is unnecessary
Wind
• Coastal areas , mountain stations & islands • RO & MVC • Cost Effective

Hybridization
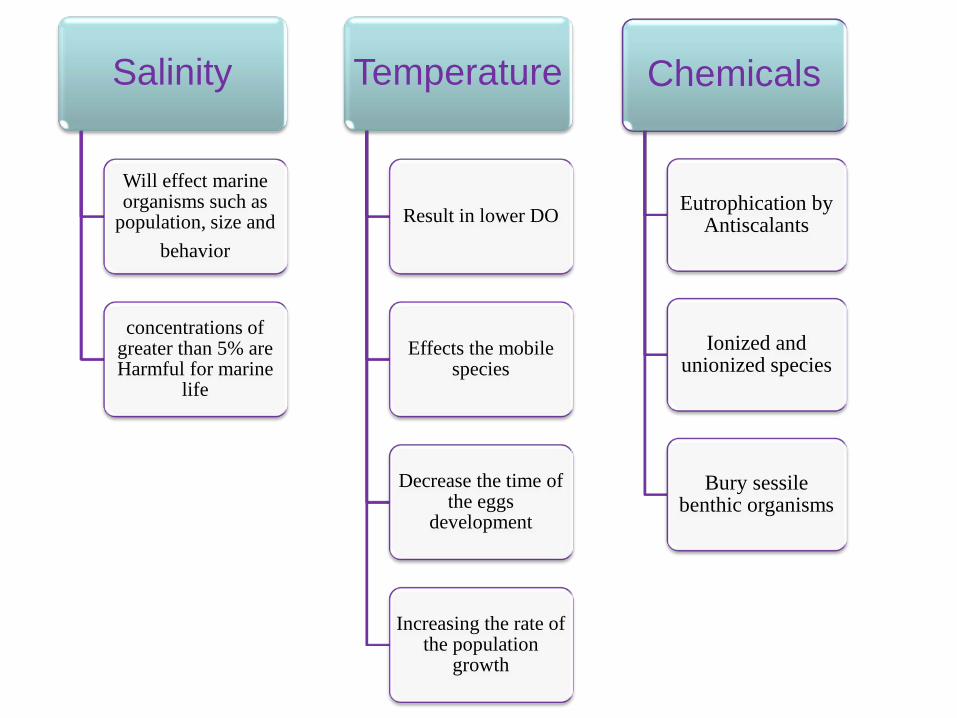
Salinity
Will effect marine organisms such as
population, size and behavior
concentrations of greater than 5% are Harmful for marine
life
Temperature
Result in lower DO
Effects the mobile species
Decrease the time of the eggs
development
Increasing the rate of the population
growth
Chemicals
Eutrophication by Antiscalants
Ionized and unionized species
Bury sessile benthic organisms
Water Intakes
• According to EPA, these intake structures kill at least 3.4 billion fish and other organisms annually. Larger organisms are trapped against the intake screens, and smaller ones, such as fish eggs and larvae, are drawn through the intake screens and destroyed in the cooling system.
• Re-suspension of sediments, Pollutants, Nutrients
during construction will change the marine life.
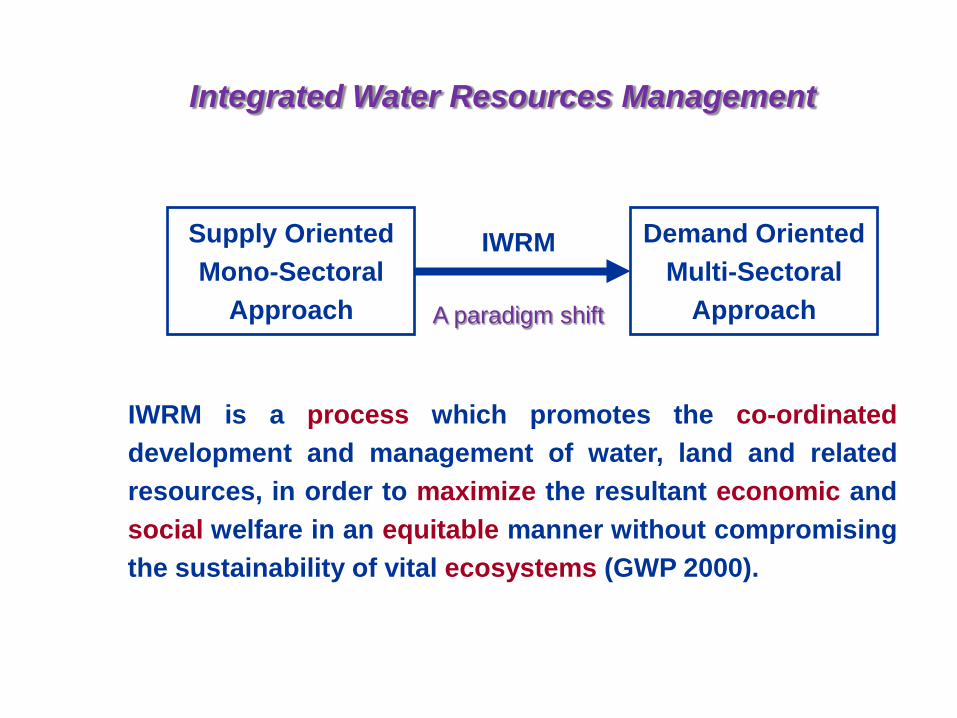
Integrated Water Resources Management
Supply Oriented Mono-Sectoral
Approach
Demand Oriented Multi-Sectoral
Approach
IWRM
IWRM is a process which promotes the co-ordinated development and management of water, land and related resources, in order to maximize the resultant economic and social welfare in an equitable manner without compromising the sustainability of vital ecosystems (GWP 2000).
A paradigm shift

CHANGE AREAS
Environmental Sustainability
Economic Efficiency Social Equity
CHANGES ARE MADE TO SEEK
TO REACH SUSTAINABILITY

Natural Resources System
Socio-Economic System
Demands
Impacts
Institutional System
IWRM Laws,
Regulations, Management Infrastructure
IWRM Concepts:
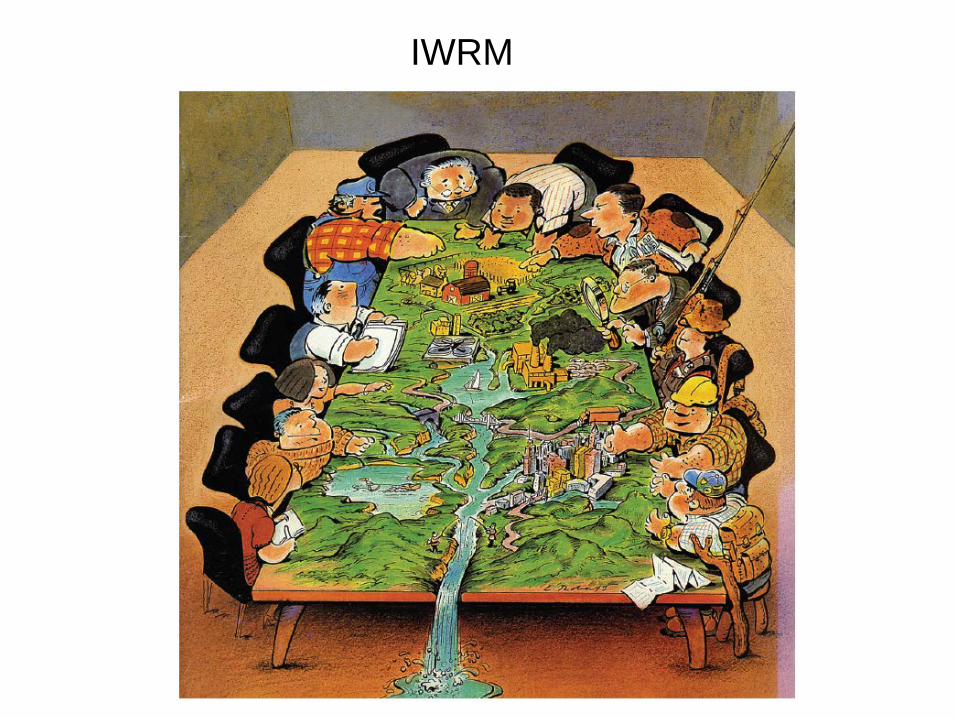
IWRM


0
500
1000
1500
2000
2500
3000
Chi
na
Indi
a
Japa
n
Pak
ista
n
Indo
nesi
a
Bra
zil
Mex
ico
Rus
sia
Nig
eria
Thai
land
Italy
US
A
Wat
er fo
otpr
int (
m3 /c
ap/y
r)
Domestic water consumption Industrial goods Agricultural goods
Water footprint per capita
Global average water footprint
[Hoekstra & Chapagain, 2008]

Net virtual water import (Gm3/yr)-100 - -50-50 - -25-25 - -10-10 - -5-5 - 00 - 55 - 2525 - 5050 - 100No Data
National virtual water balances
[Hoekstra & Chapagain, 2008]
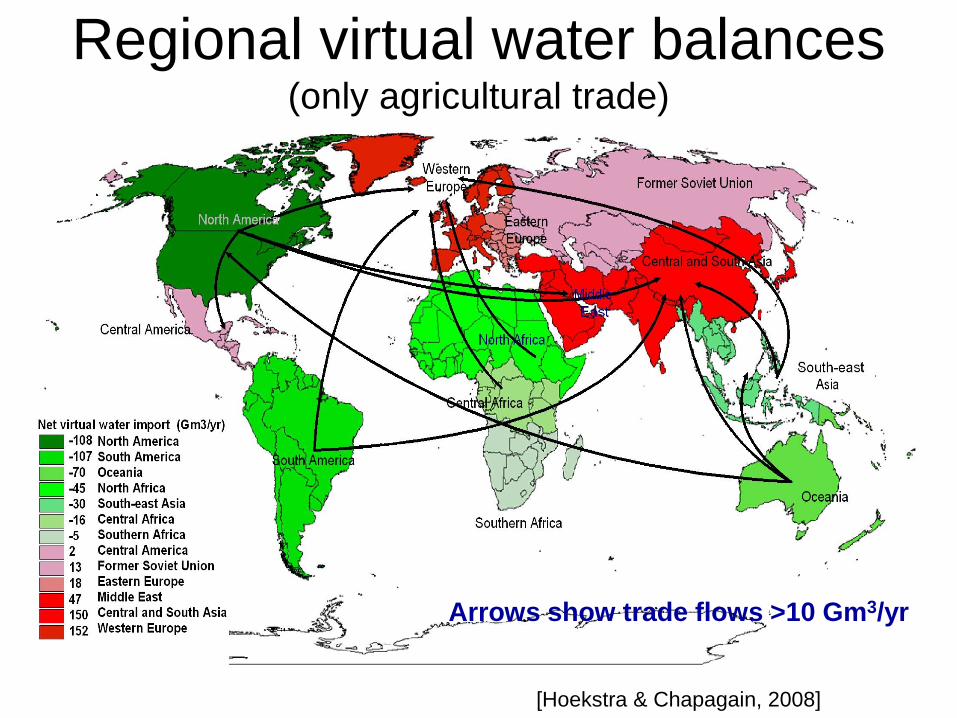
Arrows show trade flows >10 Gm3/yr
Regional virtual water balances (only agricultural trade)
[Hoekstra & Chapagain, 2008]

Virtual Water
1 bath 26 baths 73 baths


1260 litres

22,000 litres/m2

7,500 litres/kg

560 litres/g
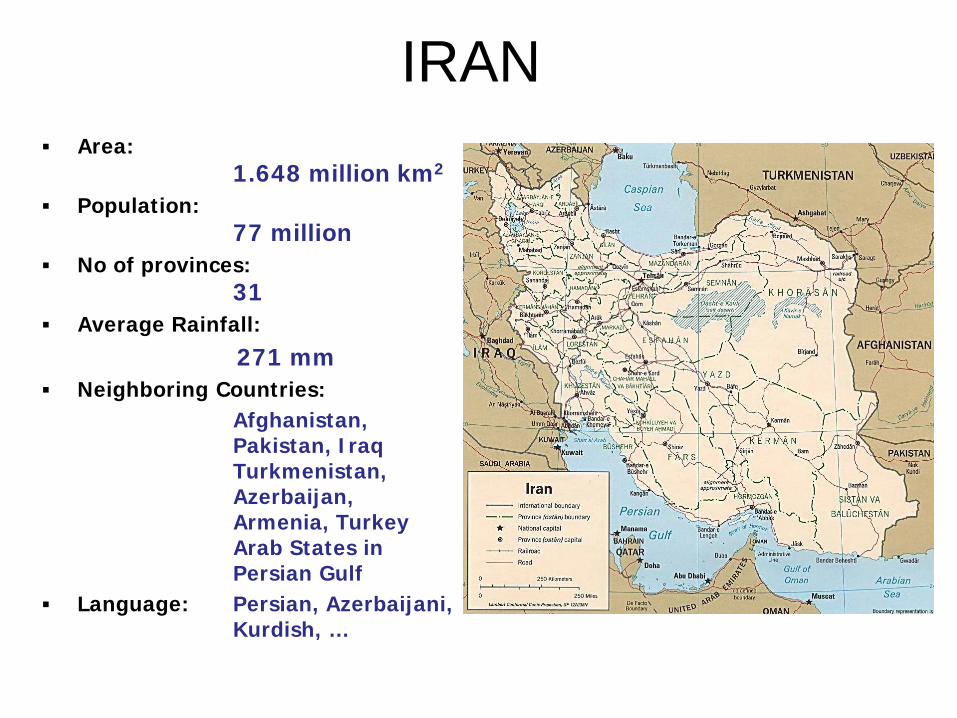
Area: 1.648 million km2
Population: 77 million
No of provinces: 31
Average Rainfall: 271 mm Neighboring Countries: Afghanistan,
Pakistan, Iraq Turkmenistan, Azerbaijan, Armenia, Turkey Arab States in Persian Gulf
Language: Persian, Azerbaijani, Kurdish, …
IRAN
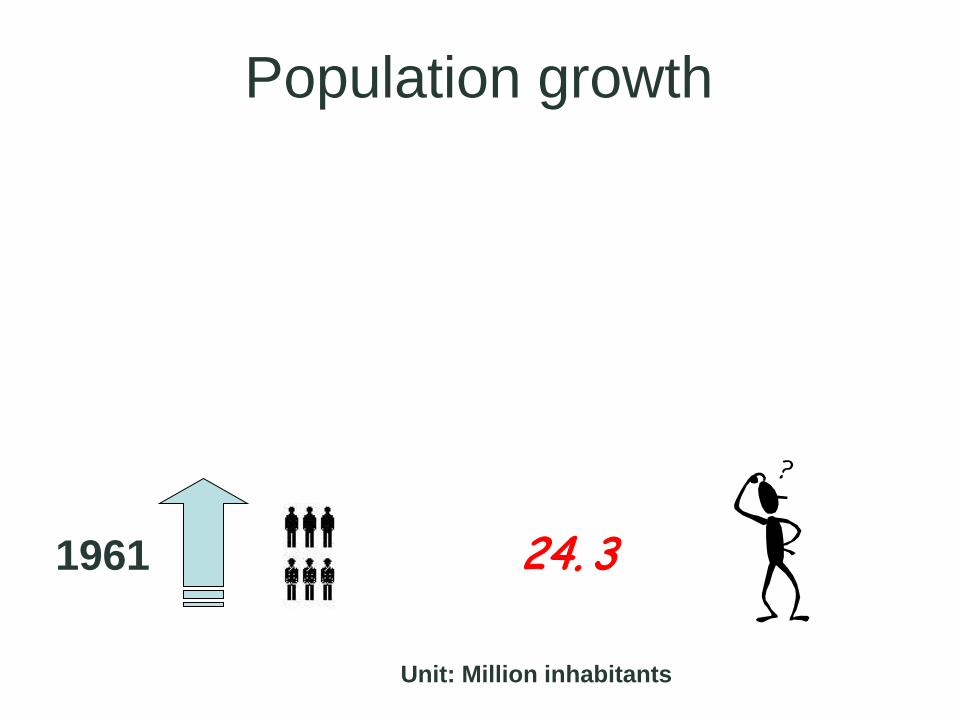
Population growth
1961 24. 3
Unit: Million inhabitants

Population growth
1961
2001 66. 0
24. 3
Unit: Million inhabitants

Population growth
1961
2021
2001
1 00
66. 0
24. 3
Unit: Million inhabitants
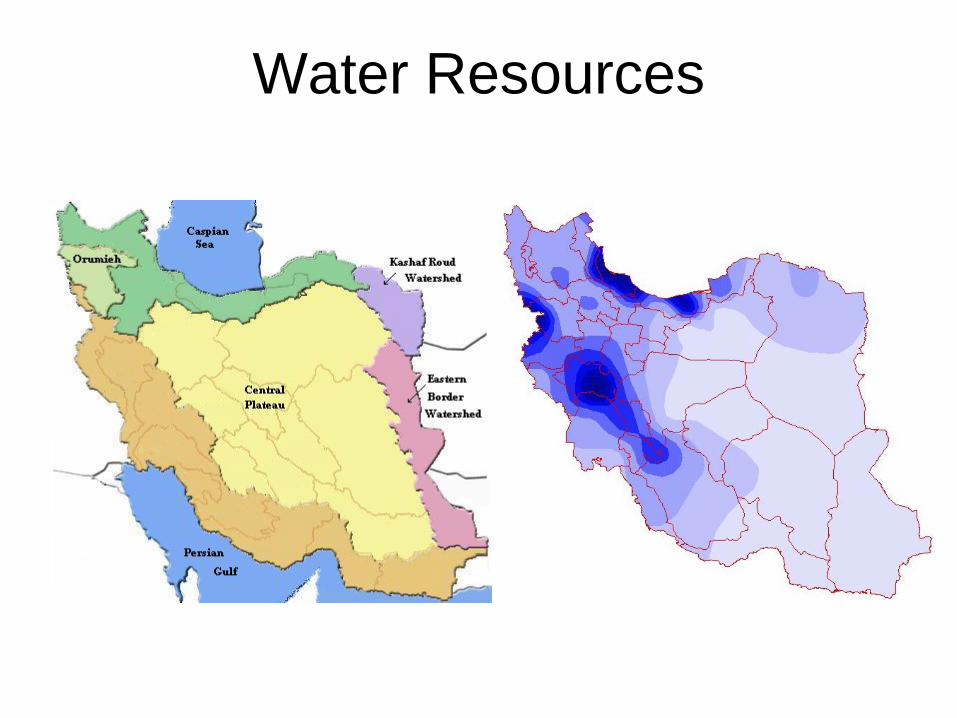
Water Resources

Volume (BCM) Source of Water
412 precipitation
282 evapotranspiration
130 renewable water resources
38
recharge of groundwater resources by
precipitation and surface flows
92 available surface flows
Year
Annual Renewable
Water availability
(cubic meters/capita)
1956 7000
2001 2000
2021 1300
Water Resources

Lake Urmia
The Hamoun

KASHAN
Case of Kashan
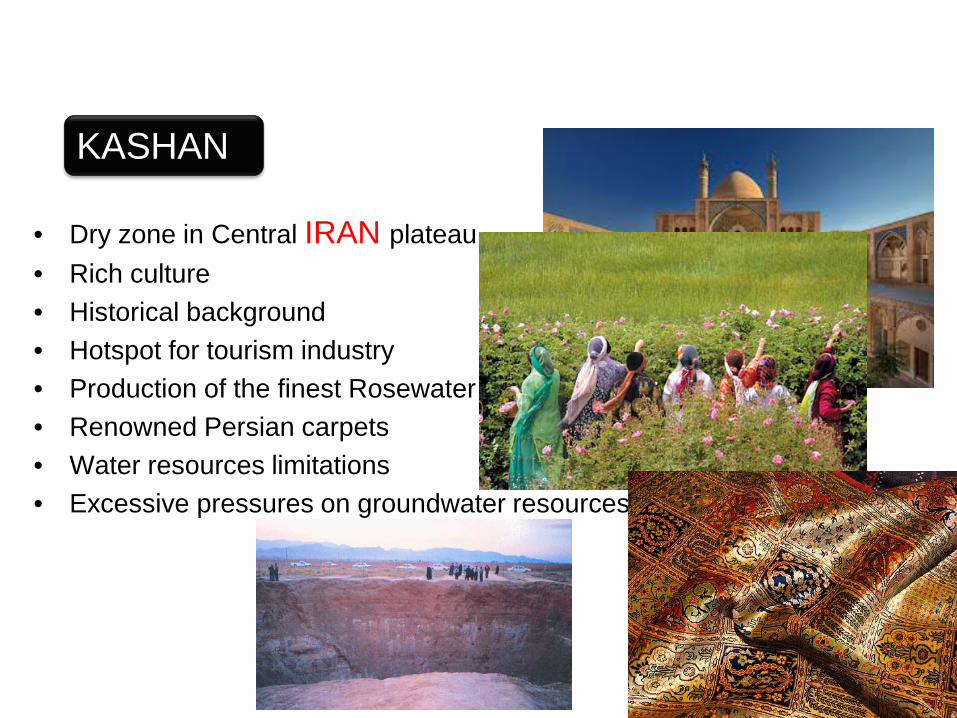
• Dry zone in Central IRAN plateau • Rich culture • Historical background • Hotspot for tourism industry • Production of the finest Rosewater • Renowned Persian carpets • Water resources limitations • Excessive pressures on groundwater resources
KASHAN

Application of the Toolbox

Sources and Demands
Main Demands,2006(MCM) Drinking
water Industry Agriculture
33.98 5.89 387.29
Water supply volumes in 2006(MCM/Year)
Ground water
Surface water
Golab tunnel
314.13 29.55 6
• No noticeable permanent rivers • Extreme pressure on groundwater • An average loss of approximately 0.5
meter in Kashan aquifer annually • Inter basin water transfer
• 90 % of water demand in agriculture • 8% for drinking and 2 % for industry • compared to the total supply available
there is no balance between supply and demand in the region.
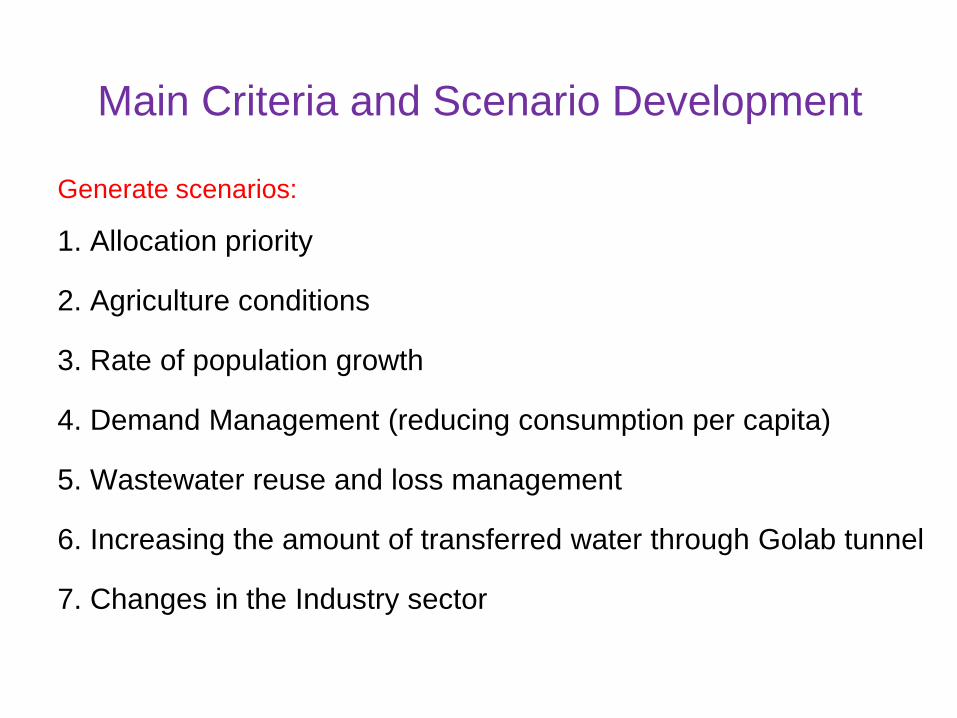
Main Criteria and Scenario Development
Generate scenarios:
1. Allocation priority
2. Agriculture conditions
3. Rate of population growth
4. Demand Management (reducing consumption per capita)
5. Wastewater reuse and loss management
6. Increasing the amount of transferred water through Golab tunnel
7. Changes in the Industry sector

Multi-Criteria Decision-Making
Resulting scenarios were considered individually as well as
in overlapping formats to evaluate their rankings using
MCDM approach based on both quantitative and non-
quantitative criteria upon which implementation measures
may be deducted and adopted.
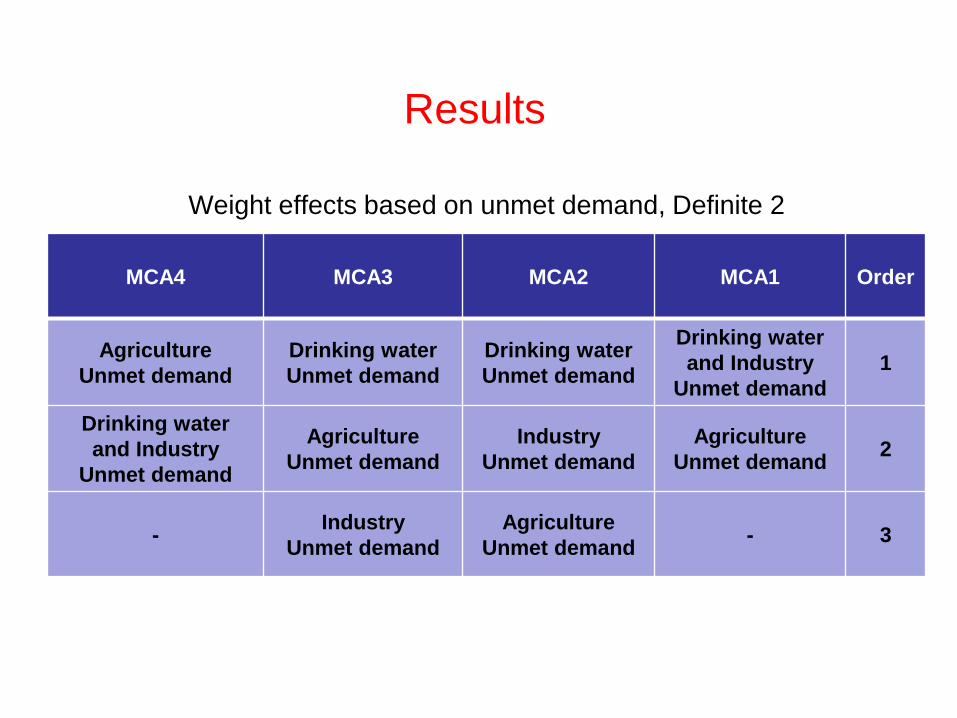
Results
Weight effects based on unmet demand, Definite 2
MCA4 MCA3 MCA2 MCA1 Order
Agriculture Unmet demand
Drinking water Unmet demand
Drinking water Unmet demand
Drinking water and Industry
Unmet demand 1
Drinking water and Industry
Unmet demand
Agriculture Unmet demand
Industry Unmet demand
Agriculture Unmet demand 2
- Industry Unmet demand
Agriculture Unmet demand - 3

Results
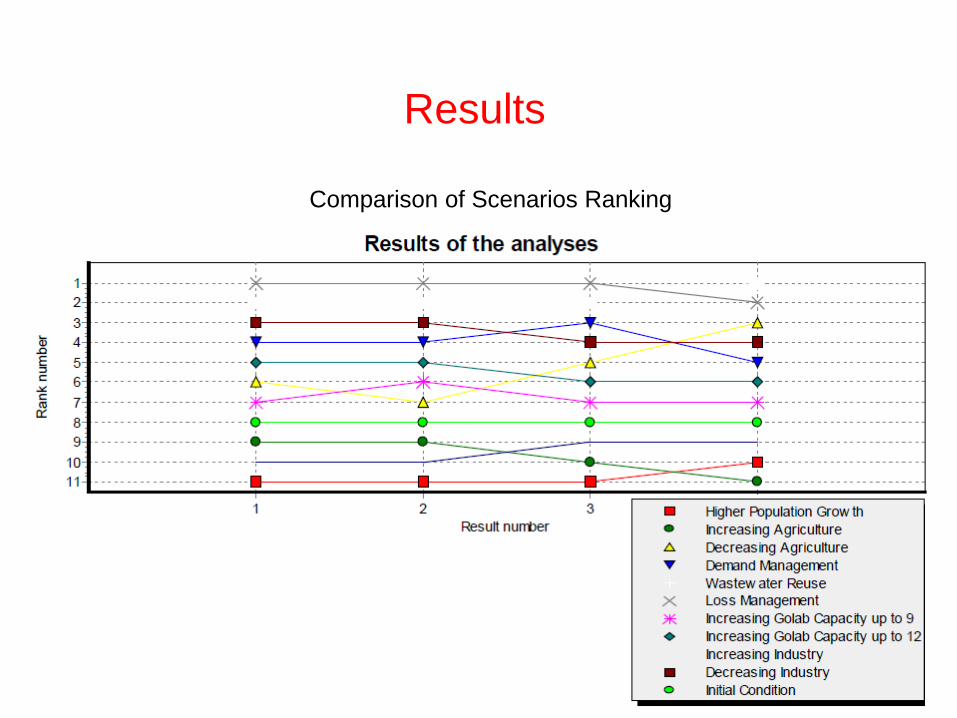
Comparison of Scenarios Ranking
Results
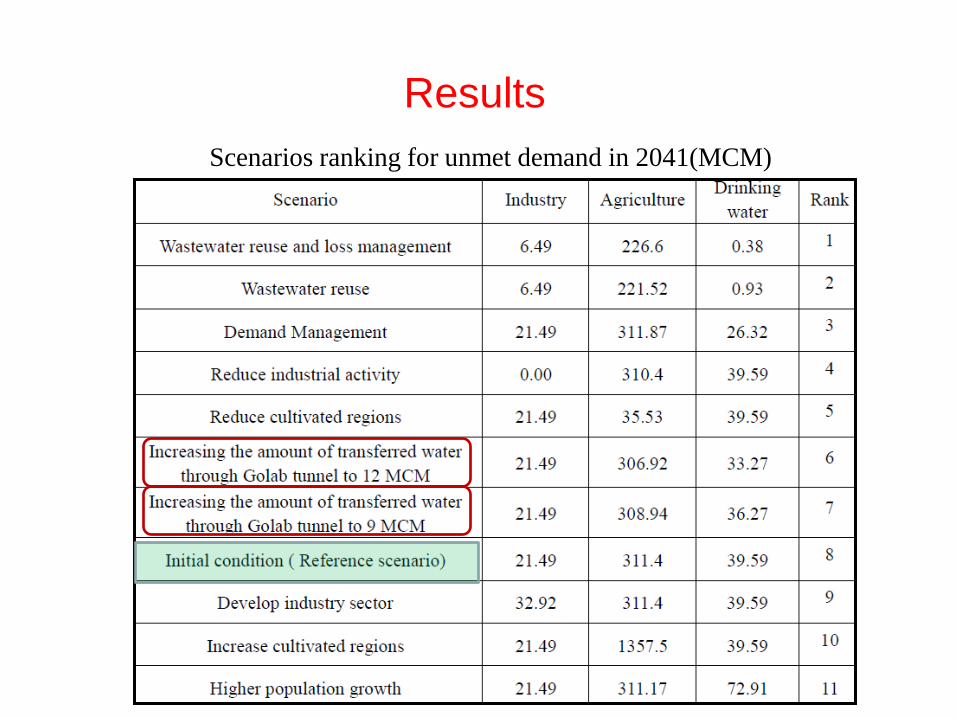
Scenarios ranking for unmet demand in 2041(MCM)
Results

Scenarios combinations ranking in 2041(MCM) Results
Conclusions Integrated water resources management approach is
needed to ascertain sustainability
Development of an IWRM toolbox facilitates appropriate decision making
Individual approaches such as demand management, wastewater reuse, loss management, industrial water demand management and inter-basin water transfer through desalination should be investigated in integration to generate a multi scenarios situation based on varying priorities of water use


Lake Urmia
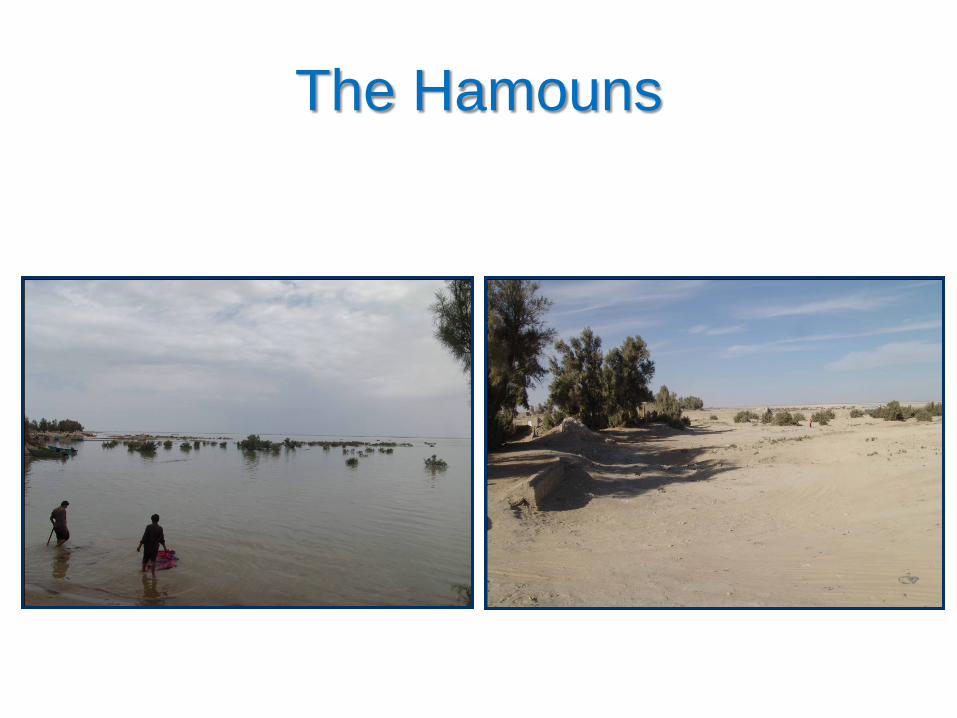
The Hamouns