Embed Size (px)
Citation preview

March 2014
Growth Through Risk Management
Deriving the Economic Impact of Derivatives

March 2014
Growth Through Risk Management
Apanard (Penny) Prabha, Keith Savard, and Heather Wickramarachi
Research SupportStephen Lin, Donald Markwardt, and Nan Zhang
Project DirectorsRoss DeVol and Perry Wong
Deriving the Economic Impact of Derivatives

Lorem ipsum dolor sit amet, consectetur adipiscing elit. Praesent pharetra vestibulum lacus eget consequat. In vel varius metus. Curabitur ut fringilla est. Sed hendrerit mollis facilisis.
—Lorem Ipsum
ACKNOWLEDGMENTS
This project evolved from discussions with various stakeholders of the Milken Institute who encouraged us to examine derivatives markets in the aftermath of the financial crisis and Great Recession. It was made possible through the support of the CME Group. The views expressed in the report, however, are solely those of the Milken Institute.
The Milken Institute would like to give special thanks to the research department of the CME Group for their valuable suggestions, feedback, and overall leadership throughout the research process. The authors appreciate the indispensable efforts of Milken Institute Managing Director Mindy Silverstein in securing the resources required to convert a methodological outline into a final product. Additionally, we appreciate the encouragement provided by Milken Institute CEO Michael Klowden in this undertaking.
The Milken Institute Research team is grateful for the advice, counsel, and expertise provided by reviewers Richard Sandor, chairman and CEO of Environmental Financial Products LLC; Ross Levine, Willis H. Booth Chair in Banking and Finance at the Haas School of Business, University of California at Berkeley; and James Barth, the Lowder Eminent Scholar in Finance at Auburn University. All are Senior Fellows of the Milken Institute. Richard Sandor is a true financial innovator known as the “father of financial futures.” Ross Levine is among the most highly regarded researchers in the operations of financial systems and functioning of the economy. Jim Barth is an expert in financial institutions and capital markets, both domestic and global, with special emphasis on regulatory issues. Our colleagues’ insights significantly improved the quality and clarity of this report.
ABOUT THE MILKEN INSTITUTE
A nonprofit, nonpartisan economic think tank, the Milken Institute works to improve lives around the world by advancing innovative economic and policy solutions that create jobs, widen access to capital, and enhance health. We produce rigorous, independent economic research—and maximize its impact by convening global leaders from the worlds of business, finance, government, and philanthropy. By fostering collaboration between the public and private sectors, we transform great ideas into action.
©2013 Milken Institute This work is made available under the terms of the Creative Commons Attribution-NonCommercial-NoDerivs 3.0 Unported License, available at creativecommons.org/licenses/by-nc-nd/3.0/

Executive Summary ...................................................................................... 1
Key Findings ...................................................................................................................... 1
An Empirical Foundation .................................................................................................. 2
Derivatives: A Market Mainstay Amid Globalization ....................................................... 4
Why Use Derivatives? ....................................................................................................... 5
Regulatory Reform and the Future .................................................................................. 6
Introduction ................................................................................................... 9
1. History ...................................................................................................... 13
1.1 Integration and Oversight in the Modern Era ........................................................... 14
2. Global Growth and Recent Trends ....................................................... 19
2.1 Volatility and Technology .......................................................................................... 22
2.2 The Exchange-Traded Market .................................................................................. 25
2.3 The OTC Market ......................................................................................................... 27
2.4 Different Environments, Different Strengths .......................................................... 30
3. Risk, Price, and Cost ............................................................................... 33
3.1 Managing Risk ...........................................................................................................33
3.2 Price Discovery .........................................................................................................40
3.3 Liquidity and Lower Costs ........................................................................................ 42
4. Measuring Derivatives’ Impact Empirically ....................................... 45
4.1 Bolstering Bank Lending .........................................................................................48
4.2 Augmenting the Value of Non-Financial Firms ....................................................... 55
4.3 Overall Impact on the U.S. Economy ........................................................................ 59
4.4 What Futures Do for the Economy ...........................................................................63
5. A New Framework .................................................................................. 69
5.1 Clearing and Capital .................................................................................................. 69
5.2 Costs Will Influence Use ........................................................................................... 71
5.3 Extraterritoriality and Regulatory Arbitrage .......................................................... 71
References and Appendixes ....................................................................... 73
About the Authors ..................................................................................... 104
Contents


1
Executive SummaryThis study is being released at a time when the global economy is still struggling to heal itself, with the help of central banks, from a crisis that ravaged the financial system. Prior to the calamity that began six years ago, derivatives use grew at an astounding rate as a broad array of businesses and investors sought to reap their benefits. During the period of the crisis and its aftermath, over-the-counter (OTC) derivatives—credit derivatives in particular—were severely criticized as a factor in raising counterparty risk and contributing to a near-shutdown of the financial system. Consequently, significant regulatory change has been instituted with the aim of increasing transparency and reducing systemic risk.
It is time for a fact-based assessment of the role derivative products play in commerce. If these financial instruments are so harmful, as some parties believe, why do so many banks and non-financial firms use them in the course of everyday business? What has been lost in the drama surrounding derivatives is an understanding of the positive impact, primarily through risk mitigation, that most of these instruments have had on U.S. economic growth over the past decade.
KEY FINDINGS
» Banks’ use of derivatives, by permitting greater extension of credit to the private sector, increased U.S. quarterly real GDP by about $2.7 billion each quarter from Q1 2003 to Q3 2012.
» Derivatives use by non-financial firms increased U.S. quarterly real GDP by about $1 billion during the same period by improving their ability to undertake capital investments.
» Combined, derivatives expanded U.S. real GDP by about $3.7 billion each quarter. The total increase in economic activity was 1.1 percent ($149.5 billion) between 2003 and 2012.
» By the end of 2012, employment had been boosted by 530,400 (0.6 percent) and industrial production 2.1 percent.
Derivatives’ role during the financial crisis and subsequent anemic recovery is also examined. Derivatives are shown to have an even larger positive impact relative to the pre-crisis period. This is not surprising given that firms use derivatives to minimize cash-flow volatility associated with underlying risk.
This first-of-its-kind study of derivatives’ quantitative impact on economic growth is built on a solid and robust methodological foundation, an extensive literature survey, and careful attention to data gathering and empirical analysis. Several methodological challenges were overcome in attempting to discern the effects of derivatives use on overall U.S. economic performance.

2 DERIVING THE ECONOMIC IMPACT OF DERIVATIVES
Case studies of the airline, energy, and food-processing industries provide detail and context for the macroeconomic analysis. As reported in 10-K filings, many firms in these industries saved hundreds of millions of dollars in costs or enjoyed other net gains through derivatives use during the course of a fiscal year. Their choice of instrument varies from forwards to futures and options as well as swaps. Companies that use these derivatives report their impact on pricing, output, supply chains, and other factors.
Considering the scale of the derivatives market, while the notional value (the value of the contracts’ underlying assets) of OTC derivatives amounted to $633 trillion (nine times global GDP) at year-end 2012, the gross market value (fair value or amount at risk) and gross credit exposure after netting (sum of positive and negative fair values across counterparties) were orders of magnitude less. This is relevant in assessing potential systemic risk under the new regulatory requirements and in making comparisons with traditional exchange-traded derivatives, which are often mistakenly viewed as dwarfed by OTC instruments.
AN EMPIRICAL FOUNDATION
In order to fully appreciate the study’s findings, it is important to understand how they were derived. The use of derivatives by banks and non-financial firms has an indirect impact on economic growth via various channels. To encompass that overall impact, the analysis is divided into two steps.
The first is estimating the influence of bank use on lending and the effects of non-financial firm use on firm value. The second step links those results to the macroeconomy. Although derivatives influence the U.S. economy in other ways, our quantitative assessment focuses especially on credit extension and firm value. Small and medium-sized enterprises rely on bank credit to expand capacity, and the nation’s economic health depends on the health of that sector.
%€Interest RatesForeign Exchange
Lending Support
Banks use derivatives contracts to hedge risk stemming primarily from the movements of interest rates and currency values. A stronger financial position promotes a higher volume of lending, which spurs the growth of industries across the economy.

3EXECUTIVE SUMMARY
Our statistical analysis demonstrates that banks’ derivatives use allows for a larger volume of commercial and industrial loans, holding other factors constant, increasing business investment. Additionally, it confirms that investors assign higher valuations to non-financial firms using derivative products, and those valuations boost their willingness and ability to expand operations.
In estimating the broad macroeconomic effect, we used two alternate approaches. One is based on a pure measure of statistical association which uses current and past values of variables in a system to determine their relationships. A key advantage is that a limited number of variables are necessary to perform the estimation. The second approach uses a structural model of the economy. This provides a separate estimate of the resulting changes in real GDP growth and includes further detail on investment, industrial production, employment, wages and incomes, and consumption, in addition to many other variables. Nevertheless, the approaches yield consistent results, warranting a high level of confidence.
This study examines the benefits of exchange-traded derivatives. The use of futures contracts has a positive association in all statistical formulations, suggesting that they help banks and non-financial firms manage risk, enabling banks to extend more loans and firms to invest more capital. Indeed, while the estimated relationships of the futures use variable do not pass conventional tests of significance, they make futures’ economic benefits clear to users, policymakers, and other stakeholders.
A Value Play
Our research shows that companies that use derivatives tend to have an edge in firm value over those that don’t. Further, this increase in firm value has a significant positive impact on overall economic growth.

4 DERIVING THE ECONOMIC IMPACT OF DERIVATIVES
DERIVATIVES: A MARKET MAINSTAY AMID GLOBALIZATION
Derivatives are financial instruments in the form of contracts, the value of which is derived from the value of an underlying asset. The trading of derivatives is done in two types of markets: organized exchanges and over the counter. An important feature of derivatives exchanges is the interposition of a clearinghouse that serves as a counterparty to reduce the default risk of parties engaged in the contract. Derivatives traded through the OTC market are privately negotiated and customized to the specifications of the counterparties involved.
Rudimentary exchange-based derivatives trading was recorded as early as the 1500s, but only recently have we seen a rapid increase in the creation of such exchanges around the world. While the major derivatives exchanges are located in mature economies (e.g., CME Group, Deutsche Borse AG, NYSE Euronext), the development of the global marketplace indicates expanding opportunities and demand in emerging economies. Based on turnover data (gross value of new deals during a given period), about two-thirds of derivatives are traded on exchanges in advanced countries, while they are traded almost equally on OTC and exchange markets in emerging economies.
Derivatives markets are populated by four main types of contracts: forwards, futures, options, and swaps. The general concepts are similar, with their value derived from the price of an underlying asset. Differences include some of the functions and features of the contracts as well as the markets where the various types of derivatives are traded. The largest derivatives market by notional amounts is swaps and the second-largest is forwards.
In recent decades, volatility in stocks and interest rates, along with the globalization of capital markets, has spurred demand for financial instruments to unbundle risks. From that perspective, interest rate derivatives are the most widely traded among global OTC derivatives, accounting for 77 percent of notional amounts outstanding in 2012. They first became popular in the late 1970s and early 1980s, when corporations were grappling with wide fluctuations in rates. Foreign exchange derivatives are the second-largest category. Rapid globalization has added exchange rate risk to the concerns of many businesses and investors.
One newer type of derivative used in risk mitigation is the credit default swap (CDS). This is a contract that allows the buyer to hedge the credit risk of debt securities contingent upon a credit event that befalls the issuer, such as a bankruptcy or payment default. Over the past 10 years, the CDS market grew at a tremendous pace, reflecting in part strong housing sales and the expansion of mortgage-backed securities prior to 2008. Although recognized as a useful hedging tool, credit default swaps have also come under a dark cloud for their misuse.
The U.S. Financial Crisis Inquiry Commission (FCIC) identified OTC derivatives—in particular, CDSs— as one of eight major factors that contributed to the financial crisis and subsequent Great Recession. One principal factor identified by the FCIC was the leverage—use of borrowed funds for making investments—that permeated the financial system. Many mistakenly assign disruptions caused by overleverage to the “D-word,” derivatives.
The absence of regulatory oversight played a considerable role in the buildup of the one-way protection writing position that AIG established in the CDS market, which was concentrated in insuring against default of mortgage-backed securities. If a clearing regime (posting of collateral based on daily marking to market)

5EXECUTIVE SUMMARY
had been implemented, AIG’s losses would not have been permitted to accumulate, and what became a financial crisis might have been much less damaging. In short, history might have been quite different.
WHY USE DERIVATIVES?
Investors generally use derivatives for three purposes: risk management, price discovery, and reduction of transaction costs. In a traditional banking model, a maturity mismatch between assets and liabilities subjects banks to interest rate risk. Derivatives mitigate this risk, which often contributes to capital adequacy, profitability, and lowering the probability of bank failure. In addition, banks make markets in derivatives to meet the risk management needs of financial and non-financial firm customers. In the process, they generate fees and other revenue from this trading as well as lower their cost of funding.
For non-financial firms, derivatives can assist in risk management associated with cash flow volatility arising from adverse changes in interest rates, exchange rates and commodity and equity prices. The tax code also offers incentives for hedging cash-flow volatility and income. A hedging strategy involving derivatives might alleviate underinvestment caused by insufficient cash flow and risk aversion.
The information that can be extracted from derivatives, such as price discovery, is another important benefit. In “complete” markets (when agents can buy insurance contracts to protect against any future state of the world), trading on derivative exchanges should reveal no new information to market participants. However, the lack of completeness means that informed traders could prefer to own futures or options in lieu of the
$1INCREASE
PER BARRELMILLION
$
INCREASE IN OPERATING COSTS
JET FUEL
A Lift for Airlines
Fuel is often a carrier’s largest operating expense, and a particularly volatile one as well. In 2011, United calculated that every $1 increase per barrel added $95 million in costs. Airlines use derivatives on similar fuels to hedge against adverse price shifts, which may allow them to increase their investment in physical capital, add flights, and prevent out-of-control costs from impacting consumers.

6 DERIVING THE ECONOMIC IMPACT OF DERIVATIVES
underlying assets, and this might reveal new information about price. Most studies done on developed nations show that the futures market leads the spot market and therefore serves as the focal point for price discovery.
Another positive identified with derivatives is reduced transaction costs through narrower bid-ask spreads. Spot markets with derivatives often have more liquidity and lower trading fees than markets without. If investors want exposure to the S&P 500, for instance, but wish to avoid the expense of purchasing all the underlying securities, they can trade index options and futures for the same result with less cost.
REGULATORY REFORM AND THE FUTURE
Derivatives’ outlook is veiled by regulatory changes taking place in the United States and other major markets. The Dodd-Frank Wall Street Reform and Consumer Protection Act (commonly known as Dodd-Frank) was signed into law in July 2010, five months before the release of the Financial Crisis Inquiry Report. It focused on addressing the lack of transparency as well as the absence of capital and collateral requirements in some derivatives markets, primarily OTC-related. Title VII of Dodd-Frank, also called the Wall Street Transparency and Accountability Act, granted the Commodity Futures Trading Commission (CFTC) and the Securities and Exchange Commission (SEC) authority to regulate swap derivatives. The SEC was designated to have specific authority over “security-based swaps.” Other titles under Dodd-Frank addressed broader issues of interconnectedness among firms and concentrations of risk in derivatives markets.
Whether Dodd-Frank’s remedies will succeed remains for history to judge. Many of the measures linked with changes to OTC derivatives and the requirement to use “swap execution facilities” have been put in place only recently. Even if the adjustment is less than smooth, the past suggests that derivatives will continue to play a pivotal role in economic and financial activities. Their continued contribution to economic growth will depend on the markets becoming more transparent and liquid, enabling end users to generate competitive returns while effectively hedging risk.


The authors hope that the results of this study will provide a more balanced view of these instruments and further their use in ways that promote economic expansion and contribute to overall financial stability.

9
IntroductionIn undertaking this research, the authors were aware that financial derivatives have been analyzed and discussed ad nauseam in recent years. Ironically, derivatives have been frequently maligned by those who confuse them with other financial instruments. This has not stopped derivatives from being erroneously portrayed as the creations of Ph.D.-trained financial engineer types, used by Wall Street bankers to entice investors seeking leverage as well as by businesses looking to enhance profits and/or reduce risk.
Derivatives, particularly over-the-counter (OTC) instruments, are blamed for any number of financial maladies, including the recent global financial crisis. They have been tagged with catchy phrases like “financial weapons of mass destruction” by none other than Warren Buffett. Nevertheless, Buffett’s Berkshire Hathaway has benefited substantially from the use of derivatives, by the company’s own admission.
This is not to say that there have been no problems with some types of derivatives. Most recently, credit default swaps (CDS) have come under scrutiny, as the history chapter in this study shows. However, the fact that derivatives have been with us for many centuries is a testament to the contribution they have made in promoting commerce and benefiting businesses of all forms and sizes. Direct benefits are manifest in risk mitigation, price discovery, and liquidity enhancement. Derivatives assist in completing markets,1 providing firms and individuals with financial flexibility as well as investment opportunity. By reducing risk they also reduce costs, which generally means that borrowing and lending (as illustrated in the home mortgage industry) can occur at lower expense than would otherwise be the case.
While the qualitative benefits of derivatives are well-known and taught in university finance programs, a tremendous amount of deep-seated skepticism remains. This study breaks new ground by rigorously quantifying, for the first time in a publicly available study, derivatives’ positive impact on economic growth. Primarily, we focus on their role in facilitating credit availability through banks. We also look at the effects derivatives have had on non-financial firms. That portion of the analysis offers broader insight into the use of various types of derivatives and their ability to enhance firm value.
Regarding the future, the transformed regulatory environment in the United States and other global financial centers poses the question of whether the evolving product mix and costs of derivatives will allow them to step up their contribution to economic growth. The emphasis on increased transparency and reduced counterparty risk, among other aims, should dampen fears of systemic risk that had been associated with unsupervised OTC derivatives activity. The authors hope that, in some small way, the results of this study will provide a more balanced view of these instruments and further their use in ways that promote economic expansion and contribute to overall financial stability.
1. In economics, a complete market (or complete system of markets) is one in which the complete set of possible gambles on future states-of-the-world can be constructed with existing assets without friction.

10 DERIVING THE ECONOMIC IMPACT OF DERIVATIVES
The paper proceeds as follows: Section 1 details the historical development and importance of derivatives and derivatives markets. Here, the authors demonstrate how these products have promoted commerce and highlight their evolution as the global financial system has expanded in scale and complexity.
Section 2 assesses the growth of the global derivatives market and all types of derivatives contracts. We discuss the varied features and distinctions among derivatives traded over the counter and on exchanges while highlighting emerging trends in the expansion of exchanges worldwide. Since the topic has received so much media attention, the analysis sheds light on public misunderstandings that stem from the varied ways of measuring derivatives’ value, the roles of derivatives and structured products during the global financial crisis, and the growth of these instruments in relation to other financial markets.
In Section 3, the authors look at the channels through which derivatives impact the real economy, focusing on risk management, price discovery, and transaction costs. Risk management is of critical importance, with financial exposure stemming from adverse changes in interest rates, foreign exchange rates, and commodity and equity prices. We address the way banks and non-financial firms mitigate risk through exchange-traded and OTC derivatives and how this remedy theoretically influences firm value and credit supply.
The main focus of this study lies in Section 4, where the authors empirically assess the impact of derivatives use by banks and non-financial firms on credit supply and firm value,2 respectively, and how these effects influence the real economy. Although other studies have assessed the impact on bank lending and firm value, none has extended the analysis to the effect on economic growth.
This assessment is divided into four parts. Parts 1 and 2 quantitatively estimate the relationships between, on the one hand, banks’ derivatives use and credit extension, and, on the other, non-financial firms’ derivatives use and firm value. Part 3 investigates the impact of firm value and bank lending on economic growth. Coupled with the estimates derived from Parts 1 and 2, it enables us to assess derivatives’ overall impact on the U.S. economy. Part 4 extends the analysis to the use of futures contracts and economic growth.
Section 5 concludes our study with an evaluation of the future of exchange-traded and OTC derivatives. Regulatory changes, along with accompanying administrative rules born of the financial crisis, will likely have a significant impact on the market structure of derivatives in the coming years. The focus on reducing systemic, and by extension counterparty, risk could result in a material migration from OTC markets to exchanges. However, the speed and degree of this adjustment is still to be determined and will depend inter alia on how rules concerning end users are interpreted and how they influence the costs of the instruments. This section highlights these and other major trends likely to emerge and offers perspective on how they might affect economic growth.
2. Firm value is defined in terms of the market-to-book value ratio.


Besides the rapid development of digital technology and its use in finance, the growth in OTC derivatives in the 1990s and early 2000s was spurred by a lax, perhaps at times controversial, regulatory environment.

13
The financial instruments we know as derivatives have played a vital role in economic activities dating back as far as Antiquity. From helping to secure the supply of commodities to facilitating trade and providing hedges against a variety of risks, derivatives use has evolved along with changes in commerce, the forms of financial assets, and their regulation. Trading activities and the platforms on which they take place also have undergone significant change, but with new regulation, instead of market preferences, sometimes leading to the transformation. In addition, technology has had a prominent role in the modern history of derivatives trading, particularly in facilitating access to these markets for non-financial businesses.
The first known use of derivatives dates to 2000 B.C., when merchants, in what is now called the Kingdom of Bahrain, engaged in consignment transactions for goods destined for India. A few hundred years later, the 48th law in the Code of Hammurabi established a contractual relation in the form of a put option.
Ancient Greece and Rome also played roles in the history of derivatives. According to the writings of Aristotle, around 580 B.C. a philosopher and mathematician named Thales purchased options on olive presses and made a fortune from an unusually large harvest by leasing out the presses at a substantial premium. In the Roman Empire for many years, laws did not recognize the transferability of contract rights and obligations, impeding derivatives use. However, commercial realities forced change, resulting in the use of contracts for future deliveries. Roman law would go so far as to enforce the intentions of contracting parties, even if they were speculative (Swan, 2000).
Derivatives continued to facilitate merchandise and commodities trade during the Middle Ages. Much of the activity at the height of the period took place in Italy, where merchants engaged in commerce spanning the Mediterranean Sea and beyond. A form of commodity forward contracts—known as Commandas—developed along with the bill of exchange. As commercial trade expanded, the exchange business grew. Professional money changers emerged, along with the trading of these bills.
As this activity multiplied, centralized markets for goods sprang up. An early version was the periodic fair, which was supervised by church institutions. Markets became specialized to respond to the trading needs of varied merchant groups. For their part, derivatives largely remained, in today’s terminology, “over the counter” but with the counters closely aligned with the individual markets. Periodic medieval markets lost their importance in trade over time, leading to permanent trading places located at the junction of port sites and land routes (Swan, 2000).
The exodus from the Middle Ages coincided with the spread of derivatives to other parts of Europe and as far as Japan. Around 1600, forward and options contracts on commodities, shipments, and securities were
1. History

14 DERIVING THE ECONOMIC IMPACT OF DERIVATIVES
traded in Amsterdam. This was followed a few decades later by forward contracting on tulip bulbs during the infamous Tulip Mania. A standardized futures contract for rice could be found in Osaka, Japan, around 1650, although it is not known whether the contracts were marked to market on a daily basis and/or had credit guarantees.
The early part of the 17th century saw the first recorded short-selling attack stemming from the abuse of options. The attack was directed at the Dutch East India Co., which was created as a joint stock company in the Netherlands in 1602. Participants in this early attack were successful, but subsequent similar efforts were less so, resulting in a number of bankruptcies. One of the outcomes of this episode was a ban on short selling in 1610, which apparently was not effectively enforced (Gelderblom and Jonker, 2009).
Although derivatives trading in a regulated exchange can be traced back to the 12th century, the first formal exchange for trading derivatives was the Royal Exchange in London, founded in 1565. The rise of England as a maritime power is one factor cited as supporting the development of derivatives trade in the country. In addition, English law recognized the transferability and negotiability of bills of exchange. Settlement was also facilitated through contracts for difference, in which a losing party could compensate the winning party for the difference between the delivery price and the spot price at the termination of the agreement.
The trading of derivatives in 18th century England also brought us the term “bubble.” When the South Sea joint stock company was established in 1711, its exclusive trade with Spain’s South American colonies was widely expected to generate enormous profits. This led to the formation of ancillary companies called bubbles. In 1720, the English Parliament passed the Bubble Act, prohibiting all joint stock companies not authorized by royal charter. The law triggered a wave of turmoil in financial markets, resulting in a crash (Swan, 2000). According to a subsequent investigation, the breakdown was attributed to those who dealt in options— mainly call options known as “refusals.” The legal consequences were that, after long debate, Parliament passed the Sir John Barnard’s Act, which banned options in shares as well as short selling (Weber, 2008).
1.1 INTEGRATION AND OVERSIGHT IN THE MODERN ERA
An ocean away and more than a century later, the first formal commodities exchange was established in the United States in 1848. In addition to tackling the problem of credit risk, the Chicago Board of Trade (CBOT) provided a centralized location to negotiate forward contracts. Under its aegis, the first exchange-traded derivatives contracts were listed in 1865, and in 1925 the first futures clearinghouse formed. In 2007, the CBOT merged with the Chicago Mercantile Exchange to become the CME Group.
The recent history of derivatives is characterized by their broad integration into commerce and finance, as evidenced by the creation of new products along with the platforms and tools for delivering them. Besides the rapid development of digital technology and its use in finance, the growth in OTC derivatives in the 1990s and early 2000s was spurred by a lax, perhaps at times controversial, regulatory environment. Derivatives also benefited from advances in finance at the academic level. In 1973, for instance, Fischer Black and Myron Scholes put forth their Nobel Prize-winning option pricing formula.

15HISTORY
The final decades of the 20th century witnessed new types of derivatives trading on currencies, bond and interest rate futures, as well as options on share indexes. The Chicago Mercantile Exchange created one of the first futures contracts that were not on physical commodities. The first currency futures were launched in 1970 at the International Commercial Exchange in New York while the Bretton Woods system was still in effect. Five years later, the interest rate futures contract based on Ginnie Mae mortgages was traded for the first time on the CBOT (Girish, 2010).
This was followed in 1977 by the U.S. Treasury bond futures contract, which became the highest-volume contract at the time. The flurry of activity continued with the creation of the Chicago Mercantile Exchange’s Eurodollar contract in 1982 and the first stock index futures contract by the Kansas City Board of Trade. The Chicago Mercantile Exchange quickly followed with its highly successful contract on the S&P 500 index.
While most derivatives were traded on exchanges up until this period, the 1980s marked the beginning of the era of swaps and other OTC derivatives. With a new generation of corporate financial managers well-versed in the use of derivatives, these instruments became essential for hedging, and in some cases speculating on, interest rate, exchange rate, and commodity risks. As corporations’ financial risks became more complex, so did the derivatives to deal with them. By 1991, the notional amount of OTC derivatives trading had surpassed that of exchange-traded derivatives (Whaley, 2006).
The rapid growth in OTC derivatives was fueled in part by the emergence of credit derivatives in the mid-1990s. The first CDSs were created by the J.P. Morgan investment bank (now JPMorgan Chase), which led the industry away from relationship banking toward credit trading. By engaging in such activities, bankers and others were striving for higher returns while shedding buy-and-hold risk.
Despite all the positives associated with derivatives in the 1990s, a number of high-profile incidents raised concerns among some regulators and others. In 1994, firms with deep financial experience such as Procter & Gamble and Metallgesellschaft suffered large losses on derivatives trading—primarily using swaps. Orange County, Calif., one of the wealthiest counties in the United States, declared bankruptcy, allegedly due to derivatives trading involving leveraged repurchase agreements. The following year, the United Kingdom’s Barings Bank declared bankruptcy because of speculation on futures by a rogue trader in its Singapore office (Chance, 1995).
These incidents did lead to minor changes in the way derivatives were sold, but for the most part firms were responsible for tightening controls internally. Following the 1998 collapse of Long-Term Capital Management (LTCM), a giant hedge fund, the Report of the President’s Working Group on Financial Markets recommended that the Securities and Exchange Commission (SEC), Commodity Futures Trading Commission (CFTC), and U.S. Treasury receive expanded authority. This would have required counterparties in OTC derivatives transactions to provide credit risk information and keep records on concentrations, trading strategies, and risk models. Federal Reserve Chairman Alan Greenspan declined to endorse these proposals but deferred to those regulators with supervisory authority, who took no discernible action.

16 DERIVING THE ECONOMIC IMPACT OF DERIVATIVES
On the heels of these events, 12 international banks formed the Counterparty Risk Management Policy Group (CRMPG) to examine the practices that brought about the LTCM crisis. Recommendations for self-regulatory practices were put forth to prevent a recurrence. There was mention of detailing certain large exposure information on a consolidated group basis. However, the major thrust of the CRMPG report was to oppose new regulation.
In late 2000, Congress passed and President Bill Clinton signed the Commodity Futures Modernization Act (CFMA), satisfying calls for deregulation amid market volatility. The law removed OTC derivatives transactions, including those related to energy, from all requirements of exchange trading and clearing under the Commodity Exchange Act (CEA) so long as counterparties to swaps were “eligible contract participants.” Except for issues related to fraud, the SEC was barred from OTC derivatives oversight. Moreover, the CFMA expressly preempted state gaming and anti-bucket shop laws, which would have barred the otherwise unregulated speculative activity granted under the act. In effect, almost no law applied to this market (Greenberger, 2010).
In the aftermath of the CFMA’s passage, derivatives growth skyrocketed. Although this boom was generally viewed as positive in helping to mitigate risk and enhance commerce, regulators and swap dealers themselves expressed reservations about operational shortcomings of OTC markets. In 2005, Timothy Geithner, then president of the Federal Reserve Bank of New York, assembled representatives of the world’s 14 largest banks to discuss his concern about substantial backlogs in the documentation of credit derivatives. He requested that banks clear up 80 percent of the backlog within a year and asked them to form a clearinghouse for complex derivatives contracts.
The CRMPG issued two reports, the first in July 2005, which aired clear concerns about the viability of the credit derivatives market. In particular, that report highlighted problems of identifying CDS counterparties because of poor documentation. The second report, released in July 2008, acknowledged difficulties with the credit derivatives settlement process and urged “swift action to create a clearinghouse for OTC derivatives, starting with CDS” (Greenberger, 2010).
For critics of OTC derivatives and credit derivatives in particular, the global financial crisis beginning in 2008 was seen as validating their views while presenting an opportunity to fundamentally alter the operational structure of derivatives markets through sweeping legislation. The facile labeling of these instruments as financial WMD added to the momentum for change. The final report of the National Commission on the Causes of the Financial and Economic Crisis in the United States took a more balanced view of derivatives’ role in the collapse. While acknowledging that OTC derivatives contributed “significantly to this crisis,” the report went on to point out that these instruments were but one of eight major factors involved.
The Dodd-Frank Wall Street Reform and Consumer Protection Act (commonly known as Dodd-Frank)—which was signed into law in July 2010, five months before the release of the Financial Crisis Inquiry Report—clearly reflected the overall negative political and public sentiment toward derivatives. Particular emphasis was placed on dealing with a lack of transparency and a buildup of losses on trading positions, as well as the absence of capital and collateral requirements in some derivatives markets, primarily OTC-related. Title VII of Dodd-Frank, also called the Wall Street Transparency and Accountability Act, granted the CFTC and SEC

17HISTORY
authority to regulate swap derivatives. The SEC was designated to have specific authority over “security-based swaps.” Other titles under Dodd-Frank addressed broader issues of interconnectedness among firms and concentrations of risk in derivatives markets.
Whether Dodd-Frank’s remedies, including a push toward cleared (listed) derivatives, will succeed remains to be seen. Many of the measures linked with changes to OTC derivatives and the requirement to use “swap execution facilities” have been put in place only recently. Even if the adjustment is less than smooth, the past suggests that derivatives will continue to play a pivotal role in economic and financial activities.

Given the expansion of international trade and financial activities, participants are likely to face increasing risks, and derivatives markets are expected to contribute to economic development by making these risks manageable.
19
2. Global Growth and Recent TrendsDerivatives are financial instruments in the form of contracts between two parties to engage in a transaction at a future time. The value of the contract is derived from the value of an underlying asset (e.g., equity, bond, or commodity) or market variable (e.g., interest rate, exchange rate, stock index, or credit risk). The notional amounts of a derivative contract refer to the principal value of the underlying asset.
Derivatives are traded in two types of markets: organized exchanges and over-the-counter (OTC). An important feature of derivatives exchanges is the interposition of a clearinghouse that serves as a counterparty to reduce the default risk of parties engaged in the contract. Exchange markets also trade standardized financial derivatives (e.g., futures and options contracts). Derivatives traded through the OTC market, on the other hand, are privately negotiated and customized to the specifications of the counterparties involved. OTC derivatives are executed bilaterally, and in most cases with derivatives dealers (such as global commercial and investment banks), who either find a counterparty or serve as a counterparty themselves. In contrast to past practice, Dodd-Frank requires with some exceptions that OTC derivatives be cleared by a derivatives clearing organization (DCO), and that the transactions trade on swap execution facilities (SEFs) or designated contract markets (DCMs) (see Part 5 for regulation of OTC derivatives under Dodd-Frank). European regulators and some Asian nations are taking a similar approach. However, it is unclear whether all of the G-20 will concur.
The four main types of derivatives contracts are forwards, futures, options, and swaps. The general concepts are similar, with their value derived from the price of an underlying asset. Differences include some of the functions and features of the contracts as well as the markets where the various types of derivative are traded.
Forwards and futures contracts are agreements between two parties to engage in a financial transaction at a specified price and quantity and at a future (forward) date. Forwards, however, are customized through negotiation. Since such contracts are bilaterally agreed upon and settled, the participants are exposed to counterparty risk.
A futures contract has several features designed to overcome this risk. Futures are traded on organized exchanges and represent a standardized agreement to deliver or receive a specific amount of a financial instrument at a specific price and date. Trading on organized exchanges enhances transparency as prices and other trade-related information are publicly displayed, while a central clearinghouse reduces counterparty credit risk. In part, this risk is mitigated because a clearinghouse requires contributions (in the form of collateral or margin) from their counterparties and collects mark-to-market collateral upon changes in the value of contracts. Most financial futures contracts in the United States are traded through the CME Group.

20 DERIVING THE ECONOMIC IMPACT OF DERIVATIVES
An option is a contract that grants owners the right but not the obligation to purchase (a call option) or sell (a put option) a financial instrument for a specific price within a defined time period. It functions by having the purchaser/owner pay the seller/writer an option premium for the right to buy or sell. The purchaser’s potential loss is limited to the price of the premium, curbing the downside. In contrast, the seller of an option receives the premium in return for risk exposure. Options are traded on organized exchanges and OTC derivatives markets, though standardized options are traded solely on organized exchanges.
A swap is a financial contract to exchange a set of payments one party owns for a set of payments owned by another party. The type most commonly traded is the interest-rate swap, which has increased in importance as financial institutions seek to manage interest-rate risk. Such transactions involve the exchange of one set of fixed-rate interest payments for a set of variable-rate interest payments. Similar to forwards, swaps are traded on the OTC market and subject to default/counterparty risk. However, all swaps not subject to enumerated exceptions are now required under Dodd-Frank to be cleared by a DCO and executed on an SEF. These reforms are aimed at reducing counterparty risk associated with bilaterally traded OTC derivatives, which policymakers and many commentators identified as a factor that magnified the global financial crisis in 2008 (see Box 1).

21GLOBAL GROWTH AND RECENT TRENDS
Financial derivatives are recognized as a useful tool for hedging risk. However, the collapse of American International Group Inc., followed by its $85-billion bailout in September 2008, illustrates that the misuse of financial instruments, along with an absence of regulatory oversight, can pose serious dangers for the financial system.
In the years leading up to the crisis, AIG had been active in the credit derivatives business, including trading (CDSs). The giant insurer’s CDS portfolio was written on complex collateralized debt obligations (CDOs) with underlying residential mortgage-backed securities (MBSs) whose asset pools included subprime loans. In this regard, AIG offered insurance in the form of CDSs to investors to protect against default or decline in MBS values, in exchange for a fee or premium.
AIG’s financial problems emerged after the U.S. residential market started to deteriorate in late 2006 and early 2007. Defaults by mortgage borrowers led to massive write-downs in AIG’s portfolio. The downgrades of AIG’s long-term debt by the major credit rating agencies, which triggered additional cash collateral obligations, led to a severe liquidity shortage at the company. Finally, the government stepped in and committed more than $180 billion to repair AIG’s liquidity situation amid fears that an abrupt collapse would trigger massive losses throughout the global financial system.
Accordingly, the U.S. Financial Crisis Inquiry Commission (FCIC) identified OTC derivatives as one of the eight major factors that contributed to the crisis. Its Final Report (2011, p. 50) notes that a “key OTC derivative in the financial crisis was the credit default swap.”
Some scholars and critics presented dissenting views on the role derivatives played as described by the FCIC. For example, Peery (2012, p. 21) points out that “members of the Crisis Commission… could not tell the difference between the derivatives that many companies
in the mainstream use every day to manage risk on the one hand, and derivatives that enabled big players like Lehman Brothers and American International Group Inc. (AIG) to pursue excessive risk taking, on the other hand.”
Regarding the distinction between the functions of derivatives and their misuse, Peter Wallison of the American Enterprise Institute (2011, pp. 5-6) argued:
“The only company known to have failed because of its CDS obligations was AIG (American International Group), and that firm appears to have been an outlier. Blaming CDS for the financial crisis because one company did not manage its risks properly is like blaming lending generally when a bank fails. Like everything else, derivatives can be misused, but there is no evidence that the ‘interconnections’ among financial institutions alleged have caused the crisis were significantly enhanced by CDS or derivatives generally.”
Nonetheless, the fact that AIG was not required to put aside adequate capital reserves and could take huge positions in the OTC derivatives market proved highly dangerous. According to René Stulz (2009, p. 64), “The AIG situation is unusual, however, because it was mostly a protection writer. Financial institutions more typically are both protection writers and protection buyers.”
In addition, several observers noted that if these OTC derivatives transactions had been cleared, the losses would have been much smaller and the massive bailout would have been less likely. This is because a clearinghouse requires the transacting parties to post initial margin (collateral) and make margin payments in response to changes in values of the contracts from daily mark-to-market. Therefore, in the case of AIG, the margin calls would have come sooner and been more frequent (see IMF, 2010, p.99. Also see Pirrong, 2011, for discussion on the economic function of central counterparties).
Credit derivatives, risk, and the 2007-2009 financial crisisB
OX 1
21GLOBAL GROWTH AND RECENT TRENDS

22 DERIVING THE ECONOMIC IMPACT OF DERIVATIVES
2.1 VOLATILITY AND TECHNOLOGY
The derivatives markets were small until the 1970s. Since then, their growth has been driven by both demand and supply factors. In the 1970s and ’80s, economic conditions such as rising volatility in stocks, interest rates, and exchange rates, along with the globalization of the capital markets, spurred demand for instruments to hedge risk. Supply factors, such as advancing technology and financial engineering, which aided the design of sophisticated derivatives, played an important role (in particular, the Black-Scholes [1973] formula to price options was widely acknowledged as an important factor).1
In the past two decades, the global derivatives markets have grown dramatically, despite experiencing a slowdown after the onset of the global financial crisis in 2008. The size of the market cited in the news media often refers to the notional amounts outstanding of contracts. Based on statistics from the Bank for International Settlements (BIS), the OTC derivatives market grew by a factor of eight, from $80 trillion to $633 trillion annually, between 1998 and 2012. The exchange-traded market expanded considerably as well over that period, from $14 trillion to $54 trillion, or about four times (Figure 1).
The global derivatives market (notional amounts outstanding)
FIG
UR
E
1
Source: Bank for International Settlements, June 2013.
$ trillions OTC derivatives
Exchange-traded derivatives
June 19
98
June 19
99
June 20
00
June 20
01
June 20
02
June 20
03
June 20
04
June 20
05
June 20
06
June 20
07
June 20
08
June 20
09
June 20
10
June 20
11
June 20
12
June 19
98
June 19
99
June 20
00
June 20
01
June 20
02
June 20
03
June 20
04
June 20
05
June 20
06
June 20
07
June 20
08
June 20
09
June 20
10
June 20
11
June 20
12
0
100
200
300
400
500
600
700
800
$ trillions
0102030405060
8090
70
100
1. According to Merton (1998), “The most influential development in terms of impact on finance practice was the Black-Scholes model for option pricing... This success in turn increased the speed of adoption for quantitative financial models to help value options and assess risk exposures” (pp. 323-324).

23GLOBAL GROWTH AND RECENT TRENDS
Among the four types of derivatives, swaps are the largest market by notional amount. The second-largest is forwards (see Figure 2). Both swaps and forwards are traded on OTC markets, while futures and standardized options are traded on organized exchanges. As discussed in detail in Part 2.4, simply comparing notional amounts outstanding between exchanges and OTC derivatives markets can be misleading. For instance, an offsetting OTC trade actually adds to the notional amount outstanding, while offsetting exchange-traded transactions are netted out. In other words, OTC trading data captures gross positions, while exchange data represents net positions. Therefore, the growth of derivative types as presented in Figure 2 should be compared within the markets where the instruments are traded.
Notional amounts, by instrument
FIG
UR
E
2
Note: Unallocated excluded.
Source: Bank for International Settlements, June 2013.
$ trillions
1998 1999 2000 2001 2002 2003 2004 2005 2006 2007 2008 2009 2010 2011 2012
0
100
200
300
400
500
600
700
800
Future (exch tr)
Options (exch tr)
Options (OTC)
Swaps (OTC)
Forwards (OTC)*
Credit derivatives (OTC)
Unallocated
* Includes forex swaps, equity-linked swaps, and commodity swaps. The amounts outstanding for these categories are small and BIS reports their data with forwards. Equity-linked forwards and swaps combined is 0.3% and commodity forwards and swaps is 0.3% of total contracts.
The development of derivatives can also be presented in terms of the risk category of the underlying assets (i.e., interest rate, foreign exchange, equity-linked, commodity, and credit derivatives), in addition to type of instrument (i.e., forwards, futures, options, and swaps) and market (i.e., exchange-traded and OTC). Appendix 1 provides data by market, risk category, and instrument.2
In terms of risk category of the underlying assets, interest rate derivatives are the most widely traded, accounting for about 77 percent of notional amounts outstanding of global OTC derivatives in 2012 (see Figure 3). They became popular in the late 1970s and early 1980s, when corporations were grappling with wide rate fluctuations and sought financial instruments to reduce the associated risk. Although some manufacturers were affected by rate movements, financial institutions, whose profit comes primarily from interest-sensitive liabilities, were even more exposed. They became the primary users of interest rate swaps, now the most commonly traded type of interest rate derivative.
2. Categorization based on Bank for International Settlements methodology.

24 DERIVING THE ECONOMIC IMPACT OF DERIVATIVES
OTC derivatives by risk categoryF
IGU
RE
3
Source: BIS, Milken Institute.
1998
2012
2011
2010
2009
2008
2007
2006
2005
2004
2003
2002
2001
2000
1999
0%
10%
20%
30%
40%
50%
60%
70%
80%
90%
100%
Unallocated CDS CommodityEquity-linked Foreign exchange Interest rate
OTC derivatives:$633 trillion (2012)
UnallocatedCDS
Commodity <1%Equity-linked 1%Foreign exchange
Interest rate
77%
7%4%
11%
Foreign exchange derivatives, at 11 percent of the notional amount of the global OTC total, are the second-largest category, much smaller than interest rate derivatives. In recent decades, foreign financial markets have become more accessible and international trade more open as technology reduced costs associated with cross-border transactions. The trend increases demand for foreign exchange derivatives to hedge currency risk, as global banks, institutional investors, and multinational corporations increase their exposure to exchange rate risk. The foreign exchange derivatives market expanded from the notional amount of $18 trillion in 1998 to $67 trillion in 2012. Activity in equity-linked and commodity derivatives is relatively small, with each accounting for about 1 percent of the broader market.
Credit derivatives are a new type, with the credit default swap its predominant form. This is a contract that allows the buyer to hedge the credit risk of debt securities contingent upon a credit event that befalls the issuer, such as a bankruptcy or payment default. With a CDS, a protection buyer makes periodic payments to a protection seller. Until the credit event occurs, the protection seller benefits from the premium payments it receives over the life of the CDS contract. If a credit event does occur, the seller is obligated to compensate the buyer equal to the price of debt securities specified in the contract.3 Most reference entities (debt issuers) are corporations, and the primary sellers and buyers of credit default swaps include globally active financial institutions.
3. Compensation upon settlement is discussed, for example, in Rajan (2007). The amount the protection seller has to pay the buyer depends on the type of settlements, including the treatment of recovery.
25GLOBAL GROWTH AND RECENT TRENDS
Over the past 10 years, the CDS market has grown at an astounding pace. The notional amount outstanding reached its peak of $58 trillion at year-end 2007, twice the size of a year earlier and a multiple of nine since 2004, according to BIS statistics. However, when compared to some other types of derivatives, the CDS market is small. The category has accounted for 3 percent to 5 percent of the total notional amount of OTC derivatives, except for a few years leading up to the financial crisis, when they jumped to 7 percent to 10 percent (see Figure 3).
One reason for CDS’ rapid growth was the heated activity in the housing market and the expansion of mortgage-backed securities. Many financial institutions that invested in mortgage-backed securities purchased CDS contracts to protect against default (see Box 1 on credit derivatives and the financial crisis). The CDS market declined amid the financial crisis and has not recovered to previous levels.
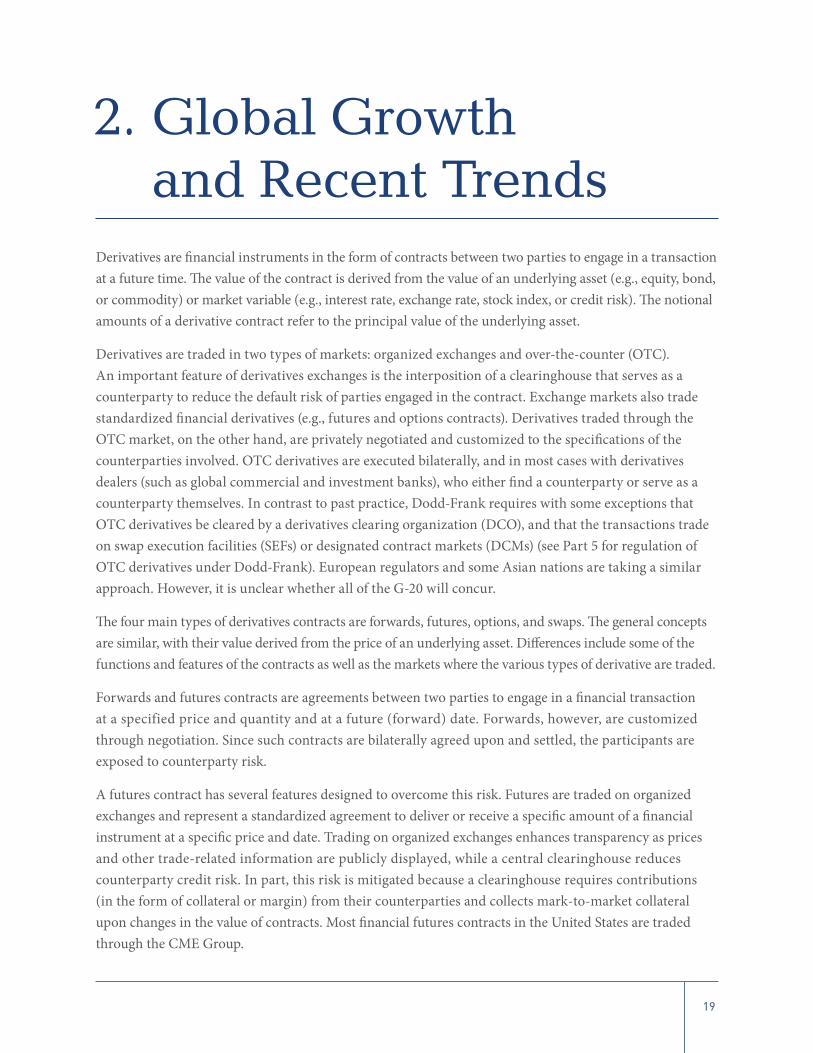
2.2 THE EXCHANGE-TRADED MARKET
Exchange-traded derivatives activity was recorded as early as the 1500s, but only recently have we seen a rapid increase in the number of such exchanges established around the world (see Figure 4). Between the 16th and 19th centuries, derivatives exchanges were located only in three mature economies, yet in the past decade these marketplaces have been established in about 50 countries, both mature and emerging markets. (Appendix 2 lists derivatives exchanges, their home countries, and the year of their creation.) In a recent trend, some exchanges have consolidated and expanded operations outside their home countries (Kohli, 2012).
Number of derivatives exchanges worldwide†
FIG
UR
E
4
Sources: World Federation of Exchanges, Futures Industry Association, Numa Directory of Futures and Options Exchanges, Association of Futures Markets, International Organization for Standardization, Commodity Futures Trading Commission
(1997), Tsetsekos and Varangis (1999), Santana-Boado and Brading (2001), Gorham and Xueqin (2002), Gorham and Singh (2009), Jorgensen, Kavajecz, and Swisher (2011), Belozertsev, Rutten, and Hollinger (2011), and Milken Institute.
0
50
1970 1973 1976 1979 1982 1985 1991 1994 1997 2000 2003 2006 2009 2012
100
150
200
250
300
350
Total number
The data includes exchanges established since 1500 but the chart starts in 1970 because few existed earlier and globalization accelerated around then. The net number of exchanges is represented, with an increase indicating more being established than closed or merged. Exchanges closed before 1970 are excluded.
†

26 DERIVING THE ECONOMIC IMPACT OF DERIVATIVES
Derivatives exchanges trade standardized contracts. Since the exchanges record transactions, activity can be tracked in a straightforward manner. The Futures Industry Association (FIA) and World Federation of Exchanges (WFE) collect futures and options trading information on their member exchanges.4 Their published surveys report the activity of listed derivatives in terms of trading volume (the number of contracts traded) and open interest (the number of contracts entered into but not fulfilled by delivery). Last year, 21.2 billion derivatives contracts were traded on organized exchanges worldwide, close to triple the volume a decade ago.5 The peak was reached in 2011, when more than 25 billion contracts were traded. Trading volume, reflecting the quantity of demand, is usually used as a measure of growth for exchanges. Those with higher volume are often recognized as being successful in offering properly designed contracts.
Regarding geographic distribution, Europe and North America dominate the exchange-traded derivatives market as measured by notional turnover and open interest—together holding more than 90 percent. Exchanges in the Asia-Pacific region account for a larger proportion of trading volume (see Figure 5) than notional amounts. These distributions, based on different units of measurement, reflect the smaller contracts traded on Asia-Pacific exchanges.
Derivatives traded on organized exchanges (2012), by region
FIG
UR
E
5
Sources: Data for the number of contracts traded and open interest is from the World Federation of Exchanges. Data for notional amounts outstanding is from BIS.
Americas EAME (Europe, Africa, Middle East) Asia Pacific
42%
22%
36%
Number of contracts traded 21.2 billion
29%
8%
63%
Open interest640 million contracts
52%
43%
5%
Notional amounts outstanding$54.4 trillion
4. Appendix 3 provides data sources for global derivatives activity.5. In 2003, the volume was 8.1 billion, according to the FIA’s annual survey. BIS also publishes the number of contracts outstanding and turnover of
exchange-traded derivatives.

27GLOBAL GROWTH AND RECENT TRENDS
Although the major derivatives exchanges are located in mature economies (e.g., CME Group, Deutsche Börse AG, ICE/NYSE), demand for such products is rising in emerging economies. Derivatives exchanges in Brazil, China, India, South Korea, and Russia have shown remarkable growth and are now ranked among the top tier (see Appendix 4). Many exchanges also pursue aggressive strategies to attract foreign trading firms through a combination of infrastructure and product development. Given the expansion of international trade and financial activities, participants are likely to face increasing risks, and derivatives markets are expected to contribute to economic development by making these risks manageable. (Parts 3 and 4 of this study examine the relationship between derivatives and economic performance for U.S. banks and non-financial firms.)
2.3 THE OTC MARKET
OTC derivatives are privately negotiated and traded between two parties without intermediation through an exchange (although OTC transactions may be cleared by a clearinghouse). Information on the trading of these individual contracts is held by dealers, who are either buyers or sellers of contracts. BIS and the International Swaps and Derivatives Association (ISDA) regularly survey global derivatives dealers and publish the results. Both surveys report notional amounts outstanding, reflecting the scale and growth of activity.
The notional amount outstanding, which stood at $633 trillion at the end of 2012, according to BIS, have drawn a great deal of attention and concern regarding possible risks tied to their scale. By this measure, the derivatives market is approximately 10 times larger than world GDP and several times larger than other global financial sectors. However, notional amounts outstanding, though a rough measure of derivatives activity, do not represent the actual amount exchanged in a transaction or, generally, the amount at risk (ISDA, 2008; OCC, 2012). The sums more closely related to the risks are gross market value and gross credit exposure (see Box 2 for definitions). As of 2012, their values are $25 trillion and $3.6 trillion, respectively, according to BIS statistics. In 1998, gross market value was $3 trillion (see Figure 6).
Growth of the global OTC derivatives market (by gross market value)
FIG
UR
E
6
Source: BIS, June 2013.
$ trillions
0
5
10
15
20
25
30
35
Jun. 1
998
Dec. 19
98
Jun. 1
999
Dec. 19
99
Jun. 2
000
Dec. 20
00
Jun. 2
001
Dec. 20
01
Jun. 2
002
Dec. 20
02
Jun. 2
003
Dec. 20
03
Jun. 2
004
Dec. 20
04
Jun. 2
005
Dec. 20
05
Jun. 2
006
Dec. 20
06
Jun. 2
007
Dec. 20
07
Jun. 2
008
Dec. 20
08
Jun. 2
009
Dec. 20
09
Jun. 2
010
Dec. 20
10
Jun. 2
011
Dec. 20
11
Jun. 2
012
Dec. 20
12
28 DERIVING THE ECONOMIC IMPACT OF DERIVATIVES
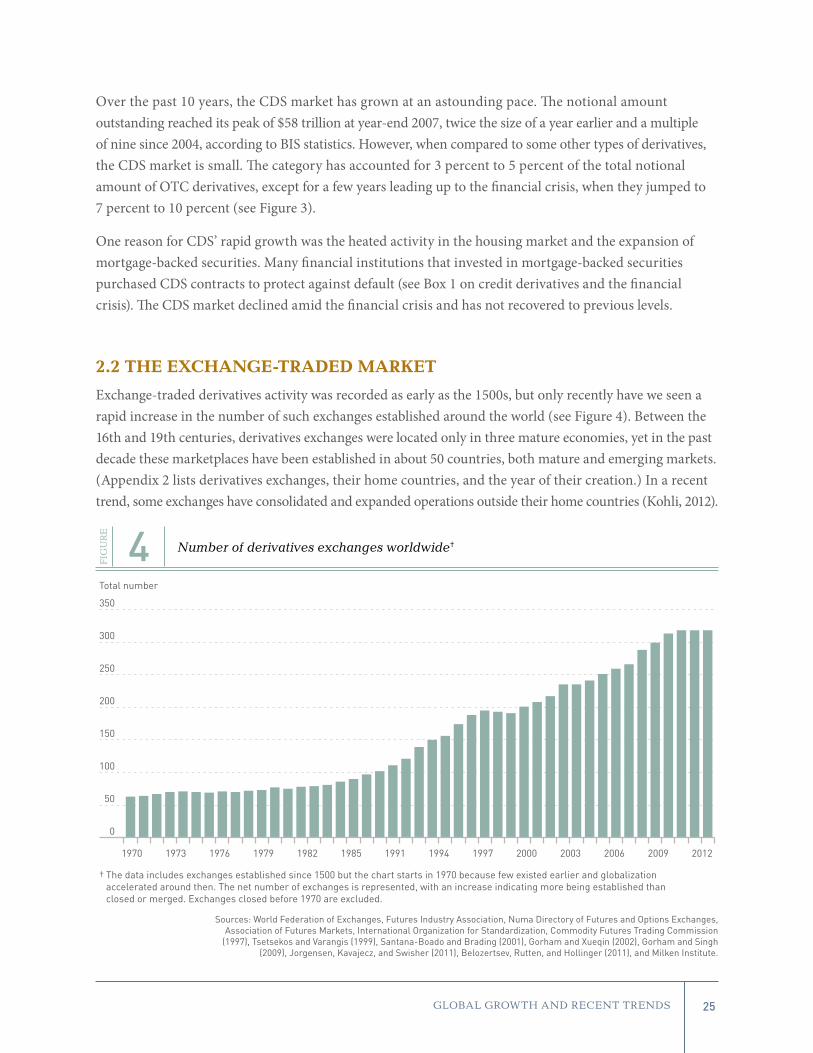
“Notional amount outstanding” of OTC derivatives contracts is commonly used to measure the activity and size of the market. The amount refers to the value of underlying assets specified in a contract. Cash flow obligations, however, are a small percentage of the notional amounts.
For example, suppose an investor buys a derivative contract from a bank to hedge the credit risk of holding $1 million in IBM bonds. Assume further that the investor pays an annual premium of $1,000 over the length of the contract in exchange for a one-time payment equivalent to the bond’s par value if IBM
were to default on its debt. In this case, the bond is the underlying asset and the $1 million is the notional amount. The $1,000 premium or cash flow obligation of the investor (counterparty) is the fair value of the contract and the amount at risk for the bank. Moreover, a bank can mitigate the risk of not being paid the premium by an investor by entering into a new contract with that same investor (e.g., by buying a new contract on IBM bonds). The sum of the fair values of the outstanding contracts between the two parties is known as “gross market value.”
Understanding risk measures of OTC derivatives(Notional amounts, gross market value, netting impacts, and gross credit exposure)B
OX 2
28 DERIVING THE ECONOMIC IMPACT OF DERIVATIVES
OTC DERIVATIVES MARKET $ TRILLIONS % OF NOTIONAL AMOUNTS % OF GROSS MARKET VALUE
Notional value 633.3 n/a n/a
Gross market value 24.7 3.9% n/a
Gross credit exposure (after netting) 3.6 0.57% 14.57%
Gross credit exposure (after netting and adjusted for collateral)
1.1 0.17% 4.45%
n/a = not applicable.
Sources: BIS, ISDA, and Milken Institute.
Note: Unallocated excluded.
Impact of gross credit exposure and netting (2012)ATAB
LE

29GLOBAL GROWTH AND RECENT TRENDS
BIS reports the gross market value of global OTC derivatives contracts along with the notional amount. In 2012, gross market value was $24.7 trillion, or 3.9 percent of the notional amount of $633 trillion.
In the United States, banks can benefit from netting and posting collateral from a master netting agreement in accordance with U.S. generally accepted accounting principles. Based on the IBM example, the bank has a positive fair value from the first contract and a negative fair value in the second contract. These cash flows can be netted out according to legally enforceable bilateral netting agreements. The sum of positive and negative fair values between the counterparties (i.e., the bank and the investor) after bilateral netting is known as “gross credit exposure.”
According to the ISDA, the gross credit exposure of global derivatives was $3.6 trillion, or 0.57 percent of the notional amount outstanding, in 2012 (see Figure A). Collateralization further reduces counterparty risk exposure. The benefits of netting and collateral posted further reduce credit exposure to 0.17 percent of the notional amount and 4.45 percent of the gross market value (see Table A).
Gross market value and gross credit exposure are considered more closely related to risk than the notional amount of derivatives (ISDA, 2008).
29GLOBAL GROWTH AND RECENT TRENDS
Sources: BIS, ISDA, and Milken Institute.
1998 1999 2000 2001 2002 2003 2004 2005 2006 2007 2008 2009 2010 2011 2012
$ trillions
0
10
20
30
40
Gross market value
Gross credit exposure
Benefits of netting
Impact of netting and gross credit exposure, OTC marketA
FIG
UR
E

30 DERIVING THE ECONOMIC IMPACT OF DERIVATIVES
Studies also point out that the gross market value of derivatives is a more appropriate measure than notional amounts in comparing the size of the market with that of other financial sectors (and world GDP). As noted by Markose (2012, p. 6), “The gross market value gives an estimate of the economic risk in derivatives arising from the volatility of underlying reference/asset prices, leverage and hedge ratios, duration, liquidity, and counterparty risk.”
Figure 7 shows this comparison. Based on market value, the size of the OTC derivatives market appears smaller than other markets, although OTC derivatives activity has burgeoned in recent decades (see Figure 1). The size of the global bond market (both private and public) was $84 trillion, which made it the largest market, more than three times the scale of OTC derivatives as of 2012. The global stock market is double the size of the OTC derivatives market.
Size of global financial markets ($ trillions), by type
FIG
UR
E
7
Note: The size of the global bond market is based on total debt outstanding, global stock market is based on capitalization, and global OTC derivatives market on gross market value. All data is in the nominal term as of 2012. GDP is based on the IMF estimate.
Sources: BIS, Bloomberg, World Bank, and Milken Institute.
Bond
GDP
Stock
OTC derivatives(gross market value)
2012 1998
8730
7230
52
27
253
2.4 DIFFERENT ENVIRONMENTS, DIFFERENT STRENGTHS
Trading derivatives through organized exchanges is recognized as more transparent. Exchanges typically offer pre-trade price discovery. Furthermore, exchanges also distribute transaction prices, bids/offers, and other trading information in real time. With such information available to all market participants as well as regulators, trading on exchanges provides a high level of transparency. Information on bilateral OTC transactions, on the other hand, is opaque to outside parties.
Exchanges also use a central counterparty (CCP) to clear and settle trades. Clearinghouses also serve as counterparties and set and enforce margin requirements. They are obliged to honor the trade in the event of a party’s default; therefore, they reduce counterparty risk. In a traditional bilateral OTC transaction, the counterparties bear the risk of default by each. In the aftermath of the global financial crisis, some G-20 countries called for certain OTC derivatives to be cleared via CCPs as a way to reduce counterparty credit risk. (The risk can become systemic because losses from defaults can spread to

31GLOBAL GROWTH AND RECENT TRENDS
parties who entered into contracts with the counterparties of the defaulted contracts). Therefore, both exchange-traded and cleared OTC derivatives benefit from credit protections through the clearing and settling services provided by clearinghouses.
Nevertheless, the swift growth of the OTC derivatives market in the past reflects some of its advantages. For example, participants can trade customized, complex, or illiquid products. This ability to design deals makes OTC contracts suitable for corporations that seek to completely hedge the risk tied to specific assets in their portfolios.
In regard to the size of the two markets, it should be noted that the notional amounts outstanding for OTC derivatives are not comparable with those of exchange-traded derivatives in terms of exposure. Consider a generic example from an ISDA study (Pirrong, 2011, p. 7):
“A may sell a contract; B may buy an identical contract and then sell it; and C may buy this contract. In a bilateral OTC market, B’s offsetting positions remain open, and one (or even in some circumstances both) of its counterparties on these contract could lose from its default. In contrast, if all of these contracts are cleared through a CCP, B’s contract would be netted out and B’s contractual obligations would be extinguished. If B went bankrupt, neither A nor C could suffer a default loss (as long as the CCP remains solvent).”
In the OTC market, traders may enter into a new transaction to hedge out a previous one. In terms of recorded transactions, the notional amount of the new contract will be accumulated to past transactions, even though the net exposure is reduced. In this example, the total notional amounts of B’s two contracts with identical notional amounts will be counted double although their net risk is zero.
For exchange-traded derivatives, the existing contract is netted out by a CCP who takes the opposite position in the same contract for each trader. That leaves the notional amounts outstanding the same or smaller, and counterparty risk is extinguished. The positive net positions are then summed across traders. As noted by Kleist (2012, p. 48), “For exchange-traded contracts, it is perfectly reasonable to net in this way because, unlike OTC contracts, exchange-traded contracts have standardized size and settlement dates and the same counterparty, i.e., the [clearinghouse].”
To compare derivatives activity between OTC and exchange markets, turnover data is considered a more appropriate measure than notional amounts. Turnover is defined as the gross value of new deals during a given period and measured in terms of the nominal or notional amount of contracts. BIS’ Triennial Central Bank Survey of Foreign Exchange and Derivatives Market Activity includes this data. A BIS study shows that when gauging derivatives activity based on turnover data, exchanges are two-thirds larger than OTC markets for a sample of advanced countries, while derivatives are traded in similar proportions in both markets for emerging countries (Mihaljek and Packer, 2010). However, using notional amounts outstanding, OTC derivatives were several times larger than those traded on exchanges—$633 trillion versus $54 trillion.

Most previous studies done on developed nations show that the futures market leads the spot market and therefore serves as the focal point for price discovery.

33
3. Risk, Price, and CostThis section examines the functions of derivatives and the costs and benefits associated with them. Our framework is meant to improve understanding of the reasons derivatives contracts are widely and increasingly used in financial markets. We focus on three major functions of derivatives: risk management, price discovery, and reducing transaction costs.
Their use impacts the overall economy, affecting firm value, investment opportunities, and credit availability. These effects will be assessed empirically in Part 4 of this study.
3.1 MANAGING RISK
Corporations are important players in derivatives markets. Non-financial firms typically use them to hedge market risk. Banks, while taking positions in derivatives to mitigate their own risk exposure, also make markets in these instruments to meet the risk management needs of their corporate customers. In return, they generate fee and other revenue from this trading and lower their cost of funding. We discuss how banks and non-financial firms use derivatives for risk management purposes in turn.
For banks, a means to hedge adverse rate change Banks act as intermediaries by allocating financial resources from savers (those with excess funds) to borrowers (those in need of funds, e.g., entrepreneurs and firms). In a traditional model, banks’ assets (such as mortgage and commercial loans) are long-term, while liabilities (such as demand deposits) have much shorter terms. A maturity mismatch between assets and liabilities subjects banks to interest rate risk. That is, a change in relative interest rates impacts banks’ earnings and returns because much of their profit comes from the difference between interest received on loans and interest paid on deposits.
Managing interest rate risk is essential for banks to be profitable and mitigate the danger of insolvency in a volatile interest rate environment.1 To reduce (or increase) their exposure, banks use interest rate derivatives.2 In a developed theoretical model, Diamond (1984) demonstrates that hedging interest rate risk through the derivatives markets lowers the probability of bank failure. Because bank loans are illiquid and monitoring loan contracts is costly, banks have incentives to use a variety of means to increase the net cost advantage of intermediation. The use of derivatives to help offset the mismatch of maturities
1. The maturity mismatch between assets and liabilities is often pointed to as a cause of many institutions’ insolvency during the savings and loan crisis in the late 1970s and early 1980s as U.S. interest rates spiked (see Barth, 1991). For a bank with more rate-sensitive (i.e., short-term) liabilities than assets, a rise in rates will reduce profits.
2. As an alternative, banks can adjust the duration of assets and liabilities (known as maturity or duration match). However, the costs can be very high in the short run. Since the mid-1980s, derivatives have been an increasingly important instrument for managing interest rate exposure because they do not require banks to adjust the maturities of assets and liabilities on their balance sheets.

34 DERIVING THE ECONOMIC IMPACT OF DERIVATIVES
can reduce the monitoring cost, and therefore enable banks to lend more effectively. The prediction from Diamond’s model is supported by later empirical studies. Brewer, Minton, and Moser (2000) and Brewer, Jackson, and Moser (2001), among others, find that hedged banks provide more efficient intermediation than unhedged banks. (Appendix 5 summarizes findings of related empirical studies.)
Table 1 shows that the majority of banks that participate in the derivatives market use interest rate derivative contracts. In fact, these account for 80 percent of total derivative notional amounts. Banks also use derivatives to hedge against unexpected movements in foreign-exchange rates and commodity prices. Credit risk is likewise relevant. Banks manage it by using derivatives to protect against the possibility that borrowers who invest in very uncertain projects can’t repay their loans. In the past decade, the total notional amounts of derivative contracts held by U.S. commercial banks have increased tremendously, rising from $71 trillion in 2003 to $227 trillion in 2012. The number of banks that participate in the derivatives market has also increased. In 2003, there were 650 banks in that group (7.8 percent of U.S. commercial banks), which had grown beyond 1,300 banks a decade later (18.7 percent).3
Types of derivatives used in the U.S. banking system
TA
BL
E 12003 2004 2005 2006 2007 2008 2009 2010 2011 2012
PROPORTION OF U.S. BANKS THAT USE DERIVATIVES*
Interest rate 6.6% 7.9% 9.9% 11.3% 12.1% 13.3% 14.5% 15.8% 16.7% 17.9%
Forex 1.1% 1.1% 1.1% 1.1% 1.1% 1.1% 1.1% 1.3% 1.2% 1.3%
Credit 0.4% 0.4% 0.4% 0.6% 0.6% 0.6% 0.7% 0.7% 0.6% 0.7%
Other 1.5% 1.7% 2.1% 2.0% 2.0% 1.7% 1.6% 1.5% 1.4% 1.4%
Number of banks 8,348 8,179 8,056 7,922 7,788 7,568 7,321 6,999 6,789 7,248
TOTAL NOTIONAL AMOUNT ($BILLIONS)
Interest rate 61,876 75,533 84,530 107,435 129,491 175,895 181,455 193,399 187,866 181,463
Forex 7,185 8,607 9,289 11,900 16,614 16,224 16,555 20,990 25,436 27,781
Credit 1,052 1,396 1,807 3,164 3,590 3,268 2,664 2,559 2,928 3,757
Other 1,001 2,347 5,822 9,020 15,863 16,029 20,716 31,658 14,759 13,998
Total 71,113 87,878 101,449 131,519 165,559 211,416 221,390 248,606 230,990 226,999
*Banks may use more than one type. Equity and commodity contracts are among the other categories. The 2012 data is as of the third quarter.
Sources: FDIC, Milken Institute.
3. The earliest data from the OCC’s Quarterly Report on Bank Trading and Derivatives Activities, published in 1998, show there were 447 banks using derivatives (about 4% of U.S. banks) with $33 trillion as the notional amount of all contracts.

35RISK, PRICE AND COST
Derivatives activity in the U.S. banking system is concentrated in a few large entities—93 percent of total notional amounts is held by four banks: JPMorgan Chase, Citibank, Bank of America, and Goldman Sachs. According to quarterly reports from the Office of the Comptroller of the Currency, more than 90 percent of total notional amounts are held for trading purposes. Research suggests that the main reasons for this concentration are the availability of economies of scale in hedging and participants’ strong preference for trading with highly rated, large dealer banks, which presumably pose lower counterparty risk (Purnanandam, 2007; see also Karfoul, 2008, for discussion). These rationales imply that large banks’ ability to provide risk management services on a large scale benefits corporate customers.
For non-financial firms, a flexible tool for hedgingThe literature on corporate risk-management theory is extensive and varied. The most widely cited determinants of corporate derivative use consider the costs of financial distress and risk (Smith and Stulz, 1985; Tufano, 1996; Bartram, Brown, and Fehle, 2009); taxes (Graham and Rogers, 2002; Donohoe, 2012); the underinvestment problem (Froot, et al. 1993; Chiorean, Donohoe, and Sougiannis, 2012); income smoothing (Barton, 2001); and principal-agent conflicts associated with managerial incentives (Mayers and Smith, 1987; Smith and Stulz, 1985). Mitigating the risk associated with each factor has implications not just for the firm but the overall economy.
Cash flow volatility, which can arise from adverse changes in interest rates, foreign exchange rates, and commodity and equity prices, can rob firms of the liquidity needed to meet fixed costs (Bartram, Brown, and Fehle, 2009). Strategies such as hedging can reduce the risk of missed obligations, thereby lowering the costs and likelihood of financial distress (Smith and Stulz, 1985). Similarly, Myers (1977) shows that hedging can reduce the probability of distress and the likelihood that equity holders will pass up potentially value-generating projects. These theories predict that firms with higher potential financial distress costs (i.e., are susceptible to cash flow volatility) are more likely than others to hedge with derivatives that mitigate financial risk. Furthermore, the tax code offers incentives for hedging cash-flow volatility and income. As shown by Graham and Rogers (2002), these incentives include larger debt capacity, increased interest tax deductions, and reduced tax liability.

36 DERIVING THE ECONOMIC IMPACT OF DERIVATIVES
AIRLINE
FUEL COST (IN US$ MILLIONS)
IN 2011
FUEL COST AS A % OF OPERATING
EXPENSE IN 2011
PERCENT FUEL HEDGED
IN 2012
FUEL EXPENSE SAVED BY HEDGING WITH DERIVATIVES
(US$ MILLION)
United 12,375 37% 31% 503
Delta 11,783 Not reported Not reported 420
American 8,304 33.2% 21% 335
Southwest 5,644 37.7% 50% Not reported
US Airways2 3,400 36% Not reported Not reported
Alaska 1,298 34% 50% $21.4
Source: Company 10-K filings hand collected by the Milken Institute
BACKGROUNDIn 1978, the Airline Deregulation Act passed the U.S. Congress, effectively removing all controls over domestic routes and fares for the first time and giving carriers the opportunity to operate as unregulated businesses. This also meant that the profitability and even survival of each airline was dependent on its ability to control costs. Considering that fuel is often an airline’s largest operating expense, the ability to manage unpredictable fuel costs aids the effort to diminish price fluctuations and stabilize cash flow, which in turn enables airlines to more accurately estimate budgets, forecast earnings, increase investment in physical capital and additional flights, and prevent out-of-control costs from being passed on to customers.
BENEFITS OF HEDGINGOne effective way to control fuel cost volatility is by hedging with fuel derivatives.1 Indeed, Southwest Airlines’ director of corporate finance once stated, “If we don’t hedge our jet fuel price risk, we are speculating. It is our fiduciary duty to try and hedge this risk.” This risk is substantial: United Airlines calculates that a $1 increase in the price per barrel of jet fuel increased operating expenses by $95 million in 2011. That year, six of the seven major airlines used fuel derivatives in various forms to manage risk. However, this practice rarely involves jet fuel itself due to the
illiquid nature of that market. Instead, airlines hedge fuels with high price correlations, such as heating and crude oil.
Table B shows the derivative positions of the major U.S. airlines for 2012, as well as the amount that hedging decreased the firm’s fuel expense in the preceding year. For United, this totaled a substantial $503 million in 2011.
Empirically, Carter, et al. (2006) find that jet fuel hedging is positively associated with airline firm value, noting that the so-called “hedging premium” is greater than 5 percent. They also find that this relationship increases capital investment, which is consistent with risk management theory that firms undertake hedging strategies to mitigate the underinvestment problem. This makes sense, given that when airlines face reduced cash flow due to higher fuel or other costs, their ability to invest in growth opportunities, such as purchasing new aircraft, is dramatically reduced. Hedging mitigates this risk, boosting investment and overall profitability.
The most common hedging instruments used by major U.S. airlines include both exchange-traded—futures and options—and OTC-traded derivatives. More specifically, airlines use forward contracts, futures contracts, and other types, including options, collars, and swaps. The latter three are most commonly used by the major carriers.
1. Airlines also use interest rate and foreign exchange derivatives to manage leverage and currency risk.2. US Airways stopped its hedging program in 2008.
Industry case study: AirlinesB
OX 3
Fuel use and hedging operations of major U.S. airlinesBTAB
LE
36 DERIVING THE ECONOMIC IMPACT OF DERIVATIVES

37RISK, PRICE AND COST
Firms with foreign operations, sales, inputs, and/or foreign-denominated debt are susceptible to adverse changes in currency values. Geczy, Minton, and Schrand (1997), in a sample of 372 firms with foreign-exchange exposure, find they primarily use currency derivatives to limit cash-flow fluctuations that may prevent them from investing in growth. Similarly, Allayannis and Ofek (2001), looking at 378 non-financial firms in the U.S., find that derivatives use reduces firms’ exchange rate risk and imply that such a strategy increases corporate value.
Theory suggests that hedging strategies can also alleviate underinvestment caused by insufficient cash flow. Froot, Scharfstein, and Stein (1993) argue that firm value is generated through investments in growth opportunities. However, a problem arises when firms reduce such investments rather than obtain costly external financing (Myers, 1977). Since cash flow can be disrupted by erratic movements in exchange rates, interest rates, and commodity prices, hedging these risks can shield cash flow, which can be channeled into growth opportunities. Thus, hedging can mitigate underinvestment, benefiting firm value (Myers and Majluf, 1984).
Several studies have empirically tested the underinvestment hypothesis, with mixed results. Positive correlations between derivative use and the mitigation of underinvestment are generally expected for firms positioned for swift growth. For example, studies find that derivatives users have greater research and development (R&D) expenditures and market-to-book ratios than firms that do not use derivatives (Nance, Smith, and Smithson, 1993; Geczy, Minton, and Schrand, 1997; Gay and Nam, 1998; Allayannis and Ofek, 2001; Lin and Smith, 2007). However, others do not find this relationship when accounting for sample size and composition, duration, and other proxies for growth (Allayannis, Brown, and Klapper, 2003; Bartram, Brown, and Fehle, 2009; Aretz and Bartram, 2010). Chiorean, Donohoe, and Sougiannis (2012) argue that the mixed results are due to issues of endogeneity and that growth opportunities and the wherewithal to invest effectively vary widely across firms.
Empirically, derivatives use by non-financial firms to manage risk is found to increase firm value4 via future expected cash flows (e.g., Gay and Nam, 1998; Allayannis and Weston, 2001; Kim, Mathur, and Nam, 2006; Mackay and Moeller, 2007). Such instruments benefit firms in other ways as well. For example, Gay, Lin, and Smith (2011) find that derivative-user firms enjoy a lower cost of capital and fewer financial constraints. Beneda (2013) reports a strong association between low earnings volatility and derivatives use. Jin and Jorion (2006) and Bartram, Brown, and Conrad (2011) find strong evidence that derivatives reduce firms’ risk and stock price volatility. Companies with higher value, lower cost of capital, and well-managed risk have better opportunities to make productive investments as a result of more efficient allocation of resources. This strengthens the overall economy.
4. See Part 4.2 for a detailed discussion of the relationship between non-financial firm derivative use and firm value, and Appendix 6 for a detailed summary of empirical studies on this issue.

38 DERIVING THE ECONOMIC IMPACT OF DERIVATIVES
The following examples illustrate how derivatives can help insulate cash flows from unexpected changes and alleviate the underinvestment problem.
FOREIGN EXCHANGE EXPOSUREThis year, U.S.-based Company X completed a credit sale of 2,800 euros to a German firm, with payment due three months later. At the time of sale, the price of a euro was $1.60. However, when the money was collected, the exchange rate had dropped to $1.40 per euro. That adverse change in the exchange rate would reduce expected cash flow by $560, or 13 percent of the sale originally valued at $4,480. Suppose that Company X decided to mitigate this risk through the use of derivatives. If the company, at the time of sale, invested in a derivative contract giving it the right to sell 2,800 euros at $1.60 each, it would have received $4,480 minus the cost of the contract.
INTEREST RATE EXPOSURE Suppose that in July, Company ABC will replace its $20 million of 8.5% bank notes that mature in September. The company is exposed to the possibility that interest rates may rise by September, thereby increasing borrowing costs. To mitigate this, the company buys Treasury note futures in September at a price established in July. For example, let’s assume that the price of Treasury note futures is quoted as 95.24 in July. Since the trading unit is a 10-year, $100,000 security, the company might sell 210 Treasury note futures to hedge the September debt issue. This would provide a hedge of 210 × $100,000 × 95.24% = $20,000,400. If interest rates rise, borrowing costs will go up because the company will have to sell notes at a higher interest rate. However, this loss will be offset by the gain produced by hedging the Treasury bond futures. It should be said, however, that if interest rates decline (causing bond prices to rise), the benefit of being able to issue debt at that lower rate will be offset by the loss from the futures contracts.
COMMODITY RISK EXPOSURE The Widget Co. knows that in about six months it will need to purchase 30,000 ounces of silver to fulfill an order for its most popular line of widgets. If the spot price for silver is $13 per ounce and the six-month futures price is $12 per ounce, then buying the futures contract would allow Widget Co. to lock in the 30,000 ounces at $12 each. Thus, Widget Co. will be able to close its futures position and buy 30,000 ounces of silver for $12 per ounce in six months, thereby reducing the company’s risk.
Firm hedging B
OX 4
38 DERIVING THE ECONOMIC IMPACT OF DERIVATIVES

39RISK, PRICE AND COST
BACKGROUNDThe prices of natural gas and oil can be volatile. In 2008, they reached historical high levels, then declined swiftly. This volatility represents a vulnerability for some energy companies, potentially affecting cash flow, which ultimately impacts production investment and employment. To reduce exposure to the price fluctuations of natural gas and oil, energy companies pursue hedging strategies to minimize the risk associated with their expected production, (in the case of oil and gas companies) and purchases (in the case of utilities).
BENEFITS OF HEDGINGSouthwestern Energy, an S&P 500 firm based in Houston, Texas, states in its SEC filings that it had commodity price hedges for 47 percent of its 2012 natural gas production (compared to 45 percent in 2009, 30 percent in 2010, and 52 percent in 2011). These risk management activities increased gas sales by $315.6 million in 2011, $290.3 million in 2010, and $587.8 million in 2009, the result of settled commodity transactions reflected in end product sales.
In written testimony provided to Congress in 2009 regarding derivatives market reform and transparency, the American Exploration & Production Council, America’s Natural Gas Alliance, and the Independent Petroleum Association of America submitted an impact assessment of Southwestern Energy’s derivatives use. Southwestern estimates the total impact of its hedging
strategy in terms of production investment, taxes, and employment. If the company did not hedge 48 percent of its estimated 2009 production, there would have been $700 million less available for investing, which would have resulted in the elimination of 240 shale wells from its Fayetteville program.1 This hedging activity adds value downstream, specifically revenue for royalty owners, operating expenses that generate economic activity, and state taxes, totaling $600 million in this example. Southwestern estimated that 1,000 oil and gas-related jobs would be directly created and 500 more indirectly.
Similarly, utility companies have testified to their use of derivatives and its effect on customers. Due to the volatility of natural gas and electricity prices, utilities hedge their risk with derivatives. Indeed, the CEOs of the National Rural Electric Cooperative Association and the Delaware Municipal Electric Corp. argue that eliminating derivatives would increase customers’ already high power bills because the cost of volatility would be passed along to them. For example, without derivatives, Delaware public power utilities would be exposed to as much as $5 million in higher costs annually. Thus, hedging with derivatives can help utilities manage their costs, which means lighter burdens on consumers.
It must be noted that energy companies, whether utilities or producers, use derivatives to varying extents—and some, Exxon Mobil for example, don’t use them at all.
1. At the time the report was presented, these numbers were estimates based on anticipated hedging operations. For 2009, 45 percent of production was hedged, generating $587 million.
Industry case study: Energy and utilities B
OX 5
39RISK, PRICE AND COST

40 DERIVING THE ECONOMIC IMPACT OF DERIVATIVES
3.2 PRICE DISCOVERY
The information that can be extracted from derivatives, such as price discovery, is another important benefit. In complete markets, trading on derivatives exchanges should reveal no new information to market participants since derivatives are redundant (Black and Scholes, 1973; Merton, 1973). The spot and derivatives markets should simultaneously reflect the same information. However, a lack of market completeness means that informed traders may prefer to own futures or options in lieu of the underlying assets, and this could reveal new information about price. Thus, price discovery refers to the use of derivatives prices (options or futures) to predict future cash market prices, information that can be applied by policymakers and central banks in decision-making as well as companies and banks in managing their risks.
Most previous studies done on developed nations show that the futures market leads the spot market and therefore serves as the focal point for price discovery. Chakravarty, Gulen, and Mayhew (2004) find that option prices on individual equities reflect market conditions more quickly and accurately than do the underlying assets. Similarly, Fleming, Ostdiek, and Whaley (1996), examining the S&P 500 stock index, index options and futures contracts, find that derivatives markets lead the spot market. Mizrach and Neely (2007), focusing on Treasury spot and futures markets, find that the 30-year futures contract contributes to price discovery in the Treasury market. And Reichsfeld and Roache (2011) find that commodity futures do indeed forecast spot prices. Such forecasting is important, particularly for policymakers in countries where the value of their resources can affect the terms of trade and levels of poverty and wealth.

41RISK, PRICE AND COST
BACKGROUNDFood manufacturers, such as ConAgra, Cargill, and Archer Daniels Midland (ADM), use derivatives to manage price risk for some of their principal ingredients and energy needs, as well as interest rate and foreign currency volatility. The inputs hedged most frequently are wheat, corn, oats, soybean oil, meat, and energy. The gains and losses from these strategies are reported as cost of sales.
BENEFITS OF HEDGINGADM’s financial reports detail its derivatives use and the motivation for its hedging strategy. Particular risk factors include the vulnerability of certain finished products to energy prices and the effects of rising commodity prices on production costs and operating results. Further, the company has subsidiaries in 75 countries that generate sales in local currencies, introducing foreign exchange risk.
To mitigate these risks, the company uses forward fixed-price purchase and sale contracts for agricultural commodities, forward foreign exchange rate contracts,
interest-rate swaps, and OTC options contracts. ADM frequently uses exchange-traded futures and OTC options to reduce the variability of cash flows associated with its corn purchasing needs. The company grinds more than 76 million bushels of that grain a month. Executives say these derivatives contracts have historically been “highly effective at offsetting changes in price movements of the underlying.”
For 2012, ADM realized $57 million in pretax gains on derivatives designated as hedging instruments, which was reported in earnings. This amount was $409 million in 2011, and in 2010 the company realized a loss of $141 million.
Other food processors document their derivatives as well. ConAgra, for example, realized net derivative gains of $74.8 million for fiscal 2013 (compared to a loss of $66.8 million in 2012 and a $35.1-million gain in 2011). All were reflected in overall corporate financial results, offsetting losses or gains in the primary business unit.
Industry case study: Food processorsB
OX 6
41RISK, PRICE AND COST

42 DERIVING THE ECONOMIC IMPACT OF DERIVATIVES
3.3 LIQUIDITY AND LOWER COSTS
An extra benefit of derivatives use is enhanced liquidity. As discussed by Acharya et al. (2009), the addition of derivatives to an underlying market can have several constructive effects. First, it brings in other players who use derivatives as a leveraged substitute for trading the underlying. Second, derivatives may cut transaction costs through narrower bid-ask spreads. Consequently, it is thought that spot markets with derivatives have more liquidity and lower transaction costs than markets without.
An intermediary may want to use the least expensive and most liquid and transparent market to hedge. At a given time, this may include customizable OTC derivatives, but at other times, standardized futures and options may provide the best alternative. For example, if an investor wants exposure to the S&P 500 but hopes to avoid the expense of purchasing all the underlying securities in the basket, he or she can trade index options and futures for the same exposure at lower cost.
In Table 2, we show the prevalence of derivatives by type for non-financial members of the S&P 500. This information, hand-gathered from each firm’s 10-K SEC filings for each year, details the types of derivatives used, whether foreign exchange, interest rate, commodity, credit, or equity. From 2003 to 2012, the number of non-financial firms in the S&P 500 that used derivatives grew by 17.3 percent, with firms that use foreign exchange derivatives accounting for most of the gains. That group increased from 50.2 percent to 63.5 percent of the index.
Types of derivatives used by non-financial firms in the S&P 500
TA
BL
E 2PROPORTION THAT USE DERIVATIVES*
Type 2003 2004 2005 2006 2007 2008 2009 2010 2011 2012
Foreign exchange 50.2% 51.4% 54.1% 55.5% 58.4% 60.1% 62.3% 63.9% 64.2% 63.5%
Interest rate 51.2% 51.0% 50.7% 52.4% 52.9% 50.5% 52.2% 53.6% 52.6% 47.8%
Commodity 26.9% 27.9% 29.6% 30.0% 31.0% 31.0% 31.3% 32.7% 32.9% 32.0%
Other 6.3% 6.3% 6.5% 7.0% 7.7% 7.9% 7.7% 8.4% 8.4% 8.2%
Total firms that use derivatives 307 315 325 331 343 345 351 361 358 360
*Non-financial firms may use more than one type, including equity and credit derivatives contracts.


Through the use of derivatives, real GDP is higher by 1.1 percent ($149.5 billion) from 2003 to 2012 than it would have been otherwise. Employment is boosted by 530,400 (0.6 percent) and industrial production 2.1 percent in 2012 by derivatives use.

45
4. Measuring Derivatives’ Impact EmpiricallyThe use of derivatives by banks and non-financial firms has an impact on economic growth, albeit indirectly and through different channels (see Box 7). Banks benefit from obtaining additional protection against interest rate, credit, and other market risks, which strengthen their financial position. Stronger banks can, in turn, provide more credit to the private sector. This positive relationship between derivatives use and lending activity is found in previous empirical work (e.g., Brewer, Minton, and Moser, 2000; Brewer, Jackson, and Moser, 2001; Cebenoyan and Strahan, 2004; Purnanandam, 2007; Altunbasa, Gambacortab, and Marques-Ibanezc, 2009; see detailed discussion below). By providing credit and channeling funds to productive sectors, banks perform an intermediation role. In economic literature, bank development (usually measured by the level of domestic credit relative to GDP) is identified as a determinant of long-term growth (see, for example, Levine and Zervos, 1998; Beck and Levine, 2004).
For non-financial firms, the use of derivatives for risk management is found to increase expected cash flows, and hence firm value (e.g., Gay and Nam, 1998; Allayannis and Weston, 2001; Kim, Mathur, and Nam, 2006; Mackay and Moeller, 2007). Such instruments benefit firms through other channels as well. For example, Gay, Lin, and Smith (2011) find that derivative-user firms have a lower cost of capital and fewer financial constraints. Jin and Jorion (2006) and Bartram, Brown, and Conrad (2011) find strong evidence that derivatives reduce firms’ risk and stock price volatility. Firms with higher value, lower cost of capital, and lower risk have greater opportunities to make more productive investments as a result of their efficient allocation of resources, and therefore spur stronger economic growth.
To assess the full impact of derivatives on the overall economy through these channels, we divide our empirical analysis into two steps. The first is estimating the impact of banks’ use of derivatives on lending (Part 4.1) and of non-financial firms’ use of derivatives on firm value (Part 4.2). In the second step, the effects of bank lending and firm value on economic growth are assessed using U.S. data. This step also combines impacts from previous estimations for a final assessment of derivatives’ impact on the U.S. economy (Part 4.3). While there are other ways in which derivatives can impact the economy, our quantitative assessment focuses specially on their impact on credit extension and firm value. To our knowledge, a study of derivatives use on the overall economy through these channels has not been done previously.

46 DERIVING THE ECONOMIC IMPACT OF DERIVATIVES
Participants in the derivatives markets are banks, non-bank financial institutions (asset managers, pension funds, hedge funds, insurance companies, and mortgage servicers), trading firms, individual investors, and governments. In addition to using derivatives for hedging purposes, these participants also use them to speculate and engage in arbitrage.
Figure B summarizes the channels through which the use of derivatives impacts overall economic activity as laid out in our empirical strategy in this section. For other indirect channels (that we do not assess quantitatively), see the discussion in Parts 2 and 3.
Financial institutions (particularly banks) and companies are the major players in the global derivatives market. Banks, while taking positions in derivatives to manage risk, also make markets in them although the nature of this activity is changing with the adoption of Basel III and implementation of the Volcker Rule. In the OTC derivatives markets, banks serve as intermediaries by matching two parties in a contract and/or serve
as dealers by taking the counterparty position. Non-financial firms are end users who for the most part use derivatives to hedge risk. Such instruments provide economic benefits through various channels (described in Figure B).
According to BIS statistics, financial institutions dominate global derivatives activity (92 percent of the notional amounts outstanding of OTC contracts). Of the total notional amounts, 27 percent represents activity in which financial institutions serve as active dealers, and they participate as end users in 65 percent of transactions. Non-financial customers worldwide hold about 8 percent, or about $45 trillion of the notional amounts outstanding (see Figure C).
Other data sources broaden the picture of participants in the derivatives markets. For example, in a 2010 Fitch Ratings survey on the use of credit derivatives by global banks, 43% said they hold derivatives for trading activities, 38% for hedging/credit risk management, and 32% for intermediary/market-making activities.
DERIVATIVES MARKET
Participants Banks and otherfinancial institutions Non-financial firms Others
(governments, investors, etc.)
Functions of derivatives* Hedge exposure to interest rate and credit risk
Hedge risk from operations(to reduce cost of capital, financialconstraint, and earnings volatility)
Hedge risk(to reduce borrowing costs and enhance portfolio performance)
Economic benefitsIncrease bank lending(allocate capital to the
productive sector)
Increase firm value(expand investment
and capital stock)Increase overall productivity
* Part 3 of this study discusses additional functions of derivatives and other channels through which they influence economic activity.
Who uses derivatives?B
OX 7
Channels of impactB
FIG
UR
E
46 DERIVING THE ECONOMIC IMPACT OF DERIVATIVES

47MEASURING DERIVATIVES’ IMPACT EMPIRICALLY
Note: According to BIS, reporting dealers are mainly commercial and investment banks and securities houses that are active dealers. Other financial institutions refer to financial end users. Non-financial participants are mainly firms and governments.
Source: BIS.
Non-financialcustomers
Reporting dealersOther financial
institutions 27%
65%
8%
Global OTC derivativesNotional amounts outstanding: $582 trillion (2012)
OTC derivatives by counterpartyC
FIG
UR
E
47MEASURING DERIVATIVES’ IMPACT EMPIRICALLY
The use of derivatives by banks and non-financial firms can also be grouped into other categories:
BANKS AND OTHER FINANCIAL INSTITUTIONS » 18.7% (about 1,300 banks) of U.S. commercial banks participate in the derivatives market as of 2012.
» 99.8% of the notional amounts of derivatives contracts are held by the top 25 U.S. commercial banks (Office of the Comptroller of the Currency [OCC], Q4 2012).
» 80% of derivatives instruments (by type of underlying asset) held by U.S. banks are interest rate derivatives (OCC, Q4 2012).
» 60.5% of derivatives instruments (by type of product) held by U.S. banks are swaps, 17.4% are forwards, and 14.2% are options.
NON-FINANCIAL FIRMS » 87%-89% of 416 non-financial firms in the S&P 500 report using derivatives.
» 92% of the world’s 500 largest companies manage their price risk by using derivatives (ISDA, 2009).
» 29 of the 30 companies that make up the Dow Jones Industrial Average use derivatives.

48 DERIVING THE ECONOMIC IMPACT OF DERIVATIVES
4.1 BOLSTERING BANK LENDING
Conceptual frameworkRisk management theories emphasize the benefit of hedging to reduce the expected costs of financial distress (Diamond, 1984; Smith and Stulz, 1985). The banking literature offers several explanations of how derivatives instruments enable banks to manage risk and financial distress while generating additional revenue, allowing them to provide more credit to the private sector.
As discussed and summarized in Purnanandam (2007), derivatives increase banks’ ability to raise external funding. These instruments reduce the maturity mismatch between assets and liabilities, thereby strengthening internal cash flow and capital position and improving creditworthiness. Derivatives use also makes it easier for banks to obtain funds from borrowings, which are uninsured. In many cases, banks may find it difficult to borrow when uninsured depositors and creditors are uncertain about the condition of the institution. This problem incurs agency costs (the principal-agent problem). Because hedging can minimize these costs (Diamond, 1984), banks that use derivatives should be able to raise uninsured funds more easily than those that do not. With these additional sources, banks engaged in hedging can use the funds obtained to invest or lend on a larger scale than non-hedged banks.
While many empirical studies focus on derivatives as a tool for firms’ risk management, relatively few consider their impact on bank lending. Those studies that do are concerned mainly with interest rate derivatives, credit derivatives, or other credit risk transfer products. Most of these studies, however, examine only the pre-crisis period. Our empirical assessment extends the literature by considering the crisis period as well.
Studies focusing on interest rate derivatives find robust evidence of a positive impact on bank lending (i.e., Brewer, Minton, and Moser, 2000; Brewer, Jackson, and Moser, 2001; Zhao and Moser, 2006). Their results suggest that interest rate derivatives (regardless of type, e.g., swaps, options, forwards, and futures) allow banks to increase lending at a higher rate than they would have otherwise. Purnanandam (2007) further analyzes whether this relationship holds under different economic conditions. He finds that lending volumes of derivatives-user banks are unaffected by changes in the macroeconomic environment (i.e., when the Federal Reserve tightens monetary policy). When such events occur, the impact is largely offset by the gain from having the hedge in place, requiring only minor operational adjustments by the bank. Purnanandam’s result confirms hedging theories that point to the benefits of derivatives as a buffer against downside risk.
The conclusion that credit derivatives and other credit risk transfer products increase bank lending is not as widespread as in the case of interest rate derivatives. While Goderis et al. (2007) and Altunbasa, Gambacortab, and Marques-Ibanezc (2009) find a positive impact, Hirtle (2009) finds only limited evidence that credit derivatives are associated with expanded bank lending. In particular, Hirtle finds a benefit only for credit extension to large corporate borrowers. Cebenoyan and Strahan (2004) find that credit risk management allows banks to lend more of their assets, but those banks also hold more risky loans. These studies, however, use different proxies for credit risk transfer instruments (see Appendix 5 for a detailed summary of these studies).1
1. Studies of credit derivatives/other credit risk transfer products have increased in recent years, focusing mainly on their role during the financial crisis and their impact on stability. See, for example, Nijskens and Wagner (2011), Norden, Buston, and Wagner (2011), Calistru (2012), Cyree, Huang, and Lindley (2012), and Rodriguez-Moreno, Mayordomo, and Peña (2013). See Appendix 5 for detailed findings of these studies.

49MEASURING DERIVATIVES’ IMPACT EMPIRICALLY
A positive relationship between derivatives and bank lending is supported by the data in Figure 8, which compares loan volume of U.S. banks that use derivatives to that of U.S. banks that do not. The great majority of loans are provided by banks that participate in the derivatives market. An econometric exercise below, which controls for characteristics such as size and equity-to-asset ratio, confirms this relationship.
Commercial and industrial (C&I) loan volume, by derivatives-user and non-user U.S. banks
FIG
UR
E
8
Note: Weighted average = SC&I loans/Stotal loans
Sources: FDIC, Milken Institute.
Derivatives-user banks
Non derivatives-user banks
$ billions
0
200
2003 2004 2005 2006 2007 2008 2009 2010 2011 2012
400
600
800
1,000
1,200
1,400
Derivatives-user banks
Non derivatives-user banks
Percent
2003 2004 2005 2006 2007 2008 2009 2010 2011 2012
0
5
10
15
20
25
Aggregated C&I loans Weighted average of C&I loans to total loans
Empirical model: Data and methodologyWe estimate the impact of derivatives on the growth of bank loans using a sample of FDIC-insured U.S. depository institutions. The data for bank-specific variables, which is available on a quarterly basis, are obtained from the Call Reports of Condition and Income that banks file with the Federal Reserve System.
The Call Reports provide information on the notional principal of derivatives that are classified by the type of instrument (e.g., swaps, forwards, futures, options, and credit derivatives) and hedged risk (e.g., interest rate, foreign exchange, and equity and commodity derivatives). Appendix 7 includes the bank variables from the Call Reports that we use in our analysis.
In the empirical work below, our sample includes banks with total assets greater than $500 million as of the third quarter of 2012, comprising 1,286 banks for the period Q1 2003–Q3 2012. Smaller banks with assets of less than $500 million generally do not participate in the derivatives market or hold a relatively small amount in derivatives notional value, and they account for an insignificant portion of the market. Specifically, 650 of 7,248 banks have assets less than $500 million and hold derivatives positions as of the third quarter of 2012. The combined notional amount of derivatives for these 650 banks is $12 billion, or 0.01% of the $227 trillion total for all U.S. banks.

50 DERIVING THE ECONOMIC IMPACT OF DERIVATIVES
We follow the literature by relating banks’ derivatives use to credit extension to commercial and industrial (C&I) borrowers. Brewer, Minton, and Moser (2000) use C&I loan growth to measure intermediary activity. They note that C&I loans present an important channel for credit flows between the financial and production sectors of the economy. Other studies also find a stronger linkage between derivatives and C&I loans, but less so for other loan types (e.g., Cebenoyan and Strahan 2004; Mahieu and Xu, 2007; Minton, Stulz, and Williamson, 2009; Deng, Elyasiani, and Mao, 2010). Drawing on Diamond’s (1984) model, which suggests that banks should hedge and invest in the areas where they can exploit their monitoring-based cost advantage, these studies point out that lending to C&I firms is more risky. Therefore, banks can benefit from hedging this loan type. To estimate the impact of derivatives on the growth of bank lending, we use a two-stage Heckman selection bias model. The problem of selection bias may arise because a bank’s C&I loan activity might affect its decisions about derivatives use. Also, the decision to issue loans and use derivatives may be made simultaneously.2 A two-stage Heckman procedure addresses this problem by controlling for self-selection of banks that enter into derivatives contracts.
The first stage of the model uses probit regressions to estimate the probability that banks will enter the derivatives market. From the first stage, an inverse Mills ratio (Lambda) is obtained and added to our full model (second stage) to control for this decision. Both stages of estimation control for bank-specific factors that previous research has found to be related to derivatives use and lending by banks. We report regression results from the first stage separately in Appendix 8. Summary statistics of all variables in the model are provided in this appendix as well.
For the second stage of the effect of derivatives on bank lending, the model specification is as follows:
Equation (1):
The dependent variable, Bank Lendingi,t, is the quarterly growth rate of C&I loans for bank i at period t [constructed from: ln(C&I loans)i,t - ln(C&I loans)i,t-1]. To test the impact of the use of derivatives instruments on lending, we regress the loan growth variable on various measures of bank participation in derivatives markets. Derivatives is derivatives usages, which is a binary variable with a value of 1 for a bank that reports a position in any type of derivative, and 0 otherwise. We also break down derivatives usages by type. Binary variables are created for interest rate, foreign exchange, credit, and equity and commodity derivatives (the latter two are combined into “Other derivatives” due to the relatively small notional amounts banks hold).
Additionally, we create a set of dummies to capture the use of different types of instruments, i.e., swaps, forwards, futures, options, and credit derivatives. In an additional analysis and robustness check section, we test the impact of the extent of banks’ derivatives use measured by the ratio of a bank’s notional amounts to its total assets. According to hedging theories discussed previously, we expect b1 to have a
2. See, for example, Carter and Sinkey (2000), who show empirically that a bank’s derivatives position involves an endogenous decision.

51MEASURING DERIVATIVES’ IMPACT EMPIRICALLY
positive sign. That is, derivatives-user banks can lend more because when these instruments are effectively employed to manage risk, banks reduce their probability of default, enabling them to expand lending.
Our regressions include a set of bank-specific factors, X i,t, which are total assets; equity-to-total assets ratio (Equity/TA); liquid assets-to-total assets ratio (Liquid/TA); net interest margin (NIM); return on average assets (ROA); and unused loan commitments-to-total assets ratio. By controlling for these bank characteristics, the coefficient of the derivatives variable captures their impact on lending activity, conditional on other factors affecting banks’ intermediation process.
Total assets are included to control for banks’ size. Since size has a highly skewed distribution in the sample—the total assets of the largest bank are $1.85 trillion, while the smallest bank has $500 million in assets (out of 1,286 sample banks)—we enter the size variable in the natural logarithm form (see Appendix Table 8.1). A bank’s capital, liquidity, and profitability positions reflect the conditions that determine its ability to lend. Healthier banks—those better capitalized, more liquid, and more profitable—are expected to lend more. Therefore, the coefficients of Equity/TA, Liquid/TA, NIM, and ROA are expected to have a positive sign. We also include banks’ unused loan commitments ratio. This variable relates to C&I lending because the majority of such loans are made under the loan commitment arrangement. Similar to the total assets variable, the unused commitments ratio enters regressions in the log form due to its highly skewed distribution. These bank control variables are lagged one year to minimize a reverse causality bias.
Lastly, the regressions control for bank- and time-fixed effects. Bank-fixed effects control for bank-specific differences in the error terms. Time-fixed effects (quarter-year dummies) take into account the variation of lending in different periods. Standard errors are clustered at the bank level. ɛi,t is an error term.
ResultsTable 3 reports the results of the second stage of the Heckman selection bias model. The result of Model 1 shows that derivatives use positively and significantly impacts growth of C&I loans at the 1 percent significance level. In Model 2, we decompose the derivatives-use variable into different types of hedged risks: interest rate derivatives, foreign exchange derivatives, credit derivatives, and other derivatives. Since interest rate derivatives are the primary type used in the banking system (80% of derivatives held by banks are interest rate derivatives as of Q3 2012), Model 2’s result, not surprisingly, shows a positive and significant coefficient only for interest rate derivatives.3 The results in this table suggest that interest rate derivatives allow banks to limit their risk from exposure to changing rates, thereby increasing their ability to provide credit. Banks that use derivatives are associated with a 0.95 percent increase in lending compared to banks that do not.
Derivatives’ positive impact on lending implies that banks receive a benefit from using derivatives to hedge. As noted by Brewer, Minton, and Moser (2000), when banks use derivatives to generate fee revenue from trading or speculating but not to aid lending, we should see a negative sign for the derivatives variable. In addition, in an unreported regression we find that both listed and unlisted derivatives increase bank lending. In other words, the result shows no significant difference in the coefficients of forwards, futures,
3. This result may not necessarily imply that banks benefit less from using derivatives to hedge other types of risks. In most cases, banks that hedge foreign exchange, commodity, equity and credit risks also hedge with interest rate derivatives.

52 DERIVING THE ECONOMIC IMPACT OF DERIVATIVES
swaps, and options, though the test for equality of coefficients between swaps and other instruments turns out to be significant in one case. This finding of swaps’ positive impact on lending can be expected given that they account for about 60 percent of derivatives held by banks.
For the bank-specific control variables, we find that banks with higher profits (measured by return on assets) and those with more unused loan commitments are more likely to expand their C&I loans. However, banks’ size and capital and liquidity ratios are not significant, while net interest margin has a negative impact. The unused loan commitments ratio is associated with the increase in C&I lending. The majority of C&I loans are made under the loan commitment arrangement, in which the bank is obliged to provide a specified loan amount to a customer firm upon request (as of February 2013, the Federal Reserve’s Survey of Terms of Business Lending shows 76.7 percent of C&I loans were made under commitment contracts). Therefore, banks with unused loan commitments are more likely to have higher C&I loan volumes reported on their balance sheets in the following period. As noted below, these bank-specific factors may have varied impacts on the growth of other loan types.
We perform several additional analyses and robustness checks. First, we examine the impact of the extent of derivatives activities, measured by the ratio of the notional values of derivatives contracts to total assets (Derivatives/total assets). We enter Derivatives/total assets in the log form, since the distribution of this variable is highly skewed; i.e., a relatively large portion of derivatives contracts are held by a small number of large banks. The results, reported in Appendix Table 9.1, confirm a positive relationship between banks’ derivatives holdings and their C&I lending.4
As discussed earlier, we focus on banks’ C&I lending growth because previous studies point to such loans as having greater exposure to credit and interest rate risk than other loan types. Nonetheless, we test the impact of derivatives use on the growth of total loans and other loan categories. For this second analysis, three estimations—with the dependent variable being growth of total loans, growth of consumer loans, and growth of real estate loans, respectively—are reported in Appendix Table 9.2.
In all three regressions, the coefficients of the derivatives use variable are positive but not significant at a conventional level. These results are consistent with Cebenoyan and Strahan (2004), who show that lending to commercial businesses is more risky than lending to consumer and residential real estate. Therefore, banks appear to benefit more from managing their credit risks on business loans. Nonetheless, real estate lending was perceived as more risky during the financial crisis, and further research should examine derivatives’ contribution to managing the risk associated with such lending, particularly in times of crisis. From our regressions, interestingly, banks’ equity capital and liquidity ratios are found to be a significant determinant of lending, suggesting that better-capitalized banks have more liquid assets and are able to lend more. Capital and liquidity ratios are not significant in the C&I loan growth regressions (Table 3).
4. We refer to the results in Table 3 as the main finding because we will use the estimated coefficients from Model 1, Table 3, to calculate the marginal effect of derivatives use by banks, which will later be combined with the marginal effect of derivatives use by non-financial firms. In addition, as discussed in Part 2, we recognize that notional values do not reflect the market risk of the derivatives contracts.

53MEASURING DERIVATIVES’ IMPACT EMPIRICALLY
Impact of derivatives use on U.S. bank lendingT
AB
LE 3
MODEL 1 MODEL 2
In(total assets) -2.659 -2.514
(1.625) (1.663)
Equity/total assets 0.140 0.133
(0.125) (0.126)
Net interest margin -1.138*** -1.165***
(0.307) (0.312)
Return on assets 0.422*** 0.423***
(0.092) (0.092)
Liquid/total assets -0.005 -0.007
(0.025) (0.024)
In(unused commitments/total assets) 2.295*** 2.335***
(0.536) (0.550)
Inverse Mills ratio 14.544*** 14.984***
(3.909) (4.027)
Use of derivatives 0.945***
(0.310)
Use of interest rate derivatives 1.229***
(0.356)
Use of foreign exchange derivatives -0.172
(0.870)
Use of other derivatives -0.821
(0.891)
Use of credit derivatives -0.253
(1.250)
Constant -18.110*** -18.483***
(4.352) (4.449)
Time-fixed effects Yes Yes
Bank-fixed effects Yes Yes
Number of observations 36,724 36,724
Number of banks 1,286 1,286
Note: The dependent variable is the growth of C&I loans. The main explanatory variable in Model 1 (Use of derivatives) is a dummy variable indicating 1 for derivatives use by a bank in a given quarter; 0 otherwise. The main explanatory variable in Model 2 is dummy variables indicating 1 for each derivative type in a given quarter; 0 otherwise. All explanatory variables are lagged one quarter. The reported results are from the second stage of the two-stage Heckman selection bias model, with correction for both bank- and time-fixed effects. Inverse Mills ratio is obtained from the first stage of the model (see Appendix 8). Clustered robust standard errors of the coefficients are included in parentheses. ***, **, and * indicate that the coefficients are statistically significant at 1%, 5%, and 10%, respectively.

54 DERIVING THE ECONOMIC IMPACT OF DERIVATIVES
Third, since our sample coverage includes the period of the U.S. subprime mortgage crisis, we test whether the relationship between derivatives use and bank lending differs in this period. For that purpose, we interact a crisis dummy with the derivatives variable. A coefficient of the interaction term captures the difference of the impact on derivatives users’ lending. A crisis dummy is assigned a value of 1 for the period from Q4 2007, at the onset of the crisis, to Q3 2009, and 0 otherwise. The regressions reported in Appendix Table 9.3 also look at impacts in the first year (Q4 2007 to Q3 2008) and the second year (Q4 2008 to Q3 2009) of the crisis.
The banking crisis that led to a decline in lending was among the main explanations for the prolonged nature of the recovery from the recent recession. In this additional analysis, we examine whether banks with (or without) derivatives contributed more to the drop. The difference in the effect of derivatives during bad times and good times is noted by Cyree, Huang, and Lindley (2012, p. 123), who write that “to the extent that derivatives act as a precautionary hedge against downside risk, the use of derivatives by depository institutions will be more valuable in bad times than in good times. Conversely, banks can construct a well-diversified portfolio of derivative securities to hedge against financial risks while concurrently providing dealing services to their customers.”5
The results shown in the Appendix Table 9.3 indicate that during the crisis period, C&I lending by derivatives-user banks was 0.11 to 0.68 percent higher than non-user banks (i.e., from Model 1: 1.142-1.032 = 0.11). This magnitude is considered relatively large when compared to the 1.71 percent average growth of C&I loans over the sample period. Banks that offered C&I loans faced increased demand for liquidity via credit lines drawn by corporate borrowers during the crisis (Ivashina and Scharfstein, 2010). These results imply that derivatives-user banks had less difficulty meeting these demands than non-users during the crisis. The findings are also in line with Purnanandam (2007) and Deng, Elyasiani, and Mao (2010), who argue that the lending policies of banks that participate in the derivatives market are less sensitive to unexpected changes in the economic environment. Therefore, they can continue their intermediation role during difficult times.
In an unreported set of regressions, we perform another robustness check by excluding failed banks from the sample. Some commentators argue that banks that participate in the derivatives markets take too much risk by pursuing reckless lending. If this is the case, our previous findings may be driven by the activities of banks that eventually failed and perhaps contributed to the financial system’s instability. However, we do not find this to be the case, as the estimated coefficient in the sample that excludes bank failures is not much different from the main results reported in Table 3.6
5. The authors use a sample of 335 commercial banks to test whether the market performance of those using derivatives instruments differed from those that did not between the high-growth period of 2003-05 and the low-growth period of 2007-09. They do not find evidence that derivatives “increased banks’ speculating behaviors and significantly contributed to the loss of value.”
6. The fact that the results changed little after we excluded failed banks may reflect that relatively few large and medium-sized banks did fail during the crisis (our sample includes banks with assets that exceed $500 million). Many, however, were bailed out. Our analysis does not separate out those banks.

55MEASURING DERIVATIVES’ IMPACT EMPIRICALLY
4.2 AUGMENTING THE VALUE OF NON-FINANCIAL FIRMS
Conceptual framework Although the literature on derivatives use by non-financial firms has grown in two decades, the effect on risk levels and market value is still not conclusive.7 This is not due to a lack of available data, which has increased greatly, but to mixed empirical results. For example, Guay (1999), sampling only firms that use derivatives, finds a decline in their total risk from interest rate changes, but no change in their market risk. Allayannis and Weston (2001) find that hedging exchange rate risk is associated with an increase in firm value (measured by Tobin’s Q) of about 4 percent, and Graham and Rodgers (2002) present evidence that hedging can add 1.1 percent to firm value by allowing firms to increase their debt capacity. Assessing this impact on the oil industry, MacKay and Moeller (2007) find that refiners who hedge increase firm value between 2 percent and 3 percent while Jin and Jorion (2006) find that the effect of hedging is not statistically significant. Looking at the airline industry, Carter, Rogers, and Simkins (2006) find that derivatives use elevates firm value between 5 percent and 10 percent. However, Guay and Kothari (2003) find that the magnitude of cash flows generated by derivatives use is small and not likely to account for large changes in firm value.
Bartram, Brown, and Conrad (2011) and others have suggested that the main problems in these earlier studies arise from endogeneity. That is, significant differences in both risk measures and corporate value between firms that hedge and those that do not could be due to omitted variable bias. They find, while controlling for selection bias via propensity matching and Heckman specification, strong evidence that derivatives use reduces total risk and increases firm value.
In the following empirical assessment, we replicate prior research on the effect of total derivatives use, as well as foreign exchange derivatives use, on firm value. Further, we extend the research by assessing the impact of derivatives use on firm value during periods of heightened risk, such as the recent financial crisis and economic downturn.
Empirical model: Data and methodologyWe estimate the impact of derivatives on firm value using a sample of all non-financial firms in the S&P 500 for the period 2003-2012.8 Of the 500 listed companies, 416 are non-financial. These firms come from a range of industries, including information technology, utilities, and consumer goods. The data for firm-specific derivatives use was hand collected from 10-K filings with the SEC, while all other firm-specific variables were downloaded from Bloomberg.
Hedging information is typically disclosed in two sections of a firm’s 10-K report. The first is “Item 7A. Quantitative and Qualitative Disclosures About Market Risk.” The second is the “Notes to Consolidated Financial Statements.” The information provided includes data on the notional amount of derivatives that is further disaggregated by hedged risk (including foreign exchange, interest rate, commodity, and equity), as well as derivative type (forward, option, swap, or futures).
7. Refer to the literature review table in Appendix 6 for a complete summary.8. We include only firms that were part of the index as of 2012.

56 DERIVING THE ECONOMIC IMPACT OF DERIVATIVES
We follow the literature by relating non-financial firms’ derivatives use to firm value, typically measured by Tobin’s Q. This is defined as the ratio of total assets minus the book value of equity plus the market value of equity to the book value of assets. Similar to Allayannis, Lel, and Miller (2007), we take the market-to-book ratio as a proxy for Tobin’s Q.
To estimate the impact of non-financial firms’ derivatives use on firm value, we use a two-stage Heckman selection bias model. The problem of selection bias may arise because internal decisions that affect firm value can be related to the decision to hedge with derivatives—decisions that can be made simultaneously. The two-stage Heckman procedure addresses this problem by controlling for the self-selection of firms that enter into derivatives contracts.9
Similar to the bank derivatives use estimation model detailed in Part 4.1, the first stage uses probit regressions to estimate the decision of a firm to enter the derivatives market. From the first stage, an inverse Mills ratio (Lambda) is obtained and added to our full model (second stage) to control for this decision. Both stages of estimation control for firm-specific factors that previous research has found to be related to derivatives use and firm value. We report regression results from the first stage separately in Appendix Table 10.2. Summary statistics of all variables in the model are provided in Appendix Table 10.1.
For the second stage of the effect of non-financial firm derivatives use on firm value, the model specification follows:
For the dependent variable, Firm Valuei,t, we take the market-to-book ratio (see Allayannis, Lel, and Miller, 2007, and Allayannis and Weston, 2001) as a proxy for Tobin’s Q. Due to the skewedness of its distribution— the median value is 2.7 while the mean is 3.2—we take the natural log of Tobin’s Q.
Our main explanatory variable, Derivatives, is a binary variable with a value of 1 if a firm reports derivatives use of any type in a given year, 0 otherwise. We also disaggregate derivatives by risk category. Binary variables are created for foreign exchange rate, interest rate, equity, and commodity derivatives. This variable is lagged one year.
Our regressions control for a set of firm-specific factors: Xi,t, which is total assets; ROA; the debt-to-equity ratio; capital expenditures to sales; and R&D-to-sales.10 By controlling for these characteristics, the coefficient of the derivatives variable captures the impact of derivatives use on firm value, all other factors being equal. All control variables enter the regression lagged one year to minimize reverse causality bias.
9. This approach to address selection bias is similar to others in the recent literature, including Allayannis, Lel, and Miller (2007), and Bartram, Brown, and Conrad (2011), who use propensity score matching and/or selection bias techniques akin to that of Heckman.
10. See Table Appendix 10.1 for summary statistics of all variables.

57MEASURING DERIVATIVES’ IMPACT EMPIRICALLY
» Size: Firm size has been shown to affect firm value (Mueller, 1987, and Peltzman, 1977), and larger firms are more likely to use derivatives than smaller firms. Thus, we include total assets to control for firm size. Because the distribution for size is highly skewed—the median value is $9.4 billion and the mean is $25.4 billion—we take the size control variable in its logarithmic form.
» Leverage: We control for leverage because a firm’s capital structure may affect its value. Leverage is defined as the ratio of total debt to shareholder equity (commonly referred to as the debt-to-equity ratio). That ratio is highly skewed in our sample (the median ratio is 49.2 and the mean is 115.9), so we take the variable in its logarithmic form.
» Profit: More profitable firms are more likely to have higher firm value. We control for profitability by using a firm’s ROA, measured as the ratio of net income to total assets.
» Growth opportunities: Because firm value may depend on future investment opportunities (Myers, 1977), and firms with better growth opportunities are more likely to be hedgers (Froot, Scharfenstein, and Stein, 1993, and Geczy, Minton, and Schrand, 1997), we control for a firm’s investment opportunities. Like Allayannis and Weston (2001) and Allayannis, Lel, and Miller (2007), to capture this variable we include the ratios of capital expenditures to sales and research and development expenditures to sales. Where values are missing, we assume the amounts to be zero.
» Industry effects:11 Firms that use derivatives may be concentrated in high-value sectors (such as energy or industrials). If this is the case, hedging firms would have higher values, not because of derivatives use but because of their industry. We control for industry effects by including the two-digit SIC codes.
» Time effects: We include time-fixed effects (year dummies) to account for the variation in firm value for different periods.
ResultsTable 4 presents the results of the second stage of the Heckman selection bias model. The result of Model 1 shows that derivatives use has a positive and significant impact on firm value for the non-financial firms in the S&P 500 at the 10 percent level. The coefficient of 0.052 indicates that non-financial firms that hedge with derivatives are valued 5.2 percent higher than firms that do not, all other things being equal.
Following other literature assessing firm value and derivatives, in Model 2 we look at the use of foreign exchange derivatives by non-financial firms with foreign sales (Kim, Mathur, and Nam, 2006; Allayannis, Lel, and Miller, 2007; Gay, Lin, and Smith, 2011; Bartram, Brown, and Conrad, 2011). Foreign exchange derivatives are used by the majority of non-financial firms (64 percent in 2012) to manage exchange rate risk.12 Thus, it is not surprising that Model 2’s results show that the use of derivatives by non-financial firms with foreign sales is positively and significantly associated with higher firm value on the order of 5 percent. This benefit that derivatives use has on firm value can be referred to as the hedging premium. Allayannis and Weston (2001) note that investors are likely to reward firms for derivatives use with higher valuations in the marketplace.
11. We include industry effects as opposed to firm effects due to multicollinearity and to be consistent with the literature. Our standard errors are clustered on individual firms.12. In an unreported regression we also looked at the impact of the use of foreign exchange derivatives on the value of firms without foreign sales. The results are
negative and not statistically significant.

58 DERIVING THE ECONOMIC IMPACT OF DERIVATIVES
Derivatives use and firm valueT
AB
LE 4
MODEL 1MODEL 2
FOREIGN SALES > 0
In(total assets) -0.137*** -0.110***
(0.010) (0.015)
In(debt-to-equity ratio) 0.085*** 0.104***
(0.012) (0.014)
Return on assets 0.033*** 0.031***
(0.003) (0.003)
Capital expenditures to sales -0.003*** -0.005***
(0.001) (0.001)
R&D-to-sales 0.019*** 0.020***
(0.002) (0.002)
Inverse Mills ratio 0.110 0.856**
(0.103) (0.348)
Use of derivatives 0.052*
(0.028)
Use of foreign exchange derivatives 0.050**
(0.026)
Constant 1.735*** 1.220***
(0.134) (0.275)
Time-fixed effects Yes Yes
Industry-fixed effects Yes Yes
Number of observations 3,273 2,552
Note: The dependent variable is firm value, measured as the natural log of the market-to-book ratio. The main explanatory variable in Model 1 (Use of derivatives) is a dummy variable indicating 1 for derivatives use by a non-financial firm in a given year; 0 otherwise. The main explanatory variable in Model 2 is dummy variables indicating 1 for the use of foreign exchange derivatives by a non-financial firm in a given year; 0 otherwise. All explanatory variables are lagged one year. The reported results are from the second stage of the two-stage Heckman selection bias model, with correction for both industry- and time-fixed effects. Inverse Mills ratio is obtained from the first stage of the model (see Appendix 10). Clustered robust standard errors of the coefficients are included in parentheses. ***, **, and * indicate that the coefficients are statistically significant at 1%, 5%, and 10%, respectively.
For the non-financial firm-specific control variables in Models 1 and 2, we find that firms with higher leverage (measured by the debt-to-equity ratio), profits (return on assets), and investment opportunities (R&D-to-sales) are likely to have higher firm values. Both size (measured by total assets) and investment opportunities (capital expenditures to sales) were statistically significant yet negative. The negative sign for size is in line with previous studies (Lang and Stulz, 1994; Allayannis and Weston, 2001) and may indicate that larger firms grow at a slower rate than smaller firms, and since investors pay a premium for high growth rates, this discrepancy may be reflected in firm value. While the negative result for the ratio of capital expenditures to sales is surprising, it could be partly explained if firms are controlled by large shareholders and any negative impact of overinvestment (Schleifer and Vishny, 1997).
We conducted several additional analyses and robustness checks. First, we examined whether derivatives use by non-financial firms has an impact on another proxy for growth opportunities: cash flow. As stated in Part 3, reduced cash flow can constrain future investment and the pursuit of growth. The results are

59MEASURING DERIVATIVES’ IMPACT EMPIRICALLY
reported in Appendix Table 11.1, Model 1. As with firm value, the impact of derivatives on cash flow is positive, but the result is statistically insignificant. However, unreported results show that when only crisis years are included, the results are positive and statistically significant.
Second, in a model assessing firm value, we included only observations in which the firm value (measured as the market-to-book ratio) is greater than 0. Some firms in our baseline sample have negative market-to-book ratios, especially during crisis years. This negative value, potentially indicating that a company incurred a string of losses, essentially renders the ratio meaningless. The results in Appendix Table 11.1, Model 2, show that results are similar to our baseline model, indicating that the removal of the negative observations is unnecessary.
Third, our baseline sample includes the period of the financial crisis and economic downturn. Therefore, we test whether the relationship between derivatives use and firm value differs during this time. Summary statistics show that the mean firm value for non-crisis years (2003-07) was 4.344, while mean firm value during the financial crisis and economic downturn (2008-12) was 2.022—less than half the mean of the preceding four years. Considering that firms use derivatives to minimize cash flow volatility associated with underlying risk, it makes sense to assess their effect on firm value during the economic downturn (an inherently risky time) compared to non-crisis years.
We divide the sample into two periods: 2003-07 and 2008-12. The latter years incorporate the financial crisis and subsequent anemic recovery. The results, shown in Appendix Table 11.2, Models 1 and 2, indicate that during both periods the impact of derivatives use on non-financial firm value is positive, but statistically and economically significant only during the crisis and subsequent downturn, clearly demonstrating a risk management function.
4.3 OVERALL IMPACT ON THE U.S. ECONOMY
The next step is to investigate the impacts of bank lending and firm value on economic growth. The resulting estimates will be combined with those obtained from the previous two subsections—the impacts of derivatives use on bank lending and firm value. This final operation will allow us to assess their overall impact on the U.S. economy via these channels.
An empirical analysis examining the relationships among bank lending, firm value, and economic growth is built on the finance-growth literature. Previous studies have used both cross-country analysis (e.g., Beck and Levine, 2004) and the time-series approach (e.g., Colombage, 2009) to study the linkage between financial development (banking sector and stock market development) and economic performance. Because our analysis in Parts 4.1 and 4.2 employed U.S. data, we use time-series econometrics (the vector autoregressive [VAR] model), which tests the causality pattern between economic growth and other variables for an individual country over time.
In the VAR model, we include three variables using quarterly data from Q1 2003 to Q3 2012. The first is real gross domestic product (GDP) as a measure of overall economic activity. U.S. real GDP data is

60 DERIVING THE ECONOMIC IMPACT OF DERIVATIVES
obtained from the Bureau of Economic Analysis. The second is bank lending, which is captured by the weighted C&I loans of the sample banks.13 As noted earlier in this section, many empirical studies have found a positive association between economic development and bank development (commonly proxied by the extent to which banks provide credit to the private sector).14 Our study focuses particularly on banks’ lending to business (C&I loans) because previous studies such as Driscoll (2004) point out that this loan type is likely to be most relevant to productive investment and output growth and because we find that derivatives use facilitates greater C&I lending by banks. The third variable is the average market-to-book (M/B) value of non-financial firms in the S&P 500, which is a proxy for firm value. Although not a direct measure of investment and production, M/B value captures a firm’s growth prospects.
The VAR technique treats variables in the model as potentially endogenous. Therefore, it allows us to evaluate the relationships without the need for prior knowledge about the direction of the variables’ causality. Testing the existence of a statistical relationship among the three variables involves three steps: testing for stationarity, testing for co-integration or a long-run equilibrium relationship, and performing the VAR model (or the vector error correction model if the variables are co-integrated). Appendix 12 provides a detailed discussion and findings for each step.
In sum, the VAR estimation suggests that 1 percent growth in banks’ C&I loans is associated with an increase in quarterly real GDP growth by 0.013 percent. With alternative model specifications, this impact ranges from 0.008 to 0.20 percent. Regarding the impact of firm value (M/B), the VAR estimation suggests that a 1-unit increase in firms’ M/B is associated with an increase in quarterly real GDP growth of 0.043 percent. With alternative model specifications, this impact ranges from 0.039 percent to 0.6 percent. (See Appendix Tables 12.3 and 12.4.)
In the last step, we provide the final assessment of the overall impacts of derivatives on the U.S. economy via their use by banks and non-financial firms. Table 5 summarizes these impacts based on the main results. It shows the estimated marginal effect of derivatives use on bank lending and how that contributes to economic growth. It also demonstrates the impact of derivatives use by non-financial firms on firm value, and the extent that firm value is associated with economic growth. The aggregation of these estimates is equivalent to the broader impact of derivatives use on the U.S. economy. Since we also run several sensitivity analyses and each model yields a slightly different estimated coefficient, we also summarize these effects and report the overall impacts in ranges, which are shown in Table 6.
Key findings: Banks’ use of derivatives expands U.S. quarterly real GDP by 0.008 percent to 0.025 percent, or about $1.1 billion to $3.6 billion, each quarter from Q1 2003 to Q3 2012. Over this period, U.S. real GDP grows $66 billion per quarter on average.
13. C&I loans for each bank is weighted by the bank’s assets (weight = assets of bank i/total assets of all sample banks) before aggregated across all sample banks in each quarter over the sample period.
14. The literature emphasizes banks’ important role in mobilizing financial resources to fund investment opportunities, thereby enhancing economic performance. See Levine (2005) for discussion and literature review. Nonetheless, the direction of the causality between bank development and economic development is not conclusive. Some studies find that financial development promotes economic growth, while others find that economic growth stimulates financial development, or the relationship is bidirectional.

61MEASURING DERIVATIVES’ IMPACT EMPIRICALLY
We find that derivatives use by non-financial firms increases U.S. quarterly real GDP by 0.002 percent to 0.03 percent, or about $300 million to $4.5 billion each quarter from Q1 2003 to Q3 2012. Taken together, the overall impact of derivatives use by banks and non-financial firms expands U.S. quarterly real GDP growth by $1.4 billion to $8.1 billion each quarter from Q1 2003 to Q3 2012.
Derivatives and growth
TA
BL
E 5
SAMPLE PERIOD: Q1 2003 – Q3 2012
ESTIMATED MARGINAL
EFFECTIMPACT PER QUARTER
(IN DOLLARS)
Impact of banks’ derivatives use
Marginal impact of derivatives use on bank lending (Table 3) 0.945
Marginal impact of bank lending on economic growth (Appendix Table 12.3) 0.013
Overall impact of banks’ derivatives use on economic growth 0.012 +$1.8 billion
Impact of non-financial firms’ derivatives use
Marginal impact of derivatives use on firm value (Table 4) 0.052
Marginal impact of firm value on economic growth (Appendix Table 12.3) 0.00043
Overall impact of non-financial firms’ use of derivatives on economic growth 0.00002 +$0.3 billion
Overall impact of derivatives use on U.S. economic growth +$1.4 billion
(U.S. real GDP grows $66 billion per quarter on average)
Ranges of overall impact
TA
BL
E 6SAMPLE PERIOD: Q1 2003 – Q3 2012
ESTIMATED MARGINAL
EFFECT
IMPACT PER QUARTER (IN DOLLARS)
Overall impact of banks’ use of derivatives on economic growth † 0.008-0.025 +$1.1 billion to $3.6 billion
Overall impact of non-financial firms’ use of derivatives on economic growth†† 0.00002-0.0003 +$0.3 billion to $4.5 billion
Overall impact of derivatives use on U.S. economic growth From +$1.4 billion to $8.1 billion
(U.S. real GDP grows $66 billion per quarter on average)
† Marginal effects of derivatives use on bank lending are from Table 3 (0.945 from Model 1 and 1.229 from Model 2). Marginal effects of bank lending on economic growth are from Appendix Table 12.4.
†† Marginal effects of derivatives use on firm value are from Table 4 (.052 from Model 1). Marginal effects of firm value on economic growth are from Appendix Table 12.4.
62 DERIVING THE ECONOMIC IMPACT OF DERIVATIVES
Macroeconomic model counterfactual simulationsTo test the validity and robustness of the VAR estimates of derivatives’ use on overall U.S. economic performance, we used a dynamic macroeconometric equilibrium growth model. This allows us to provide alternative estimates of the resulting changes in investment, industrial production, employment, wages and incomes, consumption, and real GDP growth attributable to the use of derivatives products. We can quantify these changes by comparing actual performance to a counterfactual simulation in which banks and non-financial firms don’t use derivatives products from 2003 to 2012.
In growth models such as the one used in this analysis,15 the expansion rate of technical progress, the available human capital, and the physical capital stock determine the productive potential of an economy. Both technical progress and the capital stock are governed by investment, which in turn must be in balance with post-tax capital costs, available savings, and the capacity requirements of current spending. The capacity to supply goods and services is tied to a production function combining the basic inputs of labor hours, energy use, business equipment and structures, and government infrastructure. The “total factor productivity” of this composite of tangible inputs is driven by expenditures on research and development that produce technological progress.
The first channel involved in estimating the broad economic impact is bank lending (effect of derivatives use on the provision of commercial and industrial loans) to the business sector. Small and medium-sized enterprises rely heavily on C&I loans to expand productive capacity. Based on the bank lending results from Part 4.1, we removed the incremental C&I loans attributable to banks’ use of derivatives and resolved the macro-model. Real private investment in equipment and structures respond to changes in commercial and industrial loans with a mean lag of two to four quarters. The elasticity of investment with respect to such loans is 0.4, meaning that a sustained 10 percent increase in bank lending translates into a 4 percent increase in private investment, holding other factors constant. The resulting counterfactual simulation shows real GDP being 0.8 percent higher ($108.7 billion) in 2012 through additional bank lending enabled by derivatives use.
The second channel generating broad economic impact is the effect of derivatives use on the value of non-financial firms. We removed the higher valuation attributable to derivatives use based on the results of Part 4.2 and resolved the macro-model. In that case, private investment is reduced as firms are less confident and hesitate to expand capacity. This ripples through the economy and causes a broader decline in economic activity. The counterfactual simulation results depict real GDP being 0.3 percent higher ($40.8 billion) in 2012 based on non-financial firms’ use of derivatives.
Combining these two simulations yields compelling results that are consistent with the VAR estimates. Through the use of derivatives, real GDP is higher by 1.1 percent ($149.5 billion) from 2003 to 2012 than it would have been otherwise. Employment is boosted by 530,400 (0.6 percent) and industrial production 2.1 percent in 2012 by derivatives use. The $3.7-billion overall impact of derivatives use on quarterly U.S. economic growth compares to the $1.4 billion from Table 5 and the ranges of $1.4 billion to $8.1 billion
15. The Oxford Economics Global Macro Model was used to perform these counterfactual historical simulations. This model has evolved over 30 years in response to changing structural relationships in the macroeconomic environment.

63MEASURING DERIVATIVES’ IMPACT EMPIRICALLY
from Table 6. A higher estimate from a dynamic macroeconomic model seems reasonable because it includes all the feedbacks on the U.S. economy. The macro-model results suggest that the $1.4-billion VAR estimate could be interpreted as conservative.
4.4 WHAT FUTURES DO FOR THE ECONOMY
In the aftermath of the global financial crisis, there have been calls for reform of the OTC derivatives market. The principal objectives behind these regulatory developments are to increase transparency and reduce counterparty risks, therefore preventing the misuse of OTC derivatives and averting another crisis. Clearing is an important component of the push for reform. As noted by Fung and Webb (2012):
The push for mandatory clearing of OTC traded derivatives is as much a result of the long history of success of exchange traded derivative markets in minimizing counterparty risk and promoting transparency as the presumed failure of certain OTC traded derivative markets to handle counterparty risk during the recent financial crisis. Simply stated, exchange traded derivative markets worked well during the crisis while some OTC derivatives markets either did not or appeared not to work well (p. 9).
They continued:
Mandatory clearing in futures markets, for instance, has made defaults relatively rare and market prices more transparent. Not surprisingly, a common view of how centralized clearing would operate in the OTC derivatives markets mirrors how existing futures clearinghouses operate and manage risk (that is, through imposing margin requirements and daily marking to market of outstanding positions) (p. 9).
In addition to their constructive role during the crisis, exchange-traded derivatives products perform two important functions: risk management and price discovery. Their use is beneficial to banks, non-financial firms, and other economic agents such as producers, consumers, exporters, and importers as they anticipate the future prices of goods and seek to lock in favorable prices.
Taking these benefits into account, we additionally perform an in-depth analysis to examine the economic advantages of exchange-traded derivatives products following the same empirical strategy discussed earlier. We also evaluate the impact of the use of futures contracts on U.S. GDP growth, using a counterfactual approach.
In our empirical analysis, we examine the role of futures contracts during the financial crisis. Many critics and commentators point to the need to distinguish among different types of derivatives and the roles each played during the crisis. They clearly identified specific types of swaps and structured financial products, such as synthetic collateral debt obligations, as the culprits that caused or exacerbated the economic distress (e.g., Litan, Brookings Paper, February 17, 2010, and Surowiecki, the New Yorker, May 17, 2010). No critics have suggested that futures markets played a role. Recent studies, on the other hand, document the benefits of exchange-traded derivatives after the onset of the financial crisis. Specifically, Yang and Baek

64 DERIVING THE ECONOMIC IMPACT OF DERIVATIVES
(2013) find that the trading volume of exchange derivatives in their sample of major U.S. banks and trust companies increased the institutions’ return on assets and enterprise value from 2007 to 2011.
In our effort to discern the relationship of futures to overall economic performance through the impacts of banks and non-financial firms that use such contracts, we encountered several methodological challenges. In the case of bank lending, for example, just 3 percent of observations report a futures position between Q1 2003 and Q3 2012. Because of this small number of observations, standard tests of significance may be overly restrictive. Even if conventional tests are not met, there may indeed be some efficacy in the associations. Additionally, fewer non-financial firms use futures than other types of derivatives products. To estimate the impact of futures on U.S. economic growth, we first estimate equations (1) and (2) by replacing the total derivatives use variable with futures use—a binary variable with a value of 1 for a bank or non-financial firm that reports a futures position, and 0 otherwise. Appendix 13 reports regression results for the sample period and crisis period.
The use of futures contracts has a positive sign in all regressions, suggesting that futures provide risk management benefits to banks and non-financial firms, which allows banks to extend more loans and firms to pursue greater investment opportunities. Indeed, while the estimated coefficients of the futures use variable do not pass conventional tests of significance, they are nonetheless meaningful as a guideline for users, policymakers, and other stakeholders to see futures’ benefits for the broader economy.
In an econometric setting, therefore, the impacts on bank lending and firm value may be largely driven by the use of other types of derivatives, while some of that explanatory power might accrue to exchange-traded products. The coefficients may become significant with additional entities using more exchange-traded derivative products. In other words, since we use a dichotomous variable in our empirical models, as opposed to notional amounts, we simply capture the impact of the use of futures contracts as a risk management tool in general, and that impact may be more apparent with increasing use.
The use of a binary variable to capture users and non-users of futures contracts further permits us to analyze the counterfactual impacts on bank lending and firm value. This approach gives predicted values of the growth of bank lending and firm value by simulating the case in which all sample banks participated in futures markets and the case in which none did. It therefore indicates the extent to which non-user banks may lend more if they did use futures, and the extent to which non-financial firms may increase their value if they participated in that market.
The counterfactual effects are presented in Table 7. Interpreting these results, the predicted growth of bank lending, for example, increased from 1.69 percent per quarter if no banks used futures contracts to 2.47 percent if they all participated in the futures market. Firm value is also slightly higher with all firms using futures to manage risk exposure than when none were used.
The more striking result of this counterfactual analysis points to the benefit of futures during the financial crisis. The predicted growth of bank lending and firm value are much higher for futures users than non-users in this period. For bank lending, predicted growth increased from 1.27 percent to 5.04 percent per quarter if all sample banks hedged risk with futures contracts. In the case of non-financial firms,

65MEASURING DERIVATIVES’ IMPACT EMPIRICALLY
the predicted average market-to-book ratio increased from 2.382 to 2.488 if all those in the sample used futures. (Note that the difference in the counterfactual effect for non-financial firms is not trivial, since the standard deviation of market-to-book ratios in the sample is much smaller than that of loan growth.)16
In sum, the analysis suggests that futures contracts are an effective risk management instrument. By engaging in futures activities, banks and non-financial firms can expand their operations, generating more output and contributing to economic growth and development.
Counterfactual effects
TA
BL
E 7FULL SAMPLE PERIOD CRISIS PERIOD
PREDICTED IMPACT IF PREDICTED IMPACT IF
All firms use futures
None of the firms use
futures
Difference (percentage
point)
All firms use futures
None of the firms use
futures
Difference (percentage
point)
Impact on bank lending (quarterly)
2.47% 1.69% 0.78 5.04% 1.27% 3.77
Impact on non-financial firms’ M/B ratios (annually)
2.953 2.950 0.003 2.488 2.382 0.106
Note: The counterfactual effects on bank lending and firm value are calculated based on regression results reported in Appendix tables 13.1 and 13.2, respectively. For each table, Model 1 is used for the full sample period and Model 2 for the crisis period.
After obtaining the marginal effects of the futures use variable on both bank lending and firm value regressions, we combine them with the estimated effects of bank lending and firm value on economic growth, following the same process described in Part 4.3. These steps allow us to assess the total impact of futures contract use on the broader U.S. economy. The findings are summarized in Table 8.
In the full sample period, we find that futures use by banks and non-financial firms is associated with a $1.5-billion quarterly increase in U.S. real GDP. As noted earlier, this impact is considered relatively large, as U.S. real GDP increased $66 billion per quarter on average over the sample period of 2003 to 2012. However, it should be noted that this estimate does not refer to the benefit of futures over other derivatives types, since banks and non-financial firms that hedge often use more than one type of risk management tool at the same time. The construction of the futures use variable in our model does not separate out banks or non-financial firms that exclusively use futures contracts. Therefore, the estimate simply captures the impact of futures use overall, though the effect is created by firms that use futures in their broader risk management profile.17
16. The standard deviation of the growth of banks’ C&I loans is 17.83 percent, while the standard deviation of non- financial firms’ market-to-book ratios is 2.08 (or 0.73 in the log form as reported in Appendix Table 10.1).
17. This also explains why the economic impact of futures (+$1.5 billion per quarter) is slightly different from the impact of total derivatives (+$1.4 billion per quarter, as shown in Table 5), given that futures activity is relatively small compared to other types of OTC derivatives products.

66 DERIVING THE ECONOMIC IMPACT OF DERIVATIVES
When performing an analysis using the crisis sample period, we find that the estimated coefficients of futures contracts use are much larger and get closer to significance at a conventional level (for example, Model 3, Appendix Table 13.1). This suggests that as more observations on futures use become available (and they are used more broadly), their efficacy can become increasingly apparent. The final assessment of their overall impact on the larger economy during the crisis indicates that the use of futures contracts by banks and non-financial firms is associated with an output increase of $6.2 billion per quarter relative to non-users. The implication is that the use of futures alleviates the severity of economic contraction as banks and other firms hedge downside risk; therefore, they are able to continue allocating resources and generating output during the downturn. This larger impact also supports the notion that exchange-traded derivatives, which are more regulated, plays an important role in minimizing counterparty risk and promoting transparency in times of financial turmoil, as argued by Fung and Webb (2012).
Futures’ past effects
TA
BL
E 8ESTIMATED MARGINAL EFFECT
FOR OVERALL IMPACT† IMPACT PER QUARTER
Effect on economic growth
Full sample period†† 0.00004-0.010 +$1.5 billion
Crisis period 0.0034-0.039 +$6.2 billion
Note: U.S. real GDP grows $66 billion per quarter on average.
† Marginal effect of overall impact of futures contracts are the multiplicative terms between the estimated coefficients of the effects of futures on bank lending and firm value (Appendix Tables 13.1 and 13.2) and the estimated effects of bank lending and firm value on U.S. economic growth (Appendix Table 13.3).
†† The full sample period is from 2003 to 2012. The crisis period is from 2008 to 2009 (the impact of futures on bank lending during the crisis is estimated starting from the third quarter of 2007). Since there are too few observations to estimate the impact of bank lending and firm value on economic growth from 2008 to 2009 (i.e., eight observations based on the quarterly data) using the VAR technique, the 2006-2012 period is used for these estimations.
Thus far, we focused and empirically demonstrated the economic benefit of futures contracts based mainly on the importance of risk management. As noted earlier, exchange-traded derivatives also provide economic value through other mechanisms. Derivatives traded on exchanges disseminate price information that aids both private and public entities because exchanges make contract volume and price publicly available. Such transparency helps markets function more efficiently. Derivatives exchanges (and the operations of their clearinghouses) also reduce transaction costs through the following means:

67MEASURING DERIVATIVES’ IMPACT EMPIRICALLY
» Contract standardization: Reduces transaction costs by specifying the “terms of trade,” specifically the grade, quantity, and delivery location of a commodity, for instance. Or by specifying the terms of an interest rate or foreign exchange contract, including rate and closing date. In regard to commodities, all specification options are given to the sellers, who hold the supply. Thus, standardization allows sellers to choose the terms of sale, which are spelled out in the contract. Both sellers and buyers are responsible for understanding how the delivery process works.
» Central marketplace: Derivatives exchanges bring together market participants who use them as a leveraged substitute for trading the underlying assets, whether that is corn, silver, or equities. This pares costs by creating a venue where buyers and sellers meet in lieu of searching for counterparties.
» Clearing: In exchange-traded derivatives markets, the clearinghouse takes the other side or interposes itself in each transaction. Clearing reduces counterparty risks, and therefore transaction costs, by taking on the burden of ensuring the creditworthiness of each trading partner.
Other benefits that have been attributed to futures trading include stabilizing prices in times of intense fluctuation, facilitating complex production operations, balancing supply and demand levels beyond the immediate time horizon, and encouraging competition.

Dodd-Frank’s imposition of regulated margin requirements on both cleared and uncleared swaps will have a noticeable impact on the cost-benefit analysis of hedging.

69
5. A New FrameworkIn offering a perspective on the future of derivatives, one might not be cavalier in saying that their growth could approach its former trajectory once the critical pillars of the market’s ongoing transformation are fully understood by end users. There is a case to be made that activity would gravitate to exchanges because of cost advantages as well as a simplified, automated selection process. Aided by increased transparency and a new regulatory and market operating structure in the United States and elsewhere, systemic risk would likely be reduced. In such circumstances, the contribution derivatives have made to economic growth, as shown by our research, could certainly continue.
Critics of this view might argue that it is too early to declare victory for the new derivatives framework. They could reasonably contend that cross-border, margin, and Basel III regulations are not yet complete, which is creating uncertainty about their true regulatory impact. Moreover, the realization is growing that navigating new regulations is not merely a compliance exercise. For end users, such as corporate treasurers, there is a need to reevaluate how regulations will impact their risk management strategies and operational systems. Many users are concerned that the new derivatives marketplace will terminate the flexibility they had enjoyed in terms of hedging their risks, not only from a business portfolio perspective, but from an accounting perspective. Too much standardization or too high a cost for customized derivatives products could raise questions about the prospects for market expansion and their ability to meet the specific needs of users.
Our assessment of these two views is that it is still unclear how much the overall derivatives market will tilt toward standardization and “vanilla-ization,” despite the three-year interval since the passage of Dodd-Frank. More important, however, is whether the future product mix and costs of derivatives will enable them to contribute to economic growth at a level commensurate with that shown in our research from 2003 to 2012. Although this can’t yet be answered directly, we can highlight major features, issues, and trends emerging from the new environment and offer our thoughts and observations about their impact on the health of the derivatives markets going forward.
5.1 CLEARING AND CAPITAL
Although not all regulations associated with Dodd-Frank are yet in place, enough has been done to enable us to identify the new market structure for the trading of many former OTC derivatives. The primary aim of this structure is to reduce counterparty and systemic risk. Without going into great detail, henceforth all “standardized” swaps must be executed on a swap execution facility (SEF) or a designated contract market (DCM). The instruments need to be cleared at a derivatives clearing organization (DCO) and reported to the marketplace via a swap data repository (SDR).

70 DERIVING THE ECONOMIC IMPACT OF DERIVATIVES
Looking ahead, industry experts project that 60 percent or more of over-the-counter derivatives trading volume will be centrally cleared (Sleightholme and Singh, 2011). Whether or not this is achieved will depend in part on how banks, as liquidity providers in the OTC model, rethink product distribution to clients. Moreover, market participants need to consider where they execute their derivatives business and the associated connectivity implications.
The structure of the derivatives market as described above could be subject to further change, according to some of the world’s top bankers. They have warned that fast-expanding clearinghouses on both sides of the Atlantic Ocean pose a rising risk to the stability of the financial system. As trading volume through clearinghouses ramps up, it is feared, counterparty risk will increase because current capital levels may not be sufficient. Clearinghouse executives counter that their institutions have enough capital, and their tough collateral and margin requirements provide crucial safety buffers (Stafford, 2013).
In addition to the issue of adequate capital, there is concern that the structure of the derivatives market favors broader exchange trading over cleared swaps. In particular, because the CFTC delayed issuing SEF regulations, DCMs, like CME and IntercontinentalExchange, had head starts in establishing their businesses, which favor futures over swaps. The CFTC also issued other rules that favor futures exchanges over SEFs, including those relating to block trades and margins. As for block trades, a DCM is able to set tradable size limits, whereas an SEF must follow a formula established by the futures agency (Commodity Futures Trading Commission, 2013). With respect to margins, a market participant is currently required to post significantly more money to clear a swap transaction than a similar future on a DCM (Madigan, 2013).
Clearinghouse RulesClearinghouse Rules
Agreement to trade
Clearinghouse
Trade counterpartyEnd user
Give-up or novation of trade to clearinghouse
Clearing memberClearing member
amended ISDA Agreem
ent
Customer agreement oram
ended ISDA agreement
Customer agreement or
The Clearing Process on a Derivatives Exchange
Clearinghouses, which often serve as counterparties in derivatives trading and enforce margin requirements, make efficient price discovery possible and reduce systemic risk.

71A NEW FRAMEWORK
5.2 COSTS WILL INFLUENCE USE
Prior to Dodd-Frank, the lack of regulated margin (collateral) requirements was a major driver of the dynamic growth of swaps markets. The imposition of such requirements on both cleared and uncleared swaps will have a noticeable impact on the cost-benefit analysis of hedging. The issue of margin requirements is made all the more acute by the impact of deleveraging, which has been ongoing since the financial crisis. According to industry sources, the total margin shortfall under the new market structure could range from $800 billion to more than $2.5 trillion (Rowady, 2012). However, although these estimates appear large, certain factors dampen the effect of margin constraints. These include offsets, improved risk modeling methods, the expansion of acceptable forms of collateral and collateral rehypothecation. All of these have issues as far as regulators are concerned, which will take some time to resolve.
Whether the cost of meeting margin requirements will spur the migration of OTC derivatives activity to exchanges remains to be seen. Whatever the outcome, it is widely believed that a great deal of exotic derivatives activity will cease amid the high opportunity cost of capital associated with initial margin requirements from central clearing counterparties, and the additional charges likely to be imposed on these less-liquid bilateral trades. According to a study by the Tabb Group, more than $130 trillion in derivatives’ notional value might not be clearable. What broader impact this might have could take time to assess. We could see a dynamic in which the hedgers hedging the hedges of other hedgers no longer need to be involved because the originator of that activity is no longer participating.
5.3 EXTRATERRITORIALITY AND REGULATORY ARBITRAGE
The Dodd-Frank act has not only created a seismic shift in non-exchange traded derivatives markets in the U.S., it has sent tremors through overseas markets. The commotion stemmed from concerns that U.S. regulators would require any non-U.S. entity (including foreign branches of American banks) engaged in swap trading with a U.S. entity to comply with U.S. rules. Foreign regulators, particularly those in Europe, have strenuously objected to this approach, stating that the efficient functioning of global derivatives markets would be undermined by the United States’ trying to act as a proxy global regulator. For their part, U.S. banks have objected to extraterritoriality, believing they would be placed at a competitive disadvantage.
In mid-July, the CFTC agreed to phase in rules—which affect overseas branches of U.S. banks—and lay out a process that could ultimately allow foreign banks to comply with home-country rules rather than those of the CFTC. Hopefully, this will allow for the smooth operation of global derivatives markets going forward. However, much will depend on achieving comparability of regulations across jurisdictions to limit opportunities for regulatory arbitrage.
EU-related derivatives activity is also undergoing change—albeit at a slower pace—through the Review of the Markets in Financial Instruments Directive (MiFID) and the European Market Infrastructure Regulation (EMIR). Once they come into force, Europe’s new regulations will have an important bearing on the future of non-exchange-traded derivatives, since nearly two-thirds of such global transactions have taken place there, according to the BIS. The success of all derivatives in contributing to economic growth will depend greatly on the ability of regulators and policymakers to foster more transparent and liquid markets that are subject to robust and effective risk management. For end users, the litmus test will be their ability to generate competitive returns while effectively hedging risks.


73
References and AppendixesAcharya, Viral, Manachem Brenner, Robert Engle, Anthony Lynch and Matthew Richardson. “Derivatives—The Ultimate Financial Innovation,” in Restoring Financial Stability: How to Repair a Failed System, edited by Viral Acharya and Matthew Richardson, John Wiley & Sons, 2009.
Allayannis, George, and Eli Ofek. “Exchange Rate Exposure, Hedging, and the Use of Foreign Currency Derivatives,” Journal of International Money and Finance, 20, 2001, pp. 273-296.
Allayannis, George, and James Weston. “The Use of Foreign Currency Derivatives and Firm Market Value,” Review of Financial Studies, 14(1), 2001, pp. 243-276.
Allayannis, George, Gregory Brown, and L. Klapper. “Capital Structure and Financial Risk: Evidence from Foreign Debt Use in East Asia,” Journal of Finance, 58(6), 2003, pp. 2,667-2,710.
Allayannis, George, Ugur Lel, and Darius Miller. “Corporate Governance and the Hedging Premium Around the World,” 2007. http://unpan1.un.org/intradoc/groups/public/documents/apcity/unpan033579.pdf. (accessed September 18, 2013).
Altunbasa, Yener, Leonardo Gambacortab, and David Marques-Ibanezc. “Securitisation and the Bank Lending Channel,” European Economic Review, 53(8), 2009, pp. 996–1,009.
Aretz, Kevin, and Söhnke M. Bartram. “Corporate Hedging and Shareholder Value,” Journal of Financial Research, 33(4), 2010, pp. 317-371.
Barth, James R., The Great Savings and Loan Debacle. Washington, D.C.: The AEI Press, 1991.
Barton, Jan. “Does the Use of Financial Derivatives Affect Earnings Management Decisions?” The Accounting Review, 76(1), 2001, pp. 1-26.
Bartram, Söhnke M., Gregory W. Brown, and Frank Fehle, “International Evidence on Financial Derivatives Usage,” Financial Management, 38(1), 2009, pp. 185-206.
Bartram, Söhnke M., Gregory W. Brown, and Jennifer Conrad. “The Effects of Derivatives on Firm Risk and Value,” Journal of Financial and Quantitative Analysis, 46(4), 2011, pp. 967-999.
Beck, Thorsten, and Ross Levine. “Stock Markets, Banks, and Growth: Panel Evidence,” Journal of Banking and Finance, 28(3), 2004, pp. 423-442.
Belozertsev, Alexander, Lamon Rutten, and Frank Hollinger. “Commodity Exchanges in Europe and Central Asia: A Means for Management of Price Risk,” FAO/World Bank Cooperative Programme Working Paper, Investment Center of the United Nations, 2011.
Beneda, N. “The Impact of Hedging with Derivative Instruments on Reported Earnings Volatility,” Applied Financial Economics, 23(2), 2013, pp. 165-179.

74 DERIVING THE ECONOMIC IMPACT OF DERIVATIVES
Black, Fischer, and Myron Scholes. “The Pricing of Options and Corporate Liabilities,” Journal of Political Economy, 1973, pp. 637-655.
Brewer, Elijah III, Bernadette A. Minton, and James T. Moser. “Interest-Rate Derivatives and Bank Lending,” Journal of Banking and Finance, 24(3), 2000, pp. 353-379.
Brewer, Elijah III, William Jackson III, and James T. Moser. “The Value of Using Interest Rate Derivatives to Manage Risk of U.S. Banking Organizations,” Economic Perspectives, 25, 2001, pp. 49-66.
Calistru, Roxana A. “The Credit Derivatives Market—A Threat to Financial Stability?,” Procedia—Social and Behavioral Sciences, 58(12), pp. 552-559.
Carter, David, Daniel Rogers, and Betty Simkins. “Hedging and Value in the U.S. Airline Industry,” Journal of Applied Corporate Finance, 18(4), 2006, pp. 20-34.
Cebenoyan, A. Sinan, and Philip E. Strahan. “Risk Management, Capital Structure and Lending at Banks,” Journal of Banking and Finance, 28, 2004, pp. 19-43.
Chakravarty, S., H. Gulen, and S. Mayhew. “Informed Trading in Stock and Option Markets,” Journal of Finance, 59(3), 2004, pp. 1,235-1,257.
Chance, Don M. “A Chronology of Derivatives,” Derivatives Quarterly 2, Winter 1995, pp. 53-60.
Chiorean, Raluca, Michael Donohoe, and Theodore Sougiannis. “Why Do Firms Use Derivatives? Revisiting the Underinvestment Hypothesis,” 2012. http://business.illinois.edu/finance/papers/2012/Donohoe.pdf (accessed October 8, 2013).
Colombage, Sisira R.N. “Financial Markets and Economic Performances: Empirical Evidence from Five Industrialized Economies,” Research in International Business and Finance, 23(3), 2009, pp. 339-348.
Commodity Futures Trading Commission. “Procedures to Establish Appropriate Minimum Block Sizes for Large Notional Off-Facility Swaps and Block Trades; Final Rule,” Federal Register, Vol. 78, No. 105, Washington, D.C., May 31, 2013.
Commodity Futures Trading Commission. “Status Report on Exchange-Traded Derivatives Markets in Emerging and Developing Market Economies,” 1997.
Cyree, Ken B., Pinghsun Huang, and James T. Lindley. “The Economic Consequences of Banks’ Derivatives Use in Good Times and Bad Times,” Journal of Financial Services Research, 41(3), 2012, pp. 121-144.
Deng, Saiying, Elyas Elyasiani, and Connie X. Mao. “BHC Derivatives Usage, Cost of Debt and Lending Pattern, ” 2010. http://fic.wharton.upenn.edu/fic/papers/13/p1323.htm.
Diamond, Douglas W. “Financial Intermediation and Delegated Monitoring,” Review of Economic Studies, 51, 1984, pp. 394-414.
Donohoe, Michael. “Financial Derivatives in Corporate Tax Avoidance: Outcomes and Determinants,” working paper, 2012, University of Illinois at Urbana-Champaign.
Driscoll, John C. “Does Bank Lending Affect Output? Evidence from the U.S. States,” Journal of Monetary Economics, 51(3), 2004, pp. 451-471.
Fitch Ratings. “Global Credit Derivatives Survey Respondents Opine on Public Perceptions, Regulations, Sovereigns, and More,” Credit Policy: Credit Market Research, September 2010.

75REFERENCES AND APPENDIXES
Fleming, J., B. Ostdiek, and R.E. Whaley. “Trading Costs and the Relative Rates of Price Discovery in the Stock, Futures, and Option Markets,” Journal of Futures Markets, 16, 1996, pp. 353-387.
Froot, Kenneth A., David S. Scharfenstein, and Jeremy C. Stein. “Risk Management: Coordinating Corporate Investment and Financing Policies,” Journal of Finance, 48, 1993, pp. 1,629-1,658.
Fung, Joseph K.W. and Robert I. Webb. “Clearing and OTC Traded Derivatives: A Survey,” Review of Futures, 20, July 2012, pp. 7-20.
Gay, Gerald D., Chen-Miao Lin, and Stephen D. Smith. “Corporate Derivatives Use and the Cost of Equity,” Journal of Banking and Finance, 35, 2011, pp. 1,491-1,506.
Gay, Gerald D., and Jouahn Nam. “The Underinvestment Problem and Corporate Derivatives Use,” Financial Management, 27(4), 1998, pp. 53-69.
Geczy, Christopher, Bernadette Minton, and Catherine Schrand. “Why Firms Use Currency Derivatives,” Journal of Finance, 52, 1997, pp. 1,323-1,354.
Gelderblom, Oscar, and Joost Jonker. “Amsterdam as the Cradle of Modern Futures and Options Trading, 1550-1650,” University of Utrecht, 2009.
Girish, V.S. “A Brief History of Derivatives,” The Banking & Financial World, November 2010, pp. 19-21.
Goderis, Benedikt, Ian W. Marsh, Judit Vall Castello, and Wolf Wagner. “Bank Behaviour with Access to Credit Risk Transfer Markets,” Bank of Finland Research Discussion Paper, No. 4, 2007.
Gorham, Michael, and Nidhi Singh. Electronic Exchanges: The Global Transformation from Pits to Bits. Burlington: Elsevier, 2009.
Gorham, Michael, and Wang Xueqin. “The Short, Dramatic History of Futures Markets in China,” Journal of Global Financial Markets, Spring 2002.
Graham, John R., and Daniel A. Rogers. “Do Firms Hedge in Response to Tax Incentives?” Journal of Finance, 57, 2002, pp. 815–839.
Greenberger, Michael. “The Role of Derivatives in the Financial Crisis,” Testimony, Financial Crisis Inquiry Commission Hearing, Washington, June 2010.
Guay, Wayne R. “The Impact of Derivatives on Firm Risk: An Empirical Examination of New Derivative Users,” Journal of Accounting and Economics, 26, 1994, pp. 319-351.
Guay, Wayne R., and S.P. Kothari. “How Much Do Firms Hedge with Derivatives?” Journal of Financial Economics, 70, 2003, pp. 423-462.
Hirtle, Beverly. “Credit Derivatives and Bank Credit Supply,” Journal of Financial Intermediation, 18(2), 2009, pp. 125-150.
International Monetary Fund. “Making Over-the-Counter Derivatives Safer: The Role of Central Counterparties,” IMF Global Financial Stability Report, Chapter 3, April 2010.
ISDA. “End-User Survey: Interest Rate Swaps,” October 2010. http://www2.isda.org/functional-areas/research/surveys/end-user-surveys/ (accessed October 4, 2013).
ISDA. “Over 9% of the World’s Largest Companies Use Derivatives to Help Manage Their Risks,” 2009. http://www.isda.org/press/press042309der.pdf (accessed September 10, 2013).

76 DERIVING THE ECONOMIC IMPACT OF DERIVATIVES
ISDA. “The ISDA Market Survey: What the Results Show and What They Don’t Show,” ISDA Research Notes, No. 1, Autumn 2008.
Ivashina, Victoria, and David S. Scharfstein. “Bank Lending During the Financial Crisis of 2008,” Journal of Financial Economics, 97(3), 2010, pp. 319-338.
Jin, Yanbo, and Philippe Jorion. “Firm Value and Hedging: Evidence from U.S. Oil and Gas Producers,” Journal of Finance, 66, 2006, pp. 893–919.
Jorgensen, Bjorn, Kenneth A. Kavajecz, and Scott N. Swisher IV. “The Historical Evolution of Financial Exchanges,” 2011. http://papers.ssrn.com/sol3/papers.cfm?abstract_id=1922250 (accessed January 3, 2014).
Karfoul, Hazem Y. “Banks Involvement in OTC Derivatives Markets: Underlying Theories and Potential Externalities,” working paper, IRGO, Université Montesquieu-Bordeaux IV, 2008.
Kim, Young Sang, Ike Mathur, and Jouahn Nam. “Is Operational Hedging a Substitute or Complement to Financial Hedging?” Journal of Corporate Finance, 12, 2006, pp. 834-853.
King, L.W. “The Code of Hammurabi,” Encyclopaedia Britannica, United Kingdom, 1910-1911.
Kleist, Karsten von. “The BIS Framework for Monitoring Financial Derivatives,” proceedings of the workshop Data Requirements for Monitoring Derivative Transactions, organized by the People’s Bank of China and the Irving Fisher Committee, Zhengzhou, September 27-29, 2012.
Kohli, Rasmeet. “Exchange Consolidations: Experiences and Issues,” Money & Finance, ICRA Bulletin, April 2012.
Lang, Larry, and René M. Stulz. “Tobin's q, Corporate Diversification, and Firm Performance,” Journal of Political Economy, 102(6), 1994, pp. 1,248-1,280.
Levine, Ross. “Finance and Growth: Theory and Evidence,” in: Philippe Aghion and Steven Durlauf (eds.), Handbook of Economic Growth, Vol. 1, 2005, pp. 865-934, Elsevier.
Levine, Ross, and Sara Zervos. “Stock Markets, Banks, and Economic Growth,” American Economic Review, 88(3), 1998, pp. 537-558.
Lin, Chen-Miao, and Stephen D. Smith. “Hedging, Financing, and Investment Decisions: A Simultaneous Equations Framework,” Financial Review, 42, 2007, pp. 191-209.
Litan, Robert E. “In Defense of Much, But Not All, Financial Innovation,” Brookings Paper, February 17, 2010.
Mackay, Peter, and Sara B. Moeller. “The Value of Corporate Risk Management,” Journal of Finance, 62, 2007, pp. 1,379-1,419.
Madigan, Peter. “CFTC’s Gensler Defends Swaps vs. Futures Margin Disparity,” Risk magazine, March 14, 2013.
Mahieu, Ronald, and Ying Xu. “Hedging with Interest Rate and Credit Derivatives by Banks,” 2007. http://papers.ssrn.com/sol3/papers.cfm?abstract_id=971805 (accessed September 18, 2013).
Markose, Sheri M. “Systemic Risk from Global Financial Derivatives: A Network Analysis of Contagion and Its Mitigation with Super-Spreader Tax,” IMF Working Paper 282, 2012, International Monetary Fund.
Mayers, David, and Clifford Smith. “Corporate Insurance and the Underinvestment Problem,” Journal of Risk and Insurance, 54, 1987, pp. 45-54.
Merton, Robert. “The Relationship Between Put and Call Option Prices: Comment,” Journal of Finance, 31, 1973, pp. 369-381.

77REFERENCES AND APPENDIXES
Merton, Robert. “Applications of Option Pricing Theory : Twenty-Five Years Later,” American Economic Review, 2, 1998, pp. 323-348.
Mihaljek, Dubravko, and Frank Packer. “Derivatives in Emerging Markets,” BIS Quarterly Review, Bank for International Settlements, December 2010.
Minton, Bernadette, René Stulz, and Rohan Williamson. “How Much Do Banks Use Credit Derivatives to Hedge Loans?” Journal of Financial Services Research, 35 (1), 2009, pp. 1-31.
Mizrach, Bruce, and Neely, Christopher J. “The Microstructure of the U.S. Treasury Market,” Federal Reserve Bank of St. Louis Working Papers 2007-052B, 2007.
Modigliani, Franco, and Merton Miller. “The Cost of Capital, Corporate Finance and the Theory of Investment,” American Economic Review, 48, 1958, pp. 261-297.
Mueller, Dennis. “The Corporation: Growth, Diversification and Mergers,” Harwood: Chur, Switzerland, 1987.
Myers, Stewart C. “Determinants of Corporate Borrowing,” Journal of Financial Economics, 5, 1977, pp. 147-175.
Myers, Stewart C., and Nicholas Majluf. “Corporate Financing and Investment Decisions When Firms Have Information That Investors Do Not Have,” Journal of Financial Economics, 13, 1984, pp. 187-221.
Nance, D.R., C.W. Smith, and C.W. Smithson. “On the Determinants of Corporate Hedging,” Journal of Finance, 48(1), 1993, pp. 267-284.
Nijskens, Rob, and Wolf Wagner. “Credit Risk Transfer Activities and Systemic Risk: How Banks Became Less Risky Individually But Posed Greater Risks to the Financial System at the Same Time,” Journal of Banking and Finance, 35, 2011, pp. 1,391-1,398.
Norden, Lars, Consuelo Silva Buston, and Wolf Wagner. “Financial Innovation and Bank Behavior: Evidence from Credit Markets,” 2011. http://papers.ssrn.com/sol3/papers.cfm?abstract_id=1800162 (accessed September 24, 2013).
Peery, Gordon F. The Post-Reform Guide to Derivatives and Futures, John Wiley & Sons, 2012.
Peltzman, Sam. “The Gains and Losses from Industrial Concentration,” Journal of Law and Economics, 20, 1977, pp. 229-263.
Pirrong, Craig. “The Economics of Central Clearing: Theory and Practice,” ISDA Discussion Papers Series No. 1, International Swaps and Derivatives Association, May 2011.
Purnanandam, Amiyatosh K. “Interest Rate Derivatives at Commercial Banks: An Empirical Investigation,” Journal of Monetary Economics, 54, 2007, pp. 1,769-1,808.
Rajan, Arvind. “A Primer on Credit Default Swaps,” in: Arvind Rajan, Glen McDermott, and Ratul Roy (eds.). The Structured Credit Handbook, John Wiley & Sons, 2007.
Reichsfeld, David A., and Shaun K. Roache. “Do Commodity Futures Help Forecast Spot Prices?” IMF Working Paper WP/11/254, International Monetary Fund, 2011.
Rodriguez-Moreno, Maria, Sergio Mayordomo, and Juan Ignacio Peña. “Derivatives Holdings and Systemic Risk in the U.S. Banking Sector,” 2013. http://papers.ssrn.com/sol3/papers.cfm?abstract_id=1973953 (accessed October 15, 2013).

78 DERIVING THE ECONOMIC IMPACT OF DERIVATIVES
Rowady Jr., E. Paul. “The New Global Risk Transfer Market: Transformation and the Status Quo,” the Tabb Group LLC, September 2012.
Santana-Boado, Leonela, and Christopher James Brading. “Overview of the World’s Commodity Exchanges,” UNCTAD, 2001.
Shleifer, Andrei, and Robert W. Vishny. “A Survey of Corporate Governance,” Journal of Finance, 52(2), 1997, pp. 737-783.
Sleightholme, Mike, and Bikramjit Singh. “OTC Derivatives in the Post-Dodd-Frank Landscape—Implications for Investment Managers,” Citibank, 2011. http://www.citigroup.com/transactionservices/home/securities_svcs/fund/docs/otc_white_paper.pdf (accessed September 29, 2013).
Smith, Clifford W., and René M. Stulz. “The Determinants of Firm’s Hedging Policies,” Journal of Financial Quantitative Analysis, 20, 1985, pp. 391-405.
Stafford, Phillip. “CME Chief Defends Clearing Houses’ Growing Role,” Financial Times, July 9, 2013.
Stulz, René M. “Demystifying Financial Derivatives,” the Milken Institute Review, Third Quarter 2005, pp. 20-31.
Surowiecki, James. “Too Clever by Half,” the New Yorker, May 17, 2010.
Swan, Edward J. Building the Global Market: A 4000-Year History of Derivatives, Kluwer Law International Ltd., London, 2000.
Switzer, Lorne N., and Haibo Fan. “Interactions Between Exchange Traded Derivatives and OTC Derivatives: Evidence for the Canadian Dollar Futures vs. OTC Markets,” International Journal of Business, 13(1), 2008, pp. 25-42.
U.S. Financial Crisis Inquiry Report: Final Report of the National Commission on the Causes of the Financial and Economic Crisis in the United States. 2011. http://www.gpo.gov/fdsys/pkg/GPO-FCIC (accessed September 22, 2013).
Tsetsekos, George, and Panos Varangis. “The Structure of Derivatives Exchanges: Lessons from Developed and Emerging Markets,” World Bank Development Research, No. 1887, 1999.
Tufano, Peter. “Who Manages Risk? An Empirical Examination of Risk Management Practices in the Gold Mining Industry,” Journal of Finance, 51, 1996, pp. 1,097-1,137.
Wallison, Peter J. “Dissent from the Majority Report of the Financial Crisis Inquiry Commission,” 2011. http://www.aei.org/papers/economics/fiscal-policy/dissent-from-the-majority-report-of-the-financial-crisis-inquiry-commission-paper/ (accessed October 7, 2013).
Weber, Ernst Juerg. “A Short History of Derivatives Security Markets,” University of Western Australia, 2008.
Whaley, Robert E. Derivatives: Markets, Valuation, and Risk Management, John Wiley & Sons, 2006.
Yang, Jin-Yong, and Jae-Seung Baek. “Volume of Derivative Trading, Enterprise Value, and the Return on Assets,” Modern Economy, 4, 2013, pp. 513-519.
Zhao, Fang, and James T. Moser. “Bank Lending and Interest-Rate Derivatives,” Financial Management Association Conference, Salt Lake City, 2006. http://www1.american.edu/academic.depts/ksb/finance_realestate/rhauswald/seminar/BankLending.pdf (accessed October 17, 2013).

79REFERENCES AND APPENDIXES
AP
PE
ND
IX 1
. Gro
wth
of
der
ivat
ives
ma
rket
s, b
y m
ark
et a
nd
ris
k c
ateg
ory
(not
iona
l am
ount
s, $
trill
ions
)
OTC
D
ERIV
ATIV
ES
EXCH
AN
GE-
TRA
DED
D
ERIV
ATIV
ESTO
TAL
OTC
DER
IVAT
IVES
EXCH
AN
GE-
TRA
DED
DER
IVAT
IVES
FUTU
RES
OP
TIO
NS
INTE
RES
T R
ATE
FOR
EIG
N
EXCH
AN
GE
CDS
EQU
ITY-
LIN
KED
COM
MO
DIT
YU
NA
LLO
CATE
DIN
TER
EST
RAT
EC
UR
REN
CYEQ
UIT
Y IN
DEX
INTE
RES
T R
ATE
CU
RR
ENCY
EQU
ITY
IND
EX
1998
80.3
113
.98
94.2
950
.01
18.0
11.
490.
4110
.39
8.03
0.03
0.29
4.62
0.05
0.95
1999
88.2
013
.59
101.
7960
.09
14.3
41.
810.
5511
.41
7.92
0.04
0.34
3.76
0.02
1.51
2000
95.2
014
.25
109.
4564
.67
15.6
71.
890.
6612
.31
7.91
0.08
0.37
4.73
0.02
1.14
2001
111.
1823
.76
134.
9377
.57
16.7
51.
880.
6014
.38
9.27
0.07
0.33
12.4
90.
031.
56
2002
141.
6723
.83
165.
5010
1.66
18.4
52.
310.
9218
.33
9.96
0.05
0.35
11.7
60.
031.
69
2003
197.
1736
.70
233.
8714
1.99
24.4
83.
791.
4125
.51
13.1
20.
090.
5020
.79
0.04
2.16
2004
258.
6346
.52
305.
1519
0.50
29.2
96.
404.
381.
4426
.61
18.1
60.
110.
6224
.60
0.06
2.95
2005
299.
2657
.26
356.
5221
1.97
31.3
613
.91
5.79
5.43
30.7
920
.71
0.12
0.77
31.5
90.
074.
01
2006
418.
1369
.40
487.
5329
1.58
40.2
728
.65
7.49
7.12
43.0
324
.48
0.18
1.02
38.1
20.
085.
53
2007
585.
9379
.09
665.
0239
3.14
56.2
458
.24
8.47
8.46
61.3
926
.77
0.18
1.10
44.2
80.
136.
62
2008
598.
1557
.75
655.
8943
2.66
50.0
441
.88
6.47
4.43
62.6
718
.73
0.13
0.65
33.9
80.
134.
13
2009
603.
9073
.12
677.
0244
9.87
49.1
832
.69
5.94
2.94
63.2
720
.63
0.14
0.97
46.4
30.
154.
80
2010
601.
0567
.95
668.
9946
5.26
57.8
029
.90
5.63
2.92
39.5
421
.01
0.17
1.13
40.9
30.
144.
56
2011
647.
7858
.34
706.
1250
4.12
63.3
528
.63
5.98
3.09
42.6
121
.72
0.22
0.98
31.5
80.
093.
75
2012
632.
5854
.43
687.
0148
9.70
67.3
625
.07
6.25
2.59
41.6
122
.64
0.23
1.25
25.9
10.
114.
30
Sour
ce: B
ank
for
Inte
rnat
iona
l Set
tlem
ents
, Jun
e 20
13.

80 DERIVING THE ECONOMIC IMPACT OF DERIVATIVES
EXCHANGE COUNTRY2012
Bourse Africa South Africa
NASDAQ OMX NLX U.K.
Chi-X FX Brazil
2011
Africa Futures and Derivatives Exchange Kenya
Bangladesh Commodity Exchange Bangladesh
Commodity Futures Exchange Limited Nepal
Vietnam Commodity Exchange Vietnam
Sibiu Stock Exchange Romania
MICEX-RTS Russia
Caribbean Exchange Network Caribbean
NYSE Amex Options U.S.
2010
African Commodities Exchange Malawi
Bangla Mercantile Exchange Bangladesh
Ace Derivatives & Commodity Exchange India
United Stock Exchange India
Indonesia Comm. and Derivatives Exch. Indonesia
Asian Derivative Exchange Limited Nepal
Nepal Spot Exchange Limited Nepal
Singapore Mercantile Exchange Singapore
CEE Stock Exchange Austria
NASDAQ OMX Commodities Nord Pool Norway
Ukrainian Mercantile Futures Exchange Ukraine
Carbon Trade Exchange U.K.
NASDAQ OMX N2EX U.K.
C2 Options Exchange U.S.
Cantor Financial Futures Exchange U.S.
Eris Exchange U.S.
World DR Exchange U.S.
2009
JSE Yield-X South Africa
Tianjin Bohai Commodity Exchange China
Indian Commodity Exchange India
TDEX Japan
Mercantile Exchange Nepal Limited Nepal
APX ENDEX Belgium
Power Exchange Central Europe Czech Rep.
EPEX Spot France
Tradegate Germany
Burgundy Sweden
Equiduct U.K.
MF Global Energy MTF U.K.
Electronic Liquidity Exchange U.S.
Nodal Exchange U.S.
World Green Exchange U.S.
2008
Ethiopia Commodity Exchange Ethiopia
Zambia Agricultural Commodities Exch. Zambia
China Beijing Environmental Exchange China
Tianjin Climate Exchange China
Hong Kong Mercantile Exchange Hong Kong
National Spot Exchange India
Nepal Derivative Exchange Limited Nepal
Derivative and Commodity Exchange Nepal
Singapore Commodity Exchange Singapore
Powernext Gas Spot France
EXCHANGE COUNTRY2008 (cont'd)
Powernext Gas Futures France
Bucharest Spot Market Romania
Derivatives Regulated Market - Bvb Romania
St. Petersburg International Mercantile Russia
Turquoise U.K.
Match Now Canada
Montreal Climate Exchange Canada
Chi-X Global U.S.
Houston Mercantile Exchange U.S.
NASDAQ OMX NFX U.S.
NASDAQ OMX NOM U.S.
NASDAQ OMX PHLX U.S.
NYSE Liffe US U.S.
BM&F Bovespa Brazil
BM&F Bovespa Carbon Brazil
BM&F Bovespa Commodities and Futures Brazil
BM&F Bovespa Foreign Exchange Brazil
2007
Eurasian Trading System Kazakhstan
Dubai Mercantile Exchange UAE
Prague Energy Exchange Czech Rep.
Bluenext France
NYSE Liffe Paris France
European Warrant Exchange Germany
Deutsche Börse Commodities Germany
NYSE Liffe Amsterdam Netherlands
NYSE Liffe Lisbon Portugal
FXMarketSpace U.K.
MTS Swap Market U.K.
NYSE Liffe London U.K.
ICE Futures Canada Canada
Bonddesk U.S.
ICE Futures U.S. U.S.
NASDAQ OMX Commodities U.S.
NASDAQ OMX BX U.S.
NYSE Euronext U.S.
North American Derivatives Exchange U.S.
US Futures Exchange U.S.
2006
JSE Alternative Exchange South Africa
Uganda Commodity Exchange Uganda
China Financial Futures Exchange China
Iran Mercantile Exchange Iran
Commodities and Metal Exchange Nepal Nepal
Joint Asian Derivatives Exchange Singapore
NASDAQ OMX Nordic Derivatives Mkt. Iceland
Fish Pool Norway
Fishex Norway
New York Stock Exchange Arca U.S.
Philadelphia Board of Trade U.S.
Australian Securities Exchange Australia
Financial and Energy Exchange Australia
2005
Iranian Oil Bourse Iran
Pakistan Mercantile Exchange Pakistan
Dubai International Financial Exchange UAE
Dubai Gold & Commodities Exchange UAE
EXCHANGE COUNTRY2005 (cont'd)
Belgian Power Exchange Belgium
Nordic Derivatives Market Sweden
Pridneprovsk Commodity Exchange Ukraine
European Climate Exchange U.K.
NYMEX Europe U.K.
PLUS Markets Group U.K.
Plus Markets U.K.
BATS Exchange U.S.
Direct Edge U.S.
NYSE Arca Options U.S.
2004
Malaysia Derivatives Exchange Malaysia
Thailand Futures Exchange Thailand
Agricultural Futures Exchange of Thailand Thailand
Securitised Derivatives Market Italy
Olive Oil Futures Market Spain
CBOE Futures Exchange U.S.
Chicago Climate Futures Exchange U.S.
Hedgestreet Exchange U.S.
2003
Multi Commodity Exchange of India India
National Commodity and Derivatives Exch. India
Belarusian Universal Commodity Exchange Belarus
Ukrainian Futures Exchange Ukraine
EDX London U.K.
Chicago Climate Exchange U.S.
INET Futures Exchange U.S.
2002
Shanghai Gold Exchange China
National Multi Commodity Exchange of India India
Tajik Universal Goods and Commodity Exch. Tajikistan
ENDEX Power BE Belgium
Komoditní Burza Praha Czech Rep.
European Energy Exchange Germany
Universal Commodity Exchange of Moldova Moldova
European Energy Derivatives Exchange Netherlands
Nord Pool Spot Norway
National Mercantile Exchange Russia
Turkish Derivatives Exchange Turkey
ENDEX Power UK U.K.
Boston Options Exchange U.S.
Island Futures Exchange U.S.
ICE Futures OTC U.S.
Merchants' Exchange U.S.
OneChicago U.S.
Brazilian Commodities Exchange Brazil
Goiás Commodities Exchange Brazil
Minas Gerais Commodities Exchange Brazil
Mato Grosso do Sul Comm. Exch. Brazil
Paraná Commodities Exchange Brazil
Rio Grande do Sul Commodities Exch. Brazil
Uberlandia Commodities Exchange Brazil
2001
Austrian Energy Exchange Austria
OTE Market Czech Rep.
Powernext France
Euronext.Liffe Netherlands
APPENDIX 2. Derivatives exchanges worldwide, 1500s-January 2013 (Bold indicates major exchanges; italic indicates exchange that was abolished, merged, or acquired)

81REFERENCES AND APPENDIXES
EXCHANGE COUNTRY2001 (cont'd)
International Martime Exchange Norway
Slovenia Power Exchange Slovenia
ICE Futures Europe U.K.
Virt-X U.K.
Archipelago Exchange U.S.
Exchange Place Futures Exchange U.S.
Fxall U.S.
NQLX Futures Exchange U.S.
World Energy Exchange U.S.
Australian Derivatives Exchange Australia
2000
Uzbekistan Republican Currency Exch. Uzbekistan
NYSE Liffe Brussels Belgium
Euronext Netherlands
European Asian Exchange Russia
APX Power UK U.K.
GlobalCOAL U.K.
UK Power Exchange U.K.
FutureCom U.S.
Hotspot FX U.S.
Intercontinental Exchange U.S.
Merchants’ Exchange of St. Louis U.S.
OnExchange Board of Trade U.S.
1999
Shanghai Futures Exchange China
Jakarta Futures Exchange Indonesia
Singapore Exchange Singapore
Korea Options & Futures Exchange South Korea
APX Gas ZTP Belgium
Athens Derivatives Exchange Greece
Amsterdam Power Exchange Netherlands
Amsterdam Power Exchange Gas Netherlands
Norwegian OTC Market Norway
Polish Power Exchange Poland
APX Gas UK U.K.
ICAP Hyde Derivatives Ltd U.K.
ICAP Energy U.K.
Brokertec Futures Exchange U.S.
Currenex U.S.
Foreign Exchange Capital Markets U.S.
Matchbook FX U.S.
Yieldbroker Australia
1998
Abuja Securities and Comm. Exch. Nigeria
Yokohama Commodities Exchange Japan
Comm. and Monetary Exch.Malaysia Malaysia
Taiwan Futures Exchange Taiwan
Belarus Currency And Stock Exchange Belarus
Risk Management Exchange Germany
Eurex Germany
Skopje Commodity Exchange Macedonia
Internet Direct Access Exchange Russia
Iberian Electricity Market Spain
Spanish Electricity Market Spain
Sumy Commodity Exchange Ukraine
Mexican Derivatives Exchange Mexico
EXCHANGE COUNTRY1997
Kenya Agricultural Commodities Exch. Kenya
South African Futures Exchange South Africa
Kansai Commodities Exchange Japan
Osaka Mercantile Exchange Japan
Sibiu Monetary and Financial Comm. Exch. Romania
Moscow Stock Exchange Russia
St. Petersburg Futures Exchange Russia
1996
Bond Exchange of South Africa South Africa
Chubu Commodity Exchange Japan
Kazakh International Commodity Exch. Kazakhstan
Kyrgyzstan Commodity and Raw Materials Kyrgyzstan
Malaysian Monetary Exchange Malaysia
Ringgit Bond Market Malaysia
EASDAQ Belgium
Nord Pool Norway
Porto Derivatives Exchange Portugal
Commodity Exchange of the Agroindustrial Ukraine
Prikarpatya Regional Commodity Exchange Ukraine
Rivne Commodity Exchange Ukraine
Volynsc Specialized Agrarian Exchange Ukraine
Citrus Associates of the New York Cotton U.S.
Tradeweb U.S.
1995
S. African Futures Exch.- Agricultural South Africa
Kuala Lumpur Options and Futures FinExch. Malaysia
Rousse Commodity Exchange Bulgaria
Plodinová Burza Brno Czech Rep.
Czech Moravian Commodity Exch. Kladno Czech Rep.
Warsaw Commodity Exchange Poland
Rostov Currency, Comm., and Stock Exch. Russia
Russian Trading System Russia
Commodity Exchange of Ljubljana Slovenia
Citrus Fruit and Comm. Futures - Valencia Spain
SIX Swiss Exchange Switzerland
Dniprovscaya Agrarian Exchange Ukraine
Donbas Agroindustrial Exchange Ukraine
Kiev Agroindustrial Exchange Ukraine
Tradepoint Investment Exchange U.K.
ChemConnect U.S.
New Zealand Futures & Options Exchange New Zealand
1994
Chengdu United Futures Commodity China
Changchun United Futures Commodity China
Chongqing Commodity Exchange China
China Foreign Exchange Trade System China
Guangdong United Futures Exchange China
Shanghai Commodity Exchange China
Shanghai Foodstuffs Commodity Exchange China
Shenzhen Metal Exchange China
Shenyang Commodity Exchange China
Suzhou Commodity Exchange China
Tianjin Property Rights Exchange China
Tianjin United Futures Exchange China
Gre Tai Securities Market Taiwan
Commodity and Raw Materials Exchange Turkmenistan
Italian Derivatives Market Italy
EXCHANGE COUNTRY1994 (cont'd)
Khanty-Mansiysk Oil Exchange Russia
Nizhny Novgorod Stock And Currency Russia
Samara Currency Interbank Exchange Russia
Natural Gas Exchange Canada
Australian Wool Exchange Australia
1993
Beijing Commodity Exchange China
China Commodity Futures of Hainan China
Dalian Commodity Exchange China
Shanghai Cereals, Oils, and Foodstuffs China
National Stock Exchange of India India
Kansai Agricultural Commodities Exchange Japan
Baku Interbank Currency Exchange Azerbaijan
Orenburg Farmer Exchange Russia
Yenisei Commodity Exchange Russia
Istanbul Gold Exchange Turkey
Ukrainian Interbank Currency Exchange Ukraine
1992
Shanghai Metal Exchange China
Singapore Commodity Exchange Singapore
Khorezm Interregion Commodity Exchange Uzbekistan
Uzbek Commodity Exchange Uzbekistan
Italian Interest Rate Derivatives Market Italy
Italian Futures Market Italy
Romanian Commodities Exchange Romania
Moscow Interbank Currency Exchange Russia
Russian Southern Commodity Exchange Russia
St. Petersburg Currency Exchange Russia
Siberian Commodity Exchange Russia
Siberian Interbank Currency Exchange Russia
Urals Regional Currency Exchange Russia
Bratislava Commodity Exchange Slovakia
Reuters Dealing 2000/3000 U.K.
1991
Austrian Futures and Options Exchange Austria
Belgian Futures and Options Exchange Belgium
Plovdiv Commodity Exchange Bulgaria
Sofia Commodity Exchange Bulgaria
Zagreb Stock Exchange Croatia
Moscow Commodity Exchange Russia
Moscow Non-Ferrous Metals Exchange Russia
Murmansk Commodity and Raw Material Russia
Russian Exchange Russia
Saint Petersburg Commodity and Stock Russia
Vladivostok Commodity Exchange Russia
Black Sea Commodity Exch. Ukraine
Crimea Universal Exchange Ukraine
Kharkov Mercantile Exchange Ukraine
Mariupol Universal Commodity Exchange Ukraine
Ukrainian Universal Commodity Exchange Ukraine
Veinnitsa Universal Commodity Exchange Ukraine
Zaporozhye Commodity Exchange Ukraine
London Commodity Exchange U.K.
London Commodity Exchange U.K.
Twin Cities Board of Trade U.S.
MERFOX Argentina

82 DERIVING THE ECONOMIC IMPACT OF DERIVATIVES
Note: The list includes derivatives exchanges and all stock exchange subsidiaries that trade derivatives. Stock exchanges that were established to trade only stock shares (but later may have traded derivatives) are excluded. The list also excludes the 50-plus commodity exchanges in China in the 1970s that were consolidated into three exchanges in 1990 (which were listed as founded in 1990). China also has many regional property rights exchanges that were excluded due to insufficient information about products traded.
Sources: World Federation of Exchanges, Futures Industry Association, Numa Directory of Futures and Options Exchanges, Association of Futures Markets, International Organization for Standardization, Commodity Futures Trading Commission (1997),
Tsetsekos and Varangis (1999), Santana-Boado and Brading (2001), Gorham and Xueqin (2002), Gorham and Singh (2009), Jorgensen, Kavajecz, and Swisher (2011), Belozertsev, Rutten, and Hollinger (2011), and Milken Institute.
APPENDIX 2. Derivatives exchanges worldwide, 1500s-January 2013 (Continued)
EXCHANGE COUNTRY1990
S. African Futures Exch. - Fin Mkt Division South Africa
Shanghai Stock Exchange China
Zhengzhou Commodity Exchange China
Labuan International Financial Exchange Malaysia
Yerevan Commodity and Raw Material Armenia
Zagreb Money and ST Securities Market Croatia
German Derivatives Exchange Germany
Pridneprovya Commodity Exchange Ukraine
Electronic Broking Services U.S.
New York Futures Exchange U.S.
1989
Tokyo International Financial Futures Exch. Japan
Tokyo Financial Exchange Japan
Budapest Commodity Exchange Hungary
Spanish Financial Futures Market Spain
Spanish Fin. Futures Market Fixed Income Spain
Spanish Financial Futures Market Equity Spain
Spanish Financial Derivatives Exchange Spain
London Securities and Derivatives Exch. U.K.
GFI Energymatch U.S.
1988
NASDAQ OMX Nordic Deriv - Copenhagen Denmark
Irish Futures and Options Exchange Ireland
Swiss Options and Financial Futures Exch. Switzerland
GFI Forexmatch U.S.
Mercado Abierto Electrónico Argentina
1987
FUTOP Denmark
Finnish Options Market Finland
NASDAQ OMX Nordic Deriv —Helsinki Finland
MONEP France
London Futures and Options Exchange U.K.
London Bullion Market U.K.
London Platinum And Palladium Market U.K.
GFI Creditmatch U.S.
1986
Finnish Options Exchange Finland
MATIF France
Amsterdam Financial Futures Market Netherlands
London Traded Options Market U.K.
Pacific Futures Exchange U.S.
1985
Manila International Futures Exchange Philippines
NASDAQ OMX Nordic Deriv -Stockholm Sweden
Baltic International Freight Futures Exch. U.K.
Financial Instruments Exchange U.S.
Brazilian Mercantile and Futures Exchange Brazil
EXCHANGE COUNTRY1984
Bharat Diamond Bourse India
Osaka Textile Exchange Japan
Tokyo Commodity Exchange Japan
Singapore International Monetary Exch. Singapore
Polatli Grain Exchange Turkey
Toronto Futures Exchange Canada
New Zealand Futures Exchange New Zealand
1970-1983
Chicago Rice and Cotton Exchange (1983) U.S.
Tokyo Gold Exchange (1982) Japan
London Intl. Fin Futures and Options Exch.(1982) U.K.
Maringá Mercantile and Futures Exch. (1982) Brazil
Kuala Lumpur Commodity Exchange (1980) Malaysia
Gold Exchange of Singapore (1980) Singapore
International Petroleum Exchange (1980) U.K.
Brazilian Futures Exchange (1980) Brazil
Bolsa Mercantil de Colombia (1979) Colombia
European Options Exchange (1978) Netherlands
American Commodity Exchange (1978) U.S.
Hong Kong Futures Exchange (1976) Hong Kong
Australian Options Market (1976) Australia
TELCOT (1975) U.S.
New Zealand Exchange (1974) New Zealand
Chicago Board Options Exchange (1973) U.S.
CME International Monetary Market (1972) U.S.
CME Index And Options Market (1972) U.S.
Pacific Commodity Exchange (1972) U.S.
Tokyo Sugar Exchange (1971) Japan
NASDAQ OMX (1971) U.S.
São Paulo Commodities Exchange (1971) Brazil
Tomato Products Assoc. of the NY Cotton (1970) U.S.
1500s-1962
Merchants' Exchange (1962) U.S.
Sydney Futures Exchange (1960) Australia
Korea Exchange (1956) South Korea
Memphis Board of Trade (1954) U.S.
Kobe Grain Exchange (1952) Japan
Kobe Raw Silk Exchange (1952) Japan
Kobe Rubber Exchange (1952) Japan
Osaka Grain Exchange (1952) Japan
Tokyo Grain Exchange (1952) Japan
Tokyo Rubber Exchange (1952) Japan
Tokyo Textile Exchange (1951) Japan
San Francisco Grain Exchange (1938) U.S.
London Rubber Exchange (1932) U.K.
New York Hide Exchange (1929) U.S.
Manila Commodity Exchange (1927) Philippines
EXCHANGE COUNTRY1500s-1962 (cont'd)
RAS Commodity Exchange (1920) Singapore
Hong Kong Stock Exchange (1914) Hong Kong
Adana Commodity Exchange (1913) Turkey
Konya Grain Exchange (1912) Turkey
Chinese Gold & Silver Exchange Society (1910) Hong Kong
Buenos Aires Term Market (1910) Argentina
Buenos Aires Futures and Options Exch. (1907) Argentina
Baltic Mercantile and Shipping Exchange (1903) U.K.
Australian Stock Exchange (1900) Australia
Toyohashi Dried Cocoon Exchange (1894) Japan
Yokohama Raw Silk Exchange (1894) Japan
Fukuoka Futures Exchange (1893) Japan
Izmir Mercantile Exchange (1891) Turkey
Johannesburg Stock Exchange (1887) South Africa
Winnipeg Commodity Exchange (1887) Canada
Minneapolis Grain Exchange (1885) U.S.
Rosario Futures Exchange (1884) Argentina
Commodity Exchange (1883) U.S.
Coffee, Sugar and Cocoa Exchange (1882) U.S.
Maebashi Dried Cocoon Exchange (1880) Japan
Osaka Chemical Textile Exchange (1880) Japan
Osaka Sugar Exchange (1880) Japan
Osaka Securities Exchange (1878) Japan
Tokyo Stock Exchange (1878) Japan
London Metal Exchange (1877) U.K.
Hokkaido Grain Exchange (1876) Japan
Nagoya Grain and Sugar Exchange (1876) Japan
Nagoya Textile Exchange (1876) Japan
Bombay Stock Exchange (1875) India
Chicago Mercantile Exchange (1874) U.S.
Salt Lake City Mining Stock Exchange (1873) U.S.
Bremen Cotton Exchange (1872) Germany
New York Mercantile Exchange (1872) U.S.
Sydney Stock Exchange (1871) Australia
New York Cotton Exchange (1870) U.S.
Kansas City Board of Trade (1856) U.S.
Toronto Stock Exchange (1854) Canada
Buenos Aires Grain Exchange (1854) Argentina
Paris Stock Exchange (1850) France
Chicago Board of Trade (1848) U.S.
Boston Stock Exchange (1834) U.S.
Odessa Commodity Exchange (1796) Ukraine
New York Stock Exchange (1790) U.S.
Philadelphia Petroleum Exchange (1790) U.S.
Philadelphia Stock Exchange (1790) U.S.
Corn Exchange of London (1745) U.K.
London Stock Exchange (1697) U.K.
Deutsche Börse (1585) Germany

83REFERENCES AND APPENDIXES
AP
PE
ND
IX 3
. Dat
a so
urc
es a
nd
ava
ilab
ilit
y
BIS
BIS
(TR
IEN
NIA
L)IS
DA
SIFM
AW
FEFI
ACF
TCO
CCCM
E
Sam
ple
Glo
bal
(13
coun
trie
s)G
loba
l (5
4 co
untr
ies)
Glo
bal
Glo
bal
Glo
bal e
xcha
nges
G
loba
l exc
hang
esU
.S.
U.S
.U
.S.
Tim
e co
vera
geLa
te 1
980s
19
98, 2
001,
200
4, 2
007,
20
10
1987
-pre
sent
2010
-pre
sent
1995
-pre
sent
2002
-pre
sent
1986
-pre
sent
1996
-pre
sent
1993
-pre
sent
Freq
uenc
yQ
uart
erly
Ever
y 3
year
sSe
mi-
annu
al
Mon
thly
Ann
ual
Ann
ual
Wee
kly
Qua
rter
ly
Dai
ly
Mar
ket
Exch
ange
and
OTC
Exch
ange
and
OTC
OTC
OTC
Exch
ange
Exch
ange
Exch
ange
Ex
chan
ge a
nd O
TCEx
chan
ge tr
aded
Type
of i
nstr
umen
tsFo
rwar
ds, f
utur
es,
optio
ns, s
wap
sFo
rwar
ds, f
utur
es,
optio
ns, s
wap
sFo
rwar
ds, o
ptio
ns,
swap
sSw
aps
Futu
res,
opt
ions
Futu
res,
opt
ions
Futu
res,
opt
ions
, sw
aps
Futu
res,
opt
ions
, fo
rwar
ds, s
wap
s,
cred
it de
riva
tives
Futu
res,
opt
ions
Ris
k ca
tego
ryIn
tere
st r
ate,
cur
renc
y,
equi
ty, c
omm
odity
Fore
ign
exch
ange
and
in
tere
st r
ate
Inte
rest
rat
e, c
urre
ncy,
eq
uity
, CD
SIn
tere
st r
ate,
CD
SC
omm
odity
, cur
renc
y,
equi
ty, E
TF, i
nter
est
rate
s
Com
mod
ity, c
urre
ncy,
eq
uity
Com
mod
ityIn
tere
st r
ate,
cur
renc
y,
equi
ty, c
omm
odity
, cr
edit
deri
vativ
es
Equi
ty, f
orei
gn
exch
ange
, int
eres
t ra
te, c
omm
odity
Uni
t of
mea
sure
men
tO
TC -
not
iona
l am
ount
s an
d gr
oss
mar
ket v
alue
s Ex
chan
ges
- nu
mbe
r of
con
trac
ts a
nd
turn
over
Aver
age
daily
turn
over
Not
iona
l am
ount
sN
otio
nal a
mou
nts
and
num
ber
of c
ontr
acts
Num
ber
of c
ontr
acts
tr
aded
, not
iona
l tu
rnov
er, o
pen
inte
rest
Num
ber
of c
ontr
acts
tr
aded
Not
iona
l am
ount
s,
open
inte
rest
Not
iona
l am
ount
sO
pen
inte
rest
Not
eD
ata
is a
vaila
ble
in
aggr
egat
e (fo
r al
l sa
mpl
e co
untr
ies
and
by r
egio
n)
Dat
a is
ava
ilabl
e fo
r ea
ch s
ampl
e co
untr
yD
ata
is a
vaila
ble
in
aggr
egat
e D
ata
is a
vaila
ble
in
aggr
egat
eD
ata
is a
vaila
ble
for
each
exc
hang
e m
embe
r
Dat
a is
ava
ilabl
e fo
r ea
ch e
xcha
nge
mem
ber
Trad
ing
tran
sact
ion
data
Der
ivat
ives
dat
a is
for
bank
s on
lyTr
adin
g tr
ansa
ctio
n da
ta
Web
site
Exch
ange
s -
http
://
ww
w.b
is.o
rg/s
tatis
tics/
extd
eriv
.htm
OTC
- h
ttp:
//w
ww
.bis
.or
g/st
atis
tics/
ders
tats
.ht
m
http
://w
ww
.bis
.org
/st
atis
tics/
trie
nnia
lrep
/gu
idel
ines
_cba
nks.
htm
http
://w
ww
.isda
.org
/st
atis
tics/
hist
oric
al.
htm
l
http
://w
ww
.sifm
a.or
g/re
sear
ch/s
tatis
tics.
aspx
http
://w
ww
.wor
ld-
exch
ange
s.or
g/
stat
istic
s
http
://w
ww
.fu
ture
sind
ustr
y.or
g/vo
lum
e-.a
sp
http
://w
ww
.cftc
.gov
/m
arke
trep
orts
/ co
mm
itmen
tsof
trad
ers/
inde
x.ht
m
http
://o
cc.g
ov/t
opic
s/ca
pita
l-m
arke
ts/
finan
cial
-mar
kets
/tr
adin
g/de
riva
tives
/de
riva
tives
-qua
rter
ly-
repo
rt.h
tml
http
://w
ww
.cm
egro
up.
com
/mar
ket-
data
/ da
tam
ine-
hist
oric
al-
data
/equ
ity-e
xecu
tion-
stat
istic
s.ht
ml
Not
e: B
IS =
Ban
k fo
r In
tern
atio
nal S
ettl
emen
ts; B
IS (T
rien
nial
) = B
IS T
rien
nial
Cen
tral
Ban
k Su
rvey
of F
orei
gn E
xcha
nge
and
Der
ivat
ives
Mar
ket A
ctiv
ity; I
SDA
= In
tern
atio
nal S
wap
s an
d D
eriv
ativ
es A
ssoc
iatio
n;
SIFM
A =
Sec
uriti
es In
dust
ry a
nd F
inan
cial
Mar
kets
Ass
ocia
tion;
WFE
= W
orld
Fed
erat
ion
of E
xcha
nges
; FIA
= F
utur
es In
dust
ry A
ssoc
iatio
n; C
FTC
= U
.S. C
omm
odity
Fut
ures
Tra
ding
Com
mis
sion
; OC
C =
U.S
. O
ffic
e of
the
Com
ptro
ller
of th
e C
urre
ncy;
CM
E =
Chi
cago
Mer
cant
ile E
xcha
nge.

84 DERIVING THE ECONOMIC IMPACT OF DERIVATIVES
APPENDIX 4. Largest derivatives exchanges worldwide
Ranked by number of contracts traded in 2012 (millions of contracts)
EXCHANGE COUNTRY TRADING VOLUME EXCHANGE COUNTRY TRADING VOLUME1 CME Group U.S. 2,890.0 11 NYSE Euronext Europe 955.8
2 National Stock Exchange of India India 2,010.5 12 International Securities Exchange U.S. 740.0
3 Korea Exchange S. Korea 1,835.6 13 Dalian Commodity Exchange China 633.0
4 Eurex Germany 1,660.2 14 Shanghai Futures Exchange China 365.3
5 BM&FBOVESPA Brazil 1,632.2 15 Australian Securities Exchange Australia 355.4
6 Chicago Board Options Exchange U.S. 1,134.3 16 Zhengzhou Commodity Exchange China 347.1
7 Moscow Exchange Russia 1,058.9 17 ICE Futures Europe Europe 281.2
8 NASDAQ OMX U.S. 1,010.0 18 BSE Limited India 243.7
9 NYSE Euronext U.S. 990.3 19 ICE Futures U.S. U.S. 206.4
10 MCX-SX India 959.5 20 Japan Exchange Group Inc. (Osaka) Japan 205.1
Ranked by open interest in 2012 (millions of contracts)
EXCHANGE COUNTRY OPEN INTEREST EXCHANGE COUNTRY OPEN INTEREST1 Chicago Board Options Exchange U.S. 257.5 11 Moscow Exchange Russia 7.6
2 Eurex Germany 79.4 12 MexDer Mexico 7.4
3 CME Group U.S. 69.9 13 NASDAQ OMX Nordic Exchanges Nordics 6.6
4 BM&FBOVESPA Brazil 61.1 14 ICE Futures Europe Europe 5.8
5 NYSE Euronext Europe 45.8 15 Hong Kong Exchanges and Clearing Hong Kong 5.3
6 Australian Securities Exchange Australia 19.8 16 Japan Exchange Group Inc. (Osaka) Japan 4.4
7 Johannesburg Stock Exchange South Africa 13.9 17 Montreal Exchange (TMX Group) Canada 4.2
8 MEFF Spain 11.9 18 Singapore Exchange (OTC) Singapore 2.6
9 LSE Group UK 7.8 19 Korea Exchange Korea 2.6
10 National Stock Exchange of India India 7.8 20 MCX-SX India 2.4
Source: World Federation of Exchanges
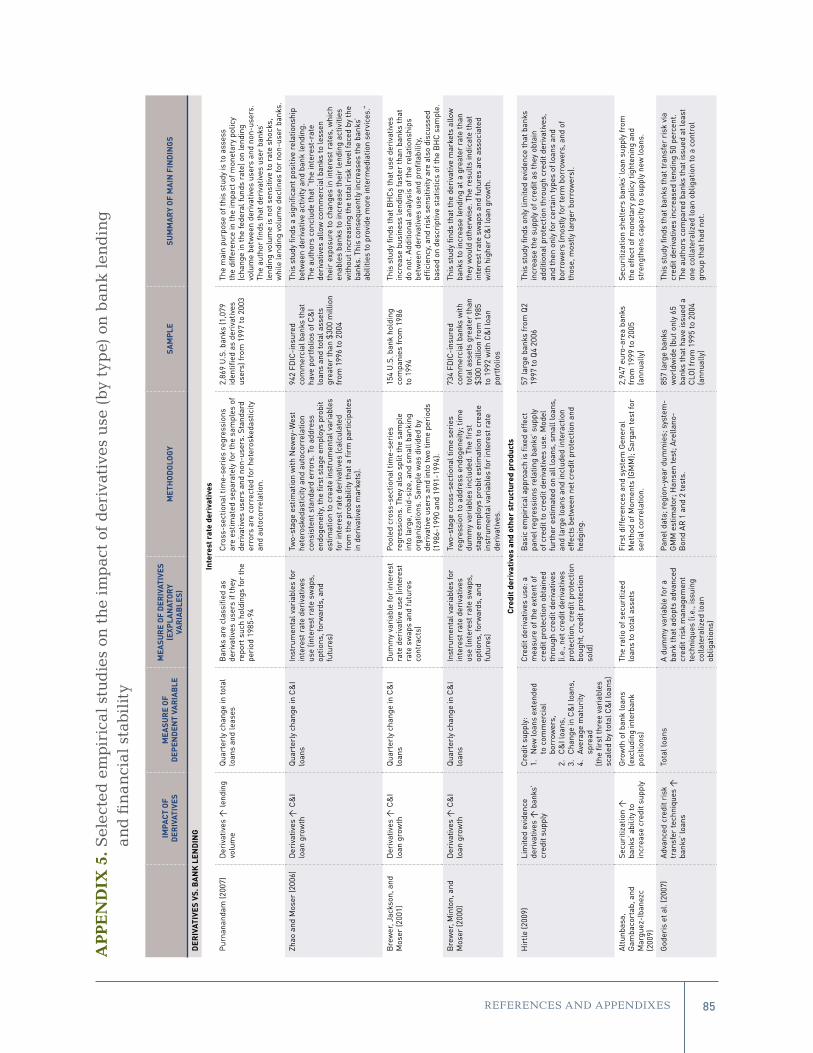
85REFERENCES AND APPENDIXES
AP
PE
ND
IX 5
. S
elec
ted
em
pir
ica
l st
ud
ies
on t
he
imp
act
of d
eriv
ativ
es u
se (
by
typ
e) o
n b
an
k le
nd
ing
an
d fi
na
nci
al
stab
ilit
y
IMPA
CT O
F D
ERIV
ATIV
ESM
EASU
RE
OF
DEP
END
ENT
VAR
IAB
LE
MEA
SUR
E O
F D
ERIV
ATIV
ES
(EXP
LAN
ATO
RY
VAR
IAB
LES)
MET
HO
DO
LOG
YSA
MP
LESU
MM
AR
Y O
F M
AIN
FIN
DIN
GS
DER
IVAT
IVES
VS.
BA
NK
LEN
DIN
G
Inte
rest
rat
e de
riva
tive
s
Pur
nana
ndam
(200
7)D
eriv
ativ
es ↑
lend
ing
volu
me
Qua
rter
ly c
hang
e in
tota
l lo
ans
and
leas
esB
anks
are
cla
ssifi
ed a
s de
riva
tives
use
rs if
they
re
port
suc
h ho
ldin
gs fo
r th
e pe
riod
198
5-94
Cro
ss-s
ectio
nal t
ime-
seri
es r
egre
ssio
ns
are
estim
ated
sep
arat
ely
for
the
sam
ples
of
deri
vativ
es u
sers
and
non
-use
rs. S
tand
ard
erro
rs a
re c
orre
cted
for
hete
rosk
edas
ticity
an
d au
toco
rrel
atio
n.
2,86
9 U
.S. b
anks
(1,0
79
iden
tifie
d as
der
ivat
ives
us
ers)
from
199
7 to
200
3
The
mai
n pu
rpos
e of
this
stu
dy is
to a
sses
s th
e di
ffer
ence
in th
e im
pact
of m
onet
ary
polic
y (c
hang
e in
the
fede
ral f
unds
rat
e) o
n le
ndin
g vo
lum
e be
twee
n de
riva
tives
use
rs a
nd n
on-u
sers
. Th
e au
thor
find
s th
at d
eriv
ativ
es u
ser
bank
s’
lend
ing
volu
me
is n
ot s
ensi
tive
to r
ate
shoc
ks,
whi
le le
ndin
g vo
lum
e de
clin
es fo
r no
n-us
er b
anks
.
Zhao
and
Mos
er (2
006)
Der
ivat
ives
↑ C
&I
loan
gro
wth
Qua
rter
ly c
hang
e in
C&
I lo
ans
Inst
rum
enta
l var
iabl
es fo
r in
tere
st r
ate
deri
vativ
es
use
(inte
rest
rat
e sw
aps,
op
tions
, for
war
ds, a
nd
futu
res)
Two-
stag
e es
timat
ion
with
New
ey-W
est
hete
rosk
edas
ticity
and
aut
ocor
rela
tion
cons
iste
nt s
tand
ard
erro
rs. T
o ad
dres
s en
doge
neity
, the
firs
t sta
ge e
mpl
oys
prob
it es
timat
ion
to c
reat
e in
stru
men
tal v
aria
bles
fo
r in
tere
st r
ate
deri
vativ
es (c
alcu
late
d fr
om th
e pr
obab
ility
that
a fi
rm p
artic
ipat
es
in d
eriv
ativ
es m
arke
ts).
942
FDIC
-ins
ured
co
mm
erci
al b
anks
that
ha
ve p
ortf
olio
s of
C&
I lo
ans
and
tota
l ass
ets
grea
ter
than
$30
0 m
illio
n fr
om 1
996
to 2
004
This
stu
dy fi
nds
a si
gnifi
cant
pos
itive
rel
atio
nshi
p be
twee
n de
riva
tive
activ
ity a
nd b
ank
lend
ing.
Th
e au
thor
s co
nclu
de th
at “
the
inte
rest
-rat
e de
riva
tives
allo
w c
omm
erci
al b
anks
to le
ssen
th
eir
expo
sure
to c
hang
es in
inte
rest
rat
es, w
hich
en
able
s ba
nks
to in
crea
se th
eir
lend
ing
activ
ities
w
ithou
t inc
reas
ing
the
tota
l ris
k le
vel f
aced
by
the
bank
s. T
his
cons
eque
ntly
incr
ease
s th
e ba
nks’
ab
ilitie
s to
pro
vide
mor
e in
term
edia
tion
serv
ices
.”
Bre
wer
, Jac
kson
, and
M
oser
(200
1)
Der
ivat
ives
↑ C
&I
loan
gro
wth
Qua
rter
ly c
hang
e in
C&
I lo
ans
Dum
my
vari
able
for
inte
rest
ra
te d
eriv
ativ
e us
e (in
tere
st
rate
sw
aps
and
futu
res
cont
ract
s)
Poo
led
cros
s-se
ctio
nal t
ime-
seri
es
regr
essi
ons.
The
y al
so s
plit
the
sam
ple
into
larg
e, m
id-s
ize,
and
sm
all b
anki
ng
orga
niza
tions
. Sam
ple
was
div
ided
by
deri
vativ
e us
ers
and
into
two
time
peri
ods
(198
6-19
90 a
nd 1
991-
1994
).
154
U.S
. ban
k ho
ldin
g co
mpa
nies
from
198
6 to
199
4
This
stu
dy fi
nds
that
BH
Cs
that
use
der
ivat
ives
in
crea
se b
usin
ess
lend
ing
fast
er th
an b
anks
that
do
not
. Add
ition
al a
naly
sis
of th
e re
latio
nshi
ps
betw
een
deri
vativ
es u
se a
nd p
rofit
abili
ty,
effic
ienc
y, a
nd r
isk
sens
itivi
ty a
re a
lso
disc
usse
d ba
sed
on d
escr
iptiv
e st
atis
tics
of th
e B
HC
sam
ple.
Bre
wer
, Min
ton,
and
M
oser
(200
0)D
eriv
ativ
es ↑
C&
I lo
an g
row
thQ
uart
erly
cha
nge
in C
&I
loan
sIn
stru
men
tal v
aria
bles
for
inte
rest
rat
e de
riva
tives
us
e (in
tere
st r
ate
swap
s,
optio
ns, f
orw
ards
, and
fu
ture
s)
Two-
stag
e cr
oss-
sect
iona
l tim
e se
ries
re
gres
sion
to a
ddre
ss e
ndog
enei
ty; t
ime
dum
my
vari
able
s in
clud
ed. T
he fi
rst
stag
e em
ploy
s pr
obit
estim
atio
n to
cre
ate
inst
rum
enta
l var
iabl
es fo
r in
tere
st r
ate
deri
vativ
es.
734
FDIC
-ins
ured
co
mm
erci
al b
anks
with
to
tal a
sset
s gr
eate
r th
an
$300
mill
ion
from
198
5 to
199
2 w
ith C
&I l
oan
port
folio
s
This
stu
dy fi
nds
that
the
deri
vativ
e m
arke
ts a
llow
ba
nks
to in
crea
se le
ndin
g at
a g
reat
er r
ate
than
th
ey w
ould
oth
erw
ise.
The
res
ults
indi
cate
that
in
tere
st r
ate
swap
s an
d fu
ture
s ar
e as
soci
ated
w
ith h
ighe
r C
&I l
oan
grow
th.
Cred
it d
eriv
ativ
es a
nd o
ther
str
uctu
red
prod
ucts
Hir
tle
(200
9)Li
mite
d ev
iden
ce
deri
vativ
es ↑
ban
ks’
cred
it su
pply
Cre
dit s
uppl
y:
1.
New
loan
s ex
tend
ed
to c
omm
erci
al
borr
ower
s,
2.
C&
I loa
ns,
3.
Cha
nge
in C
&I l
oans
, 4.
Av
erag
e m
atur
ity
spre
ad
(the
firs
t thr
ee v
aria
bles
sc
aled
by
tota
l C&
I loa
ns)
Cre
dit d
eriv
ativ
es u
se: a
m
easu
re o
f the
ext
ent o
f cr
edit
prot
ectio
n ob
tain
ed
thro
ugh
cred
it de
riva
tives
(i.
e., n
et c
redi
t der
ivat
ives
pr
otec
tion,
cre
dit p
rote
ctio
n bo
ught
, cre
dit p
rote
ctio
n so
ld)
Bas
ic e
mpi
rica
l app
roac
h is
fixe
d ef
fect
pa
nel r
egre
ssio
ns r
elat
ing
bank
s’ s
uppl
y of
cre
dit t
o cr
edit
deri
vativ
es u
se. M
odel
fu
rthe
r es
timat
ed o
n al
l loa
ns, s
mal
l loa
ns,
and
larg
e lo
ans
and
incl
uded
inte
ract
ion
effe
cts
betw
een
net c
redi
t pro
tect
ion
and
hedg
ing.
57 la
rge
bank
s fr
om Q
2 19
97 to
Q4
2006
Th
is s
tudy
find
s on
ly li
mite
d ev
iden
ce th
at b
anks
in
crea
se th
e su
pply
of c
redi
t as
they
obt
ain
addi
tiona
l pro
tect
ion
thro
ugh
cred
it de
riva
tives
, an
d th
en o
nly
for
cert
ain
type
s of
loan
s an
d bo
rrow
ers
(mos
tly fo
r te
rm b
orro
wer
s, a
nd o
f th
ose,
mos
tly la
rger
bor
row
ers)
.
Alt
unba
sa,
Gam
baco
rtab
, and
M
argu
ez-I
bane
zc
(200
9)
Secu
ritiz
atio
n ↑
ba
nks’
abi
lity
to
incr
ease
cre
dit s
uppl
y
Gro
wth
of b
ank
loan
s (e
xclu
ding
inte
rban
k po
sitio
ns)
The
ratio
of s
ecur
itize
d lo
ans
to to
tal a
sset
s Fi
rst d
iffer
ence
s an
d sy
stem
Gen
eral
M
etho
d of
Mom
ents
(GM
M);
Sarg
an te
st fo
r se
rial
cor
rela
tion.
2,94
7 eu
ro-a
rea
bank
s fr
om 1
999
to 2
005
(ann
ually
)
Secu
ritiz
atio
n sh
elte
rs b
anks
’ loa
n su
pply
from
th
e ef
fect
of m
onet
ary
polic
y tig
hten
ing
and
stre
ngth
ens
capa
city
to s
uppl
y ne
w lo
ans.
God
eris
et a
l. (2
007)
Adv
ance
d cr
edit
risk
tr
ansf
er te
chni
ques
↑
bank
s’ lo
ans
Tota
l loa
nsA
dum
my
vari
able
for
a ba
nk th
at a
dopt
s ad
vanc
ed
cred
it ri
sk m
anag
emen
t te
chni
ques
(i.e
., is
suin
g co
llate
raliz
ed lo
an
oblig
atio
ns)
Pan
el d
ata;
reg
ion-
year
dum
mie
s; s
yste
m-
GM
M e
stim
ator
; Han
sen
test
; Are
llano
-B
ond
AR
1 a
nd 2
test
s.
857
larg
e ba
nks
wor
ldw
ide
(but
onl
y 65
ba
nks
that
hav
e is
sued
a
CLO
) fro
m 1
995
to 2
004
(ann
ually
)
This
stu
dy fi
nds
that
ban
ks th
at tr
ansf
er r
isk
via
cred
it de
riva
tives
incr
ease
d le
ndin
g 50
per
cent
. Th
e au
thor
s co
mpa
red
bank
s th
at is
sued
at l
east
on
e co
llate
raliz
ed lo
an o
blig
atio
n to
a c
ontr
ol
grou
p th
at h
ad n
ot.

86 DERIVING THE ECONOMIC IMPACT OF DERIVATIVES
IMPA
CT O
F D
ERIV
ATIV
ESM
EASU
RE
OF
DEP
END
ENT
VAR
IAB
LE
MEA
SUR
E O
F D
ERIV
ATIV
ES
(EXP
LAN
ATO
RY
VAR
IAB
LES)
MET
HO
DO
LOG
YSA
MP
LESU
MM
AR
Y O
F M
AIN
FIN
DIN
GS
Ceb
enoy
an a
nd
Stra
han
(200
4)R
isk
man
agem
ent
(loan
sal
es) ↑
loan
s to
bus
ines
ses
C&
I loa
ns/a
sset
s an
d co
mm
erci
al r
eal e
stat
e lo
ans/
asse
ts
Loan
sal
es a
nd lo
an
purc
hase
sC
ross
-sec
tiona
l, re
duce
d fo
rm r
egre
ssio
nsA
ll U
.S. c
omm
erci
al
bank
s fr
om th
e C
all
Rep
orts
from
Jun
e 19
87
to J
une
1988
(qua
rter
ly)
The
auth
ors
poin
t out
that
whi
le a
ctiv
ity in
the
loan
sal
es m
arke
t is
asso
ciat
ed w
ith m
ore
loan
s to
bus
ines
ses,
this
type
of l
oan
is c
onsi
dere
d ri
sky.
The
aut
hors
als
o lo
ok a
t the
impa
cts
of
bank
act
ivity
in th
e lo
an s
ales
mar
ket o
n ca
pita
l st
ruct
ure,
pro
fits,
and
ris
k, in
add
ition
to th
e im
pact
of l
endi
ng.
DER
IVAT
IVES
VS.
FIN
AN
CIA
L ST
AB
ILIT
Y
Cyr
ee, H
uang
, and
Li
ndle
y (2
012)
Per
form
ance
of b
anks
th
at a
re d
eriv
ativ
es
user
s is
not
diff
eren
t fr
om n
on-u
sers
dur
ing
the
finan
cial
cri
sis
peri
od.
Ban
k pe
rfor
man
ce
prox
ied
by th
ree
mea
sure
s: b
uy-a
nd-h
old
retu
rns;
buy
-and
-hol
d ab
norm
al r
etur
ns; S
harp
e ra
tios.
Dum
my
vari
able
s fo
r di
ffer
ent t
ypes
of
deri
vativ
es u
se (i
nter
est
rate
, for
eign
exc
hang
e, a
nd
cred
it de
faul
t sw
ap)
Hec
kman
’s tw
o-st
age
proc
edur
e to
con
trol
fo
r th
e se
lect
ion
of b
anks
that
ent
er in
to
deri
vativ
es c
ontr
acts
. (Th
e fir
st s
tage
use
s pr
obit
regr
essi
ons
to e
stim
ate
the
deci
sion
th
at b
anks
will
use
der
ivat
ives
. The
fitt
ed
valu
e of
the
prob
it re
gres
sion
inde
x fu
nctio
n is
then
use
d to
cal
cula
te in
vers
e M
ills
ratio
s. T
hese
rat
ios
are
incl
uded
to
corr
ect f
or p
oten
tial s
elf-
sele
ctio
n bi
as.
Follo
wed
by
mul
tivar
iate
reg
ress
ion.
)
335
U.S
. com
mer
cial
ba
nks
from
200
3 to
200
5 an
d 20
07 to
200
9
This
stu
dy a
sses
ses
whe
ther
the
mar
ket
perf
orm
ance
of b
anks
usi
ng th
ese
deri
vativ
es
diff
ered
from
ban
ks th
at d
id n
ot u
se th
em. T
he
auth
ors
find
no e
vide
nce
indi
catin
g th
e w
ides
prea
d as
sert
ion
that
der
ivat
ives
use
incr
ease
d ba
nks’
sp
ecul
ativ
e be
havi
or a
nd s
igni
fican
tly c
ontr
ibut
ed
to th
e lo
ss o
f val
ue d
urin
g th
e 20
07-0
9 su
bpri
me
mor
tgag
e cr
isis
.
Rod
rigu
ez-M
oren
o,
May
ordo
mo,
and
Peñ
a (2
012)
• Fo
reig
n ex
chan
ge
and
cred
it de
riva
tives
↑
syst
emic
ris
k•
Inte
rest
rat
e de
riva
tives
↓
syst
emic
ris
k
Five
mea
sure
s ar
e co
nstr
ucte
d (b
ased
on
, e.g
., va
lue-
at-r
isk
and
expe
cted
sho
rtfa
ll)
to a
sses
s ba
nks’
co
ntri
butio
ns to
sys
tem
ic
risk
Tota
l fai
r va
lues
of f
ive
type
s of
der
ivat
ives
: cre
dit,
inte
rest
rat
e, fo
reig
n ex
chan
ge, e
quity
, and
co
mm
odity
A p
anel
reg
ress
ion
anal
ysis
(Pra
is-W
inst
en
regr
essi
on w
ith c
orre
late
d pa
nels
-co
rrec
ted
stan
dard
err
ors,
or
PC
SEs)
91 la
rge
U.S
. ban
k ho
ldin
g co
mpa
nies
(ass
ets
> $5
bi
llion
) fro
m 2
002
to 2
011
This
stu
dy e
xam
ines
the
impa
ct o
f der
ivat
ives
ho
ldin
gs o
n th
e ba
nks’
indi
vidu
al c
ontr
ibut
ions
to
syst
emic
ris
k. T
he fi
ndin
gs s
ugge
st th
at c
redi
t and
fo
reig
n ex
chan
ge d
eriv
ativ
es a
nd d
eriv
ativ
es h
eld
for
trad
ing
purp
oses
con
trib
ute
to s
yste
mic
ris
k.
The
auth
ors
stre
ss th
at th
e pr
opor
tion
of n
on-
perf
orm
ing
loan
s ov
er to
tal l
oans
and
the
leve
rage
ra
tio h
ave
muc
h st
rong
er im
pact
on
syst
emic
ris
k th
an d
eriv
ativ
es h
oldi
ngs.
Nor
den,
Bus
ton,
and
W
agne
r (2
011)
• C
redi
t der
ivat
ives
↓
bank
’s lo
an s
prea
ds.
• D
urin
g th
e cr
isis
, ba
nks
activ
e in
cr
edit
deri
vativ
es c
ut
lend
ing
less
.
• Lo
an s
prea
ds p
roxi
ed
by s
prea
d of
syn
dica
ted
loan
s ov
er L
IBO
R
• B
ank
lend
ing
prox
ied
by n
et c
harg
e-of
fs
and
com
mer
cial
loan
s sc
aled
by
tota
l ass
ets
Gro
ss a
nd n
et p
ositi
ons
of
cred
it de
riva
tives
(in
form
of
cred
it de
faul
t sw
aps)
sca
led
by to
tal a
sset
s
OLS
and
fixe
d ef
fect
reg
ress
ions
76 U
.S. b
anks
from
the
first
qua
rter
of 1
997
to
the
four
th q
uart
er o
f 200
9 (t
he s
ubsa
mpl
e fo
r th
e cr
isis
per
iod
is fr
om 2
007
to 2
009)
This
stu
dy d
iscu
sses
sev
eral
pot
entia
l cha
nnel
s th
roug
h w
hich
cre
dit d
eriv
ativ
es a
ffec
t ban
ks’
lend
ing
beha
vior
and
wid
er e
cono
mic
act
ivity
. Th
e au
thor
s fin
d th
at (g
ross
) cre
dit d
eriv
ativ
es
low
er c
orpo
rate
bon
d sp
read
s, s
uppo
rtin
g th
e ri
sk
man
agem
ent c
hann
el, a
nd th
is b
enef
it is
pas
sed
on to
bor
row
ers.
Dur
ing
the
cris
is o
f 200
7 to
200
9,
bank
s th
at u
se c
redi
t der
ivat
ives
cut
bac
k le
ndin
g le
ss th
an o
ther
ban
ks.
AP
PE
ND
IX 5
. S
elec
ted
em
pir
ica
l st
ud
ies
on t
he
imp
act
of d
eriv
ativ
es u
se (
by
typ
e) o
n b
an
k le
nd
ing
an
d fi
na
nci
al
stab
ilit
y (C
onti
nu
ed)

87REFERENCES AND APPENDIXES
AP
PE
ND
IX 6
. S
elec
ted
em
pir
ica
l st
ud
ies
on t
he
imp
act
of d
eriv
ativ
es u
se (
by
typ
e) o
n n
on-fi
na
nci
al
firm
s’ g
row
th
an
d i
nve
stm
ent
opp
ortu
nit
ies
IMPA
CT O
F D
ERIV
ATIV
ESM
EASU
RE
OF
DEP
END
ENT
VAR
IAB
LEM
EASU
RE
OF
DER
IVAT
IVES
(E
XPLA
NAT
OR
Y VA
RIA
BLE
S)M
ETH
OD
OLO
GY
SAM
PLE
SUM
MA
RY
OF
MA
IN F
IND
ING
S
Vari
ous
Chi
orea
n, D
onoh
oe, a
nd
Soug
iann
is (2
012)
No
impa
ct o
n fir
m’s
gr
owth
opp
ortu
nitie
sG
row
th o
ppor
tuni
ties
prox
ied
by R
&D
ex
pend
iture
, Tob
in’s
Q,
mar
ket-
to-b
ook
ratio
, pr
ice-
to-e
arni
ngs
ratio
A d
umm
y va
riab
le e
qual
s to
1
if th
e fir
m r
epor
ts a
pos
ition
in
deri
vativ
es; a
dum
my
vari
able
fo
r ne
w d
eriv
ativ
es u
sers
.
Two-
stag
e es
timat
ion
to
addr
ess
endo
gene
ity. F
irst
st
age
uses
a lo
git m
odel
to
estim
ate
the
prob
abili
ty th
at
a fir
m u
ses
deri
vativ
es. T
he
seco
nd s
tage
est
imat
es th
e im
pact
of d
eriv
ativ
es o
n gr
owth
op
port
uniti
es.
3,85
8 U
.S. n
on-f
inan
cial
, non
-ut
ility
firm
s fr
om 2
000
to 2
008
(487
new
der
ivat
ives
use
rs
duri
ng th
is p
erio
d id
entif
ied)
This
stu
dy fi
nds
no e
vide
nce
that
der
ivat
ives
us
e le
ads
to m
ore
grow
th o
ppor
tuni
ties
and
redu
ces
unde
rinv
estm
ent.
Bar
tram
, Bro
wn,
and
C
onra
d (2
011)
Der
ivat
ives
↑ fi
rm v
alue
an
d ↓
firm
ris
kFi
rm’s
ris
k pr
oxie
d by
cas
h flo
w v
olat
ility
, st
anda
rd d
evia
tion
of s
tock
re
turn
s, a
nd m
arke
t bet
as;
firm
’s v
alue
pro
xied
by
Tobi
n’s
Q
Dum
my
vari
able
s fo
r th
e us
e of
exc
hang
e ra
te, i
nter
est
rate
, and
com
mod
ity p
rice
de
riva
tives
Pro
pens
ity s
core
mat
chin
g (a
llow
s fo
r a
sens
itivi
ty a
naly
sis
on th
e se
lect
ion
bias
)
6,88
8 no
n-fin
anci
al fi
rms
head
quar
tere
d in
47
coun
trie
s fr
om 1
998
to 2
003
This
stu
dy fi
nds
stro
ng e
vide
nce
that
the
use
of d
eriv
ativ
es r
educ
es to
tal r
isk
and
syst
emic
ris
k. T
he r
esul
t is
wea
ker
for
the
rela
tions
hip
betw
een
deri
vativ
es a
nd fi
rm
valu
e. T
he a
utho
rs fi
nd li
ttle
evi
denc
e th
at
deri
vativ
e ty
pe m
atte
rs.
Gay
, Lin
, and
Sm
ith (2
011)
Der
ivat
ives
↓ fi
rm’s
co
st o
f equ
ity c
apita
l Th
e co
st o
f equ
ity is
es
timat
ed fr
om a
n an
nual
ri
sk p
rem
ium
equ
atio
n.
A d
umm
y va
riab
le fo
r de
riva
tives
use
var
iabl
e an
d th
e no
tiona
l am
ount
of
deri
vativ
es h
oldi
ngs
(als
o us
e du
mm
ies
for
inte
rest
rat
e,
fore
ign
curr
ency
, or
com
mod
ity
deri
vativ
es)
A p
oole
d re
gres
sion
mod
el a
nd
sim
ulta
neou
s eq
uatio
n (t
o ac
coun
t fo
r en
doge
neity
con
cern
s re
late
d to
a fi
rm’s
der
ivat
ives
use
and
ca
pita
l str
uctu
re d
ecis
ions
).
A la
rge
sam
ple
of U
.S. n
on-
finan
cial
firm
s fr
om 1
992
to
1996
and
200
2 to
200
4
This
stu
dy fi
nds
firm
s th
at u
se d
eriv
ativ
es
have
a lo
wer
cos
t of e
quity
than
non
-use
rs
by 2
4 to
78
basi
s po
ints
, att
ribu
ted
to
deri
vativ
es u
sers
hav
ing
low
er s
yste
mic
(m
arke
t) r
isk
and
low
er S
MB
(sm
all m
inus
bi
g si
ze) b
eta.
Gua
y (1
999)
D
eriv
ativ
es ↓
firm
ris
kC
hang
e in
firm
s’ to
tal r
isk
(def
ined
as
the
annu
aliz
ed
stan
dard
dev
iatio
n of
dai
ly
stoc
k re
turn
s)
The
aggr
egat
e no
tiona
l pr
inci
pal o
f a fi
rm’s
der
ivat
ives
po
sitio
ns s
cale
d by
mar
ket
valu
e of
ass
ets.
OLS
reg
ress
ions
; log
it re
gres
sion
s to
exa
min
e fir
ms’
dec
isio
n to
be
gin
usin
g de
riva
tives
.
All
non-
finan
cial
firm
s in
the
Com
pact
Dis
clos
ure
data
base
fr
om J
une
1990
to D
ecem
ber
1994
(335
new
der
ivat
ives
us
ers
iden
tifie
d)
This
stu
dy fi
nds
that
firm
ris
k de
clin
es
follo
win
g de
riva
tives
use
. The
aut
hor
conc
lude
s th
at h
is fi
ndin
g is
con
sist
ent w
ith
the
use
of d
eriv
ativ
es fo
r he
dgin
g.
Curr
ency
Alla
yann
is, L
el, a
nd M
iller
(2
007)
Der
ivat
ives
↑ fi
rm v
alue
Fi
rm’s
val
ue p
roxi
ed b
y To
bin’
s Q
A
dum
my
vari
able
for
fore
ign
curr
ency
der
ivat
ives
usa
geFi
xed
effe
cts
regr
essi
ons
1,60
5 fo
reig
n fir
ms
in 3
9 co
untr
ies
with
exc
hang
e-tr
aded
Am
eric
an d
epos
itary
re
ceip
ts (A
DR
s) (i
.e.,
thos
e th
at
are
cros
s-lis
ted
in th
e U
.S.)
from
199
0 to
199
9.
This
stu
dy fi
nds
that
the
use
of c
urre
ncy
deri
vativ
es in
crea
ses
firm
val
ue b
y 9%
to
20%
for
thos
e w
ith fo
reig
n ri
sk e
xpos
ure.
It
also
sho
ws
the
exte
nt to
whi
ch th
is p
ositi
ve
asso
ciat
ion
betw
een
firm
val
ue a
nd fo
reig
n cu
rren
cy d
eriv
ativ
es d
epen
ds o
n co
untr
ies’
in
tern
al a
nd e
xter
nal c
orpo
rate
gov
erna
nce
stru
ctur
es.
Kim
, Mat
hur,
and
Nam
(2
006)
Der
ivat
ives
↑ fi
rm v
alue
Firm
’s v
alue
pro
xied
by
Tobi
n’s
Q
Fina
ncia
l hed
ge r
atio
m
easu
red
as th
e no
tiona
l am
ount
of c
urre
ncy
deri
vativ
es d
ivid
ed b
y fo
reig
n ac
tiviti
es; o
pera
tiona
l hed
ge
is c
onst
ruct
ed u
sing
firm
’s
info
rmat
ion
such
as
oper
atin
g se
gmen
ts a
nd g
eogr
aphi
c ar
eas.
Logi
t reg
ress
ions
for
the
rela
tion
betw
een
oper
atio
nal a
nd fi
nanc
ial
hedg
ing;
thre
e-st
age
leas
t sq
uare
s fo
r th
e re
latio
n be
twee
n he
dgin
g an
d fo
reig
n ex
chan
ge
risk
exp
osur
e; O
LS r
egre
ssio
n fo
r th
e re
latio
n be
twee
n he
dgin
g an
d fir
m v
alue
.
424
U.S
. fir
ms
from
199
6 to
200
0. F
irm
s re
port
ing
fore
ign
sale
s ar
e op
erat
iona
lly
hedg
ed, w
hile
firm
s re
port
ing
only
exp
ort s
ales
are
non
-op
erat
iona
lly h
edge
d.
This
stu
dy in
vest
igat
es th
e re
latio
nshi
p be
twee
n op
erat
iona
l and
fina
ncia
l hed
ging
ac
tiviti
es a
nd th
eir
effe
cts
on fo
reig
n ex
chan
ge r
isk
expo
sure
and
firm
val
ue.
The
resu
lts
indi
cate
that
fina
ncia
l hed
ging
ad
ds 5
.4%
to fi
rm v
alue
on
aver
age
and
oper
atio
nal h
edgi
ng in
crea
ses
firm
val
ue b
y 4.
8% to
17.
9%.
Alla
yann
is a
nd W
esto
n (2
001)
Der
ivat
ives
↑ fi
rm v
alue
Firm
val
ue p
roxi
ed b
y To
bin’
s Q
A
dum
my
vari
able
for
fore
ign
curr
ency
der
ivat
ives
use
; gr
oss
valu
e of
fore
ign
curr
ency
de
riva
tives
Poo
led
and
fixed
eff
ects
re
gres
sion
s72
0 la
rge
U.S
. non
-fin
anci
al
firm
s (a
sset
s >
$500
mill
ion)
fr
om 1
990
to 1
995
The
stud
y fin
ds fi
rms
that
face
cur
renc
y ri
sk
and
use
curr
ency
der
ivat
ives
hav
e a
4.9%
hi
gher
val
ue th
an fi
rms
that
do
not u
se
curr
ency
der
ivat
ives
.

88 DERIVING THE ECONOMIC IMPACT OF DERIVATIVES
IMPA
CT O
F D
ERIV
ATIV
ESM
EASU
RE
OF
DEP
END
ENT
VAR
IAB
LEM
EASU
RE
OF
DER
IVAT
IVES
(E
XPLA
NAT
OR
Y VA
RIA
BLE
S)M
ETH
OD
OLO
GY
SAM
PLE
SUM
MA
RY
OF
MA
IN F
IND
ING
S
Alla
yann
is a
nd O
fek
(200
1)D
eriv
ativ
es ↓
ex
chan
ge-r
ate
expo
sure
Ex
chan
ge-r
ate
expo
sure
pr
oxie
d by
the
sens
itivi
ty
of fi
rm’s
sto
ck r
etur
n to
an
unan
ticip
ated
cha
nge
in a
n ex
chan
ge r
ate
A fi
rm’s
rat
io o
f for
eign
cu
rren
cy d
eriv
ativ
es to
tota
l as
sets
OLS
reg
ress
ions
, wei
ghte
d le
ast
squa
res,
and
pro
bit e
stim
atio
nsA
sam
ple
of S
&P
500
non
-fin
anci
al fi
rms
for
1993
, m
onth
ly d
ata
(als
o 19
92-1
994,
19
91-1
995)
This
stu
dy fi
nds
that
fore
ign
curr
ency
de
riva
tives
red
uce
a fir
m’s
fore
ign
exch
ange
-rat
e ex
posu
re. T
he a
utho
rs
conc
lude
that
firm
s us
e de
riva
tives
for
hedg
ing,
not
spe
cula
tive
purp
oses
. Fir
m’s
de
cisi
on to
use
der
ivat
ives
and
its
rela
tion
to e
xpos
ure
fact
ors
(i.e.
, for
eign
sal
es a
nd
trad
e) a
re a
lso
exam
ined
.
Com
mod
ity
Mac
kay
and
Moe
ller
(200
7) D
eriv
ativ
es ↑
firm
val
ueFi
rm v
alue
pro
xied
by
Tobi
n’s
QD
umm
y va
riab
les
for
the
leve
l of
der
ivat
ives
use
and
type
of
inst
rum
ent,
whi
ch in
clud
e fin
anci
al (e
.g.,
inte
rest
rat
es,
fore
ign
exch
ange
) and
ene
rgy-
rela
ted
deri
vativ
es
Sim
ulta
neou
s eq
uatio
n re
gres
sion
s; G
MM
34 o
il re
finer
s fr
om th
e C
RSP
-C
ompu
stat
dat
a se
t fro
m
Mar
ch 1
985
to J
une
2004
(q
uart
erly
dat
a)
This
stu
dy fi
nds
that
in th
e ca
se o
f oil
refin
ers,
a r
isk
man
agem
ent p
rogr
am
subs
tant
ially
enh
ance
s fir
m v
alue
.
Jin
and
Jori
on (2
006)
No
impa
ct o
n fir
m v
alue
; de
riva
tives
↓ fi
rm’s
st
ock
pric
e se
nsiti
vity
to
oil a
nd g
as p
rice
s.
Firm
val
ue p
roxi
ed b
y To
bin’
s Q
A d
umm
y va
riab
le a
nd th
e ex
tent
of h
edgi
ng a
ctiv
ities
(t
he la
tter
mea
sure
d by
the
ratio
s of
tota
l hed
ges
to
prod
uctio
n an
d re
serv
es).
Hed
ging
act
iviti
es r
efer
s to
fu
ture
s, o
ptio
ns, o
r sw
ap
cont
ract
s as
wel
l as
fixed
pri
ce
phys
ical
del
iver
y co
ntra
cts
and
volu
met
ric
prod
uctio
n pa
ymen
ts
OLS
reg
ress
ion
with
tim
e du
mm
ies
and
a H
uber
-Whi
te
sand
wic
h es
timat
e of
sta
ndar
d er
rors
that
acc
ount
s fo
r cl
uste
ring
acr
oss
firm
s an
d he
tero
sked
astic
ity
119
U.S
. oil
and
gas
firm
s fr
om
1998
to 2
001
This
stu
dy fi
nds
no d
iffer
ence
in fi
rm v
alue
be
twee
n th
ose
that
hed
ge a
nd th
ose
that
do
not.
How
ever
, the
aut
hors
find
that
hed
ging
re
duce
s a
firm
’s s
tock
pri
ce s
ensi
tivity
to o
il an
d ga
s pr
ices
.
Car
ter,
Rog
ers,
and
Si
mki
ns (2
006)
Der
ivat
ives
↑ fi
rm v
alue
Firm
val
ue p
roxi
ed b
y To
bin’
s Q
Hed
ging
act
ivity
pro
xied
by
the
perc
enta
ge o
f nex
t yea
r’s
fuel
re
quir
emen
ts h
edge
d. S
wap
s,
colla
rs, a
nd o
ptio
ns a
re a
mon
g ai
rlin
es’ i
nstr
umen
ts
Poo
led
OLS
and
Fea
sibl
e G
ener
aliz
ed L
east
Squ
ares
(F
GLS
); ye
ar d
umm
ies
incl
uded
28 a
irlin
es fr
om 1
992
to 2
003
(list
from
Fin
anci
al M
anag
emen
t in
200
6)
This
pap
er’s
res
ults
sug
gest
that
jet f
uel
hedg
ing
incr
ease
s th
e va
lue
of U
.S. a
irlin
e fir
ms
by 5
% to
10%
.
AP
PE
ND
IX 6
. S
elec
ted
em
pir
ica
l st
ud
ies
on t
he
imp
act
of d
eriv
ativ
es u
se (
by
typ
e) o
n n
on-fi
na
nci
al
firm
s’ g
row
th
an
d i
nve
stm
ent
opp
ortu
nit
ies
(con
tin
ued
)

89REFERENCES AND APPENDIXES
APPENDIX 7. Bank-specific variables and item ID number of derivatives from Call Reports
DEFINITION/NOTE ITEM NUMBER AND NOTES1
Derivatives variables
Derivatives Interest rate contracts +foreign exchange contracts + equity, commodity, & other contracts + credit derivatives (alternately, futures + forwards + options + swaps + credit derivatives)
UBPRE278 + UBPRA534 + UBPRA535
Interest rate contracts Total notional amount (e.g., gross amount) of derivative interest rate contracts
UBPRE279
Foreign exchange contracts Total notional amount (e.g., gross amount) of derivative foreign exchange contracts
UBPRE280
Equity, commodity, and other contracts Total notional amount of derivative equity, commodity, and other contracts
UBPRE281
Credit derivatives Credit derivatives on which the bank is guarantor + credit derivatives on which the bank is beneficiary
UBPRA534 + UBPRA535
Futures Futures interest rate contracts + futures foreign exchange contracts + futures equity exchange contracts + futures commodity and other contracts
RCFD8693 + RCFD8694 +RCFD8695 + RCFD8696
Forwards Forward interest rate contracts + forward foreign exchange contracts + forward equity exchange contracts + forward commodity and other contracts
RCFD8697 + RCFD8698 +RCFD8699 + RCFD8700
Options Written options + purchased options, both exchange-traded and over-the-counter
UBPRE283 + UBPRE286
Options (exchange-traded only) Exchange-traded written options + Exchange-traded purchased options UBPRE284 + UBPRE287
Options (OTC only) Over-the-counter written options + over-the-counter purchased options UBPRE285 + UBPRE288
Swaps Interest rate swaps + foreign exchange swaps + equity swaps + commodity and other swaps
UBPRE289
Bank-specific variables
Total loans Total loans and leases held for sale + loans and leases not held for sale, net of unearned income (gross)
UBPR5369 + UBPRB528
Commercial and industrial (C&I) loans Total commercial and industrial loans UBPR1766
Individual loans Domestic-office loans to individuals for household, family, and other personal expenditures
UBPRD665
Real estate loans Total of domestic-office loans secured by real estate UBPR1410
Total assets (consolidated) Amount of total assets UBPR2170
Total equity capital Total bank equity capital plus non-controlling (minority) interests in consolidated subsidiaries
UBPRG105
Liquid assets Calculated from: cash + federal funds sold and securities purchased under agreements to resell + liquid securities
Cash Amount of cash. RCFD0010
Federal funds sold and securities purchased under agreements to resell
Federal funds sold in domestic offices + securities purchased under agreements to resell.
RCONB987 + RCFDB989
Liquid securities U.S. Treasury securities + U.S. government agency obligations + securities issued by states and political subdivisions (securities held-to-maturity and available-for-sale)
RCFD0211 + RCFD1289 + RCFD1294 + RCFD8496 + RCFD1287 + RCFD1293 + RCFD1298 + RCFD8499
Unused commitments as a percent of total assets
The unused portion of all commercial & industrial loan commitments, commitments for loans to financial institutions, and all other commitments divided by total assets
UBPRE266
Net interest margin Net interest income as a percentage of average earning assets. Total interest income on a tax-equivalent basis, less total interest expense, divided by the average of the respective asset accounts involved in generating interest income
UBPRE018
Return on average assets Net Income as a percentage of average assets. Average assets = a year-to-date average of the average assets reported in the Report of Condition Schedule RC-K. Thus for the first quarter of the year, the average assets from Call Schedule RC-K quarter will appear, while at the end of year, assets for all four quarters would be averaged.
UBPRE013
1. Items prefixed with “UBPR” are taken from the Uniform Bank Performance Reports; items prefixed with “RCFD” or “RCON” are taken from the Call Reports (Consolidated Reports of Condition and Income). RCFD refers to consolidated data and RCON refers to domestic data. For RCFD variables with missing data (no foreign transactions), RCON variables are used.

90 DERIVING THE ECONOMIC IMPACT OF DERIVATIVES
APPENDIX 8. Summary statistics and first-stage regression results for banks’ derivatives use and lending
In the first stage of the Heckman two-stage model, we use the probit model to estimate the determinants of the decision of banks to hedge with derivatives. The estimated parameters from this stage are used to calculate the inverse Mills ratio, which is then included as an explanatory variable in the second-stage regression, which tests the impact of derivatives use on bank lending. This estimation procedure takes into account the selection bias that may arise because only certain banks participate in the derivatives market.
In the probit model, the dependent variable is a binary variable of derivative usage (yes = 1 for users of any type of derivatives and no = 0 for non-users). Each model includes time (quarter-year) dummies to capture the change in derivatives use over time. The standard errors from estimates are clustered at the bank level.
Hedging theories predict that banks facing a higher likelihood of financial distress are more likely to hedge (Diamond, 1984; Smith and Stulz, 1985). Therefore, we include bank condition variables that reflect the likelihood of (non)distress: banks’ capital adequacy (equity-to-total asset ratio), profitability (net interest margin and return on assets), and liquidity (liquid-to-total asset ratio). We also include various categories of loans (i.e., C&I loans and consumer loans, both relative to total loans) and the unused loan commitments-to-total assets ratio since the literature points out different effects of loan types on hedging decisions (e.g., Cebenoyan and Strahan, 2004; Minton, Stulz, and Williamson, 2009). Lastly, we control for banks’ size because large banks are expected to make greater use of derivatives due to economies of scale in risk management. Appendix Table 8.1 reports the descriptive statistics of all variables in the model (both first- and second-stage regressions).
APPENDIX TABLE 8.1 Descriptive statistics
VARIABLES MEAN MEDIAN STD. DEV.
Growth of C&I loans (%) 1.71 0.97 17.83
Growth of total loans (%) 1.92 1.26 7.88
Growth of consumer loans (%) -0.55 -1.16 19.20
Growth of real estate loans (%) 2.08 1.28 10.74
C&I loans/total loans (%) 15.74 13.64 11.20
Consumer loans/total loans (%) 6.35 3.17 10.16
Total loans/total assets (%) 66.85 68.88 13.55
Total assets ($ billions) 8.71 0.83 74.46
In(total assets) 0.19 -0.19 1.21
Equity/total assets (%) 10.17 9.53 3.15
Net interest margin (%) 3.88 3.82 1.30
Return on assets (%) 0.88 0.96 1.68
Liquid/total assets (%) 16.67 14.52 10.42
Unused commitments/total assets (%) 8.95 6.35 34.02
In(Unused commitments/total assets) 1.72 1.85 1.04
Use of derivatives 0.46 0 0.50
Use of interest rate derivatives 0.43 0 0.50
Use of foreign exchange derivatives 0.07 0 0.25
Use of other derivatives 0.07 0 0.25
Use of credit derivatives 0.03 0 0.17
In(derivatives/total assets) 0.38 0 9.01
In(interest rate derivatives/total assets) 32.26 0 844.61
In(foreign exchange derivatives/total assets) 3.93 0 61.94
In(other derivatives/total assets) 0.40 0 5.52
In(credit derivatives/total assets) 1.41 0 23.40

91REFERENCES AND APPENDIXES
Appendix Table 8.2 presents the marginal effects from the probit estimations. Model 1 includes the ratio of total loans to total assets, while in Model 2 we replace the total loan variable with two categories: C&I loan- and consumer loan-to-total loan ratios. We find that only the C&I loan-to-total loan ratio has a significant and positive coefficient, suggesting that banks with more C&I loans are more likely to participate in the derivatives market (Model 2). This is in line with Minton, Stulz, and Williamson (2009), who find that banks with C&I loans are more likely to hedge with credit derivatives because the majority of firms participating in the credit default swap market are either large, investment-grade U.S. firms or foreign multinational companies.
According to DeYoung and Yom (2008), consumer loans are usually granted through a transaction-based approach in which banks apply credit scoring. Consumer loans also tend to be more homogeneous and are made in large numbers. DeYoung and Yom argue that these characteristics of the consumer lending process generate less interest rate risk, helping to explain why we find no significant effect of consumer loans on hedging decisions.
Regarding bank control variables, our findings are consistent with hedging theories that predict the likelihood of hedging increases with the likelihood of financial distress. In particular, we find that banks with lower capital-to-asset ratios, lower profitability (as measured by net interest margin), and less liquidity—such institutions are more likely to face financial distress—are more likely to use derivatives.
We also find a positive and significant effect of bank size, supporting the notion that larger banks enjoy better economies of scale in risk management than smaller banks. We also find that the increase in unused loan commitments significantly increases the likelihood that banks will hedge with derivatives. Unused commitments are subject to risk because interest rates may change between the time a loan commitment contract is granted and when the firm takes it down. Banks with larger unused loan commitments, therefore, are more likely to use derivatives.
APPENDIX TABLE 8.2 Probit estimation of the determinants of derivatives use
MODEL 1 MODEL 2
In(total assets) 0.226*** 0.225***(0.014) (0.015)
Equity/total assets -0.009** -0.010**(0.004) (0.004)
Net interest margin -0.009 -0.028**(0.018) (0.014)
Return on assets -0.00003 0.002(0.0003) (0.007)
Liquid/total assets -0.002* -0.003**(0.001) (0.001)
In(unused commitments/total assets) 0.059*** 0.057***(0.011) (0.012)
Total loans/total assets -0.00003(0.001)
C&I loans/total loans 0.003**(0.001)
Consumer loans/total loans -0.00004(0.001)
Time-fixed effects Yes Yes
Number of observations 43,154 38,637
Number of banks 1,319 1,319
Note: The dependent variable is a binary variable for derivatives use; 0 otherwise. The regression results are from the first stage of the two-stage Heckman selection bias model, with correction for time-fixed effects. Clustered robust standard errors of the coefficients are included in parentheses. ***, **, and * indicate that the coefficients are statistically significant at 1%, 5%, and 10%, respectively.

92 DERIVING THE ECONOMIC IMPACT OF DERIVATIVES
APPENDIX 9. Additional analysis and sensitivity checks for derivatives’ impact on U.S. bank lending
APPENDIX TABLE 9.1 Derivatives variables measured by the ratio
of notional amounts to total assets
MODEL 1 MODEL 2
In(total assets) -2.877* -2.482(1.657) (1.789)
Equity/total assets 0.151 0.132(0.126) (0.133)
Net interest margin -1.107*** -1.167***(0.306) (0.321)
Return on assets 0.413*** 0.422***(0.091) (0.093)
Liquid/total assets -0.001 -0.005(0.025) (0.025)
In(unused commitments/total assets) 2.229*** 2.345***(0.537) (0.566)
Inverse Mills ratio 13.915*** 14.897***(3.920) (4.254)
In(total derivatives/total assets) 0.514**(0.226)
In(interest rate derivatives/total assets) 0.593**(0.237)
In(foreign exchange derivatives/total assets) -0.589(0.715)
In(other derivatives/total assets) -1.232(1.044)
In(credit derivatives/total assets) -0.353(1.006)
Constant -17.540*** -18.348***(4.325) (4.556)
Time-fixed effects Yes Yes
Bank-fixed effects Yes Yes
Number of observations 36,723 36,724
Number of banks 1,286 1,286
Note: The dependent variable is the growth of C&I loans. All explanatory variables are lagged one quarter. The regression results are from the second stage of the two-stage Heckman selection bias model, with correction for both bank- and time-fixed effects. Inverse Mills ratio is obtained from the first stage of the Heckman model (Appendix Table 8.2). Clustered robust standard errors of the coefficients are included in parentheses. ***, **, and * indicate that the coefficients are statistically significant at 1%, 5%, and 10%, respectively.

93REFERENCES AND APPENDIXES
APPENDIX TABLE 9.2 Bank lending is captured by growth of loan categories
DEPENDENT VARIABLES
MODEL 1TOTAL LOANS
MODEL 2CONSUMER LOANS
MODEL 3REAL ESTATE
In(total assets) -6.088*** -8.100*** -7.681***(0.908) (1.313) (1.516)
Equity/total assets 0.317*** 0.269** 0.383*(0.122) (0.133) (0.226)
Net interest margin 0.151 -0.443 0.590*(0.201) (0.301) (0.338)
Return on assets 0.172 0.498** 0.208(0.107) (0.205) (0.168)
Liquid/total assets 0.110*** 0.030 0.137***(0.025) (0.029) (0.032)
In(unused commitments/total assets) 0.634** 0.244 -0.054(0.266) (0.431) (0.593)
Inverse Mills ratio -1.130 -3.688 -5.011(2.169) (3.151) (3.712)
Total derivatives 0.073 0.081 0.083(0.168) (0.339) (0.175)
Constant -3.704 0.543 -0.328(2.553) (3.800) (3.747)
Time-fixed effects Yes Yes Yes
Bank-fixed effects Yes Yes Yes
Number of observations 37,330 37040 37133
Number of banks 1,318 1,303 1,311
Note: The dependent variable is the growth of total loans-to-total assets ratio, the growth of consumer loans to total loans, and the growth of real estate loans to total loans. The main explanatory variable (total derivatives use) is a dummy variable indicating 1 for use by a bank in a given quarter; 0 otherwise. All explanatory variables are lagged one quarter. The regression results are from the second stage of the two-stage Heckman selection bias model, with correction for both bank- and time-fixed effects. Inverse Mills ratio is obtained from the first stage of the Heckman model (Table Appendix 2.2). Clustered robust standard errors of the coefficients are included in parentheses. ***, **, and * indicate that the coefficients are statistically significant at 1%, 5%, and 10%, respectively.

94 DERIVING THE ECONOMIC IMPACT OF DERIVATIVES
APPENDIX TABLE 9.3 Includes interactions with crisis dummy variables
MODEL 1 MODEL 2 MODEL 3
In(total assets) -2.573 -2.637 -2.601
(1.628) (1.626) (1.626)
Equity/total assets 0.135 0.138 0.137
(0.125) (0.125) (0.125)
Net interest margin -1.149*** -1.141*** -1.145***
(0.306) (0.307) (0.306)
Return on assets 0.423*** 0.422*** 0.422***
(0.092) (0.092) (0.092)
Liquid/total assets -0.005 -0.005 -0.005
(0.025) (0.025) (0.025)
In(unused commitments/total assets) 2.313*** 2.300*** 2.308***
(0.537) (0.537) (0.536)
Inverse Mills ratio 14.749*** 14.594*** 14.684***
(3.915) (3.913) (3.909)
Total derivatives 1.142*** 1.020*** 1.040***
(0.317) (0.321) (0.306)
Crisis1 (Q4 2007-Q3 2009) 6.991***
(1.655)
Use of derivatives x Crisis1 -1.032**
(0.400)
Crisis2 (Q4 2007–Q3 2008) 8.702***
(1.457)
Use of derivatives x Crisis2 -0.733
(0.528)
Crisis3 (Q4 2008–Q3 2009) 2.829***
(0.443)
Use of derivatives x Crisis3 -0.358*
(0.187)
Constant -20.576*** -18.171*** -20.498***
(4.312) (4.357) (4.304)
Time-fixed effects Yes Yes Yes
Bank-fixed effects Yes Yes Yes
Number of observations 36,724 36,724 36,724
Number of banks 1,286 1,286 1,286
Note: The dependent variable is the growth of C&I loans. All explanatory variables, except crisis dummies, are lagged one quarter. The regression results are from the second stage of the two-stage Heckman selection bias model, with correction for both bank- and time- fixed effects. Inverse Mills ratio is obtained from the first stage of the Heckman model (Appendix Table 8.2). Clustered robust standard errors of the coefficients are included in parentheses. ***, **, and * indicate that the coefficients are statistically significant at 1%, 5%, and 10%, respectively.

95REFERENCES AND APPENDIXES
APPENDIX 10. Summary statistics and first-stage regression results for non-financial firms’ derivatives use and firm value
In the first stage of the Heckman two-stage model, we use a probit model to estimate the determinants of non-financial firms’ decision to hedge with derivatives. The estimated parameters from this stage are used to calculate the inverse Mills ratio, which is included as a control variable in the second-stage regression. That tests the impact of derivatives use on firm value. This estimation procedure takes into account the selection bias that may arise with firms that choose to hedge with derivatives.
In the probit model, the dependent variable is binary variable derivatives use (1 for users of any type of derivative and 0 for non-users). Each model includes time (year) dummies to capture the change in use. The standard errors from estimates are clustered at the bank level.1
Financial hedging theory, which originated from violations of perfect market assumptions, states that risk management strategies, such as hedging with derivatives, can add value if they mitigate sources of financial distress, such as cash-flow volatility, that could lead to the risks of underinvestment and bankruptcy (Froot, Scharfenstein, and Stein, 1993, and Myers, 1977). (See Part 3.1 for a discussion of this issue and the associated literature.) Therefore we include firm variables that reflect the likelihood of financial distress as well as those associated with the ability to initiate hedging with derivatives in general.
These variables include: firm size (total assets), as empirical studies have shown that larger firms are more likely to use derivatives due to the economy of scale required to initiate a hedging program; leverage (debt-to-equity ratio), as the costs associated with financial distress incurred by debt (as well as interest rate risk) may increase hedging; the quick ratio (a measure of liquidity), since the greater availability of internal funds may mitigate the need for hedging; investment opportunities (R&D-to-sales), since previous research (Gezcy, Minton, and Schrand, 1997, and Nance, Smith, and Smithson 1993) has shown that current investment in R&D projects predicts future investment, which may necessitate hedging activities; and foreign sales, since foreign exchange exposure has been shown to spur derivatives use. Appendix Table 10.1 reports the descriptive statistics of all variables in first- and second-stage regression models.
APPENDIX TABLE 10.1 Descriptive statistics
VARIABLES MEAN MEDIAN STD. DEV.
In(market-to-book ratio) 1.07 1.02 0.73
In(cash flow) 6.42 6.38 1.36
In(total assets) 9.21 9.15 1.28
In(debt-to-equity ratio) 3.65 3.92 1.53
Return on assets 7.35 6.71 7.75
R&D-to-sales 3.10 0 6.04
Capital expenditure to sales 7.62 3.43 16.77
Quick ratio 1.21 0.90 1.11
Foreign sales 0.75 1 0.43
Use of derivatives 0.82 1 0.39
Use of foreign exchange derivatives 0.58 1 0.49
1. We also include industry-specific fixed effects. Including both firm fixed effects and industry fixed effects is not possible due to multicollinearity.

96 DERIVING THE ECONOMIC IMPACT OF DERIVATIVES
Table Appendix 10.2 presents the marginal effect from the probit estimations. Our findings are consistent with hedging theories that predict the likelihood non-financial firms’ derivatives use. Specifically, we find that firms with higher total assets, higher leverage, and foreign sales are more likely to use derivatives. Investment opportunities, as measured by R&D-to-sales ratios, are positive but not significant, and the quick ratio is positive, contrary to prediction, but not significant.
APPENDIX TABLE 10.2 Probit estimation of the determinants of non-financial firms’
derivatives use
MODEL 1
In(total assets) 0.025**
(0.012)
In(debt-to-equity Ratio) 0.015*
(0.009)
Quick ratio 0.006
(0.011)
R&D/sales 0.0005
(0.002)
Foreign sales 0.188***
(0.048)
Time-fixed effects Yes
Industry-fixed effects Yes
Number of observations 3,749
Number of firms 416
Note: The dependent variable is a binary variable for derivatives use indicating 1 for use; 0 otherwise. The regression results are from the first stage of the two-stage Heckman selection bias model, with correction for time-fixed effects. Clustered robust standard errors are included in parentheses. ***, **, and * indicate that the coefficients are statistically significant at 1%, 5%, and 10%, respectively.

97REFERENCES AND APPENDIXES
APPENDIX 11. Additional analysis and sensitivity checks for derivatives’ impact on firm value
APPENDIX TABLE 11.1 Impact of derivatives—cash flow and adjusted market book values
MODEL 1CASH FLOW
MODEL 2MARKET BOOK > 0
In(total assets) 0.867*** -0.137***(0.013) (0.010)
In(debt-to-equity ratio) -0.073*** 0.085***(0.011) (0.012)
Return on assets 0.043*** 0.033***(0.003) (0.003)
Capital expenditures/sales -0.021*** -0.003***(0.003) (0.001)
R&D/sales 0.027*** 0.119***(0.003) (0.002)
Inverse Mills ratio -0.089 0.110(0.140) (0.103)
Use of derivatives 0.050 0.053*(0.040) (0.028)
Constant -1.365*** 1.735***(0.162) (0.134)
Time-fixed effects Yes Yes
Industry-fixed effects Yes Yes
Number of observations 2,889 3,165
Number of firms 390 389
Note: In Model 1, the dependent variable is the natural log of a firm’s cash flow. In Model 2, the dependent variable is firm value (measured as the natural log of the market-to-book ratio). The main explanatory variable in both Model 1 and 2 (use of derivatives) is a dummy variable indicating 1 for derivatives use by a non-financial firm in a given year; 0 otherwise. All explanatory variables are lagged one year. The reported results are from the second stage of the two-stage Heckman selection bias model, with correction for both industry- and time-fixed effects. Inverse Mills ratio is obtained from the first stage of the model (see Appendix 10). Clustered robust standard errors of the coefficients are included in parentheses. ***, **, and * indicate that the coefficients are statistically significant at 1%, 5%, and 10%, respectively.
APPENDIX TABLE 11.2 Impact of derivatives on firm value: Non-crisis and crisis years
MODEL 1NON-CRISIS
MODEL 2CRISIS
In(total assets) -0.134*** -0.137***(0.014) (0.013)
In(debt-to-equity ratio) 0.053*** 0.113***(0.019) (0.016)
Return on assets 0.033*** 0.032***(0.004) (0.003)
Capital expenditures/sales -0.004*** -0.003***(0.001) (0.001)
R&D/sales 0.018** 0.020***(0.002) (0.003)
Inverse Mills ratio -0.011*** 0.240(0.132) (0.156)
Use of derivatives 0.003 0.107***(0.039) (0.041)
Constant 1.925*** 1.063***(0.171) (0.189)
Time-fixed effects Yes Yes
Industry-fixed effects Yes Yes
Number of observations 1,420 1,853
Number of firms 416 416
Note: In Model 1, the dependent variable is firm value (measured as the natural log of the market-to-book ratio) in years 2003 to 2007. In Model 2, the dependent variable is firm value (measured as the natural log of the market-to-book ratio) in years 2008 to 2012. The main explanatory variable in both models (use of derivatives) is a dummy variable indicating 1 for derivatives use by a non-financial firm in a given year; 0 otherwise. All explanatory variables are lagged one year. The reported results are from the second stage of the two-stage Heckman selection bias model, with correction for both industry- and time-fixed effects. Inverse Mills ratio is obtained from the first stage of the model (see Appendix 10). Clustered robust standard errors of the coefficients are included in parentheses. ***, **, and * indicate that the coefficients are statistically significant at 1%, 5%, and 10%, respectively.

98 DERIVING THE ECONOMIC IMPACT OF DERIVATIVES
APPENDIX 12. Impacts of bank lending and firm value on economic growth: vector autoregressive analysis
We apply the vector autoregressive model (VAR) to estimate the relationships between banks’ C&I lending, firm value (market-to-book ratio), and real GDP. Real GDP and C&I loans enter the estimations in the natural logarithm form, while M/B is in ratio. The estimations are performed in three steps.
Step 1. Testing for stationarity
For a regression analysis between two time series to show a meaningful relationship, each series needs to be stationary. Non-stationary data is identified roughly when the data depends on time (specifically, when their mean and variance are not constant over time). Therefore, any two non-stationary series may establish a statistically significant relationship even when they are theoretically unrelated (a so-called spurious relationship). The augmented Dickey-Fuller (ADF) procedure is used to test stationarity properties. In many cases, the first difference or the change in the value of the variable from period t-1 to t is found to be stationary, although its level value is identified as non-stationary.
Appendix Table 12.1 presents the ADF test statistics for both the level and first difference (denoted by Δ) of the three variables in our model. The results indicate that the first difference of log of real GDP, log of C&I loans, and M/B is stationary (the non-stationary null hypothesis of the first difference is rejected at the 1 percent significance level). Therefore, we proceed by using the first difference of these three variables in the VAR model.
APPENDIX TABLE 12.1 Test for stationarity
ADF TEST STAT 1% CRITICAL VALUE 5% CRITICAL VALUE
H0: the level of the variable is non-stationary
Log of real GDP -2.009 -3.662 -2.964
Log of C&I loans -1.659 -3.668 -2.966
M/B -3.478 -3.662 -2.964
H0: the first difference of the variable is non-stationary
ΔLog of real GDP -2.899*** -2.639 -1.950
ΔLog of C&I loans -3.641*** -2.641 -1.950
ΔM/B -8.686*** -2.639 -1.950
Note: *** indicates significance at the 1 % level. The reported ADF statistics were generated by a model with constant and one lag. Including a trend term (not reported) results in a similar conclusion.
Step 2. Testing for co-integration relationship
The next step is to test for a long-run theoretical or equilibrium relationship between bank lending, firm value, and real GDP. Any two variables may have a fundamental relationship even though they are non-stationary if they share similar stochastic trends. In this case, the two variables are said to be cointegrated.
To elaborate, the existence of the cointegration relationship between banks’ C&I loan volume and real GDP indicates that when banks provide more C&I loans, real GDP will also change. Cointegration, however, does not tell the direction of causality. In this example, the existence of the long-run relationship also indicates that a change of conditions in the real economy affects banks’ C&I loan volume.

99REFERENCES AND APPENDIXES
Appendix Table 12.2 reports the cointegration test result, which shows that the variables in the model are cointegrated. The null hypothesis that the variables are not cointegrated (r = 0) is rejected, and the null hypothesis that there is one cointegrating equation (r ≤ 1) is accepted. In other words, evidence of cointegration implies that the relationships among the three variables are not spurious, that there is a theoretical relationship among bank lending, firm value, and real GDP, and that they are in equilibrium in the long run.
APPENDIX TABLE 12.2 Co-integration test statistics
TRACE TEST MAXIMUM EIGENVALUE TEST
H0 Test statistics 5% critical value Test statistics 5% critical value
r = 0 35.14 29.68 22.98 20.97
r ≤ 1 12.16 15.41 9.07 14.07
Note: This table reports results from Johansen’s cointegration tests based on the three-variable model (C&I loans, M/B, and real GDP) from Q1 2003 to Q3 2012; r refers to the number of cointegrating vectors.
Step 3. Vector error correction model
Next, we estimate the causal relationships of these three variables. Having determined one cointegration vector from Step 2, we apply the vector error correction (VEC) model. This is a special form of the vector autoregressive used when the time-series variables in the model are cointegrated. The VEC model gives estimates of the magnitude of a change in one variable in response to a change in other variables over the short run, as well as the speed of the change (captured by the so-called correction error coefficient).2
Appendix Table 12.3 reports the estimation results. The first equation (ΔLog of real GDP as the dependent variable) shows that 1 percent growth of C&I loans would increase quarterly GDP growth by 0.013 percent, and a one-unit rise in M/B increases economic growth by 0.0043 percent. Note that these marginal effects are not significant at a traditional level. The insignificance of estimates in the VEC model only reflects the lack of short-run responses to real GDP as the result of changes in bank lending and firm value in each quarter. It is possible that the estimates can become significant when they are captured for a longer period or several quarters. Long-run relationships of these variables were established in the previous step through the cointegration test. Since the cointegration test does not provide marginal effects, we use these estimates from Appendix Table 12.3 as a rough measure of the impacts of bank lending and firm value on economic growth.
2. The result in Appendix Table 12.3 indicates that C&I loan growth and M/B respond to changed economic conditions. This result is captured by the statistical significance of the error correction terms (αCE) in the C&I loans and M/B equations. The error correction terms also show the short-run adjustment of these variables in the model to reach the long-term equilibrium.

100 DERIVING THE ECONOMIC IMPACT OF DERIVATIVES
APPENDIX TABLE 12.3 Vector error correction estimates
DEPENDENT VARIABLE
(1) (2) (3)
ΔLOG OF REAL GDP ΔLOG OF C&I LOANS ΔM/B
ΔLog of real GDP (-1) 0.574 (0.170)*** 0.918 (1.275) 155.276 (63.546)**
ΔLog of C&I loans (-1) 0.013 (0.019) 0.253 (0.143)* 23.225 (7.125)***
ΔM/B (-1) 0.00043 (0.0004) -0.006 (0.003)** -0.060 (0.148)
αCE -0.035 (0.047) 0.905 (0.355)** -76.80 (17.699)***
Note: Standard errors are in parentheses. ***, **, * indicate significance at the 1%, 5%, and 10% levels, respectively.
We perform additional analyses by rerunning all steps for bivariate regressions among the three variables. The results are shown in models (1) – (3) in Appendix Table 12.4 (only the regression with ΔLog of real GDP being the dependent variable is reported). In addition, we use the weighted average instead of a simple average to calculate quarterly M/B values for sample non-financial firms in the S&P 500 (Models 2 and 4).3 Based on these alternative specifications, we find that a 1 percent increase in banks’ C&I lending is associated with an increase in quarterly real GDP from 0.008 to 0.02 percent. For the impacts of M/B, we find that a one-unit increase in firm value is associated with an expansion of quarterly real GDP of 0.0039 to 0.006 percent.
APPENDIX TABLE 12.4 Vector error correction estimates based on
alternative model specifications
BIVARIATE MODEL BIVARIATE MODEL BIVARIATE MODEL TRIVARIATE MODEL
(1) (2) (3) (4)
ΔLog of real GDP (-1) 0.442(0.198)**
0.532***(0.167)
0.532(0.146)***
0.541(0.215) **
ΔLog of C&I loans (-1) 0.008(0.019)
0.020(0.021)
ΔM/B (-1) 0.00039(0.0004)
Δweighted M/B (-1) 0.005(0.007)
0.006(0.008)
Note: Standard errors are in parentheses. ***, **, * indicate significance at the 1%, 5%, and 10% levels, respectively.
3. For each quarter, the weighted average of the market-to-book value of the sample firms is calculated from ∑ market value/∑ book value.
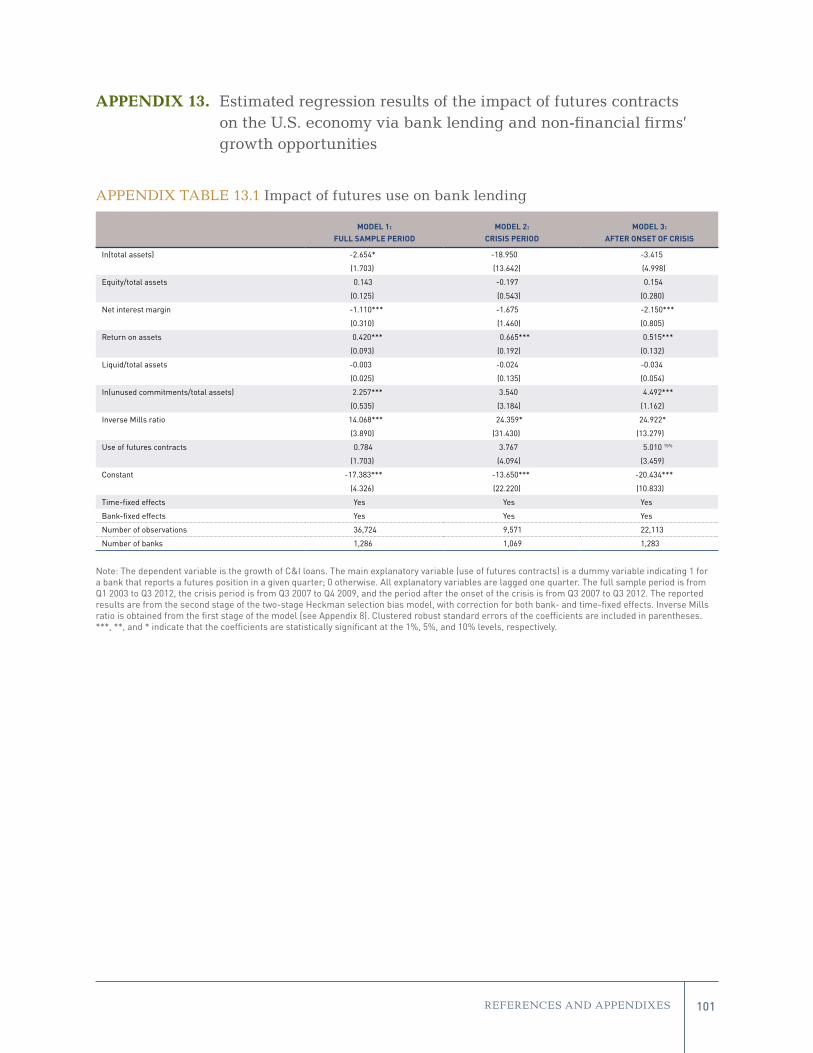
101REFERENCES AND APPENDIXES
APPENDIX 13. Estimated regression results of the impact of futures contracts on the U.S. economy via bank lending and non-financial firms’ growth opportunities
APPENDIX TABLE 13.1 Impact of futures use on bank lending
MODEL 1:FULL SAMPLE PERIOD
MODEL 2:CRISIS PERIOD
MODEL 3:AFTER ONSET OF CRISIS
In(total assets) -2.654* -18.950 -3.415
(1.703) (13.642) (4.998)
Equity/total assets 0.143 -0.197 0.154
(0.125) (0.543) (0.280)
Net interest margin -1.110*** -1.675 -2.150***
(0.310) (1.460) (0.805)
Return on assets 0.420*** 0.665*** 0.515***
(0.093) (0.192) (0.132)
Liquid/total assets -0.003 -0.024 -0.034
(0.025) (0.135) (0.054)
In(unused commitments/total assets) 2.257*** 3.540 4.492***
(0.535) (3.184) (1.162)
Inverse Mills ratio 14.068*** 24.359* 24.922*
(3.890) (31.430) (13.279)
Use of futures contracts 0.784 3.767 5.010 15%
(1.703) (4.094) (3.459)
Constant -17.383*** -13.650*** -20.434***
(4.326) (22.220) (10.833)
Time-fixed effects Yes Yes Yes
Bank-fixed effects Yes Yes Yes
Number of observations 36,724 9,571 22,113
Number of banks 1,286 1,069 1,283
Note: The dependent variable is the growth of C&I loans. The main explanatory variable (use of futures contracts) is a dummy variable indicating 1 for a bank that reports a futures position in a given quarter; 0 otherwise. All explanatory variables are lagged one quarter. The full sample period is from Q1 2003 to Q3 2012, the crisis period is from Q3 2007 to Q4 2009, and the period after the onset of the crisis is from Q3 2007 to Q3 2012. The reported results are from the second stage of the two-stage Heckman selection bias model, with correction for both bank- and time-fixed effects. Inverse Mills ratio is obtained from the first stage of the model (see Appendix 8). Clustered robust standard errors of the coefficients are included in parentheses. ***, **, and * indicate that the coefficients are statistically significant at the 1%, 5%, and 10% levels, respectively.

102 DERIVING THE ECONOMIC IMPACT OF DERIVATIVES
APPENDIX TABLE 13.2 Impact of futures use on firm value
MODEL 1:FULL SAMPLE PERIOD
MODEL 2:CRISIS PERIOD
In(total assets) -0.137*** -0.124***
(0.010) (0.020)
In(debt-to-equity ratio) 0.085*** 0.105***
(0.012) (0.023)
Return on assets 0.033*** 0.026***
(0.003) (0.004)
Capital expenditures/sales -0.003*** -0.003**
(0.001) (0.001)
R&D/sales 0.019*** 0.027***
(0.002) (0.003)
Inverse Mills ratio 0.071 0.176
(0.099) (0.208)
Use of futures contracts 0.001 0.040
(0.036) (0.077)
Constant 1.792*** 1.399***
(0.130) (0.245)
Time-fixed effects Yes Yes
Industry-fixed effects Yes Yes
Number of observations 3,273 734
Note: The dependent variable is firm value (measured as the natural log of the market-to-book ratio). Model 1 uses the sample period from 2003 to 2012. In Model 2, the sample period is from 2008 to 2009. The main explanatory variable in both models (use of futures contracts) is a dummy variable indicating 1 for derivatives use by a non-financial firm in a given year; 0 otherwise. All explanatory variables are lagged one year. The reported results are from the second stage of the two-stage Heckman selection bias model, with correction for both industry- and time-fixed effects. Inverse Mills ratio is obtained from the first stage of the model (see Appendix 10). Clustered robust standard errors of the coefficients are included in parentheses. ***, **, and * indicate that the coefficients are statistically significant at the 1%, 5%, and 10% levels, respectively.
APPENDIX TABLE 13.3 Vector error correction estimates for the crisis period
DEPENDENT VARIABLE
(1) (2) (3)
ΔLOG OF REAL GDP ΔLOG OF C&I LOANS ΔM/B
ΔLog of real GDP (-1) 0.535 (0.238)** 1.871 (1.321) 240.317 (76.837)***
ΔLog of C&I loans (-1) 0.0104 (0.030) 0.312 (0.167)* 24.991 (9.698)***
ΔM/B (-1) 0.0008 (0.0005)* -0.005 (0.003)* -0.066 (0.167)
αCE -0.034 (0.067) 0.542 (0.374) -93.928 (21.776)***
Note: Since there are too few observations to estimate the impact of bank lending and firm value on economic growth from 2008 to 2009 (i.e., eight observations based on the quarterly data) using the VAR technique, the 2006-12 period is used for these estimations. Standard errors are in parentheses. ***, **, * indicate significance at the 1%, 5% and 10% levels, respectively.


104 DERIVING THE ECONOMIC IMPACT OF DERIVATIVES
Apanard (Penny) Prabha is a senior economist at the Institute whose research expertise is in financial institutions and international finance. Her recent Milken Institute publications tackle current banking and monetary policy issues relating to the causes and consequences of the global financial crisis. Prabha’s research work has also been published in many peer-reviewed scholarly journals and presented at international economic and finance conferences. She has authored and co-authored various empirical research studies on global banking and capital markets that have been published in the Journal of International Money and Finance, Journal of Banking Regulations, International Review of Finance, Open Economies Review, Journal of International Financial Markets, Institutions & Money, and Journal of Financial Economic Policy, among others. Prior to joining the Institute, Prabha was an assistant professor of economics at the University of Illinois at Springfield. During that time, she also traveled for collaborative research projects at the Center for Law, Economics and Financial Institutions at the Copenhagen Business School in Denmark and the University of Chicago-UTCC Research Center at the University of the Thai Chamber of Commerce in Thailand. While completing her Ph.D., Prabha also was a visiting scholar at the Claremont Institute for Economic Policy Studies and the Freeman Program in Asian Political Economy at the Claremont Colleges, as well as a lecturer of economics at Pitzer College and the University of Redlands.
Keith Savard is senior managing economist at the Milken Institute. He has extensive executive management experience with expertise in evaluating the interrelationship between economic fundamentals and activity in global financial and commodity markets. He also has a background in sovereign risk analysis and applying a disciplined economic approach to investment portfolio decision-making. Prior to joining the Milken Institute, Savard was director of economic research and chief economist at Samba Financial Group (formerly Saudi American Bank) in London. He also held positions at Zurich Investments, the Institute of International Finance, the U.S. Department of State, and the Board of Governors of the Federal Reserve System.
Heather Wickramarachi is an economist with the Milken Institute. Her areas of expertise include emerging markets, international finance and foreign direct investment. Wickramarachi received an M.A. in social science, with a focus on international political economy and quantitative methodology, from the University of California, Irvine, where she is currently a Ph.D. student. She also studied energy planning and sustainable development at the University of Oslo in Norway. She presented her paper, "Do South-South Bilateral Investment Treaties Increase Foreign Direct Investment? Intra-Regional Evidence from MENA Countries," at the International Studies Association's annual conference. Most recently she presented a paper, "Institutions, FDI, and Financial Deepening," co-authored with Tong Li, at the Transparency Research Conference at HEC Paris.
About the Authors

1250 Fourth StreetSanta Monica, CA 90401Phone: 310-570-4600
E-mail: [email protected] • www.milkeninstitute.org
1101 New York Avenue NW, Suite 620Washington, DC 20005Phone: 202-336-8930
Grace Global Raffles137 Market Street #10-02Singapore 048943Phone: 65-9457-0212