Embed Size (px)
Citation preview
OIL RESOURCE MANAGEMENT AND FOOD INSECURITY IN NIGERIA1
Eme O. Akpan2
Dept. of Economics University of Ibadan
Nigeria
Abstract
The increasing spate of fluctuations in the world price of crude oil and the global food crisis in recent years have been issues of concern to policymakers the world over. Since the first oil shock in 1974, oil has annually produced over 90 per cent of Nigeria’s export income. In 2000, Nigeria received 99.6 per cent of its export income from oil, making the world’s most oil-dependent country. Despite the huge earnings from oil Nigeria remains one of the most food insecure countries in the world. Oil production has also had profound effects on Nigeria’s domestic sector. This paper thus analysis the dynamic relationship between oil production and food insecurity in Nigeria using a VAR approach. The results of the estimation reveal that the over dependence on oil resulted in the neglect of the agricultural sector, hence decline in the production of food for the teeming population in Nigeria. The variance decomposition also shows high imports of food have contributed significantly to shocks in food supply, but not significant in determining food security There is therefore an urgent need for policies that will enhance domestic production of staple foods and reduce the over dependence on oil resource in Nigeria. Key words: oil resource, food insecurity, VAR, Nigeria
1 Paper prepared for presentation at the European Report on Development (ERD) Conference in Accra, Ghana, 21st-23rd May 2009
2 Eme Akpan is currently a PhD student at the Department of Economics, University of Ibadan, Nigeria.
1
1. Introduction International evidence suggests that resource-rich countries are
characterized by slow or stagnating growth, de-industrialization, low savings, lagging
human and physical capital accumulation, and stagnating or declining productivity.
This is often labeled the ‘resource curse’. 3
This is premised on the fact that managing oil wealth has proven to be a
difficult challenge for many countries across the world. Examples include Ecuador,
Mexico, Nigeria, and Venezuela. In Nigeria, for instance, oil revenues have led to
huge investments in capital and infrastructure in the 1970s and 1980s but
productivity declined and per capita GDP remained at about the same level as 1965.
In other words, accumulated oil wealth over a 35 year period of some $350 billion did
not raise the standard of living but worsened the distribution of income in Nigeria.
Studies show that not only Dutch disease but more importantly waste of capital
resources through bad investments and corruption have resulted in this predicament
(Budina et al., 2007).
The paradox is that despite the huge resources from oil, Nigeria is
characterized by threat of hunger, about 70 per cent of the population living on less
than N100 ($ 0.7) per day, youth unemployment and high food imports. Hunger and
malnutrition continue to plague the Nigerian economy. For instance, during the
period 1970-1979, the average annual deficit in per capita daily calories intake was
24.4 per cent. It declined to 23.58 per cent within 1980-1989 and by 2006 it reached
a nadir 11.34 per cent (CBN, 1993, African Development Bank, 2007). This problem
has been a recurring issue in the World Bank, and recent reports show that about 90
million Nigerians or about 40 per cent of the population suffer from food insecurity.
Consequently, the incomes of most families are not adequate for the basic
sustenance of life.
On the whole, Nigeria has been a disastrous development experience. On
just about every conceivable metric, Nigeria’s performance since independence has
been dismal. In PPP terms, Nigeria’s per capita GDP was US$1,113 in 1970 and is
estimated to have remained at US$1,084 in 2006. The latter figure places Nigeria
3 This is often termed the Dutch Disease. However, resource boom can be a blessing when the government has substantial non-resource revenues, and a curse when resource rents constitute the better part of government revenues.
2
amongst the 15 poorest nations in the world for which such data are available (WDI
2007)
Nigeria, unfortunately, fares much worse on measures of poverty which is a
dimension of food insecurity. Between 1970 and 2006, the poverty rate, measured
as the share of the population subsisting on less than US$1 per day increased from
close to 36 percent to about 70 percent. This translates into an increase in the
number of poor from about US$19 million in 1970 to a staggering US$ 100 million in
2006 (WDR 2007). These developments, of course, coincided with the discovery of
oil in Nigeria.
Thus, the main focus of this study is to assess oil resource management and
food insecurity in Nigeria. Following the introduction, the rest of the paper is
organized accordingly; section 2 examines oil resource management and food
insecurity in Nigeria. In the third segment, a review of related literature is presented.
The model employed in the article is provided in the fourth section while the fifth
segment presents and discusses the results of the estimation. The paper concludes
by providing policy recommendations based on the finding.
2. Oil Resource Management in Nigeria Prior to Nigeria’s independence in 1960, agriculture was the main stay and
dominant sector of the economy. It contributed about 70 per cent of Gross Domestic
Product (GDP), employed about the same percentage of the working population, and
accounted for about 90 per cent of foreign earnings and Federal Government
revenue. However, with the discovery of oil in commercial quantity at Oloibiri in the
Niger Delta in 1956, the country’s fortunes have depended on the oil industry, which
has effectively replaced agriculture in revenue yield. In fiscal terms, oil revenues
currently account for about 80 percent of government revenues, 95 percent of export
receipts and 90 percent of foreign exchange earnings (Adebipe, 2004).
The massive increase in oil revenue as an aftermath of the Middle-East war
of 1973 created unprecedented, unexpected and unplanned wealth for Nigeria; then
began the dramatic shift of policies from a holistic approach to benchmarking them
against the state of the oil sector. This had severe implications for the management
of the oil windfall. Available evidence indicates that Nigeria has performed dismally
3
in terms of oil resource management. For instance, about the mid-1970s, during the
first oil boom, public expenditure was financed mainly by proceeds from oil with
moderate domestic and external borrowing. However, this period was characterized
by weak institutions which were ill equipped to conceive and implement major
investment projects with the required rate of return. This undermined the country’s
capacity to repay the loans. These credibility problems heightened negative
perceptions about Nigeria’s credit worthiness in the international financial market.
The gross external debt stock which stood at $4.3 billion (about 6.6 per cent of the
GDP) rapidly increased to about $11.2 billion by the time oil prices collapsed in the
mid-1980s. There was also an incredible fall in foreign exchange earning from 10
billion to 1.23 billion between 1981 and 1983 (Budina et al. 2007, Adeniyi, 2008).
Within the decade of the 1980s, some major economic policies were put in
place to reflect the huge oil earnings. These include, the recommendations of the
Onosode Commission on pay structure in Government establishments that were
adopted in 1981 and further increase in salaries and benefits in several public
institutions whose responsibilities were considered unique and more complex than
the ordinary civil service; again, a policy in pursuit of “capturing” legally the oil
wealth. Second was the Economic Stabilization Act of 1982, which was the response
of the Shagari’s civilian administration to dwindling oil earnings and major external
sector imbalances. A third policy was The Structural Adjustment Programme (1986;
1988) by Babangida’s military administration, with the active support of the World
Bank. This was Nigeria’s first bold step on wide-ranging reforms in almost all the
major sectors of the economy. It recorded some significant gains for the first two
years, but suffered a setback when certain aspects of it were reversed and
inconsistencies (internal and sectoral) became prevalent. Again was the
experimentation with Perspective Planning, in which three-year rolling plans were
designed to tide the economy into long-term planning. Again this was discarded
almost as soon as it was initiated.
Within the 1990s which might be described as a period of reversals and lost
opportunities;4 the series of reforms and reversals of the late 1980s took its toll on
the real sector of the economy and the effects were transmitted to the financial 4 Nigeria has had several military administrations. These political instabilities resulted in inconsistencies in policy formulation and implementation; and have had dire consequences for economic performance.
4
system. This was also the period Nigeria experienced some windfall gains from the
strong oil prices as a result of the Coalition Forces/Iraqi war of 1990. The
experimentation with deregulation and liberalization was truncated in 1994 with the
advent of the military administration led by late Abacha. The Federal Government re-
regulated the economy, by capping exchange and interest rates. It was an obvious
reaction to the high nominal interest rates that reached 78 per cent in commercial
banks and 180 per cent in the non-bank financial services sector. These rates were
themselves driven by the high rate of inflation – at 44.8 per cent in 1992 and 57.2
per cent in 1993 (Adebipe, 2007; Akpan, 2009).
There was no clear economic strategy for the rest of the decade of the
1990s, and monetary policy was totally ineffective to check expansionary fiscal
operations. Up until June 2003, there was no clear economic direction. Weak
institutions and legal environment stymied the benefits that would have accrued from
oil earnings, which had started to firm up. The entire scenario has changed in 2004,
with the formal announcement and presentation of the Federal Government’s
economic agenda, tagged the National Economic Empowerment and Development
Strategy (NEEDS). NEEDS is a medium-term strategy that seeks to implement
series of reforms that was designed to lay a solid foundation for a diversified
Nigerian economy by 2007. It sets specific goals in major growth indices as wealth
creation, employment generation, institutional reforms and social charter.
From the turn of this century, events seem to point towards improved
economic management. The external reserve position improved from $5.5 billion in
1999 to about $2.8 in 2005, while the huge gross public debt was reduced following
protracted negotiations which resulted in a debt relief by the Paris club. The fiscal
reforms involving saving part of the windfall appear to have contributed to the
improvements. The ongoing reforms, fiscal restraint, budget preparation process,
efforts to check corruption among others if sustained should enable Nigeria benefit
immensely from positive oil price shocks.
On the whole, despite the significant expansion to Nigeria’s economy brought
about by oil, there has been little structural development; a situation which
successive military administrations in Nigeria have worsened due to their
inconsistency, languid enforcement, and implementation of oil policy. These have
5
severe implications for food insecurity and livelihood of the teeming population in
Nigeria. This is pursued in the ensuing section.
2.3 Food Insecurity in Nigeria
Food security is the accessibility of all people, at all times, to enough food for
an active and healthy life (Reutlinger, 1987). Food security has two aspects;
ensuring that adequate food supplies are available, and that households whose
members suffer from under nutrition have the ability to acquire food, either by
producing it themselves or by being able to purchase it (Riscopoulos et al. 1988).
Food insecurity on the other hand, refers to deficits or shortfalls in actual per capita
daily calorie intake below the minimum per calorie intake recommended by FAO and
WHO for maintaining the human body-2450kcal/day (Riscopoulos et al. 1988; Rosen
and Shapouri, 1994).
Most countries with widespread food security problems are assessed based
on three indicators; low average levels of calorie consumption, large fluctuations in
and low levels of food consumption, and large numbers of absolute poor. Food
insecurity often results in human suffering, substantial productivity losses and a
misallocation of scarce resources due to diminished work performance, lower
cognitive ability and school performance, and ineffective income earning decisions
(Braun et al. 1992)
From the foregoing, Nigeria is considered a food insecure country. One of the
common characteristics of food insecurity in Nigeria is poverty. Available evidence
indicates that on almost every indicator, Nigeria exhibits high levels of food insecurity
(see Table 1).5
5 Details on food insecurity in Nigeria is discussed in section 2.4 under governments efforts at food security in Nigeria.
6
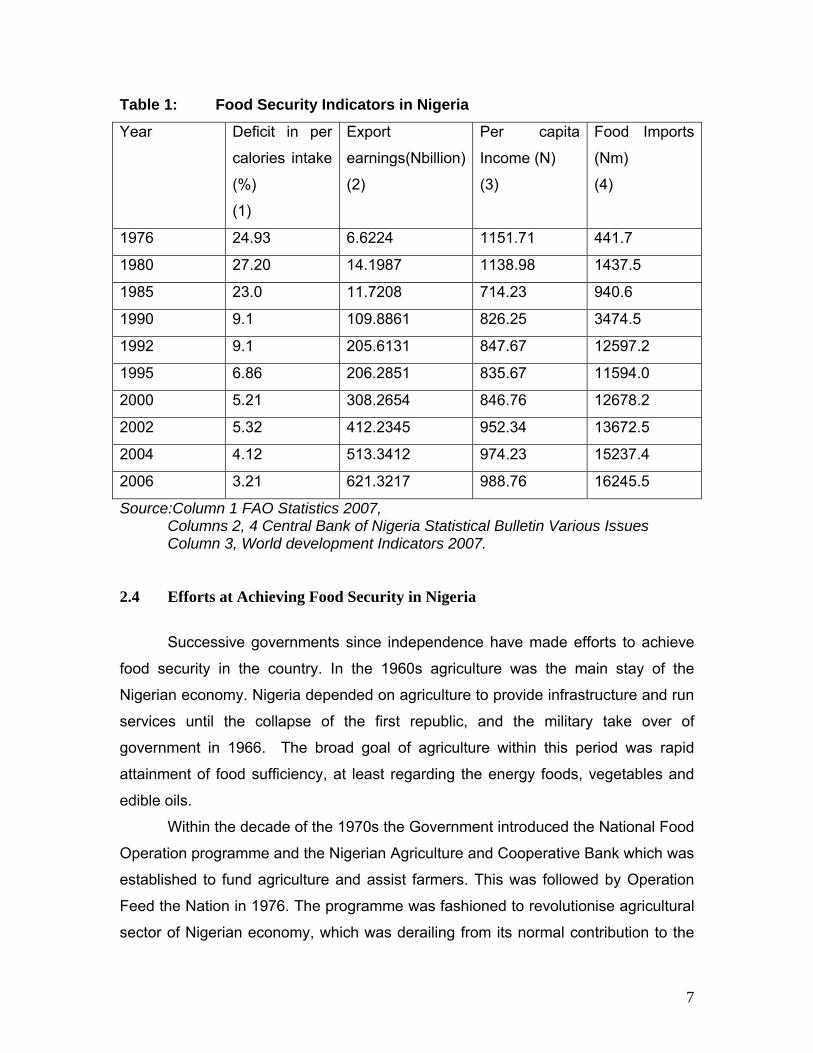
Table 1: Food Security Indicators in Nigeria
Year
Deficit in per
calories intake
(%)
(1)
Export
earnings(Nbillion)
(2)
Per capita
Income (N)
(3)
Food Imports
(Nm)
(4)
1976 24.93 6.6224 1151.71 441.7
1980 27.20 14.1987 1138.98 1437.5
1985 23.0 11.7208 714.23 940.6
1990 9.1 109.8861 826.25 3474.5
1992 9.1 205.6131 847.67 12597.2
1995 6.86 206.2851 835.67 11594.0
2000 5.21 308.2654 846.76 12678.2
2002 5.32 412.2345 952.34 13672.5
2004 4.12 513.3412 974.23 15237.4
2006 3.21 621.3217 988.76 16245.5
Source:Column 1 FAO Statistics 2007, Columns 2, 4 Central Bank of Nigeria Statistical Bulletin Various Issues Column 3, World development Indicators 2007.
2.4 Efforts at Achieving Food Security in Nigeria
Successive governments since independence have made efforts to achieve
food security in the country. In the 1960s agriculture was the main stay of the
Nigerian economy. Nigeria depended on agriculture to provide infrastructure and run
services until the collapse of the first republic, and the military take over of
government in 1966. The broad goal of agriculture within this period was rapid
attainment of food sufficiency, at least regarding the energy foods, vegetables and
edible oils.
Within the decade of the 1970s the Government introduced the National Food
Operation programme and the Nigerian Agriculture and Cooperative Bank which was
established to fund agriculture and assist farmers. This was followed by Operation
Feed the Nation in 1976. The programme was fashioned to revolutionise agricultural
sector of Nigerian economy, which was derailing from its normal contribution to the
7
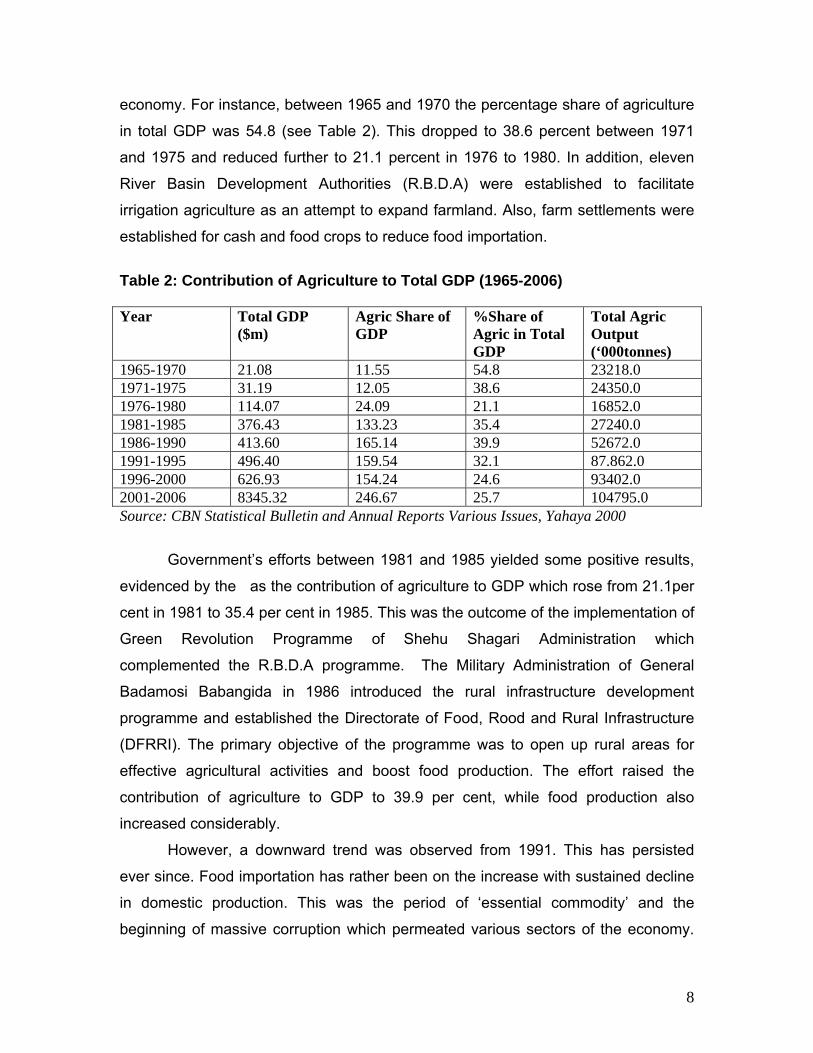
economy. For instance, between 1965 and 1970 the percentage share of agriculture
in total GDP was 54.8 (see Table 2). This dropped to 38.6 percent between 1971
and 1975 and reduced further to 21.1 percent in 1976 to 1980. In addition, eleven
River Basin Development Authorities (R.B.D.A) were established to facilitate
irrigation agriculture as an attempt to expand farmland. Also, farm settlements were
established for cash and food crops to reduce food importation.
Table 2: Contribution of Agriculture to Total GDP (1965-2006) Year Total GDP
($m) Agric Share of GDP
%Share of Agric in Total GDP
Total Agric Output (‘000tonnes)
1965-1970 21.08 11.55 54.8 23218.0 1971-1975 31.19 12.05 38.6 24350.0 1976-1980 114.07 24.09 21.1 16852.0 1981-1985 376.43 133.23 35.4 27240.0 1986-1990 413.60 165.14 39.9 52672.0 1991-1995 496.40 159.54 32.1 87.862.0 1996-2000 626.93 154.24 24.6 93402.0 2001-2006 8345.32 246.67 25.7 104795.0 Source: CBN Statistical Bulletin and Annual Reports Various Issues, Yahaya 2000
Government’s efforts between 1981 and 1985 yielded some positive results,
evidenced by the as the contribution of agriculture to GDP which rose from 21.1per
cent in 1981 to 35.4 per cent in 1985. This was the outcome of the implementation of
Green Revolution Programme of Shehu Shagari Administration which
complemented the R.B.D.A programme. The Military Administration of General
Badamosi Babangida in 1986 introduced the rural infrastructure development
programme and established the Directorate of Food, Rood and Rural Infrastructure
(DFRRI). The primary objective of the programme was to open up rural areas for
effective agricultural activities and boost food production. The effort raised the
contribution of agriculture to GDP to 39.9 per cent, while food production also
increased considerably.
However, a downward trend was observed from 1991. This has persisted
ever since. Food importation has rather been on the increase with sustained decline
in domestic production. This was the period of ‘essential commodity’ and the
beginning of massive corruption which permeated various sectors of the economy.
8
This was the situation until 1999 when a democratic government was sworn in.
During this period the Fadama development project was introduced in 1992. It
however did not make sufficient impact.
The democratic government headed by President Olusegun Obasanjo
initiated some policies and programmes which involved; reorganizing, restructuring,
privatizing institutions and agencies and encouraging partnership to make impact
(Nigerian Agricultural cooperatives and Rural development bank, NACRDB (2000);
National agricultural Development Fund, NADF (2002); National Special Programme
on Food security, NSPFS (2002); Commodiy marketing and Development
Companies, CMDC (2003).) All these have had some positive impact on agricultural
production and consequent improvement in the contribution of agriculture to total
gross domestic product (see Table 2). Reported in Table 2 also is agricultural
contribution to GDP. From the Table, a sharp increase in contribution from 24.6
percent between 1996 and 2000 is observed as against 42.20 percent in 2007.
In addition, recent statistics from the FAO and IFPRI survey show slight
increase in per capita daily calorie intake from 2050kcal in 1971-1981 to 2430kcal in
1989-1991 and daily calorie intake between 1991 and 2004. 2800kcal in 2002-2004.
Similarly, the proportion of undernourished people declined from 13 per cent in
1990-1992 to 9 per cent in 2000-2002 and 7 per cent in 2002-2004 (FAO, 2004;
IFPRI 2006). Poverty level according to HDI (2008) also fell from 70.8 per cent in
2003 to 51 per cent in 2006
On the whole, despite all the improved statistic and government efforts, not
less than 65 percent of Nigerians are food insecure (Mohammed, 2008). The
plausible reason for this persistent food insecurity problem in Nigeria despite huge
earnings from oil is the neglect of the agricultural sector, following the discovery of oil
in commercial quantity. The agricultural sector contributes over 30 per cent of total
annual GDP, employs about 70 per cent of the labour force and constitutes about 70
per cent of non-oil exports. More importantly, it provides the needed food for the
teeming Nigerian population (Adegboye, 2004, Babatunde et al, 2007) Hence, the
poor performance of the agricultural sector invariably implies food shortages and
accessibility problems. In other words, as Babatunde et al (2007) point out, the poor
performance of the sector directly creates supply shortages and indirectly demand
shortages by denying the households access to sufficient income.
9
3. Literature Review 3.1 Resource Management
It is generally acclaimed that resources are a curse for developing countries.
Traditional among explanations of poor performance in oil-rich countries is the so
called Dutch disease, named after Holland’s poor record in managing its natural gas
wealth in the 1960s (Corden and Neary 1984; Van Wijnbergen 1984a, 1984b). The
literature points out that spending out of oil wealth increases demand for
nontradables and so draws productive resources into that sector. Because the
presumption is that technological progress is faster
As Mehlum, and Torvik (2002) point out, the Asian tigers (Korea, Taiwan, Hong
Kong and Singapore), are all resource-poor, while growth losers (Nigeria, Zambia,
Sierra Leone, Angola, Saudi Arabia, and Venezuela), are all resource-rich. Natural
resource abundance, as measured by the resource concentration of exports, tends
to reduce a country’s long-term growth rate (Sachs and Warner, 1995, Gylfason et
al, 1999, Sala-i-martin, 1997, Salti, 2007). The result also holds when attention is
restricted to particular resources (see for example, Olsson (2004) for the case of
diamonds and Humphreys (2005) for the case of fossil fuels). Furthermore,
Kronenberg (2004) notes that the curse of natural resources extends to the case of
transition economies.
Looking at other outcome variables, persistent evidence of the curse is observed.
Ades and Di Tella (1999) for instance show evidence of natural resources increasing
corruption; Ross (1999, 2001) maintains that resource-dependent countries have a
larger share of their population living in poverty and a lower score on the United
Nations Human Development Index (HDI) and are less likely to be democratic;
Collier and Hoeffer (2000) find that resource abundance significantly increases the
risk of violent civil conflict.
This finding is not universal, however. The effect of natural resources on
economic performance is reversed in Papyrakis and Gerlach (2003) when controls
are included for corruption, investment, openness and terms of trade. However, the
indirect effect of resources on growth using these controls as possible transmission
channels is negative. Finally, Hodler (2004) notes that, the effect of natural
10
resources on GDP and on growth is significant and negative only in ethno-
linguistically fractionalized countries, and not in homogeneous ones.
Further, there are cases where natural resources appear to be a blessing. The
experiences of Norway, the United States, Australia, Canada and the United
Kingdom suggest that in none of these countries were natural resources a burden.
Norway was Europe’s poorest country in 1900, but is now one of the richest
(Mehlum, Moene and Torvik, 2002). It has, since the discovery of oil and gas in the
1970s, surpassed Sweden and Denmark in terms of GDP per capita (Roed, 2002).
In 2002, it stood at the top of the UN’s ranking of countries by the Human
Development Index (UNDP, 2002). Similarly, Alaska has experienced growth rates in
personal income and employment much greater than the average rates for the US
since the 1960s (Goldsmith, 2003). The Shetland Islands invested the proceeds from
the signature bonus for allowing oil drills in 1973 in a public trust fund, the Shetland
Islands Council Charitable Trust. Thus the level of rents is inevitably observable and
veritable. The Council disburses around £15 million per year for community projects,
out of a total that today stands at £150 million (Christian Aid Report, 2003).
In Nigeria, evidences exist regarding resource management and outcomes.
Adebipe (2004), Odularu (2008), Van (2008), Akpan (2009). Adepibe (2004)’s work
focused on the impact of oil on Nigeria’s economic policy formulation from 1960 to
2000. Detailed descriptive analysis was explored. From the historical evaluation of
economic policies it was evident that prior to the discovery and extraction of oil in
commercial quantity, agriculture was the main stay of the Nigerian economy.
However, with the advent of oil, unprecedented wealth accrued to the Nigerian
government. This affected policy formulation. There were series of policy reversals
which took its toll on the real sector of the economy; leading to its neglect. The
author argues that the upstream sector of the oil industry in Nigeria
The findings of Odularu (2008) who analysed the relationship between the crude
oil sector and Nigeria’s economic performance were similar to Adebipe (2004). Using
Ordinary Least Square (OLS) regression method for the period 1970 to 2005, the
findings revealed that crude oil consumption and exports had contributed positively
to the improvement of the Nigerian economy. A striking issue emerging from the
results is the finding that despite the positive relationship between domestic
consumption and export of crude oil, the coefficient of crude oil export was
11
insignificant. Plausible reasons advanced by the author, were, misappropriation of
public funds (corruption), and poor administration. The author recommended the
need for urgency in diversifying the export market especially the oil market, fight
corruption and the encouragement of private sector participation in crude oil
activities. A flaw observed in the analysis is the absence of some diagnostic tests on
the specification to ascertain the appropriateness of the specification. Similarly, unit
root tests were not conducted on the series to determine their stationarity or
otherwise. In econometric analysis involving time series, this is crucial to avoid
spurious regressions (Engle and Granger, 1997).
Van (2008) states that Nigeria’s poor record with managing oil revenue volatility
results from poor institutional framework and excessive debt over hang. The
arguments flow from a framework developed in the study to analyse public debt
decomposition dynamics. From the analysis, the debt overhang problem makes the
capital market inaccessible at the very moment they are needed. The author
concludes that fiscal policy in Nigeria should pay particular attention downside risk, if
the improvements observed in the economy beginning 2004 are to be sustained.
Using a VAR methodology, Akpan (2009) investigated oil price shocks and
Nigeria’s macro economy for the period 1970 to 2007. The study pointed out the
asymmetric effects of oil price shocks; for instance, positive as well as negative oil
price shocks significantly increased inflation and also directly increased real national
income through higher export earnings, though part of this gain was seen to be
offset by losses from lower demand for exports generally due to the economic
recession suffered by trading partners. The findings of the work further showed a
strong positive relationship between positive oil price changes and real government
expenditures. Unexpectedly, the result identified a marginal impact of oil price
fluctuations on industrial output growth. Furthermore, the "Dutch Disease" syndrome
was observed through significant real effective exchange rate appreciation. The
result confirmed the neglect of the agricultural sector following the advent of oil
observed by previous works (see Adepibe, 2004, Odularu, 2008)
12
3.1 Food Security The literature is replete with studies on food security especially in developing
countries. Clover (2003), Smith (2007), Babatunde et al. (2007), Swaminathan (2008),
Oriola (2009), Fayeye and Ola (2007) are some of the works that have examined food
security in developing countries. The authors argue that domestic policies in many
developing countries have contributed very marginally to food security especially in
Africa, and that, despite the growing global food production, hunger, malnutrition and
famine are prevalent in many developing countries. Oriola (2009) states that Nigeria’s
case is particularly worrisome owing to the abundant natural resources endowed the
country. Clover (2003) in particular examined food security in Sub-Saharan Africa. He
acknowledges that 840billion people worldwide are malnourished, the highest
percentage of these being in Africa. Clover argues that actions and plans to address
food security have continued to fall short, while food insecurity remains a thorny issue.
To him, this failure can be attributed to faulty analysis and actions. He suggests going
beyond conventional, orthodox wisdom to work more strategically in developing and
implementing effective international, national and regional policies as a way out.
Fayeye and Ola (2007) further stress the fact that Sub-Saharan Africa is
ravaged by poverty and severe malnutrition with 30 of the 45 countries having low or
critically low level of food security between 1991 and 2003. The authors observe that
food availability in the sub-continent which stood at 2100kcal/person/day within the
same period is the poorest in the world. From their analysis it is evident that
improvement in food production in SSA will boost per capita GDP, raise purchasing
power and access to improved therapeutic prophylactic health management. Their
major conclusion is that research is needed on new technologies that are output-
driven, ecologically friendly, acceptable and affordable to the resource farmers.
Finally, good governance and stable polity they argue will provide an essential and
enabling environment for food security in Sub-Saharan Africa.
Sudan’s case with food insecurity appears quite peculiar within the sub-
Saharan African region owing to the persistent political instabilities the country has
faced since its independence in 1956. Hence, Smith (2007)’s investigation of food
crisis in Sudan. The study is a detailed analysis of the historical evolution of Sudan in
terms of policies and programmes affecting especially peasant framers. His important
13
contribution rests on the observation that Sudan’s poor domestic policy has caused
excessive strife and suffering in the lives of peasant farmers, thus, resulting in
persistent hunger and malnutrition. The author further argues that to add insult to
injury, subsistence farmers are plagued by violence, genocide, drought, floods, tsetse
flies, and poor infrastructure, with a government that does little to nothing to assist
them. Despite international assistance, the civil unrests puts peasant farmers and the
entire population especially the poor at a great disadvantage. He concludes that if
tranquility can be established in this unstable area, the nation’s economy could easily
climb to unprecedented heights. With an already growing economy and an aspiration
for national harmony, Sudan has the potential to rise above the distress it is so
accustomed to and present itself as an example for other sub-Saharan countries to
follow.
The case of India as presented by Swaminathan (2001) shows that the first
60 years of the 20th century in India, the capacity to achieve a balance between human
numbers and the production of food grains and other agricultural commodities was
marked by a sense of despair. This, the author presents gave way to optimism with
the introduction of the green revolution. He however notes that there are certain
constraints which India and other developing countries face in the search for food
security. These are damage to the ecology, mismatch between production and post
harvest technologies. Other constraints which are external are global threats to
agricultural destiny of India and indeed other developing countries include, unequal
trade bargain inherent in the WTO agreement of 1994, rapid expansion of proprietary
science and potential adverse changes in temperature, precipitation, among others.
The paper argues that overcoming the external threats to agriculture will require the
United States and other industrialised countries providing adequate support for
research at the international level and revising the agreement on agriculture of the
WTO in a manner that trade becomes a powerful tool for poverty eradication.
The findings of Oriola (2009) corroborate Smith (2007). Oriola (2009)’s work
focuses on Nigeria. The specific issues raised in the article were; (i) describing a
framework for understanding the relationship between irrigation system, food
production and poverty and (ii) examining past efforts at attaining food sufficiency
along side current trends in food security in Nigeria. Analytical and qualitative
techniques were employed. From the findings, despite the huge investments in the
14
agricultural sector and lofty projects implemented by successive governments in
Nigeria, food security remained a major challenge. He however noted that following
recent economic reforms, domestic production of food had improved marginally. He
concludes that there is urgent need to explore the natural endowments; soil and water
resource and reform in irrigation agricultural system which should stimulate wider
growth in food production, hence reduce food insecurity and poverty as a whole.
Babatunde et al (2007) is another detailed work on food insecurity in Nigeria.
The study utilized a three-stage random sampling technique to obtain a sample of 94
farm households and a cross sectional data in year 2005. Descriptive analysis was
carried out to describe the socio-economic characteristics of the households.
Econometric tools were used to determine factors affecting the food security status of
household. Using the recommended calorie required approach; the study revealed
that 36 per cent and 64 per cent of the households were food secure and food
insecure respectively. The Shortfall/Surplus index showed that the food secure
households exceeded the recommended calorie intake by 42 per cent, while the food
insecure households fell short of the recommended calorie intake by 38 per cent. A
logit regression model made up of eight regressors was specified. Household income,
household size, educational status of household’s head and quantity of food obtained
from own production were found to determine the food security status of farming
households in the study area. It is concluded that the design of food security strategies
should be multi-dimensional such that would focus on and address the identified
determinants in order to achieve the target set by the Millennium Development Goals.
In an earlier work, Ukoha (1997) examined the link between food insecurity
and poverty in Nigeria. A single equation model was explored, with data series from
1976 to 1994. The theoretical framework employed was based on the Keynesian
absolute income hypothesis along side Hazell (1989) and Braun et al (1992)’s
specifications. From the results, adequate domestic food production was considered to
be the major determinant of food security. The author recommended the need to focus
on policies that will enhance domestic production of agricultural outputs. Specifically,
the author emphasized the need for increased access of farmers’ extension services
and ensuring reasonable and stable supply of agricultural inputs as the forward.
However, the estimation technique employed was fraught with various shortcomings.
The author assumed away the time series properties of the variables. This leads to
15
spurious results, thus, making the findings somewhat unreliable. In addition, the
number of observations and frequency of the series makes room for very small
degrees of freedom. The results should therefore be treated with caution.
The literature review presents consistent arguments regarding the food
insecurity situation in developing countries and Nigeria in particular. The current study
draws from and overlaps previous works in the subject but defines its scope somewhat
differently. Oil revenue is included as a factor influencing food insecurity in Nigeria.
This captures the heavy dependence on oil proceeds as the major revenue earner for
Nigeria. The import is to investigate the extent to which oil proceeds especially shocks
have contributed in alleviating food insecurity. In addition, quarterly as opposed to
annual series are employed and this enhances the degree of freedom.
4. Data and Methodology
The study employs observations for the period 1970 to 2007. This period is
chosen to capture the first and second oil booms of the 1970s and mid-2000s
respectively. Data for the analysis are quarterly series and are obtained from the IFS
CD Rom 2007. Quarterly series are preferred as it increases the data points and
provides greater degrees of freedom. All variables are in logarithmic terms. The
variables in the model are; real oil revenue, per capita income, food insecurity, food
imports and real agricultural output.
4.1 Model Specification The model specification is based on the assumption that availability of food
and ability to purchase the food are two essential determinants of food security. The
first does not ensure the second; food may be available, but a household may not
have access to it. However, adequate national food availability remains a necessary
condition for household food security. In many famine-prone African countries, it has
been established that there is a close relationship between domestic food production,
regional and local food availability and household food security (FAO, 1987 and Braun
et al. 1992). Hazell (1989) and Braun et al (1992) indicate that fluctuations in a country’s
capacity to import food (which is a function of export earnings, world prices and debt-
16
service obligations, among other variables) also contribute to global food availability.
Another important determinant of food insecurity provided in economic theory is the
real per capita income which stems from the Keynesian absolute income hypothesis. Thus, to investigate the response of food insecurity innovations to oil
revenue, an unrestricted Vector Autoregressive (VAR) model is explored. The VAR
model provides a multivariate framework where changes in a particular variable (oil
price) are related to changes in its own lags and to changes in other variables and the
lags of those variables. The VAR treats all variables as endogenous and does not
impose a priori restrictions on structural relationships. Since the VAR expresses the
dependent variables in terms of predetermined lagged variables, it is a reduced-form
model. Once the VAR has been estimated, the relative importance of a variable in
generating variations in its own value and in the value of other variables can be
assessed (Forecast Error Variance Decomposition (VDC)). VDC assesses the relative
importance of oil shocks in the volatility of other variables in the system. The dynamic
response of macroeconomic variables to innovations in a particular variable can also
be traced out using the simulated responses of the estimated VAR system (Impulse
Response Functions (IRF)). Thus, the IRF enables the determination of the dynamic
effects of oil revenue on agricultural output and food security in the economy. The
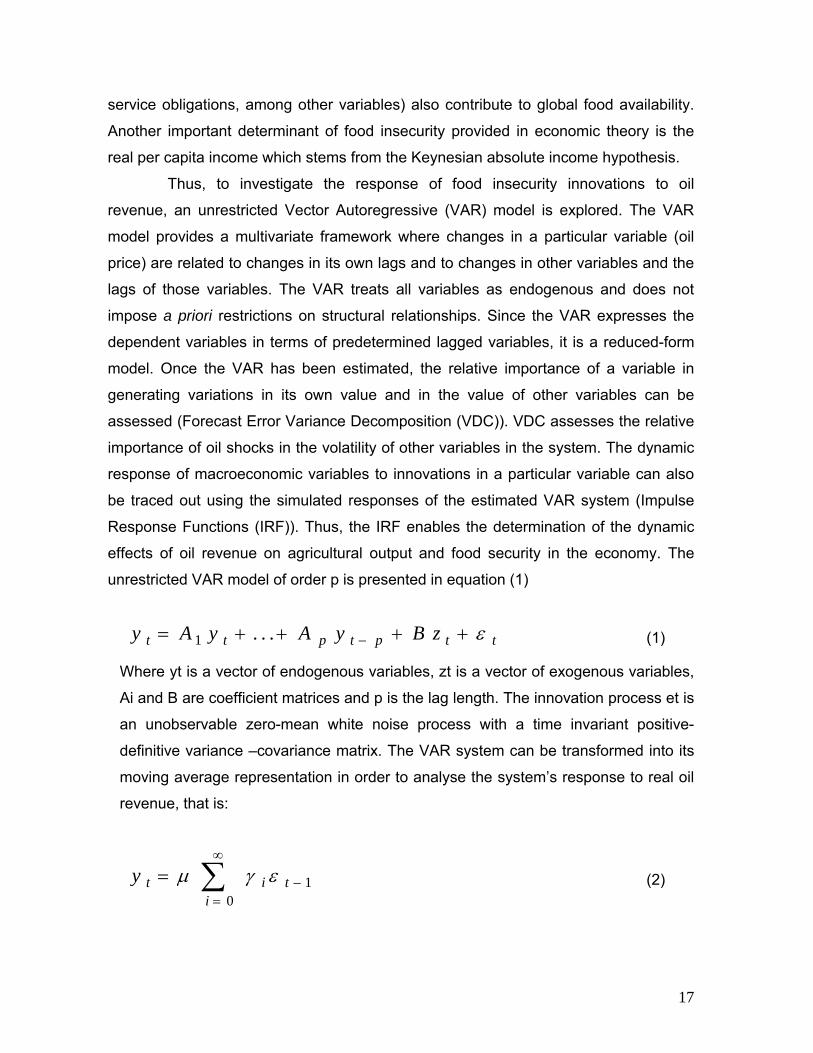
unrestricted VAR model of order p is presented in equation (1)
1 . . .t t p t p ty A y A y B z tε−= + + + + (1)
Where yt is a vector of endogenous variables, zt is a vector of exogenous variables,
Ai and B are coefficient matrices and p is the lag length. The innovation process et is
an unobservable zero-mean white noise process with a time invariant positive-
definitive variance –covariance matrix. The VAR system can be transformed into its
moving average representation in order to analyse the system’s response to real oil
revenue, that is:
10
t ii
y tμ γ ε∞
−=
= ∑ (2)
17
Where 0γ is the identity matrix, μ is the mean of the process. The moving
average representation is used to obtain the forecast error variance decomposition
and impulse response function.
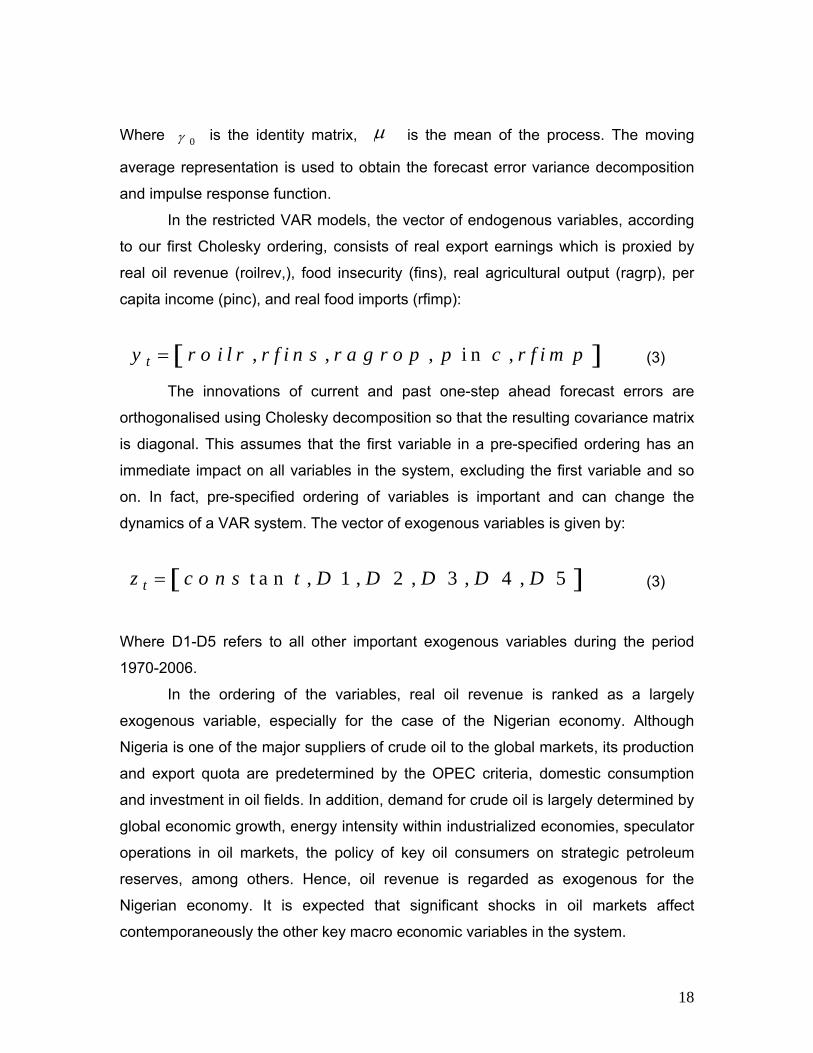
In the restricted VAR models, the vector of endogenous variables, according
to our first Cholesky ordering, consists of real export earnings which is proxied by
real oil revenue (roilrev,), food insecurity (fins), real agricultural output (ragrp), per
capita income (pinc), and real food imports (rfimp):
[ ], , , i n ,ty r o i l r r f i n s r a g r o p p c r f i m p= (3)
The innovations of current and past one-step ahead forecast errors are
orthogonalised using Cholesky decomposition so that the resulting covariance matrix
is diagonal. This assumes that the first variable in a pre-specified ordering has an
immediate impact on all variables in the system, excluding the first variable and so
on. In fact, pre-specified ordering of variables is important and can change the
dynamics of a VAR system. The vector of exogenous variables is given by:
[ ]t a n , 1 , 2 , 3 , 4 , 5tz c o n s t D D D D D= (3)
Where D1-D5 refers to all other important exogenous variables during the period
1970-2006.
In the ordering of the variables, real oil revenue is ranked as a largely
exogenous variable, especially for the case of the Nigerian economy. Although
Nigeria is one of the major suppliers of crude oil to the global markets, its production
and export quota are predetermined by the OPEC criteria, domestic consumption
and investment in oil fields. In addition, demand for crude oil is largely determined by
global economic growth, energy intensity within industrialized economies, speculator
operations in oil markets, the policy of key oil consumers on strategic petroleum
reserves, among others. Hence, oil revenue is regarded as exogenous for the
Nigerian economy. It is expected that significant shocks in oil markets affect
contemporaneously the other key macro economic variables in the system.
18
The second variable in the ordering is food insecurity which is measured by
deficits in per capita daily calorie intake and is expressed as a function of total
domestic output of food, per capita income and food imports which are the third,
fourth and fifth variables. The variables in the models are deflated by consumer price
index in order to obtain their real values. Hence, these variables enter the
behavioural equations in real form. In addition, all the variables except those with
negative values were transformed into natural logarithms
5. Empirical results
This section presents the empirical results of the analysis beginning with the
time series properties of the variables used for the estimation. This is meant to
ascertain the appropriateness of the specification and determine the underlying
properties of the data generating process. Following this, the empirical results are
presented.
5.1 Unit Root Results
The analysis is based on time series data. This therefore requires some
specific approaches to the analysis. It is generally known that the econometric
estimation of a model based on time series data demands that the series be
stationary as non-stationary series usually result in misleading inferences. Engle and
Granger (1987) provide a standard technique to deal with this problem. This involves
testing the variables of an equation for stationarity. The estimation therefore begins
by conducting stationarity test to ascertain the stationarity or otherwise of the
variables and the appropriateness of the specification for VAR estimation. Thus, both
the Augmented Dickey and Fuller (1979) and the Phillips and Perron (1988) tests are
employed. The ADF- tests and PP-tests are reported in Table 3. The results show
that the variables expressed in logs are non-stationary. When all variables are first
differenced, there is evidence that all variables are stationary. Since the variables in
the model follow an I (1) process, the second step is to test if a long run relationship
(cointegration) exists among the variables. To test this, the Johansen maximum-
19
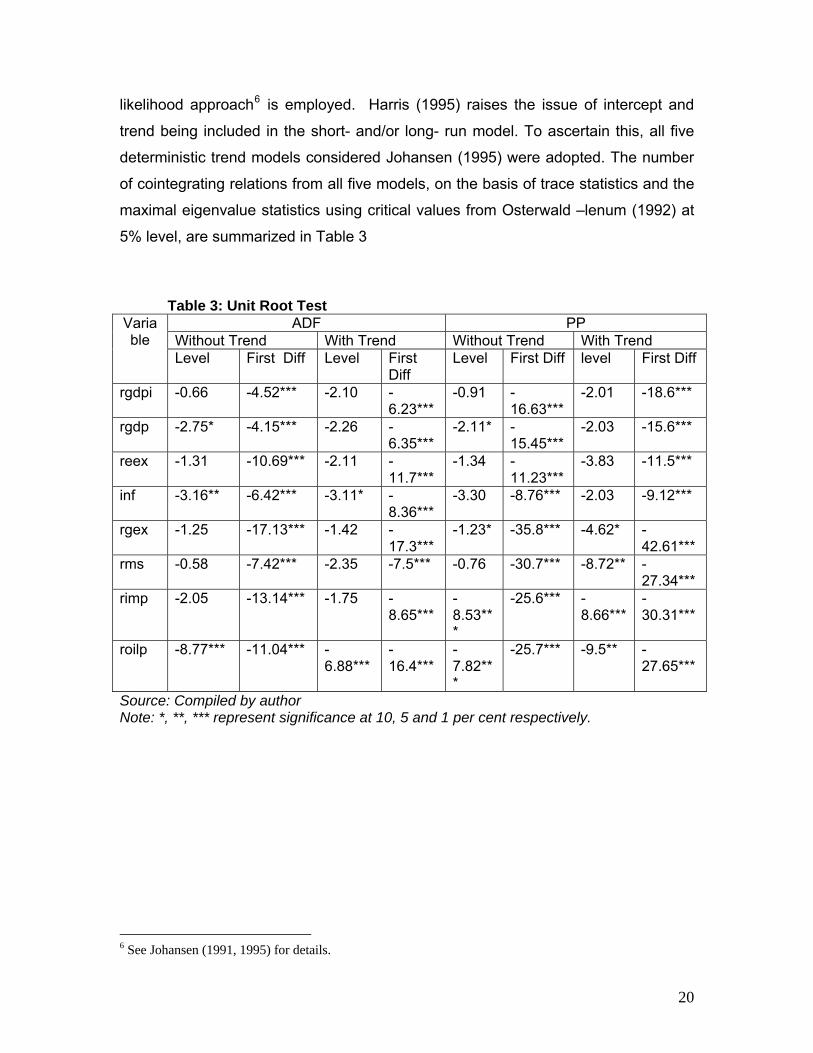
likelihood approach6 is employed. Harris (1995) raises the issue of intercept and
trend being included in the short- and/or long- run model. To ascertain this, all five
deterministic trend models considered Johansen (1995) were adopted. The number
of cointegrating relations from all five models, on the basis of trace statistics and the
maximal eigenvalue statistics using critical values from Osterwald –lenum (1992) at
5% level, are summarized in Table 3
Table 3: Unit Root Test
ADF PP Without Trend With Trend Without Trend With Trend
Variable
Level First Diff Level First Diff
Level First Diff level First Diff
rgdpi -0.66 -4.52*** -2.10 -6.23***
-0.91 -16.63***
-2.01 -18.6***
rgdp -2.75* -4.15*** -2.26 -6.35***
-2.11* -15.45***
-2.03 -15.6***
reex -1.31 -10.69*** -2.11 -11.7***
-1.34 -11.23***
-3.83 -11.5***
inf -3.16** -6.42*** -3.11* -8.36***
-3.30 -8.76*** -2.03 -9.12***
rgex -1.25 -17.13*** -1.42 -17.3***
-1.23* -35.8*** -4.62* -42.61***
rms -0.58 -7.42*** -2.35 -7.5*** -0.76 -30.7*** -8.72** -27.34***
rimp -2.05 -13.14*** -1.75 -8.65***
-8.53***
-25.6*** -8.66***
-30.31***
roilp -8.77*** -11.04*** -6.88***
-16.4***
-7.82***
-25.7*** -9.5** -27.65***
Source: Compiled by author Note: *, **, *** represent significance at 10, 5 and 1 per cent respectively.
6 See Johansen (1991, 1995) for details.
20
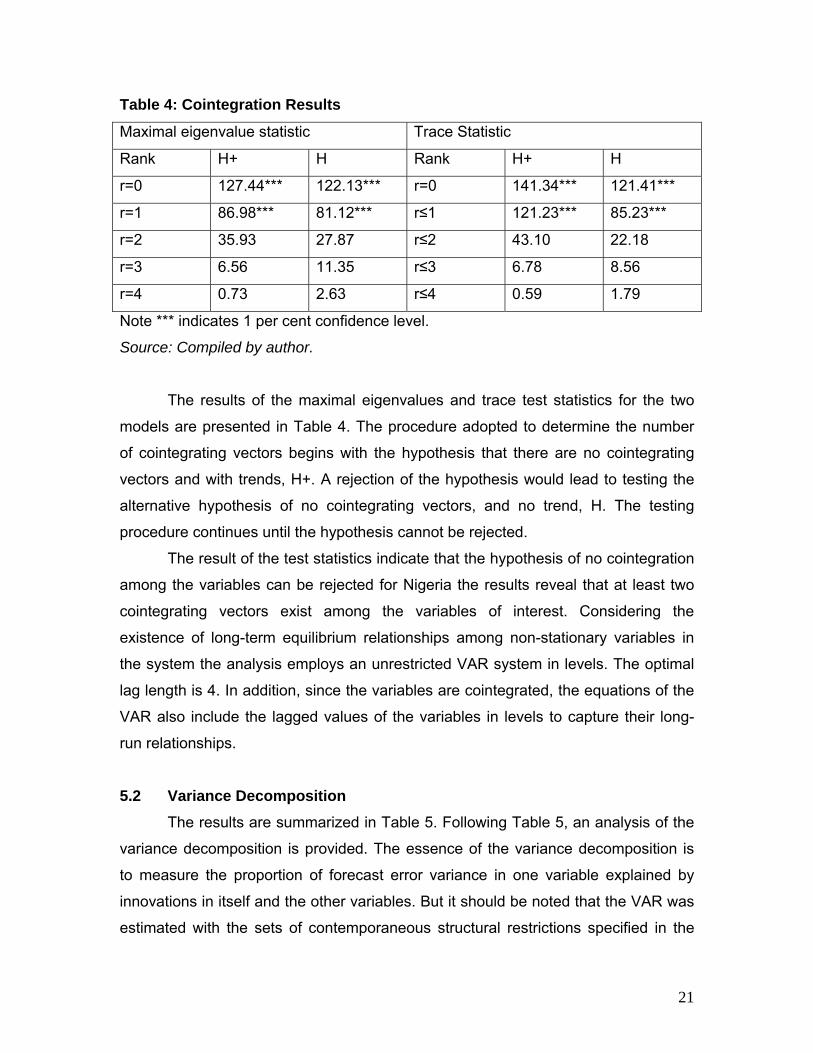
Table 4: Cointegration Results
Maximal eigenvalue statistic Trace Statistic
Rank H+ H Rank H+ H
r=0 127.44*** 122.13*** r=0 141.34*** 121.41***
r=1 86.98*** 81.12*** r≤1 121.23*** 85.23***
r=2 35.93 27.87 r≤2 43.10 22.18
r=3 6.56 11.35 r≤3 6.78 8.56
r=4 0.73 2.63 r≤4 0.59 1.79
Note *** indicates 1 per cent confidence level.
Source: Compiled by author.
The results of the maximal eigenvalues and trace test statistics for the two
models are presented in Table 4. The procedure adopted to determine the number
of cointegrating vectors begins with the hypothesis that there are no cointegrating
vectors and with trends, H+. A rejection of the hypothesis would lead to testing the
alternative hypothesis of no cointegrating vectors, and no trend, H. The testing
procedure continues until the hypothesis cannot be rejected.
The result of the test statistics indicate that the hypothesis of no cointegration
among the variables can be rejected for Nigeria the results reveal that at least two
cointegrating vectors exist among the variables of interest. Considering the
existence of long-term equilibrium relationships among non-stationary variables in
the system the analysis employs an unrestricted VAR system in levels. The optimal
lag length is 4. In addition, since the variables are cointegrated, the equations of the
VAR also include the lagged values of the variables in levels to capture their long-
run relationships.
5.2 Variance Decomposition
The results are summarized in Table 5. Following Table 5, an analysis of the
variance decomposition is provided. The essence of the variance decomposition is
to measure the proportion of forecast error variance in one variable explained by
innovations in itself and the other variables. But it should be noted that the VAR was
estimated with the sets of contemporaneous structural restrictions specified in the
21
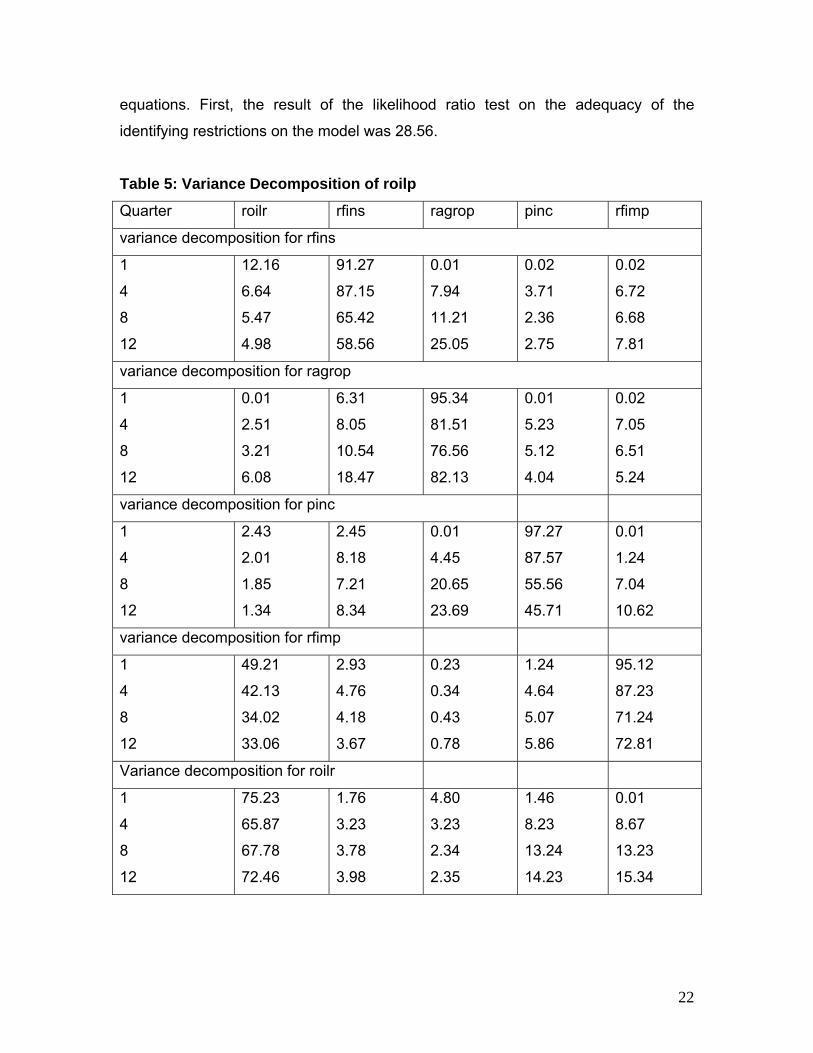
equations. First, the result of the likelihood ratio test on the adequacy of the
identifying restrictions on the model was 28.56. Table 5: Variance Decomposition of roilp
Quarter roilr rfins ragrop pinc rfimp
variance decomposition for rfins
1
4
8
12
12.16
6.64
5.47
4.98
91.27
87.15
65.42
58.56
0.01
7.94
11.21
25.05
0.02
3.71
2.36
2.75
0.02
6.72
6.68
7.81
variance decomposition for ragrop
1
4
8
12
0.01
2.51
3.21
6.08
6.31
8.05
10.54
18.47
95.34
81.51
76.56
82.13
0.01
5.23
5.12
4.04
0.02
7.05
6.51
5.24
variance decomposition for pinc
1
4
8
12
2.43
2.01
1.85
1.34
2.45
8.18
7.21
8.34
0.01
4.45
20.65
23.69
97.27
87.57
55.56
45.71
0.01
1.24
7.04
10.62
variance decomposition for rfimp
1
4
8
12
49.21
42.13
34.02
33.06
2.93
4.76
4.18
3.67
0.23
0.34
0.43
0.78
1.24
4.64
5.07
5.86
95.12
87.23
71.24
72.81
Variance decomposition for roilr
1
4
8
12
75.23
65.87
67.78
72.46
1.76
3.23
3.78
3.98
4.80
3.23
2.34
2.35
1.46
8.23
13.24
14.23
0.01
8.67
13.23
15.34
22
5.3 Discussion of Results The variance decomposition suggests that oil accounted for about 12 per cent
of shocks to food insecurity in the 1st quarter, declining in effects to 5 per cent in the
8th quarter and further to 4 per cent in the 12th quarter. Food imports contribute 6 per
cent in the 4th quarter rising marginally to about 7 per cent in the 12th quarter. An
immediate conclusion that can be drawn from the finding is that food imports play a
negligible role in alleviating food insecurity. The policy implication arising from this is
that greater benefits in terms of increase in the standard of living of populace would
be derived if the oil resources committed to food imports are employed in alternative
sources of national food security-domestic food production.
The response of food insecurity to a one standard deviation shock to positive
revenue changes was not significantly different form zero. This result confirms
Nigeria’s poor experience with managing oil revenue and is in tandem with the
findings of some previous studies (see Oriola, 2007, Van 2008, Akpan, 2009). It
further verifies the neglect of the agricultural sector which is the main source of food,
following the advent of oil.
A striking feature of the results is that real domestic food production proxied
by real agricultural output is the most important variable explaining food insecurity in
Nigeria. From the result about 85.2 per cent of the food problem in Nigeria would be
solved by promoting domestic food production. This implies that self-reliance in food
production is the best policy option for the nation in the quest for food security.
Export earnings, proxied by real oil revenue, were found insignificant in
determining food insecurity in Nigeria. This finding is consistent with Ukoha (1997)’s
work on determinants of food insecurity in Nigeria. A plausible explanation for this
finding is the persistent balance of payments problem experienced in Nigeria over
the years. This resulted in unsustainable debts. Mismanagement of oil proceeds and
embezzlement of public funds also accounted for huge debts thus, the export
earnings could not sustain huge food imports. This further strengthens the fact that
rather than import food, more resources (oil proceeds) should be channeled into
domestic food production.
The per capita income does not explain food insecurity in Nigeria. The reason
is not far fetched. Nigeria is ranked one of the poorest countries in the world. Hence,
23
the income accruing to households is unable to provide the needed daily food intake.
This calls for better income policy for the population.
Evidently, the results propose broad based policies that would assuage food
insecurity in Nigeria. The policies should be geared towards increased domestic
production of food, increased income and proper use of the oil proceeds accruing to
Nigerian government. Specific measures should include;
6. Conclusion Historical developments have shown that oil resource has been mismanaged
in Nigeria over the years. Hence, despite the huge revenue received from oil, Nigeria
remains a largely food insecure country with poor performance based on other social
indicators. Corruption, fiscal imprudence, huge debts and policy inconsistencies are
some of the major factors responsible for this dismal performance in Nigeria. If
Nigeria is to break free from this vicious cycle, there need for broad based reforms
which should increase per capita income, enhance domestic production of food and
diversify the revenue base. If the ongoing reforms are sustained, Nigeria remains on
the path to progress with the hope of decrease in the number of households that are
food insecure.
24
REFERENCES Ades, A. and R. Di Tella (1999) .Rents, Competition, and Corruption,. American Economic Review, vol. 89 No. 4, 982-993. Adegboye, R.O. (2004) “Land, Agriculture and Food Security in Nigeria, 3rd Fcaulty Lecture, Facullty of Agriculture, University of Ilorin Adeniyi O. (2008) “Oil Price Shocks and Nigeria’s macro economy” Unpublished PhD Thesis Post Field Report. Department of Economics, University of Ibadan African Development Bank 2000 and 2007. Selected Statistics on Regional Member Countries. Adebipe Biodun (2004), “The impact of Oil on Nigeria’s Economic Policy Formulation” Paper presented at the Conference on Nigeria: Maximising pro-poor growth: Regenerating the Socio-economic Database. 16th/17th June, 2004. Akpan, Eme O. (2009) “Oil Price Shocks and Nigeria’s macro economy” Paper presented at CSAE Conference, Oxford University, Oxford, UK. 21st-23rd March 2009. Babatunde, R.O, Omotesho, O.A, Sholotan, O.S (2007) “Socio-Economics characteristics and Food Security Status of Farming Households in Kwara State, North-Central Nigeria” Pakistan Journal of Nutrition. Vol.6 No.1 pp. 49-58 Budina and Wijnbergen (2008), Managing Oil Revenue Volatility in Nigeria: The Role of Fiscal Policy. pp. 425-459. Budina, N., G. Pang, and S.Van Wijnbergen (2007), “Nigeria’s Growth Record: Dutch Disease or Debt Overhang?’ Working Paper 4256, World Bank, Washington, DC. Braun Von, Joachin, T, Broca A. (1992), “Improving Food Security of the Poor: Concept, Policy and Programs. International Food Policy Research Institute, Washinton D.C Central Bank of Nigeria Statistical Bulletin, Various Issues. Central Bank of Nigeria Annual Report and Statement of Accounts, Various Issues. Christian Aid Report (2003), .Fuelling Poverty: Oil, War, and Corruption.. Clover Jenny (2003) “Food Security in Sub-Saharan Africa” African Security Review Vol.12 No.1. pp. 5-15 Collier, P. and A. Hoef_er (2000) .Greed and Grievance in Civil War,. Policy Research Working Paper 2355, Development Research Group, World Bank.
25
Corden, M., and J.P. Neary, (1984). “Booming Sector and Deindustrialization in a Small Open Economy.” Economic Journal Vol 92: pp825-848. Dickey, D.A. and Fuller W.A. (1979): “Distribution of the Estimators for Autoregressive Time series with a Unit Root”, Journal of the American Statistical Association 74, 427-431. FAO. 1987. Agriculture Towards 2000. FAO, Rome. FAO, 2005 “Food and Agricultural Organization, the state of Food Insecurity in the World, 2005. Rome, pp2 Fayeye T.R and Ola D.J. (2007) “Strategies for Food Security and Health Improvement in the Sub-Saharan Africa” World Journal of Agricultural Sciences. Vol.3 No. 6 pp. 808-814. Gylfason, T., T. Herbertson and G. Zoega (1999) .A Mixed Blessing: Natural Resources and Economic Growth,. Macroeconomic Dynamics 3, 204-225. Hazel, P.B.R. (1989) “Changing patterns of variability in world cereal production. In: variability in grain Yields. Jock R. Anderson and B.R. Hazell, eds. Baltimore and London, the Johns Hopkins university press for International food Policy Research Institute. Hodler, R. (2004) .The Curse of Natural Resources in Fractionalized Countries,. Volkswirtschaftliches Institut Discussion Paper 04-04, Universität Bern. Humphreys, M. (2005) "Natural resources, con_ict, and con_ict resolution: Uncovering the mechanisms," Journal of Conflict Resolution 49 (4): 508-537. IFPRI, 2006 “Reaching Sustainable Food Security for all by 2020: getting the Priorities and Responsibilities Ridht, pp: 1-8 Johansen, S. (1995): Likelihood-based Inference in Cointegrated Vector Autoregressive Models, Oxford, Oxford University Press. Kronenberg, T. (2004) .The Curse of Natural Resources in the Transition Economies,. Economics of Transition, Vol. 12 (3), pp.399-426. Mehlum, Moene and Torvik (2002) .Institutions and the Resource Curse,. University of Oslo, Department of Economics, Working Paper No. 29/2002. Mohammed Ibrahim (2008) Road map to attaining food security in Nigeria. Nigerian Tribune Monday, 5th May 2008. Odularu O.G., (2008) “Crude oil and The Nigerian Economic Performance” Oil and Gas Business, 2008. http://www.ogbus.ru/eng/
26
Olsson, O. (2004) .Conflict Diamonds,. Journal of Development Economics, forthcoming. Oriola E.O. (2009), “A Framework for Food Security and Poverty Reduction in Nigeria” European Journal of Social Sciences. Vol.8 No.1 pp.132-139. Osterwald-lenum, m. (1992): “A Note with quantiles of the asymptotic Distribution of the maximum Likelihood Cointegration rank Test statistics”, Oxford Bulletin of Economics and Statistics 54,481-472. Papyrakis, E. & R. Gerlach (2003) .Natural Resources: A Blessing or a Curse?,. Fondazione Eni Enrico Mattei Working Paper No. 8-2003. Phillips, P.C.B. and P.Perron (1988): Testing for a unit Root in Time Series regression, Biometrika 75, 335-346. Reutilinger, S. (1987), “Food Insecurity and Poverty in Developing Countries”. In, Food Policy. J. P. Gittinger, J. Leslie and D. Hoisington, eds. The Johns Hopkins University Press. Riscopoulos, S.J., Mukanyanye and O. Guyaux (1988), “Agriculture in the Year 2000, The Case of the African, Caribbean and Pacific Countries. International Forum, Athens, November. Røed Larsen, E. (2002), .Escaping the Natural Resource Curse and the Dutch Disease? Norway’s Catching up with and Forging ahead of Its Neighbors,. http://emlab.berkeley.edu/users/webfac/cbrown/e251_ Ross, M. (1999) .The Political Economy of the Resource Curse,. World Politics, 51. Ross, M. (2001) .”Does Oil Hinder Democracy?. World Politics, 53, 324-361. Sachs, J.D., and A. M. Warner (1995) .Natural Resource Abundance and Economic Growth,.Harvard Institute for International Development, Development Discussion Paper No. 517a,Cambridge. Sala-i-Martin, X. (1997) .”I just ran two million regressions”,. American Economic Review, 87 (2), pp. 178-183. Salti Nisreen (2007), “Oil greasing the wheels: When Do Natural Resources Become a blessing?” American University of Beirut Working Paper. shapouri S. and Rosen, s (1994) “Food Security and the role of Food aid. In; International agriculture and Trade Reports: Food Aid Needs assessment. Situation and Outlook series, united States department of Agriculture, Economic research service, GFA-5, November. Swaminathan M.S. (2001) “Food Security and Sustainable Development” Current Science. Vol.81, No.8. pp.948-954.
27
Smith J. (2007) “Food Security In Sudan” Darfur-overview. Sudan. June 2007. UNICEF. http://www.unicef.org/infobycountry/sudan_darfuroverview.html Ukoha O.O. (1997) “Determinants of Food Security in Nigeria and its implication for Poverty Alleviation” In: Poverty Alleviation in Nigeria, Nigerian Economic Society Conference Proceedings. Van Wijnbergen, S. (1984a), “Inflation, Employment, and the Dutch Disease in oil-Exporting Countries: A Short-Run Disequilibrium Analysis”. Quarterly Journal of Economics Vol.99 No.2: pp.233-250. Van Wijnbergen, S. (1984b), “The Dutch Disease: A Disease after All?’ The Economic Journal Vol. 94 No. 373: pp 41-55. Van Wijenbergen (2008): “Inflation, Employment, and the Dutch disease in Oil-exporting Countries: A short-run Disequilibrium Analysis, Quarterly Journal of Economics 145, 233-250. World development Indicators CD ROM, 2007. World Development Report, 2007.
28
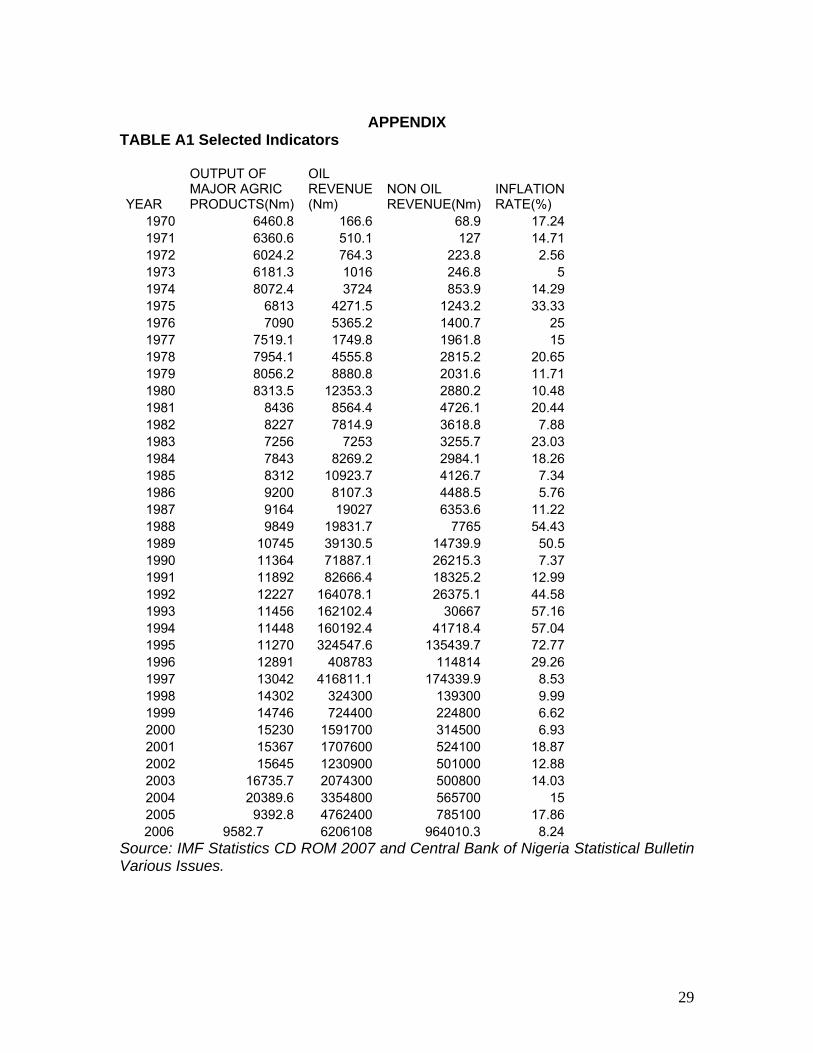
APPENDIX
TABLE A1 Selected Indicators
YEAR
OUTPUT OF MAJOR AGRIC PRODUCTS(Nm)
OIL REVENUE (Nm)
NON OIL REVENUE(Nm)
INFLATION RATE(%)
1970 6460.8 166.6 68.9 17.241971 6360.6 510.1 127 14.711972 6024.2 764.3 223.8 2.561973 6181.3 1016 246.8 51974 8072.4 3724 853.9 14.291975 6813 4271.5 1243.2 33.331976 7090 5365.2 1400.7 251977 7519.1 1749.8 1961.8 151978 7954.1 4555.8 2815.2 20.651979 8056.2 8880.8 2031.6 11.711980 8313.5 12353.3 2880.2 10.481981 8436 8564.4 4726.1 20.441982 8227 7814.9 3618.8 7.881983 7256 7253 3255.7 23.031984 7843 8269.2 2984.1 18.261985 8312 10923.7 4126.7 7.341986 9200 8107.3 4488.5 5.761987 9164 19027 6353.6 11.221988 9849 19831.7 7765 54.431989 10745 39130.5 14739.9 50.51990 11364 71887.1 26215.3 7.371991 11892 82666.4 18325.2 12.991992 12227 164078.1 26375.1 44.581993 11456 162102.4 30667 57.161994 11448 160192.4 41718.4 57.041995 11270 324547.6 135439.7 72.771996 12891 408783 114814 29.261997 13042 416811.1 174339.9 8.531998 14302 324300 139300 9.991999 14746 724400 224800 6.622000 15230 1591700 314500 6.932001 15367 1707600 524100 18.872002 15645 1230900 501000 12.882003 16735.7 2074300 500800 14.032004 20389.6 3354800 565700 152005 9392.8 4762400 785100 17.86
2006 9582.7 6206108 964010.3 8.24Source: IMF Statistics CD ROM 2007 and Central Bank of Nigeria Statistical Bulletin Various Issues.
29