Embed Size (px)
Citation preview

Dept of Bioenvironmental Systems EngineeringNational Taiwan University
Lab for Remote Sensing Hydrology and Spatial
Modeling
STATISTICSRandom Variables and
Probability Distributions
Professor Ke-Sheng ChengDepartment of Bioenvironmental Systems
EngineeringNational Taiwan University

Lab for Remote Sensing Hydrology and Spatial Modeling
Dept of Bioenvironmental Systems EngineeringNational Taiwan University
Definition of random variable (RV)
For a given probability space ( ,A, P[]), a random variable, denoted by X or X(), is a function with domain and counterdomain the real line. The function X() must be such that the set Ar, denoted
by , belongs to A for every real number r.
rXAr )(:

Lab for Remote Sensing Hydrology and Spatial Modeling
Dept of Bioenvironmental Systems EngineeringNational Taiwan University

Lab for Remote Sensing Hydrology and Spatial Modeling
Dept of Bioenvironmental Systems EngineeringNational Taiwan University
Cumulative distribution function (CDF)
The cumulative distribution function of a random variable X, denoted by , is defined to be
)(XF
RxxXPxXPxFX })(:{][)(

Lab for Remote Sensing Hydrology and Spatial Modeling
Dept of Bioenvironmental Systems EngineeringNational Taiwan University
Consider the experiment of tossing two fair coins. Let random variable X denote the number of heads. CDF of X is
x
x
x
x
xFX
21
2175.0
1025.0
00
)(

Lab for Remote Sensing Hydrology and Spatial Modeling
Dept of Bioenvironmental Systems EngineeringNational Taiwan University
)()(75.0)(25.0)( ),2[)2,1[)1,0[ xIxIxIxFX

Lab for Remote Sensing Hydrology and Spatial Modeling
Dept of Bioenvironmental Systems EngineeringNational Taiwan University
Indicator function or indicator variable
Let be any space with points and A any subset of . The indicator function of A, denoted by , is the function with domain and counterdomain equal to the set consisting of the two real numbers 0 and 1 defined by
)(AI
A if
A ifI A
0
1)(

Lab for Remote Sensing Hydrology and Spatial Modeling
Dept of Bioenvironmental Systems EngineeringNational Taiwan University
Discrete random variables
A random variable X will be defined to be discrete if the range of X is countable.
If X is a discrete random variable with values
then the function denoted by
and defined by
is defined to be the discrete density function of X.
,,,,, 21 nxxx)(Xf
j
jjX xx if
njxx ifxXPxf
0
,,,2,1,][)(
Lab for Remote Sensing Hydrology and Spatial Modeling
Dept of Bioenvironmental Systems EngineeringNational Taiwan University
Continuous random variables
A random variable X will be defined to be continuous if there exists a function such that for every real number x.
The function is called the probability density function of X.
)(Xf
x
XX duufxF )()(
)(Xf

Lab for Remote Sensing Hydrology and Spatial Modeling
Dept of Bioenvironmental Systems EngineeringNational Taiwan University
Properties of a CDF
is continuous from the right, i.e.
0)()( lim
xFF Xx
X
1)()( lim
xFF Xx
X
ba for bFaF XX )()(
)()(lim00
xFhxF XXh
)(XF

Lab for Remote Sensing Hydrology and Spatial Modeling
Dept of Bioenvironmental Systems EngineeringNational Taiwan University
Properties of a PDF
RxxfX 0)(
1)(
xfX

Lab for Remote Sensing Hydrology and Spatial Modeling
Dept of Bioenvironmental Systems EngineeringNational Taiwan University
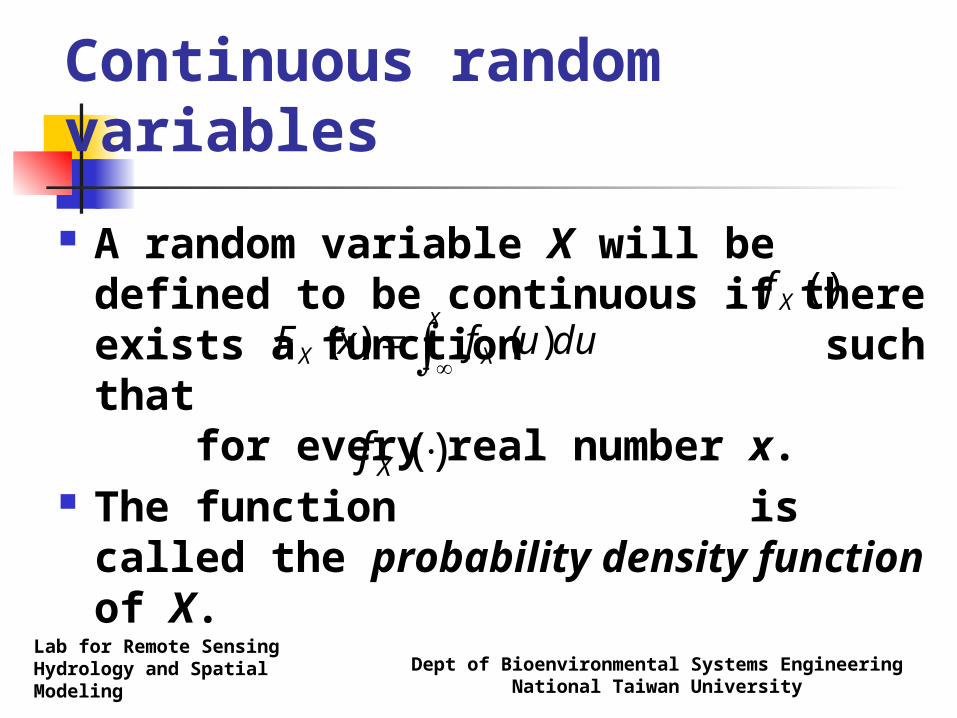
Example 1
Determine which of the following are valid distribution functions:
0
0
2/
]2/[1)(
2
2
x
x
e
exF
x
x
X
)2()()( axuaxua
xxFX
0
0
0
1)(
x
x xu

Lab for Remote Sensing Hydrology and Spatial Modeling
Dept of Bioenvironmental Systems EngineeringNational Taiwan University
Lab for Remote Sensing Hydrology and Spatial Modeling
Dept of Bioenvironmental Systems EngineeringNational Taiwan University

Lab for Remote Sensing Hydrology and Spatial Modeling
Dept of Bioenvironmental Systems EngineeringNational Taiwan University
Example 2
Determine the real constant a, for arbitrary real constants m and 0 < b, such that
is a valid density function.
Rxaexf bmxX /)(

Lab for Remote Sensing Hydrology and Spatial Modeling
Dept of Bioenvironmental Systems EngineeringNational Taiwan University
Function is symmetric about m.
)(xfX
1222)(0
/)(
abdyeabdxaedxxf y
m
bmxX
ba 2/1

Lab for Remote Sensing Hydrology and Spatial Modeling
Dept of Bioenvironmental Systems EngineeringNational Taiwan University
Characterizing random variables Cumulative distribution
function Probability density function
Expectation (expected value) Variance Moments Quantile Median Mode

Lab for Remote Sensing Hydrology and Spatial Modeling
Dept of Bioenvironmental Systems EngineeringNational Taiwan University
Expectation of a random variable
The expectation (or mean, expected value) of X, denoted by or E(X) , is defined by:
X

Lab for Remote Sensing Hydrology and Spatial Modeling
Dept of Bioenvironmental Systems EngineeringNational Taiwan University
Rules for expectation
Let X and Xi be random variables
and c be any real constant.

Lab for Remote Sensing Hydrology and Spatial Modeling
Dept of Bioenvironmental Systems EngineeringNational Taiwan University
Variance of a random variable

Lab for Remote Sensing Hydrology and Spatial Modeling
Dept of Bioenvironmental Systems EngineeringNational Taiwan University
is called the standard deviation of X.
0)( XVarX
22222 ])[(][ ][ XX XEXEXEXVar

Lab for Remote Sensing Hydrology and Spatial Modeling
Dept of Bioenvironmental Systems EngineeringNational Taiwan University
Rules for variance

Lab for Remote Sensing Hydrology and Spatial Modeling
Dept of Bioenvironmental Systems EngineeringNational Taiwan University
Two random variables are said to be independent if knowledge of the value assumed by one gives no clue to the value assumed by the other.
Events A and B are defined to be independent if and only if
BPAPBAPABP ][

Lab for Remote Sensing Hydrology and Spatial Modeling
Dept of Bioenvironmental Systems EngineeringNational Taiwan University
Moments and central moments of a random variable

Lab for Remote Sensing Hydrology and Spatial Modeling
Dept of Bioenvironmental Systems EngineeringNational Taiwan University
Properties of moments

Lab for Remote Sensing Hydrology and Spatial Modeling
Dept of Bioenvironmental Systems EngineeringNational Taiwan University

Lab for Remote Sensing Hydrology and Spatial Modeling
Dept of Bioenvironmental Systems EngineeringNational Taiwan University
Quantile The qth quantile of a random variable X, de
noted by , is defined as the smallest number satisfying .
q qFX )(

Lab for Remote Sensing Hydrology and Spatial Modeling
Dept of Bioenvironmental Systems EngineeringNational Taiwan University
Median and mode
The median of a random variable is the 0.5th quantile, or .
The mode of a random variable X is defined as the value u at which is the maximum of .
5.0
)(uf X)(Xf

Lab for Remote Sensing Hydrology and Spatial Modeling
Dept of Bioenvironmental Systems EngineeringNational Taiwan University
Note: For a positively skewed distribution, the mean will always be the highest estimate of central tendency and the mode will always be the Lowest estimate of central tendency (assuming that the distribution has only one mode). For negatively skewed distributions, the mean will always be the lowest estimate of central tendency and the mode will be the highest estimate of central tendency. In any skewed distribution (i.e., positive or negative) the median will always fall in-between the mean and the mode.

Lab for Remote Sensing Hydrology and Spatial Modeling
Dept of Bioenvironmental Systems EngineeringNational Taiwan University
Moment generating function

Lab for Remote Sensing Hydrology and Spatial Modeling
Dept of Bioenvironmental Systems EngineeringNational Taiwan University

Lab for Remote Sensing Hydrology and Spatial Modeling
Dept of Bioenvironmental Systems EngineeringNational Taiwan University
Usage of MGF MGF can be used to express
moments in terms of PDF parameters and such expressions can again be used to express mean, variance, coefficient of skewness, etc. in terms of PDF parameters.
Random variables of the same MGF are associated with the same type of probability distribution.

Lab for Remote Sensing Hydrology and Spatial Modeling
Dept of Bioenvironmental Systems EngineeringNational Taiwan University
The moment generating function of a sum of independent random variables is the product of the moment generating functions of individual random variables.

Lab for Remote Sensing Hydrology and Spatial Modeling
Dept of Bioenvironmental Systems EngineeringNational Taiwan University
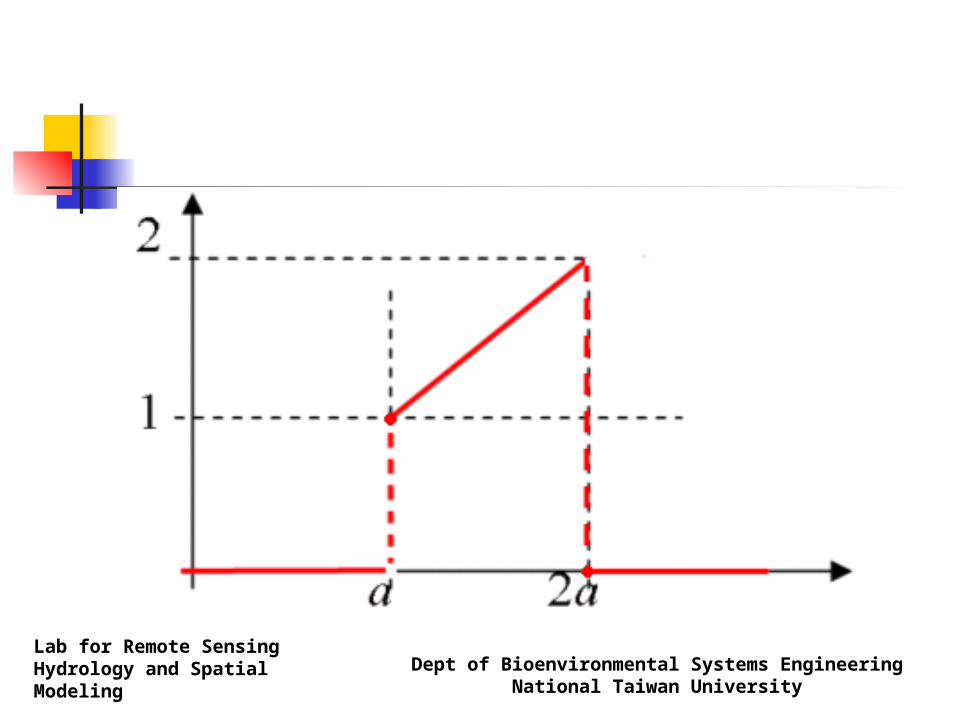
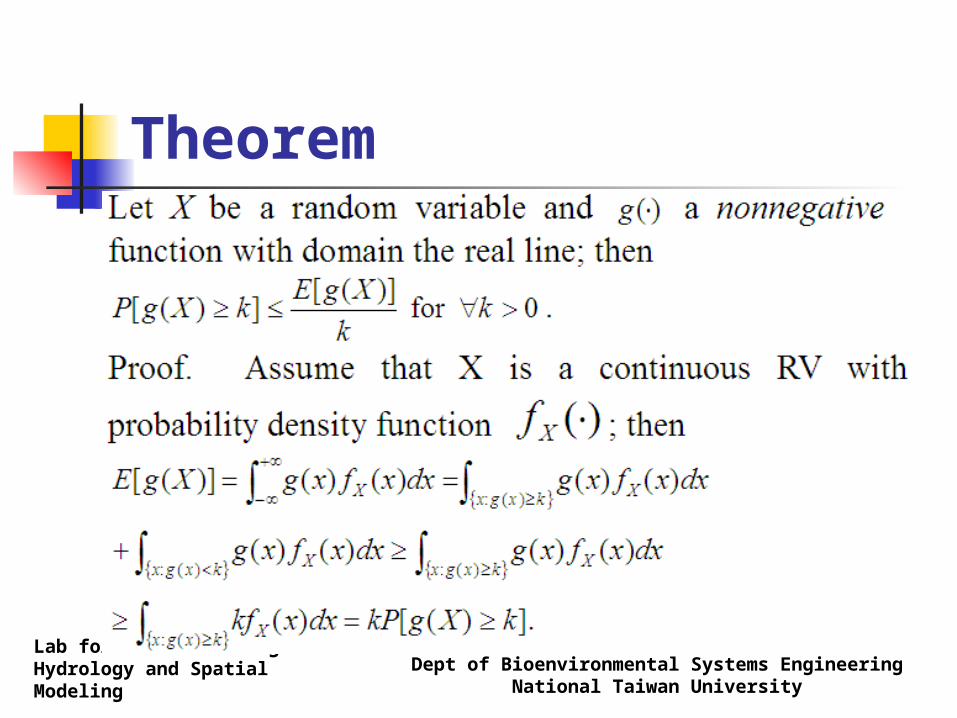
Expected value of a function of a random variable

Lab for Remote Sensing Hydrology and Spatial Modeling
Dept of Bioenvironmental Systems EngineeringNational Taiwan University
If Y=g(X)
dyyyfYE
dxxfxgXgE
Y
X
)(
)()()]([
dxxfxXEXVar XXX )()(])[(][ 22
Lab for Remote Sensing Hydrology and Spatial Modeling
Dept of Bioenvironmental Systems EngineeringNational Taiwan University
Y
Y=g(X)
Xx1
y
x2 x3
dyyyfYE
dxxfxgXgE
Y
X
)(
)()()]([
Lab for Remote Sensing Hydrology and Spatial Modeling
Dept of Bioenvironmental Systems EngineeringNational Taiwan University
Theorem

Lab for Remote Sensing Hydrology and Spatial Modeling
Dept of Bioenvironmental Systems EngineeringNational Taiwan University
Chebyshev Inequality
Lab for Remote Sensing Hydrology and Spatial Modeling
Dept of Bioenvironmental Systems EngineeringNational Taiwan University
The Chebyshev inequality gives a bound, which does not depend on the distribution of X, for the probability of particular events described in terms of a random variable and its mean and variance.

Lab for Remote Sensing Hydrology and Spatial Modeling
Dept of Bioenvironmental Systems EngineeringNational Taiwan University
Probability density functions of discrete random variables
Discrete uniform distribution Bernoulli distribution Binomial distribution Negative binomial distribution Geometric distribution Hypergeometric distribution Poisson distribution

Lab for Remote Sensing Hydrology and Spatial Modeling
Dept of Bioenvironmental Systems EngineeringNational Taiwan University
Discrete uniform distribution
N ranges over the possible integers.
)(1
0
,,2,11
);( ,,2,1 xINotherwise
NxNNxf NX
2/)1(][ NXE
N
j
jtX N
etm
NXVar
1
2
1)(
12/)1(][

Lab for Remote Sensing Hydrology and Spatial Modeling
Dept of Bioenvironmental Systems EngineeringNational Taiwan University
Bernoulli distribution
1-p is often denoted by q.
)()1(0
10)1();( 1,0
11
xIppotherwise
or xpppxf xx
xx
X
10 p
pXE ][
qpetm
pqXVart
X
)(
][

Lab for Remote Sensing Hydrology and Spatial Modeling
Dept of Bioenvironmental Systems EngineeringNational Taiwan University
Binomial distribution
Binomial distribution represents the probability of having exactly x success in n independent and identical Bernoulli trials.
)()1(
0
,,1,0)1(),;( ,,1,0 xIpp
x
n
otherwise
nxppx
npnxf n
xnxxnx
X
npXE ][nt
X peqtm
npqpnpXVar
)()(
)1(][

Lab for Remote Sensing Hydrology and Spatial Modeling
Dept of Bioenvironmental Systems EngineeringNational Taiwan University
Negative binomial distribution Negative binomial distribution represents the
probability of having exactly r success in x independent and identical Bernoulli trials.
Unlike the binomial distribution for which the number of trials is fixed, the number of successes is fixed and the number of trials varies from experiment to experiment. The negative binomial random variable represents the number of trials needed to obtain exactly r successes.

Lab for Remote Sensing Hydrology and Spatial Modeling
Dept of Bioenvironmental Systems EngineeringNational Taiwan University
,1,;,2,1)1(1
1),;(
rrx rppr
xprxf rrx
X
prXE /][
rtrtX qepetm
prqXVar
)1/()()(
/][ 2

Lab for Remote Sensing Hydrology and Spatial Modeling
Dept of Bioenvironmental Systems EngineeringNational Taiwan University
Geometric distribution
Geometric distribution represents the probability of obtaining the first success in x independent and identical Bernoulli trials.
,3,2,1)1();( 1 x pppxf xX
pXE /1][
)1/()()(
/][ 2
ttX qepetm
pqXVar

Lab for Remote Sensing Hydrology and Spatial Modeling
Dept of Bioenvironmental Systems EngineeringNational Taiwan University
Hypergeometric distribution
where M is a positive integer, K is a nonnegative integer that is at most M, and n is a positive integer that is at most M.
otherwise
nx for
n
Mxn
KM
x
K
nKMxfX
0
,,1,0),,;(

Lab for Remote Sensing Hydrology and Spatial Modeling
Dept of Bioenvironmental Systems EngineeringNational Taiwan University
Let X denote the number of defective products in a sample of size n when sampling without replacement from a box containing M products, K of which are defective.
MnKXE /][
1][
M
nM
M
KM
M
KnXVar

Lab for Remote Sensing Hydrology and Spatial Modeling
Dept of Bioenvironmental Systems EngineeringNational Taiwan University
Poisson distribution The Poisson distribution provides a realistic model
for many random phenomena for which the number of occurrences within a given scope (time, length, area, volume) is of interest. For example, the number of fatal traffic accidents per day in Taipei, the number of meteorites that collide with a satellite during a single orbit, the number of defects per unit of some material, the number of flaws per unit length of some wire, etc.

Lab for Remote Sensing Hydrology and Spatial Modeling
Dept of Bioenvironmental Systems EngineeringNational Taiwan University
,2,1,0!
);(
x x
exf
x
X
)(!
xIx
e0,1,
x
0
][XE ][XVar
)1()( te
X etm

Lab for Remote Sensing Hydrology and Spatial Modeling
Dept of Bioenvironmental Systems EngineeringNational Taiwan University
Assume that we are observing the occurrence of certain happening in time, space, region or length. Also assume that there exists a positive quantity which satisfies the following properties:
1.

Lab for Remote Sensing Hydrology and Spatial Modeling
Dept of Bioenvironmental Systems EngineeringNational Taiwan University
2.
3.

Lab for Remote Sensing Hydrology and Spatial Modeling
Dept of Bioenvironmental Systems EngineeringNational Taiwan University

Lab for Remote Sensing Hydrology and Spatial Modeling
Dept of Bioenvironmental Systems EngineeringNational Taiwan University

Lab for Remote Sensing Hydrology and Spatial Modeling
Dept of Bioenvironmental Systems EngineeringNational Taiwan University

Lab for Remote Sensing Hydrology and Spatial Modeling
Dept of Bioenvironmental Systems EngineeringNational Taiwan University

Lab for Remote Sensing Hydrology and Spatial Modeling
Dept of Bioenvironmental Systems EngineeringNational Taiwan University

Lab for Remote Sensing Hydrology and Spatial Modeling
Dept of Bioenvironmental Systems EngineeringNational Taiwan University

Lab for Remote Sensing Hydrology and Spatial Modeling
Dept of Bioenvironmental Systems EngineeringNational Taiwan University
0
0.2
0.4
0.6
0.8
1
0 5 10 15 20 25 30 35 40 45 50
alpha=0.05 alpha=0.1 alpha=0.2 alpha=0.5
tetP )(0

Lab for Remote Sensing Hydrology and Spatial Modeling
Dept of Bioenvironmental Systems EngineeringNational Taiwan University
Comparison of Poisson and Binomial distributions

Lab for Remote Sensing Hydrology and Spatial Modeling
Dept of Bioenvironmental Systems EngineeringNational Taiwan University
Example Suppose that the average number of telephone calls
arriving at the switchboard of a company is 30 calls per hour.
(1) What is the probability that no calls will arrive in a 3-minute period?
(2) What is the probability that more than five calls will arrive in a 5-minute interval?
Assume that the number of calls arriving during any time period has a Poisson distribution.

Lab for Remote Sensing Hydrology and Spatial Modeling
Dept of Bioenvironmental Systems EngineeringNational Taiwan University
Assuming time is measured in minutes.

Lab for Remote Sensing Hydrology and Spatial Modeling
Dept of Bioenvironmental Systems EngineeringNational Taiwan University
Assuming time is measured in seconds.

Lab for Remote Sensing Hydrology and Spatial Modeling
Dept of Bioenvironmental Systems EngineeringNational Taiwan University
The first property provides the basis for transferring the mean rate of occurrence between different observation scales.
The “small time interval of length h” can be measured in different observation scales.
represents the time length measured in scale of .
is the mean rate of occurrence when observation scale is used.
i
i
hhi
i
i

Lab for Remote Sensing Hydrology and Spatial Modeling
Dept of Bioenvironmental Systems EngineeringNational Taiwan University
If the first property holds for various observation scales, say , then it implies the probability of exactly one happening in a small time interval h can be approximated by
The probability of more than one happenings in time interval h is negligible.
p
hhh
hhh
nn
n n
22
11
21 21
nhh ,,1

Lab for Remote Sensing Hydrology and Spatial Modeling
Dept of Bioenvironmental Systems EngineeringNational Taiwan University
probability that more than five calls will arrive in a 5-minute interval
=1 -
=0.042021
)5()5()5()5()5()5( 543210 PPPPPP

Lab for Remote Sensing Hydrology and Spatial Modeling
Dept of Bioenvironmental Systems EngineeringNational Taiwan University
Probability density functions of continuous random variables
Uniform or rectangular distribution Normal distribution (also known as
the Gaussian distribution) Exponential distribution (or negative
exponential distribution) Gamma distribution (Pearson Type
III) Chi-squared distribution Lognormal distribution

Lab for Remote Sensing Hydrology and Spatial Modeling
Dept of Bioenvironmental Systems EngineeringNational Taiwan University
Uniform or rectangular distribution
)()(
1),;( ],[ xI
abbaxf baX
2/)(][ baXE
tab
eetm
abXVaratbt
X )()(
12/)(][ 2

Lab for Remote Sensing Hydrology and Spatial Modeling
Dept of Bioenvironmental Systems EngineeringNational Taiwan University
PDF of U(a,b)

Lab for Remote Sensing Hydrology and Spatial Modeling
Dept of Bioenvironmental Systems EngineeringNational Taiwan University
Normal distribution (Gaussian distribution)
2
2
2
1
2
1),;(
x
X exf
][XE
2/
2
22
)(
][tt
X etm
XVar

Lab for Remote Sensing Hydrology and Spatial Modeling
Dept of Bioenvironmental Systems EngineeringNational Taiwan University

Lab for Remote Sensing Hydrology and Spatial Modeling
Dept of Bioenvironmental Systems EngineeringNational Taiwan University

Lab for Remote Sensing Hydrology and Spatial Modeling
Dept of Bioenvironmental Systems EngineeringNational Taiwan University

Lab for Remote Sensing Hydrology and Spatial Modeling
Dept of Bioenvironmental Systems EngineeringNational Taiwan University

Lab for Remote Sensing Hydrology and Spatial Modeling
Dept of Bioenvironmental Systems EngineeringNational Taiwan University
Commonly used values of normal distribution

Lab for Remote Sensing Hydrology and Spatial Modeling
Dept of Bioenvironmental Systems EngineeringNational Taiwan University
Exponential distribution (negative exponential distribution)
.0)();( ),0[ ,xIexf x
X
/1][ XE
t for t
tm
XVar
X )(
/1][ 2
Mean rate of occurrence in a Poisson process.

Lab for Remote Sensing Hydrology and Spatial Modeling
Dept of Bioenvironmental Systems EngineeringNational Taiwan University

Lab for Remote Sensing Hydrology and Spatial Modeling
Dept of Bioenvironmental Systems EngineeringNational Taiwan University

Lab for Remote Sensing Hydrology and Spatial Modeling
Dept of Bioenvironmental Systems EngineeringNational Taiwan University
Gamma distribution
.00)()(
1),;( ),0[
/1
, ,xIexxf xX
][XE
./1)1()(
][ 2
t for ttm
XVar
X
represents the mean rate of occurrence in a Poisson process. is equivalent to in the exponential density.
/1/1

Lab for Remote Sensing Hydrology and Spatial Modeling
Dept of Bioenvironmental Systems EngineeringNational Taiwan University
The exponential distribution is a special case of gamma distribution with
The sum of n independent identically distributed exponential random variables with parameter has a gamma distribution with parameters .
.1
/1 and n

Lab for Remote Sensing Hydrology and Spatial Modeling
Dept of Bioenvironmental Systems EngineeringNational Taiwan University
Pearson Type III distribution
, and are mean, standard deviation and skewness coefficient of X, respectively.
It reduces to Gamma distribution if = 0.
xex
xfx
X
,)(
1)(
1
22

Lab for Remote Sensing Hydrology and Spatial Modeling
Dept of Bioenvironmental Systems EngineeringNational Taiwan University
The Pearson Type III distribution is widely applied in stochastic hydrology.
Total rainfall depths of storm events can be characterized by the Pearson Type III distribution.

Lab for Remote Sensing Hydrology and Spatial Modeling
Dept of Bioenvironmental Systems EngineeringNational Taiwan University
Chi-squared distribution
The chi-squared distribution is a special case of gamma distribution with
.)(2
1
)2/(
1);( ),0[
2/1)2/(2/
1,2,k ,xIexk
kxf xkk
X
kXE ][.2/1)21()(
2][2/
t for ttm
kXVark
X
.22/ and k

Lab for Remote Sensing Hydrology and Spatial Modeling
Dept of Bioenvironmental Systems EngineeringNational Taiwan University

Lab for Remote Sensing Hydrology and Spatial Modeling
Dept of Bioenvironmental Systems EngineeringNational Taiwan University
Log-Normal DistributionLog-Pearson Type III Distribution
A random variable X is said to have a log-normal distribution if Log(X) is distributed with a normal density.
A random variable X is said to have a Log-Pearson type III distribution if Log(X) has a Pearson type III distribution.

Lab for Remote Sensing Hydrology and Spatial Modeling
Dept of Bioenvironmental Systems EngineeringNational Taiwan University
Lognormal distribution
)(2
1),;( ),0(
ln
2
12
2
xIex
xf
x
X
)2/( 2
][ eXE22 222][ eeXVar

Lab for Remote Sensing Hydrology and Spatial Modeling
Dept of Bioenvironmental Systems EngineeringNational Taiwan University

Lab for Remote Sensing Hydrology and Spatial Modeling
Dept of Bioenvironmental Systems EngineeringNational Taiwan University
Approximations between random variables
Approximation of binomial distribution by Poisson distribution
Approximation of binomial distribution by normal distribution
Approximation of Poisson distribution by normal distribution

Lab for Remote Sensing Hydrology and Spatial Modeling
Dept of Bioenvironmental Systems EngineeringNational Taiwan University
Approximation of binomial distribution by Poisson distribution
Lab for Remote Sensing Hydrology and Spatial Modeling
Dept of Bioenvironmental Systems EngineeringNational Taiwan University
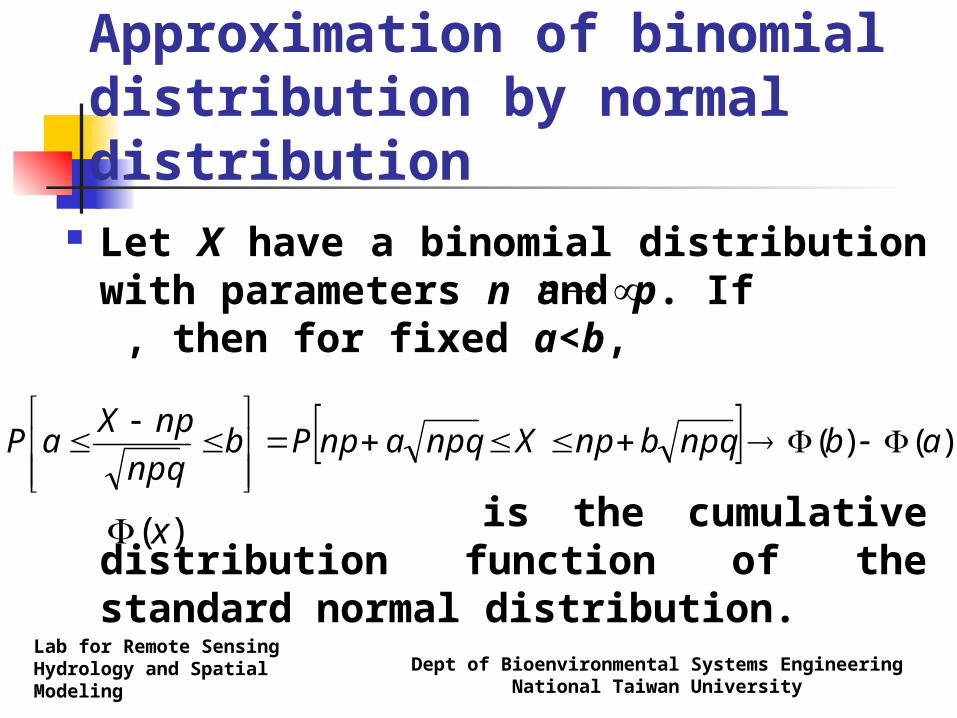
Approximation of binomial distribution by normal distribution
Let X have a binomial distribution with parameters n and p. If , then for fixed a<b,
is the cumulative distribution function of the standard normal distribution.
n
)()( abnpqbnpXnpqanpPbnpq
npXaP
)(x

Lab for Remote Sensing Hydrology and Spatial Modeling
Dept of Bioenvironmental Systems EngineeringNational Taiwan University
It is equivalent to say that as n approaches infinity X can be approximated by a normal distribution with mean np and variance npq.

Lab for Remote Sensing Hydrology and Spatial Modeling
Dept of Bioenvironmental Systems EngineeringNational Taiwan University
Approximation of Poisson distribution by normal distribution Let X have a Poisson distribution with pa
rameter . If , then for fixed a<b
)()( abbXaPbX
aP

Lab for Remote Sensing Hydrology and Spatial Modeling
Dept of Bioenvironmental Systems EngineeringNational Taiwan University
It is equivalent to say that as approaches infinity X can be approximated by a normal distribution with mean and variance .

Lab for Remote Sensing Hydrology and Spatial Modeling
Dept of Bioenvironmental Systems EngineeringNational Taiwan University

Lab for Remote Sensing Hydrology and Spatial Modeling
Dept of Bioenvironmental Systems EngineeringNational Taiwan University
Example
Suppose that two fair dice are tossed 600 times. Let X denote the number of times of a total of 7 occurs. What is the probability that ?
]11090[ XP

Lab for Remote Sensing Hydrology and Spatial Modeling
Dept of Bioenvironmental Systems EngineeringNational Taiwan University

Lab for Remote Sensing Hydrology and Spatial Modeling
Dept of Bioenvironmental Systems EngineeringNational Taiwan University
Transformation of random variables
[Theorem] Let X be a continuous RV with density fx. Let Y=g(X), where g is strictl
y monotonic and differentiable. The density for Y, denoted by fY, is given by
dy
ydgygfyf XY
)())(()(
11

Lab for Remote Sensing Hydrology and Spatial Modeling
Dept of Bioenvironmental Systems EngineeringNational Taiwan University
Proof: Assume that Y=g(X) is a strictly monotonic increasing function of X.

Lab for Remote Sensing Hydrology and Spatial Modeling
Dept of Bioenvironmental Systems EngineeringNational Taiwan University

Lab for Remote Sensing Hydrology and Spatial Modeling
Dept of Bioenvironmental Systems EngineeringNational Taiwan University
Using the moment ratio diagram (MRD) for goodness-of-fit (GOF) test
A two dimensional plot of coefficient of skewness ( ) vs coefficient of kurtosis( ) is called a moment ratio diagram.
An MRD uniquely defines the distribution types of individual random variables.
By examining scattering of sample moment ratios we can identify the distribution type for the random samples.
21
),( 21 bb

Lab for Remote Sensing Hydrology and Spatial Modeling
Dept of Bioenvironmental Systems EngineeringNational Taiwan University
Product (ordinary) moment ratio diagram

Lab for Remote Sensing Hydrology and Spatial Modeling
Dept of Bioenvironmental Systems EngineeringNational Taiwan University
Simulation Simulation Given a random variable X with CDF FX(x), ther
e are situations that we want to obtain a set of n random numbers (i.e., a random sample of size n) from FX(.) .
The advances in computer technology have made it possible to generate such random numbers using computers. The work of this nature is termed “simulation”, or more precisely “stochastic simulation”.

Lab for Remote Sensing Hydrology and Spatial Modeling
Dept of Bioenvironmental Systems EngineeringNational Taiwan University

Lab for Remote Sensing Hydrology and Spatial Modeling
Dept of Bioenvironmental Systems EngineeringNational Taiwan University
Pseudo-random number generation
Pseudorandom number generation (PRNG) is the technique of generating a sequence of numbers that appears to be a random sample of random variables uniformly distributed over (0,1).

Lab for Remote Sensing Hydrology and Spatial Modeling
Dept of Bioenvironmental Systems EngineeringNational Taiwan University
A commonly applied approach of PRNG starts with an initial seed and the following recursive algorithm (Ross, 2002)
modulo m where a and m are given positive
integers, and where the above means that is divided by m and the remainder is taken as the value of .
1 nn axx
1naxnx

Lab for Remote Sensing Hydrology and Spatial Modeling
Dept of Bioenvironmental Systems EngineeringNational Taiwan University
The quantity is then taken as an approximation to the value of a uniform (0,1) random variable.
Such algorithm will deterministically generate a sequence of values and repeat itself again and again. Consequently, the constants a and m should be chosen to satisfy the following criteria:
mxn /

Lab for Remote Sensing Hydrology and Spatial Modeling
Dept of Bioenvironmental Systems EngineeringNational Taiwan University
For any initial seed, the resultant sequence has the “appearance” of being a sequence of independent uniform (0,1) random variables.
For any initial seed, the number of random variables that can be generated before repetition begins is large.
The values can be computed efficiently on a digital computer.

Lab for Remote Sensing Hydrology and Spatial Modeling
Dept of Bioenvironmental Systems EngineeringNational Taiwan University
A guideline for selection of a and m is that m be chosen to be a large prime number that can be fitted to the computer word size. For a 32-bit word computer, m = and a = result in desired properties (Ross, 2002).
1231 57

Lab for Remote Sensing Hydrology and Spatial Modeling
Dept of Bioenvironmental Systems EngineeringNational Taiwan University
Simulating a continuous random variable
probability integral transformation

Lab for Remote Sensing Hydrology and Spatial Modeling
Dept of Bioenvironmental Systems EngineeringNational Taiwan University