Embed Size (px)
Citation preview

1
Deprivation in Ealing
A Report on the
English Indices of Deprivation 2015
March 2016

1
Authors
Rowena Steward, [email protected]
Rajiv Ahlawat, [email protected] Research and Performance Team, Ealing Council All maps in the report have been produced by Ealing GIS Team

2
Contents
Executive Summary .................................................................................................... 5
Key Findings for Ealing ......................................................................................................... 6
Uses of the Indices ............................................................................................................... 9
1. Overall Index of Multiple Deprivation 2015 ......................................................... 10
Summary measures of deprivation: Ealing and the WLA boroughs ..................................... 10
Deprivation in London at small area (LSOA) level ............................................................... 12
Deprivation in Ealing at small area (LSOA) level ................................................................. 13
Deprivation in Ealing at ward level ...................................................................................... 15
2. Income Deprivation ............................................................................................... 18
Ealing Overview .................................................................................................................. 18
Income deprivation at LSOA level ....................................................................................... 19
Income deprivation at ward level ......................................................................................... 22
3. Employment Deprivation ...................................................................................... 25
Ealing Overview .................................................................................................................. 25
Employment deprivation at LSOA level ............................................................................... 26
Employment deprivation at ward level ................................................................................. 29
4. Other Domains of Deprivation .............................................................................. 32
Education, Skills and Training Deprivation ................................................................... 32
Health Deprivation and Disability ................................................................................. 32
Crime ........................................................................................................................... 32
Barriers to Housing and Services ................................................................................. 33
Living Environment Deprivation ................................................................................... 33
Deprivation in other domains at LSOA level ........................................................................ 33
Deprivation in other domains at ward level.......................................................................... 40
5. Income Deprivation Affecting Children Index (IDACI) ........................................ 42
Ealing Overview .................................................................................................................. 42
Income deprivation affecting children at LSOA level ........................................................... 42
Income deprivation affecting Children at Ward Level .......................................................... 45
6. Income Deprivation Affecting Older People Index (IDAOPI) .............................. 48
Ealing Overview .................................................................................................................. 48
Income deprivation affecting Older People at LSOA Level .................................................. 48
Income deprivation affecting Older People at Ward Level ................................................... 50
Appendices ................................................................................................................ 53

3
APPENDIX A: Sources ....................................................................................................... 53
APPENDIX B: England Deciles (based on scores) of Ealing Wards, for: Overall Index of
Multiple Deprivation, 7 Domains, IDACI and IDAOPI, by Ward (2015) ................................ 55
APPENDIX C: London and National Rankings of London Boroughs for: Overall Index of
Multiple Deprivation, 7 Domains, IDACI and IDAOPI (2015) ............................................... 56
List of Figures
Figure 1: Percentage* of London LSOAs in National IMD Deciles (2015 and 2010**) ............ 12
Figure 2: Percentage* of Ealing LSOAs in National IMD Deciles (2015 and 2010**) .............. 13
Figure 3: Ranges of Overall IMD Ranks for LSOAs by Ealing Ward (2015) ............................ 15
Figure 4: Percentage of Ealing Wards in each IMD Decile for England (2015) ....................... 17
Figure 5: Ealing LSOAs in Each Decile of the Income Domain (2010 and 2015) .................... 20
Figure 6: Percentage of Ealing Wards in each Income Deprivation Decile for England (2015) 22
Figure 7: Ranges of Income Domain Ranks for LSOAs by Ealing Ward (2015) ...................... 23
Figure 8: % of Ealing LSOAs in deciles of employment deprivation, 2010 and 2015 .............. 27
Figure 9: Percentage of Ealing Wards in each Employment Deprivation Decile for England .. 29
Figure 10: Ranges of Employment Domain Ranks for LSOAs by Ealing Ward (2015) ............ 30
Figure 11: Percentage of Ealing LSOAs in England Deciles for Five Domains of Deprivation 34
Figure 12: Percentage of Ealing Wards in England Deciles for Five Domains of Deprivation . 40
Figure 13: Ealing LSOAs in Each Decile of IDACI (2010 and 2015) ....................................... 42
Figure 14: Percentage of Ealing Wards in each IDACI Decile for England (2015) .................. 45
Figure 15: Ranges of IDACI Ranks for LSOAs by Ealing Ward (2015) ................................... 46
Figure 16: Ealing LSOAs in Each Decile of IDAOPI (2010 and 2015) ..................................... 48
Figure 17: Percentage of Ealing Wards in each IDAOPI Decile for England (2015) ................ 50
Figure 18: Ranges of IDAOPI Ranks for LSOAs by Ealing Ward (2015) ................................. 51
List of Tables Table 1: Ealing’s rank of average rank on the various domains of deprivation .......................... 8
Table 2: The 3 Most and 3 Least Deprived Wards in Ealing (out of 23) based on Scores for
Overall Index of Multiple Deprivation, 7 Domains, IDACI and IDAOPI (2015) ........................... 8
Table 3: Ranks* of summary measures of deprivation, WLA boroughs; 2010 and 2015 ......... 11
Table 4: IMD 2015 ranks* of Ealing Wards within Ealing, London, and England ..................... 16
Table 5: Income Deprivation Scale and Ranks, WLA Boroughs (2010 and 2015) .................. 19
Table 6: Income Domain Rankings for Ealing Wards against all Ealing Wards, all London
Wards and all England Wards (2015) ..................................................................................... 24
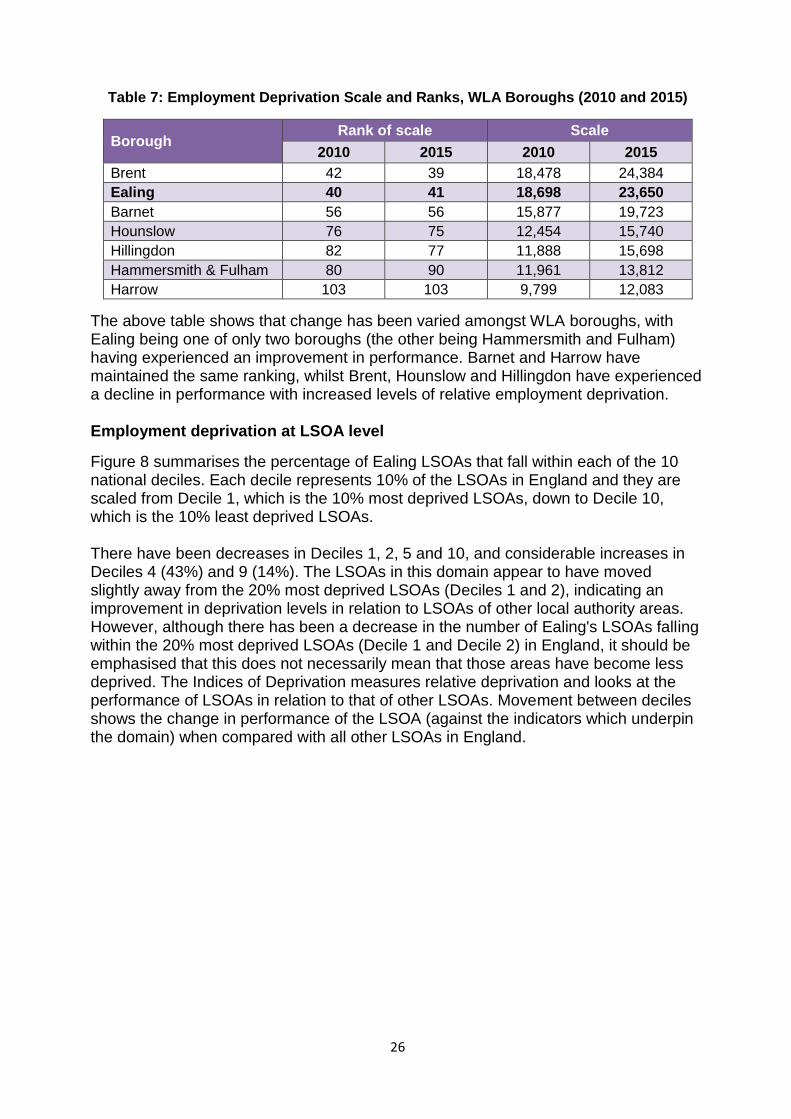
Table 7: Employment Deprivation Scale and Ranks, WLA Boroughs (2010 and 2015) .......... 26
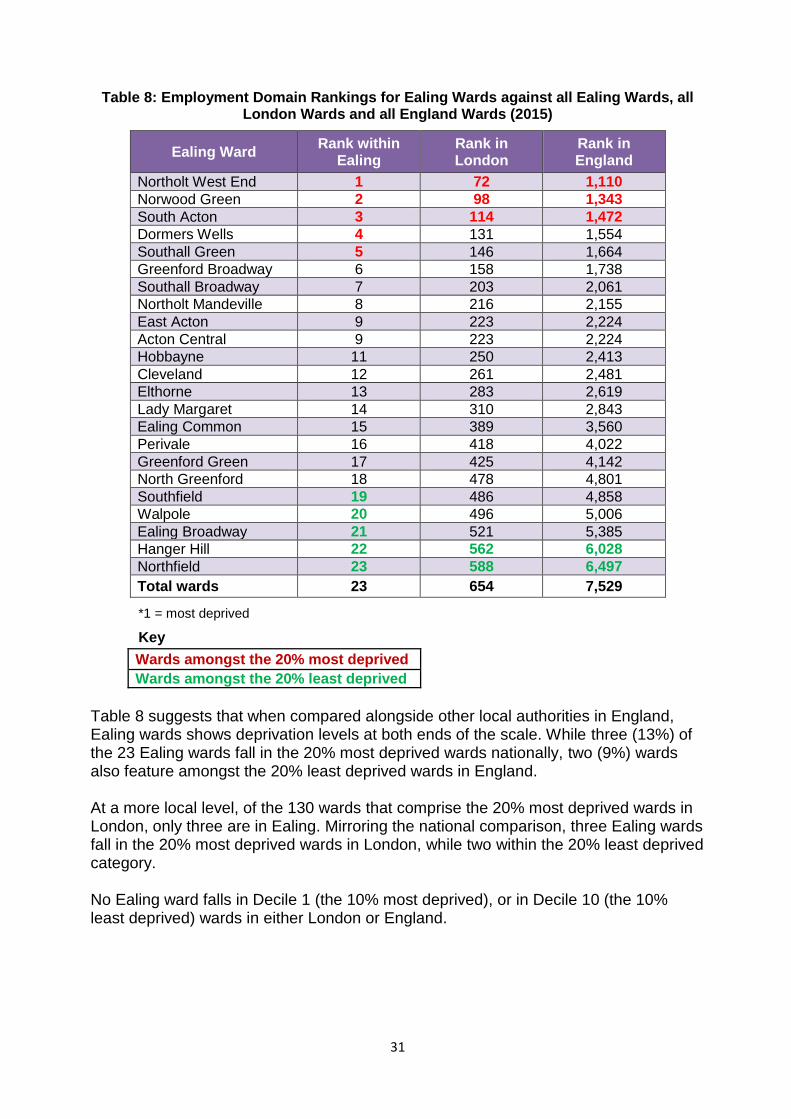
Table 8: Employment Domain Rankings for Ealing Wards against all Ealing Wards, all London
Wards and all England Wards (2015) ..................................................................................... 31
Table 9: Ranks* of Ealing Wards for 5 Domains ..................................................................... 41
Table 10: IDACI 2015 ranks* of Ealing Wards within Ealing, London and England ................. 47
Table 11: IDAOPI ranks 2015 of Ealing Wards within Ealing, London and England................ 52

4
List of Maps Map 1: Index of Multiple Deprivation, Ealing LSOAs, 2015 ..................................................... 14
Map 2: Index of Multiple Deprivation, Ealing LSOAs, 2010 ..................................................... 14
Map 3: Income Deprivation, Ealing LSOAs, 2015 ................................................................... 21
Map 4: Income Deprivation, Ealing LSOAs, 2010 ................................................................... 21
Map 5: Employment Deprivation, Ealing LSOAs, 2015 ........................................................... 28
Map 6: Employment Deprivation, Ealing LSOAs, 2010 ........................................................... 28
Map 7: Education, Skills and Training Deprivation, Ealing LSOAs, 2015 ................................ 35
Map 8: Education, Skills and Training Deprivation, Ealing LSOAs, 2010 ................................ 35
Map 9: Health Deprivation and Disability, Ealing LSOAs, 2015 .............................................. 36
Map 10: Health Deprivation and Disability, Ealing LSOAs, 2010 ............................................ 36
Map 11: Crime, Ealing LSOAs, 2015 ...................................................................................... 37
Map 12: Crime, Ealing LSOAs, 2010 ...................................................................................... 37
Map 13: Barriers to Housing and Services, Ealing LSOAs, 2015 ............................................ 38
Map 14: Barriers to Housing and Services, Ealing LSOAs, 2010 ............................................ 38
Map 15: Living Environment Deprivation, Ealing LSOAs, 2015 .............................................. 39
Map 16: Living Environment Deprivation, Ealing LSOAs, 2010 .............................................. 39
Map 17: Income Deprivation Affecting Children Index (IDACI), Ealing LSOAs, 2015 .............. 44
Map 18: Income Deprivation Affecting Children Index (IDACI), Ealing LSOAs, 2010 .............. 44
Map 19: Income Deprivation Affecting Older People Index (IDAOPI), Ealing LSOAs, 2015 .... 49
Map 20: Income Deprivation Affecting Older People Index (IDAOPI), Ealing LSOAs, 2010 .... 49

5
Executive Summary On 30 September 2015, the Department for Communities and Local Government (DCLG) released the 2015 English Indices of Deprivation. These indices provide a set of relative measures of deprivation for small areas (Lower-layer Super Output Areas, total 32,844) across England, based on seven domains of deprivation constructed from 37 different indicators. Ealing has a total of 196 LSOAs. The domains are combined using the following weights to produce the overall Index of Multiple Deprivation (IMD):
Income Deprivation (22.5%)
Employment Deprivation (22.5%)
Education, Skills and Training Deprivation (13.5%)
Health Deprivation and Disability (13.5%)
Crime (9.3%)
Barriers to Housing and Services (9.3%)
Living Environment Deprivation (9.3%) In addition to the Index of Multiple Deprivation and the seven domain indices, two supplementary indices are also available: the Income Deprivation Affecting Children Index (IDACI) and the Income Deprivation Affecting Older People Index (IDAOPI). Note that data used for most of these indicators is from 2012/13 (most recent available). This report considers in detail the overall Index of Multiple Deprivation, focussing on the two domains with the heaviest weighting: Income Deprivation and Employment Deprivation. It also covers the two supplementary indices, Income Deprivation Affecting Children Index (IDACI) and Income Deprivation Affecting Older People Index (IDAOPI), in order to gain a greater understanding of how Ealing compares in relation to other local authorities in England. The report also considers how the borough’s performance has changed in 2015 since the last Indices of Deprivation were released in 2010. It must however be noted that a change in the rank between 2010 and 2015 does not indicate an absolute change in deprivation; that is, it cannot be said with certainty that Ealing (or an area or ward in the borough) has become more or less deprived than in 2010. The Indices of Deprivation measure only relative deprivation and look at the performance of one area in relation to that of all other areas in England. Movement between ‘deciles’ of deprivation (areas within each group of 10% of all the areas) shows a change in performance of the area (against the indicators which underpin the domain) when compared with all other areas in the country.

6
Key Findings for Ealing
Overall Index of Multiple Deprivation
o Ealing is now ranked as the 87th most deprived local authority out of all 326 English local authorities in terms of average rank, as compared to being the 61st most deprived authority in 2010.
o The most deprived areas of Ealing fall within the towns of Northolt, Southall, and Acton.
o Norwood Green is the most deprived ward in terms of the overall Index of Multiple Deprivation, followed by Northolt West End, Southall Broadway, and Southall Green.
o Fewer Ealing LSOAs feature in the 20% most deprived in England in 2015 (18%), as compared with 2010 (20%).
o There has been an increase in the number of Ealing LSOAs in the 20% least deprived (9% in 2015, compared with 3% in 2010).
o Fewer Ealing LSOAs feature in the 10% most deprived in England in 2015 (2%), compared with 2010 (3%), but there has also been a slight decrease in the number of Ealing LSOAs in the 10% least deprived, with 6% in 2015, compared with 7% in 2010.
Income Deprivation
o Ealing is now the 28th most deprived borough in terms of the scale of income deprivation (i.e. the size of the population that is income-deprived), as compared to being 23rd in 2010.
o Northolt West End is the most deprived ward in terms of rank of income deprivation.
o 8% of Ealing LSOAs feature in the 10% most income deprived LSOAs in England in 2015, compared with 13% in 2010.
Employment Deprivation
o Ealing is now the 41st most deprived borough in terms of scale of employment deprivation (i.e. the size of the population that is employment-deprived), as compared to being 40th in 2010.
o Northolt West End is the most deprived ward in terms of the rank of income deprivation.
o 2% of Ealing LSOAs feature in the 10% most employment deprived LSOAs in England in 2015, compared with 3% in 2010.
Other Domains of Deprivation
o The domain where the highest proportion of Ealing LSOAs fall within the most deprived decile in England in 2015 is ‘Barriers to Services and Housing’. More than a quarter (27%) of Ealing LSOAs fall within the 10% most deprived LSOAs in England. Further, 69% LSOAs fall within the three most deprived deciles in
7
England. This is also the domain where Ealing’s rank is the worst (16th most deprived) amongst all the seven domains.
o At ward level, however, the domain of Crime has the highest proportion (30%) of Ealing wards amongst the 10% most deprived wards in England.
o On the other hand, no Ealing LSOA falls within the 10% most deprived LSOAs in England for the domain of ‘Education, Skills and Training’. This domain also has the highest proportion of Ealing LSOAs in the 10% least deprived LSOAs in England (19%).
Income Deprivation Affecting Children Index (IDACI)
o There are now fewer Ealing LSOAs amongst the 20% most deprived in England (25%), compared with 2010 (39%), although there has also been a slight decrease in the number of Ealing LSOAs in the 20% least deprived, with 6% in 2015 as compared to 7% in 2010.
o East Acton is the most deprived Ealing ward in terms of IDACI score.
o Nine (39%) Ealing wards are amongst the 20% most deprived wards in England in terms of IDACI.
Income Deprivation Affecting Older People (IDAOPI)
o The number of Ealing LSOAs featuring in the 20% most deprived in England has increased slightly from 29.7% in 2010 to 31.6% in 2015. However there has also been a slight increase in the number of Ealing LSOAs in the 20% least deprived, up from 2.6% in 2010 to 3.1% in 2015.
o South Acton and Southall Broadway are the joint most deprived wards in Ealing in terms of IDAOPI scores.
o Seven (30%) Ealing wards feature amongst the 10% most deprived wards in England in terms of IDAOPI. Further, all 23 Ealing wards fall within the five most deprived national deciles (i.e. 50% most deprived wards in England).

8
Ealing’s ranks on all the aspects of deprivation are shown in the table below.
Table 1: Ealing’s rank of average rank on the various domains of deprivation
Aspect of deprivation Ealing’s Rank
of Average Rank 2015*
Indices of Multiple Deprivation (overall) 87
Barriers to Services & Housing domain 16
Crime domain 20
Living Environment domain 47
Income domain 61
Employment domain 137
Health Deprivation & Disability domain 142
Education, Skills & Training domain 248
Income Deprivation Affecting Children Index (IDACI) 61
Income Deprivation Affecting Older People Index (IDAOPI) 28
*Where 1 is the most deprived local authority and 326 the least deprived
Table 1 shows the Ealing’s rank of ‘average rank’ for 2015 in the various domains of deprivation. Corresponding ranks for 2010 are not available as these were not produced by the DCLG in 2010; the only exception was the overall Index of Multiple Deprivation for which Ealing’s rank of average rank was 61.
Table 2: The 3 Most and 3 Least Deprived Wards in Ealing (out of 23) based on Scores for: Overall Index of Multiple Deprivation, 7 Domains, IDACI and IDAOPI (2015)
Ran
k Overall Index (IMD)
Income Employ’nt Education Health & Disability
Crime Barriers to Services & Housing
Living Env’t
IDACI IDAOPI
1 Norwood Green
Northolt West End
Norwood Green
Southall Broadway
Norwood Green
Southall Broadway
Norwood Green
East Acton East Acton South Acton
2 Northolt West End
Norwood Green
Northolt West End
Southall Green
Southall Broadway
Southall Green
Northolt West End
Ealing Broadway
Northolt West End
Southall Broadway
3 Southall Broadway
South Acton
South Acton
Dormers Wells
South Acton
Greenford Broadway
Southall Green
South Acton
South Acton
Dormers Wells
3 Southfield Ealing Broadway
Southfield Walpole Northfield Cleveland Walpole Greenford Green
Hanger Hill Ealing Broadway
2 Hanger Hill Hanger Hill Hanger Hill Northfield North Greenford
Ealing Broadway
Southfield North Greenford
Walpole Hanger Hill
1 Northfield Northfield Northfield Ealing Broadway
Hanger Hill Northfield Northfield Lady Margaret
Northfield Northfield
Data source: LG Inform, Local Government Association, December 2015

9
Uses of the Indices The Indices of Deprivation can be used for the following purposes:
Comparing small areas across England
Identifying the most deprived small areas
Exploring the domains (or types) of deprivation
Comparing larger areas e.g. local authorities
Looking at changes in relative deprivation between versions However, there are a number of things that the Indices cannot be used for:
Quantifying how deprived a small area is
Identifying deprived people
Saying how affluent a place is
Comparing with small areas in other UK countries (i.e. other than England)
Measuring real change in deprivation over time Further information on usage of the Indices of Deprivation is available in DCLG’s Guidance report.1
1 Department for Communities and Local Government, The English Indices of Deprivation 2015: Guidance (2015),
pp.1-5.

10
1. Overall Index of Multiple Deprivation 2015
The Department for Communities and Local Government defines the Index of Multiple Deprivation as a measure based on “combining together seven distinct domains of deprivation” and “can be used to rank every small area in England according to the deprivation experienced by the people living there”.2
Summary measures of deprivation: Ealing and the WLA boroughs The overall picture for deprivation in Ealing has improved since 2010, in relation to other local authority areas, with the borough’s ranking for overall IMD moving from 61 in 2010 to 87 in 2015, where 1 is the most deprived and 326 is the least deprived. Fewer Ealing LSOAs feature in the 20% most deprived in England in 2015 (18%), compared with 2010 (20%). There has been an increase in the number of Ealing LSOAs in the 20% least deprived, with 9% in 2015, compared with 3% in 2010. Ealing’s position on four summary measures of deprivation in 2010 and 2015 alongside the other six boroughs in the West London Alliance (WLA) is shown in Table 3. A brief explanation of what the summary measures mean is as below: Average Rank: The average rank measure summarises the average level of deprivation across the higher-level area, based on the ranks of the Lower-layer Super Output Areas in the area. Average Score: The average score measure summarises the average level of deprivation across the higher-level area, based on the scores of the Lower-layer Super Output Areas in the area. Extent: The extent measure is a summary of the proportion of the local population that live in areas classified as among the most deprived in the country. The extent measure is a more sophisticated version of the proportion of Lower-layer Super Output Areas in the most deprived 10 per cent nationally measure, and is designed to avoid the sharp cut-off seen in that measure, whereby areas ranked only a single place outside the most deprived 10 per cent are not counted at all. Local Concentration: The local concentration measure is a summary of how the most deprived Lower-layer Super Output Areas in the higher-level area compare to those in other higher-level areas across the country. This measures the average rank for the most deprived Lower-layer Super Output Areas in the higher-level area that contain exactly 10 per cent of the higher-level area population.
2 The seven distinct domains of deprivation are: Income Deprivation; Employment Deprivation; Education, Skills
and Training Deprivation; Health Deprivation and Disability; Crime; Barriers to Housing and Services; and Living Environment Deprivation. (Source: Department for Communities and Local Government, The English Indices of Deprivation 2015: Research Report (2015), p.7.)
11
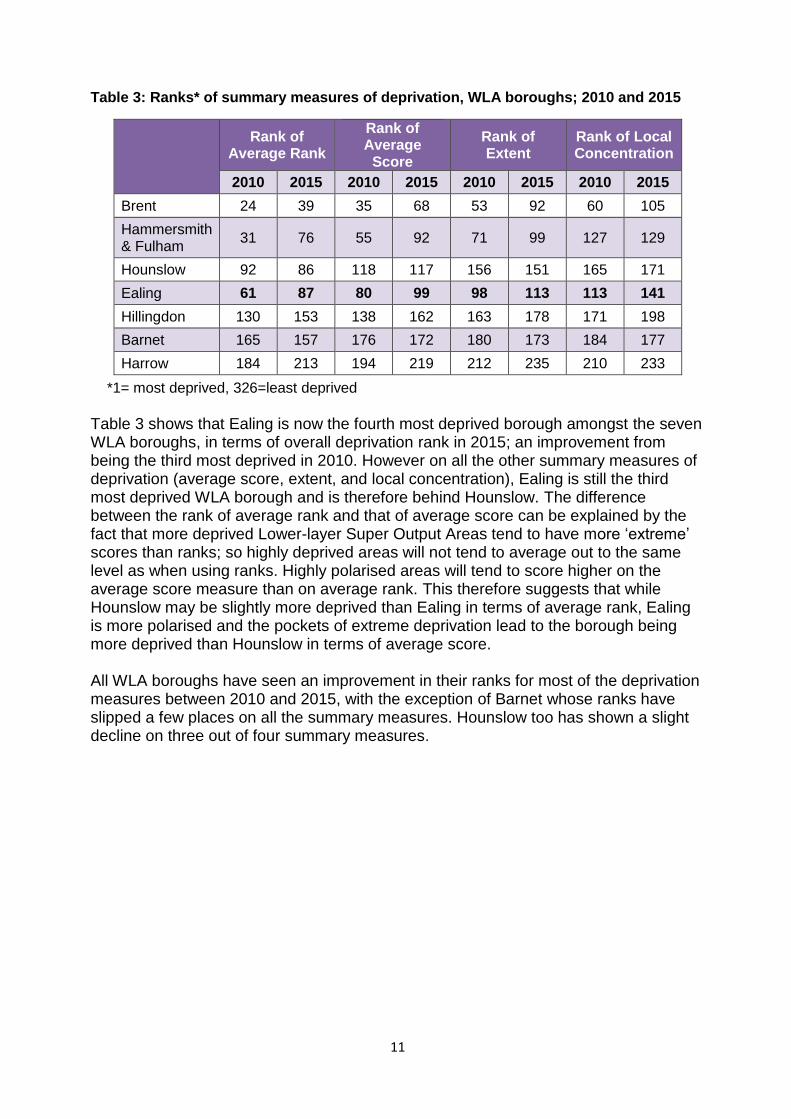
Table 3: Ranks* of summary measures of deprivation, WLA boroughs; 2010 and 2015
Rank of Average Rank
Rank of Average
Score
Rank of Extent
Rank of Local Concentration
2010 2015 2010 2015 2010 2015 2010 2015
Brent 24 39 35 68 53 92 60 105
Hammersmith & Fulham
31 76 55 92 71 99 127 129
Hounslow 92 86 118 117 156 151 165 171
Ealing 61 87 80 99 98 113 113 141
Hillingdon 130 153 138 162 163 178 171 198
Barnet 165 157 176 172 180 173 184 177
Harrow 184 213 194 219 212 235 210 233
*1= most deprived, 326=least deprived
Table 3 shows that Ealing is now the fourth most deprived borough amongst the seven WLA boroughs, in terms of overall deprivation rank in 2015; an improvement from being the third most deprived in 2010. However on all the other summary measures of deprivation (average score, extent, and local concentration), Ealing is still the third most deprived WLA borough and is therefore behind Hounslow. The difference between the rank of average rank and that of average score can be explained by the fact that more deprived Lower-layer Super Output Areas tend to have more ‘extreme’ scores than ranks; so highly deprived areas will not tend to average out to the same level as when using ranks. Highly polarised areas will tend to score higher on the average score measure than on average rank. This therefore suggests that while Hounslow may be slightly more deprived than Ealing in terms of average rank, Ealing is more polarised and the pockets of extreme deprivation lead to the borough being more deprived than Hounslow in terms of average score. All WLA boroughs have seen an improvement in their ranks for most of the deprivation measures between 2010 and 2015, with the exception of Barnet whose ranks have slipped a few places on all the summary measures. Hounslow too has shown a slight decline on three out of four summary measures.

12
Deprivation in London at small area (LSOA) level Figure 1 summarises the percentage of Lower layer Super Output Areas (LSOAs) in London that fall within each of the ten national deciles of deprivation. Each decile represents 10% of the LSOAs in England and they are scaled from Decile 1, which is the 10% most deprived LSOAs, to Decile 10, which is the 10% least deprived LSOAs nationally.
Figure 1: Percentage* of London LSOAs in National IMD Deciles (2015 and 2010**)
* Percentages may not sum to 100 due to rounding. **In 2010 there were 4,765 LSOAs in London; in 2015, there were 4,835 as several LSOAs were split Figure 1 shows that the percentage of London LSOAs in Deciles 1 to 3 (the 30% most deprived nationally) decreased from 43% in 2010 to 39% in 2015, while the percentage of LSOAs in Deciles 5 through 10 (those at the ‘least deprived’ end of the scale), increased during the period; suggesting that levels of overall relative deprivation in London have decreased. However, it is important to note that it cannot be concluded that actual levels of deprivation have improved, since the overall change in London’s relative position might be due to other local authorities experiencing proportionally greater levels of deprivation change.
8%
6%
18%
17%
17%
16%
13%
13%
10%
11%
9%
10%
8%
9%
7%
8%
6%
7%
3%
4%
Decile 1 Decile 2 Decile 3 Decile 4 Decile 5
Decile 6 Decile 7 Decile 8 Decile 9 Decile 10
Most Deprived Least Deprived
2015
2010

13
Deprivation in Ealing at small area (LSOA) level
Figure 2 summarises the percentage of Lower layer Super Output Areas (LSOAs) in Ealing that fall within each of the ten national deciles of deprivation. As with Figure 1, each decile represents 10% of the LSOAs in England; scaled in the same way, from Decile 1, the 10% most deprived LSOAs; to Decile 10, the 10% least deprived LSOAs nationally.
Figure 2: Percentage* of Ealing LSOAs in National IMD Deciles (2015 and 2010**)
* Percentages may not sum to 100 due to rounding. **In 2010 there were 195 LSOAs in Ealing; in 2015, there were 196 as one LSOA was split
Ealing LSOAs that fall within the 10% most deprived LSOAs (Decile 1) in England showed a decrease from 7% in 2010 to 4% in 2015. However it should be noted that this does not necessarily mean that those areas have become less deprived. IMD measures relative deprivation and looks at the performance of LSOAs in relation to that of other LSOAs in England. Movement between deciles shows the change in performance of the LSOA (against the indicators which underpin the domain) when compared with all other LSOAs in the country. At the other end of the scale, the increasing proportions of LSOAs featuring in deciles 7-9 signify an overall improvement in Ealing’s deprivation levels relative to those of other local authorities. While 13% of Ealing LSOAs featured in Deciles 7-9 in 2010, this proportion rose to 21% in 2015. No Ealing LSOA was within Decile 10 i.e. the 10% least deprived LSOAs in England, either in 2010 or in 2015. A geographical distribution of the index of deprivation in Ealing based on LSOA ranks, for both 2010 as well as 2015, is shown in Maps 1 and 2.
7%
4%
13%
14%
17%
18%
17%
15%
16%
13%
17%
16%
4%
8%
6%
4%
3%
9%
0%
0%
Decile 1 Decile 2 Decile 3 Decile 4 Decile 5
Decile 6 Decile 7 Decile 8 Decile 9 Decile 10
2010
2015
Most deprived Least deprived

14
Map 1: Index of Multiple Deprivation, Ealing LSOAs, 2015
Map 2: Index of Multiple Deprivation, Ealing LSOAs, 2010

15
Maps 1 and 2 both show that the most deprived areas of Ealing fall mainly within the north-western and the eastern edges of the borough, in the areas of Northolt, Southall, and Acton. An overall conclusion that can be drawn from the two maps is that overall the 2015 map has grown lighter in colour, with many LSOAs no longer as dark as they were in 2010. This indicates that many Ealing LSOAs have become relatively less deprived when compared with other local authority areas. Deprivation in Ealing at ward level
Figure 3 below illustrates the range within which the ranks of the most and least deprived LSOA in 2015 fall, in each ward of Ealing, where 1 is the most deprived and 10 the least deprived. Some wards have a relatively compact range of ranks; for example, Southall Green ranges from 5,817 to 9,174 (3,357) with all its LSOAs placed in either the second or third most deprived deciles and Southall Broadway which ranges from 2,970 to 9,327 (6,357) with all its LSOAs in the three most deprived deciles. On the other hand, most other wards have a broader range of ranks, with Cleveland showing the widest range from 494 (in Decile 1) through to 27,964 (in Decile 9), a range of 27,470. This means the ward has some of the most deprived LSOAs in Ealing along with some of the least deprived.
Figure 3: Ranges of Overall IMD Ranks for LSOAs by Ealing Ward (2015)
Dec
iles
Decile 1 (most deprived 10%)
Decile 10 (least deprived 10%)
9
8
7
6
5
4
3
2

16
Table 4 ranks the overall index score for each Ealing Ward, out of all Ealing Wards (total: 23); all London Wards (total: 654); and all England Wards3 (total: 7,529). The colour coding indicates whether the ward is in the most deprived 20% or least deprived 20% of wards for that geographical breakdown.
Table 4: IMD 2015 ranks* of Ealing Wards within Ealing, London, and England
Ealing Ward Rank in Ealing
Rank in London
Rank in England
Norwood Green 1 108 846
Northolt West End 2 113 891
Southall Broadway 3 116 901
Southall Green 4 132 979
Dormers Wells 5 139 1004
South Acton 6 144 1027
Greenford Broadway 7 209 1399
East Acton 8 218 1442
Northolt Mandeville 9 244 1642
Acton Central 10 252 1688
Elthorne 11 297 2026
Hobbayne 12 317 2152
Cleveland 13 320 2180
Lady Margaret 14 359 2538
Ealing Common 15 381 2769
Greenford Green 16 410 3101
Perivale 17 411 3108
North Greenford 18 446 3598
Ealing Broadway 19 457 3718
Walpole 20 480 4171
Southfield 21 498 4411
Hanger Hill 22 502 4467
Northfield 23 575 5792
Total wards 23 654 7,529
*1 = most deprived
Key
Wards amongst the 20% most deprived
Wards amongst the 20% least deprived
Table 4 suggests that when compared alongside other London boroughs, Ealing fares well in terms of overall level of relative deprivation. Of the 130 wards that comprise the 20% most deprived wards in London, only three are in Ealing. However, of the 1,505 wards that comprise the most deprived 20% of wards in England, eight are in Ealing. This means that 35% of Ealing wards are amongst the 20% most deprived wards in England.
3 IMD data was not released at ward level by the Department for Communities and Local Government; the ward
level analysis presented in this section has been produced by the Local Government Association (LGA). LSOAs do not always fit neatly within ward boundaries, therefore the LGA has employed a 'best fit' method in order to produce this data and assign LSOAs to a single ward.

17
None of Ealing’s wards feature amongst the 10% most deprived wards in London or in England. At the other end of the scale, there are no Ealing wards featuring in the 20% least deprived wards in England. This would suggest that when compared against the rest of England, Ealing wards do not fare quite so well, with only four wards falling in the 50% least deprived wards in England. This also highlights the apparent difference between Ealing’s performance at LSOA level and ward level. As seen in Figure 3, some wards have LSOAs that fall into a wide range of deciles, meaning that despite having areas with relatively low levels of deprivation, a ward’s overall level of deprivation might be high if it also contains several LSOAs which are at the more deprived end of the scale. Figure 4 below summarises the percentage of Ealing wards which fall into the 10 deciles for deprivation in England.
Figure 4: Percentage of Ealing Wards in each IMD Decile for England (2015)
* Percentages may not sum to 100 due to rounding.
19 wards in the borough (83%) are in the 5 most deprived deciles i.e. half of the most deprived wards in England. The remaining 4 Ealing wards (17%) are in either Decile 6 or Decile 8. This suggests that when wards are looked at in the England context, Ealing has comparatively high levels of deprivation.
Decile 2, 35%
Decile 3, 22%
Decile 4, 9%
Decile 5, 17%
Decile 6, 13% Dec 8,
4%
Most Deprived Least Deprived

18
2. Income Deprivation The Income Deprivation domain measures the proportion of the population in an area experiencing deprivation relating to low income. The definition of low income used includes both those people that are out-of-work, and those that are in work but who have low earnings (and who satisfy the respective means tests).” A count of income deprived individuals per Lower-layer Super Output Area (LSOA) is calculated by summing six non-overlapping indicators.4
Ealing Overview
The overall picture for Income Deprivation in Ealing has improved since 2010, in relation to other local authority areas, with the borough’s rank of the income deprivation scale having improved from 23 in 2010 to 28 in 2015 (where 1 is the most deprived and 326 is the least deprived). The scale of income deprivation shows the number of people who are experiencing income deprivation in the borough. Therefore, if two local authorities have the same percentage of income deprived people, the larger local authority will be ranked as more deprived on the income scale because more people are experiencing the deprivation. Fewer Ealing LSOAs feature in the 10% most deprived in England in 2015 (8%), compared with 2010 (13%). There has also been a slight decrease in the number of Ealing LSOAs in the 10% least deprived, with 2% in 2015, compared with 3% in 2010. However, analysis at ward level (based on data compiled from the Indices of Deprivation 2015 by the Local Government Association), indicates that Ealing still has high levels of relative income deprivation, with three out of 23 wards featuring in the 10% most deprived wards in England. There are no Ealing wards featuring in the 10% most deprived in London, but three do feature in the 20% most deprived. Similarly, there are 10 Ealing wards in the 20% most deprived nationally. Table 5 shows the Income Domain scales and ranks of scale for the seven West London Alliance (WLA) boroughs from the Indices of 2010 and the Indices of 2015. It is presented in order of 2015 rank, where the lowest number is the most income deprived.
4 Six non-overlapping indicators underpinning the Income Domain:
i. Adults and children in Income Support families; ii. Adults and children in income-based Jobseeker’s Allowance families; iii. Adults and children in income-based Employment and Support Allowance families; iv. Adults and children in Pension Credit (Guarantee) families; v. Adults and children in Working Tax Credit and Child Tax Credit families not already counted, that is those
who are not in receipt of Income Support, income-based Jobseeker’s Allowance, income-based Employment and Support Allowance or Pension Credit (Guarantee) and whose equivalised income (excluding housing benefit) is below 60 per cent of the median before housing costs;
vi. Asylum seekers in England in receipt of subsistence support, accommodation support, or both. (Source: Department for Communities and Local Government, The English Indices of Deprivation 2015: Research Report (2015), pp.14-15.)
19
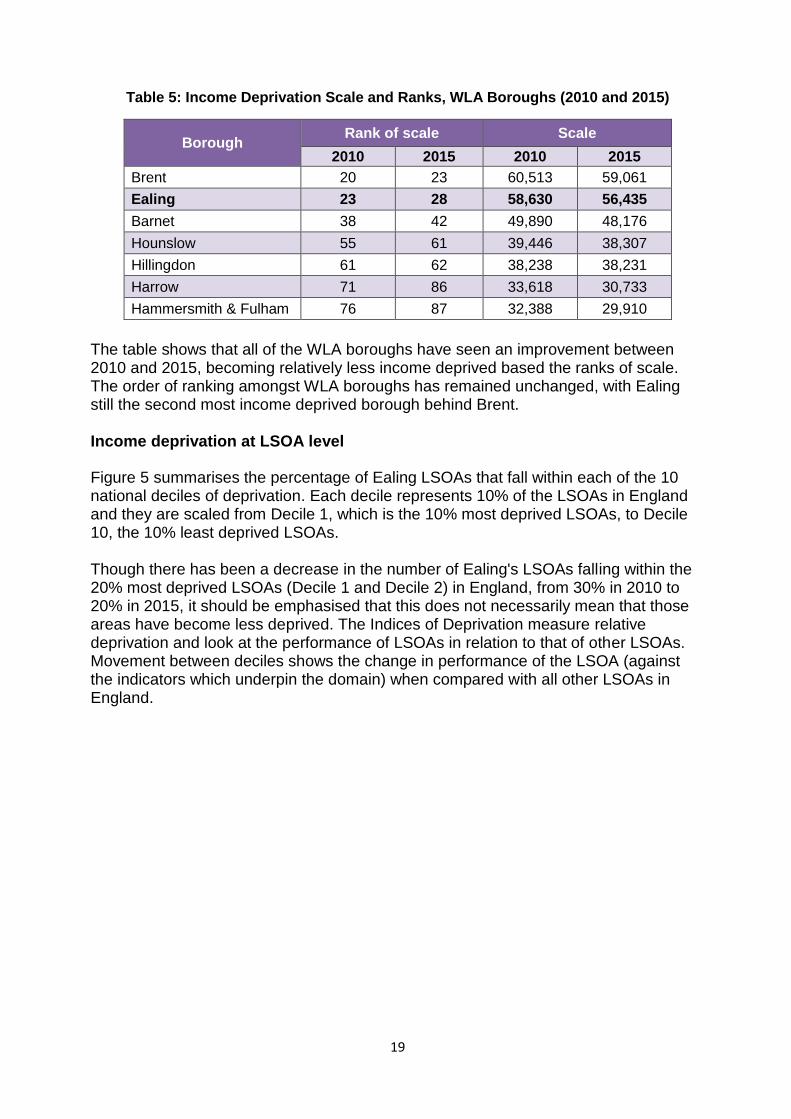
Table 5: Income Deprivation Scale and Ranks, WLA Boroughs (2010 and 2015)
Borough Rank of scale Scale
2010 2015 2010 2015
Brent 20 23 60,513 59,061
Ealing 23 28 58,630 56,435
Barnet 38 42 49,890 48,176
Hounslow 55 61 39,446 38,307
Hillingdon 61 62 38,238 38,231
Harrow 71 86 33,618 30,733
Hammersmith & Fulham 76 87 32,388 29,910
The table shows that all of the WLA boroughs have seen an improvement between 2010 and 2015, becoming relatively less income deprived based the ranks of scale. The order of ranking amongst WLA boroughs has remained unchanged, with Ealing still the second most income deprived borough behind Brent. Income deprivation at LSOA level
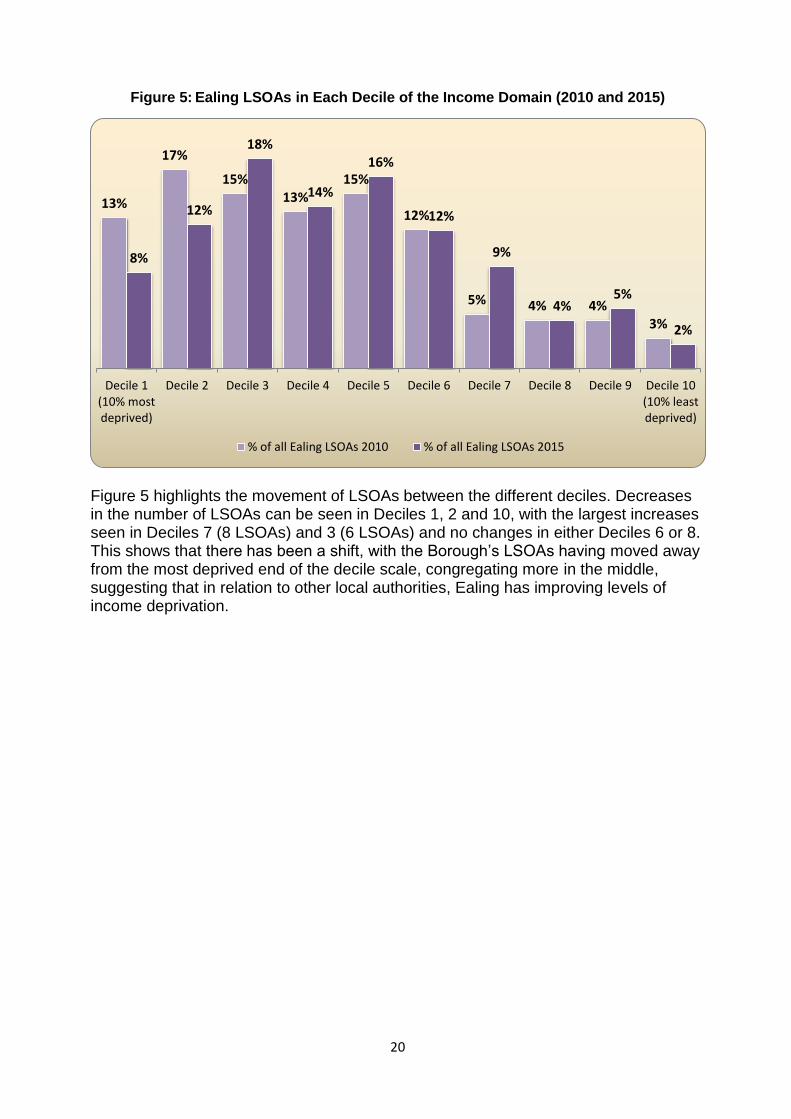
Figure 5 summarises the percentage of Ealing LSOAs that fall within each of the 10 national deciles of deprivation. Each decile represents 10% of the LSOAs in England and they are scaled from Decile 1, which is the 10% most deprived LSOAs, to Decile 10, the 10% least deprived LSOAs. Though there has been a decrease in the number of Ealing's LSOAs falling within the 20% most deprived LSOAs (Decile 1 and Decile 2) in England, from 30% in 2010 to 20% in 2015, it should be emphasised that this does not necessarily mean that those areas have become less deprived. The Indices of Deprivation measure relative deprivation and look at the performance of LSOAs in relation to that of other LSOAs. Movement between deciles shows the change in performance of the LSOA (against the indicators which underpin the domain) when compared with all other LSOAs in England.
20
Figure 5: Ealing LSOAs in Each Decile of the Income Domain (2010 and 2015)
Figure 5 highlights the movement of LSOAs between the different deciles. Decreases in the number of LSOAs can be seen in Deciles 1, 2 and 10, with the largest increases seen in Deciles 7 (8 LSOAs) and 3 (6 LSOAs) and no changes in either Deciles 6 or 8. This shows that there has been a shift, with the Borough’s LSOAs having moved away from the most deprived end of the decile scale, congregating more in the middle, suggesting that in relation to other local authorities, Ealing has improving levels of income deprivation.
13%
17%
15% 13%
15%
12%
5% 4% 4% 3%
8%
12%
18%
14%
16%
12%
9%
4% 5%
2%
Decile 1(10% mostdeprived)
Decile 2 Decile 3 Decile 4 Decile 5 Decile 6 Decile 7 Decile 8 Decile 9 Decile 10(10% leastdeprived)
% of all Ealing LSOAs 2010 % of all Ealing LSOAs 2015

21
Map 3: Income Deprivation, Ealing LSOAs, 2015
Map 4: Income Deprivation, Ealing LSOAs, 2010

22
The 2015 income deprivation map (Map 3) shows that the least deprived areas of Ealing lie in the centre of the borough, in areas such as Ealing Broadway, Walpole and Northfields, with levels of relative deprivation increasing in both easterly and westerly directions from the centre. Areas with some of the highest levels of relative income deprivation can be found in Dormers Wells, Greenford Broadway and South Acton. As with the overall Index of Multiple Deprivation, relative levels of income deprivation in Ealing have decreased since 2010, with noticeable changes in areas such as North Greenford and Norwood Green. Income deprivation at ward level
Figure 6 below summarises the percentage of Ealing wards which fall into the 10 deciles for income deprivation in England. 19 wards in the borough (82.6%) are in the 5 most deprived deciles, the 50% most deprived wards in England. The remaining 4 Ealing wards (17.4%) are in either Decile 6 or Decile 8. This shows that Ealing has comparatively high levels of income deprivation when the wards are looked at in the England context.
Figure 6: Percentage of Ealing Wards in each Income Deprivation Decile for England (2015)
Data source: LG Inform, Local Government Association, November 2015. * Percentages may not sum to 100 due to rounding.
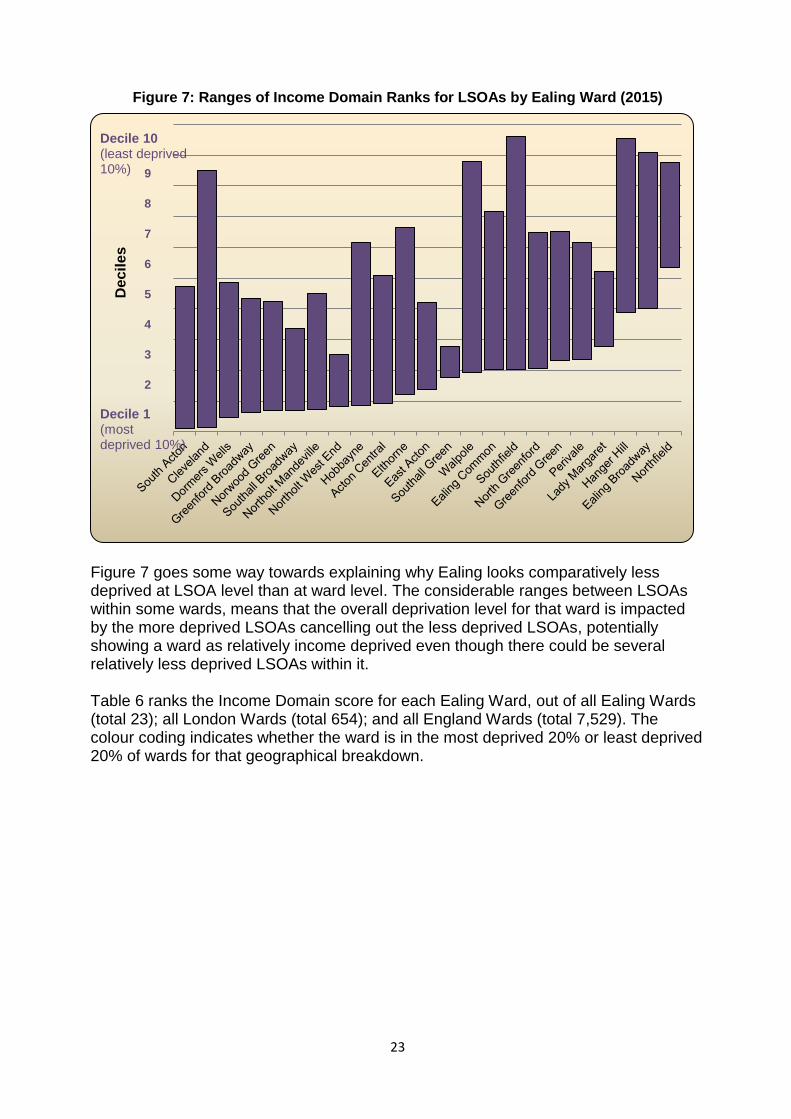
Figure 7 illustrates the ranges between the LSOA Income ranks for each ward in Ealing, where 1 is the most deprived. Some wards have a relatively compact range of Income ranks; for example, Southall Green ranges from 5,817 to 9,174 (3,357) with all its LSOAs placed in either the second or third most deprived deciles and Northolt West End which ranges from 2,725 to 8,265 (5,540) with all its LSOAs in the three most deprived deciles. Other wards have a broader range of Income ranks, such as Cleveland ranging from 494 (in Decile 1) through to 27,964 (in Decile 9), a range of 27,470.
Decile 1, 13%
Decile 2, 30%
Decile 3, 17%
Decile 4, 13%
Decile 5, 9%
Decile 6, 13%
Dec 8, 4%
Most Deprived Least Deprived
23
Figure 7: Ranges of Income Domain Ranks for LSOAs by Ealing Ward (2015)
Figure 7 goes some way towards explaining why Ealing looks comparatively less deprived at LSOA level than at ward level. The considerable ranges between LSOAs within some wards, means that the overall deprivation level for that ward is impacted by the more deprived LSOAs cancelling out the less deprived LSOAs, potentially showing a ward as relatively income deprived even though there could be several relatively less deprived LSOAs within it. Table 6 ranks the Income Domain score for each Ealing Ward, out of all Ealing Wards (total 23); all London Wards (total 654); and all England Wards (total 7,529). The colour coding indicates whether the ward is in the most deprived 20% or least deprived 20% of wards for that geographical breakdown.
Decil
es
Decile 1 (most deprived 10%)
Decile 10 (least deprived 10%) 9
8
7
6
5
4
3
2

24
Table 6: Income Domain Rankings for Ealing Wards against all Ealing Wards, all London Wards and all England Wards (2015)
Ealing Ward Rank within
Ealing Rank in London
Rank in England
Northolt West End 1 73 578
Norwood Green 2 101 705
South Acton 2 101 705
Dormers Wells 4 137 928
Southall Green 5 166 1,051
Greenford Broadway 6 172 1,071
Southall Broadway 7 184 1,129
Northolt Mandeville 8 189 1,162
East Acton 9 201 1,195
Acton Central 10 241 1,453
Hobbayne 11 264 1,593
Cleveland 12 269 1,626
Elthorne 13 280 1,714
Lady Margaret 14 343 2,210
Ealing Common 15 415 2,777
Perivale 16 416 2,806
Greenford Green 17 424 2,939
North Greenford 18 438 3,119
Southfield 19 479 3,841
Walpole 20 481 3,877
Ealing Broadway 21 496 4,064
Hanger Hill 22 508 4,265
Northfield 23 584 5,684
Total wards 23 654 7,529
*1 = most deprived Data source: LG Inform, Local Government Association, November 2015
Key
Wards amongst the 20% most deprived
Wards amongst the 20% least deprived
Table 6 highlights that Ealing does have some comparatively high levels of income deprivation, with 10 out of 23 wards (43.5%) falling in the 20% most deprived wards in England. There are no Ealing wards in the 20% least deprived wards in England and only one ward in the 40% least deprived wards nationally. As such, Ealing wards tend to be clustered nearer the more deprived end of relative deprivation scale in England. Three Ealing wards fall into the 10% most deprived wards nationally. At a London level, the table shows that Ealing’s levels of relative deprivation compare slightly better, with only three wards falling in the 20% most deprived wards in London. The spread of Ealing wards across the London deciles is wider than across the national deciles, with a greater number of wards falling in the least deprived half of the table, one of which features in the 20% least deprived London wards.

25
3. Employment Deprivation The Employment Deprivation domain measures the proportion of the working age population in an area involuntarily excluded from the labour market. This includes people who would like to work but are unable to do so due to unemployment, sickness or disability, or caring responsibilities. A count of employment deprived individuals per Lower-layer Super Output Area (LSOA) is calculated by summing five non-overlapping indicators.5 Ealing Overview
The overall picture for Employment Deprivation in Ealing has not changed a large amount since 2010, in relation to other local authority areas. Ealing’s ranking of employment scale has improved slightly, from 40 in 2010 to 41 in 2015, where 1 is the most deprived and 326 is the least deprived. Similar to income deprivation, the scale of employment deprivation shows the number of people who are experiencing employment deprivation in the borough. Therefore, if two local authorities have the same percentage of employment deprived people, the larger local authority will be ranked as more deprived on the employment scale because more people are experiencing the deprivation. Fewer Ealing LSOAs feature in the 10% most deprived in England in 2015 (2%), compared with 2010 (3%). Yet there has also been a slight decrease in the number of Ealing LSOAs in the 10% least deprived, with 6% in 2015, compared with 7% in 2010. Analysis at ward level indicates that Ealing has comparatively high levels of employment deprivation, with almost two thirds (65%) of wards placed in the 50% most deprived wards in England. Though there are no Ealing wards in Decile 1, the 10% most deprived wards in England, 13% fall into the 20% most deprived wards. No Ealing wards feature in the 10% least deprived national wards but 9% fall in the 20% least deprived. Table 7 shows the Employment Domain scales and ranks of scale for the seven West London Alliance (WLA) boroughs, from the Indices of 2010 and the Indices of 2015. It is presented in order of 2015 rank, where the lowest number is the most income deprived.
5 Five non-overlapping indicators underpinning the Income Domain:
i. Claimants of Jobseeker’s Allowance (both contribution-based and income-based), women aged 18 to 59 and men aged 18 to 64;
ii. Claimants of Employment and Support Allowance, women aged 18 to 59 and men aged 18 to 64;
iii. Claimants of Incapacity Benefit, women aged 18 to 59 and men aged 18 to 64;
iv. Claimants of Severe Disablement Allowance, women aged 18 to 59 and men aged 18 to 64;
v. Claimants of Carer’s Allowance, women aged 18 to 59 and men aged 18 to 64. (Source: Department for Communities and Local Government, The English Indices of Deprivation 2015: Research Report (2015), p.15).
26
Table 7: Employment Deprivation Scale and Ranks, WLA Boroughs (2010 and 2015)
Borough Rank of scale Scale
2010 2015 2010 2015
Brent 42 39 18,478 24,384
Ealing 40 41 18,698 23,650
Barnet 56 56 15,877 19,723
Hounslow 76 75 12,454 15,740
Hillingdon 82 77 11,888 15,698
Hammersmith & Fulham 80 90 11,961 13,812
Harrow 103 103 9,799 12,083
The above table shows that change has been varied amongst WLA boroughs, with Ealing being one of only two boroughs (the other being Hammersmith and Fulham) having experienced an improvement in performance. Barnet and Harrow have maintained the same ranking, whilst Brent, Hounslow and Hillingdon have experienced a decline in performance with increased levels of relative employment deprivation. Employment deprivation at LSOA level
Figure 8 summarises the percentage of Ealing LSOAs that fall within each of the 10 national deciles. Each decile represents 10% of the LSOAs in England and they are scaled from Decile 1, which is the 10% most deprived LSOAs, down to Decile 10, which is the 10% least deprived LSOAs. There have been decreases in Deciles 1, 2, 5 and 10, and considerable increases in Deciles 4 (43%) and 9 (14%). The LSOAs in this domain appear to have moved slightly away from the 20% most deprived LSOAs (Deciles 1 and 2), indicating an improvement in deprivation levels in relation to LSOAs of other local authority areas. However, although there has been a decrease in the number of Ealing's LSOAs falling within the 20% most deprived LSOAs (Decile 1 and Decile 2) in England, it should be emphasised that this does not necessarily mean that those areas have become less deprived. The Indices of Deprivation measures relative deprivation and looks at the performance of LSOAs in relation to that of other LSOAs. Movement between deciles shows the change in performance of the LSOA (against the indicators which underpin the domain) when compared with all other LSOAs in England.

27
Figure 8: % of Ealing LSOAs in deciles of employment deprivation, 2010 and 2015
3%
9%
13% 12%
13%
16%
11% 10%
7% 7%
2%
9%
14%
17%
9%
15%
11% 10%
8%
6%
Decile 1(10% mostdeprived)
Decile 2 Decile 3 Decile 4 Decile 5 Decile 6 Decile 7 Decile 8 Decile 9 Decile 10(10% leastdeprived)
% of all Ealing LSOAs 2010 % of all Ealing LSOAs 2015

28
Map 5: Employment Deprivation, Ealing LSOAs, 2015
Map 6: Employment Deprivation, Ealing LSOAs, 2010
29
Maps 5 and 6 show that overall there has not been a great deal of change in the relative levels of employment deprivation within Ealing, between 2010 and 2015. There are some areas which have become more deprived, highlighted by the darkening of the shading, such as in Northolt West End and East Acton; whilst others appear to have become relatively less deprived, such as Norwood Green and Dormers Wells. Employment deprivation at ward level
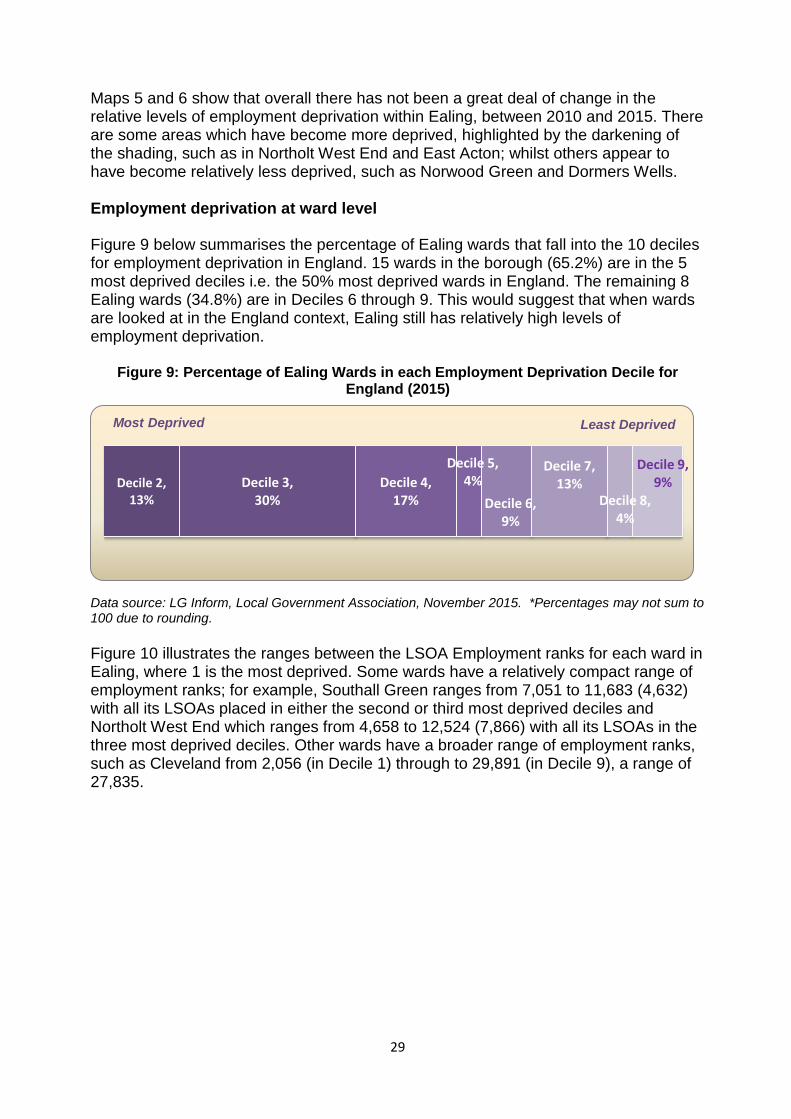
Figure 9 below summarises the percentage of Ealing wards that fall into the 10 deciles for employment deprivation in England. 15 wards in the borough (65.2%) are in the 5 most deprived deciles i.e. the 50% most deprived wards in England. The remaining 8 Ealing wards (34.8%) are in Deciles 6 through 9. This would suggest that when wards are looked at in the England context, Ealing still has relatively high levels of employment deprivation.
Figure 9: Percentage of Ealing Wards in each Employment Deprivation Decile for England (2015)
Data source: LG Inform, Local Government Association, November 2015. *Percentages may not sum to 100 due to rounding. Figure 10 illustrates the ranges between the LSOA Employment ranks for each ward in Ealing, where 1 is the most deprived. Some wards have a relatively compact range of employment ranks; for example, Southall Green ranges from 7,051 to 11,683 (4,632) with all its LSOAs placed in either the second or third most deprived deciles and Northolt West End which ranges from 4,658 to 12,524 (7,866) with all its LSOAs in the three most deprived deciles. Other wards have a broader range of employment ranks, such as Cleveland from 2,056 (in Decile 1) through to 29,891 (in Decile 9), a range of 27,835.
Decile 2, 13%
Decile 3, 30%
Decile 4, 17%
Decile 5, 4%
Decile 6, 9%
Decile 7, 13%
Decile 8, 4%
Decile 9, 9%
Most Deprived Least Deprived

30
Figure 10: Ranges of Employment Domain Ranks for LSOAs by Ealing Ward (2015)
Figure 10 helps to explain why Ealing looks comparatively less deprived at LSOA level than at ward level. The considerable ranges between LSOAs within some wards, means that the overall deprivation level for that ward is impacted by the more deprived LSOAs cancelling out the less deprived LSOAs, potentially showing a ward as relatively income deprived even though there could be several relatively less deprived LSOAs within it. Table 8 ranks the Employment Domain score for each Ealing Ward, out of all Ealing Wards (total: 23); all London Wards (total: 654); and all England Wards (total: 7,529). The shading indicates whether the ward is in the most deprived 20% or least deprived 20% of wards for that geographical breakdown.
Decil
es
Decile 1 (most deprived 10%)
Decile 10 (least deprived 10%) 9
8
7
6
5
4
3
2
31
Table 8: Employment Domain Rankings for Ealing Wards against all Ealing Wards, all London Wards and all England Wards (2015)
Ealing Ward Rank within
Ealing Rank in London
Rank in England
Northolt West End 1 72 1,110
Norwood Green 2 98 1,343
South Acton 3 114 1,472
Dormers Wells 4 131 1,554
Southall Green 5 146 1,664
Greenford Broadway 6 158 1,738
Southall Broadway 7 203 2,061
Northolt Mandeville 8 216 2,155
East Acton 9 223 2,224
Acton Central 9 223 2,224
Hobbayne 11 250 2,413
Cleveland 12 261 2,481
Elthorne 13 283 2,619
Lady Margaret 14 310 2,843
Ealing Common 15 389 3,560
Perivale 16 418 4,022
Greenford Green 17 425 4,142
North Greenford 18 478 4,801
Southfield 19 486 4,858
Walpole 20 496 5,006
Ealing Broadway 21 521 5,385
Hanger Hill 22 562 6,028
Northfield 23 588 6,497
Total wards 23 654 7,529
*1 = most deprived
Key
Wards amongst the 20% most deprived
Wards amongst the 20% least deprived
Table 8 suggests that when compared alongside other local authorities in England, Ealing wards shows deprivation levels at both ends of the scale. While three (13%) of the 23 Ealing wards fall in the 20% most deprived wards nationally, two (9%) wards also feature amongst the 20% least deprived wards in England. At a more local level, of the 130 wards that comprise the 20% most deprived wards in London, only three are in Ealing. Mirroring the national comparison, three Ealing wards fall in the 20% most deprived wards in London, while two within the 20% least deprived category. No Ealing ward falls in Decile 1 (the 10% most deprived), or in Decile 10 (the 10% least deprived) wards in either London or England.

32
4. Other Domains of Deprivation In addition to the Income and Employment domains covered previously, there are five further domains that comprise the Indices of Deprivation. These are:
Education, Skills and Training Deprivation This is the lack of attainment and skills in the local population, with indicators falling into two sub-domains: one relating to children and young people and the other relating to adult skills. The ‘children and young people’ sub-domain measures the attainment of qualifications and associated measures (‘flow’)”,6 while the adult skills sub-domain measures the lack of qualifications in the resident working age adult population (‘stock’).”7
Health Deprivation and Disability This measures the risk of premature death and the impairment of quality of life through poor physical or mental health. It covers morbidity, disability and premature mortality but not aspects of behaviour or environment that may be predictive of future health deprivation.8
Crime Crime is an important feature of deprivation that has major effects on individuals and communities, with the domain measuring the risk of personal and material victimisation at local level.9
6 Education, Skills and Training Deprivation - Children and Young People sub-domain includes:
Key Stage 2 attainment: The average points score of pupils taking reading, writing and mathematics Key Stage 2 exams12;
Key Stage 4 attainment: The average capped points score of pupils taking Key Stage 4;
Secondary school absence: The proportion of authorised and unauthorised absences from secondary school;
Staying on in education post 16: The proportion of young people not staying on in school or non-advanced education above age 16;
Entry to higher education: A measure of young people aged under 21 not entering higher education. (Source: Department for Communities and Local Government, The English Indices of Deprivation 2015: Research Report (2015), p.16).
7 Education, Skills and Training Deprivation - Adult Skills sub-domain is a non-overlapping count of two indicators:
Adult skills: The proportion of working age adults with no or low qualifications, women aged 25 to 59 and men aged 25 to 64;
English language proficiency: The proportion of working age adults who cannot speak English or cannot speak English well, women aged 25 to 59 and men aged 25 to 64.
(Source: Department for Communities and Local Government, The English Indices of Deprivation 2015: Research Report (2015), p.16).
8 The Health Deprivation and Disability Domain measures:
Years of potential life lost: An age and sex standardised measure of premature death;
Comparative illness and disability ratio: An age and sex standardised morbidity/disability ratio;
Acute morbidity: An age and sex standardised rate of emergency admission to hospital;
Mood and anxiety disorders: A composite based on the rate of adults suffering from mood and anxiety disorders, hospital episodes data, suicide mortality data and health benefits data.
(Source: Department for Communities and Local Government, The English Indices of Deprivation 2015: Research Report (2015), p.16).
9 The Crime Domain measures:
Violence – number of reported violent crimes (18 reported crime types) per 1000 at risk population;
Burglary – number of reported burglaries (4 reported crime types) per 1000 at risk population;
Theft – number of reported thefts (5 reported crime types) per 1000 at risk population;
Criminal damage – number of reported crimes (8 reported crime types) per 1000 at risk population. (Source: Department for Communities and Local Government, The English Indices of Deprivation 2015: Research Report (2015), p.17).

33
Barriers to Housing and Services The domain measures the physical and financial accessibility of housing and key local services, with indicators that fall into two sub-domains: ‘geographical barriers’, relating to the physical proximity of local services,10 and ‘wider barriers’ which include issues relating to access to housing such as affordability.11
Living Environment Deprivation This measures the quality of the local environment, and the domain includes indicators that fall into two sub-domains: the ‘indoors’ living environment, which measures the quality of housing;12 and the ‘outdoors’ living environment that contains measures of air quality and road traffic accidents.13
Deprivation in other domains at LSOA level Figure 11 shows the percentage of Ealing LSOAs which fall into the national deciles for each of the five domains. Decile 1 is the most deprived 10% of LSOAs in England and Decile 10 is the least deprived 10%. The chart only displays the deciles which an Ealing LSOAs falls into, so there might not be 10 deciles displayed for each domain.
10
Barriers to Housing and Services - Geographical Barriers sub-domain includes:
Road distance to a post office;
Road distance to a primary school;
Road distance to a general store or supermarket;
Road distance to a GP surgery. (Source: Department for Communities and Local Government, The English Indices of Deprivation 2015: Research Report (2015), p.17).
11 Barriers to Housing and Services - Wider Barriers sub-domain covers:
Household overcrowding: The proportion of all households in a Lower-layer Super Output Area which are judged to have insufficient space to meet the household’s needs;
Homelessness: Local authority district level rate of acceptances for housing assistance under the homelessness provisions of the 1996 Housing Act, assigned to the constituent Lower-layer Super Output Areas;
Housing affordability: Difficulty of access to owner-occupation or the private rental market, expressed as the inability to afford to enter owner occupation or the private rental market.
(Source: Department for Communities and Local Government, The English Indices of Deprivation 2015: Research Report (2015), p.17).
12 Living Environment Deprivation - Indoors sub-domain measures:
Houses without central heating: The proportion of houses that do not have central heating ;
Housing in poor condition: The proportion of social and private homes that fail to meet the Decent Homes standard.
(Source: Department for Communities and Local Government, The English Indices of Deprivation 2015: Research Report (2015), pp.17-18).
13 Living Environment Deprivation - Outdoors sub-domain includes:
Air quality: A measure of air quality based on emissions rates for four pollutants;
Road traffic accidents involving injury to pedestrians and cyclists: A measure of road traffic accidents involving injury to pedestrians and cyclists among the resident and workplace population.
(Source: Department for Communities and Local Government, The English Indices of Deprivation 2015: Research Report (2015), p.18).

34
Figure 11: Percentage of Ealing LSOAs in England Deciles for Five Domains of Deprivation (2015)
* Percentages may not sum to 100 due to rounding.
Figure 11 shows that levels of deprivation within the borough vary between the different domains. Under Crime and Barriers to Services and Housing, the majority of LSOAs in Ealing fall within Deciles 1 through 5, the 50% most deprived in England, with only 10% and 8% of LSOAs respectively falling in the least deprived 50%. However in terms of Education, Skills and Training as well as Health both have a broader range of deciles; the latter of which sees Ealing LSOAs in all 10 deciles. 28% of Ealing LSOAs feature in the least deprived 20% under the Education, Skills and Training domain, while no LSOA is in the top 10% most deprived (Decile 1). 60% of Ealing LSOAs fall into the 50% least deprived national deciles for this domain. The following pages contain maps which show the distribution of deprivation deciles across Ealing LSOAs for the five domains in focus. They highlight the changes in relative deprivation levels between 2010 and 2015, showing that overall levels of relative deprivation in the Borough have decreased.
Decile 1, 1%
Decile 1, 16%
Decile 1, 27%
Decile 1, 5%
Decile 2, 1%
Decile 2, 6%
Decile 2, 25%
Decile 2, 20%
Decile 2, 14%
Decile 3, 8%
Decile 3, 12%
Decile 3, 20%
Decile 3, 22%
Decile 3, 27%
Decile 4, 15%
Decile 4, 13%
Decile 4, 17%
Decile 4, 16%
Decile 4, 28%
Decile 5, 11%
Decile 5, 17%
Decile 5, 13%
Decile 5, 7%
Decile 5, 19%
Decile 6, 11%
Decile 6, 14%
Decile 6, 7%
Decile 6, 6%
Decile 6, 7%
Decile 7, 14%
Decile 7, 15%
Decile 7, 3%
Decile 7, 2%
Decile 7, 1%
Decile 8, 12%
Decile 8, 10%
Decile 9, 9%
Decile 9, 11% Decile 10,
19%
Decile 10, 2%
Education, Skills &Training
Health Crime Barriers toServices &
Housing
LivingEnvironment
Mo
st
Dep
rived
L
east
Dep
rived

35
Map 7: Education, Skills and Training Deprivation, Ealing LSOAs, 2015
Map 8: Education, Skills and Training Deprivation, Ealing LSOAs, 2010

36
Map 9: Health Deprivation and Disability, Ealing LSOAs, 2015
Map 10: Health Deprivation and Disability, Ealing LSOAs, 2010

37
Map 11: Crime, Ealing LSOAs, 2015
Map 12: Crime, Ealing LSOAs, 2010

38
Map 13: Barriers to Housing and Services, Ealing LSOAs, 2015
Map 14: Barriers to Housing and Services, Ealing LSOAs, 2010

39
Map 15: Living Environment Deprivation, Ealing LSOAs, 2015
Map 16: Living Environment Deprivation, Ealing LSOAs, 2010

40
Deprivation in other domains at ward level Figure 12 shows the percentage of Ealing wards which fall into the national deciles for each of the five domains. Decile 1 is the most deprived 10% of wards in England and Decile 10 is the least deprived 10%. The chart only displays the deciles which an Ealing ward falls into, so there might not be 10 deciles displayed for each domain.
Figure 12: Percentage of Ealing Wards in England Deciles for Five Domains of Deprivation (2015)
*
Percentages may not sum to 100 due to rounding.
Figure 12 shows that Ealing’s levels of relative deprivation vary considerably between the different domains. All of Ealing’s wards fall within Deciles 1 to 3, the 30% most deprived wards under the Crime Domain, whereas the spread of deciles for the Education, Skills and Training Domain is more broad, falling into seven of the deciles, with a quarter of wards falling in Deciles 9 and 10, the 20% least deprived in England.
Decile 1, 30% Decile 1,
26%
Decile 2, 4%
Decile 2, 43%
Decile 2, 30%
Decile 2, 22%
Decile 3, 9%
Decile 3, 22%
Decile 3, 26%
Decile 3, 30%
Decile 3, 39%
Decile 4, 22%
Decile 4, 26%
Decile 4, 30%
Decile 5, 13%
Decile 5, 9%
Decile 5, 9%
Decile 6, 9%
Decile 6, 17%
Decile 6, 4%
Decile 7, 26%
Decile 7, 13%
Decile 8, 9%
Decile 8, 4%
Decile 9, 9%
Decile 10, 17%
Education, Skills &Training
Health Crime Barriers toServices &
Housing
LivingEnvironment
Leas
t d
epri
ved
M
ost
dep
rive
d

41
Table 9 below presents the ranks for all Ealing wards under the five domains considered in this section, based on data produced by the LGA. It highlights how the wards vary in their performance on the different domains of deprivation.
Table 9: Ranks* of Ealing Wards (within Ealing) on Various Domains of Deprivation
Ran
k Education,
Skills & Training
Health & Disability
Crime Barriers to Housing & Services
Living Environment
1 Southall
Broadway Norwood Green
Southall Broadway
Norwood Green East Acton
2 Southall Green Southall
Broadway Southall Green
Northolt West End
Ealing Broadway
3 Dormers Wells South Acton Greenford Broadway
Southall Green South Acton
4 Northolt West
End Southall Green
Northolt West End
Dormers Wells Ealing Common
5 Northolt
Mandeville Dormers Wells Dormers Wells East Acton Elthorne
6 Norwood Green Northolt West
End Acton Central
Southall Broadway
Walpole
7 Greenford Broadway
Acton Central South Acton South Acton Acton Central
8 Lady Margaret Greenford Broadway
East Acton Northolt
Mandeville Hanger Hill
9 East Acton East Acton Norwood Green Cleveland Southall Green
10 North Greenford Elthorne Greenford Green Greenford Broadway
Southall Broadway
11 South Acton Hobbayne Ealing Common Perivale Southfield
12 Perivale Lady Margaret Elthorne Acton Central Northfield
13 Hobbayne Northolt
Mandeville Northolt
Mandeville North Greenford
Greenford Broadway
14 Greenford Green Cleveland Lady Margaret Ealing Common Dormers Wells
15 Elthorne Ealing Common Perivale Lady Margaret Northolt West
End
16 Acton Central Greenford Green North Greenford Greenford Green Hobbayne
17 Cleveland Ealing Broadway Southfield Elthorne Northolt
Mandeville
18 Ealing Common Walpole Hobbayne Hobbayne Cleveland
19 Hanger Hill Southfield Walpole Hanger Hill Norwood Green
20 Southfield Perivale Hanger Hill Ealing Broadway Perivale
21 Walpole Northfield Cleveland Walpole Greenford Green
22 Northfield North Greenford Ealing Broadway Southfield North Greenford
23 Ealing Broadway Hanger Hill Northfield Northfield Lady Margaret
*1 = most deprived
42
5. Income Deprivation Affecting Children Index (IDACI) The Income Deprivation Affecting Children Index (IDACI) is a subset of the Income Deprivation Domain, and shows the proportion of children in each Lower-layer Super Output Area who live in families that are income deprived; those that are in receipt of Income Support, income-based Jobseeker’s Allowance, Pension Credit Guarantee or Child Tax Credit below a given threshold. Ealing Overview
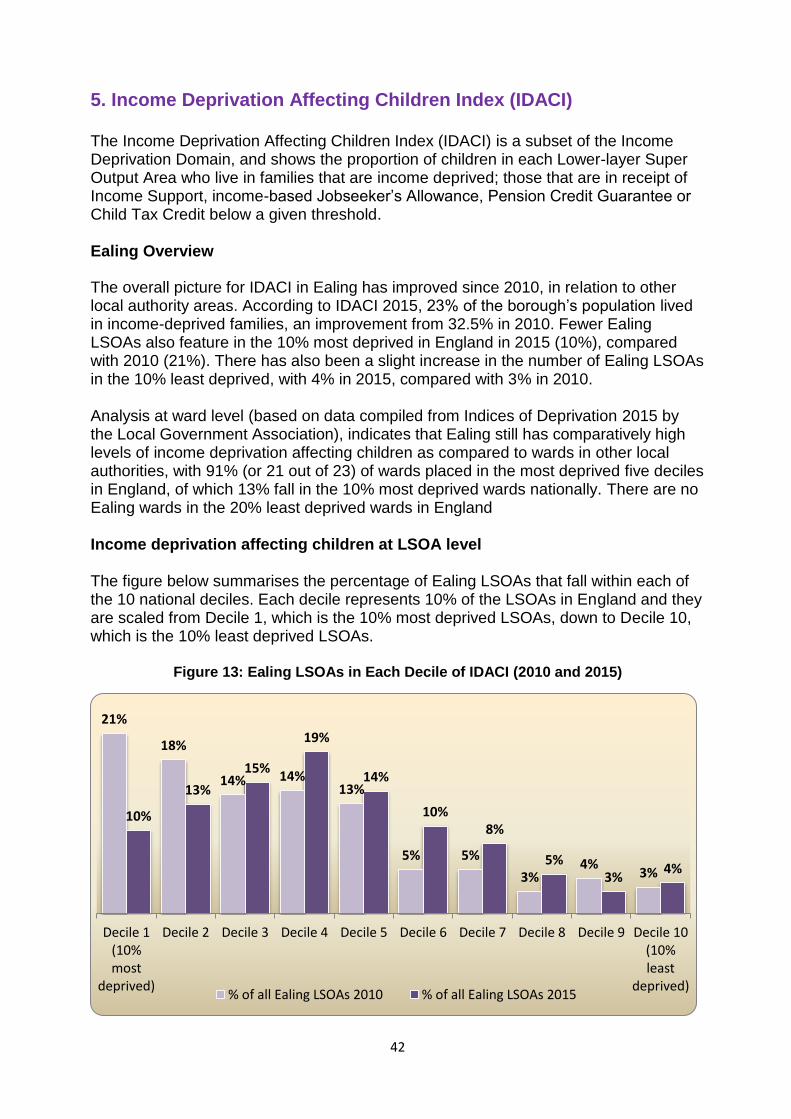
The overall picture for IDACI in Ealing has improved since 2010, in relation to other local authority areas. According to IDACI 2015, 23% of the borough’s population lived in income-deprived families, an improvement from 32.5% in 2010. Fewer Ealing LSOAs also feature in the 10% most deprived in England in 2015 (10%), compared with 2010 (21%). There has also been a slight increase in the number of Ealing LSOAs in the 10% least deprived, with 4% in 2015, compared with 3% in 2010. Analysis at ward level (based on data compiled from Indices of Deprivation 2015 by the Local Government Association), indicates that Ealing still has comparatively high levels of income deprivation affecting children as compared to wards in other local authorities, with 91% (or 21 out of 23) of wards placed in the most deprived five deciles in England, of which 13% fall in the 10% most deprived wards nationally. There are no Ealing wards in the 20% least deprived wards in England Income deprivation affecting children at LSOA level The figure below summarises the percentage of Ealing LSOAs that fall within each of the 10 national deciles. Each decile represents 10% of the LSOAs in England and they are scaled from Decile 1, which is the 10% most deprived LSOAs, down to Decile 10, which is the 10% least deprived LSOAs.
Figure 13: Ealing LSOAs in Each Decile of IDACI (2010 and 2015)
21%
18%
14% 14% 13%
5% 5%
3% 4%
3%
10%
13%
15%
19%
14%
10% 8%
5% 3%
4%
Decile 1(10%most
deprived)
Decile 2 Decile 3 Decile 4 Decile 5 Decile 6 Decile 7 Decile 8 Decile 9 Decile 10(10%least
deprived)% of all Ealing LSOAs 2010 % of all Ealing LSOAs 2015

43
Figure 13 shows the movement of the borough’s LSOAs between the deciles, with decreases seen in Deciles 1, 2 and 9, but with increases experienced in all other deciles, the most considerable of which being Decile 6 (10 LSOAs) and Decile 4 (9 LSOAs). The LSOAs in this domain have moved away from the 20% most deprived LSOAs (Deciles 1 and 2), indicating an improvement in relative levels of deprivation.
44
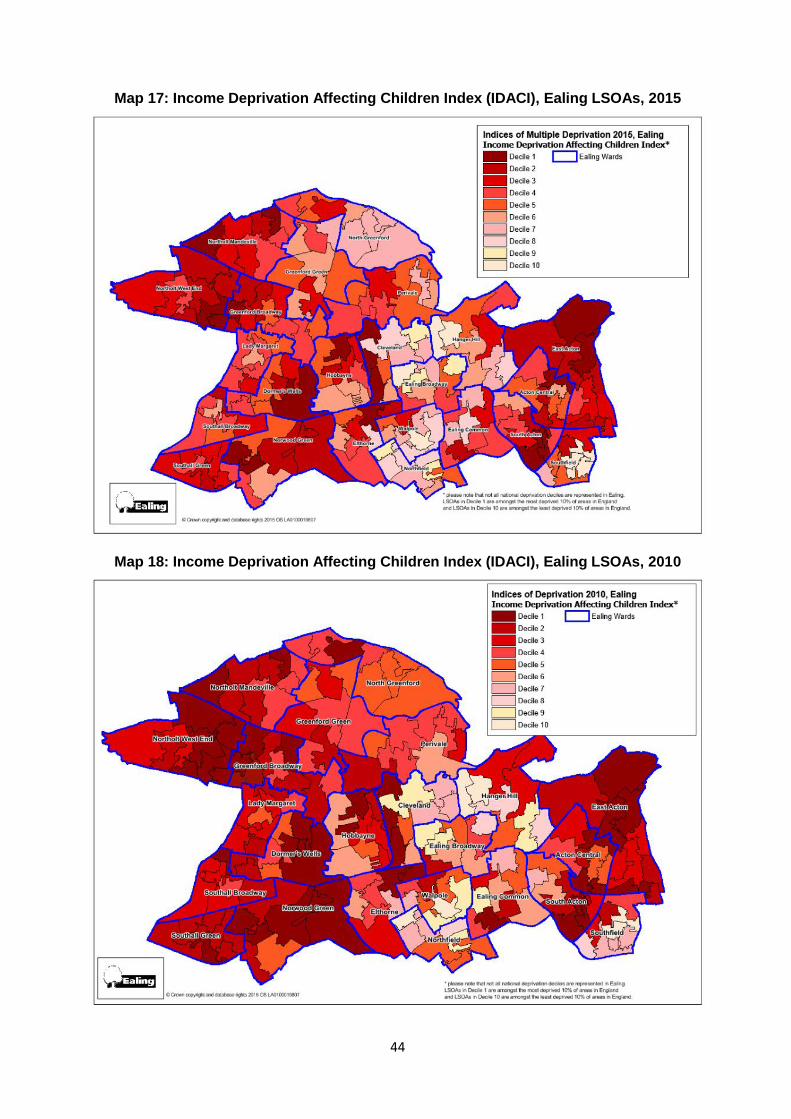
Map 17: Income Deprivation Affecting Children Index (IDACI), Ealing LSOAs, 2015
Map 18: Income Deprivation Affecting Children Index (IDACI), Ealing LSOAs, 2010

45
Maps 17 and 18 highlight the overall decrease in relative levels of deprivation in Ealing, with noticeable changes in shading between 2010 and 2015. Areas such as East Acton, Norwood Green and Southall Broadway in particular have LSOAs which have become relatively less deprived in the IDACI scale. As seen with several of the other domains, the more deprived areas are clustered in the west and very east of the borough. Income deprivation affecting Children at Ward Level
Figure 14 summarises the percentage of Ealing wards which fall into the 10 deciles for IDACI deprivation in England. It shows that all Ealing wards fall in Deciles 1 through 7, with none in Deciles 8 to 10 (the 30% least deprived wards in England). 13% of the Borough’s wards are in the 10% most deprived wards nationally. This would suggest that when wards are looked at in the England context, Ealing has comparatively high levels of IDACI deprivation.
Figure 14: Percentage of Ealing Wards in each IDACI Decile for England (2015)
Data source: LG Inform, Local Government Association, November 2015. * Percentages have been rounded so might not sum to 100.
Figure 15 illustrates the ranges between the LSOA IDACI ranks for each ward in Ealing, where 1 is the most deprived. Some wards have a relatively compact range of IDACI ranks; for example, Southall Green ranges from 5,713 to 10,997 (5,284) with all its LSOAs placed in either the second or third most deprived deciles and Northolt West End which ranges from 3,163 to 9,861 (6,698) with all its LSOAs in the three most deprived deciles. Other wards have a broader range of IDACI ranks, such as Cleveland from 279 (in Decile 1) through to 26,755 (in Decile 9), a range of 26,476. Figure 15 also shows the median LSOA rank for each ward to further illustrate how levels of deprivation vary between the wards.
Decile 1, 13%
Decile 2, 26%
Decile 3, 17%
Decile 4, 17%
Decile 5, 17%
Decile 6, 4%
Decile 7, 4%
Most Deprived
Least Deprived

46
Figure 15: Ranges of IDACI Ranks for LSOAs by Ealing Ward (2015)
Decile 10 (least deprived 10%)
Decile 1 (most deprived 10%)
9 8 7 6 5 4 3 2
De
cil
es

47
Table 10 ranks the IDACI score for each Ealing Ward, out of all Ealing Wards (total: 23); all London Wards (total: 654); and all England Wards (total: 7,529). The shading indicates whether the ward is in the most deprived 20% or least deprived 20% of wards for that geographical breakdown.
Table 10: IDACI 2015 ranks* of Ealing Wards within Ealing, London and England
Ealing Ward Rank in Ealing
Rank in London
Rank in England
East Acton 1 83 417
Northolt West End 2 126 598
South Acton 3 139 682
Norwood Green 4 177 862
Northolt Mandeville 5 191 943
Greenford Broadway 6 221 1,092
Southall Green 7 233 1,168
Acton Central 8 251 1,237
Dormers Wells 9 269 1,360
Cleveland 10 309 1,661
Elthorne 10 309 1,661
Southall Broadway 12 320 1,743
Hobbayne 13 329 1,797
Lady Margaret 14 389 2,312
Ealing Common 15 404 2,437
Perivale 16 416 2,607
Greenford Green 17 431 2,769
North Greenford 18 463 3,170
Southfield 19 472 3,325
Ealing Broadway 20 488 3,569
Hanger Hill 21 491 3,594
Walpole 22 515 4,072
Northfield 23 575 5,196
Total wards 23 654 7,529
* 1 = most deprived
Key
Wards amongst the 20% most deprived
Wards amongst the 20% least deprived
Table 10 suggests that when compared alongside other London boroughs, Ealing has varied levels of IDACI deprivation. Of the 130 wards which comprise the 20% most deprived wards in London, only two are in Ealing. However, of the 1,505 wards which comprise the most deprived 20% of wards in England, nine of them are in Ealing; which equates to 39% of all Ealing wards. There are no Ealing wards featuring in the 20% least deprived wards in England. At a London level, there are no Ealing wards in either the 10% most deprived or 10% least deprived, whereas at national level, three Ealing wards fall into the 10% most deprived wards. This would suggest that when compared against the rest of England, Ealing has comparatively high levels of IDACI deprivation.

48
6. Income Deprivation Affecting Older People Index (IDAOPI) Income Deprivation Affecting Older People Index (IDAOPI) is a subset of the Income Deprivation Domain. An IDAOPI score shows the proportion of a Lower-layer Super Output Area’s population who are aged 60 and over and are income deprived. Ealing Overview
The overall picture for IDAOPI in Ealing has not altered a great deal since 2010, in relation to other local authority areas. There has been a slight increase in the percentage of Ealing LSOAs featuring in the 10% most deprived in England in 2015 (17%), compared with 2010 (16%). The percentage falling in the 10% least deprived has remained the same (1%), however there has been an increase in the percentage falling into the 20% least deprived, from 2.6% in 2010 to 3% in 2015. Analysis at ward level (based on data compiled from the Indices of Deprivation 2015 by the Local Government Association), indicates that Ealing still has high levels of relative IDAOPI deprivation, with all 23 wards placed in the 50% most deprived wards in England. With 30% of wards falling in the most deprived 10% (Deciles 1). Income deprivation affecting Older People at LSOA Level
Figure 16 summarises the percentage of Ealing LSOAs that fall within each of the 10 national deciles. Each decile represents 10% of the LSOAs in England and they are scaled from Decile 1, which is the 10% most deprived LSOAs, down to Decile 10, which is the 10% least deprived LSOAs.
Figure 16: Ealing LSOAs in Each Decile of IDAOPI (2010 and 2015)
16%
14%
16% 17% 17%
10%
4% 4%
2% 1%
17%
15%
17% 17%
14%
7% 6%
4% 3%
1%
Decile 1(10%most
deprived)
Decile 2 Decile 3 Decile 4 Decile 5 Decile 6 Decile 7 Decile 8 Decile 9 Decile 10(10%least
deprived)% of all Ealing LSOAs 2010 % of all Ealing LSOAs 2015

49
Map 19: Income Deprivation Affecting Older People Index (IDAOPI), Ealing LSOAs, 2015
Map 20: Income Deprivation Affecting Older People Index (IDAOPI), Ealing LSOAs, 2010

50
Maps 19 and 20 highlight that there has been comparatively little change in levels of IDAOPI deprivation across Ealing; there are a few more LSOAs featuring in the deciles one and two (most deprived), but also a few more in Deciles 9 and 10 (least deprived). The least deprived LSOAs are mostly clustered around the centre of the borough, in the wards of Hanger Hill and Ealing Broadway. The areas with some of the high levels of relative deprivation include Southall Broadway, Southall Greens and Dormers Wells. Income deprivation affecting Older People at Ward Level
Figure 17 summarises the percentage of Ealing wards which fall into the 10 deciles for IDAOPI deprivation in England. All 23 wards in the borough are in the 5 most deprived deciles, the 50% most deprived wards in England. Of the Borough’s 23 wards, 30% are in Decile 1; the most deprived 10% of wards nationally. This would suggest that when wards are looked at in the England context, Ealing has comparatively high levels of IDAOPI deprivation.
Figure 17: Percentage of Ealing Wards in each IDAOPI Decile for England (2015)
Data source: LG Inform, Local Government Association, November 2015. * Percentages have been rounded so might not sum to 100.
Figure 18 illustrates the ranges between the LSOA IDAOPI ranks for each ward in Ealing, where 1 is the most deprived. Some wards have a relatively compact range of IDAOPI ranks; for example, Southall Green ranges from 1,563 to 7,070 (5,507) with all its LSOAs placed in the first, second or third most deprived deciles and Norwood Green which ranges from 539 to 8,579 (6,698) with all its LSOAs in the three most deprived deciles. Other wards have a broader range of IDAOPI ranks, such as Northfield from 5,334 (in Decile 2) through to 29,235 (in Decile 9), a range of 23,901. Figure 18 also shows the median LSOA rank for each ward to further illustrate how levels of deprivation vary between the wards.
Decile 1, 30%
Decile 2, 26%
Decile 3, 30%
Decile 4, 4%
Decile 5, 9%
Most Deprived
Least Deprived
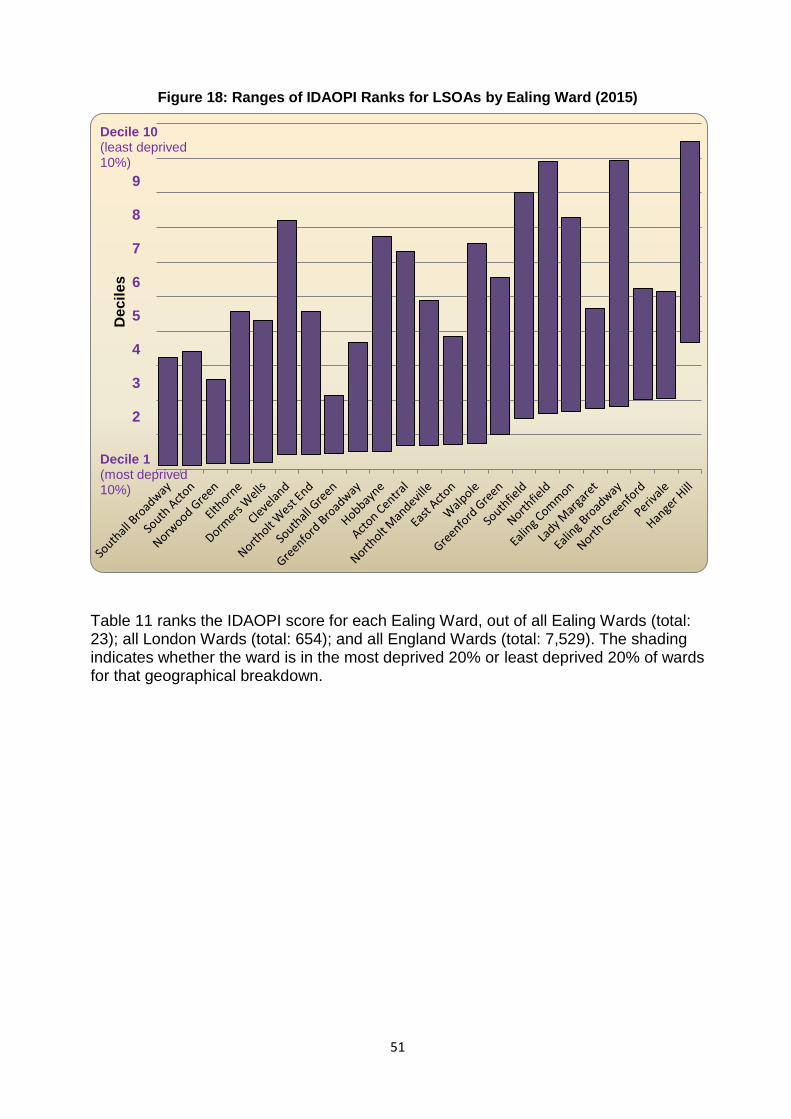
51
Figure 18: Ranges of IDAOPI Ranks for LSOAs by Ealing Ward (2015)
Table 11 ranks the IDAOPI score for each Ealing Ward, out of all Ealing Wards (total: 23); all London Wards (total: 654); and all England Wards (total: 7,529). The shading indicates whether the ward is in the most deprived 20% or least deprived 20% of wards for that geographical breakdown.
Decile 10 (least deprived 10%)
Decile 1 (most deprived 10%)
9 8 7 6 5 4 3 2
De
cil
es

52
Table 11: IDAOPI ranks 2015 of Ealing Wards within Ealing, London and England
Ealing Ward Rank in Ealing
Rank in London
Rank in England
South Acton 1 117 309
Southall Broadway 1 117 309
Dormers Wells 3 136 365
Southall Green 4 140 374
Norwood Green 5 151 429
Northolt West End 6 172 496
Greenford Broadway 7 215 705
Elthorne 8 230 758
East Acton 9 235 778
Acton Central 10 280 1,003
Lady Margaret 11 313 1,225
Northolt Mandeville 12 315 1,268
Hobbayne 13 326 1,375
Cleveland 14 364 1,646
Perivale 15 372 1,742
Walpole 16 385 1,801
Ealing Common 17 390 1,853
North Greenford 18 398 1,927
Greenford Green 19 417 2,128
Southfield 20 427 2,251
Ealing Broadway 21 441 2,375
Hanger Hill 22 493 3,271
Northfield 23 498 3,327
Total wards 23 654 7,529
* 1 = most deprived
Key
Wards amongst the 20% most deprived
Wards amongst the 20% least deprived
Table 11 suggests that when compared alongside the rest of England, Ealing has comparatively high levels of IDAOPI deprivation. As cited previously in this report, all Ealing wards fall in Deciles1 through 5 (the most deprived 50%). This increases to 56% of Ealing wards falling in the 20% most deprived wards in England; meaning that out of the 1,505 wards which comprise the most deprived 20% of wards in England, 13 of them are in Ealing. Compared alongside just the London boroughs, Ealing has more varied levels of relative IDAOPI deprivation and appears to perform more favourably. Of the 130 wards which comprise the 20% most deprived wards in London, only two are in Ealing. The borough’s wards fall into a broader range of deciles when compared against London alone, featuring in Deciles 2 to 8; but mirroring the national deciles, there are no Ealing wards in Deciles 9 and 10 (the least deprived 20%). 30% of the Borough’s 23 wards are in the 10% most deprived wards nationally, but none fall in the most deprived 10% in London. No Ealing wards feature in the 10% least deprived wards in either London or England.

53
Appendices
APPENDIX A: Sources Sources Used in the Production of this Report:
Department for Communities and Local Government, ‘English Indices of Deprivation 2010: Overall, (https://www.gov.uk/government/statistics/english-indices-of-deprivation-2010, downloaded: March 2011).
Department for Communities and Local Government, ‘English Indices of Deprivation 2010: Local Authority Summaries, (https://www.gov.uk/government/statistics/english-indices-of-deprivation-2010, downloaded: March 2011).
Department for Communities and Local Government, ‘English Indices of Deprivation 2010: Indices and Domains, (https://www.gov.uk/government/statistics/english-indices-of-deprivation-2010, downloaded: March 2011).
Department for Communities and Local Government, ‘English Indices of Deprivation 2010: Supplementary Indices: Children and Older People’, (https://www.gov.uk/government/statistics/english-indices-of-deprivation-2010, downloaded: March 2011).
Department for Communities and Local Government, ‘English Indices of Deprivation 2015, File 2: Domains of Deprivation’, (https://www.gov.uk/government/statistics/english-indices-of-deprivation-2015, downloaded: September 2015).
Department for Communities and Local Government, ‘English Indices of Deprivation 2015, File 3: Supplementary Indices - Income Deprivation Affecting Children Index and Income Deprivation Affecting Older People Index’, (https://www.gov.uk/government/statistics/english-indices-of-deprivation-2015, downloaded: September 2015).
Department for Communities and Local Government, ‘English Indices of Deprivation 2015, File 10: Local Authority District Summaries’, (https://www.gov.uk/government/statistics/english-indices-of-deprivation-2015, downloaded: September 2015).
Department for Communities and Local Government, ‘The English Indices of Deprivation 2015: Frequently Asked Questions', (https://www.gov.uk/government/uploads/system/uploads/attachment_data/file/467901/English_Indices_of_Deprivation_2015_-_Frequently_Asked_Questions.pdf, downloaded: October 2015).

54
Department for Communities and Local Government, ‘The English Indices of Deprivation 2015: Guidance', (https://www.gov.uk/government/uploads/system/uploads/attachment_data/file/464430/English_Index_of_Multiple_Deprivation_2015_-_Guidance.pdf, downloaded: October 2015).
Department for Communities and Local Government, ‘The English Indices of Deprivation 2015: Research Report', (https://www.gov.uk/government/uploads/system/uploads/attachment_data/file/464597/English_Indices_of_Deprivation_2015_-_Research_Report.pdf, downloaded: September 2015).
Local Government Association, ‘LG Inform Plus Indices of Deprivation ward level data’, (http://lginform.local.gov.uk/, downloaded: November and December 2015).
Further Information Department for Communities and Local Government:
All supporting documents for the English Indices of Deprivation 2010 Available for download: https://www.gov.uk/government/statistics/english-indices-of-deprivation-2010
All supporting documents for the English Indices of Deprivation 2015 Available for download: https://www.gov.uk/government/statistics/english-indices-of-deprivation-2015

55
APPENDIX B: England Deciles (based on scores) of Ealing Wards, for: Overall Index of Multiple Deprivation, 7 Domains, IDACI and IDAOPI, by Ward (2015)
Domain
Ward Overall IMD decile
Income decile
Employment decile
Education decile
Health decile
Crime decile
Barriers to Services & Housing decile
Living Environment decile
IDACI decile
IDAOPI decile
Acton Central 3 2 3 8 4 1 2 3 2 2
Cleveland 3 3 4 8 5 3 2 4 3 3
Dormers Wells 2 2 3 4 3 1 1 3 2 1
Ealing Broadway 5 6 7 10 6 3 3 2 5 4
Ealing Common 4 4 5 9 5 2 3 2 4 3
East Acton 2 2 4 6 4 2 1 2 1 2
Elthorne 3 3 4 7 4 2 3 2 3 2
Greenford Broadway 2 2 3 4 4 1 2 3 2 1
Greenford Green 5 4 6 7 6 2 3 4 4 3
Hanger Hill 6 6 9 9 8 3 3 3 5 5
Hobbayne 3 3 3 7 4 3 3 4 3 2
Lady Margaret 4 3 4 6 4 2 3 5 4 2
North Greenford 5 5 7 7 7 2 2 5 5 3
Northfield 8 8 9 10 7 3 6 3 7 5
Northolt Mandeville 3 2 3 4 5 2 2 4 2 2
Northolt West End 2 1 2 4 3 1 1 4 1 1
Norwood Green 2 1 2 4 2 2 1 4 2 1
Perivale 5 4 6 7 7 2 2 4 4 3
South Acton 2 1 2 7 3 1 2 2 1 1
Southall Broadway 2 2 3 3 3 1 1 3 3 1
Southall Green 2 2 3 3 3 1 1 3 2 1
Southfield 6 6 8 10 6 2 5 3 5 3
Walpole 6 6 7 10 6 3 5 3 6 3
Data source: LG Inform, Local Government Association, December 2015
Key
20% most deprived 20% least deprived

56
APPENDIX C: London and National Rankings of London Boroughs for Overall Index of Multiple Deprivation, 7 Domains, IDACI and IDAOPI (2015)
Rank in London
Overall Rank of average rank
Income Rank of average rank
Employment Rank of average rank
Education, Skills & Training Rank of average rank
Health Deprivation & Disability Rank of average rank
1 Hackney 2 Barking and Dagenham 1 Barking and Dagenham 17 Barking and Dagenham 30 Tower Hamlets 47
2 Barking and Dagenham 3 Tower Hamlets 2 Hackney 39 Havering 89 Islington 54
3 Tower Hamlets 6 Hackney 3 Islington 52 Newham 98 Hackney 55
4 Newham 8 Newham 6 Lewisham 58 Waltham Forest 140 Barking and Dagenham 70
5 Islington 13 Islington 10 Newham 61 Enfield 143 Newham 87
6 Waltham Forest 15 Lewisham 18 Haringey 67 Bexley 146 Southwark 89
7 Haringey 21 Enfield 20 Tower Hamlets 68 Tower Hamlets 151 Hammersmith and Fulham 97
8 Lambeth 22 Waltham Forest 21 Waltham Forest 71 Haringey 171 Lewisham 98
9 Southwark 23 Haringey 23 Enfield 77 Greenwich 175 Lambeth 101
10 Lewisham 26 Southwark 25 Greenwich 82 Hackney 177 Greenwich 108
11 Brent 39 Lambeth 27 Southwark 86 Brent 179 Waltham Forest 110
12 Westminster 43 Brent 30 Lambeth 96 Hillingdon 185 Haringey 115
13 Greenwich 50 Greenwich 31 Brent 105 Croydon 207 Camden 129
14 Enfield 53 Ealing 61 Croydon 117 Lewisham 211 Ealing 142
15 Camden 69 Camden 65 Camden 135 Islington 213 Croydon 155
16 Hammersmith and Fulham 76 Hammersmith and Fulham 69 Ealing 137 Hounslow 224 Westminster 160
17 Hounslow 86 Croydon 72 Hammersmith and Fulham 140 Southwark 236 Hounslow 161
18 Ealing 87 Redbridge 84 Redbridge 158 Ealing 248 Brent 174
19 Croydon 91 Hounslow 86 Havering 160 Redbridge 260 Hillingdon 175
20 Kensington and Chelsea 99 Westminster 98 Westminster 170 Sutton 262 Enfield 188
21 Redbridge 119 Hillingdon 120 Hounslow 175 Lambeth 263 Wandsworth 190
22 Wandsworth 147 Barnet 131 Bexley 179 Camden 271 Havering 199
23 Hillingdon 153 Harrow 132 Hillingdon 193 Bromley 281 Redbridge 202
24 Barnet 157 Havering 137 Barnet 199 Merton 288 Sutton 211
25 Havering 166 Wandsworth 149 Kensington and Chelsea 215 Hammersmith and Fulham 302 Kensington and Chelsea 229
26 Bexley 195 Bexley 158 Harrow 217 Harrow 303 Merton 236
27 Merton 212 Kensington and Chelsea 177 Sutton 219 Westminster 305 City of London 238
28 Harrow 213 Merton 185 Bromley 223 Barnet 309 Bexley 242
29 Sutton 217 Sutton 192 Wandsworth 240 Wandsworth 314 Barnet 259
30 Bromley 220 Bromley 211 Merton 246 Kingston upon Thames 315 Bromley 265
31 City of London 226 Kingston upon Thames 247 Kingston upon Thames 298 Kensington and Chelsea 321 Harrow 277
32 Kingston upon Thames 278 Richmond upon Thames 293 Richmond upon Thames 313 City of London 325 Kingston upon Thames 306
33 Richmond upon Thames 296 City of London 322 City of London 322 Richmond upon Thames 326 Richmond upon Thames 319
* 1 is most deprived. 326 is least deprived. Numbers in blue font are national ranks.
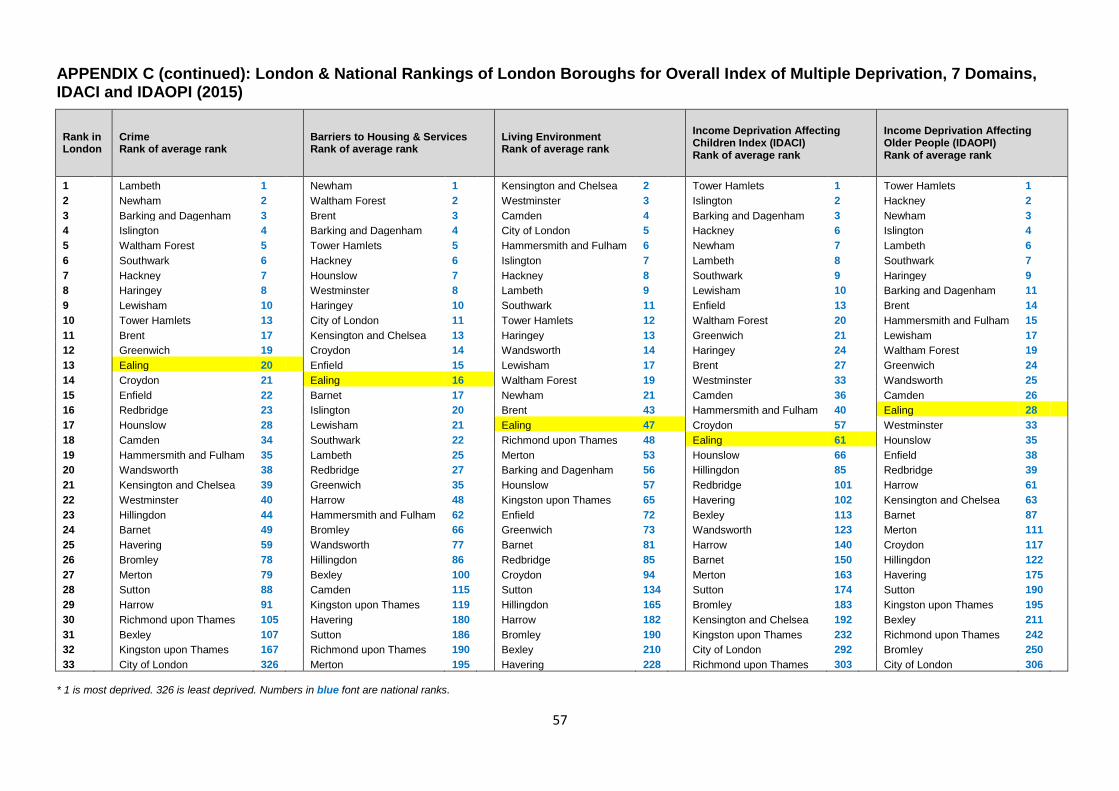
57
APPENDIX C (continued): London & National Rankings of London Boroughs for Overall Index of Multiple Deprivation, 7 Domains, IDACI and IDAOPI (2015)
Rank in London
Crime Rank of average rank
Barriers to Housing & Services Rank of average rank
Living Environment Rank of average rank
Income Deprivation Affecting Children Index (IDACI) Rank of average rank
Income Deprivation Affecting Older People (IDAOPI) Rank of average rank
1 Lambeth 1 Newham 1 Kensington and Chelsea 2 Tower Hamlets 1 Tower Hamlets 1
2 Newham 2 Waltham Forest 2 Westminster 3 Islington 2
Hackney 2
3 Barking and Dagenham 3 Brent 3 Camden 4 Barking and Dagenham 3
Newham 3
4 Islington 4 Barking and Dagenham 4 City of London 5 Hackney 6
Islington 4
5 Waltham Forest 5 Tower Hamlets 5 Hammersmith and Fulham 6 Newham 7
Lambeth 6
6 Southwark 6 Hackney 6 Islington 7 Lambeth 8
Southwark 7
7 Hackney 7 Hounslow 7 Hackney 8 Southwark 9
Haringey 9
8 Haringey 8 Westminster 8 Lambeth 9 Lewisham 10
Barking and Dagenham 11
9 Lewisham 10 Haringey 10 Southwark 11 Enfield 13
Brent 14
10 Tower Hamlets 13 City of London 11 Tower Hamlets 12 Waltham Forest 20
Hammersmith and Fulham 15
11 Brent 17 Kensington and Chelsea 13 Haringey 13 Greenwich 21
Lewisham 17
12 Greenwich 19 Croydon 14 Wandsworth 14 Haringey 24
Waltham Forest 19
13 Ealing 20 Enfield 15 Lewisham 17 Brent 27
Greenwich 24
14 Croydon 21 Ealing 16 Waltham Forest 19 Westminster 33
Wandsworth 25
15 Enfield 22 Barnet 17 Newham 21 Camden 36
Camden 26
16 Redbridge 23 Islington 20 Brent 43 Hammersmith and Fulham 40
Ealing 28
17 Hounslow 28 Lewisham 21 Ealing 47 Croydon 57
Westminster 33
18 Camden 34 Southwark 22 Richmond upon Thames 48 Ealing 61
Hounslow 35
19 Hammersmith and Fulham 35 Lambeth 25 Merton 53 Hounslow 66
Enfield 38
20 Wandsworth 38 Redbridge 27 Barking and Dagenham 56 Hillingdon 85
Redbridge 39
21 Kensington and Chelsea 39 Greenwich 35 Hounslow 57 Redbridge 101
Harrow 61
22 Westminster 40 Harrow 48 Kingston upon Thames 65 Havering 102
Kensington and Chelsea 63
23 Hillingdon 44 Hammersmith and Fulham 62 Enfield 72 Bexley 113
Barnet 87
24 Barnet 49 Bromley 66 Greenwich 73 Wandsworth 123
Merton 111
25 Havering 59 Wandsworth 77 Barnet 81 Harrow 140
Croydon 117
26 Bromley 78 Hillingdon 86 Redbridge 85 Barnet 150
Hillingdon 122
27 Merton 79 Bexley 100 Croydon 94 Merton 163
Havering 175
28 Sutton 88 Camden 115 Sutton 134 Sutton 174
Sutton 190
29 Harrow 91 Kingston upon Thames 119 Hillingdon 165 Bromley 183
Kingston upon Thames 195
30 Richmond upon Thames 105 Havering 180 Harrow 182 Kensington and Chelsea 192
Bexley 211
31 Bexley 107 Sutton 186 Bromley 190 Kingston upon Thames 232
Richmond upon Thames 242
32 Kingston upon Thames 167 Richmond upon Thames 190 Bexley 210 City of London 292
Bromley 250
33 City of London 326 Merton 195 Havering 228 Richmond upon Thames 303 City of London 306
* 1 is most deprived. 326 is least deprived. Numbers in blue font are national ranks.