Embed Size (px)
Citation preview

1
TITLE-
Depression biased non-Hebbian spike-timing-dependent synaptic plasticity in the rat
subiculum.
AUTHORS-
Anurag Pandey
Sujit Kumar Sikdar
AFFILIATION-
Molecular Biophysics Unit, Indian Institute of Science, Bangalore, India, 560012.
RUNNING TITLE- Non-Hebbian STDP in subiculum
KEY WORDS-Subiculum, STDP, non-Hebbian, Synaptic plasticity.
TOTAL NUMBER OF WORDS - 8688 (except legends and references)
CONTENT - Table – 01, Figures – 11, Equations – 00.
CORRESPONDING AUTHOR
S. K. Sikdar
Molecular Biophysics Unit
Indian Institute of Science
Bangalore 560 012
India
Tel. +91 80 22933220
Fax: +91 80 23600535
E-mail address: [email protected]
Acc
epte
d A
rticl
e
This is an Accepted Article that has been peer-reviewed and approved for publication in the The Journal of Physiology, but has yet to undergo copy-editing and proof correction. Please cite this article as an 'Accepted Article'; doi: 10.1113/jphysiol.2014.273367.
This article is protected by copyright. All rights reserved.

2
Key point summary
Spike- timing- dependent plasticity (STDP) is the induction of synaptic plasticity by
coincident activity of pre-and postsynaptic neurons.
In most of the excitatory synapses, EPSP immediately followed by back propagating action
potential (bAP) enhances the synaptic efficacy, whereas the reverse weakens the same.
Contrary to the above observation, we demonstrate that at the proximal excitatory
synapses on the subicular pyramidal neurons, EPSP immediately followed by burst of
bAPs weakens the synaptic strength, whereas the reverse order strengthens the synapse
in both, the bursting and regular firing neurons.
This reverse STDP rule may have strong implications in synaptic integration and
information outflow from the hippocampus.
Interestingly, the mechanisms associated with synaptic depression using same induction
protocol were different in the two neuronal subtypes. It was postsynaptic in the bursting
neurons requiring NMDA receptor activity, while presynaptic in the regular firing neurons
involving L-type calcium channels.
Abstract
The subiculum is a structure that forms a bridge between the hippocampus and the
entorhinal cortex (EC), and plays a major role in the memory consolidation process. Here,
we demonstrate spike- timing- dependent plasticity (STDP) at the proximal excitatory
inputs on the subicular pyramidal neurons of juvenile rat. Causal pairing of a single EPSP
with a single back propagating action potential (bAP) at a time interval of +10 ms failed to
induce plasticity. However, increasing the number of bAPs in a burst to three, at two
different frequencies of 50 Hz (bAP burst) and 150 Hz, induced LTD at +10 ms time
interval in both, the regular firing (RF), and the weak burst firing (WBF) neurons. The LTD
amplitude decreased with increasing time interval between EPSP and the bAP burst.
Reversing the order of the pairing of EPSP with bAP burst induced LTP at -10 ms time
interval. This finding is in contrast with reports at other synapses, wherein pre-before post
(causal) pairing induced LTP and vice-versa. Our results reaffirm the earlier observations
Acc
epte
d A
rticl
e
This article is protected by copyright. All rights reserved.
3
that the relative timing of the pre- and postsynaptic activities can lead to multiple types of
plasticity profiles. The induction of t-LTD was dependent on postsynaptic calcium change
via NMDA receptors in the WBF neurons, while it was independent of postsynaptic
calcium change, but required active L-type calcium channels in the RF neurons. Thus the
mechanism of synaptic plasticity may vary within a hippocampal subfield depending on the
postsynaptic neuron involved. This study also reports a novel mechanism of LTD
induction, where L-type calcium channels are involved in a presynaptically induced
synaptic plasticity. The findings may have strong implications in the memory consolidation
process owing to the central role of the subiculum and LTD in it.
Abbreviations
ADP, after depolarization; AP, action potential; bAP, back propagating action potential; BF,
burst firing; EC, entorhinal cortex; HFS, high frequency stimulus; Ih, Hyperpolarization-
activated non selective cation channels; LFS, low frequency stimulus; LTD, long term
depression; NMDAR, NMDA receptor; PPR, paired pulse ratio; RF, regular firing; Rin, input
resistance; RMP, resting membrane potential; Rs, series resistance; sACSF, sucrose
based ACSF; STDP, spike- timing- dependent plasticity; t-LTD, timing dependent LTD;
WBF, weak burst firing.
Introduction
According to the Hebbian theory of plasticity, long term potentiation is induced if the post
synaptic neuron fires within a narrow time window after the pre synaptic firing (Hebb,
1949). This coincident activity modifies the synaptic strength that is manifested as a
change in the amplitude or slope of the EPSPs recorded at the postsynaptic neuron. This
change in synaptic strength depends upon the relative timing of pre- and post synaptic
activities (Bi & Poo, 1998) and is known as ‘spike- timing- dependent plasticity’ (Song et
al., 2000). Synaptic plasticity is widely believed to underpin memory formation (Martin et
al., 2000). STDP is a form of synaptic plasticity that can explain both, strengthening and
weakening of synapses (Bi & Poo, 2001; Dan & Poo, 2006). Certain kinds of memories are
formed in the hippocampus (Andersen, 2007) and stored in the cortex (Stern et al., 2001).
Acc
epte
d A
rticl
e
This article is protected by copyright. All rights reserved.

4
Due to its strategic location, the subiculum funnels information from the hippocampus to
various cortical sub regions such as the EC layer IV and V, perirhinal cortex (Witter et al.,
1989), amygdala and thalamus (Canteras & Swanson, 1992). Lesion studies have
established the role of the subiculum in long term spatial learning (Morris et al., 1990) and
performance of working memory tasks (Galani et al., 1998); and with CA1, it executes
mnemonic functions of the brain (Deadwyler & Hampson, 2004). Majority of the neurons in
the subiculum respond with burst(s) of multiple action potentials upon suprathreshold
excitation (Staff et al., 2000). These neurons are different from typical regular firing
neurons in certain aspects such as larger neuronal spike after depolarization (ADP) and
higher sag ratio (van Welie et al., 2006). This difference in the intrinsic properties leads to
diverse synaptic integration properties of the excitatory neurons in the subiculum (van
Welie et al., 2006). Furthermore, the mechanism of synaptic plasticity varies with the
intrinsic properties of the neurons as well (Wozny et al., 2008).
Although some properties of the subicular pyramidal neurons are well studied, other
aspects like the expression profile and kinetics of various ion channels including the
magnesium unblock of NMDA receptors are not well understood, which may influence the
STDP plot of a synapse (Shouval et al., 2002; Johnston et al., 2003; Kampa et al., 2004).
In the absence of this information, it is very difficult to predict and compare the STDP plot
of the synapses on the subicular neurons with other synapses. Most of the synapses in
different hippocampal subfields have been well studied for synaptic plasticity (Dudek &
Bear, 1992; Bliss & Collingridge, 1993; Nicoll & Schmitz, 2005), and STDP (Debanne et
al., 1998; Wittenberg & Wang, 2006; Astori et al., 2010). However, there are very few
reports of synaptic plasticity in the proximal excitatory inputs on the subicular pyramidal
neurons that predominantly originate from the CA1 (Kokaia, 2000; Fidzinski et al., 2008;
Wozny et al., 2008), and so far, STDP has not been reported for this synapse.
In this study, we asked if the proximal excitatory inputs on the subicular pyramidal neurons
express STDP. Further, we explored the differences in the mechanism of such plasticity
between different types of neurons, following earlier reports that the mechanism of
synaptic plasticity in the subiculum depends on the type of postsynaptic neuron involved
(Fidzinski et al., 2008; Wozny et al., 2008). Recently, it was demonstrated that the
subiculum can generate gamma rhythms independently (Jackson et al., 2011); hence, we
Acc
epte
d A
rticl
e
This article is protected by copyright. All rights reserved.

5
paired a single EPSP with a burst of 3 bAPs at 50 Hz (bAP burst). Interestingly, we found
that causal pairing induced LTD, while anti-causal pairing induced LTP in the subicular
pyramidal neurons. In the WBF neurons, the negative side of the STDP curve showing
LTP was slightly narrower than the positive side that showed LTD. The causal pairing
induced LTD was also observed in the RF neurons; however, there were prominent
differences in the plasticity mechanism between these two neuronal sub-types.
Materials and Methods
Slice preparation
All the experiments were approved by the ‘Animal Ethics and Welfare Committee’ of Indian
Institute of Science, Bangalore, India, and all the guidelines of this committee were
followed in all the experiments. Halothane anaesthetized rats were decapitated and slices
were cut in sucrose based ACSF (sACSF) (in mM): Sucrose 250, KCl 2.5, MgCl2 3, CaCl2
1, NaHCO3 25, NaH2PO4 1.25, Glucose 10, Ascorbic acid 0.4, bubbled with carbogen
(95% O2+5% CO2), pH 7.4. In a subset of experiments, the slicing procedure was
performed using NaCl based ACSF (nACSF) where sucrose was completely replaced with
125 mM NaCl. The experiments were performed on 300 µm thick acute transverse
hippocampal slices from Wistar rats (15 to 18 days old). The slices were cut using Leica
VT 1200S vibratome, incubated at 340C for 15 min, and thereafter maintained at room
temperature (23 ±10C). The incubation solution contained (in mM): NaCl 125, KCl 2.5,
MgCl2 2, CaCl2 2, NaHCO3 25, NaH2PO4 1.25, Glucose 25, Ascorbic acid 1.0, pH 7.4,
bubbled with carbogen throughout the incubation period.
Data acquisition and analysis
During the experimental recordings the slices were continuously superfused with carbogen
saturated ACSF (in mM): NaCl 125, KCl 2.5, NaH2PO4 1.25, NaHCO3 26, MgCl2 1, CaCl2 2,
Glucose 25, pH 7.4. 10 µM picrotoxin and 1 µM CGP-55845 were added to block
GABAergic inhibitory inputs. All the experiments were conducted at a bath temperature
between 32 and 340C. The patch pipettes (pipette resistance 3.5-5 MΩ) were filled with
solution containing (in mM): Potassium gluconate 125, KCl 20, HEPES 10, Sodium
phosphocreatine 10, Mg-ATP 5, Na-GTP 0.5, EGTA 0.2, pH was adjusted to 7.3 with
Acc
epte
d A
rticl
e
This article is protected by copyright. All rights reserved.

6
KOH. In experiments with pharmacological blockers, 50 µM DL-AP5, 25 µM nifedipine, 50
µM verapamil hydrochloride, or 10 µM bicuculline were added to the bath solution. The
physiological role of intracellular calcium was checked in some experiments by partially
replacing potassium gluconate with 10 mM tetra-potassium salt of BAPTA in the internal
solution.
0.5% Biocytin was included in the patch pipette to obtain information about location and
morphology of the recorded neurons. After the experiment, each slice was incubated in
4% paraformaldehyde containing 0.1% glutaraldehyde in 0.1% PBS, pH 7.4, for at least 24
hrs. Thereafter, sections were washed thrice in PBS for 10 minutes each. To eliminate
endogenous peroxidase activity, slices were washed with 50% ethanol (v/v) for 10 min,
70% ethanol (v/v) for 15 min, and 50% ethanol (v/v) for 10 min followed by three PBS
washes of 10 min duration each. Slices were permeabilized using 0.5% Triton X-100 in
PBS for 1 hr, which was washed later from the slices using PBS in three steps of 10 min
each. Thereafter, slices were incubated in avidin–horseradish peroxidase (avidin-HRP)
solution (Vectastain ABC-kit, Vector labs, USA) for 3 hrs, which was washed in 3 steps of
10 min each with PBS. Slices were then incubated in nickel intensification solution
consisting of PBS with 0.05% of 3’-3-diaminobenzidine tetrahydrochloride (DAB), CoCl2
(0.025%) and NiNH4SO4 (0.02%), for 15 min, followed by addition of H2O2 to a final
concentration of 0.1%. This step was carefully monitored until the development of a dark
brown coloured cell with a light brown background of the slice. Immediately after this the
slices were washed in 0.1% PBS again, to stop the development of background colour.
Slices were mounted on glass slides using chicken egg albumin and Vecta shield (Vector
labs, USA).
Electrophysiological recordings were performed using Multiclamp 700B amplifier
(Molecular Devices, USA) and digitization was done with Digidata 1440A analogue-digital
converter (Molecular Devices, USA), using Clampex 10 software (Molecular Devices,
USA). Data were acquired at 20 kHz, and filtered at 6 kHz using low pass bessel filter.
All the experiments were performed in the whole cell current clamp mode. Throughout the
experiment, the cells were held at a membrane potential of –60 mV by constant current
injection. The resting membrane potential (RMP) was monitored by removing the current
injection briefly every third minute and the RMP values plotted in all the figures correspond
Acc
epte
d A
rticl
e
This article is protected by copyright. All rights reserved.

7
to these measurements. The data were discarded if RMP depolarized to more than –55
mV or changed by more than 3-4 mV from the initial value. The series resistance (Rs) was
compensated throughout the experiment and monitored every third minute. The
experiments were terminated if the Rs changed by more than 20% of the initial value or
crossed 15 MΩ. The input resistance (Rin) was monitored throughout the experiment, twice
every minute, by injecting a 50 pA hyperpolarizing pulse of 500ms duration.
The proximal excitatory inputs on the subicular pyramidal neurons were stimulated by
placing an ACSF filled theta electrode at a lateral distance of 50 µm from the apical
dendrite within a radial distance of 100 µm from the soma of the recorded neuron (Fig.1A)
in the layer stratum pyramidale of the subiculum. The stimulation strength was adjusted to
evoke a monosynaptic response of 3.5-6 mV amplitude. In a subset of experiments
performed to demonstrate input specificity of synaptic plasticity, a second stimulating
electrode was placed distal to the soma and close to the apical dendrite. Both the inputs
were stimulated alternately at 0.05 Hz during baseline and test stimulations. During the
induction protocol the control input was not stimulated while the test input was paired with
a burst of bAPs at +10 ms time interval. Cross facilitation was performed to ascertain that
both the inputs were independent. For cross facilitation, both the pathways were
stimulated at a time interval of 110 ms and the ratio of the EPSP slopes was compared
with the ratio of the EPSP slopes when they were stimulated at a time interval of 20
seconds. The two pathway experiments were performed only when there was no
difference between these two ratios. A burst of action potentials was evoked at the soma
by three step depolarizing current pulses of 1.8 nA amplitude and 2 ms duration at 50 Hz,
unless stated otherwise. This is referred as ‘bAP burst’ in the text. For the first 5 minutes
the EPSPs were evoked at the rate of 0.05Hz to record baseline, then one EPSP was
paired with a bAP burst or a single action potential and this pair was repeated at the rate
of 0.1 Hz for 10 minutes to induce STDP. The time interval between the EPSP and the
bAP burst was varied in different experiments. After the pairing the synaptic strength was
tested again at a stimulation frequency of 0.05 Hz for 30 minutes. The time interval
between the EPSP and the bAP burst was defined by the time gap between the onset of
the EPSP and the peak of the bAP nearest to it. The pairing was termed ‘causal’ or
positive pairing when an EPSP was followed by the bAP burst, while it was termed ‘anti-
Acc
epte
d A
rticl
e
This article is protected by copyright. All rights reserved.

8
causal’ or negative pairing when an EPSP followed the bAP burst. In some control
experiments, pairing was replaced with only EPSPs or only bAP bursts repeated at 0.1 Hz
for 10 minutes. The pairing protocol was replaced with high frequency stimulation (HFS)
protocol in a few experiments. This protocol consisted of 4 tetanic stimuli, each of 1
second duration and 100 Hz frequency with inter-tetanus interval of 10 seconds. Paired
pulse ratio (PPR) experiments were performed by evoking two EPSPs at a time interval of
110 ms, as it was the minimum time interval that did not give rise to postsynaptic
summation. The PPR test was performed twice, both, before and after the induction
period. A minimum time gap of one minute was maintained between two consecutive PPR
tests. The PPR was calculated as (EPSP2/EPSP1), where EPSP2 and EPSP1 are the
second and first EPSP in the pair respectively.
Statistics
The EPSPs were quantified using the rising slope of initial 2 ms of the waveform. The
slopes of all the EPSPs during baseline were averaged and the slopes of all other EPSPs
following the induction were normalized with respect to this averaged value. This
normalized change in the EPSP slope was multiplied by 100 to represent the percentage
change in the EPSP slopes. The extent of plasticity was calculated by averaging the
percentage change during the last 10 minutes of the experiment. All the datasets were
tested for normal distribution using D'Agostino & Pearson omnibus normality test. To
assess the significance of plasticity induced by a particular protocol, paired t-test was used
for the datasets found to be normally distributed; otherwise, Wilcoxon matched-pairs
signed rank test (mentioned as Wilcoxon test in the text) was performed. These tests were
performed between the average EPSP slopes during the baseline and the average EPSP
slopes during the last 10 minutes of the experiments (test). The Wilcoxon signed rank test
was performed between the PPR before and after plasticity induction since the data sets
failed the normality test. Two populations were classified to be statistically different if the P
value was less than 0.05 for the comparisons where both the data sets were used only
once for statistical comparison. For comparing the extent of plasticity induction between
two different experiments, unpaired t-test or Mann-Whitney test were performed based on
the outcome of the normality test. In the cases where one dataset was used more than
once for comparison, Bonferroni-Dunn post-hoc correction for multiple comparisons was
Acc
epte
d A
rticl
e
This article is protected by copyright. All rights reserved.
9
applied and the threshold for significance was adjusted accordingly. Therefore, the P value
threshold for the data used for multiple comparisons was set to be 0.01(0.05/5) for the RF
neurons (same control dataset was used 5 times) and 0.012 (0.05/4) for the WBF neurons
(same control dataset was used 4 times). Since the ADP data were found to be normally
distributed, unpaired t-test was performed between the ADP values of WBF and RF
neurons. The Rin and RMP data did not pass the normality test; hence Mann-Whitney test
was performed for comparison between WBF vs RF, WBF vs SBF and RF vs SBF
neurons. For this comparison, the threshold significance was set to 0.025 (0.05/2) with
Bonferroni-Dunn post-hoc correction.
The following drugs were used
1,2-Bis(2-aminophenoxy)ethane-N,N,N′,N′-tetraacetic acid tetrapotassium salt (BAPTA)
10mM, Bicuculline 10µM, Sodium ascorbate 0.4 and 1 mM, Verapamil hydrochloride
50µM(all from Sigma-Aldrich, USA); Picrotoxin 10µM, DL-2-Amino-5-
Phosphonovalerate (DL-AP5) 50µM, Nifedipine 25 µM (all from Abcam, UK),(2S)-3-
[[(1S)-1-(3,4-Dichlorophenyl)ethyl]amino-2-hydroxypropyl] (phenylmethyl) phosphinic
acid hydrochloride (CGP-55845) 1 µM (Tocris Biosciences, UK), Biocytin staining kit
(Vector labs, UK).
Results
Characterisation of regular firing, weak burst firing, and strong burst firing neurons
As reported earlier (Staff et al., 2000), we found three subtypes of pyramidal neurons in
the subiculum; the regular firing (RF) neurons did not fire a burst (Fig. 1Bb), while the
weak burst firing (WBF) neurons fired a single burst of action potentials (Fig. 1 Cb) and the
strong burst firing (SBF) neurons fired multiple bursts (Fig. 1Db) in response to a 500 ms
long depolarizing current injection of 250 pA. In response to 1.8 nA depolarization for 2
ms, the RF and WBF neurons fired a single action potential (AP), while the SBF neurons
fired a single burst consisting of 2 or 3 APs at a frequency higher than 100 Hz (Figs. 1Bc,
1Cc and 1Dc respectively). Thus, the SBF neurons could never elicit a single AP, while the
WBF neurons could fire a single AP upon a short step depolarization, and consequently,
could be evoked to fire at any required frequency, unlike the SBF neurons. Hence, all the
Acc
epte
d A
rticl
e
This article is protected by copyright. All rights reserved.

10
subsequent experiments were performed on the WBF and RF neurons. The RMP of all the
reported neurons was close to –63mV with WBF neurons more depolarized compared to
the RF neurons (RF neurons, –63.6±0.3 mV, n=51; WBF neurons, –62.8±0.3 mV, n=53
and SBF neurons, –63.3±0.3, n=46; RF vs WBF, P<0.025; RF vs SBF, P=0.17; WBF vs
SBF, P=0.38; Mann-Whitney test with Bonferroni’s correction, Table 1).The Rin of the RF
neurons was highest while that of the SBF neurons was lowest among the three neuronal
subtypes (SBF neurons, 61.0±4.1MΩ, n=12; WBF neurons, 75.5±3.0 MΩ, n=52 and RF
neurons, 91.3±5.1 MΩ, n=26; SBF vs WBF, P<0.025; WBF vs RF, P<0.025 and RF vs
SBF, P<0.005; for SBF vs WBF and WBF vs RF, Mann-Whitney test and for SBF vs RF,
unpaired t-test with Bonferroni’s correction; Table 1).The WBF neurons were found to
have a higher ADP (17.6 ± 0.4 mV, n=43) than the RF neurons (13.4 ± 0.4 mV, n=36;
P<0.01, unpaired t-test, Table 1). However, the ADP could not be measured in the SBF
neurons, since the ADP amplitude crossed the action potential threshold and fired a
second spike immediately after the first, resulting in a burst of action potentials. No
significant difference was found in the sag ratio of these three types of neurons (sag ratio
for RF neurons, 0.75±0.06, n=20; WBF neurons, 0.75±0.07, n=19; SBF neurons,
0.80±0.08, n=20; SBF vs WBF, P=0.88; WFB vs RF, P=0.05 and RF vs SBF, P=0.07,
Unpaired t-test with Bonferroni’s correction; Table1), as reported earlier by Staff et al (Staff
et al., 2000).
Causal pairing of an EPSP with a bAP burst induced non-Hebbian t-LTD, while, high
frequency stimulus (HFS) induced Hebbian LTP
The subicular pyramidal neurons show diverse firing patterns, as shown in fig. 1, and
reported earlier (Staff et al., 2000). Some of them fire discrete single action potentials
(RF), while others fire in burst mode (BF). We asked, if an EPSP paired with a single
action potential in the RF and the WBF neurons can induce synaptic plasticity, as
observed in the hippocampal synapses (Bi & Poo, 1998; Buchanan & Mellor, 2010); or
would fail to induce plasticity as reported in the cortical layer V (Kampa et al., 2006), and
Schaffer collateral-CA1 synapses in the hippocampus (Pike et al., 1999). We observed
that causal pairing of an EPSP with a single bAP at a time interval of 10 ms and repeating
the pair at 0.1 Hz for 10 minutes did not elicit any synaptic plasticity in the RF (–13.4±9.2%
Acc
epte
d A
rticl
e
This article is protected by copyright. All rights reserved.

11
of baseline, n=6, P=0.38 test vs baseline, Wilcoxon test; Fig. 2A) or the WBF (3.2±7.8% of
baseline, n=8, P=0.67 test vs baseline, paired t-test, Fig. 2B) neurons. Rin and RMP were
also stable throughout the experiment (Fig. 2). Following an earlier report where a burst of
action potentials in the postsynaptic neurons was found to be essential for pairing induced
synaptic plasticity in the CA3-CA1 synapses (Pike et al., 1999), we reasoned that the
failure to observe plasticity in our case could be due to the single bAP used in the
postsynaptic neurons. Hence, we paired a single EPSP with a burst of three bAPs at 50
Hz (bAP burst) at the same time interval of +10 ms and repeated this pair as described
above. Contrary to the canonical STDP plots, where causal pairing induces LTP, such
pairing induced timing dependent LTD (t-LTD) in both, the RF (–26.2±5.3% of baseline,
n=9, P<0.01 test vs baseline, paired t-test with Bonferroni’s correction, Fig. 3A) as well as
the WBF (–36.5±5.0% of baseline, n=9, P<0.012 test vs baseline, Wilcoxon test with
Bonferroni’s correction, Fig. 3B) neurons. Since certain STDP induction protocols can also
induce plasticity of the intrinsic properties of the neurons (Moore et al., 2009; Debanne &
Poo, 2010), we monitored the Rin and RMP of the postsynaptic neuron throughout the
experiments, and these were found to be stable in both the cell types (Fig. 3). These
synapses are known to express Hebbian LTP in response to high frequency synaptic
stimulation (HFS) (Wozny et al., 2008). However, Wozny et al used 4 mM CaCl2 and
MgSO4 each in the perfusate in some of their LTP experiments, while we used much lower
concentrations of these salts (see Materials and Methods). Hence, we explored if these
synapses express HFS-induced LTP and the results indicate a robust expression of LTP in
the RF (45.5±18.5%of baseline, n=6, P<0.05, Wilcoxon test, Fig. 4A) as well as WBF
(67.8±15.3% of baseline, n=6, P<0.05, Wilcoxon test, Fig. 4B) neurons in response to
HFS. Thus, in our experimental conditions, these synapses are capable of expressing
Hebbian as well as non-Hebbian synaptic plasticity, depending upon the stimulation
protocol.
Further, we examined if sucrose containing ACSF as the dissection medium influenced the
STDP plot in favor of LTD in response to a causal pairing protocol, as observed in the rat
CA3-CA1 synapses (Edelmann & Lessmann, 2011). Sucrose was replaced with NaCl in
the dissection solution and the pairing of an EPSP with a bAP burst at +10 ms time interval
was performed. Such pairing induced robust t-LTD in the slices prepared in NaCl
Acc
epte
d A
rticl
e
This article is protected by copyright. All rights reserved.
12
containing ACSF as well (–31.7±7.9% of baseline, n=6; P<0.05 test vs baseline, Wilcoxon
test, data not shown). We used lower concentration of picrotoxin (10 µM) to block
inhibitory inputs in most of the experiments. Hence, we further confirmed our key finding of
t-LTD by causal pairing with additional block of inhibitory inputs by pairing an EPSP with a
bAP burst at a time interval of +10 ms in the presence of 10 µM bicuculline, in addition to
10 µM picrotoxin. In conditions of additional block of inhibitory transmission, induction of
tLTD was observed in both the neuronal subtypes (RF neurons, –33.7±9.1% of baseline,
n=6; WBF neurons, –23.2±5.8% of baseline, n=6, data not shown). This plasticity was
similar to that induced in the presence of picrotoxin and CGP-55485 only (in the RF
neurons, P=0.53 and in the WBF neurons, P=0.11, Mann-Whitney test with Bonferroni’s
correction). Subsequently, we tested the timing dependence of this t-LTD in the WBF
neurons by increasing the time interval between the EPSP and the burst of bAPs. We
observed that causal pairing at a time interval of +30 ms induced small t-LTD (–13.4±9.5%
of baseline, n=7, P=0.29 test vs baseline, Wilcoxon test, Fig. 8A) that was not significant.
Further, increasing the time interval to +50 ms abolished the t-LTD (–1.6±5.2% of
baseline, n=6, P=0.91, test vs baseline, Wilcoxon test, Fig. 8A).
Anti-causal pairing of an EPSP with a bAP burst induced t-LTP at a narrow time
interval in the WBF neurons
Next we asked, if these synapses also express t-LTD with anti-causal pairing as reported
earlier for excitatory synapses (Caporale & Dan, 2008; Buchanan & Mellor, 2010). This
was addressed by reversing the order of the EPSP and the bAP burst in the pair. Contrary
to the canonical Hebbian STDP plot in excitatory synapses, we observed LTP at anti-
causal pairing at a close time interval of –10 ms in the WBF neurons (37.0±10.7% of
baseline, n=7, P<0.05, test vs baseline, Wilcoxon test, Fig. 3D). Although such pairing
induced small LTP in the RF neurons as well, it was not significant (27.4±12.8%, of
baseline, n=7, P=0.11 test vs baseline, Wilcoxon test, Fig. 3C). However, in the WBF
neurons similar pairings failed to induce any plasticity at longer time intervals (–3.9 ±6.5 %
of baseline, n=7, P=0.69, test vs baseline, for–20ms; –12.6±14.8% of baseline, n=6, P=0.44
test vs baseline, for –50 ms and 2.5±7.8% of baseline, n=5, P=0.82, test vs baseline, for –
85 ms, Wilcoxon test, Fig. 8B).
Acc
epte
d A
rticl
e
This article is protected by copyright. All rights reserved.

13
The STDP plot of the paired inputs on the subicular WBF neurons showed that this
synapse behaves in a non-Hebbian manner (Fig. 8C). The amplitude of t-LTD decreased
with increasing time interval between the EPSP and the burst of action potentials (Fig. 8A
and 8C), while LTP was induced only at –10 ms anti-causal pairing (Fig. 3D, 8B and 8C).
Therefore, we observed a reverse STDP rule contrary to most of the hippocampal and
cortical excitatory synapses (Caporale & Dan, 2008). The asymmetric STDP plot was
different from earlier reports where the negative side of the STDP plot is wider than the
positive side in most of the excitatory synapses (Bi & Wang, 2002). Moreover, in the STDP
curve reported here, the plasticity was limited to the time interval of –10 ms on the
negative side, whereas on the positive side plasticity could be induced upto +30 ms. The
negative side of this STDP curve is narrower than the positive side, hence the STDP curve
is biased towards depression.
Properties of the non-Hebbian t-LTD
In the cortical layer V pyramidal neurons, Kampa et al demonstrated that EPSPs paired
with bAP bursts of higher frequencies are more potent in inducing spike timing dependent
LTP compared to an EPSP paired with a single bAP or a burst(s) of bAPs at lower
frequencies (Kampa et al., 2006). We therefore tested, if changing the frequency of action
potentials in the burst affects the non-Hebbian t-LTD. This was done by pairing an EPSP
with a burst of 3 bAPs at a higher frequency (150 Hz) instead of 50 Hz, at a time interval of
+10 ms, where the t-LTD was most prominent. We found that both, the RF (–24.6 ±8.7%
of baseline, n=6; Fig. 5A) and the WBF (–36.8% ±7.7 of baseline, n=6, Fig. 5B) neurons
showed t-LTD. Further, this t-LTD was similar to that obtained with an EPSP paired with a
50 Hz bAP burst (Pairing with 50 Hz bAP burst vs. Pairing with 150 Hz bAP burst; P=0.70
for RF neurons and P=0.98 for WBF neurons, Mann Whitney test with Bonferroni’s
correction). Our results, along with previous findings (Pike et al., 1999; Kampa et al.,
2006), suggest that an EPSP paired with a single bAP may fail to induce timing dependent
plasticity in a system where pairing with a burst of bAPs can induce plasticity. However,
we failed to observe any t-LTP by causal pairing with a burst of bAPs at a higher
frequency in the subicular pyramidal neurons.
Acc
epte
d A
rticl
e
This article is protected by copyright. All rights reserved.

14
The non-Hebbian t-LTD observed here requires both, the pre- and the post synaptic
activities, as reported earlier in the rat cortical layer II/III and layer V synapses (Birtoli &
Ulrich, 2004). In the absence of either of these activities, this phenomenon was not
observed in both the neuronal subtypes. Repetition of bAP bursts at 0.1 Hz alone, or
repetition of only EPSPs at 0.1 Hz for 10 minutes did not induce any plasticity in the RF
neurons (4.7±14.0% of baseline, n=7, P=0.89 test vs baseline, paired t-test for repeated
bursts of bAPs and –1.0±8.8% of baseline, n=8, P=0.69 test vs baseline for EPSPs,
Wilcoxon test; Fig. 6A) and the WBF neurons (–5.0±5.8% of baseline, n=6, P=0.56 test vs
baseline, Wilcoxon test, for repeated bursts of bAPs and 0.6±9.6%of baseline, n=7,
P=0.94 test vs baseline for EPSPs, Wilcoxon test; Fig. 6B).
Next, we tested if the t-LTD was input specific. This was experimentally verified by
stimulating two independent inputs on the same postsynaptic neuron. While, only one of
the inputs was paired with the bAP burst (test pathway); the other was silent during the
pairing and acted as the control pathway. In the RF neurons, only the test pathway
showed t-LTD (–26.0±6.9% of baseline, n=9, P<0.05 test vs baseline, paired t-test), while
the control pathway was unaffected (–1.0±9.4% of baseline, n=9, P=0.52 test vs baseline,
paired t-test; Fig. 7A). Similarly, the t-LTD in the WBF neurons was also specific to the
paired pathway (–28.2±3.5% of baseline, n=7, P<0.05 test vs baseline, Wilcoxon test),
while the control pathway did not express any plasticity (–2.8±3.0% of baseline, n=7, P=
0.30 test vs baseline, Wilcoxon test; Fig. 7B). This confirmed that the t-LTD is specific to
the inputs paired with the bAP burst in both the neuronal subtypes.
LTD is post synaptic in the WBF neurons, while presynaptic in the RF neurons
An earlier report suggests that in the subiculum the site of induction of synaptic plasticity
can be either pre-or postsynaptic depending on the involvement of the postsynaptic
neuronal subtype (Wozny et al., 2008). The involvement of the postsynaptic neuron in
synaptic plasticity is associated with changes in intracellular calcium and its chelation
leads to loss of plasticity. We included 10 mM BAPTA in the patch pipette to chelate
calcium in the postsynaptic neuron, and paired an EPSP with a bAP burst at the time
interval of +10 ms. The t-LTD was blocked in the WBF neurons (–3.9±8.9% of baseline,
n=7, P=0.94 test vs baseline, Wilcoxon test; Fig.9B), whereas the extent of plasticity did
Acc
epte
d A
rticl
e
This article is protected by copyright. All rights reserved.

15
not change in the RF neurons (control –26.2±5.3% of baseline, n=9; with BAPTA –
40.0±9.7% of baseline, n=7, P=0.21 Mann Whitney test for control vs BAPTA with
Bonferroni’s correction; Fig. 9A). Additionally, we performed paired pulse ratio (PPR)
analysis in both the neuronal subtypes, as it indicates the change in release probability. A
change in PPR after the induction protocol suggests that the plasticity involves presynaptic
rather than postsynaptic mechanisms (Schulz et al., 1994). Since we did not observe any
difference in the plasticity phenomenon between experiments performed in ACSF
containing picrotoxin and ACSF containing picrotoxin+bicuculline, we pooled the PPR data
from both these experiments. We observed increase in PPR due to induction of t-LTD in
the RF neurons (1.4±0.1, before pairing and 1.8±0.1 after pairing, n=14; P<0.01, Wilcoxon
test; Fig. 9C1), while it remained unchanged in the WBF neurons (1.6±0.1 before pairing
and 1.7±0.1 after pairing, n=17, P=0.46, paired t-test; Fig. 9C2). The intracellular BAPTA
experiments suggest that the induction of spike-timing dependent LTD does not require
postsynaptic calcium in the RF neurons, while postsynaptic calcium is required for LTD
induction in the WBF neurons. The PPR experiments indicate that t-LTD is expressed via
some presynaptic mechanism in the RF neurons while postsynaptic mechanisms are
involved in the WBF neurons. These results are contrary to the HFS induced LTP, where
induction and expression of LTP is presynaptic in bursting, while postsynaptic in regular
firing subicular neurons (Wozny et al., 2008).
t-LTD is NMDAR dependent in the WBF neurons, while L-type calcium channel
dependent in the RF neurons
Neurons mobilize calcium from different sources during the induction of synaptic plasticity.
The most common source of calcium is through NMDA receptors due to their dependence
on glutamate binding, modulation by voltage, and calcium permeability (Bliss &
Collingridge, 1993). The importance of Ca2+ mobilization through NMDA receptors in the
RF and WBF neurons was tested by inducing t-LTD with causal pairing at +10 ms time
interval in the presence of the NMDA receptor blocker, DL-AP5 (50µM) in the bath
solution. In the WBF neurons, blocking NMDA receptors abolished t-LTD (–7.7±8.6% of
baseline, n=8, P=0.42 test vs baseline, paired t-test; Fig. 10B), while in the RF neurons
Acc
epte
d A
rticl
e
This article is protected by copyright. All rights reserved.
16
DL-AP5 did not affect the t-LTD (control –26.2±5.3%, n=9; with DL-AP5 –27.5±5.2%, n=7,
P=0.99 Mann Whitney test for control vs DL-AP5 with Bonferroni’s correction; Fig. 10A).
Another source of calcium mobilization is through L-type calcium channels, due to their
voltage dependency and calcium permeability. Their involvement in synaptic plasticity has
been documented in the hippocampus and amygdala (Huang & Malenka, 1993; Kapur et
al., 1998; Weisskopf et al., 1999). The involvement of the L-type calcium channels in the t-
LTD of RF and WBF neurons was tested with the L-type calcium channel blocker
Nifedipine (25µM) in the bath solution. Nifedipine in the bath solution did not affect t-LTD in
the WBF neurons (control –36.5±5.0%, n=9; with nifedipine –34.6±8.0%, n=6, P=0.99,
Mann Whitney test for control vs nifedipine with Bonferroni’s correction; Fig. 11B), while it
blocked the t-LTD in the RF neurons (2.5±3.9% of baseline, n=9, P=0.47 test vs baseline,
paired t-test; Fig. 11A). This observation was further confirmed by using another L-type
calcium channel blocker verapamil hydrochloride (50 µM) in the bath solution (Bauer et al.,
2002; Fourcaudot et al., 2009), which was effective in blocking the t-LTD in the RF
neurons (–4.2±4.1% of baseline, n=6, P=0.44 test vs baseline, Wilcoxon test; Fig. 11A).
Discussion
In the present study, we have demonstrated that near coincident activity of proximal
excitatory inputs on the subicular pyramidal neurons and action potentials in the post
synaptic neuron induces synaptic plasticity. The amplitude and direction of this plasticity is
determined by the order and time interval between the two activities. This was studied in
detail in the WBF neurons and the results were used to generate the STDP plot. The
STDP curve was non-Hebbian, as it showed LTD at causal and LTP at anti-causal
pairings; and was biased towards depression, as it showed t-LTD for a wider time interval
between the EPSP and the bAP burst (Fig. 8). Similar inputs on the RF neurons also
induced non-Hebbian t-LTD with causal pairing of an EPSP and a bAP burst. In both the
neuronal subtypes, the non-Hebbian t-LTD was specific to the synaptic input that was
paired with the bAP burst (Fig. 7). Interestingly, the HFS to similar inputs induced LTP in
both the neuronal subtypes (Fig. 4), confirming the previous observations of Wozny et al
(Wozny et al., 2008). Although causal pairing induced t-LTD in both the neuronal
Acc
epte
d A
rticl
e
This article is protected by copyright. All rights reserved.

17
subtypes, the mechanism associated with the induction of plasticity was different in these
neurons. In the case of WBF neurons, t-LTD was induced postsynaptically and required
calcium influx through the NMDA receptors (Figs. 9 and 10), while t-LTD was induced and
maintained presynaptically in the RF neurons and required the activation of L-type calcium
channels (Figs. 9 and 11). Such mechanistic differences in synaptic plasticity between two
different cell types in the rat subiculum have been reported previously for HFS induced
LTP (Wozny et al., 2008). Though the involvement of L-type calcium channels in
presynaptic plasticity has been reported in the amygdala earlier (Fourcaudot et al., 2009),
to the best of our knowledge the present report is the first of its kind in the hippocampus.
Comparison of the STDP plot in the subiculum with other synapses
Contrary to the canonical STDP plots in the excitatory synapses, wherein causal pairing
induces t-LTP and anti-causal pairing t-LTD (Caporale & Dan, 2008), causal pairing
induced t-LTD in the proximal excitatory inputs on the WBF and RF neurons in the
subiculum. While at many synapses, pairing an EPSP with a single bAP induces STDP,
pairing with a single bAP failed to induce plasticity at the proximal synapses on the
subicular WBF and RF neurons (Fig. 2); however, when paired with a burst of bAPs, it
induced plasticity (Figs. 3 and 5). Similar observations have been reported previously in
the hippocampus (Pike et al., 1999) and the cortex (Kampa et al., 2006). The burst of
bAPs may be more efficient than a single bAP in overcoming the dendritic filtering to
invade the dendritic arborization and depolarize the dendrites (Lisman, 1997). Indeed, in
the rat cortical pyramidal neurons, while pairing a single bAP with an EPSP failed to open
synaptic NMDARs, pairing a burst of bAPs with an EPSP caused significant activation of
synaptic NMDARs (Kampa et al., 2006). The frequency of APs in the bAP burst also
appears to be critical in inducing plasticity at certain synapses. For example, t-LTD at
acausal pairing is limited to lower frequency of action potentials in the bAP burst at the
synapses between layer V cortical pyramidal neurons in the rat visual cortex (Sjöström et
al., 2001). However, both the WBF and the RF neurons showed t-LTD upon pairing an
EPSP with both low (50 Hz), and high (150 Hz) frequency action potential burst (Fig. 3 and
5). Inhibitory activity in the network can influence the plasticity induction rules (Meredith et
al., 2003). The induction of robust t-LTD at +10 ms time interval in both the subtypes of
Acc
epte
d A
rticl
e
This article is protected by copyright. All rights reserved.

18
neurons in the presence of bicuculline, picrotoxin and CGP-55845 that blocks inhibitory
transmission suggests that the non-Hebbian plasticity observed in the present study was
not due to the influence of inhibitory activity. In an earlier study, presence of sucrose has
been demonstrated to restrain pairing induced LTP induction in the CA1 pyramidal
neurons (Edelmann & Lessmann, 2011). However, in our study, removing sucrose from
the dissection solution did not change the direction of plasticity.
There is ample diversity in the STDP plots in the hippocampus (Buchanan & Mellor, 2010);
wherein causal pairing induces LTP (Magee & Johnston, 1997; Debanne et al., 1998; Bi &
Poo, 2001; Astori et al., 2010), no plasticity (Pike et al., 1999) or even LTD (Christie et al.,
1996). There are also reports from the somatosensory cortex, where causal pairing
induces LTD (Egger et al., 1999; Birtoli & Ulrich, 2004; Letzkus et al., 2006; Shindou et al.,
2011). Such causal pairing induced non-Hebbian t-LTD observed here in the CA1-
subiculum synapses has also been reported in the distal synapses of layer II/III pyramidal
neurons on the layer V pyramidal neurons in the rat somatosensory cortex (Letzkus et al.,
2006), spiny stellate neurons in the layer IV of barrel cortex of young rats (Egger et al.,
1999), and cerebellum like structure of a weakly electric fish (Bell et al., 1997). Whereas,
Bell et al (Bell et al., 1997) observed LTP by anti-causal pairing, Egger et al observed LTD
by both, causal as well as anti-causal near coincident pairings (Egger et al., 1999). In the
study by Letzkus et al (2006) causal pairing caused LTD at the distal synapses and LTP in
the proximal synapses, while anti-causal pairing caused LTD at the proximal synapses
and LTP at the distal inputs (Letzkus et al., 2006). Various factors such as dendritic
location of synaptic inputs, calcium dynamics, and neuromodulators have been attributed
to such non-Hebbian STDP in different synapses (Kampa et al., 2007; Froemke et al.,
2010).
By repetitive pairing of an EPSP with a bAP burst, Birtoli and Ulrich have reported ‘LTD
only’ STDP plot in the layer V of rat somatosensory cortex (Birtoli & Ulrich, 2004).
However, our STDP plot primarily showed LTP with anti-causal pairing. They also reported
LTP induction by repeated pairing of an EPSP with a single bAP, which failed to induce
any plasticity in our system (Fig. 2). In a later study by the same group, cellular
mechanisms of causal pairing induced LTD were described in the neocortical pyramidal
neurons (Czarnecki et al., 2007), where t-LTD was found to be mGluR mediated and
Acc
epte
d A
rticl
e
This article is protected by copyright. All rights reserved.

19
abolished by buffering postsynaptic calcium. However, in our study t-LTD was
postsynaptic calcium mediated and required NMDAR activation in the subicular WBF
neurons (Figs. 9 and 10) while in the RF subicular neurons, a postsynaptic calcium
independent role of the L-type calcium channels was found to be important in the induction
of t-LTD (Figs. 9 and 11). Unlike the typical asymmetric STDP curves where positive side
of the curve (causal pairing) is narrower than the negative side (anti-causal pairing), in the
subicular synapses the positive side of STDP curve is broader than the negative side (Fig.
8). Along with several other reports (Sjöström et al., 2001; Rumsey & Abbott, 2004;
Wittenberg & Wang, 2006), our finding also endorses the view that timing rules for the
STDP are malleable, and may vary from synapse to synapse.
The atypical STDP plot of the proximal excitatory synapses on the WBF and RF subicular
pyramidal neurons is rather intriguing, and may have to do with their intrinsic properties
like ADP (Karmarkar et al., 2002) and sag ratio (van Welie et al., 2006) that affect
coincidence detection and synaptic integration respectively. Another factor that can
influence STDP and has not been studied in the subicular pyramidal neurons is the
distribution and kinetics of the potassium channels (Zhou et al., 2005). The STDP plot
reported here resembles the STDP plot reported on the distal inputs of the cortical
neurons (Letzkus et al., 2006; Kampa et al., 2007). It appears that the proximal dendrites
of the subicular pyramidal neurons behave like distal dendrites of the cortical neurons. In
summary, the non-Hebbian t-LTD biased STDP plot observed in the present study can
either be attributed to certain peculiar intrinsic properties of the subicular pyramidal
neurons or the induction protocol itself.
Mechanistic differences in the t-LTD between the two different types of subicular
neurons
The results of experiments with intracellular BAPTA (Fig. 9) indicate that induction of t-LTD
is postsynaptic in the WBF neurons, while pre- synaptic in the RF neurons. Our
observations related to the site of origin of plasticity are different from the HFS induced
LTP reported earlier (Wozny et al., 2008). While HFS induced LTP was presynaptic in the
burst firing neurons and postsynaptic in the RF neurons, our results suggest that the
pairing induced t-LTD is presynaptic in the RF neurons and postsynaptic in the BF
neurons.
Acc
epte
d A
rticl
e
This article is protected by copyright. All rights reserved.

20
One of the puzzling findings was the resistance of t-LTD to intracellular loading of BAPTA
in the RF neurons. Since the synaptic plasticity is expressed by change in presynaptic
release probability and it requires near coincident activation of pre- and postsynaptic
neurons, we believe some kind of retrograde messenger is involved during the repeated
coincident activations that is different from the basket of known mechanisms. Possible role
of K+ as a retrograde messenger in presynaptic plasticity has been suggested previously
(Sastry et al., 1986; Matyushkin et al., 1995). An earlier report by Poolos et al (Poolos et
al., 1987) showed that repetitive stimulation of Schaffer collaterals cause considerable rise
in extracellular K+ in the rat CA1 stratum radiatum. Recently, K+ released from
postsynaptic neurons due to synaptic activation has been shown to influence presynaptic
activity by working as a retrograde messenger (Shih et al., 2013). Bursts of action
potentials can cause considerable changes in the extracellular K+ due to the limited
volume of the interstitial space and low baseline levels of extracellular K+ (Kume-Kick et
al., 2002). Similar rise in extracellular K+ can be expected around the presynaptic terminal
while evoking the EPSCs and the bAP burst that together would result in increase in
extracellular K+ in the synaptic cleft resulting in strong depolarization of the presynaptic
terminals. Further depolarization can occur due to the accumulated intracellular calcium
during presynaptic activity that occurs 10 ms before the bAP burst. Earlier, an increase in
extracellular K+ due to postsynaptic activity was shown to modify presynaptic activity
(Malenka et al., 1981). Depression of glutamatergic synaptic release due to strong
depolarization by high extracellular K+ has also been demonstrated in dissociated
hippocampal neuronal cultures (Moulder et al., 2006). Such changes in the presynaptic
depolarization during plasticity induction period in our experiments may be involved in the
expression of t-LTD through presynaptic changes in protein phosphorylation/synthesis
(Collingridge et al., 2010). However, we cannot exclude the possible involvement of some
other retrograde messenger(s) that does not require postsynaptic calcium for its release
(Ramikie et al., 2014).
The source of calcium for t-LTD induction is also different in these two types of neurons. In
the WBF neurons, NMDA receptors provide the calcium required by the postsynaptic
neurons (Fig. 10) whereas for the RF neurons, the source of calcium is L-type calcium
channels (Fig. 11). This observation suggests that there are mechanistic differences
Acc
epte
d A
rticl
e
This article is protected by copyright. All rights reserved.

21
between the LTD induced by low frequency stimulation (LFS) and pairing of an EPSP with
a burst of bAPs. LFS induced LTD has been demonstrated to be NMDA receptor
dependent in both the neuronal subtypes (Fidzinski et al., 2008). However, Li et al
observed subicular LTD to be dependent upon mACh receptors, when induced by pairing
EPSPs with postsynaptic depolarization (Li et al., 2005). HFS induced LTP is also NMDA
receptor dependent in both the neuronal subtypes (Wozny et al., 2008), although Kokaia
(Kokaia, 2000) observed HFS induced LTP to be NMDAR independent and
presynaptically induced in the mice subiculum. These reports suggest substantial diversity
in the mechanisms of synaptic plasticity in the subiculum depending on the induction
protocols and neuronal subtypes. While L-type calcium channels have been associated
with postsynaptic plasticity (Huang & Malenka, 1993; Kapur et al., 1998), we show the
blockade of postsynaptic calcium independent t-LTD with L-type calcium channel blockers
(Fig. 11) that has not been reported earlier in the STDP literature. Experimental evidences
of the role of L-type calcium channels in plasticity of the CA1-subiculum synapse are
scant. Shor et al (Shor et al., 2009) have reported bi-directional modulation of synaptic
plasticity by the L-type calcium channels that is dependent on the type of postsynaptic
neuron involved. In their study, blocking the L-type calcium channels with nifedipine
resulted in the conversion of LTD into LTP in the burst firing neurons, and LTP into LTD in
the RF neurons. However, the location of the L-type calcium channels in the pre-or post
synaptic sites contributing to the plasticity changes were not discussed in their work. Few
reports suggest the involvement of L-type calcium channels in presynaptic plasticity in
other brain areas like the amygdala (Fourcaudot et al., 2009) In the mossy-fiber synapses,
the L-type calcium channels have been found to play a role in synaptic facilitation and
presynaptic LTP under certain conditions (Lauri et al., 2003). In the Schaffer collateral-
CA1 synapses in the rat hippocampus, LTP induced by short depolarization steps in the
presence of high concentration of extracellular calcium was found to be induced
presynaptically and sensitive to L-type calcium channel block (Hendricson et al., 2003),
although their study relied only on the analysis of mEPSCs. In a recent study, the role of L-
type calcium channels in the presynaptic mossy fiber LTP was proposed (Nistico et al.,
2011). The L-type calcium channels have been found to be expressed at the distal axons
of the CA1 pyramidal neurons (Tippens et al., 2008) that synapse on the subicular
Acc
epte
d A
rticl
e
This article is protected by copyright. All rights reserved.

22
pyramidal neurons. These studies however, do not specify the subicular neuronal
subtypes on which the CA1 axon terminals synapse and it is difficult to generalize this
observation to our findings. The L-type calcium channels were found to be specifically
important in the induction of plasticity only in the RF neurons of the subiculum, and not in
the WBF neurons.
Functional implications of non-Hebbian STDP in the subicular excitatory synapses
The kind of STDP curve observed here may have an important role in modulating the
hippocampal output since the subiculum projects to many cortical and sub cortical regions,
thus acting as a bridge between the hippocampus proper- CA1 in particular- and the EC
(O'Mara, 2005). The subiculum has been implicated in memory formation, particularly in
the memory for temporal order and novelty detection (Potvin et al., 2010), and contextual
exploration (Chang & Huerta, 2012). Most of the theories related to memory formation and
hippocampus argue for a hippocampal and cortical interface that transforms the short term
temporary memory traces into long term permanent memories (Rolls, 1996; Nadel &
Moscovitch, 1997), and anatomically the subiculum is perfectly placed for such a role.
Hippocampal LTD has been found to be associated with novelty acquisition (Manahan-
Vaughan & Braunewell, 1999), and necessary for spatial memory consolidation (Ge et al.,
2010) indicating that the non-Hebbian STDP phenomenon in the subiculum may play a
pivotal role in the process of learning and memory formation. The subiculum shows higher
theta-gamma coherence with the area CA1 during contextual exploration (Chang &
Huerta, 2012), leading to strengthening of these synapses due to heightened Hebbian
LTP. The reversed STDP curve observed in our study may decelerate the synapse
saturation and adjust the synaptic strength such that it does not reach the extremes of the
BCM curve and change the plasticity thresholds drastically (Stanton, 1996). For high
frequency (50 Hz) synaptic inputs, the subicular BF neurons have different temporal
integration properties than the RF neurons, owing to different levels of Ih expression (van
Welie et al., 2006). STDP has also been demonstrated to influence dendritic integration
properties of a neuron locally (Campanac & Debanne, 2008). According to the cable
theory, the proximal synaptic inputs have an advantage over the distal synapses in terms
of their efficacy to elicit an action potential at the soma. Therefore, decreasing their
synaptic strength with a reverse STDP rule can establish dendritic democracy (Rumsey &
Acc
epte
d A
rticl
e
This article is protected by copyright. All rights reserved.

23
Abbott, 2006). Reverse STDP rule can also reduce the probability of an action potential
firing by the postsynaptic cell in response to presynaptic neuronal activity (Rumsey &
Abbott, 2006). This was demonstrated previously in a pair of spiny stellate neurons,
wherein presynaptic action potentials failed to generate postsynaptic action potential after
the induction of reverse STDP (Egger et al., 1999). Using computer simulations, Rumsey
and Abbott have predicted that a larger area under the curve for LTD in the non-Hebbian
STDP plot would buffer the postsynaptic neuron from excessive firing (Rumsey & Abbott,
2004). Since, majority of the excitatory neurons in the subiculum are intrinsically bursting
in nature (Staff et al., 2000), it is important to have a mechanism to buffer the excessive
firing in these neurons and reduce the spread of hyperexcitability. The major route for the
spread of epileptiform activity from the hippocampus to the cortical areas like the
amygdala is through the subiculum (Stoop & Pralong, 2000). This observation becomes
more relevant in the hyperactive networks seen in epileptic conditions, where such
pairings and HFS like scenario may exist together. Thus, reverse STDP may decrease the
probability of postsynaptic neuronal spiking and thus filter the hyperactivity of the
hippocampus from invading the entorhinal cortex and other areas. However, it is not clear
if such a reverse STDP phenomenon exists under hyperactive network conditions.
In conclusion, we demonstrate an STDP plot in the proximal excitatory synaptic inputs on
the subicular excitatory neurons that shows LTD with causal and LTP with anti-causal
pairing. This t-LTD uses different calcium sources in different subtypes of postsynaptic
neurons. In the RF neurons, the t-LTD is mediated through L-type calcium channels and is
resistant to calcium chelation in the postsynaptic neuron. Whereas in the WBF neurons,
calcium increase in the postsynaptic neuron is required along with the activation of NMDA
receptors.
Author contribution
A.P. performed the experiments and analysed the data. A.P. and S.K.S. designed the experiments, interpreted the data and wrote the manuscript.
Additional information Authors declare that they have no conflict of competing interest.
Acc
epte
d A
rticl
e
This article is protected by copyright. All rights reserved.

24
A.P. was supported by research fellowships from CSIR, India. The research was partly supported by funds
from the DBT-IISc Partnership program for Advanced Research in Biological Sciences and Bioengineering
(DBT/BF/PRIns/2011-12/IISc).
References
Andersen P. (2007). The hippocampus book. Oxford University Press, USA.
Astori S, Pawlak V & Kohr G. (2010). Spike-timing-dependent plasticity in hippocampal CA3 neurons. J Physiol 588, 4475-4488.
Bauer EP, Schafe GE & LeDoux JE. (2002). NMDA receptors and L-type voltage-gated calcium channels contribute to long-term potentiation and different components of fear memory formation in the lateral amygdala. J Neurosci 22, 5239-5249.
Bell CC, Han VZ, Sugawara Y & Grant K. (1997). Synaptic plasticity in a cerebellum-like structure depends on temporal order. Nature 387, 278-281.
Bi G & Poo M. (2001). Synaptic modification by correlated activity: Hebb's postulate revisited. Annu Rev Neurosci 24, 139-166.
Bi GQ & Poo MM. (1998). Synaptic modifications in cultured hippocampal neurons: dependence on spike timing, synaptic strength, and postsynaptic cell type. J Neurosci 18, 10464-10472.
Bi GQ & Wang HX. (2002). Temporal asymmetry in spike timing-dependent synaptic plasticity. Physiol Behav 77, 551-555.
Birtoli B & Ulrich D. (2004). Firing mode-dependent synaptic plasticity in rat neocortical pyramidal neurons. J Neurosci 24, 4935-4940.
Bliss TV & Collingridge GL. (1993). A synaptic model of memory: long-term potentiation in the hippocampus. Nature 361, 31-39.
Buchanan KA & Mellor JR. (2010). The activity requirements for spike timing-dependent plasticity in the hippocampus. Front Synaptic Neurosci 2, 11.
Campanac E & Debanne D. (2008). Spike timing-dependent plasticity: a learning rule for dendritic integration in rat CA1 pyramidal neurons. J Physiol 586, 779-793.
Canteras NS & Swanson LW. (1992). Projections of the ventral subiculum to the amygdala, septum, and hypothalamus: a PHAL anterograde tract-tracing study in the rat. J Comp Neurol 324, 180-194.
Caporale N & Dan Y. (2008). Spike timing-dependent plasticity: a Hebbian learning rule. Annu Rev Neurosci 31, 25-46.
Acc
epte
d A
rticl
e
This article is protected by copyright. All rights reserved.

25
Chang EH & Huerta PT. (2012). Neurophysiological correlates of object recognition in the dorsal subiculum. Front Behav Neurosci 6, 46.
Christie BR, Magee JC & Johnston D. (1996). The role of dendritic action potentials and Ca2+ influx in the induction of homosynaptic long-term depression in hippocampal CA1 pyramidal neurons. Learn Memory 3, 160-169.
Collingridge GL, Peineau S, Howland JG & Wang YT. (2010). Long-term depression in the CNS. Nat Rev Neurosci 11, 459-473.
Czarnecki A, Birtoli B & Ulrich D. (2007). Cellular mechanisms of burst firing-mediated long-term depression in rat neocortical pyramidal cells. J Physiol 578, 471-479.
Dan Y & Poo MM. (2006). Spike timing-dependent plasticity: from synapse to perception. Physiol Rev 86, 1033-1048.
Deadwyler SA & Hampson RE. (2004). Differential but complementary mnemonic functions of the hippocampus and subiculum. Neuron 42, 465-476.
Debanne D, Gahwiler BH & Thompson SM. (1998). Long-term synaptic plasticity between pairs of individual CA3 pyramidal cells in rat hippocampal slice cultures. J Physiol 507 ( Pt 1), 237-247.
Debanne D & Poo MM. (2010). Spike-timing dependent plasticity beyond synapse - pre- and post-synaptic plasticity of intrinsic neuronal excitability. Front Synaptic Neurosci 2, 21.
Dudek SM & Bear MF. (1992). Homosynaptic long-term depression in area CA1 of hippocampus and effects of N-methyl-D-aspartate receptor blockade. Proc Natl Acad Sci U S A 89, 4363-4367.
Edelmann E & Lessmann V. (2011). Dopamine Modulates Spike Timing-Dependent Plasticity and Action Potential Properties in CA1 Pyramidal Neurons of Acute Rat Hippocampal Slices. Front Synaptic Neurosci 3, 6.
Egger V, Feldmeyer D & Sakmann B. (1999). Coincidence detection and changes of synaptic efficacy in spiny stellate neurons in rat barrel cortex. Nat Neurosci 2, 1098-1105.
Fidzinski P, Shor O & Behr J. (2008). Target-cell-specific bidirectional synaptic plasticity at hippocampal output synapses. Eur J Neurosci 27, 1111-1118.
Fourcaudot E, Gambino F, Casassus G, Poulain B, Humeau Y & Luthi A. (2009). L-type voltage-dependent Ca(2+) channels mediate expression of presynaptic LTP in amygdala. Nat Neurosci 12, 1093-1095.
Froemke RC, Letzkus JJ, Kampa BM, Hang GB & Stuart GJ. (2010). Dendritic synapse location and neocortical spike-timing-dependent plasticity. Front Synaptic Neurosci 2, 29.
Acc
epte
d A
rticl
e
This article is protected by copyright. All rights reserved.

26
Galani R, Coutureau E & Kelche C. (1998). Effects of enriched postoperative housing conditions on spatial memory deficits in rats with selective lesions of either the hippocampus, subiculum or entorhinal cortex. Restor Neurol Neurosci 13, 173-184.
Ge Y, Dong Z, Bagot RC, Howland JG, Phillips AG, Wong TP & Wang YT. (2010). Hippocampal long-term depression is required for the consolidation of spatial memory. Proc Natl Acad Sci U S A 107, 16697-16702.
Hebb DO (1949). The Organization of Behavior. Wiley, New York.
Hendricson AW, Thomas MP, Lippmann MJ & Morrisett RA. (2003). Suppression of L-type voltage-gated calcium channel-dependent synaptic plasticity by ethanol: analysis of miniature synaptic currents and dendritic calcium transients. J Pharmacol Exp Ther 307, 550-558.
Huang YY & Malenka RC. (1993). Examination of TEA-induced synaptic enhancement in area CA1 of the hippocampus: the role of voltage-dependent Ca2+ channels in the induction of LTP. J Neurosci 13, 568-576.
Jackson J, Goutagny R & Williams S. (2011). Fast and slow gamma rhythms are intrinsically and independently generated in the subiculum. J Neurosci 31, 12104-12117.
Johnston D, Christie BR, Frick A, Gray R, Hoffman DA, Schexnayder LK, Watanabe S & Yuan LL. (2003). Active dendrites, potassium channels and synaptic plasticity. Philos Trans R Soc Lond B Biol Sci 358, 667-674.
Kampa BM, Clements J, Jonas P & Stuart GJ. (2004). Kinetics of Mg2+ unblock of NMDA receptors: implications for spike-timing dependent synaptic plasticity. J Physiol 556, 337-345.
Kampa BM, Letzkus JJ & Stuart GJ. (2006). Requirement of dendritic calcium spikes for induction of spike-timing-dependent synaptic plasticity. J Physiol 574, 283-290.
Kampa BM, Letzkus JJ & Stuart GJ. (2007). Dendritic mechanisms controlling spike-timing-dependent synaptic plasticity. Trends Neurosci 30, 456-463.
Kapur A, Yeckel MF, Gray R & Johnston D. (1998). L-Type calcium channels are required for one form of hippocampal mossy fiber LTP. J Neurophysiol 79, 2181-2190.
Karmarkar UR, Najarian MT & Buonomano DV. (2002). Mechanisms and significance of spike-timing dependent plasticity. Biol Cybern 87, 373-382.
Kokaia M. (2000). Long-term potentiation of single subicular neurons in mice. Hippocampus 10, 684-692.
Acc
epte
d A
rticl
e
This article is protected by copyright. All rights reserved.

27
Kume-Kick J, Mazel T, Vorisek I, Hrabetova S, Tao L & Nicholson C. (2002). Independence of extracellular tortuosity and volume fraction during osmotic challenge in rat neocortex. J Physiol 542, 515-527.
Lauri SE, Bortolotto ZA, Nistico R, Bleakman D, Ornstein PL, Lodge D, Isaac JT & Collingridge GL. (2003). A role for Ca2+ stores in kainate receptor-dependent synaptic facilitation and LTP at mossy fiber synapses in the hippocampus. Neuron 39, 327-341.
Letzkus JJ, Kampa BM & Stuart GJ. (2006). Learning rules for spike timing-dependent plasticity depend on dendritic synapse location. J Neurosci 26, 10420-10429.
Li H, Zhang J, Xiong W, Xu T, Cao J & Xu L. (2005). Long-term depression in rat CA1-subicular synapses depends on the G-protein coupled mACh receptors. Neurosci Res 52, 287-294.
Lisman JE. (1997). Bursts as a unit of neural information: making unreliable synapses reliable. Trends Neurosci 20, 38-43.
Magee JC & Johnston D. (1997). A synaptically controlled, associative signal for Hebbian plasticity in hippocampal neurons. Science 275, 209-213.
Malenka RC, Kocsis JD, Ransom BR & Waxman SG. (1981). Modulation of parallel fiber excitability by postsynaptically mediated changes in extracellular potassium. Science 214, 339-341.
Manahan-Vaughan D & Braunewell KH. (1999). Novelty acquisition is associated with induction of hippocampal long-term depression. Proc Natl Acad Sci U S A 96, 8739-8744.
Martin SJ, Grimwood PD & Morris RG. (2000). Synaptic plasticity and memory: an evaluation of the hypothesis. Annu Rev Neurosci 23, 649-711.
Matyushkin DP, Krivoi, II & Drabkina TM. (1995). Synaptic feed-backs mediated by potassium ions. General Physiology and Biophysics 14, 369-381.
Meredith RM, Floyer-Lea AM & Paulsen O. (2003). Maturation of long-term potentiation induction rules in rodent hippocampus: role of GABAergic inhibition. J Neurosci 23, 11142-11146.
Moore SJ, Cooper DC & Spruston N. (2009). Plasticity of burst firing induced by synergistic activation of metabotropic glutamate and acetylcholine receptors. Neuron 61, 287-300.
Morris RG, Schenk F, Tweedie F & Jarrard LE. (1990). Ibotenate Lesions of Hippocampus and/or Subiculum: Dissociating Components of Allocentric Spatial Learning. Eur J Neurosci 2, 1016-1028.
Moulder KL, Jiang X, Taylor AA, Olney JW & Mennerick S. (2006). Physiological activity depresses synaptic function through an effect on vesicle priming. J Neurosci 26, 6618-6626.
Acc
epte
d A
rticl
e
This article is protected by copyright. All rights reserved.

28
Nadel L & Moscovitch M. (1997). Memory consolidation, retrograde amnesia and the hippocampal complex. Curr Opin Neurobiol 7, 217-227.
Nicoll RA & Schmitz D. (2005). Synaptic plasticity at hippocampal mossy fibre synapses. Nat Rev Neurosci 6, 863-876.
Nistico R, Dargan SL, Amici M, Collingridge GL & Bortolotto ZA. (2011). Synergistic interactions between kainate and mGlu receptors regulate bouton Ca signalling and mossy fibre LTP. Sci Rep 1, 103.
O'Mara S. (2005). The subiculum: what it does, what it might do, and what neuroanatomy has yet to tell us. J Anat 207, 271-282.
Pike FG, Meredith RM, Olding AW & Paulsen O. (1999). Rapid report: postsynaptic bursting is essential for 'Hebbian' induction of associative long-term potentiation at excitatory synapses in rat hippocampus. J Physiol 518 ( Pt 2), 571-576.
Poolos NP, Mauk MD & Kocsis JD. (1987). Activity-evoked increases in extracellular potassium modulate presynaptic excitability in the CA1 region of the hippocampus. J Neurophysiol 58, 404-416.
Potvin O, Lemay F, Dion M, Corado G, Dore FY & Goulet S. (2010). Contribution of the dorsal subiculum to memory for temporal order and novelty detection using objects, odors, or spatial locations in the rat. Neurobiol Learn Mem 93, 330-336.
Ramikie TS, Nyilas R, Bluett RJ, Gamble-George JC, Hartley ND, Mackie K, Watanabe M, Katona I & Patel S. (2014). Multiple mechanistically distinct modes of endocannabinoid mobilization at central amygdala glutamatergic synapses. Neuron 81, 1111-1125.
Rolls ET. (1996). A theory of hippocampal function in memory. Hippocampus 6, 601-620.
Rumsey CC & Abbott LF. (2004). Equalization of synaptic efficacy by activity- and timing-dependent synaptic plasticity. J Neurophysiol 91, 2273-2280.
Rumsey CC & Abbott LF. (2006). Synaptic democracy in active dendrites. J Neurophysiol 96, 2307-2318.
Sastry BR, Goh JW & Auyeung A. (1986). Associative induction of posttetanic and long-term potentiation in CA1 neurons of rat hippocampus. Science 232, 988-990.
Schulz PE, Cook EP & Johnston D. (1994). Changes in paired-pulse facilitation suggest presynaptic involvement in long-term potentiation. J Neurosci 14, 5325-5337.
Shih PY, Savtchenko LP, Kamasawa N, Dembitskaya Y, McHugh TJ, Rusakov DA, Shigemoto R & Semyanov A. (2013). Retrograde synaptic signaling mediated by K+ efflux through postsynaptic NMDA receptors. Cell Rep 5, 941-951.
Acc
epte
d A
rticl
e
This article is protected by copyright. All rights reserved.

29
Shindou T, Ochi-Shindou M & Wickens JR. (2011). A Ca(2+) threshold for induction of spike-timing-dependent depression in the mouse striatum. J Neurosci 31, 13015-13022.
Shor OL, Fidzinski P & Behr J. (2009). Muscarinic acetylcholine receptors and voltage-gated calcium channels contribute to bidirectional synaptic plasticity at CA1-subiculum synapses. Neurosci Lett 449, 220-223.
Shouval HZ, Bear MF & Cooper LN. (2002). A unified model of NMDA receptor-dependent bidirectional synaptic plasticity. Proc Natl Acad Sci U S A 99, 10831-10836.
Sjöström PJ, Turrigiano GG & Nelson SB. (2001). Rate, timing, and cooperativity jointly determine cortical synaptic plasticity. Neuron 32, 1149-1164.
Song S, Miller KD & Abbott LF. (2000). Competitive Hebbian learning through spike-timing-dependent synaptic plasticity. Nat Neurosci 3, 919-926.
Staff NP, Jung HY, Thiagarajan T, Yao M & Spruston N. (2000). Resting and active properties of pyramidal neurons in subiculum and CA1 of rat hippocampus. J Neurophysiol 84, 2398-2408.
Stanton PK. (1996). LTD, LTP, and the sliding threshold for long-term synaptic plasticity. Hippocampus 6, 35-42.
Stern CE, Sherman SJ, Kirchhoff BA & Hasselmo ME. (2001). Medial temporal and prefrontal contributions to working memory tasks with novel and familiar stimuli. Hippocampus 11, 337-346.
Stoop R & Pralong E. (2000). Functional connections and epileptic spread between hippocampus, entorhinal cortex and amygdala in a modified horizontal slice preparation of the rat brain. Eur J Neurosci 12, 3651-3663.
Tippens AL, Pare JF, Langwieser N, Moosmang S, Milner TA, Smith Y & Lee A. (2008). Ultrastructural evidence for pre- and postsynaptic localization of Cav1.2 L-type Ca2+ channels in the rat hippocampus. J Comp Neurol 506, 569-583.
van Welie I, Remme MW, van Hooft JA & Wadman WJ. (2006). Different levels of Ih determine distinct temporal integration in bursting and regular-spiking neurons in rat subiculum. J Physiol 576, 203-214.
Weisskopf MG, Bauer EP & LeDoux JE. (1999). L-type voltage-gated calcium channels mediate NMDA-independent associative long-term potentiation at thalamic input synapses to the amygdala. J Neurosci 19, 10512-10519.
Wittenberg GM & Wang SS. (2006). Malleability of spike-timing-dependent plasticity at the CA3-CA1 synapse. J Neurosci 26, 6610-6617.
Acc
epte
d A
rticl
e
This article is protected by copyright. All rights reserved.

30
Witter MP, Groenewegen HJ, Lopes da Silva FH & Lohman AH. (1989). Functional organization of the extrinsic and intrinsic circuitry of the parahippocampal region. Prog Neurobiol 33, 161-253.
Wozny C, Maier N, Schmitz D & Behr J. (2008). Two different forms of long-term potentiation at CA1-subiculum synapses. J Physiol 586, 2725-2734.
Zhou YD, Acker CD, Netoff TI, Sen K & White JA. (2005). Increasing Ca2+ transients by broadening postsynaptic action potentials enhances timing-dependent synaptic depression. Proc Natl Acad Sci U S A 102, 19121-19125.
Table and figures
RF neurons WBF neurons SBF neurons
RMP (mV) –63.6±0.3(n=51) –62.8±0.3(n=53) –63.3±0.3(n=46)
Rin (MΩ) 91.3±5.1(n=26) 75.5±3.0(n=52) 61.0±4.1(n=12)
Sag ratio 0.75±0.06 (n=20) 0.75±0.07 (n=19) 0.80±0.08 (n=20)
ADP (mV) 13.4 ± 0.4(n=36) 17.6 ± 0.4(n=43)*** ----
Table 1: Different properties of the pyramidal neuron subtypes in the subiculum.
Values are mean ± SEM; n in parentheses. For Rin: SBF vs WBF, P<0.025; WBF vs RF, P<0.025
andRF vs SBF, P<0.005; for SBF vs WBF and WBF vs RF, Mann-Whitney test and for SBF vs RF,
unpaired t-test with Bonferroni’s correction, for RMP: RF vs WBF, P<0.025; RF vs SBF, P=0.17;
WBF vs SBF, P=0.38; Mann-Whitney test with Bonferroni’s correction and for sag ratio: SBF vs
WBF,P=0.88; WFB vs RF, P=0.05 and RF vs SBF, P=0.07, unpaired t-test with Bonferroni’s
correction. Following Bonferroni’s correction, in all the above statistical tests the P value threshold
for significant difference is 0.025 since each dataset was used twice for comparison. For sag ratio;
RF vs WBF, P<0.01, unpaired t-test.
Figures and legends
Acc
epte
d A
rticl
e
This article is protected by copyright. All rights reserved.

31
Figure 1: Experimental design and characterization of different subtypes of subicular
pyramidal neurons.
A, Schematic drawing illustrating electrode placement; stimulating electrode was placed near
apical dendrite and timing of the pot-synaptic action potential(s) was controlled by current injection
through somatic recording electrode. B, Regular firing neuron: a, Biocytin stained neuron. b,
Voltage response to a step depolarization of 250 pA for 500 ms does not show any burst firing. c,
A single AP in response to a 2 ms step pulse of 1.8 nA. Inset shows a single AP in zoomed in
version of the first spike in b. C, Weak burst firing neuron: a, Biocytin stained neuron. b, Voltage
response to a step depolarization of 250 pA for 500 ms shows burst of activity at the onset of
depolarization. c, A single AP in response to a 2 ms step of 1.8 nA. Inset shows a burst of 2 APs in
zoomed in version of the first spike in b. D, Strong burst firing neuron: a, Biocytin stained neuron.
b, Voltage response to a step depolarization of 250 pA of 500 ms duration shows burst of activity
at the onset of depolarization. c, Burst of APs in response to 2 ms step of 1.8 nA. Inset shows a
Acc
epte
d A
rticl
e
This article is protected by copyright. All rights reserved.

32
burst of three APs in zoomed in version of the first spike in b. Scale bar: 50 µm in biocytin stained
neurons, y axis 20 mV in all voltage traces, x axis- 100 ms in 500 ms depolarization step, 25 ms in
2 ms depolarization pulse and 20 ms in inset.
Figure 2: Causal pairing of EPSP with a single bAP fails to induce LTD.
A, Normalized EPSP slope time series for the experiments show that an EPSP paired with a single
bAP failed to induce any plasticity (–13.4±9.2%, n=6, P=0.38, Wilcoxon test for baseline vs last 10
minutes of the experiment) in the RF subicular neurons. B, Similar pairing experiments in the WBF
subicular neurons failed to induce any plasticity (–3.2±7.8%, n=8, P=0.67, paired t-test for baseline
vs last 10 minutes of the experiment). In both the experiments, an EPSP was paired with a single
bAP at a time interval of +10 ms and this pair was repeated at 0.1 Hz for 10 minutes. Scale bars
for EPSP traces; x axis-50 ms, y axis-3 mV. Acc
epte
d A
rticl
e
This article is protected by copyright. All rights reserved.

33
Figure 3: Pairing induced non-Hebbian plasticity
Acc
epte
d A
rticl
e
This article is protected by copyright. All rights reserved.

34
A, The normalized EPSP slope time series for the experiment in the top panel shows the induction
of t-LTD in the RF neurons (–26.2±5.3%, n=9, P<0.01,paired t-test with Bonferroni’s correction for
baseline vs last 10 minutes of the experiment) when an EPSP was paired with a burst of three
bAPs at a time interval of +10 ms. The next two panels below, show the stability of Rin and RMP
throughout the experiment in this and figures B,C and D. The dashed line at -60 mV in the RMP
plots indicates the membrane potential at which the neurons were held by current injection, while
the data points show the actual RMP values without current injection at different time points in this,
and the RMP plots of other figures. B, A similar protocol as in A, induced t-LTD in the WBF
neurons (–36.5±5.0%, n=9, P<0.012, Wilcoxon test with Bonferroni’s correction for baseline vs last
10 minutes of the experiment) at +10 ms timing, when an EPSP was paired with a burst of three
bAPs at a time interval of +10 ms. C. In the RF neurons, pairing an EPSP with a burst of 3 bAPs at
a time interval of –10 ms induced small LTP (27.4±12.8%, n=7, P=0.11, Wilcoxon test for baseline
vs last 10 minutes of the experiment), that was statistically not significant. D. In the WBF neurons,
pairing an EPSP with the bAP burst at –10 ms timing interval showed prominent LTP (37.0±10.7%,
n=7, P<0.05, Wilcoxon test for baseline vs last 10 minutes of the experiment). In all the
experiments, the EPSP and bAP burst pair was repeated at 0.1 Hz for 10 minutes, indicated by
horizontal double headed arrows in the top panels of A, B, C and D and are common for the
bottom panels showing normalized Rin and RMP in a given figure. The action potentials shown in
the representative traces for the pairing protocol are truncated for the sake of clarity. The traces
shown during the induction period are representation of only one pair of EPSP and bAP burst, 60
such pairs were used in each induction protocol in this and other figures. Scale bars for these
representative traces; x axis-50 ms, y axis-20 mV. The average EPSP traces shown at the top
correspond to the parts of the time series denoted by numbers (1, baseline; 2, test for this and
other figures on which the statistical tests were done). The dotted traces in the overlapped
representative EPSP traces (1+2) in this and other figures are from last 5 minutes of the
experiment. Scale bars for EPSP traces; x axis-50 ms, y axis-3 mV.
Acc
epte
d A
rticl
e
This article is protected by copyright. All rights reserved.

35
Figure 4: High frequency synaptic stimulation without pairing induced Hebbian LTP
A, Normalized EPSP slope time series shows induction of robust LTP in the RF neurons
(45.5±18.5% of baseline, n=6, P<0.05, Wilcoxon test for baseline vs last 10 minutes) following
high frequency presynaptic stimulation (4 tetanic stimuli, each of 1 second duration and 100 Hz
frequency with inter-tetanus interval of 10 seconds) was applied on the pre-synaptic inputs. B,
Robust LTP was observed in the WBF neurons following HFS stimulation (67.8±15.3% of baseline,
n=6, P<0.05, Wilcoxon test for baseline vs last 10 minutes). The next two panels below show
the stability of Rin and RMP throughout the experiments. Scale bars for the EPSP traces; x axis-50
ms, y axis-3 mV. The vertical thick arrows indicate the application of HFS protocol.
Acc
epte
d A
rticl
e
This article is protected by copyright. All rights reserved.
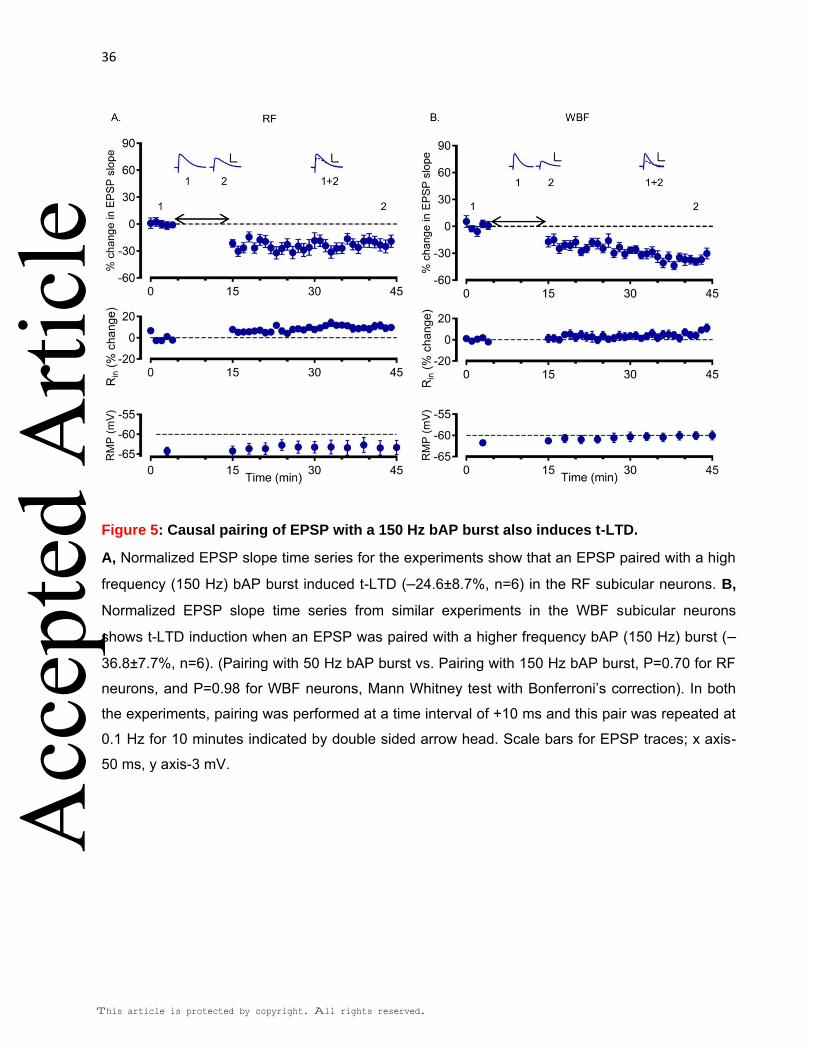
36
Figure 5: Causal pairing of EPSP with a 150 Hz bAP burst also induces t-LTD.
A, Normalized EPSP slope time series for the experiments show that an EPSP paired with a high
frequency (150 Hz) bAP burst induced t-LTD (–24.6±8.7%, n=6) in the RF subicular neurons. B,
Normalized EPSP slope time series from similar experiments in the WBF subicular neurons
shows t-LTD induction when an EPSP was paired with a higher frequency bAP (150 Hz) burst (–
36.8±7.7%, n=6). (Pairing with 50 Hz bAP burst vs. Pairing with 150 Hz bAP burst, P=0.70 for RF
neurons, and P=0.98 for WBF neurons, Mann Whitney test with Bonferroni’s correction). In both
the experiments, pairing was performed at a time interval of +10 ms and this pair was repeated at
0.1 Hz for 10 minutes indicated by double sided arrow head. Scale bars for EPSP traces; x axis-
50 ms, y axis-3 mV.
Acc
epte
d A
rticl
e
This article is protected by copyright. All rights reserved.

37
Figure 6: The non-Hebbian LTD requires both, pre- and postsynaptic activity
A, Normalized EPSP slope time series shows that the RF subicular neurons do not show plasticity
when only bAP bursts were repeated at 0.1 Hz for 10 minutes ( ) (4.7±14.0 %, n=7, P=0.89, paired
t-test for baseline vs last 10 minutes of the experiment), or only EPSPs were repeated at 0.1 Hz for
10 minutes ( ) (–1.0±8.8%, n=8, P=0.69, Wilcoxon test for baseline vs last 10 minutes of the
experiment). B, Similar experiments in the WBF neurons showed failure of plasticity induction
when only bAP bursts were repeated at 0.1 Hz for 10 minutes ( ) (–5.0±5.8% n=6, P=0.56,
Wilcoxon test for baseline vs last 10 minutes of the experiment), or only EPSPs were repeated at
0.1 Hz for 10 minutes ( ) (0.6±9.6% n=7, P=0.94, Wilcoxon test for baseline vs last 10 minutes of
the experiment). In both the figures the double headed horizontal arrows show the time when
EPSPs or bAP bursts were repeated. The two bottom panels show the stability of Rin and RMP
throughout the experiment in both the neuronal subtypes. Scale bars for EPSP traces; x axis-50
ms, y axis-3 mV.
Acc
epte
d A
rticl
e
This article is protected by copyright. All rights reserved.
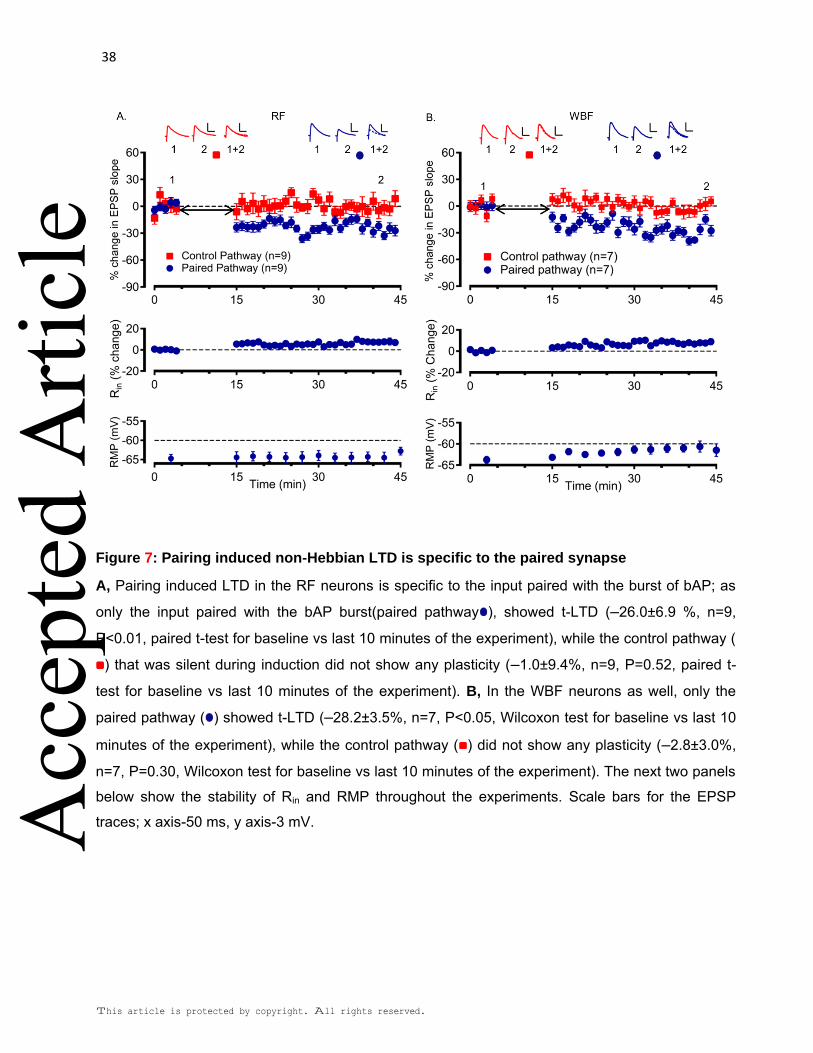
38
Figure 7: Pairing induced non-Hebbian LTD is specific to the paired synapse
A, Pairing induced LTD in the RF neurons is specific to the input paired with the burst of bAP; as
only the input paired with the bAP burst(paired pathway ), showed t-LTD (–26.0±6.9 %, n=9,
P<0.01, paired t-test for baseline vs last 10 minutes of the experiment), while the control pathway (
) that was silent during induction did not show any plasticity (–1.0±9.4%, n=9, P=0.52, paired t-
test for baseline vs last 10 minutes of the experiment). B, In the WBF neurons as well, only the
paired pathway ( ) showed t-LTD (–28.2±3.5%, n=7, P<0.05, Wilcoxon test for baseline vs last 10
minutes of the experiment), while the control pathway ( ) did not show any plasticity (–2.8±3.0%,
n=7, P=0.30, Wilcoxon test for baseline vs last 10 minutes of the experiment). The next two panels
below show the stability of Rin and RMP throughout the experiments. Scale bars for the EPSP
traces; x axis-50 ms, y axis-3 mV.
Acc
epte
d A
rticl
e
This article is protected by copyright. All rights reserved.

39
Figure 8: Pairing an EPSP with a burst of action potentials leads to depression biased
reverse STDP rule in the weak burst firing neurons of the subiculum
A, Overlap of the time series of normalized EPSP slopes for different positive time intervals of the
STDP protocol shows that in the WBF neurons an EPSP paired with a bAP burst induced LTD that
decreased with increasing time interval; extent of t-LTD for +10 ms ( ) (–36.5±5.0%, n=9,
P<0.012, Wilcoxon test with Bonferroni’s correction), and for +30 ms ( ) (–13.49±9.5%, n=7,
Acc
epte
d A
rticl
e
This article is protected by copyright. All rights reserved.

40
P=0.29) and +50 ms ( ) (–1.6±5.2 %, n=6, P=0.91) Wilcoxon test. The statistical comparison was
performed between EPSP slopes during baseline vs EPSP slopes during last 10 minutes of the
recording in all the three experiments. B, At negative pairings, longer than –10 ms no plasticity
was induced (–3.9. ±6.5 %, n=7, P=0.69 for –20ms ( ); –12.6±14.8%,n=6, P=0.44 for –50 ms, ( );
and 2.5±7.8%,n=5, P=0.82 for –85 ms, ( ); Wilcoxon test for baseline vs last 10 minutes of the
recording in all the three experiments). A robust LTP (37.0±10.7%, n=7, P<0.05, Wilcoxon test)
was induced, when a burst of bAPs was followed by an EPSP at a time interval of 10 ms (data not
shown here for the sake of clarity, refer fig.2C). Rin and RMP were stable throughout the
experiments. The symbols used for normalized Rin and RMP correspond to that used in the
normalized EPSP slope time series. During plasticity induction protocol, an EPSP was paired with
a bAP burst at varying time intervals, as indicated in the figures, and the pairs were repeated at 0.1
Hz for 10 minutes. Scale bars for EPSP traces; x axis-50 ms, y axis-3 mV. C, Amplitude of
plasticity is plotted for various timing intervals (Δt) on the x-axis for the data shown in A, B and fig.
2C and D. The timing is given a positive value if the EPSP preceded the bAP burst, while a
negative value was given if the EPSP followed the bAP burst. Δt was calculated as described in
the Materials and Methods section. The plot shows a non-Hebbian STDP profile expressing t-LTD
on the positive side of the curve and t-LTP on the negative side. While t-LTP is limited to near
coincident time interval of –10 ms on the negative side of the STDP curve, a small amount of LTD
can be observed till +30 ms timing interval on the positive side. Open circles-individual neurons,
filled circles-mean±SEM value for a particular time interval.
Acc
epte
d A
rticl
e
This article is protected by copyright. All rights reserved.

41
Figure 9: LTD is presynaptic in the RF neurons while postsynaptic in the WBF neurons
A, The time series of normalized EPSP slopes for an EPSP paired with a bAP burst at a time
interval of +10 ms shows that in the RF neurons, dialysis of the postsynaptic neuron with 10 mM
BAPTA could not block t-LTD (–40.0±9.7%, n=7 with BAPTA, ( ); –26.2±5.3%, n=9, without
BAPTA ( ); P=0.21 control vs BAPTA, Mann Whitney test with Bonferroni’s correction). B, The t-
LTD was blocked in the WBF neurons with 10 mM intracellular BAPTA in the postsynaptic neuron
(–3.9±8.9% of baseline, n=7, P=0.94, with BAPTA ( ), Wilcoxon test for baseline vs last 10
minutes of the experiment; –36.5±5.0%, n=9 without BAPTA ( ). In both the figures, the bottom
panels show the stability of Rin and RMP throughout the experiments. Plasticity was induced by
EPSP paired with bAP burst at a time interval of +10 ms. The control data appearing in figs. A and
Acc
epte
d A
rticl
e
This article is protected by copyright. All rights reserved.

42
B have been adapted from the figs. 2A and 2B respectively. Scale bars for the EPSP traces; x
axis-50 ms, y axis-3mV. C1, The RF neurons show increase in PPR after t-LTD induction (1.4±0.1,
before pairing and 1.8±0.1 after pairing, n=14; P<0.01(**), Wilcoxon test for PPR before induction
vs PPR at the end of the experiment). C2, PPR did not change in the WBF neurons after t-LTD
induction (1.6±0.1 before pairing and 1.7±0.1 after pairing, n=17, P=0.46 (ns-not significant),
paired t-test for PPR before induction vs PPR at the end of the experiment). PPR measurements
from individual neurons before and after induction are connected with a line. Filled circles with
whiskers represent mean±SEM for all the experiments. Scale bars for EPSP traces; x axis-50 ms,
y axis-3 mV.
Figure 10: t-LTD is NMDA receptor mediated in the WBF neurons
A, The time series of normalized EPSP slopes shows that blocking NMDA receptors with 50 µM
DL-AP5 did not influence t-LTD in the RF neurons (–27.5±5.2%, n=7 with DL-AP5 ( ); –
26.2±5.3%, n=9 without DL-AP5 ( ); P=0.99 control vs DL-AP5, Mann Whitney test with
Bonferroni’s correction for control vs DL-AP5). B, Blocking NMDA receptors using 50 µM DL-AP5
blocked t-LTD in the WBF neurons (–7.7±8.6%, P=0.42, n=8 with DL-AP5 ( ), paired t-test for
baseline vs last 10 minutes of the experiment; –36.5±5.0%, n=9 without DL-AP5 ( )).The control
data appearing in figs. A and B have been adapted from the figs. 2A and 2B respectively. In both
Acc
epte
d A
rticl
e
This article is protected by copyright. All rights reserved.

43
the figures, bottom panels show the stability of Rin and RMP throughout the experiments. Scale bar
for EPSP traces; x axis-50 ms, y axis-3mV.
Figure 11: t-LTD is dependent upon L-type calcium channels in the RF neurons
A1,The time series of normalized EPSP slopes shows that induction of t-LTD was blocked in the
presence of L-type calcium channel blocker Nifedipine (25 µM) in the RF neurons (2.5±3.9%,
P=0.47, n=9 with Nifedipine ( ),paired t-test for baseline vs last 10 minutes of the experiment;–
26.2±5.3%, n=9 without Nifedipine,( )). In the presence of another L-type calcium channel blocker
Verapamil hydrochloride (50 µM) also EPSPs paired with postsynaptic bAP bursts failed to induce
t-LTD in the RF neurons (–4.2±4.1% of baseline, n=6, P=0.44, ( ), Wilcoxon test for baseline vs
last 10 minutes of the experiment). B, Blocking L-type calcium channels with 25 µM Nifedipine did
not affect t-LTD induction by pairing EPSPs with postsynaptic bAP bursts in the WBF neurons (–
34.6±8.0%, n=6 with Nifedipine ( ); –36.5±5.0%, n=9 without Nifedipine ( ); P=0.99, Mann
Whitney test with Bonferroni’s correction for control vs Nifedipine).The control data appearing in
figs. A and B have been adapted from the figs. 2A and 2B respectively. In both the figures the
Acc
epte
d A
rticl
e
This article is protected by copyright. All rights reserved.

44
bottom panels show the stability of Rin and RMP throughout the experiments. Scale bar for EPSP
traces; x axis-50 ms, y axis-3mV.
Acc
epte
d A
rticl
e
This article is protected by copyright. All rights reserved.