Embed Size (px)
Citation preview

DEPOSITION OF YTTRIA-STABILIZED ZIRCONIA THERMAL BARRIER COATINGS BY
LASER-ASSISTED PLASMA COATING AT ATMOSPHERIC PRESSURE
BY
ZIHAO OUYANG
THESIS
Submitted in partial fulfillment of the requirements
for the degree of Master of Science in Nuclear, Plasma, and Radiological Engineering
in the Graduate College of the
University of Illinois at Urbana-Champaign, 2011
Urbana, Illinois
Master’s Committee:
Professor David N. Ruzic, Chair
Professor J. Gary Eden

ii
ABSTRACT
This thesis details the design and construction of a microwave generation system, and a
coaxial cylindrical plasma torch, where an atmospheric-pressure plasma (APP) can be
generated using 2.45 GHz. The discharge characteristics of the atmospheric plasma, such as
electron temperature Te, electron density ne, and plasma gas temperature Tg, are
experimentally investigated using the optical emission spectroscopy (OES) technique. The
discharge mechanisms of the atmospheric pressure plasma are also theoretically discussed.
The APP generated in the atmospheric-pressure plasma torch (APPT) has various
applications determined by the plasma gas type and plasma gas temperature, which can
range from room temperature to as high as several thousand degrees Celsius. In this study,
the APP is utilized to deposit the yttria-stabilized zirconia (YSZ) thermal barrier coatings
(TBC) at atmosphere pressure. These coatings can be applied on silicon wafers, and
multi-layer nickel-based superalloy substrates (René N5), by a new deposition technique
called laser-assisted plasma coating at atmospheric pressure (LAPCAP). The plasma
generated in the APPT has the potential to increase the vapor volume ablated from the YSZ
target by a Nd:YAG laser, therefore, adhesion strength between the coatings and the
substrate and deposition rate can be increased. The deposited YSZ coatings show columnar
structures as can be seen by other deposition methods, such as electron beam-physical vapor
deposition (EB-PVD) or the conventional pulsed laser deposition (PLD) at low pressure.
Some differences in the morphology, such as column size and porosity, are compared with
the coatings deposited by EB-PVD and low-pressure PLD. The substrate temperature, the
target-to-substrate distance and the laser ablation energy density are considered to be the
determining parameters in order to obtain thick and adhesive coatings. The structures of the
YSZ coatings deposited at different substrate temperatures from 20 °C to 1300 °C using
helium/nitrogen plasma, were investigated and compared by means of scanning electron
microscope (SEM) and focused ion beam (FIB) techniques. X-ray photoelectron
spectroscopy (XPS) and X-ray diffraction (XRD) analysis have showed that although a fully
stabilized cubic phase YSZ coating can be achieved at different deposition temperatures with
appropriate laser energy density, the microstructures, stoichiometry and phase composition

iii
of the deposited coatings can be strongly influenced by many experimental parameters, such
as the deposition temperature, microwave power and laser energy density.

iv
ACKNOWLEDGEMENTS
This work would not be possible with the effort and collaboration of many people.
I firstly want to express my thanks to my adviser Dr. David Ruzic. David as a professor
is such a knowledgeable and energetic scientist and engineer, who always has a great deal of
good ideas which other people will never have thought of. I am always enlightened by his
thoughts whenever I feel stuck on my projects and experiments. David also encourages me
to be creative and cooperative, which helps me enormously to express my thoughts in my
study and research. David’s enthusiasm influences me to be always positive about what I am
doing. Moreover, David is more like a dear friend of mine, he and his wife, Marilyn, treat all
the students in his group as their own children. I learned a lot from countless details David
has showed in front of me on how to communicate with company people, and how to find a
way to cope with tough problems in my study and personal life. David and Marilyn are very
considerate people who are willing to help me with almost every detail in my life in the
United States. I remember that I once asked them for the travelling tips for one of my
vacations, and another time coupons to fix my car. I truly feel lucky that I have had David to
be my adviser and friend for almost three years till today.
Also, I want to acknowledge all my lab partners who have helped me work through
difficulties in my study and experiments. Hyungjoo Shin and John Sporre always leave their
work aside whenever I need their help. They are patient enough to help me solve the
simplest question I am not sure about. Their precious experience benefits me a lot. My
Chinese friends Liang Meng and Wenyu Xu are the ones who are always willing to help me
solve the problems in my research, and listen to me complain. Priya Rayman is the kindest
person in the lab who helps me to do FIB analysis for countless times. I do appreciate the
advices and suggestions Marty Neumann and Ramasamy Raju have shared with me when I
feel confused. And I want to acknowledge all my undergraduates, Abhinav Gupta, Todd
Pixton, Benjamin Copple, Junghoon Shin and my friend Roland Wu, who have all sacrificed
their personal time many times in order to help me with my experiments. I feel fortunate to
meet and supervise them and I learned how to be cooperative in the process of working with
them. Dr. Vijay Surla and Jungmi Hong helped me with setting up and calibrating the

v
spectrometer. I also own a great debt of gratitude to Dr. Tae Cho, he takes care of all my
devices when I am gone and guarantee that this project keeps moving forward. All these
people have great personalities who make me feel inspired and happy to work in the lab.
This work was made possible by a great deal of support from the General Electric
Aviation department. Dr. Todd Rockstroh and Dr. Brian Pilsner in GE Aviation provide us
René N5 substrates for the experiments and share their expertise in EB-PVD technique with
me. Thanks to their great advices, we have made progress on this work much faster than we
ever expected.
The staff in the Nuclear, Plasma, and Radiological Engineering department has been
extremely friendly and helpful to me. Gail Krueger takes care of almost all the purchase
work for me and all the other people in the department and she seldom makes even a small
mistake. And she is always smiling at work. Becky Meline is one of the coolest staff in the
department who helped me to clarify questions regarding to the courses and graduation, and
she does her work very efficiently. Idell Dollison, Autumn West and Sandra Patterson are all
kind people who offer me a lot of help.
I have always been a happy person since I came to University of Illinois, no matter how
much work I have or how much pressure I feel. For this I must thank all my teammates in
the Fighting Dragon volleyball team, almost everyone in the team became a good friend
with me, they take me to all the interesting activities nearby and we often travel together.
They have helped me to adapt to and start to enjoy the new life here in U of I so easily and
so fast.
Last, I want to express my greatest gratitude to my parents, for their enduring support
and patience. I left my home town at a very young age to other cities to study and was only
able to go back home once or twice in a year since, but the love my parents give me only
become stronger as time passes by. They give me encouragement to deal with setbacks in
my life and give me faith when I feel frustrated. I cherish every single minute that I have
spent with them and appreciate their trust with all my heart.

vi
Table of Contents
CHAPTER 1: INTRODUCTION .................................................................................. 1
1.1 Atmospheric-Pressure Plasma (APP) .............................................................................. 1
1.2 Thermal Barrier Coatings (TBCs) ................................................................................... 4
1.3 Methods for YSZ TBC Deposition .................................................................................. 6
1.4 Motivation for Studies .................................................................................................... 11
CHAPTER 2: EXPERIMENTAL SET-UP .................................................................. 13
2.1 Microwave Generation and Propagation ....................................................................... 13
2.1.1 Microwave Generator and Waveguides .................................................................. 13
2.2 Atmospheric-Pressure Plasma Torch (APPT) ................................................................ 14
2.3 Nd:YAG Laser and Optics ............................................................................................. 16
2.4 YSZ Target and René N5 Superalloy ............................................................................. 17
2.5 Diagnostic Apparatus ..................................................................................................... 19
2.5.1 Optical Emission Spectroscopy (OES) System and Calibration ............................. 19
2.5.2 Other Diagnostic Apparatus .................................................................................... 23
2.5.3 Microstructure Analysis .......................................................................................... 24
CHAPTER 3: THEORY & DIAGNOSTICS ............................................................... 26
3.1 Atmospheric Pressure Plasma Generation ..................................................................... 26
3.1.1 Theory of APP Ignition and Stability ...................................................................... 26
3.1.2 Electric Field Simulation Results of APPT ............................................................. 32
3.2 Optical Emission Spectroscopy (OES) Diagnostics ...................................................... 35
3.2.1 Optical Emission Spectroscopy (OES) Theory ....................................................... 35
3.2.2 Optical Emission Spectroscopy (OES) Results .......................................................... 37
3.2.2.1 Plasma Electron Temperature Measurements .................................................. 37
3.2.2.2 Plasma Electron Density Measurements .......................................................... 42
3.2.2.3 Plasma Gas Temperature Measurements .......................................................... 48
3.3 Theory of the Formation of YSZ Coating Microstructure ............................................. 52
3.4 Substrate Temperature Simulation & Measurements ................................................. 54
CHAPTER 4: RESULTS AND DISCUSSION OF YSZ TBCS DEPOSITED BY
LAPCAP ...................................................................................................................... 60
4.1 YSZ Deposition Rate ..................................................................................................... 60
4.2 Deposition Results on René N5 Superalloy (Stage I) .................................................... 63
4.2.1 Morphology of YSZ TBCs on René N5 Superalloy ............................................... 64
4.2.2 Stoichiometry of YSZ TBCs on René N5 Superalloy............................................. 68
4.2.3 Phase Composition of YSZ TBCs on René N5 Superalloy .................................... 70
4.3 Preliminary Deposition Results on René N5 Superalloy (Stage II) ............................... 71
CHAPTER 5: CONCLUSIONS AND FUTURE WORK ........................................... 75
5.1 Conclusions ................................................................................................................... 75
5.2 Future Work ................................................................................................................... 77

vii
REFERENCES ............................................................................................................ 78
APPENDIX .................................................................................................................. 82
AUTHOR’S BIOGRAPHY ......................................................................................... 84

1
CHAPTER 1: INTRODUCTION
1.1 Atmospheric-Pressure Plasma (APP)
Low-pressure plasmas (LPPs) have been widely investigated and applied in
semiconductor manufacture and materials processes [1]. In these applications, a relatively
large-volume and uniform plasma is commonly sustained and confined in a high-vacuum
system, which makes the large-area material processing at a uniform rate possible. LPP
requires low breakdown voltage to ignite, and has relatively high electron temperature and
low neutral temperature. Along with these advantages, the major drawbacks of generating a
plasma at low pressure environment also originated in the use of a vacuum system. Vacuum
systems and related devices for controlling the targets inside the chamber are expensive and
also lack of flexibility. Applications such as plasma etching and plasma deposition can create
contamination in the vacuum chamber which will affect the observation and measurements
and requires frequent maintenance.
Generation of plasmas at atmospheric pressure is desirable in lowering the cost of
manufacture and able to broaden the plasma applicable areas due to the fact that the products
only require partially treatment in many applications. However, sustaining a gas discharge at
atmospheric pressure is much more difficult than it can be done in a vacuum chamber, for
the time constants for instabilities decrease with increasing pressure [2]. In a DC discharge,
for example, higher voltages are required to ignite and sustain a plasma as pressure is
increased, however, as the pressure is increased to one atmospheric pressure (1 atm), the
ignition voltage can be high enough to generate an arc-mode discharge between the
electrodes, which is usually unwanted in materials processing applications, due to the high
gas temperature and restricted processing area of the arcs. This glow-to-arc transition sets a
threshold for the discharge stability [3] and is usually prevented by changing the schematic
of the electrodes, which are consequently categorized into several atmospheric-pressure
plasma types according to the configuration. The corona discharges are usually ignited by
applying a ~10 kV DC voltage between a point electrode and a plane electrode with a

2
distance of several mm, and the current is kept below 300 μA to prevent arcing [4]. The
atmospheric-pressure plasma jet (APPJ) consists of two concentric electrodes, and the inner
electrode is applied with 13.56 MHz RF power or microwave power. Inertial gases with high
flow rates are fed between the electrodes in order to ignite the discharge. The ignition
condition for APPJ is easily achievable and the discharge of APPJ is homogenous and
volumetric with low gas temperature [5]. Dielectric barrier discharges (DBDs) are usually
generated between two metal electrodes with a spacing of several mm, and on one or both of
which is coated with a dielectric layer [6]. Generation of DBDs requires a ~20 kV DC
voltage, and the plasma streamers can be distributed in a large area. A comparison of the gas
and electron temperatures for several atmospheric-pressure plasmas with low-pressure
plasmas is shown in Figure 1.1.
Fig 1.1. Comparison of the gas/electron temperatures for atmospheric-pressure
plasmas and low-pressure plasmas from Ref. [7].
A simple approach to generate large-volume atmospheric-pressure plasmas is to create a
large electric field around the cathode boundary region to supply sufficient production of
electrons, which depends on the specific structure of the electrodes and different type of feed
gas. The comparison of breakdown voltage and electron density of different
atmospheric-pressure plasmas and low-pressure plasma is listed in Table 1.1. As can be seen,
the APPJ has a similar breakdown voltage to the discharges at low pressure, which is much
DBD

3
lower than the other atmospheric-pressure discharges. The electron density of APPJ is also
in the same range of low-pressure discharges.
Table 1.1 Breakdown voltage and electron density of plasma discharges from Schütze
1998 Ref [7].
Plasma Source Breakdown voltage (kV) Electron density (cm-3
)
Low pressure discharge 0.2-0.8 108-10
13
Arc 10-50 1016
-1019
Corona 10-50 109-10
13
DBD 5-25 1012
-1015
APPJ 0.05-0.2 1011
-1012
In this study, the configuration and plasma-generation mechanism of an
microwave-induced atmospheric-pressure plasma torch (MI-APPT) is modeled and
investigated. MI-APPT is one type of the APPJs which has many advantages compared with
other atmospheric-pressure plasma sources, such as wide tenability of the plasma gas
temperature from room temperature to high temperature applicable in welding and
metallurgy uses, large plasma volume, transversely symmetric distribution and
longitudinally monotonically evolved non-uniformity. However, in order to effectively
couple the microwave power, the structure of the plasma torch attached to the microwave
system needs to be delicately designed, and the distribution of the electromagnetic field
generated by the microwave strongly affects the properties of the plasma, which brings
complexity in theoretically analyzing the physical mechanisms of the discharge and
measuring the plasma properties.
The atmospheric-pressure plasmas are highly collisional and nonequilibrium, owing to
the fact that the electron-neutral collision frequency is much greater than the plasma
frequency in 1 atm pressure. As a result, traditional characterization methods, such as
Langmuir probes, often fail in measuring and analyzing the electron temperature, electron
density, and particle distribution of the plasma. Spectroscopy is usually utilized as an main
alternative method to measure some of the macroscopic variables of the discharges at
4
atmospheric pressure. The theory of optical emission spectroscopy (OES) and some of its
applications on measurements of plasma parameters will be carried out in this study.
1.2 Thermal Barrier Coatings (TBCs)
Thermal barrier coatings (TBCs) are essential materials in aerospace-related
applications and mechanical, electro-chemical components and systems, such as gas turbine
engines [8], combustion chambers and solid oxide fuel cells (SOFCs) [9], for their
capabilities of lowering metal surface temperatures and protecting thermal oxidation in
high-temperature operations. Ceramic materials are optimal for TBCs for their high melting
points and good insulativity. However, the distinct physical and chemical properties between
ceramic materials and metals bring challenge to the deposition processes. High thermal
stability and good adhesion, for instance, are normally required for TBCs in most industrial
applications in order to improve operation lifetime and efficiency, but the thermal expansion
coefficients of most of ceramics are much lower than those of metals, which can lead to
TBC spallation failure when it is subjected to considerable thermal corrosion [10]. The
application necessity of the TBCs and their demanding operation conditions are attracting
urge and motives of searching for suitable materials and methods for TBC depositions to
broaden their potential.
In gas turbine engine applications, TBC is typically a two-layer system which consists
of a ceramic layer and a metallic “bond coat” between the ceramic layer and the underlying
substrate, the turbine superalloy. The bond coat is typically a ~ 100 μm layer made of
aluminides of Ni and Pt [11], which can be deposited by chemical-vapor deposition (CVD)
to increase the adhesion between the ceramic layer and the Ni or Co-based superalloy. The
superalloy has either single-crystal or polycrystalline forms and has a melting point is in the
range of 1230 °C and 1315 °C [8] in turbine applications, depending on the specific
composition. A 1-10 μm thermally grown oxide (TGO) will form between the ceramic layer
and the bond coat when deposition is operated at high temperatures. It is found that although
TGO provides strong bonding between ZrO2 and bond coat, the spallation failure also occurs
5
at this interface in cases such as electron-beam physical-vapor deposition (EB-PVD) [8]. A
current TBC system which is deposited on a turbine blade is shown in Figure 1.2.
Fig 1.2. Cross-sectional scanning electron micrograph (SEM) image of an EB-PVD
TBC from Ref. [11].
Zirconia-based ceramics are most commonly used as materials of TBCs. Oxides such as
Y2O3, CeO2, MgO, or CaO are doped in the ZrO2 to improve its thermal and mechanical
stabilities, and the percentage of the dopants is also an important parameter in stabilizing the
crystal phases of the ZrO2 [12]. Yttria-stabilized zirconia (YSZ), among all TBC ceramics, is
found most suitable for TBCs for it possesses many desirable properties, such as high
melting point (2600 ~ 2700 °C), low thermal conductivity (~ 2.0 W·m-1
·K-1
at 1100 °C) due
to the high concentration of point defects [11], and high thermal expansion coefficient
(10.1×10⁻⁶
K-1
at 873K), which help to reduce the thermal stresses between the coatings and
the underlying superalloy [13]. Additionally, when YSZ intermolecular bonds are broken,
bonds with a higher atomic packing factor (APF) will form to fill the cracks and increase the
YSZ fracture resistance. Various formation of YSZ structure has been deposited on
superalloys and other substrates such as Si, Pt, or sapphire wafers [14], and laminar,
columnar and triangular-facet structures [15] are obtained depending on the deposition
methods and conditions. Detailed morphology such as the coating porosity, orientation and
periodicity vary in different approaches. Morphology of the YSZ TBCs is closely related to

6
the mechanical and thermal performances. Laminar structured YSZ TBCs are typically
porous and lack of periodicity, which tends to crack within the layer when exposed to
mechanical or thermal stresses. Fully-dense or porous-free YSZ TBCs are reported to have
lower ohmic resistance and has better thermal resistance than laminar structures, and zig-zag
porous structured and highly porous TBCs are tend to have much lower thermal conductivity
[16,17].
1.3 Methods for YSZ TBC Deposition
Various methods have been employed to prepare and deposit YSZ TBCs on metal
substrates. There are four most widely used approaches up to date: (1) air plasma spraying
(APS), (2) electron beam-physical vapor deposition (EB-PVD), (3) pulsed laser deposition
(PLD) at low-pressure environment, and (4) chemical vapor deposition (CVD). The
characteristics and morphology of YSZ TBCs deposited by these methods have been
experimentally observed and compared in different ways.
YSZ TBCs deposited by current APS technique are usually accomplished by feeding
nanoscale YSZ powder, which has a grain size ranging from 25 nm to 500 nm, into a high
temperature (10000-20000 K near the nozzle [8]) air plasma plume [18,19]. A typical APS
torch is shown in Figure 1.3.
Fig 1.3. Schematics of an APS torch with axial powder injection from Ref. [20]
The operation current of the plasma spray gun is around 600 A and the voltage less than
100 V [21]. The plasma flame heats the nanoscale powder particles above the melting point
and into a semiplastic state and brings them to the substrate. The semiplastic particles
7
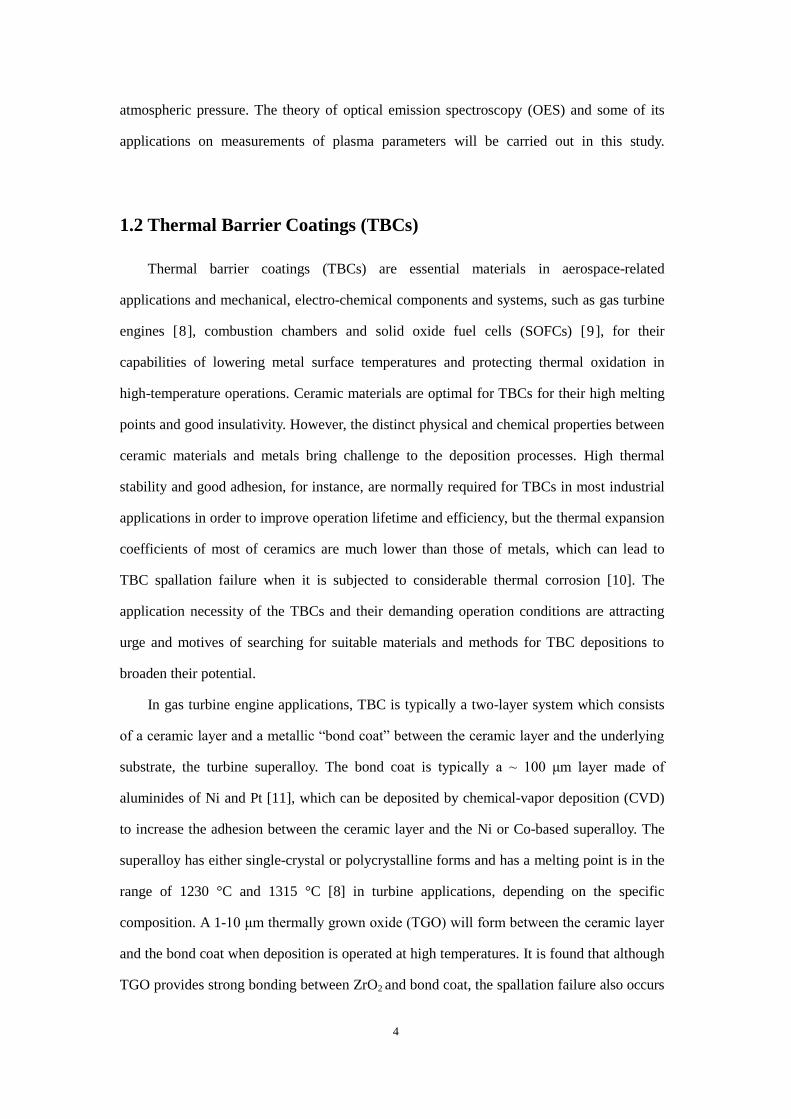
impinge on the substrate and create an interlocking bonded structure with it [8]. The
deposition morphology of TBCs by APS usually shows a highly molten lamellar
microstructure, with micro-pores and micro-cracks presented in the coatings [22], as shown
in Figure 1.4. APS YSZ deposition is a cost-effective technique with high deposition rate,
which is determined by the powder injection rate and plasma gas temperature, which can
reach up to the magnitude of μm/s. However, the need for a high temperature operation
environment and a decontamination system, and the high-porous lamellar morphology of the
coatings due to APS inherent properties limits its applications. In the turbine engine
applications, APS TBCs tend to crack at both ceramic layer interfaces within the coating as
well as the substrate-coating interface since the bonding between the deposited coating and
the substrate is completely physical interlocks, combined with porous laminar structure.
Alternative processes such as low-pressure plasma spray (LPPS) [19], vacuum plasma spray
(VPS) [23], and high-velocity oxygen fuel thermal spray [24] are used to improve the
coating adhesion.
Fig 1.4. The microstructure of deposited 7 wt% YSZ coatings by APS from Ref. [8].
Columnar structured TBCs are believed to have smaller surface roughness, higher
thermal conductivity, larger adhesive strength, and lower erosion rate than lamellar
structured TBCs [25], which can be achieved by the EB-PVD, PLD or CVD techniques.
Typical EB-PVD, PLD and CVD processes are shown in Figure 1.5-1.7. An EB-PVD
chamber consists of one or several EB guns in order to preheat the substrate and evaporate
the ingots fed into the vacuum chamber, while in a PLD system various pulsed laser systems

8
are employed to ablate the target and create a cloud of atoms and fragments vertically
escaped from the surface of the target. A CVD system usually consists of an evaporator, a
deposition reactor and a vacuum system. Each of these three deposition methods has its
unique advantages and also some challenges. EB-PVD has a relatively large deposition rate
and strong chemical bonding between the YSZ coating and the substrate, but also sets high
standards for the deposition system due to its complicated load locks and controls for both
the ingots and substrates, and the paths for the electron beams assembly. Compared to
EB-PVD, the PLD reduces the cost because it requires more simplified system and laser is
more flexible and adjustable as an individual optical device. However, the ablation process
often causes micro-sized fragments in the vapor, which results in nonuniformity in the
coating and weakens the bonding strength. CVD can be applied to deposition of more
complicated-shaped components compared with EB-PVD and PLD, and has better
repeatability due to the stability of chemical reactions [26], but it also has a much lower
deposition rate and less controllability on the coatings qualities.
Fig 1.5. Schematic diagram of an EB-PVD system from Ref. [27].
9
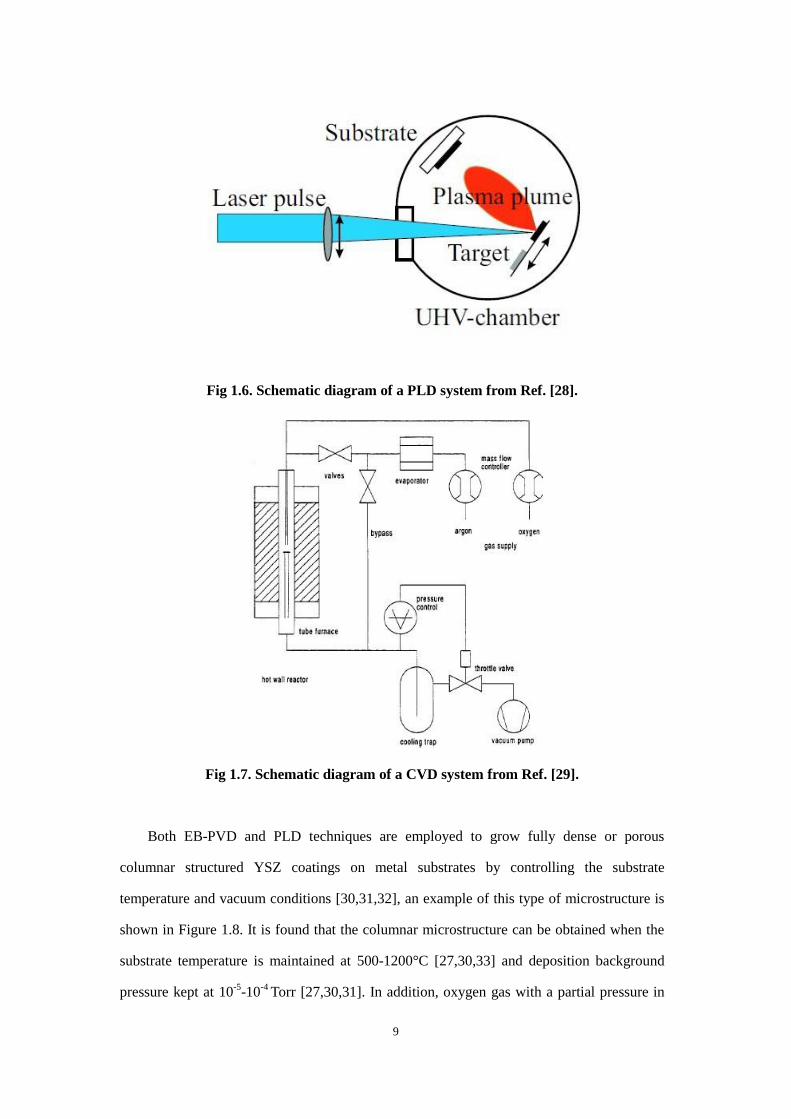
Fig 1.6. Schematic diagram of a PLD system from Ref. [28].
Fig 1.7. Schematic diagram of a CVD system from Ref. [29].
Both EB-PVD and PLD techniques are employed to grow fully dense or porous
columnar structured YSZ coatings on metal substrates by controlling the substrate
temperature and vacuum conditions [30,31,32], an example of this type of microstructure is
shown in Figure 1.8. It is found that the columnar microstructure can be obtained when the
substrate temperature is maintained at 500-1200°C [27,30,33] and deposition background
pressure kept at 10-5
-10-4
Torr [27,30,31]. In addition, oxygen gas with a partial pressure in

10
the range of 10-3
-10-1
Torr is often applied during the deposition process in order to acquire
appropriate coating porosity [30,34], for microstructures with fully dense columns will have
higher compressive residual stresses than microstructures with well-spaced columns, which
makes the TBCs with appropriately porous columnar structure desirable for many
applications [ 35 ]. Compared with the interlocking bonding mechanism in the APS
deposition case, both EB-PVD and PLD form chemical bonding between YSZ coatings and
the underlying substrate which does not as easily fail due to spallation within the coating as
APS does, thus improves the thermal corrosion resistance. Although EB-PVD and PLD
usually have smaller deposition rates than APS, they are able to control the microstructure of
deposited coatings by simply adjusting the deposition parameters. These significant
controllable parameters in determining the coating properties includes: Preheat temperature,
deposition temperature, pressure in the chamber, partial pressure of oxygen in the chamber
and substrate rotation speed, etc [10]. Conventional thermal CVD technique is able to grow
uniform, dense columnar YSZ thin films [29], which has a small deposition rate yields to <
10 μm/h and requires a high deposition temperature from 800-1500 K [36]. As a result, laser
devices or plasma sources are sometimes combined with CVD systems to improve the
deposition rate [36,37]. Comparison of these deposition techniques is listed in Table 1.2.
Fig 1.8. The columnar structured YSZ TBCs deposited by the EB-PVD process from
Ref. [8].
11
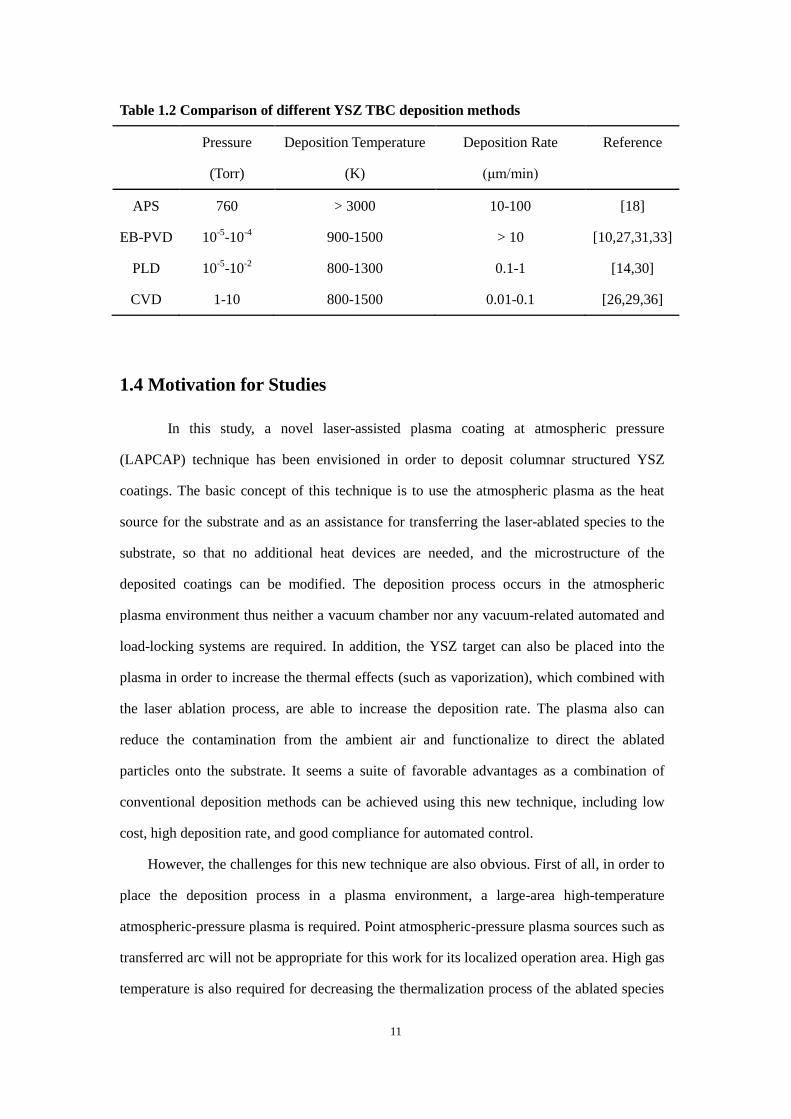
Table 1.2 Comparison of different YSZ TBC deposition methods
Pressure
(Torr)
Deposition Temperature
(K)
Deposition Rate
(μm/min)
Reference
APS 760 > 3000 10-100 [18]
EB-PVD 10-5
-10-4
900-1500 > 10 [10,27,31,33]
PLD 10-5
-10-2
800-1300 0.1-1 [14,30]
CVD 1-10 800-1500 0.01-0.1 [26,29,36]
1.4 Motivation for Studies
In this study, a novel laser-assisted plasma coating at atmospheric pressure
(LAPCAP) technique has been envisioned in order to deposit columnar structured YSZ
coatings. The basic concept of this technique is to use the atmospheric plasma as the heat
source for the substrate and as an assistance for transferring the laser-ablated species to the
substrate, so that no additional heat devices are needed, and the microstructure of the
deposited coatings can be modified. The deposition process occurs in the atmospheric
plasma environment thus neither a vacuum chamber nor any vacuum-related automated and
load-locking systems are required. In addition, the YSZ target can also be placed into the
plasma in order to increase the thermal effects (such as vaporization), which combined with
the laser ablation process, are able to increase the deposition rate. The plasma also can
reduce the contamination from the ambient air and functionalize to direct the ablated
particles onto the substrate. It seems a suite of favorable advantages as a combination of
conventional deposition methods can be achieved using this new technique, including low
cost, high deposition rate, and good compliance for automated control.
However, the challenges for this new technique are also obvious. First of all, in order to
place the deposition process in a plasma environment, a large-area high-temperature
atmospheric-pressure plasma is required. Point atmospheric-pressure plasma sources such as
transferred arc will not be appropriate for this work for its localized operation area. High gas
temperature is also required for decreasing the thermalization process of the ablated species

12
by the ambient gas molecules. Second, as a result of the 1 atm deposition pressure, the
particles generated from the target in the pulse laser ablation process have an extremely
short mean free path, which will result in a very low deposition rate if the target-to-substrate
distance is not small enough. Third, the interactions between the plasma or the electric field
in the plasma ignition region and the substrate increase the complexity of modeling and
analyzing the deposition mechanisms.
This thesis is divided into chapters discussing Experimental Set-up, Theory, Plasma
Simulation and Diagnostics, Results and Discussion of YSZ TBCs by Pulsed Laser
Deposition (PLD), and Conclusion.
Chapter 2 discusses the facilities and apparatus used for the experiments. The assembly
of the microwave generation and propagation system and the atmospheric-pressure plasma
torch, the diagnostic system and calibration method, and the devices used in the PLD
technique are presented in detail in this chapter.
Chapter 3 introduces the theory of the generation mechanisms of atmospheric-pressure
plasma and the optical emission spectroscopy (OES) technique for analyzing some
significant properties (Te, ne, and Tg) of the plasma. The dependence of TBC microstructure
on pressure and temperature is extended in the 1 atm pressure condition, and a theoretical
model for simulating the temperature distribution of the substrate is discussed here. The
simulative and diagnostic results of the atmospheric-pressure plasma used in this work
varied with the microwave power, axial distance and gas flow rate are compared and
discussed along with the theories.
Chapter 4 thoroughly characterizes the properties of the microstructure of YSZ TBCs
deposited on silicon and superalloy substrates under various deposition conditions. The
results will show that the LAPCAP technique can successfully deposit columnar structured
YSZ TBCs on the superalloy substrates.
Chapter 5 summarizes the accomplishments in this study and the future work for more
detailed characterization of the plasma and for improving the TBC quality.

13
CHAPTER 2: EXPERIMENTAL SET-UP
2.1 Microwave Generation and Propagation
2.1.1 Microwave Generator and Waveguides
The atmospheric-pressure plasma source in this study was ignited in a plasma torch by
coupling the microwave with a 2.45 GHz frequency. The path of generation and propagation
of the microwave is shown schematically in Figure 2.1. The microwave is generated by a
magnetron in a generator (Cober Electronics, Inc., Model S6F, USA), which needs a ~
12kVA power input and has a continuously adjustable power output from approximately 0.5
kW to 6 kW into a matched load. The output microwave is directed out from the magnetron
and travels in WR 284 waveguide cavities consists of the following sections: (1) An
aluminum 90º E-bend or H-bend, depending on the experimental requirements (not shown in
Figure 2.1, CoberMuegge LLC, USA), which changes the direction of the microwave
propagation from vertical to parallel. (2) A two-port circulator with an embedded water load
(or an isolator, CoberMuegge LLC, USA), which ensures that the reflected microwave to be
deposited in the water load instead of travelling back to the magnetron. (3) A dual directional
coupler (CoberMuegge LLC, USA), which has a 60 dB power attenuation at both ports for
detecting forward and reflected microwave power, respectively. (4) A 3-stub (home-made) or
4-stub (CoberMuegge LLC, USA) tuning system, which can continuously adjust the
reflected microwave power by inserting or extracting one or more of the tuning stubs, or
changing the impedance matching. The reflected power is tuned less than 5% of the output
power in all experiments. (5) A WR 284 to 7/16 coaxial adapter (home-made), which
couples the microwave from WR 284 cavity into the antenna of the plasma torch, which will
be discussed in the following section in detail.

14
Fig 2.1. Experimental set-up schematic of microwave generation and propagation.
2.2 Atmospheric-Pressure Plasma Torch (APPT)
The atmospheric-pressure plasma torch (APPT, shown in Figure 2.1 schematically, and
actual configuration is shown in Figure 2.2) is designed and fabricated at Center for
Plasma-Material Interactions (CPMI) at University of Illinois at Urbana-Champaign. It
consisted of three coaxial copper cylinders with decreasing diameters, a copper (or tungsten)
antenna in the center, and a quartz discharge tube. The diameter of the antenna varies from
0.25” to 0.375” for different operation temperatures and experimental purposes, and it is
connected with the coaxial adapter by a receptacle jack (HUBER+SUHNER Group, USA)
and a 7/16 DIN adapter (RF Parts Company, USA). The discharge tube (O. D. 16.2 mm, I. D.
13 mm, Technical Glass Products, Inc., USA) is fixed inside the torch by two Teflon rings
between it and the copper cylinders. The gas is fed into the APPT from the gas inlet at the
bottom of the outmost copper cylinder wall, and a Teflon pad is placed at the bottom of the
torch to prevent arcing between the antenna and the copper cylinder. Helium, nitrogen,
oxygen, hydrogen, and argon are controlled by RMA-Master® flowmeters (Dwyze
Instruments, Inc., USA) which can be individually used or mixed in order to generate
various types of plasmas, as shown in Figure 2.3.
15
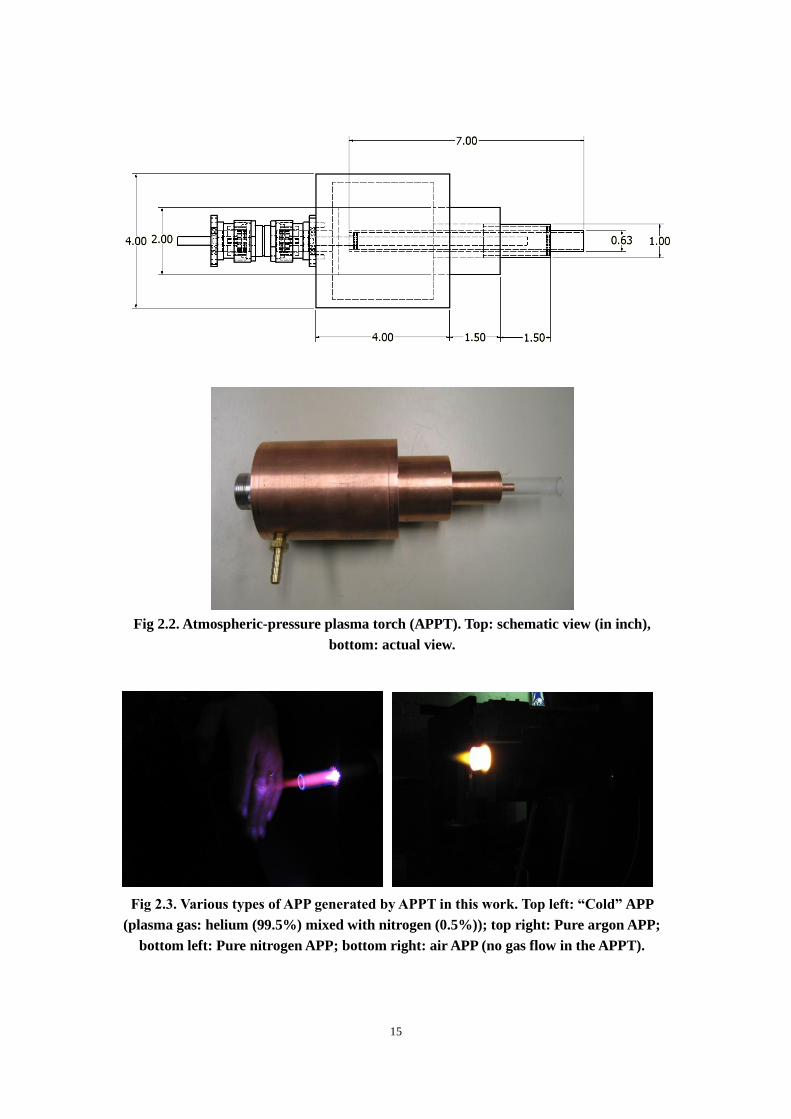
Fig 2.2. Atmospheric-pressure plasma torch (APPT). Top: schematic view (in inch),
bottom: actual view.
Fig 2.3. Various types of APP generated by APPT in this work. Top left: “Cold” APP
(plasma gas: helium (99.5%) mixed with nitrogen (0.5%)); top right: Pure argon APP;
bottom left: Pure nitrogen APP; bottom right: air APP (no gas flow in the APPT).

16
Fig 2.3 Cont. Various types of APP generated by APPT in this work. Top left: “Cold”
APP (plasma gas: helium (99.5%) mixed with nitrogen (0.5%)); top right: Pure argon
APP; bottom left: Pure nitrogen APP; bottom right: air APP (no gas flow in the APPT).
The APPT designed for this study has the capability of generating APP with a wide
range of plasma gas temperature, from room temperature to as high as 3000 ºC, depending
on the type of plasma gas used, the gas flow rate, and the operation microwave power. The
plasma is usually ignited with a helium gas flow ranged from 10-30 liters per minute (lpm),
an ignitor made of a tungsten wire and a ceramic insulator is sometimes used for ignition.
Pure argon, nitrogen and air APP can be obtained and sustained with an appropriate gas flow
rate and output microwave power by mixing each of them into the helium plasam and then
completely turning the helium off.
2.3 Nd:YAG Laser and Optics
A neodymium doped yttrium aluminum garnet laser, or a Nd:YAG laser is a solid-state
laser which has an emission wavelength most commonly at 1064 nm. The Nd:YAG used in
this work (Spectra-Physics, Model Lab-190, USA) can be operated at 266 nm, 532 nm, and
1064 nm wavelengths by frequency doubling and quadrupling techniques. Pulses obtained
by Q-switching have 8~12 ns pulse width, 100 Hz pulse repetition rate, and 120 mJ energy
per pulse at 532 nm. The laser beam is reflected and directed by a suite of Nd:YAG laser
mirrors (Thorlabs, USA) and focused by a UV fused silica lens (Thorlabs, USA, f: 10 cm) at
a ~1 mm diameter spot to ablate the YSZ target, yielding a maximum laser energy density of
10 J/cm2 (the laser energy density can be continuously adjusted by controlling the laser

17
beam intensity). Figure 2.4 shows the optical layout in this work.
Fig 2.4. The optical path for the Nd:YAG laser ablation (λ: 532 nm).
2.4 YSZ Target and René N5 Superalloy
3% mol yttira-stabilized zirconia (YSZ) cylinders (Inframat® Advanced Material, USA)
are used as the ablation target throughout this study. The YSZ cylinders can be obtained by
sintering the YSZ powder below the melting temperature and pressing it at high pressure
[30]. The YSZ target is partially immersed in the APP plume in order to utilize the high
plasma gas temperature to melt the possible micro-sized fragments escaped from the target
during ablation and to avoid potential air contamination. Different sizes of YSZ cylinders
which are used for laser ablation processes in this study are shown in Figure 2.5.
Fig 2.5. YSZ (3% mol Y2O3 stabilized) cylinders with dimensions of 5×5 mm, 7.5×7.5
mm, and 10×10 mm (diameter × height).

18
The substrates used in this study are Si wafers and nickel-base single crystal René N5
superalloys. The chemical composition of a René N5 superalloy (shown in Figure 2.6) is
7.72% Co, 7.48% Cr, 7.13% Ta, 6.38% W, 6.18% Al, 2.85% Re, 1.4% Mo, and 0.15% Hf
which yields a melting temperature of about 1300 ºC [38]. The substrate is mounted on a
crucible which is attached to a 2 rpm rotational motor and then a computer-controlled XY
linear travel-stage system (Thorlabs, Model NRT150, USA) which has a maximum movable
distance of 150 mm and maximum velocity of 10 mm/s in both directions. The substrate is
heated by the APP plume to the desirable deposition temperature by adjusting the output
microwave power, which is kept below 1100 ºC for René N5 superalloy due to the chemical
stability of the bond coat/substrate system [10]. The substrate temperature Ts of Si wafer is
estimated by a thermocouple mounted at the edge deposition area on the substrate, and the
Td of René N5 superalloy is analyzed by comparing the temperatures measured by three
thermocouples mounted at the center of the front side, the edge of the front side and the edge
of the back side, separately. The theoretical reasons will be discussed in the Chapter 3 later.
The deposition rate of YSZ coatings is approximately 1-2 µm/min using this technique, and
the deposition time is set up to 30 minutes.
Fig 2.6. René N5 superalloys (1” diameter and 1” square buttons, provided by GE
Aviation, USA)
In this study, two phases of experimental set-ups for laser ablation are employed, as
shown schematically in Fig 2.7. The Stage I experimental set-up places the YSZ target on
the side of the plasma plume and the substrate is placed beneath the target and laser

19
interaction spot. The idea of immersing the laser ablation inside the plasma plume is not
exactly satisfied in this case, for the target (especially the bigger ones) has a tendency to
disturb the plasma gas flow near the ablation area and also affect the plasma heating for the
underlying substrate. The Stage II set-up is a more improved set-up for the following reasons:
(1) The system is a more symmetric compared with the Stage I set-up and has a potential to
improve coating uniformity; (2) The surface of the embedded YSZ target is placed at the
plasma ignition area where the gas temperature is the highest, which even has a capability to
melt the surface of the YSZ target to create a vapor; (3) The gas is flowing up which resist
the deposition of micro-sized fragments ablated by the laser due to gravitational effect; (4)
The gas flow will create a low pressure zone on the top of the tip of the antenna (or YSZ
target), where the laser ablation happens, which increases the mean free path of the ablated
particles to some extend compared with the situation in the 1 atm pressure.
Fig 2.7. Stage I (left) and Stage II (right) experimental set-ups for laser ablation.
2.5 Diagnostic Apparatus
2.5.1 Optical Emission Spectroscopy (OES) System and Calibration
The optical emission spectroscopy (OES) system in this study consists of a 0.275 meter
focal length monochromator (Acton Research Corporation, Model SpectraPro® 275, USA),

20
a spectrometer sensor engine (SSE) (Mightex Systems, Canada), and auxiliary apparatus
such as optical fibers and focus lenses. Two gratings are installed on the triple indexable
grating turret in the monochromator which can be swept by a stepping motor scan controller.
The monochromator, which has a resolution of 0.1 nm with the 1200 g/mm grating (10 μm
slits, at 435.8 nm), and 0.05 nm with the 2400 g/mm grating, can be operated in the
wavelength range of 185 nm to 1.4 μm. The slit width of the monochromator is continuously
adjustable from 10 μm to 3 mm. The SSE consists of a CCD line camera (Mightex Systems,
Model SSE-1304-U, Canada) with 3600 linear channels (pixels) and spectrometer software
which provides functions such as wavelength calibration, dark references and spectrum
display.
Two types of calibration for the CCD camera should be conducted before measurements:
wavelength calibration and intensity calibration. He, Ne, Kr, (Lamp sources from Materials
Research Laboratory (MRL), University of Illinois at Urbana-Champaign) and Hg
calibration lamps (UVP LLC, USA) are used to calibrate the wavelength range from 300 nm
to 700 nm. The wavelength calibration is carried out with both 1200 g/mm and 2400 g/mm
gratings, respectively, in the following steps: (1) Identify the approximate wavelength range
covered by the 3600 pixels of the CCD within one take. In pixel mode of the SSE software,
first move the stepping motor scan controller to center the CCD at the wavelength of a
known specific strong line λs, for example, 365.0153 nm for Hg [39], then center the
controller at wavelengths λ1 and λ2 where the peak at λs moves to the pixel = 0 and pixel =
3600, thus the wavelength range is estimated as ∆λ = |λ1 – λ2|. ∆λ is found to be ~70 nm for
1200 g/mm grating and ~35 nm for 2400 g/mm grating in this spectrometer system, and will
be slightly different at different center wavelength. (2) Set center wavelengths λc1, λc2, …
and stepping wavelength ∆λ’ to calibrate all wavelength ranges of interest, ∆λ’ < ∆λ needs to
be satisfied in order to exclude the edge effect of the CCD. In this work, λc is set to cover
300-700 nm wavelength bandwidth, and ∆λ’ is set to be 50 nm and 30 nm for 1200 g/mm
and 2400 g/mm gratings, respectively. (3) Combine the calibration lamps mentioned above
to find at least 3 peaks spread in the wavelength range around each of λc (the more peaks can
be found, the more accurate the calibration is), record the pixel values corresponding to the
peak wavelengths from references [39]. (4) Fit the pixel versus wavelength curves for each

21
wavelength range.
The intensity calibration of the CCD camera is carried out by a standard spherical
luminance source (Hoffman Engineering, Model SPH-4, USA), which provides the spectral
radiance (SR, in μW/cm2-STR-nm) values from 350-975 nm at intervals of 5 nm. In order to
use this data, a fit for the SR from 350-975 nm is calculated and shown in Figure 2.8 and the
equation for the fitted curve is given by
𝑆𝑅 = 4.84371 × 10⁻⁹𝜆4 − 1.44796 × 10⁻⁵𝜆3 + 0.01506𝜆2 − 6.12554𝜆 + 851.20993
(2.1)
Two points need to be noticed from equation (2.1): (1) The UV SR values in the range
of 250-350 nm cannot be achieved by this device but are found and compared in Ref. [40].
(2) In most cases, if a smaller wavelength range (or even one specific peak) sectioned from
the range of 375-975 nm is the interest of analysis, equation (2.1) may not be the best fitting
in this range although it is optimal for the wavelength throughout 350-975 nm. In these cases,
the exact same calibration and fitting method can be used except that only a section of the
SR reference data needs to be considered. The blackbody radiation signals recorded by CCD
at different wavelength ranges divided by the SR data is the response of the spectrometer
system (shown in Figure 2.9), and the intensity of a measured signal divided by the response
is the calibrated intensity that can be used in the spectroscopy analysis.
Fig 2.8. Fitted spectral radiance curve in the 350-975 nm wavelength band.

22
Fig 2.9. Top: Response function for 1200 g/mm grating (350-700 nm); Bottom:
Response function for 2400 g/mm grating (300-550 nm).
The response functions for both gratings have several peaks due to the edge effect of
the spectrometer sensor, which results from the fact that the spectral data is taken steppedly
for multiple times in order to cover a wide range. Therefore, polynomial fits for the response
functions are performed for both 1200 g/mm and 2400 g/mm cases. In many applications

23
which only one spectral peak or a small section of spectrum need to be analyzed, a more
accurate and convenient way is to calculate the response function centered at the specific
peak or in the range of interest.
The slit calibration is made possible by a He-Ne laser which emits at 632.8 nm. The
He-Ne laser is aligned carefully with the monochromatic and the slit width is adjusted to
about 45 μm which guarantees that the peak signal is the narrowest in shape. The FWHM of
the 632.8 nm emission peak is estimated as the slit calibration for the SSE system.
The schematic configuration of the LAPCAP together with the OES system is shown in
Figure 2.10.
Fig 2.10. LAPCAP system integrated with OES systems and other diagnostic
apparatus.
2.5.2 Other Diagnostic Apparatus
The microwave power is detected by a USB power sensor (Mini-Circuits, Model
PWR-SEN-6G+, USA) connected to one port of the directional coupler. This is used to
couple the impedance matching as well as measure the forward or reflected microwave
power. An oscilloscope (Tektronix, Model TDS2014, USA) combined with a 50 dB diode is
also connected to the directional couple to monitor the microwave shape.
K-type thermocouples (Omega, USA) are used to measure the temperature of the

24
substrate and approximately estimate the plasma gas temperature, for the microwave and
particles in plasma will cause significant errors in this measurement.
Laser beam power is detected by the energy detector (Gentec-EO, Model
QE50LP-H-MB, Canada) connected to a power & energy monitor (Gentec-EO, Model Solo
2, Canada), as shown in Figure 2.11. The energy detector has a large detecting area (50mm ×
50mm), wide spectral range (0.19-20 μm), and high damage threshold when it is masked by
an attenuator with a 30-40% transmittance (45W or 6 J/cm2 at 532 nm).
Fig 2.11. Laser beam detector and power monitor
2.5.3 Microstructure Analysis
The thickness of the YSZ coatings deposited on a Si substrate is analyzed using the
cross-sectional scanning electron microscopy (SEM), which can be used to estimate the
deposition rate given the deposition time. The morphology of the YSZ coatings is compared
and analyzed as a function of the substrate temperature (room temperature without assisted
plasma, 100 ºC, 800 ºC and 1300 ºC) by the following techniques: SEM, focused ion beam
(FIB), X-ray photoelectron spectroscopy (XPS), and X-ray diffraction (XRD). SEM was
performed on a Hitachi S-4800 FE-SEM operated at 5 kV. Cross-section images of YSZ
coatings were obtained on a FEI Dual Beam 235 FIB, with electron-beam operated at 10 kV.
All substrates were tilted at 52° and coated with a 1µm thick platinum protection layer
before sliced by a 7000 pA ion beam and then polished with a 1000 pA ion beam. XPS

25
results were obtained and analyzed on a Physical Electronics PHI 5400 XPS and XRD
analysis was performed on a Philips X’pert X-ray diffraction system.

26
CHAPTER 3: THEORY & DIAGNOSTICS
3.1 Atmospheric Pressure Plasma Generation
3.1.1 Theory of APP Ignition and Stability
Ignition of a plasma by ionizing a neutral gas has significant dependence on the
breakdown voltage, denoted by Vb, which depends on the gas type, the background pressure,
and the distance between the electrodes, which can be denoted by equation (3.1) [41]. A
plasma can be ignited if the voltage applied between the electrodes exceeds Vb.
𝑉𝑏 =𝐵(𝑝 ∙ 𝑑)
ln 𝐴 𝑝 ∙ 𝑑 − ln[ln 1 + 𝛾𝑠𝑒−1 ]
(3.1)
Here γse is the secondary electron emission coefficient of the cathode, and A and B are
constants depending on the gas type and applied electric field, which can be experimentally
measured [42]. For inertia gases such as helium, argon, and neon, however, the following
equation is found to be a better approximation for the breakdown voltage [43]:
𝑉𝑏 =𝐵(𝑝 ∙ 𝑑)
ln 𝐴 𝑝 ∙ 𝑑 − ln[ln 1 + 𝛾𝑠𝑒−1 ] 2
(3.2)
The curves which show the dependence of Vb on the product of pressure p and electrode
spacing d are known as Paschen curves, as shown in Figure 3.1.
Fig 3.1. Paschen curves of He, Ne, Ar, H2, and N2 from Ref. [44].

27
The Paschen curves are used to describe the plasma ignition behavior of a direct
discharge. As can be seen in Figure 3.1, Vb increases remarkably when p× d is above 10,
which means a small electrode spacing is required in order to obtain a plasma ignition at
high pressure. It is also noticeable that at high pressure, He discharge is the easiest to ignite
among all the gases listed, and it seems like the inertia gases (He, Ne, Ar) are easier to ignite
than the others (H2 and N2). Helium is also found to have the ability to stabilize the plasma
due to its long lived metastable states, together with the use of a high-frequency power
source and inserting a dielectric layer, which is verified elsewhere [45].
Helium is used to initialize the plasma in the APPT at 1 atm pressure environment
throughout this study. According to Figure 3.1, if the electrodes are spaced 1 cm (p× d = 760
Torr∙cm), Vb is estimated to be ~7000 V. This result can be compared with the electric field
simulation of the APPT in the following section. Generally, in a self-sustained discharge,
which means no additional electron source is needed to maintain the plasma, the generation
of the electrons should balance the electron loss. According to the collisional-radiative (CR)
model by T. Fujimoto [46], the continuity equation for the electrons can be expressed as
equation (3.3) for each energy level p
𝑑𝑛(𝑝)
𝑑𝑡= − 𝐶 𝑝, 𝑞 𝑛𝑒
𝑞≠𝑝
+ 𝐴 𝑝, 𝑞
𝑞<𝑝
+ 𝑆 𝑝 𝑛𝑒 𝑛 𝑝
+ 𝐶 𝑞,𝑝 𝑛𝑒𝑞≠𝑝
+ 𝐴 𝑞,𝑝
𝑞<𝑝
𝑛 𝑞 + 𝛼(𝑝)𝑛𝑒
+ 𝛽(𝑝) 𝑛𝑖𝑛𝑒
(3.3)
where q is an energy level other than p, coefficients A and C are the rates of spontaneous
transition probability and excitation/de-excitation by electron collisions, respectively. S(p),
α(p) and β(p) are the rate coefficients of the ionization by electron collisions from p,
three-body recombination to level p, and radiative recombination to level p. In a helium
discharge, the time derivative in (3.3) can be assumed to be zero except than the ground state
1S and two metastable levels 2
1S and 2
3S, thus these three levels are actually coupled
together and (3.3) is no longer valid for these states. However, with further approximation
that the change in the population densities ρ(p) is changing slowly enough, the time

28
derivatives of both metastable levels can taken as zero, too. Then the population density for
all the energy levels are given by [46]
𝑑𝑛(11𝑆)
𝑑𝑡= −𝑆𝑛 11𝑆 𝑛𝑒 + 𝛼𝑛𝑖𝑛𝑒 (3.4)
𝜌 𝑝 = 𝑅0 𝑝 + 𝑅1 𝑝 𝜌 11𝑆 (3.5)
where S and α are the collisional-radiative ionization and recombination coefficients, and
𝑅0 𝑝 and 𝑅1 𝑝 are the reduced population coefficients, which in this model can all be
determined by the collisional-radiative coupling coefficients and population coefficients, if
the values of electron temperature and density are given. Although this model is derived
under assumptions of low pressure, it can be extended to atmospheric pressure together with
the kinetics of the molecular ions [47].
In this study, it can be assumed that 𝑛𝑖 ≈ 𝑛𝑒 , then in steady state case, it can be
obtained that 𝑛 11𝑆 ≈ 𝛼𝑛𝑒/𝑆. Apply 𝑆 ≈ 10−15 and 𝛼 ≈ 10−12 from [46], which is
corresponding to 𝑇𝑒 ≈ 1.6 × 10⁴ 𝐾 and 𝑛𝑒 ≈ 1015 𝑐𝑚−3, one can obtain that 𝑛 11𝑆 ≈
103𝑛𝑒 . This result verifies that the metastable state of helium atoms has a long-lived life so
that the helium discharge is relatively easy to ignite and sustain in the APPT, and the validity
of the choices of 𝑇𝑒 and 𝑛𝑒 here can be demonstrated later in this chapter when 𝑇𝑒 and
𝑛𝑒 are measured using the OES technique.
As an approach to study on the APP ignition and operation stability, the ignition power
and extinction power (the lowest power that is able to sustain the plasma) of helium only,
helium mixed with different percentage of nitrogen, and helium mixed with different
percentage of oxygen is measured and compared in Table 3.1-3.3 and Figure 3.2-3.3. The
error of the power results from the fluctuation of the power reader and deviations of multiple
measurements.

29
Table 3.1. Experimental data of the ignition and extinction power of the helium plasma
He (lpm) Ignition Power PI (W) Error of PI (W) Extinction Power PE (W) Error of PE (W)
72 391 28 127 13
109 428 30 181 18
145 406 46 195 19
181 424 41 206 21
217 432 22 211 21
253 421 31 220 22
290 461 11 219 22
Table 3.2 Experimental data of the ignition and extinction power of the helium mixed
with nitrogen plasma
N2 (%) Ignition Power PI (W) Error of PI (W) Extinction Power PE (W) Error of PE (W)
0.019 471 32 158 1
0.038 512 51 159 2
0.057 525 37 169 3
0.076 605 33 177 2
Table 3.3 Experimental data of the ignition and extinction power of the helium mixed
with oxygen plasma
O2 (%) Ignition Power PI (W) Error of PI (W) Extinction Power PE (W) Error of PE (W)
0.017 463 19 193 1
0.033 448 46 200 11
0.050 462 37 206 11
0.067 436 27 213 5

30
Fig 3.2. Comparison of ignition and extinction power of the helium (flow rate: 109 lpm)
plasma at different flow rate.
Fig 3.3. Comparison of ignition and extinction power of the helium mixed with nitrogen
and helium (flow rate: 109 lpm) mixed with oxygen plasma at different mix rate.
It is found that the ignition of pure helium plasma in the APPT does not have a strong
dependence on the helium flow rate, which is in agreement with the statement in [3].
However, the ignition power is slightly increased at a high flow rate around 300 lpm than

31
that at a flow rate of 70 lpm, due to the pressure turbulence around the antenna tip by the
high flow rate. On the other hand, there is obvious dependence of the extinction power on
the flow rate in a pure helium plasma. This result can be explained by the production-loss
balance of the electrons. As the flow rate increases, the loss rate of the electrons during the
relaxation process is increased due to the increased probability of collisions, while the
production of the electrons is kept at the same level or even lower (due to the pressure
turbulence), thus a higher electric field is needed to sustain the plasma. Therefore, the
extinction power is higher when the gas flow is increased, as the experimental results show
in Figure 3.2.
The ignition power and extinction power can be strongly affected by mixing the helium
with a small proportion of other gases. Less than 0.1 volumetric percentage of nitrogen will
increase the ignition power from around 400 W to above 600 W, but also increase the
operational stability by reducing the extinction power. It is interesting, however, a similar
percentage of oxygen (less than 0.1%) mixed in the helium plasma tends to behave in an
opposite way. The ignition power is slightly decreased when 0.07% of oxygen is mixed with
helium, but the extinction power is higher than that of a pure helium plasma, and it increases
as the percentage of oxygen is higher. The mechanisms of the instability account for the
mixture gases is complicated, but the opposite behavior of nitrogen and oxygen mixture may
result from the generation of molecule ions, which is mostly 𝑁2+ and 𝑂2
− at these electron
tempeartures. An oxygen molecule tends to obtain one electron and a nitrogen molecule
tends to lose one electron when they are excited, thus the production of electrons are more
difficult to balance the loss in the oxygen discharge, which explains the higher extinction
power of the helium/oxygen plasma and lower of the helium/nitrogen plasma, compared
with the case of a pure helium plasma. The opposite charge of these two species can also
cause different instability mechanisms, which in the oxygen case is not mainly a thermal
instability (which is the major instability in a pure helium plasma) anymore, instead, the
instability due to the dissociative-attachment mechanism between 𝑂2− and electrons when
the number density of them is on the same order becomes more significant at atmospheric
pressure.

32
3.1.2 Electric Field Simulation Results of APPT
The electric field induced by the microwave power around the tip of antenna is the
origin of the plasma ignition. Helium discharge requires ~7000 V/cm in a planar electrodes
spaced at 1 cm. In the APPT case, this model needs to be modified in the cylindrical
ordinates. Theoretically, the electric field can be calculated using the integral form of
Gauss’s Law
𝐸 ∙ 𝑑𝑆 =𝑄
ε𝑆
(3.6)
where the left-hand side is the electric flux integral over a closed surface S, and the
right-hand size is the total electric charge Q divided by the permittivity of the media.
Applying the cylindrical coordinate for the APPT model in this equation, and defining the
capacitance between the antenna and the copper wall to be C, which, by a rough estimation,
can be calculated as the infinite cylindrical capacitor case,
𝐶 =
2𝜋𝜀𝐿
ln𝑏𝑎
(3.7)
where L denotes the length of the cylinders, a and b are radii of the inner and outer
electrodes, respectively. If the voltage applied on the antenna which is provided by the
microwave is V, from (3.6) and (3.7), one can easily find
𝐸(𝑟) =
𝑉
r ∙ ln𝑏𝑎
(3.8)
and the breakdown voltage around the tip of the antenna is
𝑉𝑏 = 𝐸(𝑎) ∙ 𝑎 ∙ ln𝑏
𝑎 (3.9)
Comparing (3.8) to the planar electrode capacitor, the only difference is (3.8) has a ln𝑏
𝑎
term, which means the ratio of the outside radius (torch) to the inner radius (antenna) is the
most important variable to determine Vb. If 1 <𝑏
𝑎< 𝑒, the value of Vb will be smaller than
in the planar case, which is always desirable for the plasma ignition. However, it is also
noticeable that the errors in the calculation of C for the APPT model can be originated from:
(1) The quartz tube between the electrodes, which is a dielectric layer that limits the
minimum difference between b and a, and also affects the distribution of the electric field; (2)

33
The assumption that the lengths of the electrodes are infinite is only valid when L is much
larger than a and b, which is not true in the APPT case of this study. When ba, the
cylindrical capacitor is getting closer to the planar capacitor, and the edge effect becomes
stronger, which presents in this case as the arc ignition between the two electrodes given a
strong enough electric field. The solution for (1) is relatively simple, for the permittivity
doesn’t show in equation (3.8), and it can be ignored if the discharge tube is not too close to
the antenna. Regarding the correction of (2), although the capacitance of two finite
cylindrical electrodes strongly depends on the geometrical configuration, such as the ratio of
electrode diameter to cylinder length, it can be analytically solved using Coulomb method
[48]. Applying the parameters of APPT L = 14 cm, a = 3.2 mm and b = 13 mm, an error of
the capacitance which is less than 10% can be estimated from Ref. [48], and the modified
capacitance should be slightly larger than what is calculated from equation (3.7), which will
further increase the value of Vb in this case.
The electric field in (3.9) is modeled and analyzed in the High Frequency Structure
Simulator (HFSS, Ansys Inc., USA), which is a commonly used 3D electromagnetic field
simulator. The diagram of the APPT is shown in Figure 3.4 below. The scale of the model is
assigned to be 1:1 to the actual device, and conductivities of materials are chosen from the
HFSS database, which determine the boundary conditions. A 2.45 GHz microwave is used as
the excitation from the waveport, which simulates the source of the open end of the
waveguide adaptor. The electric field can be plotted separately for each part of the APPT,
Figure 3.5, for example, shows the electric field distribution in the discharge tube. The
ignition power is assigned to be 400 W according to the data listed in Table 3.1-3.3.
Fig 3.4. The APPT structure model in HFSS.

34
Fig 3.5. The distribution of electric field (magnitude) in the discharge tube
(antenna: 0.25” diameter, discharge tube: 13×16.2 mm, power: 400 W).
The electric field near the tip of antenna is most intriguing in this simulation, for the
reason the theoretical model stated earier cannot derive a precise estimation due to the
boundary effects. A reference plane is assigned along the mid-plane of the antenna, and two
different sizes of antenna and discharge tube are combined and compared in Figure 3.6.
Fig 3.6. Simulation results of (1) top left: 0.25” diameter antenna with 13×16.2 mm
quartz tube; (2) top right: 0.25” diameter antenna with 18×21 mm quartz tube; (3)
bottom left: 0.375” diameter antenna with 13×16.2 mm quartz tube; (4) 0.375”
diameter antenna with 18×21 mm quartz tube. Power is 400 W for all results.
The simulation results show that the thicker (larger a) antenna yields stronger electric

35
field near the tip of the antenna, where the plasma is ignited. This result is in agreement with
equation (3.9). Also, with the thickness of the discharge tube kept almost the same, larger
diameter discharge tube tends to decrease the electric field of the ignition area, which is not
expected by the theoretical model. The reason for this is that the permittivity ε of between
the antenna (anode) and APPT wall (cathode) is averaged out in the theoretically model,
which is not explicitly shown in (3.9). However, ε in fact is a parameter with spatial
variation, which will affect the spatial distribution of the electric filed. A possible
modification of the theoretical model is to consider the discharge tube as another boundary.
Substitute the values of electric field from the simulation results into equation (3.9), an
estimated value of the breakdown voltage can be obtained
𝑉𝑏 = 1.3 × 10³ 𝑉𝑜𝑙𝑡𝑠 (3.10)
Notice that this value is much lower than that calculated from the Paschen curve (7000 V).
This difference may originate from the following reasons: (1) The discharge tube should be
treated as another discontinuous boundary in the electric field distribution, thus the effective
spacing between the electrodes should be smaller than 1 cm, as is assumed in the product p
× d; (2) The Paschen curves in Figure 3.1 only describes the DC discharges, which should
be calibrated with equation (3.2) in the microwave-induced discharges, and will result in a
decrease in the curve envelope of the helium discharge; (3) The simulation results do not
take account of any effect resulted from the specific gas type, the flow rate and pressure
turbulence of the plasma gas, which may affect the breakdown voltage.
3.2 Optical Emission Spectroscopy (OES) Diagnostics
3.2.1 Optical Emission Spectroscopy (OES) Theory
The OES method is widely used in the diagnostics of high-pressure discharges due to
the fact that enormously high collision rate and small mean free path of the plasma particles.
Traditional Langmuir probe measurement which is commonly used for the low-pressure
discharges based on the collisionless thin-sheath approximation when the probe size is
smaller compared to the mean free path [49]. However, the sheath is thick at high pressure

36
and the probe size is much larger than the mean free path, thus complicated modifications
and appropriate theoretical assumptions must be made in order to perform accurate
measurements for the high-pressure discharge [50,51]. The complexity of the use of
Langmuir probe in this study is increased by three more mechanisms: (1) The perturbation
of electric field around the plasma ignition area. The Langmuir probe needs to be placed
close to the plasma ignition area to get a relatively reliable signal of the electrons and ions,
where the electric field is usually the strongest, thus an arc formed between the probe and
the antenna is almost inevitable in the APPT; (2) Langmuir probe theory for low gas
temperature plasma is no longer applicable, thermal diffusion is a significant mechanism
which can no longer be neglected; (3) Most of the APPs requires large gas flow rate, which
has been verified to cause large deviations from static discharge [52].
The OES method is believed to be more reliable in high-pressure discharges diagnostics,
for the Boltzmann balance can be achieved by collisions, thus the atoms, ions and electrons
stay in local thermodynamic equilibrium (LTE), and can be considered to have the same
temperature. In this study, the degree of ionization is large in the plasma generated in the
APPT, and abundant free electrons are able to control the density distribution of atomic
excited states to be Boltzmann distribution, thus the densities of an atomic excited state n(p)
satisfies [53]*
𝑛 𝑝 =𝑔 𝑝
2𝑔𝑖𝑛𝑒𝑛𝑖
ℎ2
2𝜋𝑚𝑒𝑘𝑇𝑒
3/2
exp −𝐸 𝑝
𝑘𝑇𝑒 (3.11)
where g(p) and gi are the statistical weights of excited state p and the ground state,
respectively, Te is the electron temperature, ne and ni are the electron density and ground
state ion density, and E(p) is the excitation energy of the atomic level p. If all the energy
levels of a plasma can be described by equation (3.11), the plasma is said to be in local Saha
equilibrium (LSE). However, as has been stated in the C-R model earlier in this thesis, the
behavior of metastable states and the ground state has a different distribution with higher
energy states in a way they are coupling together, so these states cannot be described by
* Ref. [52] uses the negative energy in the Boltzmann distribution, according to which the exponential
term is expressed as exp 𝐸 𝑝
𝑘𝑇𝑒 , instead of exp −
𝐸 𝑝
𝑘𝑇𝑒 .

37
(3.11). For higher energy states, although ionization and recombination processes are mostly
controlled by electrons, radiative de-excitation and ions can also contribute a small part in
them, thus the plasma is said to be in partial local Saha equilibrium (pLSE).
In OES measurements, the intensities of the spectral lines are the only but most
significant information which can be used to analyze the properties of a plasma. Assume
pLSE is satisfied, the intensity of a specific spectral line representing a transition pk is
given by
𝐼𝑝→𝑘 = 𝑛 𝑝 𝐴𝑝→𝑘𝐸𝑝→𝑘 (3.12)
where 𝐴𝑝→𝑘 is the Einstein constant for spontaneous emission from level p to k, and
𝐸𝑝→𝑘 = ℎ𝑐/𝜆𝑝→𝑘 is the photon energy generated in this transition. With (3.11) and (3.12), it
can be immediately seen that the intensity of a specific transition is in proportional to the
density of an atomic excited state, thus the detailed transition profile in a plasma can be
calculated theoretically if the intensity of each transition is given. A departure from pLSE
will result in a nonlinear relation between 𝐼𝑝→𝑘 and 𝐸𝑝→𝑘 , which can be estimated on the
plot 𝑙𝑛 𝑛(𝑝) vs 𝐸(𝑝). The error of the electron temperature measurements due to the
departure from pLSE will be discuss it in the following section.
3.2.2 Optical Emission Spectroscopy (OES) Results
3.2.2.1 Plasma Electron Temperature Measurements
As discussed in previous section, if the absolute intensity of any known transition in a
discharge and the densities of electrons and ions are given, the electron temperature can be
easily acquired from equation (3.11) and (3.12). However, even after calibration with the
standard luminance source, the absolute intensity of a spectral line is not reliable due to the
background noise and inherent mechanical noise of optical devices. Nevertheless, the ratio
of the intensities is more convenient to use, and the accuracy depends on how many
transitions the monochromator can find in a stable discharge, which means Te and ne are not
changing as a function of time here. Therefore, it is obvious from (3.11) and (3.12) that

38
𝑙𝑛𝐼𝑝→𝑘𝜆𝑝→𝑘
𝑔(𝑝)𝐴𝑝→𝑘= −
𝐸 𝑝
𝑘𝑇𝑒+ 𝑐𝑜𝑛𝑠𝑡𝑎𝑛𝑡 (3.13)
The reference data of 𝜆𝑝→𝑘 , 𝐴𝑝→𝑘 and 𝑔(𝑝) for a particular transition can all be found at
NIST Atomic Spectra Database*. A typical spectrum of the helium plasma generated from
APPT in this study is shown in Figure 3.7. According to (3.13), if the relative intensities I of
several transitions in a plasma can be measured, the electron temperature 𝑇𝑒 can be
determined by the slope on the plot of 𝑙𝑛𝐼𝑝→𝑘𝜆𝑝→𝑘
𝑔(𝑝)𝐴𝑝→𝑘 versus 𝐸 𝑝 , which is known as the
Boltzmann plot. In the helium plasma generated in the APPT, more than 10 strong
transitions can be found in the emission spectrum in Figure 3.7, but only peaks in the range
of 300-800 nm should be used because the wavelength and intensity calibrations are only
conducted in this range. It needs to be emphasized that the OES spectrum rules out the
metastable levels of helium due to these transitions are difficult to be measured by emission
technique, but rather absorption method.
Fig 3.7. Left: Spectrum of the helium plasma generated in the APPT;
Right: Identification of some of the transitions in the helium plasma
The Boltzmann plots of helium plasma at different gas flow rate are shown in Figure
3.8. The reference wavelengths, Einstein constants, transition quantum number and the
excitation energy chosen are listed in Table 3.4. Note that for a same wavelength, two or
more transitions are possible due to the differences in the quantum number and Einstein
constants of the spontaneous emission, but the intensities of all these transitions are coupled
* Ref. from http://www.nist.gov/pml/data/asd.cfm.

39
together. Therefore, for each transition at the same λ, 𝑙𝑛𝐼𝑝→𝑘𝜆𝑝→𝑘
𝑔(𝑝)𝐴𝑝→𝑘 needs to be calculated,
and the intensity measured at this wavelength should be the average of all the transition,
assuming the probability for each transition is the same.
Table 3.4 Transitions selected from the helium plasma in the APPT
λ/Å Aki/s-1
gk Ek/cm-1
3888.6480 9.4746E+06 3 185564.6
9.4746E+06 5 185564.6
4026.1914 3.2224E+05 3 193917.2
2.8999E+06 5 193917.2
1.1601E+07 7 193917.2
4.8336E+06 3 193917.2
8.6997E+06 5 193917.2
4471.4802 6.8275E+05 3 191444.5
6.1440E+06 5 191444.5
2.4579E+07 7 191444.5
1.0241E+07 3 191444.5
1.8432E+07 5 191444.5
4713.1457 5.2894E+06 3 190298.1
3.1736E+06 3 190298.1
4921.9313 1.9863E+07 5 191446.5
5015.6783 1.3372E+07 3 186209.4
5875.6210 1.7673E+07 5 186101.5
7.0708E+07 7 186101.5
2.9462E+07 3 186101.6
5.3019E+07 5 186101.5
6678.151 6.3705E+07 5 186105.0
7065.190 1.5474E+07 3 183236.8
9.2844E+06 3 183236.8

40
Fig 3.8. Boltzmann plots of He I excited levels yielding the electron temperature
(excitation temperature) of the helium plasma at different gas flow rate (Power: 200 W,
measurements obtained at 3 cm away from the tip of the antenna in APPT).
From the straight line fitted in the Boltzmann plot in Figure 3.8, it seems that these
atomic states in the helium plasma satisfy the Boltzmann distribution. However, it is
noticeable that at the low Ek end, the value of 𝑙𝑛𝐼𝑝→𝑘𝜆𝑝→𝑘
𝑔(𝑝)𝐴𝑝→𝑘 is obvious departed from the
Boltzmann distribution, this is a proof that the helium plasma in this study is not a pLSE
plasma, but rather an ionizing plasma, which means the lower excited states are
overpopulated. Theoretically, it is proved the Boltzmann plot is reliable if the energy
separation between atomic and ionic levels is large enough compared with Te [52]. In this
study, the atomic energies of helium are in the range of 22-24 eV, and the ionic energy of
helium is 24.6 eV, thus the separation of these energy levels are not large enough compared
to the electron temperature. Since Te is obtained from the slope of the Boltzmann plot, it can
be concluded that Te increases as the excitation energy decreases, thus the value of Te

41
deduced by Figure 3.8 is lower than the actual electron temperature. Another assumption
that has been made in this calculation is that the excitation temperature and the electron
temperature are assumed to be the same in the pLSE plasma, which is not valid in the
helium plasma in the APPT. A calibration equation for Te is given in [54]
𝑇𝑒 ,𝑐𝑎𝑙𝑖𝑏𝑟𝑎𝑡𝑒𝑑 = 0.03 × exp 𝑇𝑒
0.11 (3.14)
where both temperatures are in eV. (3.14) is valid when the electron density of plasma is
high ( ne > 1013
-1014
cm-3
) and the plasma gas temperature is low (Tg << 1 eV), which can be
verified in the following sections is the case for the helium plasma in this study. The
calibrated electron temperature is listed in Table 3.5, which is a larger number than Te
deduced from the Boltzmann plot at a specific flow rate. The results are compared in Figure
3.9.
Table 3.5 Calibrated Te of the helium plasma versus flow rate
Flow Rate (lpm) Slope Te (K) Te, calibrated (K)
30 -(3.94±0.70)E-04 (3.7±0.7)E03 (6.1±3.1)E03
40 -(3.82±0.60)E-04 (3.8±0.6)E03 (6.7±3.1)E03
50 -(3.21±0.80)E-04 (4.5±1.1)E03 (1.2±1.0)E04
Fig 3.9. Calibrated electron temperature compared with excitation temperature versus
gas flow rate of the helium plasma at 200 W.

42
The measured electron temperature is in the range of 3000-5500 K, and its dependence
on the gas flow rate is not significant as can be seen in Figure 3.9. This result could be
expected for the reason stated previously in the section where the APP ignition theory is
discussed. However, after calibration, the electron temperature seems to increase as the flow
rate increases which may result from the calculation using (3.14). It can be expected that as
the flow rate change, many characteristics such as the electron density and plasma gas
temperature of the plasma will all be affected, thus the constants in the empirical equation
(3.14) needs to be modified for each individual experimental condition. As can be seen from
Figure 3.9, a significant error is estimated from the calibrated electron temperature results
when the gas flow rate is at 50 lpm. This calibration only gives an approximate relation
between the excitation temperature and the electron temperature, but it also brings larger
error due to this relation is empirical. It needs to be emphasized that the flow rate can affect
the electron temperature in the way that it changes the local pressure distribution near the
plasma ignition area or through cooling mechanism along the plasma downstream. A
relatively low pressure area can be formed in front of the tip of the antenna by this
mechanism, and the pressure will slightly decrease when gas flow is increased. Therefore,
the electron temperature may be slightly increasing due to the decrease of the collisions with
larger gas flow rate.
3.2.2.2 Plasma Electron Density Measurements
A common method to calculate the electron density is to analyze the Stark broadening
of different Balmer series lines of hydrogen. The Stark broadening is originated from the
quantum Stark effect, which describes the interaction between an emitted atom or molecule
and an external electric field, which in this case is provided by the charged particles in the
plasma. In the conditions of electron density ne less than 1016
cm-3
, the external field is
created predominantly by ions in the plasma, which can be considered as quasi-static [55].
The Hβ spectral line at 486.1 nm is popularly chosen for measuring the electron density
for its strong Stark broadening effect and weak self-absorption [56]. However, the intensity
of Hβ line is usually too weak to be distinguished with background noise, thus a small

43
portion of hydrogen needs to be added into the plasma. In this study, about 1% hydrogen is
introduced into the plasma in order to get a strong enough signal for an accurate
measurement, and we consider this introduction does not strongly affect the plasma
dynamics. The full width at half-maximum (FWHM) of Stark broadening of the Hβ line is
given by Griem in [57]
∆𝜆𝑆𝑡𝑎𝑟𝑘 = 2.50 × 10⁻⁹𝛼1/2𝑛𝑒2/3
(3.15)
where ∆𝜆𝑆𝑡𝑎𝑟𝑘 is in nm, ne is in cm-3
, and α1/2 is a the reduced wavelength tabulated in [58],
which varies for different transitions and also has a weak dependence on Te and ne. For the
hydrogen Balmer β line, 𝛼1/2 is in the range of 7.62 × 10⁻³-8.03 × 10⁻³ nm if Te is
from 5000-10000 K and ne is from 1014
-1015
cm-3
. Here we choose 𝛼1/2 = 7.83 × 10⁻³ nm
as an average value, thus (3.15) becomes
∆𝜆𝑆𝑡𝑎𝑟𝑘 = 1.96 × 10⁻¹¹𝑛𝑒2/3
(3.16)
which gives the value for ne if ∆𝜆𝑆𝑡𝑎𝑟𝑘 can be found from spectra. In OES, the broadening
mechanisms of a spectral line are categorized into two main types: Gaussian broadening and
Lorentzian broadening effects, which are distinguished by the line shape due to the
broadening. Stark broadening, for instance, is a Lorentzian broadening effect. There are
three broadening mechanisms considered in this study besides the Stark broadening: (1)
Instrumental broadening. The instrumental broadening is mainly introduced by the slit width
of the monochromator, which cause the diffraction dispersion in the spectral line. The line
shape of this broadening effect is considered as the Gaussian function, and is measured by
the line width of He-Ne laser beam at 632.8 nm. (2) Doppler broadening. If the velocity
distribution of the hydrogen atoms is approximated by a Maxwell-Boltzmann function in the
pLSE plasma, the Doppler broadening can be estimated by
∆𝜆𝐷 = 𝜆0 8𝑘𝑇𝑔𝑙𝑛2
𝑚𝑐2
1/2
= 7.16 × 10⁻⁷𝜆0 𝑇𝑔
𝑀
1/2
(3.17)
where 𝜆0 = 486.1 𝑛𝑚 is the central wavelength of Hβ line, 𝑇𝑔 is the gas temperature of
the plasma in K, which is measured by a thermocouple, and m, M is the atomic mass of the
emitter (He atom) in kg and amu, respectively. (3) van der Waals broadening. This effect is
originated from the dipolar interaction between the excited atoms (the emitter) with the

44
dipoles formed by the excited atoms and a neutral molecule in the ground state (the
perturber). The half width at half maximum (HWHM) of the van der Waals broadening in
the frequency space is given by [57]
∆𝜔𝛼 = 𝜋𝑁 9𝜋ħ5𝑅𝛼
2
16𝑚𝑒3𝐸𝑝
2
25
𝑣35
(3.18)
where v is the relative speed of the emitter and the perturber, which can be related to the
mean speed of the atoms
𝑣35
=
4
𝜋
210
Γ 9
5 𝑣
35 = 0.98
8𝑘𝑇𝑔
𝜋𝜇
310
(3.19)
𝜇 is the reduced mass of the emitter-perturber pair. 𝑅𝛼2 is the matrix element, which is
approximately 520 for the Hβ line [59]. Ep is the energy of the first excited state of the
perturber, which in helium plasma case is 24.6 eV, and 𝑁 = 𝑃/𝑘𝑇𝑔 is the number density of
the perturber. Therefore, the FWHW of van der Waals broadening in helium plasma in the
wavelength domain can be written as
∆𝜆𝛼 = 0.98𝜆0
2
𝑐
𝑃
𝑘𝑇𝑔
9𝜋ħ5𝑅𝛼2
16𝑚𝑒3𝐸𝑝
2
25
8𝑘𝑇𝑔
𝜋𝜇
310
=1.9
𝑇𝑔0.7 (3.20)
where is in nm and Tg is in K. The helium plasma has smaller van der Waals
broadening contribution compared to air plasma or argon plasma due to the large value of Ep.
The convolution profile of a spectral line with both Gaussian and Lorentzian contributions is
a Voigt line shape. Assume the Gaussian and Lorentzian contribution is ∆λG and ∆λL,
respectively, given by
∆𝜆𝐺 = ∆𝜆𝑖𝑛𝑠𝑡𝑟𝑢𝑚𝑒𝑛𝑡 2 + ∆𝜆𝐷
2 (3.21)
∆𝜆𝐿 = ∆𝜆𝑆𝑡𝑎𝑟𝑘 + ∆𝜆𝛼 (3.22)
and the FWHM of a Voigt line shape with Gaussian width wG and Lorentzian width wL is
given empirically by [60]

45
∆𝜆𝑉𝑜𝑖𝑔𝑡 = 0.5346∆𝑤𝐿 + 0.2166 ∆𝑤𝐿 2 + 1.3862 ∆𝑤𝐺
2 12 (3.23)
which is obtained by fitting the Hβ line with a Voigt curve. Therefore, the Stark broadening
can be expressed by
∆𝜆𝑆𝑡𝑎𝑟𝑘 = ∆𝜆𝑉𝑜𝑖𝑔𝑡 − ∆𝜆𝑖𝑛𝑠𝑡𝑟𝑢𝑚𝑒𝑛𝑡
2 + ∆𝜆𝐷 2 − ∆𝜆𝛼 (3.24)
The line shape of the Hβ line is shown in Figure 3.10 below. The Voigt fitting is
conducted in Origin by iteration. The electron density profile as a function of the axial
distance from the tip of antenna is shown in Figure 3.11. Contribution of each mechanism
for the overall line shape is listed in Table 3.6 for this measurement.
Fig 3.10. Hβ line shape at 100 W input power. Spectrum is taken 4 cm away from the tip
of the antenna. Red line shows the Voigt fit for the experimental data. Blue line is the fit
after excluding the instrumental, Doppler and van der Waals broadening mechanisms,
which is estimated to be the line shape of the Stark broadening.
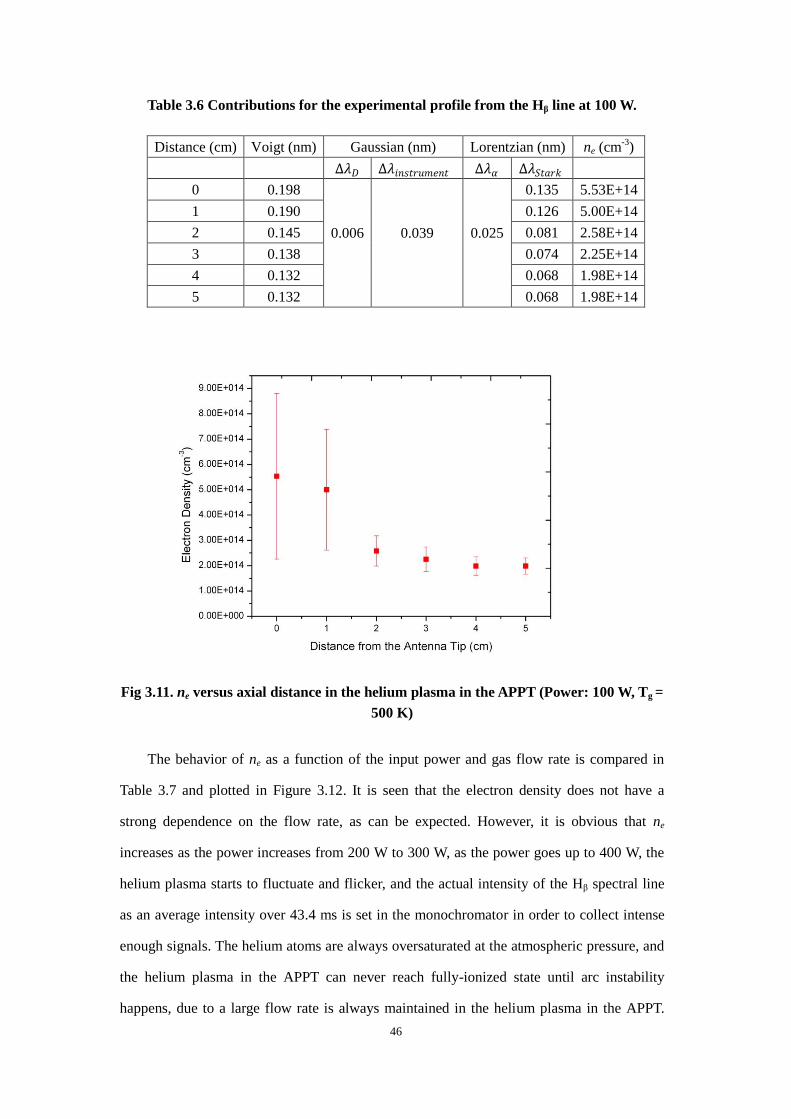
46
Table 3.6 Contributions for the experimental profile from the Hβ line at 100 W.
Distance (cm) Voigt (nm) Gaussian (nm) Lorentzian (nm) ne (cm-3
)
∆𝜆𝐷 ∆𝜆𝑖𝑛𝑠𝑡𝑟𝑢𝑚𝑒𝑛𝑡 ∆𝜆𝛼 ∆𝜆𝑆𝑡𝑎𝑟𝑘
0 0.198
0.006
0.039
0.025
0.135 5.53E+14
1 0.190 0.126 5.00E+14
2 0.145 0.081 2.58E+14
3 0.138 0.074 2.25E+14
4 0.132 0.068 1.98E+14
5 0.132 0.068 1.98E+14
Fig 3.11. ne versus axial distance in the helium plasma in the APPT (Power: 100 W, Tg =
500 K)
The behavior of ne as a function of the input power and gas flow rate is compared in
Table 3.7 and plotted in Figure 3.12. It is seen that the electron density does not have a
strong dependence on the flow rate, as can be expected. However, it is obvious that ne
increases as the power increases from 200 W to 300 W, as the power goes up to 400 W, the
helium plasma starts to fluctuate and flicker, and the actual intensity of the Hβ spectral line
as an average intensity over 43.4 ms is set in the monochromator in order to collect intense
enough signals. The helium atoms are always oversaturated at the atmospheric pressure, and
the helium plasma in the APPT can never reach fully-ionized state until arc instability
happens, due to a large flow rate is always maintained in the helium plasma in the APPT.

47
Therefore, the increased electric field intensity tends to ionize more atoms in the gas flow
when input power is increased, which results in the increase of ne.
Table 3.7 Contributions of the broadening mechanisms of the Hβ line shape and the
measured ne in the helium plasma with 200-400 W input power and 20-50 lpm flow rate
at the tip of the antenna. Error estimates are shown in Figure 3.12.
Power
(W) ∆𝜆𝑖𝑛𝑠𝑡𝑟𝑢𝑚𝑒𝑛𝑡 ∆𝜆𝐷 ∆𝜆𝛼
ne (cm-3
)
(nm) (nm) (nm) 20 lpm 30 lpm 40 lpm 50 lpm
200 0.193
0.0078 0.0245 8.18E+15 8.51E+15 6.94E+15 6.68E+15
300 0.0110 0.0151 1.45E+16 1.51E+16 1.61E+16 1.38E+16
400 0.0134 0.0114 2.02E+16 1.46E+16 1.56E+16 1.66E+16
Fig 3.12. ne of the helium plasma as a functions of input power and helium flow rate at
the tip of the antenna
It needs to be emphasized that the error in this measurement rises mainly from the
instrumental broadening effect, for the slit width is set to be more than 300 μm in order to
get intense spectral signals. However, the measurement of the instrumental broadening effect
using a He-Ne laser is no longer reliable if the slit width is very large, for the detected
spectral line start to depart from the Gaussian shape. The actual instrumental broadening
should be larger than the ∆𝜆𝑖𝑛𝑠𝑡𝑟𝑢𝑚𝑒𝑛𝑡 measured, and the actual electron density should be

48
smaller than the measured ne. Another error results from the gas temperature estimated by
the thermocouple, which cannot be precisely measured at the ignition area due to the
perturbation of the thermocouple with the APPT antenna, thus Tg can only be measured a
few millimeters away from the ignition area (the tip of the antenna), which yield to be
around 1500 K, 1000 K and 500 K at 400 W, 300 W and 200 W, respectively, in the ∆𝜆𝐷
and ∆𝜆𝛼 calculations. The actual Tg should be higher which results in a decrease in ∆𝜆𝛼
and an increase in ∆𝜆𝐷, therefore will affect ne determined by which broadening effect is
more predominant.
3.2.2.3 Plasma Gas Temperature Measurements
The gas temperature of a helium plasma is commonly determined by comparing the
spectroscopic intensities of nitrogen molecules (the 𝑁2+ first negative system B-X at 356.4
nm and 391.4 nm [58], N2 first positive system B-A in the 600-900 nm range, or N2 second
positive system C-B in the 300-420 nm range), or hydroxyl radicals (OH A-X transition in
the 306-312 nm range) with theoretically calculated ones. The theoretical base for this is the
frequent energy exchanges between the plasma molecules and the rotational-vibrational
states of these molecules by collisions [52]. A small portion of water vapor and nitrogen gas
sometimes needs to be mixed into the plasma in order to get intense OH and 𝑁2+ spectra.
In this study, the N2 second positive system (C-B) in the range of 360-390 nm, instead
of OH A-X band, is used in the Tg measurements for two reasons: (1) The OH A-X is proved
to be reliable when Tg is lower than 1800 K [61], which may be lower than the Tg of the
plasma generated in APPT, especially when the power is high. (2) The OH A-X transitions
are easily overlapped by strong emission from N2 C-B transitions from the ambient air. The
rotational temperature is determined by fitting the experimental N2 C-B spectrum with the
calculated spectrum by the SPECAIR code [62], which can be used as a good estimate for
the plasma gas temperature due to the fast relaxation in atmospheric pressure. The electronic
excitation temperature Tel, rotational temperature Tr, translational temperature Tt, and
vibrational temperature Tv can be all individually adjusted in SPECAIR. In non-equilibrium
plasmas these temperatures typically satisfy the relation Te > Tel > Tv >Tr ≈ Tt [63]. With this

49
relation, the behavior of changing different temperatures can be simulated in SPECAIR and
summarized here: (1) Increasing or decreasing Te only results in the increase or decrease in
the absolute intensity of the N2 C-B spectra. The profiles of these spectra are exactly the
same after normalizing to the highest intensity at 380.4 nm. (2) Increasing Tr mainly
increases the width of each peak in the N2 C-B spectra and also increases the relative
intensity of the peaks at 375.3 nm, 370.85 nm and 367.0 nm, as shown in Figure 3.12. (3)
Increasing Tv, on the other hand, mainly increases the relative intensity of the peaks at 375.3
nm, 370.85 nm and 367.0 nm, with the profile of the 380.4 nm peak remains exactly the
same, and also increases the width of each peak in the N2 C-B spectra, as shown in Figure
3.13. These facts provide a convenient approach to fit the measured spectra with the
calculated spectra in SPECAIR. The slit function is a triangle of base width 0.35 nm, the
best fit of the measured N2 C-B transition at 400 W and 0.3 lpm N2 in the SPECAIR
calculation is shown in Figure 3.14.
Fig 3.13. Simulative profiles of N2 C-B spectra in SPECAIR at various rotational
temperatures, normalized to the intensity of the peak at 380.3 nm (Tv = 3000 K).

50
Fig 3.14. Simulative profiles of N2 C-B spectra in SPECAIR at various vibrational
temperatures, normalized to the intensity of the peak at 380.3 nm (Tr = 1200 K).
Fig 3.15. Measured N2 C-B spectrum in the helium plasma generated in the APPT (400
W, N2 flow rate: 0.3 lpm) compared with the best-fit spectrum in SPECAIR.
The measured N2 C-B spectra are compared in Figure 3.16 and Figure 3.17 as a
variation of the amount of N2 mixed in the helium plasma (~150 lpm) in the APPT and the
input microwave power. The results clearly show that, as the amount of N2 increases from
0.3 lpm to 0.7 lpm, the plasma gas temperature also increases, but no obvious increase is
observed when the N2 flow rate increases above 0.7 lpm. In the meanwhile, the plasma starts
to fluctuate and become unstable when N2 flow rate reaches above 0.9 lpm at the power of
300 W, and the cool down effect start to become more significant as flow rate increases.

51
Fig 3.16. Measured N2 C-B spectrum versus different amount of N2 mixed in the helium
plasma generated in the APPT (Power: 300 W).
Fig 3.17. Measured N2 C-B spectrum versus microwave power in the helium plasma
generated in the APPT (N2 flow rate: 0.9 lpm).
It is interesting that although the plasma gas temperature Tg is increasing with power
from 200 W to 400 W, it seems that the N2 C-B spectrum of a medium power (300 W) gives
the highest Tv of all three powers in Figure 3.17, for the first three N2 C-B peaks (3, 5), (2, 4)
and (1, 3) have the highest ratio referred to the last peak (0, 2) among these three spectra.
This result is verified in Figure 3.18 shown below, which illustrate the dependence of Tr and
Tv on the microwave power and N2 flow rate. Once again it can be seen that the cooling
effect of N2 gas flow is becoming more significant at higher power (or at higher rotational

52
temperature), which results in a slight decrease in Tr when the N2 flow rate is increased. The
vibrational temperature Tv is always higher than the rotational temperature Tr, but it has no
strong dependence on the N2 flow rate or the power.
Fig. 3.18. Measured N2 C-B spectrum versus microwave power and N2 flow rate in the
helium plasma generated in the APPT.
3.3 Theory of the Formation of YSZ Coating Microstructure
The morphology of the YSZ coatings has a strong dependence on the substrate
temperature and deposition pressure. The model of the relationship between the YSZ
microstructure and the ratio of the substrate temperature Ts to the YSZ melting temperature
and Tm = 2700 ºC has been established for the thermal evaporation in a low pressure
deposition. The YSZ growth can be categorized into three different processes according to
the ratio of Ts/Tm [30]: (1) Ts/Tm < 0.3 (Ts < 810 ºC), the coatings have a porous columnar
structure; (2) 0.3 < Ts/Tm < 0.5 (810 ºC < Ts < 1350 ºC), the coatings have a polycrystalline
dense columnar structure; (3) Ts/Tm < 0.5 (Ts < 1350 ºC), the coatings have a enhanced
crystalline dense columnar structure. The deposition pressure is a crucial parameter for the
deposited microstructure for it determines the mean free path of the ablated species,

53
therefore will affect the kinetic energy of these species when they reach the substrate. The
microstructure of deposited YSZ coatings as a dependence on the pressure and substrate
temperature is described in Figure 3.19.
Fig 3.19. Microstructures of deposited YSZ coatings as an effect of substrate
temperature and deposition pressure, From Ref. [30].
Generally, a dense and crystalline microstructure can be formed at high temperature and
low pressure, whereas a porous and non-crystalline microstructure is formed at low
temperature and high pressure. As can be seen from Figure 3.19, porosity between the
columns grows as pressure increases (from case B to C, or from case A to D), and
microstructures start to crack and de-crystallized inside the columns as substrate temperature
decreases (from case B to A, or from case C to D). It needs to be emphasized that this
scheme only describes the situation in the low pressure deposition regime, the transition
pressure from case B to C is about 0.05 mbar [30]. If the pressures reach far beyond this
threshold, the ablated particles from the YSZ target will be quickly thermalized by the
background, the energy of the ablated particles upon reaching the substrate will be low
enough to induce any adhesion on the substrate. Additionally, the plasma size which is
generated by the laser ablation will also shrink drastically, the interactions between the
ablated particles and the ambient gas particles and between ablated particles themselves are
enormously increased; therefore large-sized clusters will be easily formed by the aggregation
of ablated particles and cause failure in the columnar structure formation.

54
A direct solution can be envisioned is to decrease the target-substrate distance in order
to decrease the mean free path l of the ablated particles, which is given by [64]
𝑙 =1
2𝜋𝑛𝜍2=
𝑘𝑇
2𝜋𝑃𝜍2 (3.25)
where σ is the collision diameter of a particle, n is the number density of the ambient gas, P
and T are the pressure and temperature, respectively. Therefore, it can be calculated that at 1
atm pressure and room temperature, l is smaller than 1 μm, given σ is in the order of 10-10
m.
One can see that by decreasing the target-substrate distance, T is increased, thus l is also
increased. However, it is not practical to increase the temperature by several orders of
magnitude and it requires the experimental devices to have high heat stability.
The assistance of an additional plasma source is believed to have the capability to
increase the plasma plume created by a laser ablation from the target for the following
reasons: (1) The electron temperature is in the order of 1-10 eV in the ignition area which
can increase the mean free path of the ablated particles by about two orders of magnitude
compared to the room temperature condition; (2) The assisted plasma is pointed to the
substrate which has the same direction with the laser plasma plume and may help to direct
more ablated particles towards the direction of the substrate; (3) The high plasma gas
temperature around the ignition area can melt and disaggregate the clusters formed by the
ablated particles, which may help to avoid accumulation of large-sized particles and
fragments, therefore has potential to increase the adhesion and uniformity of the coatings.
These reasons provide foundation for the use of APPT in the laser ablation applications.
3.4 Substrate Temperature Simulation & Measurements
The substrate temperature is a significant parameter in determining the morphology of
the deposited YSZ coatings. However, with the plasma heating the surface of the substrate,
and the high heat convection due to the atmospheric pressure environment, the deposition
temperature, which is defined as the surface temperature of the substrate as the position of
deposition, needs to be more carefully estimated and measured. Since the front surface of the
substrate (the surface to deposit YSZ coatings on) cannot be attached with a thermocouple
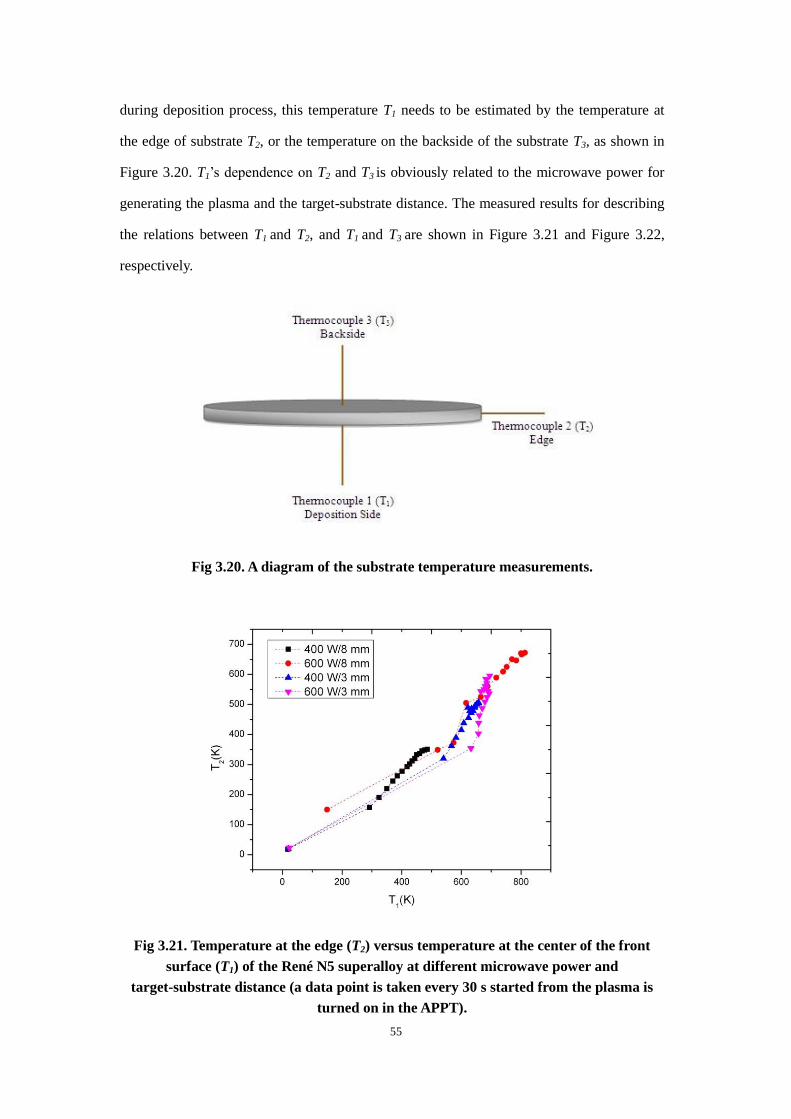
55
during deposition process, this temperature T1 needs to be estimated by the temperature at
the edge of substrate T2, or the temperature on the backside of the substrate T3, as shown in
Figure 3.20. T1’s dependence on T2 and T3 is obviously related to the microwave power for
generating the plasma and the target-substrate distance. The measured results for describing
the relations between T1 and T2, and T1 and T3 are shown in Figure 3.21 and Figure 3.22,
respectively.
Fig 3.20. A diagram of the substrate temperature measurements.
Fig 3.21. Temperature at the edge (T2) versus temperature at the center of the front
surface (T1) of the René N5 superalloy at different microwave power and
target-substrate distance (a data point is taken every 30 s started from the plasma is
turned on in the APPT).

56
Fig 3.22. Temperature at the center of the back surface (T3) versus temperature at the
center of the front surface (T1) of the René N5 superalloy at different microwave power
and target-substrate distance (a data point is taken every 30 s started from the plasma
is turned on in the APPT).
The René N5 superalloy temperature has a relatively low heat conductivity (~14.2
W∙m-1∙K-1) [65] compared with other metal materials, which results in a 100-200 ºC
temperature between T1 and T2, or T1 and T3, in the power range of 400-600 W, and
target-substrate distance of 3-8 mm. The time dependence of the substrate temperature is
also important due to its low heat conductivity, the increase T3 as a function of time is
plotted in Figure 3.23, from which it is noticeable that it takes ~10 minutes until a stable
temperature can be reached. The stable T2 and T3 temperatures can be used to estimate the
stable T1 temperature in the 400-1000 ºC by linearly fitting T2 with T1, or T3 with T1, which
is illustrated in Figure 3.24. In this study, T3 is measured by embedding a thermocouple on
the back surface of the substrate in order to estimate the T1, using the following equation
𝑇1 = 0.926𝑇3 + 172℃ (3.26)
which introduces an error of less than 50 ℃ for T1 in the range of 400-1000 ℃.

57
Fig 3.23. Increase of T3 as a dependence on time at various power and
target-substrate temperature.
Fig 3.24. Linearly fitted equations for calculating T1 using the values of T2 or T3.
In order to simulate the steady-state temperature distribution profile in the substrate,
several assumptions needs to be made: (1) The plasma generated by the APPT is treated as a
heat source on the front surface of the substrate; (2) The back surface of the substrate is
cooled by the ambient air through convection; (3) The edge of the substrate is treated as
𝑇1 = 0.941𝑇2 + 160℃
𝑇1 = 0.926𝑇3 + 172℃

58
adiabatic boundary since the thickness of the substrate is small compared with the diameter.
These assumptions can be used as boundary conditions in the heat transfer equations of the
substrate, which is calculated in MATLAB, and the temperature profile of a René N5
superalloy substrate is illustrated in Figure 3.25. It must be noticed that the temperature
profile of the substrate is strongly determined by the plasma temperature profile. Figure 3.23
is obtained by a given plasma temperature profile, which is acquired by fitting the measured
temperature at different radial locations of the front surface plane of the plasma (listed in
Table 3.8) with a Lorentzian function. The MATLAB code for the temperature distribution
in the René N5 substrate is stated in the Appendix part in detail.
Fig 3.25. The temperature profile of a René N5 substrate with the plasma temperature
profile given in Table 3.8.
Table 3.8 Measured plasma temperature Tg (power: 400 W, target-substrate distance: 3
mm) as a function of r at d = 0 plane used for calculating the temperature profile of a
Rene N5 substrate shown in Figure 3.21 above.
r (cm) 0 0.62 0.77 0.97 1.07 1.17 1.27 1.37 1.47 1.57 1.77 1.92 2.54
Tg (℃) 152 246 404 605 755 961 1013 950 741 614 411 251 156
Fitted 𝑇𝑔 = 84.24 + 415.57/(4 × (𝑟 − 1.27)2 + 0.45))
As can be seen from Figure 3.25, the difference between T1 and T2, or T1 and T3 is
ranged from 100-200 ºC, which matches well with the experimental results shown in Figure
3.24. However, the overall simulative temperature profile shown in Figure 3.25 is also lower
than the experimental results. This can be originated from two reasons: (1) There is a
temperature difference between the plasma gas temperature and substrate temperature at the
interface (at d = 0 plane), thus the measured plasma gas temperature at the interface is
usually higher than that of the front surface of the substrate; (2) The simulation results
depends strongly on the accuracy of the plasma temperature measurement, which cannot be

59
measured precisely by the thermocouple. The OES method can be used along the radial
direction of the plasma, but a general 50 K error resulted from fitting the measured spectra
with calculated ones together with the error from the relatively small plasma radial size will
bring significant inaccuracy in the substrate temperature measurements.

60
CHAPTER 4: RESULTS AND DISCUSSION OF YSZ
TBCS DEPOSITED BY LAPCAP
4.1 YSZ Deposition Rate
YSZ deposition on silicon wafers are used to measure the deposition rate (which is
proportional to the ablation rate) and to compare the different deposition conditions in order
to achieve the optimal experimental set-up as a guide for the YSZ deposition on the René N5
superalloys. The morphology of the YSZ TBCs deposited on Si wafers, however, cannot be
considered as an indication for that on the René N5 superalloys, for the distinct properties of
these two types of substrates. This section studies on the feasibility of laser-assisted plasma
coatings at atmospheric pressure (LAPCAP) and the deposition rates this technique can
reach depending on the wavelengths of the Nd:YAG laser.
The YSZ coatings are deposited by the PLD method in the atmospheric pressure by a
pulsed Nd:YAG laser operated at 266 nm and 532 nm, respectively. It needs to be pointed
out that although the 1064 nm is also a possible operation wavelength, it also induces large
reflectivity when ablating the YSZ target and has more than sufficient energy density which
may result in ejection of large volume of undesired fragments, therefore, the 1064 nm laser
beam will be utilized in the future applications when deposition process on a large area is
needed. Without the assistant of the plasma generated by the APPT, the deposition is an
atmospheric-pressure PLD process. It is found in this study that the ablation spot needs to be
placed less than 0.5 mm from the Si wafer in order to get observable YSZ thin films on the
Si wafers, owing to the extremely small mean free path of the ablated species. The YSZ
deposition pattern on the Si wafers and the scanning electron microscope (SEM) images of
the morphology at both 266 and 532 nm laser ablation are shown in Figure 4.1.

61
(a)266 nm (b)532 nm
Fig 4.1. YSZ coatings deposited on Si wafers with 4-minute laser ablation at
atmospheric pressure at wavelength of (a) 266 nm and (b) 532 nm with laser energy
density: ~10 J/cm2.
It can be seen from Figure 4.1 that without the assistance of the APPT plasma, the
deposited YSZ coatings are localized within a ~1 mm2 area with 266 nm laser ablation, and a
~2 mm2 area with the 532 nm laser ablation. The SEM images show that the coating
deposited with the 266 nm laser ablation is much sparser than with the 532 nm laser ablation.
This is mainly due to the laser pulse energy at 532 nm (120 mJ) is much higher compared
with at 266 nm (20 mJ). Since the high deposition rate is one of the main goals in this study,
the 532 nm laser ablation is used throughout the experiments afterwards. The additional
plasma generated by the APPT is used to improve the deposition rate, and the YSZ
deposition of which is shown in Figure 4.2 and compared with the deposition pattern
without the APPT plasma.
~1mm
~2mm
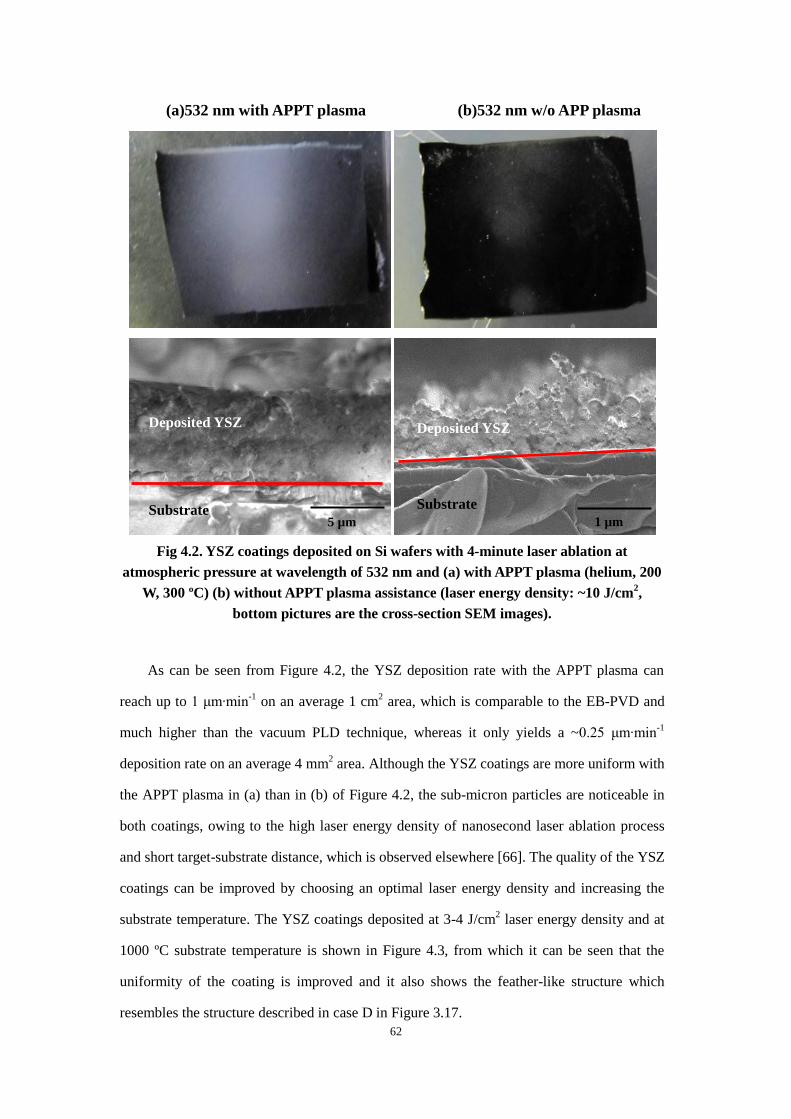
62
(a)532 nm with APPT plasma (b)532 nm w/o APP plasma
Fig 4.2. YSZ coatings deposited on Si wafers with 4-minute laser ablation at
atmospheric pressure at wavelength of 532 nm and (a) with APPT plasma (helium, 200
W, 300 ºC) (b) without APPT plasma assistance (laser energy density: ~10 J/cm2,
bottom pictures are the cross-section SEM images).
As can be seen from Figure 4.2, the YSZ deposition rate with the APPT plasma can
reach up to 1 μm∙min-1
on an average 1 cm2 area, which is comparable to the EB-PVD and
much higher than the vacuum PLD technique, whereas it only yields a ~0.25 μm∙min-1
deposition rate on an average 4 mm2 area. Although the YSZ coatings are more uniform with
the APPT plasma in (a) than in (b) of Figure 4.2, the sub-micron particles are noticeable in
both coatings, owing to the high laser energy density of nanosecond laser ablation process
and short target-substrate distance, which is observed elsewhere [66]. The quality of the YSZ
coatings can be improved by choosing an optimal laser energy density and increasing the
substrate temperature. The YSZ coatings deposited at 3-4 J/cm2 laser energy density and at
1000 ºC substrate temperature is shown in Figure 4.3, from which it can be seen that the
uniformity of the coating is improved and it also shows the feather-like structure which
resembles the structure described in case D in Figure 3.17.
5 µm 1 µm
Deposited YSZ
Substrate Substrate
Deposited YSZ

63
Fig 4.3. Cross-section SEM image of the YSZ coating deposited on Si wafers with
10-minute laser ablation at atmospheric pressure at wavelength of 532 nm with APPT
plasma (helium, 600 W, 1000 ºC, laser energy density: 3-4 J/cm2).
The tradeoff, however, is a decreased the deposition rate when the laser energy density
decreases, the deposition rate estimated using the SEM image in Figure 4.3 is less than 0.5
μm/min. Therefore, a balance needs to be carefully tuned between the desirable deposition
rate and the microstructure of the coating. It needs to be emphasized that the generation of
micro-sized or sub-micron particles is depending on not only the laser energy density, but
also the laser repetition frequency and even the fraction of Y2O3 stabilized in the ZrO2. It is
found in Ref. [65] that the 3% Y2O3 stabilized YSZ (3YSZ) can be ablated by the
nanosecond laser pulses without forming micro-sized or sub-micron particles, but
fragmentation of 8% or 9.5% Y2O3 stabilized YSZ (8YSZ, 9.5YSZ) is observed by the same
laser pulses. In addition, femtosecond laser pulses are found to be effective in preventing the
ejection of micro-sized particles from the target but they also inevitably result in the
expulsion of submicron particles. Therefore, 3YSZ and nanosecond laser pulses are chosen
in this study in order to maximize the coating quality.
4.2 Deposition Results on René N5 Superalloy (Stage I)
In turbine blade TBCs, one crucial morphological requirement for the coatings is the
formation of the columnar structure with proper porosity among the individual columns.
This section is to discuss the feasibility of the columnar morphology of the TBCs deposited
on the René N5 superalloy substrates, using the LAPCAP technique, as a variation of the

64
deposition temperature.
4.2.1 Morphology of YSZ TBCs on René N5 Superalloy
Figure 4.4 shows the top view SEM images of YSZ coatings deposited at the substrate
temperature varying from room temperature to 1300 ºC, assisted by a mixed helium (30
lpm)/nitrogen plasma (0.3 lpm) generated in the APPT. Some micro-sized fragments
presented as 1-5 µm spherical or quasi-spherical clusters are clearly visible for all substrate
temperatures, while the size of the clusters decreases as the deposition temperature increases.
These fragments are probably formed by the agglomeration of the intensified particle
ejection from the ablation spot, due to the high fluence nanosecond-laser ablation (~10
J/cm2). The dominant structure of the YSZ coatings deposited at high substrate temperatures
(800 ºC and 1300 ºC) are both presented as nano-sized filamentous clusters (< 500 nm).
However, coatings at 800 ºC deposition temperature seem to have the better uniformity and
less micro-sized particles, and the trenches between these small clusters can be clearly
distinguished, while the coating at higher deposition temperature (1300 ºC) is relatively
denser and has worse uniformity, due to the fact that some chemical properties of the René
N5 substrate may have changed when it undergoes a near-melting temperature. Therefore,
the deposition temperature has to be set appropriately in order to optimize the coating quality.
A suggested transition temperature of the René N5 deposition temperature is around
1100-1150 ºC from Ref. [10].

65
Fig 4.4. Top view SEM images of YSZ coatings deposited at a substrate temperature of
(a) room temperature w/o assisted plasma, (b) 100 ºC, (c) 800 ºC and (d) 1300 ºC at
atmospheric pressure. (a) was deposited by PLD without assisted plasma, (b)-(d) were
deposited by atmospheric helium/nitrogen (100:1) plasma assisted PLD.
At low deposition temperature, however, most particles in the assisted
helium/nitrogen plasma plume are neutral molecules which diffuse downstream from the
ignition spot (the tip of the antenna) due to the frequent collision between the ablated
particles and gas molecules, which makes the assisted plasma works barely more than a gas
flow. As a result, the mean free path of the YSZ species created by laser ablation is
drastically reduced by collision, and most of the species are thermalized before they can
reach to the substrate. Furthermore, the micro-sized fragments generated during the ablation
also have a slight chance to be reacted with energetic ions and electrons in the assisted
plasma and reduce to nano-sized particles before they reach onto the substrate. Therefore,
the deposition process at low substrate temperature is more likely a micro-sized powder
accumulation. The adhesion between the YSZ coating and the substrate is poor in these
deposition conditions, which is verified by the fact that these coatings can be easily rubbed
off by a finger. It can be anticipated that the adhesion between the coating and substrate is
5µm 5µm
5µm 5µm
(a) (b)
(c) (d)

66
affected by the structure of the deposited coatings. However, it is difficult to determine by
the top-view SEM images alone whether or not they indicate the columnar structure of the
coatings.
The FIB is used to show better images of both the top view and cross-section pattern of
the YSZ coatings. The columnar structure of YSZ coatings deposited at substrate
temperature of 800 ºC and 1300 ºC can be clearly seen when applying a cascade FIB cutting
method (Figure 4.5 and Figure 4.6). It is also noticeable that the coating deposited at 800 ºC
substrate has 50-200 nm columnar clusters, while the size of which increases to 500-2 μm at
1300 ºC deposition temperature. The same experimental procedure was performed on the
coatings which are deposited at room temperature without the assisted plasma and a
deposition temperature of 100 ºC. As shown in Figure 4.7, the YSZ coating deposited at
room temperature using atmospheric pressure PLD (Figure 4.7(a)) is relatively porous and
shows no columnar structure at all. This result verifies the vaporized particles, which are
generated during the laser ablation process, are drastically decelerated by the molecules in
high pressure air environment before they arrive at the surface of the substrate. The plasma
size produced by the laser ablation in this case is measured to be around 1 mm. When the
substrate temperature is increased from 100 ºC to 1300 ºC and the plasma environment is
created around the target, the size of the laser-ablated plasma plume seems to grow to about
1 cm and the columnar structures can be clearly seen at all these three conditions (Figure 4.7
(b)-(d)) in the FIB images. It is also worth to notice that the coatings have smaller column
size but larger gaps formed at a lower substrate temperature deposition, as can be seen from
Figure 4.7, the size of a single column is ranged from several tens to around 100 nm in
coatings deposited at the substrate temperature of 100 ºC, and increases to100~200 nm in
coatings deposited at the temperature of 800 ºC, while more coarse and denser coatings are
formed at the substrate temperature of 1300 ºC, which shows a result of Ostwald ripening, is
in agreement with the results concluded elsewhere [27,31].

67
Fig 4.5. Top view FIB image of YSZ coating deposited at substrate temperature of 1300
ºC. Cut depth: 0-6 μm (cascade)
Fig 4.6. Cross-section FIB image of YSZ coating deposited at substrate temperature of
800 ºC.

68
Fig 4.7. Cross-section FIB image of YSZ coating deposited at substrate temperature of:
(a) room temperature without plasma, (b) 100 ºC, (c) 800 ºC and (d) 1300 ºC.
4.2.2 Stoichiometry of YSZ TBCs on René N5 Superalloy
The stoichiometry of the TBC is crucial since it plays an important role in determining
the performances of the substrate. An example is that a deposited YSZ TBC layer usually
requires to consist of 6~8 wt% Y2O3 when an optimum protection for the turbine blades can
be achieved [67]. Therefore, it is important to ensure that the stoichiometry of the target
matches that of the coatings on the substrate. The elemental composition in the coatings is
investigated by X-ray photoelectron spectroscopy (XPS) in this study. Atomic concentration
ratio of coatings deposited at different conditions is shown in Figure 4.8. One can notice that
an evident abundance of oxygen appears in the coatings at all deposition conditions, this may
(a) (b)
(c) (d)

69
result from the inherent oxygen contamination of an atmospheric pressure deposition and the
highly porous structures which helps to absorb more oxygen. Thus the oxygen concentration
is not a good indication of the stoichiometry of the YSZ coatings. However, the comparison
of the Y/Zr ratio between the coatings and the target is meaningful because these elements can
only be transferred from the target onto the deposited coatings. In Figure 4.8, the percentage
of the Y 3d and Zr 3d emissions are determined by the area of each peak with a given a base
line. More accurate atomic concentration ratio is obtained by fitting each peak of the major
elements with a Gaussian function, and to integrate the peaks individually. In both methods
the atomic sensitivity factors 1.76 (for Y) and 2.1 (for Zr) have been taken into account. These
results are listed and compared with the target composition in Table 1.
Fig 4.8. XPS results of the deposited YSZ coatings at substrate temperature of (from
top to bottom): 1300 ºC, 800 ºC, 100 ºC assisted with plasma and at room temperature
without plasma.
As can be seen in Table 4.1, the YSZ coatings deposited at room temperature without
assisted plasma show similar composition with the target with a small yttrium loss rate. When
the deposition temperature is increased, the Y/Zr ratio of deposited coatings first increases

70
drastically from room temperature to 800 ºC, but it deceases back at 1300 ºC, resulting in a
similar Y/Zr composition of the coatings, compared with that of the target. This phenomenon
may be related to the thermal effect that assisted plasma brings to the target during the laser
ablation. The fact that the YSZ target is closer to the plasma ignition spot allows the target to
be continuously heated by the plasma, in the case that deposition temperature is 1300 ºC, the
YSZ target temperature actually already reaches very close to its melting temperature.
Therefore, a reasonable explanation for the Y/Zr ratio shown in Table 4.1 is, when the target
temperature is much lower than its melting temperature, yttria has much larger thermal
sensitivity than zirconia, and the laser ablation is the dominant process instead of the thermal
evaporation. However, if the target temperature increases close to its melting temperature, the
thermal evaporation becomes dominant, which causes an yttrium loss during deposition, the
same effect has been reported in other thermal evaporation YSZ deposition processes
elsewhere [68].
Table 4.1 Y/Zr ratio of coatings at different deposition temperature and the target
(Measurement error may up to 10% as suggested by the XPS instrument).
Substrate Temperature (ºC) Y/Zr (XPS) Y/Zr (Gaussian Fit)
Target - 6.2% 6.2%
Coating 1 room temp w/o plasma 5.7% 4.1%
Coating 2 100 14.3% 16.9%
Coating 3 800 7.0% 11.0%
Coating 4 1300 5.3% 5.7%
4.2.3 Phase Composition of YSZ TBCs on René N5 Superalloy
The phase composition of the YSZ coatings at different deposition temperature was
analyzed by XRD and compared with the results of the YSZ targets, as shown in Figure 4.9.
It can be seen that all the YSZ coatings were crystallized in a cubic phase. Compared with
the YSZ target, the coatings show all the YSZ diffraction peaks, in addition, some substrate

71
element peaks such as Ni (111) are presented in all the deposition, due to the porosity of the
thin YSZ coatings and a relatively small deposition area. Furthermore, it is noticeable that
the primary diffraction peak in all the deposited coatings is the (111) plane of the cubic YSZ,
and it becomes dominant when deposition temperature is increased from 100 °C to
1300 °C, whereas in a YSZ target the (111) and (220) diffraction peaks are almost equivalent.
This YSZ (111) plane preference during the YSZ film deposition has also been reported in
other deposition techniques [31,69].
Fig 4.9. XRD patterns of the YSZ target and the YSZ coatings deposited at different
substrate temperature.
4.3 Preliminary Deposition Results on René N5 Superalloy (Stage II)
The main goal of the Stage II experimental set-up is to improve the adhesion strength
between the YSZ coatings of the coating, and also the adhesion strength between different
layers of the YSZ coatings. Two improvements are made in the Stage II experiments
compared with Stage I, due to the experimental layout as shown early in Figure 2.7. (1) The
target-distance can be adjusted to as close as 1 mm. (2) The laser energy intensity is set to
increase by steps as the power increases in one single deposition process. The reason for (1)
is to increase the ablated particles energy on their impingement onto the substrate. However,
the plasma power has to be reduced in order to prevent the substrate from melting or being

72
chemically damaged. The reason for (2) is for the consideration of the change in the
substrate temperature change and heat conductivity as the YSZ deposition being deposited
on the substrate. The deposition process is actually divided into two steps in this part: the
bonding between the bond coat and first few layers of YSZ coatings, and the stack of newly
ablated YSZ particles with previous deposited YSZ coatings, and the latter is to guarantee
that thick TBC coatings (>100 μm) can be obtained in order to satisfy the requirements for
applications such as engine turbine blades.
Figure 4.10 shows an improved YSZ coating deposited at a 2 mm target-substrate
distance in three steps: (1) Preheat: Power 150 W, substrate temperature 400-500 ºC, 10
minutes; (2) Deposition: Power 250 W, deposition temperature 600-700 ºC, laser energy
density 3-4 J/cm2, 10 minutes; (3) Deposition: Power 400 W, deposition temperature
1000-1100 ºC, laser energy density 7-8 J/cm2, 20 minutes.
Fig 4.10. FIB images of YSZ coatings by the three-step deposition process: (1) Preheat:
150 W, 400-500 ºC, 10 min; (2) Deposition: 250 W, 600-700 ºC, 3-4 J/cm2, 10 min; (3)
Deposition: 400 W, 1000-1100 ºC, 7-8 J/cm2, 20 min.
By comparing the deposition by the preheat medium-temperature-medium-ablation
deposition high-temperature-high-ablation process with the normal deposition results
shown in last section (Figure 4.7), we find that the uniformity has been increased in the
three-step deposition process, and the columnar structure of the YSZ coating is more
distinguishable. The size of the column is around 200-500 μm in Figure 4.10. A simple test
Pt (Protection Layer)
YSZ columns
Sub-micron
YSZ particles

73
for the adhesion strength is done by scratching the coatings with a thin plastic stick, which
shows the adhesion strength of the YSZ coatings cannot be easily peeled off by the
three-step deposition process.
In order to the significance of the laser energy density and the power in the deposition
process, two experiments have been done in order to compare with the results in Figure 4.10.
The first one is to increase the power in the same pattern: (1) Preheat: 150 W, 10 minutes; (2)
Deposition: 250 W, 10 minutes, and (3) Deposition: 400 W, 20 minutes, but keep the laser
energy density at the same level (3-4 J/cm2), and the second one is to keep the deposition
power at the same level: (1) Preheat: 150 W for 10 minutes, and (2) Deposition: 250 W for
30 minutes), but increase the laser energy density in the same pattern: 3-4 J/cm2 for 10
minutes and 7-8 J/cm2 for 20 minutes. The FIB images are shown in Figure 4.11.
Fig 4.11. FIB images of YSZ coatings by different three-step deposition process.
(a): (1) Preheat: 150 W, 400-500 ºC, 10 min; (2) Deposition: 250 W, 600-700 ºC, 3-4
Right: J/cm2, 10 min; (3) Deposition: 400 W, 1000-1100 ºC, 3-4 J/cm
2, 20 min.
(b): (1) Preheat: 150 W, 400-500 ºC, 10 min; (2) Deposition: 250 W, 600-700 ºC, 3-4
Right: J/cm2, 10 min; (3) Deposition: 250 W, 1000-1100 ºC, 7-8 J/cm
2, 20 min.
It is quite obvious that the contribution of the laser is more significant for the formation
of the columnar structures, as can be seen from Figure 4.11 (b), whereas no columns can be
observed in the coatings deposited by process (a) in Figure 4.11. The size of the columns in
the YSZ coatings deposited by process (b) in Figure 4.11 is averagely reduced compared
with Figure 4.10, which is in agreement with the statement made in section 4.2.1, as a result
(a) (b)

74
of the Ostwald ripening effect. By this comparison we conclude that the laser ablation is the
major mechanism to produce energetic ablated particles to form the columnar-structure
coatings and the assisted plasma is used to increase the deposition rate and prevent the
substrate from excessive oxidation.

75
CHAPTER 5: CONCLUSIONS AND FUTURE WORK
5.1 Conclusions
This work developed and verified the feasibility of a novel deposition method at
atmospheric pressure; the Laser-Assisted Plasma Coatings at Atmospheric Pressure
(LAPCAP). An atmospheric-pressure plasma torch (APPT) has been designed and fabricated
to generate various centimeter-sized plasma sources, using a range of substrate temperatures
from 20 ºC to 1300 ºC. The characterization of atmospheric plasmas is significant in this
study for controlling and analyzing the behavior of the plasma in the deposition process. The
reasons for traditional characterization methods, which are widely used to analyze the
low-pressure plasmas, are not reliable in the atmospheric-pressure plasma diagnostics are
discussed. However, the optical emission spectroscopy (OES) method was verified to be
reliable in the high-pressure, non-equilibrium plasmas, and it was used to successfully obtain
the significant plasma characteristics, such as the electron temperature Te, electron density ne,
and plasma gas temperature Tg.
The ignition voltages of the plasmas generated in the APPT were theoretically
calculated, and the electric field distribution of the APPT was modeled using HFSS, the
results verified that the helium plasma can be ignited at 300-400 W, which was in good
agreement of the experimental results. The plasma generated by the APPT was spatially
nonuniform. The electron temperature of a helium plasma was calculated from slope of the
Boltzmann plot, which was valid in this study because the electron density of plasma was
high (ne > 1013
-1014
cm-3
), and the plasma gas temperature was low (Tg << 1 eV). The
measured electron density ne was in the range of 1015
-1016
cm-3
by using the Stark
broadening effect, which was 3-5 orders of magnitude larger than the plasmas at low
pressure. Te and ne did not have a strong dependence on the gas flow rate but they both
increased as the input power increased. The plasma gas temperature Tg was in the range of
1500-2000 K by fitting the experimental N2 second positive (C-B) spectra with the
SPECAIR calculated spectra in the 360-385 nm range. The vibrational and transitional
temperatures were also measured and compared. The results showed that Te > Tel > Tv >Tr ≈

76
Tt, which was a typical relation in nonequilibrium plasmas.
The mechanisms and the feasibility of successfully deposition YSZ TBC at one
atmospheric pressure were seldom mentioned in previous researches and references.
However, it was certain that high deposition temperature was critical for increasing adhesion
strength at high pressure and small target-substrate distance. In this study, it is found the
ablated particles could have enough energy to form adhesive coatings when the
target-substrate distance was decreased to within 5 millimeters at temperature higher than
800 ºC. Equations for measuring the deposition temperature from the size and back surface
of the substrate were empirically obtained, and the temperature profile of René N5 during
the deposition was modeled using heat transfer theory. These two results were used to
determine the deposition temperature in this study.
Columnar structured YSZ coatings were successfully grown on the René N5 substrate
with pores among the columns in this study. Deposition rates reaching several μm/min on Si
wafers were achieved. Comparison between the PLD processes in the atmospheric pressure
with and without the assisted plasma from the APPT showed the plasma could help increase
the deposition rate and modify the morphology of the YSZ coatings. This was due to the fact
that high-temperature assisted helium or helium/nitrogen plasma had the ability to increase
the size of the evaporation volume ablated from the YSZ target induced by a laser ablation.
Comparison between the crystal structures of the YSZ coatings deposited with and without
assisted plasma at different deposition temperature, revealed that the coatings had the most
uniform column size and some porosity deposited at the substrate temperature of 800 °C
assisted with the helium/nitrogen plasma. The stoichiometry of the coatings was found to be
strongly affected by the plasma, and the deposition temperature, which indicated that the
plasma has an effect of damaging the balance of the composition of the coatings. Increasing
deposition temperature also resulted in a high YSZ (111) plane preference in this new
deposition technique. Preliminary deposition results showed the significance of the laser
ablation and the assisted plasma heating mechanisms in this study. It was found that laser
ablation was the key mechanism to generate energetic particles ejected from the target, and
the assisted plasma played an assistance role to increase the deposition rate and modify the
fine deposition structures of the YSZ TBCs.

77
5.2 Future Work
Spatial analysis of the characterizations for the atmospheric plasmas generated by the
APPT in this study is important to better understand the particle (electrons and ions)
distribution and plasma heating mechanism, which needs to be done axially and radially by
OES technique. Detailed profiles of the temperature and density distribution of electron/ion
in plasma will provide the insight for the plasma ignition and propagation mechanism in
APPT. Further characterizations on the plasma generated in APPT can be envisioned by
using OES are: The dependence of Te on the microwave power, and plasma gas type; the
dependence of ne on radial distance from the center of the antenna; a more accurate
characterization of the Tg by comparing the fittings of the measured the 𝑁2+ first negative
system B-X at 356.4 nm and 391.4 nm, the N2 second positive system C-B in the 300-420
nm range, and the OH A-X transitions in the 306-312 nm range.
A model for the laser ablation process needs to be theoretically constructed in this study,
for the energy distribution of the ablated species ablated from the YSZ target is crucial in
this study to understand the mechanisms of the generation and propagation of ablated
species. To compare with the theoretical model, time resolved energy distribution of the
ablated particles needs to be experimentally measured, for the dynamics of the first few
micron-seconds of the laser ablation process is rather significant and complicated. It will be
more valuable if the ablation process can be studied in the nano-second regime, for the pulse
duration of the Nd:YAG laser used in this study is ranged from 3-12 ns depending on the
operation wavelengths. Therefore, an intensified charge-coupled device (ICCD) will be
needed in order to fulfill these goals.

78
REFERENCES
[1] M. A. Lieberman and A. J. Lichtenberg, Principles of Plasma Discharges and Materials
Processing. New York: Wiley, 1994.
[2] L. Tonks and I. Langmuir, “Oscillation in Ionized Gases”, Phys. Rev., vol. 33, p. 195, 1929.
[3] E. E. Kunhardt, “Generation of Large-Volume, Atmospheric-Pressure, Nonequilibrium Plasmas”,
IEEE Transactions on Plasma Science, vol. 28, p. 189, 2000.
[4] M. Goldman and R. S. Sigmond, “Corona and Insulation”, IEEE Trans. Elect. Insulation, vol.
EI-17, no. 2, p. 90-105, 1982.
[5] J. Park, I. Henins, H. W. Herrmann, G. S. Selwyn, J. Y. Jeong, R. F. Hicks, D. Shim, and C. S.
Chang, “An Atmospheric Pressure Plasma Source”, Appl. Phys. Lett., vol. 76, p. 288, 2000.
[6] B. Eliasson and U. Kogelschatz, “Nonequilibrium Volume Plasma Chemical Processing”, IEEE
Trans. Plasma Sci., vol. 19, p. 163-1077, 1991.
[7] A. Schütze, J. Y. Jeong, S. E. Babayan, J. Park, G. S. Selwyn, and R. F. Hicks, “The
atmospheric-pressure plasma jet: a review and comparison to other plasma sources”, IEEE Trans.
Plasma Sci., vol. 26, p. 1685-1694, 1998.
[8] S. M. Meier and D. K. Gupta, “The evolution of thermal barrier coatings in gas turbine engine
applications”, J. Eng. Gas Turbines Power, vol. 116, p. 250, 1994.
[9] S. C. Singhal, High Temperature Solid Oxide Fuel Cells: Fundamentals, Design and Applications,
Oxford: Elsevier, ed. K. Kendall, p. 1–22, 2003.
[10] D. V. Rigney, R.Viguie, D. J. Wortman, and D. W. Skelly, “PVD thermal barrier coatings
applications process development for aircraft engines”, J. Thermal Spray Technol., vol. 6, p. 167,
1997.
[11] N. P. Padture, M. Gell, E. H. Jordan, “Thermal barrier coatings for gas-turbine engine
applications”, Science, vol. 296, p. 280-284, 2002.
[12] J. Katamura, T. Seki, and T. Sakuma, “The cubic-tetragonal phase equilibria in the ZrO2-R2O3 (R
= Y, Gd, Sm, Nd) systems”, J. Phase Equilibria, vol. 16, no. 4, p. 315-319, 1995.
[13] Y. J. Su, R. W. Trice, K. T. Faber, H. Wang, and W. D. Porter, “Thermal Conductivity, Phase
tability, and Oxidation Resistance of Y3Al5O12 (YAG)/Y2O3–ZrO2 (YSZ) Thermal-Barrier Coatings”,
Oxidation of Metals, vol. 61, p. 253, 2004.
[14] J. H. Joo and G. M. Choi, “Electrical conductivity of YSZ film grown by pulsed laser
deposition”, Solid State Ionics, vol. 177, p. 1053-1057, 2006.
[15] K. Wada, N. Yamaguchi, and H. Matsubara, “Crystallographic texture evolution in ZrO2-Y2O3
layers produced by electron beam physical vapor deposition”, Surf. Coat. Technol., vol. 184, p. 55-62,
2004.
[16] J. Will, A. Mitterdorfer, C. Kleinlogel, D. Perednis, and L. J. Gauckler, “Fabrication of thin
electrolytes for second-generation solid oxide fuel cells”, Solid State Ionics, vol. 131, p. 79-96, 2000.
[17] S. Gu, T. J. Lu, D. D. Hass, and H. N. G. Wadley, “Thermal conductivity of zirconia coatings
with zig-zag pore microstructures”, Acta Mater., vol. 49, p.2539-2547, 2001.
[18] O. Racek, C. C. Berndt, D. N. Guru, and J. Heberlein, “Nanostructured and conventional YSZ
coatings deposited using APS and TTPR techniques”, Surf. Coat. Technol., vol. 201, p. 338-346,
2006.

79
[19] C. Zhang, H.-L. Liao, W.-Y. Li, G. Zhang, C. Doddet, C. Li, C.-X. Li, and X.-J. Ning,
“Characterization of YSZ solid oxide fuel cells electrolyte deposited by atmospheric plasma spraying
and low pressure plasma spraying”, J. Thermal Spray, vol. 15(4), p. 598-603, 2006.
[20] C. Friedrich, R. Gadow, and A. Killinger, “Plasma and hypersonic flame sprayed ceramic
coatings for dielectrical applications”, Dielectric Mater. Devices, American Cermaic Society,
Westerville, Ohio, USA, p. 323-338, 2001.
[21] H. Chen and C. X. Ding, “Nanostructured zirconia coating prepared by atmospheric plasma
spraying”, Surf. Coat. Technol., vol. 150, p. 31-36, 2002.
[22] C. C. Berndt, P. Michlik, and O. Racek, “The effect of YSZ microstructure on Young’s modulus”,
Proc. Intl. Thermal Spray Conf., Osaka, Janpan, p. 1110, 2004.
[23] M. Zadvydas, S. Tamulevicius, and T. Grinys, “Relation between the YSZ powder properties and
vacuum plasma spray deposited layers”, Mater. Sci. (Medziagotyra), vol. 10, no. 4, p. 1392-1320,
2004.
[24] C. R. C. Lima and J. M. Guilemany, “Adhesion improvements of thermal barrier coatings with
HVOF thermally sprayed bond coats”, Surf. Coat. Technol., vol. 201, p. 4694-4701, 2007.
[25] J. R. Nicholls, V. Pereira, K. J. Lawson, and D. S. Rickerby, Proc. Research and Technology
Organization (RTO, NATO) Meeting on “Intelligent Processing of High Performance Materials”,
Brussels, Belgium, p. 16.1-16.11, 1998.
[26] D. W. Stollberg, J. M. Hampikian, L. Riester, and W. B. Cater, “Nanoindentation measurements
of combustion CVD Al2O3 and YSZ films”, Mater. Eng., vol. A359, p. 112-118, 2003.
[27] K. –D. Bouzakis, A. Lontos, N. Michailidis, O. Knotec, E. Lugscheider, K. Bobzin, and A.
Etzkorn, “Determination of mechanical properties of electron beam-physical vapor
deposition-thermal barrier coatings (EB-PVD-TBCs) by means of nanoindentation and impact
testing”, Surf. Coat. Technol., vol. 163-164, p. 75-80, 2003.
[28] H.-U. Krebs, M. Weisheit, J. Faupel, et al., “Pulsed laser deposition (PLD) – A versatile thin film
technique”, Advances in Solid State Physics, vol. 43, p. 101-107, 2003.
[29] G. Wahl, W. Nemetz, M. Giannozzi, S. Rushworth, D. Baxter, N. Archer, F. Cernuschi, and N.
Boyle, “Chemical vapor deposition of TBC: an alternative process for gas turbine components”,
Transactions of the ASME, vol. 123, p. 520-524, 2001.
[30] A. Infortuna, A. S. Harvey, and L. J. Gauckler, “Microstructures of CGO and YSZ thin films by
pulsed laser deposition”, Adv. Funct. Mater., vol. 18, p. 127-135, 2008.
[31] H. Y. Jung, K. Hong, H. Kim, J. Park, J. Son, J. Kim, H. Lee, and J. Lee, “Characterization of
thin-film YSZ deposited via EB-PVD technique in anode-supported SOFCs”, J. Electrochemical
Society, vol. 153, p. A961-A966, 2006.
[32] Y. –C. Jung, T. Sasaki, T. Tomimatsu, K. Matsunaga, T. Yamamoto, Y. Kagawa, and Y. Ikuhara,
“Distribution and structures of nanopores in YSZ-TBC deposited by EB-PVD”, Sci. Technol. Adv.
Mater., vol. 4, p. 571-574, 2003.
[33] S. H. Park, S. K. Kim, T. W. Kim, U. Paik, and K. S. Lee, “Indentation on YSZ thermal barrier
coating layers deposited by electron beam PVD”, Philosophical Magzine, vol. 86, p. 5453-5463,
2006.
[34] A. A. Voevodin, J. G. Jones, and J. S. Zabinski, “Characterization of ZrO2/Y2O3 laser ablation
plasma in vacuum, oxygen, and argon environments”, J. Appl. Phys., vol. 88, p. 1088-1096, 2000.
[35] C. A. Johnson, J. A. Ruud, R. Bruce, and D. Wortman, “Relationships between residual stress,
microstructure and mechanical properties of electron beam-physical vapor deposition thermal barrier

80
coatings”, Surf. Coat. Technol., vol. 108-109, p. 80-85, 1998.
[36] T. Goto, “Laser CVD process for high speed deposition of YSZ films”, Mater. Sci. Forum, vol.
475-479, p. 1213-1218, 2005.
[37] B. Préauchat and S. Drawin, “Isothermal and cycling properties of zirconia-based thermal barrier
coatings deposited by PECVD”, Surf. Coat. Technol., vol. 146-147, p. 94-101, 2001.
[38] C. E. Campbell, W. J. Boettinger, T. Hansen, P. Merewether, and B. A. Mueller, “Examination of
multicomponent diffusion between two Ni-base superalloys”, Complex Inorganic Solids: Structural,
Stability, and Magnetic Properties of Alloys, P. E. A. Turchi, A. Gonis, K. Rajan, and A. Meike, Ed.,
New York: Springer, 2005.
[39] Data from NIST: http://physics.nist.gov/PhysRefData/Handbook/Tables/mercurytable2.htm.
[40] P. Sperfeld, “Spectral Irradiance 200 nm to 350 nm”, Report of the CIPM Key Comparison
CCPR-K1.b, 2008.
[41] Y. P. Raizer, Gas Discharge Physics, New York: Springer-Verlag, 1991.
[42] J. Cohine, Gaseous Conductors, New York: Dover, 1958.
[43] S. S. Yang, S. M. Lee, F. Iza, and J. K. Lee, “Secondary electron emission coefficients in plasma
display panels as determined by particle and fluid simulations”, J. Phys. D: Appl. Phys., vol. 39, p.
2775-2784, 2006.
[44] M. Lieberman and A. Lichtenberg, Principles of Plasma and Materials Processing, New York:
Wiley, 2005.
[45] T. Yokoyama, M. Kogoma, T. Moriwaki, and S. Okazaki, “The mechanism of the stabilization of
glow plasma at atmospheric pressure”, J. Phys. D: Appl. Phys., vol. 23, p. 1125-1128, 1990.
[46] T. Fujimoto, “A collisional-radiative model for helium and its application to a discharge plasma”,
J. Quant. Spectrosc. Radiat. Transfer, vol. 21, p. 439-455, 1978.
[47] L. L. Alves, G. Gousset, and C. M. Ferreira, “A collisional-radiative model for microwave
discharges in helium at low and intermediate pressures”, J. Phys. D: Appl. Phys., vol. 25, p.
1713-1732, 1992.
[48] P. Azimi and H. Golnabi, “Precise formulation of electrical capacitance for a cylindrical
capacitive sensor”, J. Appl. Sci., vol. 9(8), p. 1556-1561, 2009.
[49] D. Bohm, E. H. S. Burhop, and H. S. W. Massey, The Characteristics of Electrical Discharges in
Magnetic Fields, A. Guthrie and R. K. Waherling, ed., New York: McGraw-Hill, 1949.
[50] M. R. Talukder, D. Korzec, and M. Kando, “Probe diagnostics of high pressure microwave
discharge in helium”, J. Appl. Phys., vol. 91, no. 12, p. 9529-9538 ,2002.
[51] A. K. Srivastava, M. K. Garg, K. S. G. Prasad, V. Kumar, M. B. Chowdhuri, and R. Prakash,
“Characterization of atmospheric pressure glow discharge in helium using langmuir probe, emission
spectroscopy, and discharge resistivity”, IEEE Trans. Plasma Sci., vol. 35, no. 4, p. 1135-1142, 2007.
[52] R. M. Clements, C. S. MacLatchy, and P. R. Smy, “Verification of static spherical probe theory in
a moving high-pressure plasma”, J. Appl. Phys., vol. 43, p. 31-37, 1972.
[53] A. Gamero, “Spectroscopic diagnostics of high pressure discharges”, J. Phys. IV France, vol. 8, p.
339-348, 1998.
[54] X-M Zhu, W-C Chen, and Y-K Pu, “Gas temperature, electron density and electron temperature
measurement in a microwave excited microplasma”, J. Phys. D: Appl. Phys., vol. 41, p. 105212,
2008.
[55] J. M. Luque, M. D. Calzada, and M. Saez, “The electron density measured using the Stark
broadening of both Hα and Hβ lines in a plasma column sustained by a surface-wave: the ionic dynamic

81
effect”, A. Bouchoule, J. M. Pouvesle, A. L. Thomann, J. M. Bauchire and E. Robert ed., 15th
ISPC,
Orléans, France, PO.5.193, p. 1515, 2001.
[56] J. M. Luque, M. D. Calzada, and M. Saez, “Experimental research into the influence of ion
dynamics when measuring the electron density from the Stark broadening of the Hα and Hβ lines”, J.
Phys. B: At. Mol. Opt. Phys., vol. 36, p. 1573-1584, 2003.
[57] H. R. Griem, Plasma Spectroscopy, New York: McGraw-Hill, 1964.
[58] H. R. Griem, Spectral Line Broadening by Plasmas, New York: Academic, 1974.
[59] C. O. Laux, T. G. Spence, C. H. Kruger, and R. N. Zare, “Optical diagnostics of atmospheric
pressure air plasmas”, Plasma Sources Sci. Technol., vol. 12, p. 125-128, 2003.
[60] J. J. Olivero and R. L. Longbothum, “Empirical fits to the Voigt line width: a brief review”, J.
Quant. Spectrosc. Radiat. Transfer, vol. 17, p. 233-236, 1977.
[61] A. Ricard, L. St-Onge, H. Malvos, A. Gicquel, J. Hubert, and M. Moisan, “Torche à plasma à
excitation micro-onde: deux configurations complémentaires”, J. Phys. III France, vol. 5, p.
1269-1285, 1995.
[62] C. O. Laux, “Radiation and Nonequilibrium Collisional-Radiative Models,” von Karman
Institute Lecture Series 2002-07, Physico-Chemical Modeling of High Enthalpy and Plasma Flows, D.
Fletcher, J.-M. Charbonnier, G. S. R. Sarma, and T. Magin ed., Rhode-Saint-Genèse, Belgium, 2002.
[63] D. Staack, B. Farouk, A. Gutsol, A. Fridman, “DC normal glow discharges in atmospheric
pressure atomic and molecular gases”, Plasma Sources Sci. Technol., vol. 14, p. 700-711, 2005.
[64] S. Chapman and T. G. Cowling, The Mathematical Theory of Non-uniform Gases, 3rd
ed.,
Cambridge University Press, 1990.
[65] X. Zheng, D. G. Cahill, and J.-C. Zhao, “Thermal Conductivity Imaging of Thermal Barrier
Coatings”, Adv. Eng. Mater., vol. 7, p. 622, 2005.
[66] S. Herioth, J. Koch, T. Lippert, A. Wokaun, D. Günther, F. Garrelie, and M. Guillermin, “Laser
ablation characteristics of yttria-doped zirconia in the nanosecond and femtosecond regimes”, J. Appl.
Phys., vol. 107, p.014908, 2010.
[67] T. E. Strangman, “Thermal barrier coatings for turbine airfoils”, Thin Solid Films, vol. 127, p.
93-105, 1985.
[68] T. Salminen, M. Hahtala, I. Seppälä, P. Laukkanen, and T. Niemi, “Picosecond pulse laser
ablation of yttira-stabilized zirconia from kilohertz to megahertz repetition rates”, Appl. Phys. A, vol.
101, p. 735-738, 2010.
[69] B. Meng, X. D. He, Y. Sun, and M. W. Li, “Preparation of porous Ni-YSZ coatings by EB-PVD”,
Mater. Sci. Technol., vol. 25, p. 117-120, 2009.

82
APPENDIX
The MATLAB code for calculating the temperature distribution in the René N5 substrate
using the heat transfer model in Section 3.4 is:
%Define constants of the René N5 substrate
D=2.54; %Diameter (cm)
Z=0.3; %Thickness (cm)
k=14.2; %Heat conductivity (W/m*K)
h1=10/k; %heat convective coefficient front surface (Air=10-100 W/m3)
h2=10/k; %heat convective coefficient back surface (Air=10-100 W/m3)
Tair=25; %Air temperature
%Define grid size and grid array
rgridsize=0.005;
rgrid=0:rgridsize:D;
zgridsize=0.01;
zgrid=0:zgridsize:Z;
%Initialize Temperature Profile Arrays
Tprev=500*ones(length(rgrid),length(zgrid));
Ti=500*ones(length(rgrid),length(zgrid));
%Define plasma temp Gaussian function
y0=84.2444;
A=974.73462; %Max temperature
b=D/2; %Shifted peak to center of cylinder
w=0.6697; %Sharpness of peak
Tplasma=y0+0.6366*A*w*((4*((rgrid-b).^2)+(w^2))).^(-1);
%Calculate Temperature Profile using finite difference method
for step=1:2000 %Max number of iteration
Tprev=Ti;
for j=2:(length(zgrid)-1)
for i=2:(length(rgrid)-1)
Ti(i,j)=(rgridsize*zgridsize)^2/(2*(rgridsize^2+zgridsize^2))*...
(((Ti(i+1,j)-Ti(i-1,j))/(2*rgrid(i)*rgridsize))+...
((Ti(i-1,j)+Ti(i+1,j))/(rgridsize^2))+...
((Ti(i,j-1)+Ti(i,j+1))/(zgridsize^2)));

83
Ti(i,length(zgrid))=(Ti(i,length(zgrid)-1)+Tair*(h1)*zgridsize)/(1+(h
1)*zgridsize); %Boundary Condition 1
Ti(i,1)=(Ti(i,2)+Tplasma(i)*(h2)*zgridsize)/(1+(h2)*zgridsize); %Bou
ndary Condition 2
Ti(1,j)=Ti(2,j); %Boundary Condition 3
Ti(length(rgrid),j)=Ti(length(rgrid)-1,j); %Boundary Condition 4
end
end
if max(max(Tprev-Ti))<0.000001 %Stop if temperature profile converges
break
end
step
end
Ti(1,1)=Ti(2,1);
Ti(length(rgrid),1)=Ti(length(rgrid)-1,1);
Ti(1,length(zgrid))=Ti(2,length(zgrid));
Ti(length(rgrid),length(zgrid))=Ti(length(rgrid)-1,length(zgrid));
surf(rgrid,zgrid,Ti)

84
AUTHOR’S BIOGRAPHY
Zihao Ouyang was born and raised in Liuyang, Hunan province, China. Zihao attended the
Peking University in China and enrolled in the Department of Physics in the fall of 2004. He
graduated with a Bachelor’s of Science in Physics in the summer of 2008. From here, Zihao
attended the University of Illinois at Urbana-Champaign and enrolled in the Department of
Nuclear, Plasma, and Radiological Engineering in the fall of 2008. Zihao is working towards
completing a Doctorate of Philosophy in Nuclear, Plasma, and Radiological Engineering.