Embed Size (px)
Citation preview

DDEEPPOOCCEENN Working Paper Series No. 2012/ 10
Equity and Access to Tertiary Education: The Case of Vietnam
VU HOANG LINH
Indochina Research & Consulting (IRC), Hanoi Email: [email protected]
LE VIET THUY
Department of Education Management, National Economics University, Hanoi. Email: [email protected]
GIANG THANH LONG
Indochina Research & Consulting (IRC), Hanoi Email: [email protected]
The DEPOCEN WORKING PAPER SERIES disseminates research findings and promotes scholar exchanges in all branches of economic studies, with a special emphasis on Vietnam. The views and interpretations expressed in the paper are those of the author(s) and do not necessarily represent the views and policies of the DEPOCEN or its Management Board. The DEPOCEN does not guarantee the accuracy of findings, interpretations, and data associated with the paper, and accepts no responsibility whatsoever for any consequences of their use. The author(s) remains the copyright owner. DEPOCEN WORKING PAPERS are available online at http://www.depocenwp.org

Equity and Access to Tertiary Education:
The Case of Vietnam
VU HOANG LINH
Indochina Research & Consulting (IRC), Hanoi
Email: [email protected]
LE VIET THUY
Department of Education Management,
National Economics University, Hanoi.
Email: [email protected]
GIANG THANH LONG
Indochina Research & Consulting (IRC), Hanoi
Email: [email protected]
(Draft, not for citation)
Abstract: The objectives of this case study of equity and access to tertiary education
in Vietnam are to (i) document the significance and consequences of disparities in tertiary
education opportunities, particularly in specific instances and areas of Vietnam, (ii)
investigate the results and lessons of efforts to expand access to tertiary education, and (iii)
offer concrete recommendations for effective policies directed toward the ideas of
widening participation. To pursue these research objectives, we evaluate students at three
periods of their study life, i.e. access to universities; performance in universities; and
completion from universities, using a number of individual and household characteristics.
Our data include the Vietnam Household Living Standard Survey (VHLSS) in 2006 and a
survey conducted at the National Economics University (NEU), Hanoi in late 2009. An
important contribution of this paper is to highlight cases, in which equity provisions in
tertiary education policies might have had detrimental effects on the quality of the tertiary
system and on the capacity for a government to maximize the potential of tertiary
education in stimulating economic growth and development.

2
Acknowledgements
We would like to thank the World Bank for providing a generous funding to complete this
report. We are also thankful to the participants of the higher education meeting at the
Ministry of Education and Training (MoET) on 3 February 2010 for their useful
comments. Our special thanks should go to Dr. Emanuela di Gropello (Human
Development Unit, East Asian Region of the World Bank) for her enthusiasm and
excellent comments and suggestions, which helped us to improve our analysis. All possible
errors, however, remain our responsibilities.

3
Table of Contents
Equity and Access to Tertiary Education: The Case of Vietnam ....................................................... 1
1. Introduction ................................................................................................................................ 5
2. Education system in Vietnam and the evolution of tertiary education since Doi moi. .............. 6
2.1. Higher education in Vietnam: Background and evolution ................................................. 6
2.2. Previous studies on equity and access to tertiary education in Vietnam ............................ 9
2.3. Government policies regarding the tertiary education ...................................................... 10
3. Methodology and Data Sources ............................................................................................... 12
3.1. Concepts and measures ..................................................................................................... 12
3.2. Description of Data ............................................................................................................... 15
3.2.1. The Vietnam Household Living Standard Survey 2006 (VHLSS 2006). ...................... 15
3.2.2. The NEU Survey 2009 .................................................................................................. 16
4. Inequality in access, performance and completion in tertiary education ................................. 16
4.1. Disparity in access ............................................................................................................ 16
4.2. Disparity in affordability .................................................................................................. 20
4.3. Disparities in performance................................................................................................ 23
5. Factors determining access, performance and completion in higher education ............................ 28
5.1 Determinants of access ...................................................................................................... 28
5.2. Determinants of performance and completion ................................................................. 36
6. An examination of government policies .................................................................................. 37
6.1 Policies on tuition and fees ................................................................................................ 37
6.2. Other policies .................................................................................................................... 39
7. Concluding remarks ................................................................................................................. 40
Appendix ...................................................................................................................................... 42

4
List of Tables
Table 1: Number of enrolled students, 2000-2008 ............................................................................. 7
Table 2: The swift development of the higher education system in Vietnam .................................... 8
Table 3: Selected Tertiary Education Indicators ................................................................................ 8
Table 4: Graduates in tertiary education, by specialization in 2008 .................................................. 9
Table 5: Definition of Indicators for Affordability .......................................................................... 14
Table 6: Accessibility to Tertiary Education Indicators ................................................................... 17
Table 7: Basic access indices across countries ................................................................................. 20
Table 8: Affordability indicators, by educational levels (% of per capita income).......................... 21
Table 9: Affordability indicators at tertiary education, by levels and ownership ............................ 22
Table 10: Affordability of Different Population Groups (% of household income per capita) ....... 23
Table 11.1. Mean GPA of Student from different regions…………………………………………23
Table 11.2: Difference in GPA due to different original residential regions………………………23
Table 12.1 : Mean GPA by different ethnicities groups……………………………………………23
Table 12.2 : Difference in GPA in terms of ethnicities…………………………………………….24
Table 13.1: Mean GPA by students‟ fathers‟ education levels…………………………………….24
Table 13.2: Mean GPA by students‟ mothers‟ education levels…………………………………...24
Table 13.3: Difference in GPA due to Fathers‟ education levels…………………………………..24
Table 13.4: Difference in GPA due to Mothers‟ education levels…………………………………25
Table 14.1 : Mean GPA by students‟ parents‟ careers……………………………………………..25
Table 14.2 : Difference in GPA due to fathers‟ careers……………………………………………25
Table 14.3 : Difference in GPA due to mothers‟ careers…………………………………………..25
Table 15.1: Means of GPA by family income quintiles……………………………………………26
Table 15.2: Difference in GPA due to family income……………………………………………...26
Table 16: Determinants of GPA of first-year university students………………………………….26
Table 17: Socio-economic factors and tertiary education access ..................................................... 29
Table 18: Probit regression model 1* .............................................................................................. 30
Table 19: Probit regression model 2 ................................................................................................ 32
Table 20: Determinants of GPA of first-year university students .................................................... 37
Table 21: Higher education cost per month………………………………………………………...35
Table 22: Higher education cost per month………………………………………………………...35
List of Figures
Figure 1: The current structure of the education system in Vietnam ................................................. 7
Figure 2: Change in composition of Vietnam‟s education system 2000-2007................................... 8
Figure 3: Comparing tertiary education indicators among income quintiles* ................................. 16
Figure 4: Education cost and education benefit (as % of per capita income) ................................. 22
Figure 5: Probability of attending college/university after high school, persons aged 18-23 .......... 31
Figure 6: Distrivbution of national UEE marks by regions………………………………………...36
Figure A1: Tertiary education enrolment, by age ............................................................................ 42
Figure A2: Education levels of household head, head‟s spouse, father and mother. ....................... 42

5
1. Introduction
Tertiary education is a key factor in a nation‟s effort to develop a highly skilled
workforce for competing in the global economy. There are important private and public
benefits to participating in tertiary education.1 Higher salaries, better employment
opportunities, increased savings, and upward mobility are some of the private economic
benefits obtained by taking part in tertiary education. A tertiary education graduate also
obtains non-economic benefits including, a better quality of life, improved health, and
greater opportunities for the future. Tertiary education can also be linked to the demand for
high quality skills in the new knowledge economy. Tertiary education through the creation
of new knowledge, development of innovative technologies and development of scholars
in varied specialties can bolster the labor force in today‟s global and competitive economy.
Given the extensive social and private benefits that result from tertiary education,
access and inclusion are essential for achieving social justice and ensuring the realization
of the full potential of all young people. First, in the interest of fairness, every individual
must be given an equal chance to partake in tertiary education and its benefits irrespective
of income and other social characteristics including gender, ethnicity, and language.
Second, there is a strong efficiency argument in favor of equity promotion. A talented but
low-income student who is denied entry into tertiary education represents a loss of human
capital for society. The lack of opportunities for access and success in tertiary education
will lead to underdeveloped or undeveloped human resources.
Gender inequality in tertiary education also persists in many parts of the developing
world, particularly in the countries of the Middle East, Sub-Saharan Africa and South Asia.
Even in the few countries where gender parity has been achieved in tertiary education,
“gender streaming” of women toward specific types of non-university institutions and/or
toward specific disciplines leading to low-paying occupations can be observed. Female
over-representation persists in teaching institutes, nursing schools, and secretarial schools.
Women are commonly over-represented in the humanities, while yet most often
underrepresented in subject areas such as agriculture, medicine, business, science and
engineering programs. Women are also underrepresented in leadership roles in tertiary
education institutions.
There are both non-monetary and monetary barriers to entry into tertiary education.
Academic ability, information access, motivation, inflexibility of university admission
processes, and family environment and others forms of cultural capital are some of the
non-monetary reasons that have been recognized as important factors in explaining poor
participation of low-income individuals in tertiary education. There are also three monetary
barriers to tertiary education, including the cost-benefit barrier, the cash-constraint or
liquidity barrier, and the internalized liquidity constraint or the debt aversion barrier. The
cost-benefit barrier occurs when an individual decides that the costs of attending university
(including tuition and living expenses as well as opportunity costs of not working during
the duration of the course) outweigh the returns to their education. Liquidity barriers refer
to a student‟s inability to gather the necessary resources to pursue tertiary education after
having decided that the benefits do outweigh the costs. And, the debt aversion constraints
occur when a student values the benefits of tertiary education to its costs, can borrow to
access to sufficient financial resources, but, regardless of these factors, chooses not to
matriculate because the financial resources available to him/her include loans. All three of
1 In this paper, tertiary education and higher education are use alternatively.

6
these monetary barriers are contributing to rising inequity in tertiary education
participation.
The objectives of this case study of equity and access to tertiary education in
Vietnam are to document the significance and consequences of disparities in tertiary
education opportunities, particularly in specific instances and areas of Vietnam, to
investigate the results and lessons of efforts to expand access to tertiary education, and to
offer concrete recommendations for effective policies directed toward the ideas of
widening participation. Such research aims are important, as Vietnam will also enter a so-
called „demographic bonus‟, in which working-age population, particularly youth, will be
increasing quickly for about two decades. Our analysis will focus on students at colleges
and universities, not in vocational training institutions, because they are treated differently
for training purposes. To pursue these research objectives, we will use data from the
Vietnam Household Living Standard Survey (VHLSS) in 2006, and data from a survey
conducted in November 2009 with about 400 second-year students at the National
Economics University as supplementary data (hereafter called the NEU Survey 2009).
The research is organized as follows. In the next part, we will provide a brief view on
education system in Vietnam and the evolution of the tertiary education since Doi moi.
Then, our methodology and data will be described in Part 3. In Part 4, we will analyze
disparities in access, affordability, and performance of the students, using both VHLSS
2006 and NEU Survey 2009. To explore the results in Part 4 more thoroughly, we will
conduct some regression models to determine factors impacting such differences in Part 5.
In Part 6, we will provide some evaluations of government policies on tertiary education,
such as tuition and fee policies and student loan policy. We will provide some concluding
remarks in the last part of the paper.
2. Education system in Vietnam and the evolution of tertiary education
since Doi moi.
In this section, we address the question of how access and equity are, or rather,
should be defined in the economic and social contexts of Vietnam. We will start with a
review of the education system in Vietnam, and how the roles of tertiary education have
evolved in the overall national education priorities.
2.1. Higher education in Vietnam: Background and evolution
Higher education in Vietnam has quite a long history, but the current system is in
need of essential reforms because it has been behind in comparison with the higher
education system in most developing and developed countries. The first university in
Vietnam was established in 1076, but only for the royal family and their children. The
French colonial regime, which ruled Vietnam from the later half of 19th century to
September 1945, invested very little in tertiary education. And in more than forty years
from 1945 to the late 1980s, the higher education system in Vietnam was imitated the
former Soviet education system. Most of the current public universities, which were
established in that time, still are highly specialized in one or few fields of study.
Since 1986, when the Communist Party and the Government of Vietnam adopted Doi
moi to replace the centrally-planned economy with a market economy, Vietnam has
dramatically changed in various economic and social aspects. These changes, on the one
hand, have facilitated and promoted the development of the education system; on the other

7
hand, they have made many pressures on the education system in general and the higher
education system in particular, in which the unification and restructuring process,
including the establishment of semi-public and non-public educational institutions, are
embraced.
The current education system in Vietnam has five levels: pre-primary education;
primary education; lower secondary education; upper secondary education; and higher
(tertiary) education. The higher education (HE) system includes university (from 4 to 6
years, depending on the field of study), college (3 years), master (from 1 to 3 years after
getting university degree, depending on the field of education and the forms of study) and
doctorate education (2 to 4 years after getting master degree) (Figure 1).
Figure 1: The current structure of the education system in Vietnam
Source: Mori and Nguyen (2008)
2
Table 1: Number of enrolled students, 2000-2008 Unit: 1,000 people
2000 2001 2002 2003 2004 2005 2006 2007 2008
Primary 10,063 9,751 9,337 8,841 8,350 7,773 7,318 7,041 6,872
Lower secondary 5,767 5,918 6,254 6,498 6,612 6,671 6,445 6,218 5,858
Upper secondary 2,159 2,400 2,529 2,768 2,977 3,269 3,530 3,627 …
Tertiary 732 749 785 829 1,328 1,355 … 1,588 1,655
Source: World Bank Education Statistics and UNESCO Education Statistics.
Table 1 shows the enrolment numbers at different education levels from 2000 to
2008. The figures show that tertiary system has expanded at the expense of primary
schooling. From 2000 to 2008, the number of tertiary students increased by 120 percent,
from 732 thousand students to 1.66 million students. At the same time, the number of
2 Mori, Junichi and Nguyen, Thi Xuan Thuy. (2008), “Development of Industrial Human Resources for FDI-
oriented Industrialization in Vietnam”. http://www.vdf.org.vn/Doc/2008/VDFConfContribution2.pdf,
accessed 30 November 2009.
Kindergarten
Nursery
Upper secondary
Lower secondary
Primary
General Education
Infant Education
Professional
secondary *
Doctor
Master
University *
College *
Higher Education
Professional
Education
Education system
* Education institutions
provide TVET programs
Vocational college*
Vocational secondary*
Vocational training
center *
TVET system

8
enrolled primary students reduced by 32 percent from 10.06 million to 6.87 million people.
Thus, there were 13.7 primary pupils per each tertiary student in 2000. In 2008, there were
4.2 primary pupils per each tertiary student. There are at least two reasons for this
substantial change in the composition of Vietnam‟s education system (Figure 2). First,
reducing birth rates during the last decade means that the population of primary school age
has reduced, while the population of tertiary school age has increased. Second, there has
been a shift in government policies in recent years that aim at expanding Vietnam‟s higher
education system.
Figure 2: Change in composition of Vietnam’s education system, 2000 & 2007
Table 2: The swift development of the higher education system in Vietnam
1987 1997 9/2009
Number of HE Institutions 101 126 376
Non-public HE institutions 0 15 81
Number of students 133.136 715.231 1.719.499
Source: Ministry of Education and Training (2009)
Table 2 shows that the HE system in Vietnam has developed swiftly in a short period
of time. In 1987, there were only 101 public HE institutions, no private HE institutions,
and 133 thousand students. After two decades, by 2009, the numbers were 376; 81; and
more than 1.7 million, respectively.
Table 3: Selected Tertiary Education Indicators
2000 2001 2002 2003 2004 2005 2006 2007 2008
Enrollment
Female enrollment share (%) 41.6 42.1 42.8 43.0 40.9 40.9 48.2 49.3 48.8
Number of teachers (1,000) 30.3 32.2 35.9 38.6 46.7 47.6 48.6 53.5 56.1
Female teachers share (%) 37.9 38.7 39.3 39.7 40.5 40.5 42.2 44.4 45.0
Ratio of student/teacher (%) 24.2 23.3 21.8 21.5 28.4 28.4 .. 29.7 29.5
Private enrollment share (%) 13.1 10.6 9.1 8.8 10.2 10.2 11.8 11.4
Graduates
Total graduates (1,000) .. .. .. .. .. 182.5 .. 242.0 243.5
Female graduates share (%) .. .. .. .. .. 42.4 .. 43.8 43.1
Source: World Bank Edstats, accessed on January 10, 2010 at:
http://ddp-ext.worldbank.org/ext/DDPQQ/member.do?method=getMembers&userid=1&queryId=189,
Table 3 summarizes selected tertiary education indicators since 2000. Both the
number of students and the number of teachers have increased steadily during the decade.

9
However, the growth rate of teachers has been lower than that of students. As a result, the
student to teacher ratio increased from 24.2 in 2000 to 29.5 in 2008, which could be an
imperative to increasing both access to and quality of the higher education system.
There has been a steadily increasing trend of female enrolment in tertiary education.
Female enrolment share increased from 41.6 percent in 2000 to 48.8 percent in 2008. At
the same time, the ratio of female teachers also increased from 37.9 percent in 2000 to 45.0
percent in 2008. The share of the private enrolment fluctuated during the period. It reduced
from 13.1 percent in 2000 to 8.8 percent in 2003 before increasing again to 11.4 percent in
2008.
Table 4: Graduates in tertiary education, by specialization in 2008
% of graduates Female share (%)
Education 33.22 52.50
Social sciences 27.29 52.96
Engineering 19.76 22.43
Agriculture 5.02 38.73
Services 3.99 18.32
Humanities and arts 3.93 31.33
Health 3.19 44.70
Others 3.60 38.57
Total 100 43.1
Source: World Bank Edstats
Table 4 presents graduates in tertiary education by specialization in 2008. We can see
that the share of female graduates was relatively the same as that of male graduates in
some social research-related fields such as education and social sciences, but was much
smaller than that of male graduates in some technical fields such as engineering.
2.2. Previous studies on equity and access to tertiary education in Vietnam
To the best of our knowledge, this topic has not been well examined in Vietnam.
Though, in the few academic studies on different aspects of education in Vietnam, the
issues on equity and access have been mentioned. Most of these studies have focused on
the enrolment quotas and indicate that the current HE system does not meet the demand in
various senses: unequal rates of enrolment in HE institutions, uneven spread of
investments between public and non-public HE institutions, especially universities,
between urban and rural areas, between HE and other educational levels.
One of the recent studies evaluating this issue is World Bank (2008).3 To measure
the level of accessing higher education, this study uses the gross enrolment rate (GER) in
higher education, which is calculated by the total number of students enrolled in higher
education divided by the total age group of 18-24 years old. Comparing the GER figure
calculated from the Vietnam Household Living Standard Survey (VHLSS) in 2004 with
those from other regional countries, the study concludes that, despite an impressive growth
of the HE system, the GER in Vietnam is still lower than that of other performing
countries, i.e. China, Malaysia, the Philippines, and Thailand.
In addition, the estimation of completion and enrolment rates of higher education by
area (urban and rural), income quintiles (the richest and the poorest), and gender (males
3 World Bank (2008), Vietnam: Higher education and skills for growth. The World Bank Asia and Pacific
Region.
10
and females) suggests that the HE completion rates are quite different between these
groups of people. For instance, the rate of women enrolled in HE is 48 percent, while that
of men is 52 percent. The difference in access is large between ethnic minorities and non-
minorities, considering both numbers enrolled in HE and the number of individuals
holding higher education degrees. The distribution of HE enrolment by income quintiles
suggests that the richer are likely to have to better access to HE than the poorer: the richest
quintile has the highest level of enrolments in HE, and it is about four timesthat of the
poorest.
However, the causes of the said disparities have not been carefully examined. The
study suggests that there are some specific barriers that may be limiting individual‟s access
to HE, such as a limited number of universities and faculties, financial barriers, and
familial characteristics.
In an excellent overview of studies on the issues of access and equity in the higher
education system in Vietnam, Oliver (2004) provides some critical findings from other
studies. As quoted in his analysis, World Bank (1997)4 shows that the richest 20 percent
account for more than half of all those enrolled in upper secondary and tertiary education.
Also, Dang (1998)5 indicates that children of poor families still do not have equal access to
higher education in comparison with better income families.
In his review of higher education system in Vietnam, Ngo (2006)6 states that access
to higher education for young people from rural, remote and mountainous areas and
children of underprivileged families has increased by about 70 percent annually. He
attributes this widening access to the government policies, including the establishment and
development of public and non-public higher education institutions, especially those in
remote areas; the introduction of a student loan programme; and the expansion of “in-
service” higher education. However, his study does not provide in-depth analysis on the
access to higher education and its determinants.
At the best of our knowledge, the current study is the first attempt to investigate the
factors that influence higher education access, equity, and performance in Vietnam, using
different datasets with both individual and household characteristics.
2.3. Government policies regarding the tertiary education
In 1993, the Government of Vietnam issued the Decree 90/CP, dated 24 November
1993, which committed that Vietnam would have a unification of the HE system. In the
Article 3 and Article 4 of this Decree, the government declared that all people, regardless
of their circumstances, should have the right of access to HE. This declaration was
legalized in the Law of Education of Vietnam (1998, 2005, and the amended 2009). The
Law stated that:
4 World Bank. (1997). Vietnam education financing. (World Bank Stock No. 14023). Washington, DC: The
World Bank. 5 Dang, Xuan Hai. (1998). “Vietnam”. Country report presented at the National Institute for Educational
Research, Tokyo (Japan), United Nations Educational, Scientific and Cultural Organization, Bangkok
(Thailand), and Asian Centre for Educational Innovation for Development Seminar on Recent Reform and
Perspectives in Higher Education, Bangkok, Thailand. In NIER Report (1998), pp. 152-158. (ERIC
Document Reproduction Service No. ED 346 082). 6 Ngo Doan Dai (2006). “Vietnam.” in Higher Education in South-East Asia, Asia-Pacific Programme of
Educational Innovation for Development, United Nations Educational, Scientific and Cultural Organization.
Bangkok: UNESCO Bangkok, 2006, 219-250.

11
- All citizens have the right and responsibility to pursue education.
- All citizens, regardless of ethnics, religion, gender, family status, or economic
circumstances, are equal in terms of access to education.
- The government is responsible to maintain the equity of access, to create
favourable conditions for disadvantaged people in access to education.
To meet these aims, some key policies have been created and implemented in the
past 10 years to influence the equity and access to tertiary education in Vietnam. Among
them are some important policies.
First, the Priority in University Recruitment policy, in which students from special
groups will enjoy a lower University Entrance Examination Cut-Off Score. These groups
includes: students from remote and mountainous areas (namely Region 1), from rural area
(namely Region 2-NT), and students whose parents are ethnic minority people or war
disables.
Second, the University Entrance Nomination policy, in which every year Ministry of
Education and Training (MoET), Ministry of Investment and Planning (MPI), and Ministry
of Labour, Invalids and Social Affairs (MoLISA) allow a number of students from
disadvantaged provinces to enter the assigned public universities without participating in
any university entrance exams. The number of students is proposed by the provincial
governments according to their socio-economic development level. These students,
however, are still required to pass the national upper secondary exams as well as pursue an
intensive one-year education before entering normal university courses. In fact, the ethnic
minority students are always preferred when the provincial governments select the list of
students under this policy.
Third, the Student Loan Policy. The government through the State Bank of Vietnam
(SBV) has conducted the student loan policy since 1995. The first trial of this service was
only for a limited number of students in public universities through the former Vietnam
Industrial and Commercial Bank (now Vietnam Industrial Bank, Vietinbank). In March
1998, the Government of Vietnam issued Decision No.51/1998/QĐ-TTg on the setting up
of the training credit fund (later on it was replaced by Decision No.107/2006/QĐ-TTg,
dated 18/05/2006, on credit for pupils and students), and in July 1998, the SBV issued the
Decision No.219/1998/QĐ-NHNN1 for the guidelines on credit fund for students. The
SBV also appointed Vietinbank as the credit provider and managing institution for the
repayments. After 9 years of implementation of this policy, however, only 100,000
students were granted with a total of VND 290 billions. On average, each student has
borrowed only VND 2.9 millions, and the beneficiaries only account for 1 percent of the
total number students. The main reasons for such a low rate of student loan include: the
credit limit is low (at first it was VND 150.000 per month, and then increased to VND
300,000 per month); only full-time students can borrow money; and students have to repay
the loan after only 6 months from their graduation.
To improve the situation, in 2007, the Government issued the Decision No.
157/2007/QĐ-TTg on student credit loan, in which most students could benefit from the
policy. In detail, the credit allowance was higher, increased from VND 300,000 per month
to VND 800,000 per month. The repayments would be deferred for one year after the

12
graduation. Thus, only about two years after the Decision, the number of students
benefiting from the policy was 1,335,000 and VND 13,517 billions were borrowed.
In June 2009, in a conference on summarizing results of the student credit program,
Vice Prime Minister and Minister of Education H.E. Nguyen Thien Nhan stated that there
were no poor students in Vietnam who had to stop their studies due to the lack of money.
He also confirmed that the Government would try its best to allocate more money for this
program. It was considered that this statement would support the idea that increasing HE
tuition fees in the coming years would not heavily affect disadvantaged people from
pursuing the HE (considering they are academically admitted to HE). In the later part of
this research, this statement will be carefully examined with the data from our case study at
NEU.
3. Methodology and Data Sources
3.1. Concepts and measures
In this section, we define the concepts and measures that represent equity and access
to tertiary education.
3.1.1. Equity in access to tertiary education
Several indicators are selected to capture different aspects of access to tertiary
education. Anisef (1985)7 discusses two types of access to tertiary education: Type I refers
to the extent of access among population, while Type II is related to the background and
composition of participants with access. This approach has been used in Usher and
Cervenan (2005)8 and Murakami and Blom (2008)
9. In this paper, we measure Type I
access by the participation ratio, gross and net enrolment ratio of tertiary education, and by
the attainment rate of tertiary education, while Type II access is captured by the education
equity index and the gender parity index. In particular, we calculated the following indices:
Type I access
- Participation Ratio (PR): is the percentage of population enrolling in tertiary
education (including post-graduate degrees, such as master and doctoral
degrees).
- Gross Enrolment Ratio (GER): is calculated by expressing the number of
students enrolling in tertiary education, regardless of age, as a percentage of the
population of a certain age group. In this paper, that age group is defined as the
age ranging from 18 to 22, which is that of the five-year age group after the
high school leaving age.
- Net Enrolment Ratio (NER): is the number of students in the theoretical age
group for tertiary education enrolled in tertiary education expressed as a
7 Anisef, P., Bertrand, M.A., Hortian, U., James, C., (1985). “Accessibility to Postsecondary Education in
Canada: A Review of the Literature.” Secretary of State, Ottawa, ON 8 Usher, A., Cervenan, A., (2005). “Global Higher Education Rankings 2005.” Educational Policy Institute,
Toronto, ON. 9 Murakami, Y., Blom, A. (2008). “Accessibility and Affordability of Tertiary Education in Brazil,
Colombia, Mexico and Peru within a Global Context.” World Bank Policy Research Working Paper 4517.

13
percentage of the population in that age group. In this paper, this age group is
18-22.
- Education Attainment Ratio (EAR): is measured as a percentage of population
that attains a particular education level. We calculate the ratio between the
people aged 25 to 34 years who completed college or university education in
relation to the total population in the same age range. Thus, the advantage of
EAR is that it measures completion of tertiary education before the age of 34
(Murakami and Blom, 2008).
Type II access
- Gender Parity Index (GPI): is defined as the ratio of GER of female students
enrolled at a given level of education to GER of male students at the same level
(Murakami and Blom, 2008). To calculate the GPI, we use the GER by gender.
GPI is calculated as the ratio of GER of female students at tertiary level to GER
of male students at tertiary level. A value of less than one indicates differences
in favour of males, whereas a value near one indicates that parity has been more
or less achieved. Proximity to gender parity is another possible indicator of
equity in higher education access. In this indicator, any deviation from gender
parity is treated as being indicative of inequality and, therefore, negative.
- Educational Equity Index (EEI): is an indicator to measure socio-economic
status (SES) determinants of access to education. Usher and Cervenan (2005)
and Murakami and Blom (2008) define Education Equity Index (EEI) as the
ratio of students‟ socio-economic status (SES) to the SES of the general
population, using father‟s education as a proxy for students‟ SES. In our
analysis, we use household head‟s education instead of father‟s education as an
indicator for socio-economic status. Such a use is due to two reasons. First, our
data from the VHLSS 2006 include data on household members based on the
relationship between the members and the household head. Thus, if a student is
a grandchild of the household head, we are not able to know the educational
qualification of that student‟s father or mother. Using father‟s education as a
proxy for a household‟s SES in that case will exclude from the sample all
extended families as well as the households in which the fathers are missing.
Second, since a household head is generally considered the household decision-
maker, using a household head‟s education as a proxy for the household‟s SES
is more appropriate than using father‟s education. Third, there are no
convincing arguments in using father‟s education instead of such alternatives as
mother‟s education to represent a household‟ SES. Thus, generating EEI in our
study requires two indicators: (i) the percentage of students in tertiary education
living in households in which household heads have a tertiary education degree
(this measure indicates the SES of the student population), and (ii) the
percentage of household heads with tertiary education degrees among the
general population, which measures the SES of the general population. The
index is a ratio of the second indicator to the first one, and then multiplied by
100.
The formula for EEI is:
EEIh= %(Hh/PRh)*100, (1)

14
in which Hh is a percentage of household heads with tertiary education and PRh
is a percentage of students living in such households in which the household
heads have completed tertiary education. EEI is usually lower than 100,
reflecting that the SES of the student population is often better than the SES of
the general population. Therefore, the higher the EEI score, the more the SES of
the student population resembles that of the general population, indicating that
tertiary education is more equitable. In contrast, the lower the score, the less
equitable the system of tertiary education is.
In order to capture the disparity in accessibility in tertiary education in both types, we
develop a composite index, namely Education Accessibility Index (EAI). The EAI reflects
both the extent of and the equity in access to tertiary education. EAI is defined by adding
four different indexes: net enrolment ratio, gender parity, education attainment ratio, and
education equity index, using their weights. The weights chosen for this study are based on
Usher and Cervenan (2005): they are 25 percent for net enrolment ratio, 10 percent for
gender parity, 25 percent for education attainment ratio, and 40 percent for education
equity index. The reason behind the weight is that we attach equal importance to Type I
and Type II access (both 50%). We consider net enrolment ratio and education attainment
ratio to have similar importance. However, we consider education equity to be more
important than gender parity, and thus we give more weight to education equity (40%) than
to gender parity (10%).
The deriving formula is as follows:
Education Accessibility Index = 0.25*Net Enrolment Ratio +
+ 0.1* 100*abs (1-Gender Parity) + 0.25*Education Attainment Ratio +
+ 0.4*Education Equity Index. (2)
In this study, the access indices will be calculated for the whole population in
Vietnam, and across groups differentiated by such dimensions as income and ethnicities.
3.1.2 Affordability in tertiary education
In analyzing equity and access to higher education, it is crucial to examine
affordability in tertiary education. We express the estimated costs of attending tertiary
education as a function of ability to pay. This study uses real per capita income to express
ability to pay. We measure the costs of attending tertiary education by four indicators of
affordability, taking into account direct cost and indirect costs.
The four indicators are the combinations of cost components including tuition, other
education costs and education benefits. They are defined as in Table 5. Net education cost
ratio is the most important indicator, reflecting overall affordability of the higher
education.
Table 5: Definition of Indicators for Affordability Indicators
(per income per capita) Formulas
Tuition ratio Tuition
Education cost ratio
Tuition+ other education costs (fund contribution, uniform, textbook,
attending extra costs, transportation, lodging)
Education benefit ratio Scholarship+ educational subsidies (for lodging, transportation etc.)
Net education cost ratio Education cost- Education benefit

15
3.1.3 Performance indicators in tertiary education
To assess equity in education performance, there are a number of methods. Some
commonly used performance indicators in education literature include:
- Non-completion rates: the proportion of students who leave the system without
completing the requirements of their institution in a given school year.
- Promotion rate: is the proportion of students who have successfully completed a
grade and proceeded to the next grade the following year.10
- Repetition rate: the proportion of students who repeat a grade once or twice.
- Percentage of repeaters: Percentage of repeaters at a particular grade.
- Duration of schooling: This calculates the duration of schooling at tertiary
institutions, normally in comparison with the generally “normal period” needed
to obtain a degree at such institutions.
- GPA (Grade Point Average): Among many indicators, a student‟s performance
can be assessed by his/her GPA. In this study, we use GPA as the indicator
reflecting a student‟ performance at tertiary institutions. The higher is a
student‟s GPA, the better performance he/she has.
3.2. Description of Data
3.2.1. The Vietnam Household Living Standard Survey 2006 (VHLSS 2006).
The Vietnam Household Living Standard Survey (VHLSS) 2006 is the main dataset
used in this study. The survey covers 45,000 households, of which 75 percent live in rural
area. The survey collects information on household socio-economic status, including
income, education, health, and employment. The education module in VHLSS 2006 has
more details than in the previous surveys in 2002 and 2004. It includes such information as
education achievement, education costs, subsidies, and extra classes.
Although most of the modules in VHLSS 2006 collect information on all 45,000
households, the expenditure module collects details on household consumption in only
9,189 households. Therefore, it is possible to estimate poverty rates based on either
consumption (with data on 9,189 households) or income module (with data on 45,000
households). The General Statistics Office of Vietnam (GSO) defines poverty based on
expenditure module, and it was VND 2,556 thousand per capita per year. In 2006, the
national poverty headcount was estimated at 16 percent, based on the expenditure data
(World Bank, 2007).11
10
In some universities in Vietnam, students need to fulfil some requirements before being accepted to
promote in to higher grade („Year‟). Thus, if a student fails in some courses in Year 1, he/she may not be
accepted to enter Year 2. 11
World Bank (2007), Vietnam Development Report 2008: Social Protection. Hanoi: World Bank.

16
3.2.2. The NEU Survey 2009
The main aim of this survey is to provide supplement data in order to further explore
the disparity in performance in higher education. We conduct a survey on 400 second-year
students in order to get their GPA in the first year at NEU. The current system at NEU is
the credit system, in which students can decide the subjects where they wish to be enrolled.
However, for the first year, most students will have the same list of subjects.
4. Inequality in access, performance and completion in tertiary education
In this section, we will describe and analyze disparities in access and performance in
tertiary education along the dimensions of socio-economic groups, gender, regions, and
ethnic groups.
4.1. Disparity in access
To estimate accessibility indicators, we use data from the education, demographic,
expenditure and income modules of the VHLSS 2006. The education section provides data
on school participation, the highest level of education completed, household head‟s
education, and current level of education. The demographic section of the survey includes
age, gender, relationship of an interviewee to household head, geographic characteristics
and ethnicity of the household head, and household size. The income and expenditure
sections provide data on household income and expenditure per capita.
Figure 3: Comparing tertiary education indicators among income quintiles*
0
10
20
30
40
50
60
70
Partic
ipatio
n ratio
(PR
)
Gro
ss e
nrol
men
t rat
e (G
ER)
Net enr
olm
ent r
ate
(NER)
Educa
tion
Attain
men
t Rat
io
Gen
der d
ispa
rity
Edu. E
quity
Inde
x (E
EI)
Acces
sibi
lity In
dex (E
AI)
Poorest
Lowest middle
Middle
Upper middle
Richest
Note: *gender disparity index is defined as 100* abs (1-gender parity)
Source: Own estimates from VHLSS2006.
Figure 3 shows that there is marked difference in tertiary education accessibility
among quintiles. Similar trends are also observed in the expenditure groups as well as in
the poor/non-poor categorization.

17
Table 6: Accessibility to Tertiary Education Indicators
Type I Type II Composite
Index
Participation
ratio (PR)
Gross
enrolment
rate (GER)
Net
enrolment
rate (NER)
Education
Attainment
Ratio (EAR)
Gender
Parity
(GP)
Education
Equity Index
(EEI)
Accessibility
Index (EAI)
Income per
capita
(VND mil.)
Whole country 2.29 20.84 15.27 8.48 1.03 37.76 21.32 6.89
By area
Urban 4.12 37.37 27.75 19.68 1.04 58.05 35.49 10.16
Rural 1.60 14.65 11.05 3.69 0.98 31.17 16.31 5.72
By region
Red River Delta 3.13 28.78 22.38 15.01 1.01 47.24 28.37 7.22
North East 2.14 18.02 13.22 5.30 1.20 29.71 18.53 5.85
North West 1.08 8.80 4.82 5.86 0.76 25.66 15.29 3.68
North Central Coast 2.59 23.76 18.59 6.21 1.08 29.03 18.64 5.22
South Central Coast 2.96 27.52 20.74 9.75 0.83 36.74 24.01 6.07
Central Highland 1.79 16.70 12.26 4.40 1.17 46.59 24.53 5.77
South East 2.71 25.57 17.72 12.85 1.02 48.94 27.38 9.95
Mekong River Delta 1.20 11.08 7.61 3.98 1.07 28.30 14.96 7.08
By ethnicities
Kinh and Chinese 2.54 23.36 17.32 9.61 1.02 39.38 22.72 7.52
Minority 0.70 5.99 3.81 1.60 1.33 21.32 13.17 3.60
By gender
Female 2.14 21.14 16.19 7.96 46.61 -- 6.84
Male 2.44 20.57 14.44 9.02 35.35 -- 6.95
By income quintiles
Poorest 0.53 6.04 5.16 0.24 1.22 -- -- 2.11
Lowest middle 0.99 10.08 7.71 0.66 0.83 31.61 16.45 3.59
Middle 1.72 15.24 11.94 2.39 1.09 41.74 21.16 5.15

18
Upper middle 2.72 22.22 16.07 7.80 1.04 44.65 24.22 7.49
Richest 4.89 39.94 30.04 24.96 1.03 60.66 38.27 15.95
By poverty status
Non-poor 2.54 22.46 16.47 9.52 1.03 39.91 22.74 7.69
Poor 0.47 5.44 4.58 0.22 1.47 -- -- 1.91 Note: -- unavailable data.
Source: Own estimates from VHLSS2006.

19
Table 6 summarizes the accessibility indices. Gross Enrolment Ratio (GER) is quite high
(at 20.84), and much higher than the corresponding figure of 10.0 in 2002 from the UNESCO
Education Statistics. A reason is an explosive expansion of tertiary system over the past years.
From 2002 to 2007, the number of students in tertiary system doubled, from 785,000 students in
2002 to 1,588,000 students in 2007 (UNESCO Education Statistics).
Table 6 shows remarkable variability in accessibility among different population groups.
Generally, rural and lower-income people have much less access than urban and higher-income
people, respectively. Thus, for example, only 0.24 percent of the poorest quintile of the 25-34
age group completed tertiary education. In contrast, 24.96 percent of the richest quintile of that
age group could complete tertiary education.
Based on the composite accessibility index, Table 6 indicates substantial variation in
tertiary education accessibility among regions. Residents in Red River Delta and South East have
highest accessibly to tertiary education, as indicated by their respective composite accessibility
index: 28.4 and 27.4, respectively. The two regions also have highest income per capita. In
contrast, people in North West, Mekong River Delta, and North East have low accessibility to
education. In particular, North West has the lowest accessibility index. It is also the region with
the lowest gross (and net) enrolment ratio, the lowest equity index and the worst gender
disparity. Since this region is also the poorest region in the country, limited financial resource
could be a primary reason for low education accessibility in North West.
The case of Mekong River Delta should be noted. This region has relatively large land area
per head and is economically better-off than most other regions, except South East and Red
River Delta. Yet, its accessibility index is lower than all other regions, except the North West.
This fact shows that the regions with better incomes are not necessarily the ones with better
education achievements. An opposite case to Mekong River Delta is Central Highlands, which is
among the poorest regions but has a relatively high accessibility index, mostly due to its high
education equity index.
It is also interesting to compare the gender parity index among regions. While gender
disparity12
between boys and girls is low nationwide and in both rural and urban areas, there is
much variability in this index across regions. The two richest regions, i.e. Red River Delta and
South East, have low gender disparity. On the other hand, North West, North East, Central
Highlands, and South Central Coast have high gender disparity. Yet, the gender disparity in
North West (0.76) and South Central Coast (0.83) tend to favour boys to girls, while girls have
more advantages than boys in accessing tertiary education in North East (1.20) and Central
Highlands (1.17).
Ethnically speaking, the Kinh and Chinese groups have better access to tertiary education
than the ethnic minority households. In fact, the Kinh and Chinese have higher indicators than
the minority in the composite indicator as well as in all component indicators.
Comparing between men and women, it shows that men have higher participation ratio and
education attainment ratio than women. However, women have higher gross and net enrolment
ratio and have higher educational equity index than men. It means that women now enjoy higher
tertiary education access than they could in the past.
12
Calculated by the absolute value of one minus gender parity index, multiplied by 100: 100× (1-abs (GPI)).

20
Table 6 shows that there is much larger variability among the EAI than the PR, GER or GP
across groups. For example, while the GERs of Red River Delta and South Central Coast are
slightly different (28.78 and 27.52 respectively), the EAI of Red River Delta (15.01) is much
higher than that of South Central Coast (9.75). Since GER reflects current enrolment, while EAI
indicates completed tertiary education, it means that today‟s tertiary education is more equal
between South Central Coast and Red River Delta than in the past. In other words, the gap in
tertiary education access between South Central Coast and Red River Delta has narrowed during
recent years.
Regarding EEI, Table 6 reveals that people in Red River Delta, Central Highlands and
South East have more equal access to tertiary education, while those in North Central Coast,
North East, North West, and Mekong River Delta have more inequality. The differences in
equity in access across regions can be caused by several factors, such as affordability of tertiary
education, inequality in graduation of high schools, and government policies in expanding access
to disadvantaged students.
Table 7: Basic access indices across countries
EEI* GP
Netherlands 67 1.08
Finland 61 1.23
United Kingdom 64 1.23
United States 57 1.35
Canada 63 1.34
Australia 59 1.24
Ireland 63 1.29
France 55 1.27
Sweden 55 1.54
Italy 47 1.34
Germany 43 0.92
Belgium 37 1.18
Austria 38 1.19
Colombia 26 1.09
Mexico 17 1.05
Peru 37 0.7
Brazil 12 1.25
Vietnam 37.76 1.03
Note: EEI is calculated based on head‟s educational level in Vietnam but based on father‟s educational level in other
countries.
Source: Own estimates for Vietnam with data from VHLSS2006; and Murakami and Blom (2008) for other
countries.
Table 7 compares the EEI and GP across a sample of developed and developing countries.
Vietnam has among the highest gender parity in the sample. Vietnam however, has among the
lowest EEI in the sample, with the exception of Mexico and Brazil.
4.2. Disparity in affordability
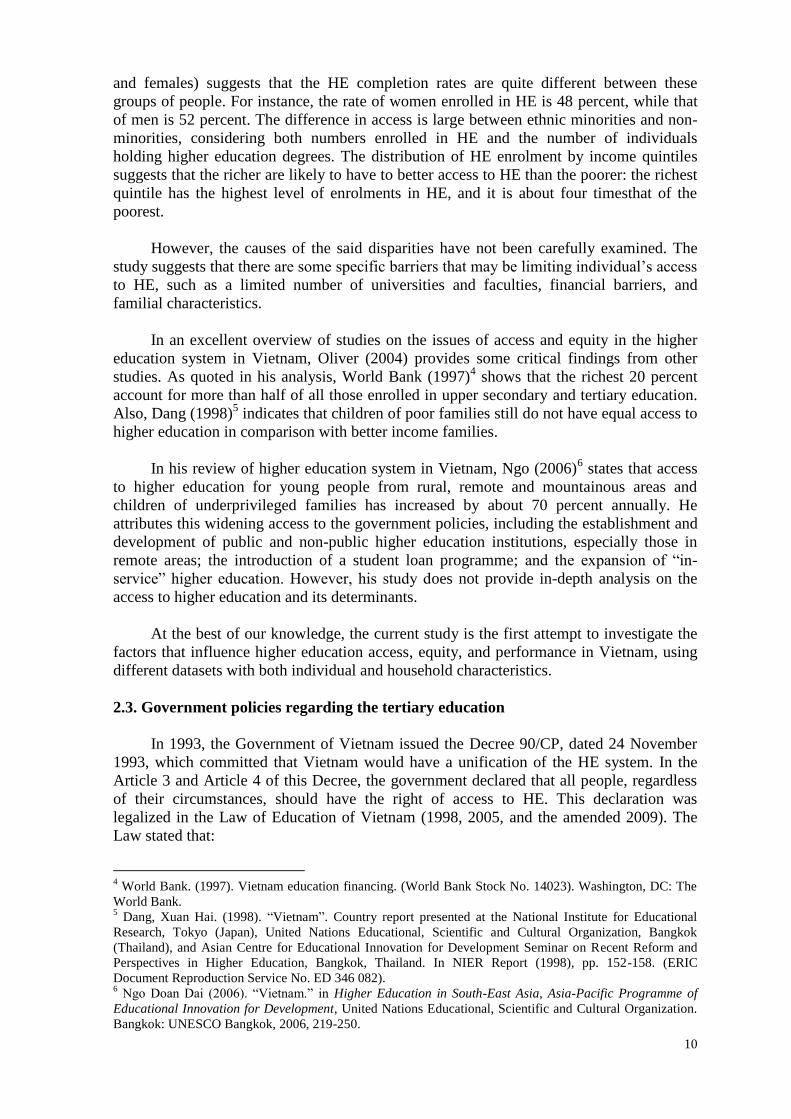
Our results show that affordability is a serious issue in Vietnam‟s education. Table 8
summarizes affordability indices by different education levels. Altogether, education costs
account for 16.3 percent of per capita income. After deducting education benefits with

21
scholarships and grants, net education costs are about 15 percent of per capita income. Net
education cost share is a little higher in urban areas (19.0 percent) than in rural areas (13.9
percent).
Table 8: Affordability indicators, by educational levels (% of per capita income)
Tuition
cost
Education
cost
Education
benefit13
Net
education cost
Tuition/
Education cost
All level 4.53 16.26 0.24 15.29 19.52
Rural 3.72 14.89 0.25 13.93 16.67
Urban 6.75 19.99 0.20 18.98 27.24
Primary 0.34 7.74 0.58 7.18 2.62
Rural 0.15 7.11 0.64 6.54 1.41
Urban 1.04 10.02 0.35 9.51 6.94
Secondary 1.73 11.34 0.71 10.56 14.15
Rural 1.41 10.33 0.79 9.51 13.24
Urban 2.87 14.91 0.43 14.27 17.35
High school 4.85 20.27 0.67 19.43 22.80
Rural 4.58 19.82 0.75 18.91 22.07
Urban 5.58 21.47 0.46 20.82 24.77
Tertiary 19.25 47.72 2.67 44.21 44.13
Rural 20.85 53.58 3.04 49.96 40.03
Urban 17.46 41.00 2.29 37.62 48.72 Source: Own estimates from VHLSS2006.
Table 8 also indicates that education costs increase along with higher education levels.
Primary schooling costs are 7.7 percent; secondary schooling costs 11.3 percent; high school
costs 20.3%; and tertiary education costs 47.7 percent of per capita income. While education cost
share is lower in rural areas than in urban areas at pre-tertiary levels, it is higher in rural areas
than in urban areas at tertiary levels (53.58 percent vs. 41.00 percent). There are at least two
reasons for it. First, tertiary students living in urban areas are often richer than rural students.
Therefore, tertiary education cost as a proportion of income is lower for urban students than for
rural students. Second, the “education costs” collected in the survey include lodging costs. Since
urban students usually live in their parents‟ houses and pay no rents, their lodging costs are
considered zero. In contrast, lodging costs are considered part of education costs for rural
students who study in the cities and pay rents for their housing. From Table 8, it is clear that
tertiary education is more affordable to urban dwellers than for rural dwellers.
Table 9 summarizes affordability indices at tertiary education, categorized by levels and
ownership. Annual education costs are about VND 3.6 million at junior colleges; VND 4.4
million at bachelor level; and VND 7.8 million at master level. However, net education costs at
master level are smaller than those at junior college and bachelor level, because of substantial
education benefits at this level. In terms of money values, education costs at junior college level
are lower than at bachelor level. Yet, its share to household income per capita is higher than at
bachelor level because average income per capita of junior college students is significantly lower
than that of university students. In addition, tuition costs in non-public schools are higher than
those in public schools by 75 percent. Nevertheless, it seems that there is less non-tuition
education costs in non-public schools than in public schools. As a result, education costs and net
education costs in non-public schools are only higher than those in public schools by 42 percent
and 37 percent, respectively.
13
It would be interesting if we can include student loans as benefits in our analysis. This information, however, is
not available in the VHLSS 2006.

22
Table 9: Affordability indicators at tertiary education, by levels and ownership Costs Junior college
(3 years)
Bachelor
(4-5 years)
Master Public Non-public
Tuition cost (VND thousand) 1,476 1,779 2,318 1,580 2,769
Education cost (VND thousand) 3,569 4,397 7,749 4,036 5,747
Education benefit (VND thousand) 172 300 4,554 280 605
Net education cost (VND thousand) 3,397 4,097 3,195 3,756 5,142
Tuition cost share (%) 21.03 18.69 14.58 18.39 26.46
Education cost share (%) 48.81 47.29 49.53 46.86 55.12
Education benefit share (%) 2.92 3.35 27.61 3.36 4.79
Net education cost share (%) 45.89 43.94 21.92 43.50 50.34
Tuition/Education cost (%) 41.5 45.03 46.84 42.93 54.14
Source: Own estimates from VHLSS2006.
Figure 4: Education cost and education benefit (as % of per capita income)
0
10
20
30
40
50
60
Vietn
amPer
u
Bra
zil
Colom
bia
Mex
ico
Japa
n
Unite
d State
s
Unite
d Kingd
om
Fran
ce
Ger
man
y
Swed
en
Education cost
Education benefit
Source: Own estimates for Vietnam’s data from VHLSS2006; and Murakami and Blom (2008) for others
In comparison to some selected countries, Figure 4 shows that education cost share is
relatively high in Vietnam, similar to Peru and Brazil, and much higher than Colombia, Mexico
and other developed countries.
Table 10 (below) summarizes affordability indicators for different population groups.
Among regions, households in South Central Coast and Mekong River Delta must pay the
highest share of their income to tertiary net education costs. On the other hand, tertiary net
education cost ratios are lowest in North West and Central Highland, possibly because tertiary
students in these regions tend to attend some low-cost, government-supported colleges and
universities in their localities.
In terms of ethnics, net education cost ratio is lower for the ethnic minority households,
mostly due to large educations grant and scholarships to these minority groups. Men tend to pay
more than women for tertiary education, mostly because their non-tuition education costs are
higher.

23
Table 10: Affordability of Different Population Groups (% of household income per capita)
Tuition ratio Education
cost ratio
Education
benefit ratio
Net
education
cost ratio
Tuition per
education
cost
All country 19.32 48.42 2.74 44.67 43.55
By area
Urban 17.33 41.10 2.19 37.92 48.15
Rural 20.97 54.33 3.24 50.11 39.75
By region
Red River Delta 19.60 47.40 1.74 44.86 45.18
North East 21.05 48.82 3.15 45.47 43.46
North West 12.07 38.24 6.55 30.74 26.40
North Central Coast 18.37 51.82 3.32 45.73 35.56
South Central Coast 23.40 54.63 3.67 52.67 45.56
Central Highland 14.43 38.68 4.36 31.01 37.81
South East 18.90 44.54 2.10 40.57 50.96
Mekong River Delta 18.16 51.72 2.55 48.56 42.58
By ethnicity
Kinh and Chinese 19.45 48.32 2.37 45.11 44.43
Minority 16.73 50.21 10.37 36.39 26.98
By gender
Female 18.89 44.67 2.87 40.49 45.30
Male 19.68 51.57 2.63 48.18 42.06
By income quintiles
Poorest 49.37 126.25 5.94 122.29 33.74
Lowest middle 30.09 77.12 5.22 64.49 34.31
Middle 26.96 62.87 2.88 60.72 43.51
Upper middle 21.84 55.54 2.70 50.75 41.49
Richest 13.23 33.62 1.88 31.20 46.29
By poverty status
Poor 48.85 118.33 8.24 109.19 34.46
Non-poor 18.98 47.59 2.58 43.90 43.66 Source: Own estimates from VHLSS2006.
Table 10 shows markedly differences in affordability across income groups. While net
education cost is just 31 percent of per capita income in the richest quintile, it is 122 percent of
per capita income in the poorest quintile. Undoubtedly, paying tertiary education is a severe
issue for poor households, which in turns may defer tertiary education enrolment of bright but
poor young men and women.
4.3. Disparities in performance
Using the NEU survey on about 400 second-year students, we examine the factors
determining student performance. We first compare the performance, which is measured by the
mean of the first year GPA between different student groups in terms of their backgrounds:

24
original residential regions (region 1; region 2-rural; region 2-urban; and region 3 (metropolitan);
ethnic groups (ethnic minorities and non-minorities); parents‟ educational levels (with five
levels: no schooling, primary education, lower-secondary education, upper-secondary education,
and post-secondary education); parents‟ careers; and family income. Using the estimated data,
we conduct one-way ANOVA test to examine the statistical significance of the above
differences. Our findings are as following.
Table 11.1. Mean GPA of Student from different regions.
Source: Own estimates from NEU survey.
Table 11.2: Difference in GPA due to different original residential regions
Sum of Squares df Mean Square F Sig.
Between Groups 4.895 3 1.632 5.683 .001
Within Groups 112.249 391 .287
Total 117.143 394
Source: Own estimates from NEU survey.
Table 11.1 shows difference in GPA due to different original residential regions. Table
11.2 shows that with the F-ratio of 5.683, regional differences is 5.7 times for intra-regional GPA
(1.632 vs. 0.287), and it is statistically significant at 1 percent significance level. This means
that, at the NEU, students coming from regions with better socio-economics development level
could perform better than those coming from lower socio-economics development level.
Table 12.1 : Mean GPA by different ethnicities groups
GPA * Ethnic
GPA
7.3222 371 .54007
7.0921 24 .59089
7.3082 395 .54527
Ethnic
Kinh
Minority
Total
Mean N Std. Dev iat ion
GPA
7.1289 47 .53738
7.2512 137 .52937
7.3221 141 .54606
7.5121 70 .52623
7.3082 395 .54527
Region Region 1
Region 2 - Rural
Region 3 - Urban
Region 3 - Metropolitan
Total
Mean N Std. Deviation

25
Table 12.2 : Difference in GPA in terms of ethnicities
Sum of Squares df Mean Square F Sig.
Between Groups 1.193 1 1.193 4.044 .045
Within Groups 115.950 393 .295
Total 117.143 394
Source: Own estimates from NEU survey.
Table 12.1 and Table 12.2 show differences in GPA in terms of ethnicities. The non-
minority students are clearly doing better than are the minority ones. The average GPA of Kinh
students is 7.32, while the average GPA of ethnic minority students is 7.1. This difference is
statistically significant, as the results from ANOVA test are statistically significant at 5-percent
significance level.
Table 13.1: Mean GPA by students’ fathers’ education levels
GPA * Father_Edu
GPA
7.0875 8 .54363
7.3639 62 .48263
7.2618 105 .55999
7.3345 208 .55803
7.3142 383 .54698
Father_Edu
Primary Edu
Lower Secondary Edu
Upper Secondary Edu
Teriary Edu and Higher
Total
Mean N Std. Dev iation
Source: Own estimates from NEU survey.
Table 13.2: Mean GPA by students’ mothers’ education levels
GPA * Mother_Edu
GPA
7.2567 3 .26764
6.8833 6 .70828
7.3606 62 .57925
7.2688 123 .51615
7.3350 189 .54987
7.3102 383 .54641
Mother_Edu
No-schooling
Primary Edu
Lower Secondary Edu
Upper Secondary Edu
Teriary Edu and Higher
Total
Mean N Std. Dev iation
Source: Own estimates from NEU survey.
Table 13.3: Difference in GPA due to Fathers’ education levels
Sum of Squares df Mean Square F Sig.
Between Groups .938 3 .313 1.045 .372
Within Groups 113.351 379 .299
Total 114.289 382
Source: Own estimates from NEU survey.

26
Table 13.4: Difference in GPA due to Mothers’ education levels
Sum of Squares df Mean Square F Sig.
Between Groups 1.587 4 .397 1.333 .257
Within Groups 112.465 378 .298
Total 114.051 382
Source: Own estimates from NEU survey.
As the number of students with parents who have no-schooling education is too small, we
will not consider this level of education in the analysis. Tables 13.1–13.4 provide the results of
the survey, which show that performance of the students coming from families whose parents
have lower educational levels is the same as those whose parents have higher educational levels.
The results from ANOVA test obviously support this statement, as the difference is not
statistically significant. This means that, once students enter the university, given other things
constant, their performances depend on their ability, it is not due to their parents‟ background.
Table 14.1 : Mean GPA by students’ parents’ careers
Father_Job Mean N Std. Deviation Mother_Job Mean N Std. Deviation
Wages 7.3318 208 .52672 Wages 7.3252 183 .54115
Sales 7.3440 42 .59370 Sales 7.3168 72 .56353
Argriculture 7.3232 84 .53046 Argriculture 7.3422 97 .54825
Production 6.9472 18 .52538 Production 6.9473 11 .50307
No work 7.3060 35 .61335 No work 7.2122 32 .50844
Total 7.3111 387 .54642 Total 7.3082 395 .54527
Source: Own estimates from NEU survey.
Table 14.2 : Difference in GPA due to fathers’ careers
Sum of Squares df Mean Square F Sig.
Between Groups 2.532 4 .633 2.145 .075
Within Groups 112.718 382 .295
Total 115.250 386
Source: Own estimates from NEU survey.
Table 14.3 : Difference in GPA due to mothers’ careers
Sum of Squares df Mean Square F Sig.
Between Groups 1.898 4 .475 1.606 .172
Within Groups 115.245 390 .295
Total 117.143 394
Source: Own estimates from NEU survey.
Tables 14.1–14.3 show that parents‟ careers also seem not to affect student‟s performances
in the university. The average GPAs of the students from four groups are quite similar with the
exception of the group of students whose parents are in production (manufacturing) industries.
The number of observations of this group, however, is small (less than 20), so the results might
not be precise. The results from ANOVA test show no statistical differences between groups.

27
Table 15.1: Means of GPA by family income quintiles.
Statistics
395 395
0 0
4264.6329 7.3082
2000.0000 6.9000
3000.0000 7.1540
4000.0000 7.5000
6000.0000 7.7500
Valid
Missing
N
Mean
20
40
60
80
Percentiles
Income GPA
Source: Own estimates from NEU survey.
Table 15.2: Difference in GPA due to family income
Sum of Squares df Mean Square F Sig.
Between Groups 13.989 33 .424 1.484 .046
Within Groups 103.154 361 .286
Total 117.143 394
Source: Own estimates from NEU survey.
Tables 15.1 and 15.2 present our average estimated GPA for students with different family
income quintiles. It shows that family income do affect students‟ performances: students from
families with lower income (20% poorest quintile) have the lowest average GPA (6.9), while
other students from higher income families have higher average GPA. In particular, students
from the richest families have the highest average GPA (7.75). The ANOVA results when
compare the mean GPA and family in Table 15.2 has statically proved that the family income
affects the students‟ GPA.
Table 16: Determinants of GPA of first-year university students
Coef. Std. Err. t-stat P-value
Disadvantaged areas (KV1) -0.04 0.02 -2.20 0.03
Rural areas (KV2-NT) -0.03 0.01 -2.91 0.00
Other urban areas (KV2-TT) -0.02 0.01 -1.82 0.07
Log(Entrance score) 0.26 0.05 4.79 0.00
Log (Household income) 0.00 0.01 0.50 0.62
Log (Education expenditure) 0.01 0.01 1.74 0.08
Kinh ethnicity 0.00 0.03 0.16 0.87
Father has post-high school degrees 0.00 0.01 0.23 0.82
Mother has post-high school degree 0.01 0.01 1.05 0.29
Father has wage job 0.00 0.01 0.29 0.78
Father is self-employed 0.02 0.01 1.15 0.25
Mother has wage job -0.02 0.01 -1.24 0.22
Mother is self-employed -0.03 0.01 -2.28 0.02
Constant 1.10 0.19 5.90 0.00
Number of obs 350
F( 13, 336) 4.01
Prob > F 0
R-squared 0.1344
Note: Default area: Metropolitan (KV3). Default father‟s and mother‟s job: Agriculture.
Source: Own estimates from NEU survey.

28
Table 16 shows that the localities also have significant effects on students‟ performances,
using an OLS regression model. Students from disadvantaged areas, rural areas and other urban
areas have lower GPA than those having metropolitan background. The most important
determinant of a student‟s GPA is his/her entrance score. Education expenditures, which cover
such costs as tuition and extra-class expenses, also affect positively a student‟s performance in
class. On the other hand, household income, parent‟s education and parent‟s job appear to have
no effects on a student‟s performance. The exception is when a student‟s mother is self-
employed. In this case, the student‟s performance is negatively affected.
5. Factors determining access, performance and completion in higher education
5.1 Determinants of access
In this section, we will to identify the socio-economic factors influencing access to tertiary
education. In Table 16, we summarize the factors that may affect a person aged 18-22 who is
attending a tertiary education institution. These factors are categorized into three groups:
demographic factors, parents‟ education, and income-related factors. For each variable, we
compare the mean value of the tertiary education participants with the non-participants. The
latter can be further decomposed into those having completed high school and those who have
not.
Table 17 shows that there are noticeable differences between the students and the two
groups of non-students. Compared to the non-students, the students in higher education
institutions often live in urban areas, live in households which are smaller and have a smaller
proportion of children. On average, 45.6% of students live in urban areas, while 21.4% of non-
students live in urban areas. The average household size is 4.8 persons in the students‟
households, but 5.5 persons in the non-students‟ households. Females and males have similar
acesss to tertiary education and high school degrees. About 50.2% of the tertiary students are
female, and 49.9% of the non-students who completed high schools are female. In contrast,
females account for only 45.1% of all people aged 18-22 who neither finish high school nor go
to college.
Parents‟ completed education seems to have a strong correlation with their children‟s
probability of participating in higher education. Among students, 29.6% have a father who
completed high school and 16.9% have a father who completed bachelor degree or above. In
contrast, only 13.6% of non-students have a father who completed high school and 2.5% have a
father who completed bachelor degree or above. Likewise, 19.9% of students have at least a
parent with a bachelor degree or above. The corresponding proportion in non-students is only
3.1%.
Furthermore, better-off households have higher participation rate than the poorer ones.
About 44.6% of students belong to the richest income quintile, and only 5% belong to the
poorest quintile. On the other hand, 18.1% of non-students belong to the richest quintile, and
16.6% belong to the poorest quintile. On average, income per capita of students is 53% higher
than that of non-students, while expenditure per capita of students is 73% higher than that of
non-students.
In order to determine the factors affecting access to tertiary education, we first use a probit
regression model (Model 1). The dependent variable is a binary variable which has a value of
one if the person enrolled in a higher educational institution in 2006 and has a zero value

29
otherwise. Model 1 is run for every person aged 18-22. There are two variants of this model: the
first conditional on a person completed high school (Model 1A) and the second unconditional,
i.e. applying to all people aged 18-22 (Model 1B). Therefore, Model 1A compares students with
all non-students who have completed high schools (and aged 18-22). Model 1B compares
students with all non-students in the same age group including those who have not completed
high schools. Each variant is run with and without sampling weights.
Table 17: Socio-economic factors and tertiary education access
% of the population in the 18-22 age group
Tertiary
students
Non students
Completed
high school
No high
school
degree
All non-
students
Demographic
Living in urban areas (%) 45.58 29.02 17.21 21.42
Female (%) 50.19 49.92 45.14 46.85
Female head (%) 25.32 21.15 19.54 20.12
Minority (%) 3.80 9.34 21.70 17.29
Head's age (%) 50.82 50.44 50.17 50.27
Household size (persons) 4.78 5.12 5.72 5.50
Children proportion (%) (<15 years) 6.92 8.90 14.71 12.64
Elderly proportion (%) (>59 years) 5.49 5.55 5.79 5.71
Parents’ education
Father, primary schooling (%) 16.13 26.61 51.97 40.80
Father, lower secondary (%) 37.21 47.78 39.05 42.90
Father, high school (%) 29.55 21.20 7.68 13.64
Father, junior college (%) 2.50 0.88 0.33 0.58
Father, university (%) 16.98 4.19 1.22 2.53
Mother, primary schooling (%) 21.99 33.47 54.61 44.63
Mother, lower secondary (%) 39.87 48.01 39.53 43.53
Mother, high school (%) 26.48 15.77 5.06 10.12
Mother, junior college (%) 4.76 1.14 0.44 0.77
Mother, university (%) 6.86 1.55 0.35 0.92
At least a parent, high school or above (%) 53.13 31.01 10.23 19.09
At least a parent, college or above (%) 19.88 5.33 1.44 3.10
Both parents, high school or above (%) 29.36 10.23 2.69 6.47
Both parents, college or above (%) 7.60 1.01 0.30 0.66
Income-related
Head working for wage (%) 42.54 33.47 30.16 31.34
Head working in agriculture (%) 45.86 61.83 69.00 66.44
Head, non-farm self-employment (%) 28.71 26.07 17.27 20.40
Income per capita (VND thousand) 10,615 8,153 6,087 6,823
Expenditure per capita (VND thousand) 9,540 6,913 4,787 5,555
Contribution of agricultural income (%) 25.64 36.61 44.41 41.63
Contribution of wages income (%) 39.34 35.57 36.17 35.96
Lowest income 20% (%) 4.97 9.99 20.19 16.55
Low to middle income 20% (%) 9.17 15.14 22.02 19.57
Middle income 20% (%) 16.79 21.70 22.58 22.27
Middle to high income 20% (%) 24.44 26.33 21.00 22.90
Highest income 20% (%) 44.62 26.84 14.21 18.71
Note: Parents‟ education data are for only individuals who are sons or daughters of a household head.
Source: Own estimates from VHLSS2006.

30
The regression results are presented in Table 17. Table 17 shows that between regions,
young people in South Central Coast are more likely to enrol in tertiary education than those in
Red River Delta. In contrast, young people in North East are less likely to go to colleges than
those in Red River Delta. Young people living in urban areas are more likely to attend college
than those in rural areas.
Among the determinants of tertiary education access, both head and head‟s spouse
education levels have strong impacts. Children living in households whose heads or head
spouses have only primary education or no formal schooling are less likely to go to college,
although the effect is only significant in Model 1B. Meanwhile, those living in households
whose heads have high school degrees or tertiary decrees are more likely to go to colleges and
universities. Coefficients for head education and head spouse‟s education at both junior college
and bachelor level are higher than those at high school. Therefore, children living in households
whose heads or head spouses finish junior college and bachelor level are more likely to enrol in
tertiary institutions than those living in households whose heads or head spouses only finish high
school.
Table 18: Probit regression model 1*
Dependent variable (1=tertiary education enrolment; 0= no enrolment, age range: 18-22)
Conditional on finishing high school
(model 1a)
No Conditional (model 1b)
Weighted Unweighted Weighted Unweighted
Coef. Z Coef. Z Coef. Z Coef. Z
Urban 0.88 1.6 0.84 1.7* 1.01 1.9* 0.98 1.9*
North East -0.16 2.2** -0.15 2.1** -0.16 2.5*** -0.15 2.3**
North West -0.18 1.1 -0.17 1.1 -0.17 1.2 -0.16 1.1
North Central Coast 0.03 0.5 0.04 0.6 0.03 0.5 0.05 1.0
South Central Coast 0.35 4.2*** 0.36 4.3*** 0.40 5.5*** 0.41 5.7***
Central Highlands 0.23 2.0** 0.19 1.7* 0.13 1.4 0.10 1.1
South East 0.09 1.0 0.11 1.2 0.15 1.9* 0.14 1.8*
Mekong River Delta 0.13 1.5 0.11 1.3 0.06 0.8 0.05 0.6
Head's education
Primary or no schooling -0.10 1.6 -0.10 1.6 -0.25 4.8*** -0.25 4.8***
High school 0.20 3.5*** 0.21 3.9*** 0.31 6.0*** 0.31 6.3***
Junior college 0.49 2.6** 0.47 2.6** 0.61 3.5*** 0.55 3.3***
Bachelor or higher 0.64 4.2*** 0.61 4.0*** 0.64 4.5*** 0.64 4.5***
Head's spouse education
Primary or no schooling -0.09 1.6 -0.09 1.6 -0.18 3.5*** -0.18 3.7***
High school 0.16 2.4** 0.16 2.5** 0.31 4.9*** 0.30 5.1***
Junior college 0.66 4.5*** 0.57 3.8*** 0.76 5.5*** 0.69 5.0***
Bachelor or higher 0.70 4.0*** 0.65 3.9*** 0.86 5.1*** 0.77 4.9***
Female 0.04 0.9 0.04 0.9 0.08 2.1** 0.09 2.4**
Female head 0.02 0.2 0.00 0.1 0.09 1.1 0.07 0.9
Head‟s age (log) 0.50 2.8*** 0.44 2.4** 0.59 4.7*** 0.55 4.0***
Household size -0.05 2.9*** -0.04 2.2** -0.05 3.2*** -0.04 2.6**
Children proportion -0.59 2.7*** -0.75 3.7*** -0.98 5.1*** -1.10 6.3***
Income per capita (log) 0.06 1.6 0.10 2.6** 0.11 3.0*** 0.14 4.2***
Minority -0.33 3.1*** -0.31 3.3*** -0.31 3.4*** -0.29 3.5***

31
Poor commune -0.21 2.1** -0.21 2.3*** -0.18 2.2** -0.17 2.2**
Remote commune 0.02 0.2 0.03 0.3 -0.07 -0.9 -0.07 1.0
High school in commune 0.00 0.1 0.03 0.6 0.02 0.3 0.05 0.9
Constant -2.80 3.6*** -2.95 3.9*** -3.91 6.8*** -4.11 6.8***
Number of obs 4158 4158 7640 7640
Wald chi2(26) 266.7 309.9 620.8 776.5
Prob > chi2 0 0.00 0 0
Note: Default region: Red River Delta; default head and spouse education: lower- secondary school. *: significant at
90% confidence interval; **: 95% confidence interval; ***: 99% confidence interval
Source: Own estimates from VHLSS2006.
Income per capita has significant impact on student enrolment in tertiary education. It
indicates that richer households have better access to higher education than poorer households.
This can be further demonstrated by a Kernell regression in Figure 5 (below) run on all people
aged 18-22 who had finished high school. The figure shows that, as income per capita increases,
the probability of attending college also increases.
Figure 5: Probability of attending college/university after high school, persons aged 18-22
0.1
.2.3
Pro
bab
ility
of g
oin
g to
col
lege
afte
r hi
gh s
cho
ol
6 7 8 9 10Log (income per capita)
kernel = epanechnikov, degree = 0, bandwidth = .4
Local polynomial smooth
Source: Own estimates from VHLSS2006.
However, the coefficient for income is substantially lower than the coefficients for
education levels, implying that adult education is a more important determinant of tertiary
education access than is income.
In addition, ethnic minority people have lower access to tertiary education than those of
Kinh or Hoa group. People living in poor communes as defined by the Government Program No.
135 have lower participation than those in other communes. Larger households and households
with higher proportion of children have lower access to higher education than others. A possible
elucidation is that in these households, household expenditure in general and education
expenditure in particular must be allocated to more household members and more children than
otherwise. Household head‟s age has significant positive impact on the access to tertiary
education. On the other hand, the “female” variable has significant impact on the access to
education in Model 1B, but not in Model 1A.
Table 18 shows that head‟s education and head spouse‟s education have significant impact
on a person‟s access to tertiary education. Yet, it is still unclear from Table 18 what are the
particular roles of father‟s and mother‟s education in determining a person‟s access to tertiary
education. In order to examine that, we use a sub-group of the sample including all individuals at

32
the age range from 18 to 22 years who are sons or daughters of the household‟s head. As we
already know the gender of the household‟s head as well as the education levels of both
household heads and head‟s spouse, it is possible to infer father‟s and mother‟s education levels
of these individuals. We run a probit regression similar to the one in Table 18 but with father‟s
and mother‟s education levels in places of household head‟s and head spouse‟s education levels.
The results are summarized in Table 19.
Table 19 shows that both father and mother‟s education levels at high school and bachelor
degree have a positive impact on the enrolment to tertiary schools. The „bachelor or above‟
coefficient is much higher than the „high school‟ coefficient, indicating that the ones whose
parents have tertiary degrees are much more likely to go to colleges and universities than those
whose parents only have high school degrees. On the other hand, if a father or a mother only has
primary schooling or no formal education, there is smaller probability that the child will go to
college and university.
Table 19: Probit regression model 2
Dependent variable (1=tertiary education enrolment; 0= no enrolment, age range: 18-22)
Conditional on finishing high school Unconditional
Weighted Unweighted Weighted Unweighted
Coef. z Coef. z Coef. z Coef. z
Urban 0.82 1.5 0.78 1.5 0.98 1.8* 0.95 1.8*
North East -0.16 2.2** -0.15 2.1** -0.16 2.5** -0.15 2.3**
North West -0.16 1.0 -0.15 -0.9 -0.13 0.9 -0.12 0.9
North Central Coast 0.04 0.6 0.05 0.8 0.04 0.6 0.06 1.1
South Central Coast 0.35 4.1*** 0.35 4.3*** 0.39 5.3*** 0.40 5.5***
Central Highlands 0.22 1.9* 0.18 1.7* 0.14 1.4 0.10 1.1
South East 0.08 0.9 0.10 1.1 0.15 1.8* 0.14 1.8*
Mekong River Delta 0.14 1.5 0.12 1.3 0.07 0.9 0.05 0.7
Father's education
Primary or no schooling -0.06 0.9 -0.06 1.0 -0.21 4.0*** -0.22 4.1***
High school 0.13 2.3** 0.14 2.5** 0.26 4.9*** 0.26 5.1***
Junior college -0.32 1.5 -0.30 1.4 -0.19 0.9 -0.20 1.0
Bachelor or higher 0.62 4.4*** 0.58 4.2*** 0.68 5.1*** 0.66 5.1***
Mother’s education
Primary or no schooling -0.12 2.0** -0.11 2.0** -0.19 3.7*** -0.19 3.7***
High school 0.25 3.7*** 0.25 3.9*** 0.37 5.9*** 0.37 6.1***
Junior college 0.77 4.8*** 0.67 4.2*** 0.78 5.3*** 0.72 4.9***
Bachelor or higher 0.88 3.8*** 0.84 3.9*** 0.96 4.4*** 0.89 4.5***
Female 0.05 1.0 0.05 1.1 0.11 2.9*** 0.12 3.2***
Female head 0.00 0.0 -0.03 0.3 0.05 0.7 0.03 0.4
Head‟s age (log) 0.46 2.3** 0.39 2.1** 0.45 2.8*** 0.40 2.5**
Household size -0.05 2.7*** -0.04 2.0** -0.05 3.1*** -0.04 2.7***
Children proportion -0.57 2.6** -0.74 3.6*** -0.92 4.7*** -1.04 5.8***
Income per capita (log) 0.07 1.8* 0.11 2.8*** 0.11 3.1*** 0.15 4.4***
Minority -0.34 3.2*** -0.33 3.4*** -0.33 3.6*** -0.31 3.6***
Poor commune -0.22 2.3** -0.22 2.4** -0.18 2.2*** -0.17 2.2**
Remote commune 0.03 0.3 0.04 0.4 -0.06 0.8 -0.07 1.0

33
High school in commune 0.01 0.2 0.04 0.7 0.02 0.4 0.05 1.0
Constant -2.71 3.3*** -2.88 3.6*** -3.40 4.8*** -3.58 5.2***
Number of obs 4083 4083 7210 7210
Wald chi2(26) 255.6 304.1 566.2 710.4
Prob > chi2 0.00 0.00 0.00 0.00
Note: Default region: Red River Delta; default head and spouse education: lower- secondary school. *: significant at
90% confidence interval; **: 95% confidence interval; ***: 99% confidence interval
Source: Own estimates from VHLSS2006.
Comparing between the coefficients and the statistical significance of father‟s and
mother‟s education, it appears that mother‟s education has a relatively higher effect than father‟s
education on children‟s enrolment. All the other variables have similar signs as in Table 19.
To further examine disparity in the higher education admission of students, we also use
NEU survey data. The data are collected via the National University Entrance Examination
(UEE), which takes place in the first two weeks of every July. All upper-secondary graduate
students are eligible to apply for and take the examination (except some special Tertiary
Institutions, such as Police Academy, Military Academy, and Art Performance Academy will
require some non-academic preliminary selection). Students will be required to sit for three
subject tests in three separate half-day sessions. At NEU, the subjects are Mathematics, Physics,
and Chemistry. When all the National UEE results are available (usually at the end of August),
MOET will set out the cut-off marks for tertiary institutions admission: the popular mark for
college admission (3-year education) is 10, and the mark for university admission is 13. Colleges
and Universities then will publicly announce their cut-off marks, the admission short list and
acceptance of applications from students whose National UEE results is higher than the cut-off
marks. Most top universities will require higher cut-off marks, which is around 20.
For our analysis purpose, we will compare the average results of students coming from
four different regions: Region 1 (remote and mountainous area); Region 2-rural; Region 2-urban,
and Region 3-metropolitan (such as some centre districts of Hanoi, Ho Chi Minh city, Hai Phong
city, and Da Nang city) to see the disparities. Four regions have different socio-economic
conditions which affect academic performances of students. Thus, the Government of Vietnam,
MOET have a policy that students coming from different regions will be required to pass lower
cut-off marks to get the tertiary education admissions. The general table of preferential cut-off
marks is as below:
Regions Cut-off marks Regional Adjustment
Region 1 – mountaneous and remote areas N-1.5 1.5
Region 2-rural areas N-1.0 1.0
Region 2-urban areas N-0.5 0.5
Region 3 - metropolitan N 0
For this case study, we will test data from three University Entrance Exam at National
Economics University in 2005, 2007, and 2009. We do not use the data of 2004, 2006, 2008,
since there was a tendency that some students would not apply for the National UEE at NEU in
these years when they saw high cut-off marks from the previous years. Therefore, the data from
2005, 2007, 2009 will be relevant to analysis the changes of disparity over a period of time.
Figure 6 presents the data, and can provide some conclusions are as follows.

34
Figure 6: Distribution of national UEE marks by regions
2005
0.00%
10.00%
20.00%
30.00%
40.00%
50.00%
60.00%
70.00%
80.00%
90.00%
100.00%
UEE marks >=10 UEE marks w ith regional
adjustment>=10
UEE marks >=13 UEE marks w ith regional
adjustment>=13
UEE marks >=20 UEE marks w ith regional
adjustment>=20
Total contestants
Region 1
Region 2 - Rural
Region 2 - Urban
Region 3 (Metropolitan)
2007
0.00%
10.00%
20.00%
30.00%
40.00%
50.00%
60.00%
70.00%
80.00%
90.00%
100.00%
UEE marks >=10 UEE marks w ith regional
adjustment>=10
UEE marks >=13 UEE marks w ith regional
adjustment>=13
UEE marks >=20 UEE marks w ith regional
adjustment>=20
Total contestants
Region 1
Region 2 - Rural
Region 2 - Urban
Region 3 (Metropolitan)
2009
0.00%
10.00%
20.00%
30.00%
40.00%
50.00%
60.00%
70.00%
80.00%
90.00%
100.00%
UEE marks >=10 UEE marks w ith regional
adjustment>=10
UEE marks >=13 UEE marks w ith regional
adjustment>=13
UEE marks >=20 UEE marks w ith regional
adjustment>=20
Total contestants
Region 1
Region 2 - Rural
Region 2 - Urban
Region 3 (Metropolitan)
Source: Own estimates from the NEU survey.
First, there is disparity in the performance of the admission test among regions. With or
without regional adjustments, the students from Region 1 are falling behind in the test in
comparison with their counterparts from the other regions with better socio-economic conditions.
Second, with regional adjustment marks, students from Region 2-rural, Region 2-urban
seem to “catch up” with the students from Region 3 in the National UEE over time. In 2005,
Figure 6 clearly shows that students from Region 3 had the best performance in the National
UEE, followed by students from Region 2-urban and then Region 2-rural. In 2007, however, the
difference in performances between students from different regions in National UEE were lower.
And in 2009, such differences were minimized. This would suggest that: (i) differences in socio-

35
economic conditions between regions were reduced, which resulted in lower disparities in
students‟ academic performances; and (ii) the region adjustment mark was relevant for Region 2
(both rural and urban), but Region 1 should have a higher mark adjustment.
And third, differences between students‟ performances from the four regions increase
when we increase the cut-off marks. This means that students coming from regions with lower
socio-economic development levels would have less academic chances to get admitted in more
well-known tertiary education institutions. To battle this issue, MOET recently has allowed some
provinces with low socio-economic development and high demand for high quality human
resources to select students who: (i) reside in the province territory, (ii) have National UEE
marks from standard university cut-off mark (13), and (iii) agree to pay the fees by themselves or
by families, and send them to the university of province‟s choice.
Cohorts Cut-off marks Ethnics Minority Adjustment
Non-minority group N-2.0 2 Minority group N 0
Looking at the disparity in performances between non-minority students and minority
students (which have different consideration in terms of entrance exam marks as in the table
above), we also can see three similar comments: First, there is a considerable disparity in the
performance of the admission test between two cohorts. Second, with the “ethnics minority”
adjustment marks, the disparity gap is narowing down over time. And third, differences between
two student groups‟ performances increase when we increase the cut-off marks. In another
words, minority students will have less chance to be in the good (public) tertiary institutions.
Figure 7. University Entrance Exam Marks Distribution by Ethnics

36
5.2. Determinants of performance and completion
Using the NEU survey data, we conduct an OLS regression to determine factors
influencing a student‟s performance, represented by his/her first year GPA. Table 19 shows that
the localities have significant effects on a student‟s performance. In detail, students from
disadvantaged areas, rural areas, and other urban areas have lower GPA than those from
metropolitan.

37
Table 20: Determinants of GPA of first-year university students
Coef. Std. Err. t-stat P-value
Disadvantaged areas (KV1) -0.04 0.02 -2.20 0.03**
Rural areas (KV2-NT) -0.03 0.01 -2.91 0.00***
Other urban areas (KV2-TT) -0.02 0.01 -1.82 0.07*
Log(Entrance score) 0.26 0.05 4.79 0.00***
Log (Household income) 0.00 0.01 0.50 0.62
Log (Education expenditure) 0.01 0.01 1.74 0.08*
Kinh ethnicity 0.00 0.03 0.16 0.87
Father has post-high school degrees 0.00 0.01 0.23 0.82
Mother has post-high school degree 0.01 0.01 1.05 0.29
Father has wage job 0.00 0.01 0.29 0.78
Father is self-employed 0.02 0.01 1.15 0.25
Mother has wage job -0.02 0.01 -1.24 0.22
Mother is self-employed -0.03 0.01 -2.28 0.02**
Constant 1.10 0.19 5.90 0.00
Number of obs 350
F( 13, 336) 4.01
Prob > F 0.0000
R-squared 0.1344
Note: Default area: Metropolitan (KV3). Default father‟s and mother‟s job: Agriculture.
Source: Own estimates from the NEU survey.
The most important determinant of a student‟s GPA is his/her entrance examination score.
Education expenditures covering such costs as tuition fees and extra-class expenses also affect
positively a student‟s performance in class. On the other hand, household income, parent‟s
education and parent‟s job appear to have no effect on a student‟s performance. The exception is
when a student‟s mother is self-employed. In this case, the student‟s performance is negatively
affected.
6. An examination of government policies
6.1 Policies on tuition and fees
The policies on tertiary education tuition fees in Vietnam changed few times in the past 20
years. Before 1987, all university students were fully funded. From 1987 to 1994, MOET
allowed some public universities to recruit a larger number of students, in which some of them
had to pay tuition fees (which were based on national entrance examination results). Since 1994,
all students are required to pay tuition fees. Before 1998, the highest fees was VND 120,000 per
month. In March 1998, the government set out the tuition fees scheme for public university was
VND 50,000-180,000 per month (Decree No.70/1998/QĐ-TTg by Prime Minister). On 21 Aug
2009, after a long debate, Prime Minister agreed to change the tuition fee policies. Under the
new plan, from the 2009-2010 academic year, the highest fee will be VND 240,000 per month
(60,000VND or 33% higher than the former plan).
According to the latest proposal from MOET, from 2010, then tuition fees plan will be as
follows:
38
Discipline 2010-2011 2011-2012 2012-2013 2013-2014 2014-2015
Medicine and Pharmacy 340.000 450.000 560.000 680.000 800.000
Fine Arts, Sports 310.000 390.000 480.000 560.000 650.000
Technology & Engineering 310.000 390.000 480.000 560.000 650.000
Natural Science 310.000 390.000 480.000 560.000 650.000
Argriculture - Forestry - Fishery 290.000 350.000 410.000 480.000 550.000
Social Science, Economics, Law 290.000 350.000 410.000 480.000 550.000
In non-public universities, students will have to pay the full fees, and the government has
not imposed any explicit restriction of the level of tuition fees.
What has worked in this policy regarding equity and access? (number of enrolment,
coverage of students, increasing or decreasing access to education). The analysis includes
estimating the cost of higher education compared to household.
Table 21: Higher education cost per month (as a percentage of total household expenditure, by income quintile, 2004)
Income Quintile Total HE costs („000VND) Percentage of Nominal Total Expenditure
Poorest 256 27.1
Near Poorest 223 24.3
Middle 252 17
Near Richest 258 12
Richest 374 8.6
Source: Adapted from WB(2008, p.139)
Table 22: Higher education cost per month (as a percentage of total income, by income quintile, 2009)
Income Quintile Average Monthly HE costs
(„000VND)
Average Monthly Income
(„000VND)
HE cost as Percentage of
Income
Poorest 1,264 1,808 70.1
Near Poorest 1,564 2,884 54.2
Middle 1,798 4,008 44.8
Near Richest 2,054 5,007 41.1
Richest 2,388 8,737 29.6
Source: Own estimates from the NEU survey.
The HE costs in the survey include the tuition fees, extra-class fees, living, and
accommodation costs. From Tables 21 and 22, we can see that: first, the current student loan
limit at VND 860,000 per month is not enough for students who are from poor families to
“survive”. It should be increased to at least VND 1,200,000 per month to ensure that students
from poor families can be able to pursue HE; second, an increase tuition fee by VND 60,000 per
month from 2010 to 2015 will be equivalent to only 2.5%-4.7% of the average monthly HE
costs. Considering Vietnam‟s expected GDP growth rate at more than 5 percent per year in the
coming time, such an increase is acceptable.
The data in Table 22 is also inline with the estimates in the Table 10 when considering the
education cost ratio. In the table 10, for examle, the education cost ratio for poorest quantiles is
126.25% of household income per capita. If a typical family in Vietnam has 4.1 to 5 members,
this is equivalent with 126.25% /(4.1 to 5) =25.5 to 30.8% of average income. In the Table 22,
the real education cost ratio is for poorest income is in the same range: (1264-860)/1808 =
22.4% (860 is the loan from the bank, so the real education cost is 1264-860)

39
6.2. Other policies14
6.2.1. Credit (loan) policies to support education
Since the Decision No. 157/2007/QĐ-TTg dated 27 September 2007 by Prime Minister,
MoET has coordinated with the Bank for Social Policy to create a loan procedure for education.
By 30 June 2008, there were 754 thousand pupils and students making loans of VND 5,292
billion. A recent survey by MoET shows that in 103 training institutions (24 universities, 4
academies, 46 colleges, and 29 professional high schools) there were 9,493 students out of
32,850 pupils and students (or 28.9%) could get loans.
Survey data from 77 schools show that loans were mostly for students‟ daily-life
necessities: 18,871 pupils and students (accounting for 46.15%) said that the loan of VND
800,000 per month was not enough to cover education and daily life costs; 20,548 pupils and
students (accounting for 50.26%) thought such an amount was just enough; and remaining 1,463
pupils and students said such an amount was more than requested. The surveyed schools and
universities evaluated that 34,897 pupils and students (90.23%) are using the loan as precisely as
they proposed; 3,442 pupils and students (8.90%) are using as partially precisely as they
proposed; and the remaining (338 pupils and students, or 0.87% of the total) are not using the
loan as they proposed.
6.2.2. Scholarships promoting studies
Previously the fairly high amount provided to the pupils and students was about VND
120,000 per month. According to the current Decision No. 44/2007/QĐ-BGDĐT dated 15
August 2007, this scholarship was increased and its minimum amount is equal to tuition fee that
a receiving pupil or student has to pay. Another progress was that a receiving pupil or student of
this scholarship could only get 40 percent of the mentioned amount (VND 120,000), but now
they can receive 100 percent as other pupils or students. As such, with this scholarship, pupils
and students with economic difficulties can be able to cover tuition fee.
6.2.3. Social assistance policies
A pupil or student receiving social assistance according to the Decision No. 1121/1997/
QĐ-TTg can get VND 100,000 per month. Particularly, an ethnic minority pupil or student can
get VND 140,000 per month. According to a survey in 2006 with 162 educational institutions,
there were 34,188 pupils and students eligible for receiving assistance, in which 10,884 were
ethnic minority pupils and students.
Due to changing economic status, such an amount is not appropriate any more. Thus,
beneficiaries need to get further assistance from the government and MoET so as to overcome
difficulties in pursuing their studies. According to the Education Law in 2006, expenditure for
this program was transferred to local governments, and regulated by MoLISA, but there have
been no guidelines for implementation.
6.2.4. Other priority policies
Pupils and students receiving lump-sum assistance or tuition fee deduction and exemption
are regulated with Circular No. 16/2006/TTLT/BLĐTBXH-BGDĐT-BTC. Monthly amount for
14
This part is heavily drawn from a recent report by MoET (2008), “Chinh sach an sinh xa hoi trong giao duc-tao
dao o Vietnam” (Social security policies in education and training in Vietnam”, mimeo.

40
the ethnic minority beneficiaries is VND 470,000; assistance to national merits‟ children who are
studying at kindergartens is VND 200,000; primary schools is VND 250,000; professional
schools, universities, and ethnic minorities is VND 300,000.
Though the number of beneficiaries are increasing, some of eligible people could not get
assistance, such as those are disables due to parents affected by orange agents.
6.2.5. Tuition fee deduction and exemption
Following are beneficiaries of policies on tuition fee deduction and exemption:
− Decision No. 70/1998/QĐ-TTg dated 31 March 1998 by Prime Minister and Inter-
circular No. 54/1998/TTLT by MoET and MoF dated 31 August 1998 indicate that
deduction of 50 percent of tuition fee would be applied to pupils and students whose
father and/or mother was a war devotee; was public-sector staff who had occupational
accident and get monthly assistance; whose parents are poor.
− According to the regulations of the Inter-circular No.16/2006/TTLT/BLĐTBXH-
BGDĐT- BTC dated 20 November 2006 by MoLISA, MoET, and MoF, prioritized
pupils and students enrolling in educational institutions would be exempted with
tuition fees (for public institutions), be partially supported (for private institutions). In
detail, VND 250,000 per month for students at universities; VND 200,000 per month
for students vocational training colleges; and VND 150,000 per month for students of
professional schools.
− Decision No.62/2005/QĐ-TTg dated on 24 March 2005 on supporting policies to
universalize high school education. At least 50 percent of tuition fees and other
contributions would be deducted for disable pupils or pupils living in poor households.
A deduction of 100 percent for tuition fees, other contributions, and support of
textbooks and study tools for ethnic minority pupils.
− Decision No.267/2005/QĐ-TTg dated on 31 October 2005 by Prime Minister, and
Inter-circular No.65/2006/TTLT/BTC-BLĐTBXH dated 12 July 2006 by MoF and
MoLISA to guide implementation of policies for vocational training provision to
ethnic minority pupils.
In the year 2006, there were 10,315,177 pupils and students (accounting for 53 percent of
the whole country‟s number of pupils and students) to get tuition fees deducted. The percentages
of pupils and students at various educational levels to get deduction were: kindergarten 28%;
primary 100%; secondary and upper-secondary 28%; vocational training 15%; medium-level
professional education 23%; college and university 22,5%. In the period 2001-2006, the
percentages of pupils and students who got tuition fees deducted remained stable.
7. Concluding remarks
In this research paper, we aimed to provide the current development of the tertiary
education system in Vietnam, as well as analyze (in)equality in access, performance and
completion of tertiary education, using a number of individual and household characteristics of
persons from two sets of data, i.e., the VHLSS in 2006 and the NEU survey in late 2009. Our
findings show that improvements of social and economic conditions of the country resulted from
Doi moi have obviously facilitated and developed education system in general and tertiary
41
education system in particular. As a result, many groups of people in Vietnam, particularly
people living in mountainous and remote areas, have been more able to access to education,
including tertiary education, partially thanked to various education promoting policies from the
government as well as great efforts from people themselves. However, as indicated in the paper,
there have been a number of people lagged behind and could not be able to access to any
education, including tertiary education. On the one hand, these people are facing a lot of social
and economic difficulties, which make them struggle for a living rather than trying for an
education. One the other hand, these people are also vulnerable to be out of education without
support from the government, as they bear higher burden than those having better income.
As such, our paper suggested that the government pay more attention to disadvantaged
groups via promoting economic growth in their localities, providing more facilitating education
environment, as well as revising tuition fee policies to finance education costs, so as to provide
them more access to tertiary education. It is hoped that after getting tertiary education, they will
in turn help promote growth and development of their provinces through higher quality human
resources.
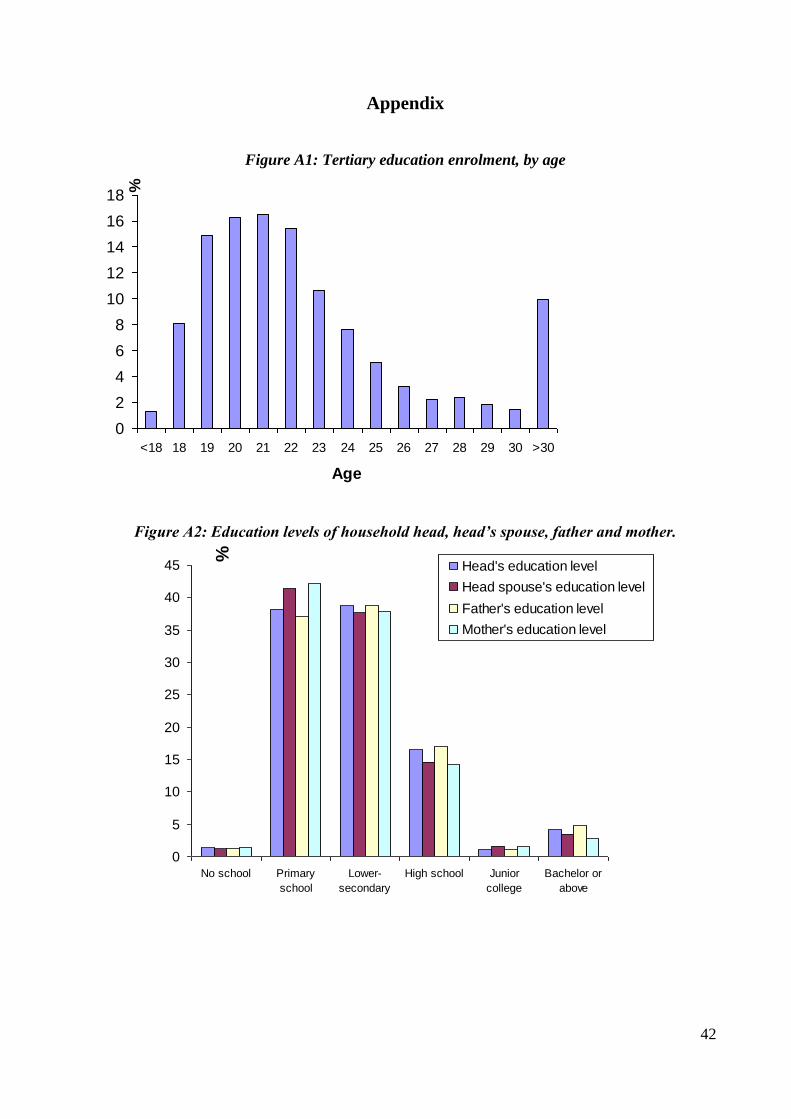
42
Appendix
Figure A1: Tertiary education enrolment, by age
0
2
4
6
8
10
12
14
16
18
<18 18 19 20 21 22 23 24 25 26 27 28 29 30 >30
Age
%
Figure A2: Education levels of household head, head’s spouse, father and mother.
0
5
10
15
20
25
30
35
40
45
No school Primary
school
Lower-
secondary
High school Junior
college
Bachelor or
above
%
Head's education level
Head spouse's education level
Father's education level
Mother's education level