Embed Size (px)
Citation preview
DeploymentIssues in ScalableIsland Multicastfor Peer-to-PeerStreaming
Xing JinOracle USA
Ho-Shing Tang and S.-H. Gary ChanThe Hong Kong University of Science and Technology
Kan-Leung ChengUniversity of Maryland
With the prevalence of peer-
to-peer (P2P) technologies,
multimedia streaming has
become an important Inter-
net application. In a P2P-streaming system, co-
operative peers organize into an overlay
network via unicast connections. The peers
cache and relay data for each other, eliminating
the need for powerful servers. A popular P2P-
streaming system might consist of more than
tens of thousands of peers.1,2 To improve de-
livery efficiency, some P2P protocols make
use of Internet Protocol (IP) multicast. Al-
though global IP multicast is not yet available,
many local Internet networks are multicast-
capable.
These local multicast-capable domains, so-
called islands, are frequently interconnected
by multicast-incapable or multicast-disabled
routers. For example, in the Hong Kong area,
Hong Kong Broadband Network Limited has
deployed a network that covers more than
2,500 corporate buildings and approximately
one million residences. It offers digital televi-
sion service to subscribers via IP multicast.
The Scalable Island Multicast protocol,
which we introduced in other research reports,
integrates IP multicast into P2P overlay deliv-
ery.3,4 In SIM, hosts within an island communi-
cate with IP multicast and connect across
islands through unicast. Each host distributedly
joins an overlay tree and detects and joins its
multicast island, if possible. Each island in
SIM has a unique ingress host that receives
media content from outside the island and
multicasts within the island. Other hosts in the
island receive data via IP multicast from the in-
gress. In this article, we investigate the practical
deployment issues of the SIM protocol.
Network address translation
In SIM, hosts first form a low-delay overlay
tree, then detect multicast islands and use IP
multicast if possible. In the following discus-
sion, a parent of a host refers to the host’s par-
ent in the overlay tree. We are interested in
building a tree with low end-to-end delay.
Clearly, the tree-construction mechanism
should be distributed and scalable, and the al-
gorithm should be simple, with low setup and
maintenance overheads. A practical problem
in setting up connections is that some hosts
might be behind network address translations
(NATs) and have only limited connectivity.
These hosts are called restricted hosts. A host
that is not behind any NAT is called public. A
restricted host can communicate only with
public hosts or other restricted hosts behind
the same NAT, while a public host can commu-
nicate with either a restricted host (with the
restricted host being the initiator of the con-
nection) or a public one. Hence, we integrate
the traditional Basic Contributor algorithm5
into our system to achieve NAT traversal. This
algorithm allows restricted hosts to upload
data to public hosts.
A new host must identify whether it’s public
or restricted before joining the tree. This identi-
fication can be achieved using the protocol,
Simple Traversal of User Datagram Protocol
through NATs (STUN).6 Afterward, each host
maintains a heap Hp to store its potential
parents. In the first iteration, the new host con-
tacts a publicly known rendezvous point to ob-
tain a list of public hosts in the system. It
measures the round-trip time (RTT) to these
hosts and inserts them into Hp in the increasing
Intelligent and Pervasive Multimedia Systems
The Scalable Island
Multicast protocol
integrates Internet
Protocol multicast
and overlay delivery
for media streaming.
1070-986X/09/$25.00 �c 2009 IEEE Published by the IEEE Computer Society72
order of the RTT. In the next iteration, the new
host pops k hosts with the smallest RTT from
Hp (k is a system parameter). For each of the
popped hosts, if the new host has not sent a
NeighborQuery message to it before, the new
host sends the message.
If a host receives a NeighborQuery message
from a public new host, it replies with the IP
addresses of its public neighbors and informs
its restricted neighbors to contact the new
host. Hence, the new host can communicate
with all the neighbors of the queried host and
obtain the RTT to each of them. The new
host then inserts the neighbors into Hp accord-
ing to their RTT.
If a host receives a NeighborQuery message
from a restricted new host, it replies with
the addresses of all its public and restricted
neighbors. The purpose of responding with
restricted neighbors is to detect whether these
hosts and the new one are behind the same
NAT. If they are, the restricted neighbors
could communicate with the new host. Fur-
thermore, the queried host asks its restricted
neighbors to report their public neighbors to
the new host. The new host then communi-
cates with all the returned hosts and obtains
the RTT to each of them. Finally, the new
host inserts into Hp the hosts whose RTT from
the new host is available.
After the new host obtains the RTT to all the
returned hosts, it pops k closest ones from Hp.
The iteration repeats until the improvement
in the smallest RTT is lower than a certain
threshold, or the number of iterations exceeds
a certain value t. At the end of the process,
the new host selects from its current m closest
hosts the one with the highest forwarding
bandwidth as its parent, where m is a tunable
system parameter. If the new host is public,
its heap Hp might contain some restricted
hosts. Because only the restricted host can initi-
ate the connection between a public and a
restricted host, the new host should keep the con-
nection between them after RTT measurement.
Furthermore, a restricted host can select
only a public host or another restricted host
behind the same NAT as its parent. If all public
hosts in the system are occupied, new re-
stricted hosts will not be able to join the over-
lay tree. Therefore, we require public hosts to
preferentially select restricted hosts as the
parents. Given a public new host, its measured
RTT from a restricted host is multiplied by a
constant a(a < 1).
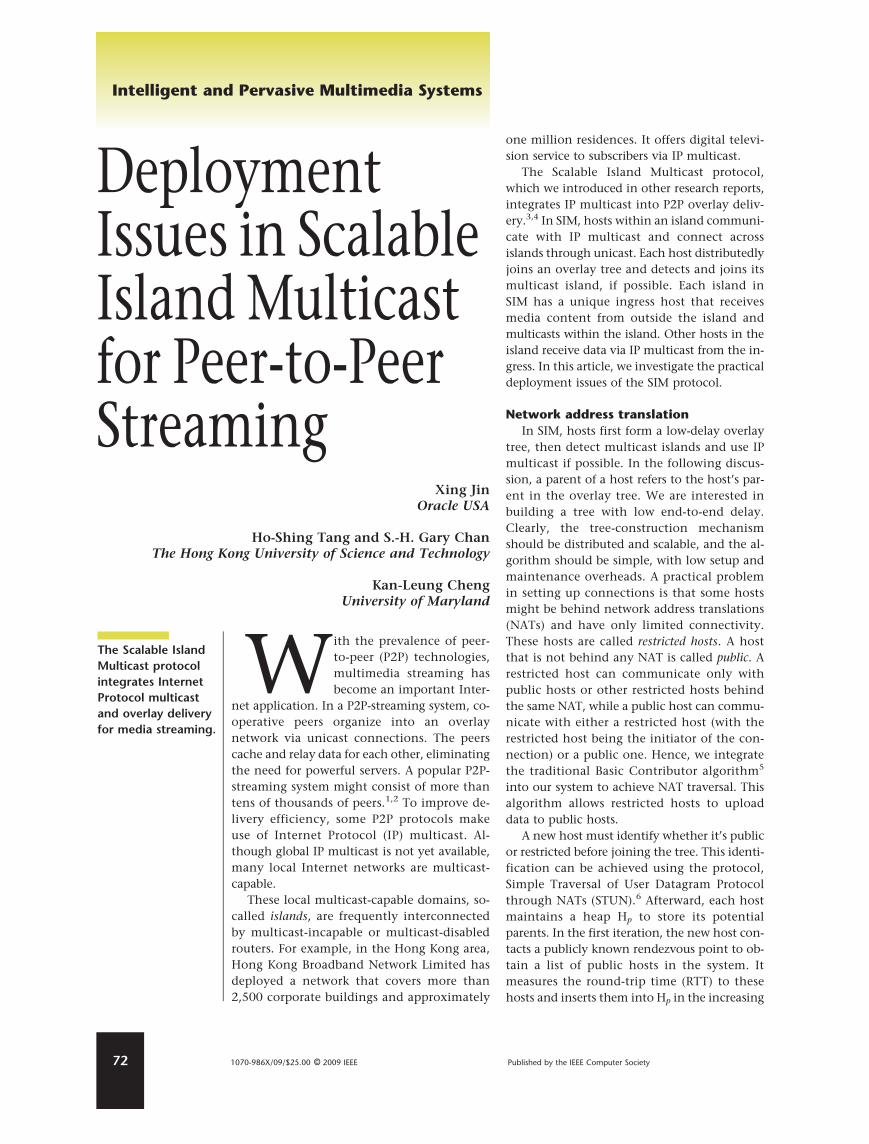
Figure 1 shows an example of host joining in
the overlay tree. Suppose k ¼ 2 and P is a new
host. P first obtains a list of public hosts from
the rendezvous point, say, C, D, E, and F.
P then pings all these hosts and inserts them
into Hp. Suppose that C and D are the two clos-
est hosts. In the following, if P is a public host,
it pings C’s public neighbors (that is, A, F, and
G) and D’s public neighbors (that is, B and I).
Furthermore, D has a restricted neighbor H.
D will inform H to ping P. In this way, P can ob-
tain the RTT to all the neighbors of C and D.
P then inserts all the neighbors into Hp and
completes this iteration. In the next iteration,
it pops the two closest hosts from Hp and
sends NeighborQuery messages to them. Such
iteration stops if any of the stopping conditions
is satisfied.
In another case, if P is a restricted host, when
it sends NeighborQuery messages to C and D,
both C and D will reply with their public neigh-
bors (that is, A, F, G, B, and I). Furthermore,
D has a restricted neighbor H. D informs H to
set up a connection with P and asks H to report
its public neighbors other than D (that is, J) to P.
P then measures the RTT to all the returned
hosts. And the hosts with available RTT are
inserted into Hp. Note that H might not be
able to set up a connection with P because they
might not be behind the same NAT. Afterward,
a new iteration starts.
Finally, if a host leaves, its children must re-
join the tree and find new parents. A rejoining
host sends a NeighborQuery message to
its grandparent and starts joining from its
grandparent.
A
B C
D E F G
H I
P
J
Restricted host
Public host
New host
Figure 1. An example of
joining the overlay tree
in Scalable Island
Multicast.
Jan
uary
�M
arch
2009
73
Fault tolerance and loss recovery
During streaming, a host can suffer packet
loss for various reasons. A path might be
congested or fail. A host’s parent might unex-
pectedly leave the system. In addition, there is
potential for application-level loss. That is, a
streaming application usually has a playback
deadline by which data delivery and loss recov-
ery have to be accomplished. Data packets
received after the deadline are useless and
regarded as a loss.
In other work, we proposed a scheme to re-
cover from temporary packet loss due to back-
ground traffic.4 In this method, each host in
SIM must identify a few other hosts as its
recovery neighbors. A host’s recovery neigh-
bors must satisfy, at the least, the following
requirements:
� not reside in the host’s subtree,
� not be the host’s ancestor, and
� not reside in the same island as the host.
To achieve quick recovery, the scheme esti-
mates recovery latency from each of its
recovery neighbors. Whenever a loss occurs,
the host sends a retransmission request to the
recovery neighbor that has the smallest recov-
ery latency. If the retransmission fails again,
the host turns to the recovery neighbor with the
second smallest recovery latency, and so on.
In bandwidth-limited networks, a single in-
coming path might not provide an adequate
delivery rate. If this occurs, the corresponding
host will suffer persistent and often serious
packet loss. In the above method for recovering
temporary packet loss, we estimate recovery
latency according to source-to-host delay
along the tree. But if a large number of hosts
in the system have to consistently fetch data
from recovery neighbors, the data flows in the
overlay will become chaotic. Accordingly,
the estimated recovery latency will become use-
less and the overall recovery efficiency won’t be
high. To address this problem, we extend the
recovery scheme to a pull-based recovery.7,8
First, each host in the system joins the tree
and selects recovery neighbors, as discussed
previously. A host encountering persistent
packet loss triggers pull-based recovery. It
sends requests to all its recovery neighbors,
which respond with their buffer maps. The
buffer map of a host records packet availability
in the host’s buffer.
Once we have buffer maps from all recovery
neighbors, we can determine the packet-
scheduling sequence. That is, for each missing
packet, we know the recovery neighbors pos-
sessing the packet. We need to identify one
recovery neighbor to conduct packet retrans-
mission so that the packet can be fetched as
quickly as possible. Suppose host j is a recovery
neighbor of host i. Let RTTj be the round-trip
delay between j and i. Let pj be the transmission
delay of a data packet from j to i. Clearly, if
i sends a retransmission request to j (after i has
analyzed j’s buffer map and knows that j pos-
sesses the designated packet), i will receive the
retransmission after (RTTj þ pj) time. We call it
the retransmission latency from j. Here we as-
sume the transmission delay of a retransmission
request message is negligible.
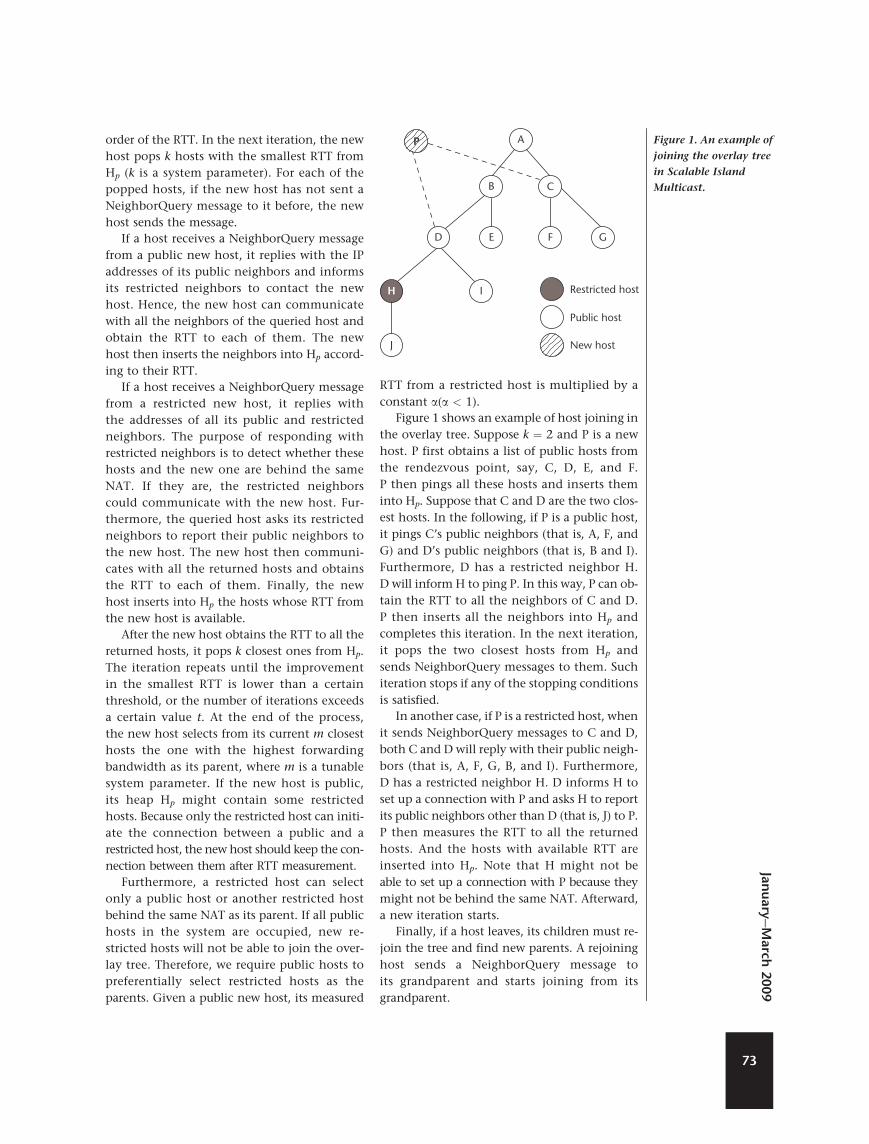
Clearly, the lower retransmission latency we
can achieve, the better. Therefore, we designed
a packet-scheduling algorithm, as shown in
Figure 2. The algorithm tries to find a recovery
neighbor with the smallest retransmission la-
tency for each missing packet. Note that in
line 7, we increase the value of RTT# by p#.
This is because if recovery neighbor # is
selected to retransmit the packet, any follow-
ing retransmission has to wait until this
retransmission ends. On the other hand, at
the beginning of each execution of the algo-
rithm, the RTT values refer to the original
round-trip delay between hosts.
After identifying the recovery neighbors for
all missing packets in the buffer map, host i
sends retransmission requests to the correspond-
ing recovery neighbors. The packet-scheduling
INPUT: D-number of packets in a buffer map; For each recovery neighbor j, we know its buffer map, and: RTTj-round-trip delay between j and i; pj-transmission delay of a data packet from j to i.OUTPUT: rn[t]-selected recovery neighbor for packet t
1: for t = 1 to D do2: if packet t is already in i’s buffer map then3: continue4: end if5: identify the set of recovery neighbors that possess packet t6: select recovery neighbor j from the above set s.t. j = argminj {RTTj + pj|∀j ∈ above set}7: RTTj ← RTTj + pj8: rn[t] ← j9: end for
Figure 2. Packet
scheduling at host i.
IEEE
Mu
ltiM
ed
ia
74
process is then periodically performed at the
host.
Implementation issues
We implemented and deployed SIM on the
Home Media Center Platform of the Hong
Kong Applied Science and Technology Re-
search Institute. On the platform, an end user
can watch programs on a TV connected to the
network via a set-top box (STB). Media content
delivery and audiovideo compression and de-
compression are conducted through the STB.
Each STB has 1 Mbyte of memory for storing
program footprints, 5 Mbytes of memory
for program execution, and 32 Mbytes of
space for storing media segments. To support
efficient media-content processing, separate
memory space is dedicated to the audiovideo
encoder and decoder. Moreover, each STB has
a 300-MHz CPU and a hard disk with more
than 100 Gbytes of storage. The STB runs an
embedded Linux operating system. More
details about the STB can be found at http://
www.astri.org/.
On the Home Media Center platform, some
STBs serve as the media sources. A source cap-
tures TV signals through an audiovideo input.
It encodes video into H.264 format and audio
into Advanced Audio Coding format, respec-
tively. H.264 is the latest video standard devel-
oped by the International Telecommunications
Union and MPEG.9 It provides a more efficient
video-compression algorithm compared to its
precursor, the H.263 standard. In our experi-
ments, a normal stream has a frame rate of 25
frames per second (fps), with one I-frame fol-
lowed by 24 P-frames. For such a stream, H.263
and H.264 encodings have bit rates of around
1,200 and 500 kilobits per second (Kbps), respec-
tively. The video and audio streams are then
encapsulated into packets and transmitted
through networks. Other STBs have the SIM soft-
ware installed. They retrieve packets from net-
works, decode packets, and output TV signals
to TV sets via the audiovideo output.
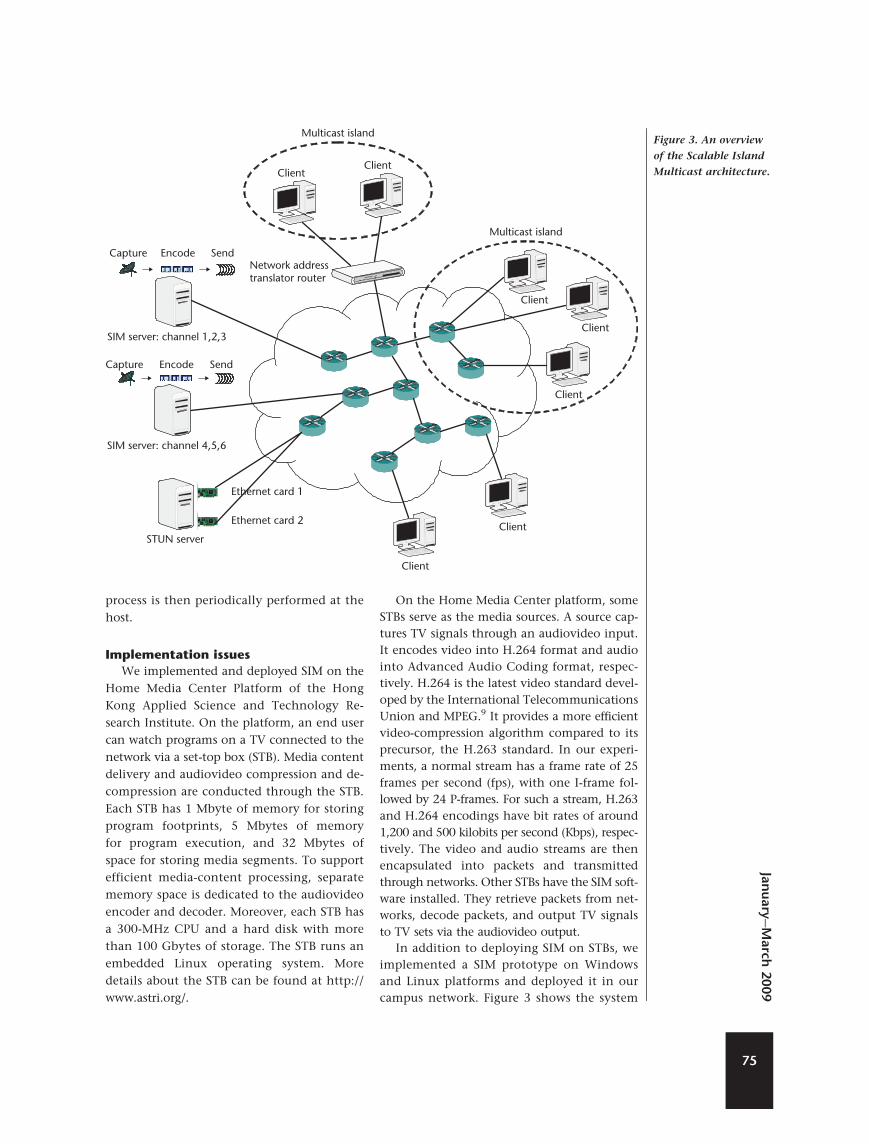
In addition to deploying SIM on STBs, we
implemented a SIM prototype on Windows
and Linux platforms and deployed it in our
campus network. Figure 3 shows the system
ClientClient
Network addresstranslator router
Multicast island
Multicast island
Client
Client
Client
Client
Client
Capture Encode Send
Capture Encode Send
SIM server: channel 1,2,3
SIM server: channel 4,5,6
Ethernet card 1
Ethernet card 2
STUN server
Figure 3. An overview
of the Scalable Island
Multicast architecture.
Jan
uary
�M
arch
2009
75
architecture. Each SIM server is responsible for
a certain number of channels. It captures TV
signals, encodes streams, and sends streams to
the network. A STUN server is deployed for
NAT detection. Clients (or end users) receive
streaming data from their neighbors or the
server. They form islands and make use of IP
multicast, if possible. We use a TV tuner card
to capture TV signals at the server side and en-
code the stream into H.264 format. We use the
MP3 standard to compress the audio using a bit
rate of around 100 Kbps. The server independ-
ently encodes and transmits video and audio,
which is synchronized at the client before
playback.
A host in the system receives data from its
parent as well as recovery neighbors (if needed).
However, if the host’s bandwidth is limited, its
receiving rate will be accordingly limited and
multiple-path delivery won’t help. In this
case, the host must accept only the most im-
portant packets and skip the less important
ones. A video stream encoded by our method
consists only of I-frames and P-frames. An
I-frame is a standalone frame that can be played
back by itself; while a P-frame is predicted from
its immediately previous frame. As a result, if
the immediately previous frame of a P-frame
is lost, the P-frame will be useless. The group
of frames leading with an I-frame and ending
with P-frames is called a group of pictures
(GoP). Clearly, the importance of frames in a
GoP sequence decreases from the first I-frame
to the last frame. Therefore, a host with a lim-
ited receiving rate can skip a certain number
of trailing P-frames in each GoP until the remain-
ing frames can be transmitted at the current
receiving rate. It then requires only the remain-
ing frames from its parent or recovery neighbors.
In the SIM prototype, an end user can switch
between multiple channels. Each channel
forms its own SIM tree for data delivery. A
user can watch two channels at the same
time. One is displayed as normal and another
is displayed in a smaller picture for preview.
To achieve this functionality, each channel
encodes a normal stream and a preview stream.
The normal stream has a frame rate of 25 fps,
which is one I-frame followed by 24 P-frames.
The preview stream has a frame rate of 1 fps,
which is one I-frame.
Simulation results on transit-stub
topologies
In this section we present simulation results
on Internet-like topologies and experimental
results on PlanetLab (see http://www.planet-lab.
org). We generate 10 transit-stub topologies
with Georgia Tech’s Internetwork Topology
Generator.10 Each topology is a two-layer hier-
archy of transit and stub domains. The transit
domains form a backbone and all the
stub domains are connected to the backbone.
Each topology has four transit domains and
280 stub domains. On average, a transit do-
main contains 10 routers and a stub domain
contains eight routers. Each topology consists
of 2,280 routers and about 11,000 links. A
group of N hosts are randomly put into the net-
work. A host is connected to a unique stub
router with 1-millisecond delay, while the to-
pology generator gives the delays of core links.
We set the distribution of islands as follows.
From the stub domains that consist of at least
one host, we randomly select some and set them
to be multicast-capable. We define multicast ratio yas the ratio of the number of multicast-capable
stub domains to the number of stub domains
that consist of at least one host. We define is-
land size S as the number of stub domains in
an island. In the real Internet, routers in a mul-
ticast island are frequently close to each other.
Therefore, in our simulations, only the stub
domains connected to the same transit router
can form a multicast island. Furthermore, we
define restricted host ratio g as the ratio of the
number of restricted hosts to the total number
of hosts. We assume that there is an average of
two hosts behind a NAT.
We set the SIM parameters as follows. Each
new host obtains several (at most 10) randomly
selected hosts from the rendezvous point when
joining. A new host will repeat the pinging iter-
ations for a maximum of six times and in each
iteration will ping a maximum of 10 hosts (that
is, t ¼ 6 and k ¼ 10). Each host has a degree
bound equal to its normalized edge bandwidth.
We do not implement loss recovery in the sim-
ulations. We use the following metrics to eval-
uate the protocol:11
� Relay delay penalty (RDP). Defined as the ratio
of the overlay delay from the source to a
given host to the delay along the shortest
unicast path between them.IEEE
Mu
ltiM
ed
ia
76
� Link stress. Defined as the number of copies
of a packet transmitted over a certain physi-
cal link.
� Resource usage. Defined asPL
i¼1 di � si, where
L is the number of links active in data trans-
mission, di is the delay of link i, and si is the
stress of link i. Resource usage is a metric of
the network resource consumed in data
delivery.
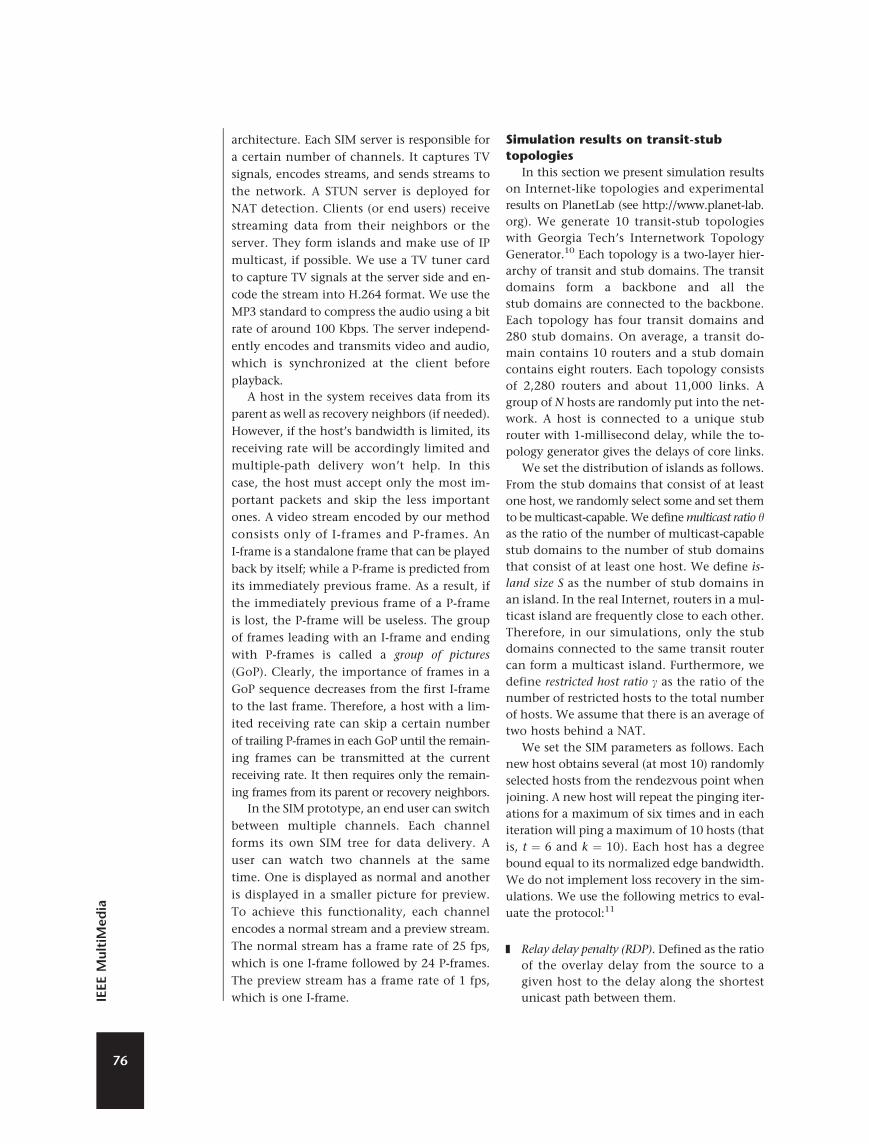
Figure 4a shows the performance of SIM
with different group sizes N. As N increases,
the average RDP generally increases, with
some fluctuation in values. This increase is
not surprising because with more hosts in the
system, the overlay tree becomes deeper.
Hence, the average distance to the tree root
increases with the group size. On the other
hand, the average stress doesn’t regularly in-
crease or decrease with the group size. A possi-
ble reason is that stress computation is affected
by the number of IP multicast paths, as IP multi-
cast always achieves an average stress of 1.0. In
addition, resource usage keeps increasing as
the group size increases. Clearly, the more
hosts in the tree, the more network resources
the tree consumes.
Figure 4b shows the performance of SIM
with different restricted host ratios g. As gincreases, all three metrics increase. From
g ¼ 0 to g ¼ 0.9, RDP, stress and resource
usage have increased by 47, 104, and 222 per-
cent, respectively. These metrics show that
the existence of restricted hosts might seriously
impair delivery efficiency. A promising point
from the figure is that our NAT solution can
successfully traverse NATs. Even with 90 per-
cent of hosts behind NATs, SIM can still build
a connected overlay tree. Therefore, for a net-
work with many restricted hosts, we might de-
ploy only a few public hosts and servers to
connect all of them. In addition to conducting
these tests, we have tuned other SIM parame-
ters and compared our protocol with other
overlay protocols elsewhere.4
Experimental results on real networks
We deployed 26 Home Media Center STBs
to evaluate SIM. Half of the STBs are in our
campus network, and the other half are in
the Applied Science and Technology Research
Institute company network. The system has
three multicast islands, consisting of six,
four, and three STBs, respectively. Other STBs
are not in any islands. The coding parameters
follow the STB description earlier in this article.
The streaming bit rate is around 500 Kbps. We
record the system performance in the steady
state.
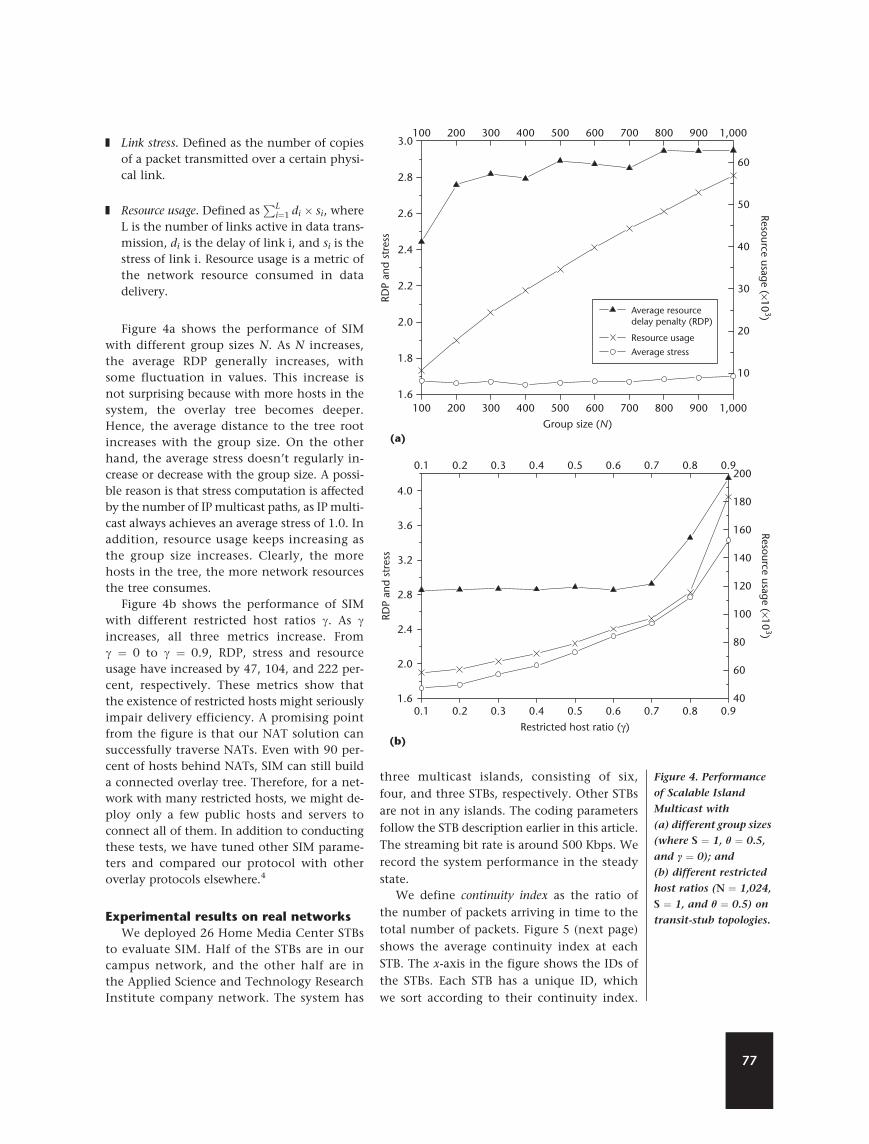
We define continuity index as the ratio of
the number of packets arriving in time to the
total number of packets. Figure 5 (next page)
shows the average continuity index at each
STB. The x-axis in the figure shows the IDs of
the STBs. Each STB has a unique ID, which
we sort according to their continuity index.
100 200 300 400 500 600 700
Group size (N)(a)
Average resourcedelay penalty (RDP)
Resource usage (×103)
Resource usage
Average stress
800 900 1,000
100 200 300 400 500 600 700 800 900 1,000
10
20
30
40
50
60
3.0
2.8
2.6
2.4
2.2
2.0
RDP
and
stre
ss
1.8
1.6
0.1 0.21.6
2.0
2.4
2.8
3.2
3.6
4.0
0.3 0.4 0.5
Restricted host ratio (γ)
Resource usage (×103)
RDP
and
stre
ss
0.6 0.7 0.8 0.9
0.1 0.2 0.3 0.4 0.5 0.6 0.7 0.8 0.9
40
60
80
100
120
140
160
200
180
(b)
Figure 4. Performance
of Scalable Island
Multicast with
(a) different group sizes
(where S ¼ 1, y ¼ 0.5,
and g ¼ 0); and
(b) different restricted
host ratios (N ¼ 1,024,
S ¼ 1, and y ¼ 0.5) on
transit-stub topologies.
77
As shown, the lowest and highest continuity
indexes are 0.989 and 0.9989, respectively.
Clearly, we have kept the packet-loss rate at a
low level. From the video-decoding viewpoint,
such a loss rate can be effectively masked by
interleaving or error-concealment techniques.
We also deployed the SIM prototype on Planet-
Lab and conducted experiments on the Plan-
etLab test bed. We randomly selected 66
PlanetLab nodes across the Internet. The
nodes form 40 multicast islands. Among
them, 22 islands have size one (that is, consist-
ing of only one host), 14 islands have size two,
three islands have size three, and one island
has size seven. Due to the public nature of
PlanetLab, no nodes are behind NAT.
To count packet loss, we divide streaming
data into a set of units. Each unit contains
500 packets and each packet is 1,400 bytes.
Given such a unit, we set the playback dead-
line to be the receiving timestamp of the
first packet minus the sending timestamp of
the first packet plus 10 seconds. For other
packets in the unit, if the receiving timestamp
is larger than the sending timestamp plus the
playback deadline, we mark the packet as
delayed (or lost). Otherwise, the packet arrives
in time.
In our experiments, we vary the streaming
bit rate from 100 to 500 Kbps. A node can select
several recovery neighbors according to the
network condition. In each experiment, we
set a public rendezvous point and a public
source node. Nodes then join the system one
by one, with an interval of around 10 seconds.
The system runs for 30 minutes after all nodes
join. Each node logs the statistics to a text file
every minute. We collect the text files at the
end of the experiment and analyze the system
performance in its steady state.
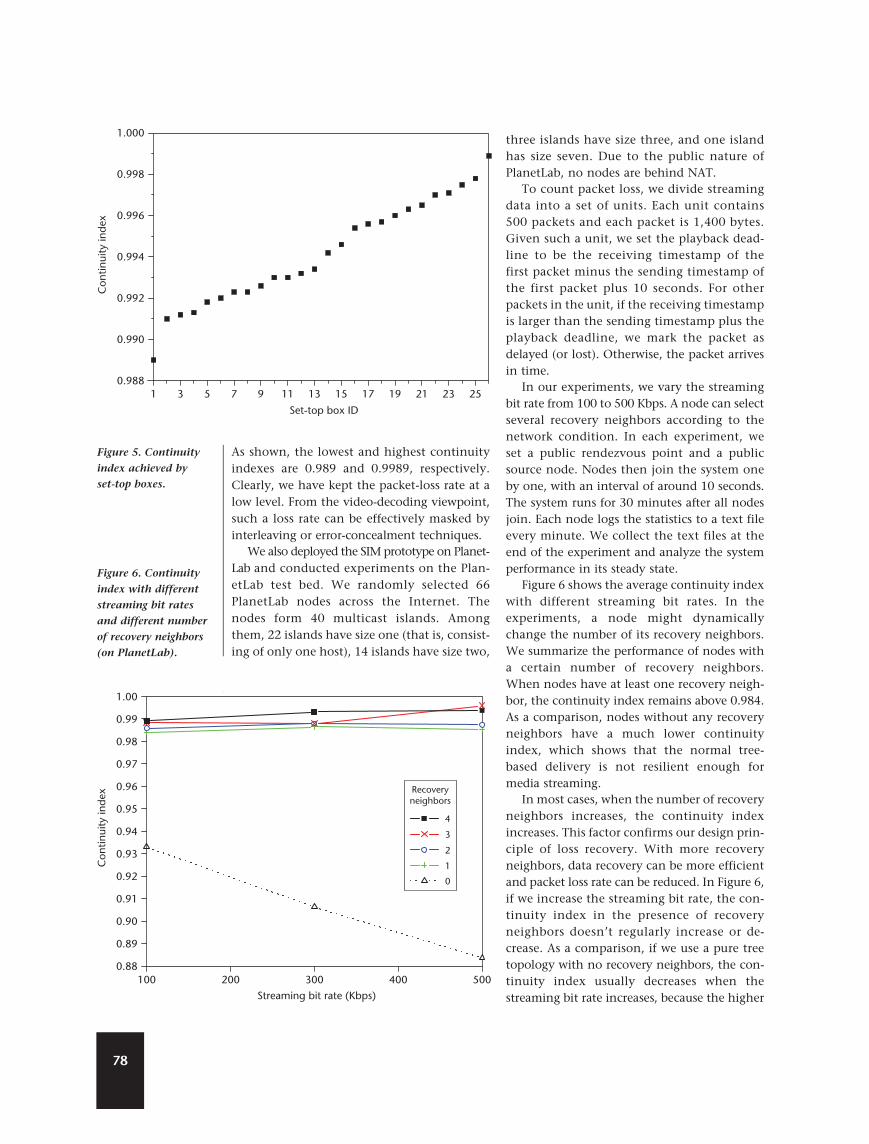
Figure 6 shows the average continuity index
with different streaming bit rates. In the
experiments, a node might dynamically
change the number of its recovery neighbors.
We summarize the performance of nodes with
a certain number of recovery neighbors.
When nodes have at least one recovery neigh-
bor, the continuity index remains above 0.984.
As a comparison, nodes without any recovery
neighbors have a much lower continuity
index, which shows that the normal tree-
based delivery is not resilient enough for
media streaming.
In most cases, when the number of recovery
neighbors increases, the continuity index
increases. This factor confirms our design prin-
ciple of loss recovery. With more recovery
neighbors, data recovery can be more efficient
and packet loss rate can be reduced. In Figure 6,
if we increase the streaming bit rate, the con-
tinuity index in the presence of recovery
neighbors doesn’t regularly increase or de-
crease. As a comparison, if we use a pure tree
topology with no recovery neighbors, the con-
tinuity index usually decreases when the
streaming bit rate increases, because the higher
10.988
0.990
0.992
Con
tinui
ty in
dex
0.994
0.996
0.998
1.000
3 5 7 9 11 13 15
Set-top box ID
17 19 21 23 25
Figure 5. Continuity
index achieved by
set-top boxes.
1000.88
0.89
0.90
0.91
0.92
0.93
0.94
Con
tinui
ty in
dex
0.95
0.96
0.97
0.98
0.99
1.00
200 300Streaming bit rate (Kbps)
400
4
3
2
1
0
500
Recoveryneighbors
Figure 6. Continuity
index with different
streaming bit rates
and different number
of recovery neighbors
(on PlanetLab).
78
the streaming bit rate, the more contention
on the paths and links. As each node has
only one incoming path in a tree, such con-
tention will lead to packet loss at nodes. As
shown, delivery with recovery neighbors can
provide much better streaming quality than
tree-based delivery, especially for high-bit-
rate streaming. Loss recovery is essential for
P2P streaming.
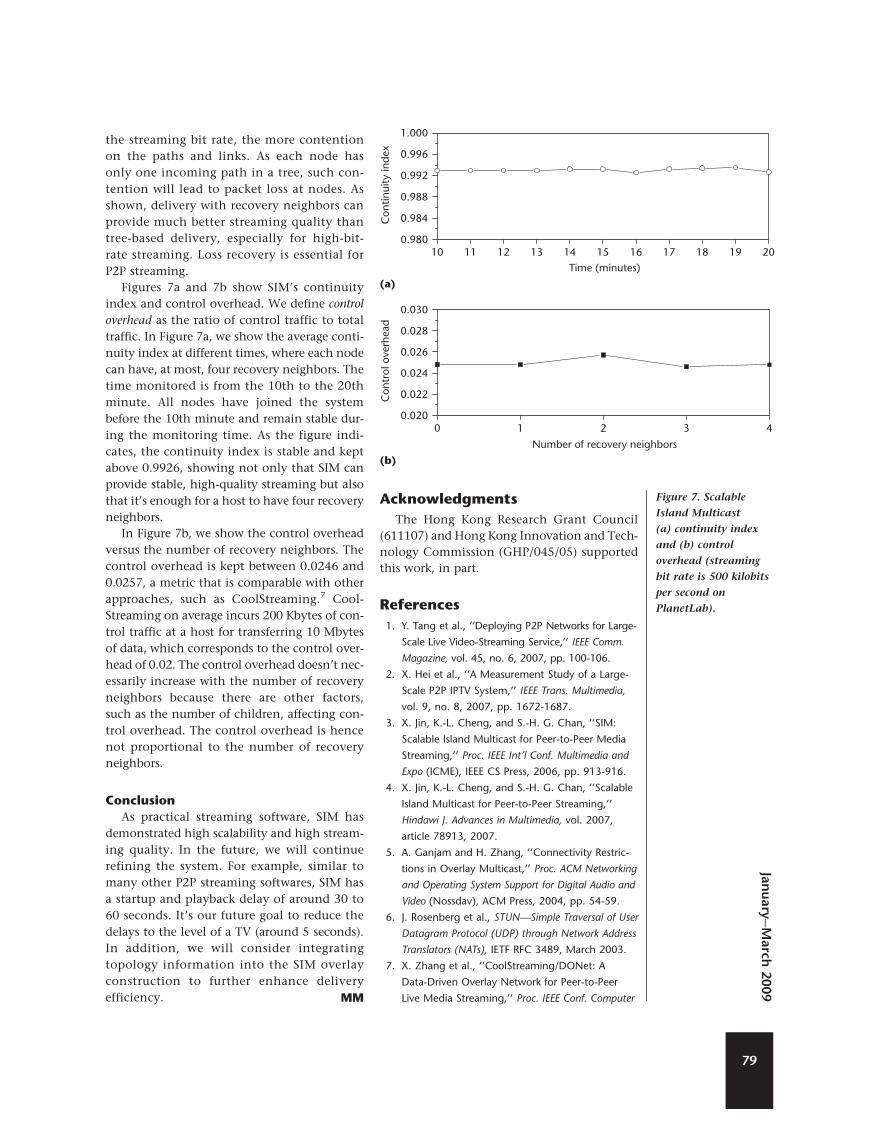
Figures 7a and 7b show SIM’s continuity
index and control overhead. We define control
overhead as the ratio of control traffic to total
traffic. In Figure 7a, we show the average conti-
nuity index at different times, where each node
can have, at most, four recovery neighbors. The
time monitored is from the 10th to the 20th
minute. All nodes have joined the system
before the 10th minute and remain stable dur-
ing the monitoring time. As the figure indi-
cates, the continuity index is stable and kept
above 0.9926, showing not only that SIM can
provide stable, high-quality streaming but also
that it’s enough for a host to have four recovery
neighbors.
In Figure 7b, we show the control overhead
versus the number of recovery neighbors. The
control overhead is kept between 0.0246 and
0.0257, a metric that is comparable with other
approaches, such as CoolStreaming.7 Cool-
Streaming on average incurs 200 Kbytes of con-
trol traffic at a host for transferring 10 Mbytes
of data, which corresponds to the control over-
head of 0.02. The control overhead doesn’t nec-
essarily increase with the number of recovery
neighbors because there are other factors,
such as the number of children, affecting con-
trol overhead. The control overhead is hence
not proportional to the number of recovery
neighbors.
Conclusion
As practical streaming software, SIM has
demonstrated high scalability and high stream-
ing quality. In the future, we will continue
refining the system. For example, similar to
many other P2P streaming softwares, SIM has
a startup and playback delay of around 30 to
60 seconds. It’s our future goal to reduce the
delays to the level of a TV (around 5 seconds).
In addition, we will consider integrating
topology information into the SIM overlay
construction to further enhance delivery
efficiency. MM
Acknowledgments
The Hong Kong Research Grant Council
(611107) and Hong Kong Innovation and Tech-
nology Commission (GHP/045/05) supported
this work, in part.
References
1. Y. Tang et al., ‘‘Deploying P2P Networks for Large-
Scale Live Video-Streaming Service,’’ IEEE Comm.
Magazine, vol. 45, no. 6, 2007, pp. 100-106.
2. X. Hei et al., ‘‘A Measurement Study of a Large-
Scale P2P IPTV System,’’ IEEE Trans. Multimedia,
vol. 9, no. 8, 2007, pp. 1672-1687.
3. X. Jin, K.-L. Cheng, and S.-H. G. Chan, ‘‘SIM:
Scalable Island Multicast for Peer-to-Peer Media
Streaming,’’ Proc. IEEE Int’l Conf. Multimedia and
Expo (ICME), IEEE CS Press, 2006, pp. 913-916.
4. X. Jin, K.-L. Cheng, and S.-H. G. Chan, ‘‘Scalable
Island Multicast for Peer-to-Peer Streaming,’’
Hindawi J. Advances in Multimedia, vol. 2007,
article 78913, 2007.
5. A. Ganjam and H. Zhang, ‘‘Connectivity Restric-
tions in Overlay Multicast,’’ Proc. ACM Networking
and Operating System Support for Digital Audio and
Video (Nossdav), ACM Press, 2004, pp. 54-59.
6. J. Rosenberg et al., STUN—Simple Traversal of User
Datagram Protocol (UDP) through Network Address
Translators (NATs), IETF RFC 3489, March 2003.
7. X. Zhang et al., ‘‘CoolStreaming/DONet: A
Data-Driven Overlay Network for Peer-to-Peer
Live Media Streaming,’’ Proc. IEEE Conf. Computer
00.020
0.022
0.024
0.026
0.028
0.030
10 11 12 13 14 15 16Time (minutes)
Con
tinui
ty in
dex
Con
trol
ove
rhea
d
(a)
(b)
17 18 19 200.980
0.984
0.988
0.992
0.996
1.000
1 2
Number of recovery neighbors
3 4
Figure 7. Scalable
Island Multicast
(a) continuity index
and (b) control
overhead (streaming
bit rate is 500 kilobits
per second on
PlanetLab).
Jan
uary
�M
arch
2009
79
Comm. (Infocom), IEEE CS Press, 2005, pp. 2102-
2111.
8. V. Fodor and G. Dan, ‘‘Resilience in Live Peer-to-
Peer Streaming,’’ IEEE Comm. Magazine, vol. 45,
no. 6, 2007, pp. 116-123.
9. R. Schafer, T. Wiegand, and H. Schwarz, ‘‘The
Emerging H.264/AVC Standard,’’ EBU Technical
Rev., Jan. 2003.
10. E. Zegura, K. Calvert, and S. Bhattacharjee,
‘‘How to Model an Internetwork,’’ Proc. IEEE Conf.
Computer Comm. (Infocom), IEEE CS Press, 1996,
pp. 594-602.
11. Y.H. Chu et al., ‘‘A Case for End System Multi-
cast,’’ IEEE J. Selected Areas Comm., vol. 20, no. 8,
2002, pp. 1456-1471.
Xing Jin is a member of technical staff in the Systems
Technology Group, Oracle USA. His research interests
include overlay networks, Internet topology infer-
ence, and multimedia networking. Jin has a PhD in
computer science and engineering from The Hong
Kong University of Science and Technology
(HKUST). He was awarded the Microsoft Research
Asia Fellowship in 2005. He is a Junior Editor of the
Journal of Multimedia, and the editor of the Canadian
Journal of Pure and Applied Sciences. Contact him at
Ho-Shing Tang is working toward an M.Phil. at the
Department of Computer Science and Engineering
at HKUST. His research interests include peer-to-
peer systems and multimedia streaming. Tang has a
B.Eng. in computer science and engineering from
HKUST. He was awarded the Academic Achievement
Medal from HKUST in 2006. Contact him at
S.-H. Gary Chan is an associate professor in the De-
partment of Computer Science and Engineering at
HKUST. His research interests include multimedia
networking, peer-to-peer technologies, streaming,
and wireless communication networks. Chan has a
PhD in electrical engineering from Stanford Univer-
sity. He is a member of Tau Beta Pi, Sigma Xi, and
Phi Beta Kappa. He is a senior member of the IEEE
Computer Society. Contact him at [email protected].
Kan-Leung Cheng is working toward a PhD in the
Department of Computer Science at the University
of Maryland, College Park. His research interests in-
clude protocols, algorithms, and architectures for net-
working systems. Cheng has an M.Phil. in computer
science and engineering from HKUST. Contact him
80
IEEE
Mu
ltiM
ed
ia