Embed Size (px)
Citation preview

White Paper
Deploying XenApp 7.5 on Microsoft Azure cloud
The scalability and economics of delivering
Citrix XenApp services
citrix.com

Deploying XenApp on a Microsoft Azure cloud
2
citrix.com
White Paper
2
citrix.com 2
Deploying XenApp on a Microsoft Azure cloud
Given business dynamics—seasonal peaks, mergers,
acquisitions, and changing business priorities—deploying
XenApp 7.5 workloads on a Microsoft Azure cloud gives IT
organizations a strategic advantage since it enables agile
desktop and application delivery. Best of all, the price point for
deploying a XenApp farm on Microsoft Azure can be just over
$7 per month per user.1
Microsoft Azure Cloud Services
Microsoft Azure is a reliable and flexible cloud platform that allows applications to be quickly deployed
across Microsoft-managed datacenters. Azure offers monthly service level agreements (SLAs) of
99.95% to meet strict requirements for continuously available services. By provisioning XenApp
desktops and application workloads on Azure Cloud Services, businesses can avoid expenses for
internal infrastructure and rely instead on Microsoft to supply the necessary compute, networking, and
storage resources for user workloads.
Citrix XenApp
Citrix XenApp® 7.5 provides advanced management and scalability, a rich multimedia experience over
any network and self-service applications with universal device support across a full range of mobile
endpoints—including laptops, tablets, smartphones, PCs, and Macs. XenApp provides session and
application virtualization technologies that make it easy for customers to manage centralized
applications and apply the optimal combination of local and hosted delivery models to match user
requirements. Hosted desktop sessions can be deployed from the Citrix XenApp 7.5 or using Citrix
XenDesktop 7.5 software if pooled virtual desktops are also required.
XenApp simplifies application provisioning, enabling unprecedented levels of scalability that helps to
increase efficiency. When deployed on Microsoft Azure cloud, XenApp gives IT departments the
flexibility of delivering infrastructure services for Windows applications and desktops at an economical
price point while extending and integrating current investments on Windows Server System Center
and Hyper-V technologies from on-premise environments.
Scalability testing of Citrix XenApp on Microsoft Azure instances
Microsoft Azure makes it possible to spin up new virtual machines in minutes and adjust usage as
infrastructure requirements change. Virtual machines on Azure instances can support all of the
infrastructure and XenApp services required for a deployment.
To validate XenApp 7.5 configurations using Microsoft Azure virtual machines, Citrix engineers
1 An estimate of $7.05 per month per user represents infrastructure (compute, networking, and storage)
costs given U.S. West pricing (at the time of this writing) and does not include costs for Citrix licensing. This
per-user value is based on densities measured with a Light workload (as defined by Login VSI) and
represents an 8-hour user day and 7-day work week. .

Deploying XenApp on a Microsoft Azure cloud
3
citrix.com
White Paper
3
citrix.com 3
Deploying XenApp on a Microsoft Azure cloud
conducted a series of performance tests in conjunction with input from Microsoft. The goal was to
analyze the scalability and economics of XenApp on different Microsoft Azure instance types. Login
VSI 4.0 software (from Login VSI Inc.) was used in the testing to generate user connections to XenApp
and simulate user workloads running on Azure instances.
Microsoft Azure instance types vary according to infrastructure resources and relative cost per hour, as
shown in the table below. “Pay-as-you-go” pricing for Azure virtual machines varies by region and
includes Windows licensing (see http://azure.microsoft.com/en-us/pricing/details/virtual-machines).
Instance types Virtual cores RAM Disk sizes Price per hour 2
Small (A0) 1 768 MB 20.00 GB 0.02
Small (A1) 1 1.75 GB 70.00 GB 0.09
Medium (A2) 2 3.5 GB 135.00 GB 0.18
Large (A3) 4 7 GB 285.00 GB 0.36
Extra Large (A4) 8 14 GB 605.00 GB 0.72
Memory-Intensive A5 2 14 GB 135.00 GB 0.33
Memory-Intensive A6 4 28 GB 285.00 GB 0.66
Memory-Intensive A7 8 56 GB 605.00 GB 1.32
Topology for the scalability testing
For the XenApp 7.5 testing, virtual machines were configured with Microsoft Windows Server 2012 R2
on Azure instances as follows:
A virtual machine on an A2 instance containing:
o 1x Login VSI controller and profile server
o 4x Login VSI launchers
A virtual machine on an A2 instance containing:
o 1x Web Interface server
o 1x Secure Gateway server
A virtual machine on an A3 instance containing:
o 1x dedicated XenApp 7.5 DC/XML broker
o 1x Citrix license server
o 1x Microsoft SQL server
A virtual machine on an A1 instance containing:
o 1x Active Directory controller and DNS server
A virtual machine containing a single XenApp 7.5 worker server hosting simulated user sessions.
This server was deployed on each instance type in different test runs to test the scalability of
different Azure instances.
Creating a virtual machine on Azure automatically creates an Azure Cloud Service container. By default
virtual machines built in a Cloud Service are isolated on the same virtual network. Figure 1 depicts the
test architecture.
2 Pay-as-you-go pricing as of September 24, 2014 for U.S. West. See http://azure.microsoft.com/en-
us/pricing/details/virtual-machines/.

Deploying XenApp on a Microsoft Azure cloud
4
citrix.com
White Paper
4
citrix.com 4
Deploying XenApp on a Microsoft Azure cloud
Figure 1: Architecture for XenApp scalability testing on Microsoft Azure.
In an Azure depoyment, users connect through https (port 443) to a Secure Gateway server, which
proxies all traffic in and out of the virtual network. Web Interface servers provide authentication and a
list of available resources from which users can select desktops or application services. As in a
traditional XenApp architecture, Delivery Controllers distribute the connections and set up service
connections to XenApp session hosts.
In the testing, the Login VSI clients simulated the user connections to the Secure Gateway. XenApp 7.5
servers were configured with a single boot volume and one local-instance storage volume. Local
instance volumes were configured to hold volatile data (e.g., pagefile and user profiles).
Results summary
The graph below shows the maximum number of simulated XenApp user sessions that each instance
type supported under the Login VSI Light and Medium workloads.3 As shown, the user density scaled
in a relatively linear fashion across the Small (A1) to Extra Large (A4) instances. The A7 instance (with 8
vCPUs and 56GB of RAM) hosted the highest user session densities, sustaining 31 and 51 users under
the Medium and Light workloads respectively.
3 A description of the Login VSI Light and Medium workloads can be found at:
http://www.loginvsi.com/pdf/documentation/Login-VSI-40-Workloads.pdf.
Deploying XenApp on a Microsoft Azure cloud
5
citrix.com
White Paper
5
citrix.com 5
Deploying XenApp on a Microsoft Azure cloud
The pricing model for Azure instances varies according to the region and the instance type and
resources it provides. The graph below compares the cost efficiency of each instance based on
XenApp densities achieved in the testing. It reflects U.S. West “pay-as-you-go” pricing available at the
time of this writing for standard Windows VM instances with Windows licenses.
There are a number of design tradeoffs that solution architects must consider in choosing an Azure
instance type for XenApp 7.5 implementations. Deploying multiple small instances rather than a single
large instance, for example, enables greater flexibility in adjusting capacity since smaller instances can
be added or removed incrementally, optimizing efficiency and potentially reducing costs. However,
taking a granular approach and deploying many small instances also increases management
complexity. While deploying XenApp 7.5 on an A4 instance may be preferable from a management
perspective, the A3 instance offers a lower cost per seat. For this reason, this document focuses on
performance results and cost estimates based on using an A3 instance for the XenApp workload.
Instance types A5 through A7 are configured to supply additional RAM resources and priced
accordingly. In the testing, the density results showed no clear benefit from the extra memory in
testing with the A5 to A7 instance definitions. However, if users run applications that are particularly
memory-intensive, there may be a benefit in deploying XenApp 7.5 on a memory-intensive A5, A6, or
A7 instance.
49
18
27
9
20
31
6
13
28
43
13
27
51
0
10
20
30
40
50
60
A1 Small (1 vCPU,
1.75GB)
A2 Medium (2
vCPUs, 3.5GB)
A3 Large (4 vCPU,
7GB)
A4 Extra Large (8
vCPU, 14GB)
A5 Medium
Memory Intensive
(2 vCPU, 14GB)
A6 Large Memory
Intensive (4 vCPU,
28GB)
A7 Extra Large
Memory Intensive
(8 vCPU, 56GB)
Users per Azure Instance Type
Medium Workload Light Workload
$0.0225
$0.0200 $0.0200
$0.0267
$0.0367
$0.0330
$0.0426
$0.0150 $0.0138 $0.0129
$0.0167
$0.0254 $0.0244 $0.0259
$0.000
$0.005
$0.010
$0.015
$0.020
$0.025
$0.030
$0.035
$0.040
$0.045
A1 Small (1
vCPU, 1.75GB)
A2 Medium (2
vCPUs, 3.5GB)
A3 Large (4
vCPU, 7GB)
A4 Extra Large (8
vCPU, 14GB)
A5 Medium
Memory
Intensive (2
vCPU, 14GB)
A6 Large
Memory
Intensive (4
vCPU, 28GB)
A7 Extra Large
Memory
Intensive (8
vCPU, 56GB)
Infrastructure cost per user per hour*
Medium Workload Light Workload *Based on U.S. West pricing for infrastructure only

Deploying XenApp on a Microsoft Azure cloud
6
citrix.com
White Paper
6
citrix.com 6
Deploying XenApp on a Microsoft Azure cloud
The scalability results presented in this paper should be used simply as guidelines in configuring Azure
infrastructure for your own XenApp workloads and applications. As always, it is recommended that
you execute your own proof-of-concept tests before making final sizing and deployment decisions.
Testing methodology
In the scalability testing, Login VSI was used to simulate workers running generic Windows
applications such as Microsoft Office 2010, Microsoft Internet Explorer, and Adobe Acrobat Reader.
The default Login VSI Light and Medium workloads simulate diverse workers that perform a variety of
application tasks. The Light workload includes a small set of well-defined applications that have
limited CPU (and other resource) requirements, simulating an office task worker. The Medium
workload is more resource-intensive and mimics the application and desktop activity of a typical
knowledge worker. The default workloads are characterized in the Login VSI 4.0 Workloads Overview
guide (http://www.loginvsi.com/pdf/documentation/Login-VSI-40-Workloads.pdf).
Azure instance types A0 through A7 were tested. Since the goal was to capture a baseline reflecting
the densities possible on each instance type, the Login VSI client launchers were configured to go
through the Secure Gateway and Web Interface servers.
Performance metrics were captured during user logon and virtual desktop acquisition (ramp-up), user
workload execution (steady state), and user logoff. During ramp-up, Login VSI was configured to log in
a new user every 40 seconds. To achieve consistent measurements that reflected when components
were appropriately cached, each workload ran for 40 minutes before Login VSI performance metrics
were recorded.
Login VSI 4.0 uses new workload definitions, a completely revised test engine, and new analytics. For
this reason, results for Login VSI 4.0 differ significantly from results from earlier releases since they
show heavier CPU utilization (see the Login VSI 4.0 Upgrade Guide for a discussion of version
differences). With Login VSI 4.0, density values are based on an index (“VSImax v4”) that represents the
maximum user density before serious performance degradation occurs.
A3 instance results
Since the A3 instance proved to be the most cost-effective for XenApp 7.5, the following pages show
user density and performance metrics for the A3 instance under the Login VSI Medium and Light
workloads. A later section in this document (“Economic considerations”) describes cost factors to
consider when developing a budget estimate for deploying XenApp on Azure.
Medium workload results
This section gives test results for the A3 instance with the Medium workload. VSImax v4 is determined
from two other metrics, VSI Baseline and VSI Threshold. VSI Baseline represents a pre-test Login VSI
baseline response time measurement that is determined before the normal Login VSI sessions are
sampled. The A3 instance demonstrates a VSImax v4 density of 18 users under the Medium
workload.

Deploying XenApp on a Microsoft Azure cloud
7
citrix.com
White Paper
7
citrix.com 7
Deploying XenApp on a Microsoft Azure cloud
The next two graphs depict CPU and memory consumption and disk I/O response times
measured during the test. These metrics are helpful in assessing performance under the test
workload.
In the chart below, as user load increases, CPU and memory utilization peaks at the point where the
number of users approaches VSImax v4.
The write I/O response time averaged around 4 ms. Read I/O response times averaged less than 1
ms. I/O metrics were also captured for the temp disk but this I/O was negligible.
0
1
2
3
4
5
6
7
0
20
40
60
80
100
GB
yte
s M
em
ory
% C
PU
Uti
liza
tio
n
Time (mm:ss)
Memory and CPU consumption as users log on
% Processor Time Memory Consumed (Gbytes)
Steady
State
Idle LogoffRamp-Up/Logins Logoff
Complete

Deploying XenApp on a Microsoft Azure cloud
8
citrix.com
White Paper
8
citrix.com 8
Deploying XenApp on a Microsoft Azure cloud
The following network and disk performance metrics show resource consumption that impacts scale
as well as the costs associated with the solution. The graph below shows networking transfer rates for
data going out of Azure data centers. Microsoft charges for outbound data while inbound data
transfers are free. For the Medium workload, the average outbound bandwidth during steady state is
approximately 5500kbps for the test workload of 19 users. This means the per-user outgoing transfer
rate is approximately 300kbps (5500/19=289.47 ≈ 300 kbps). Outgoing network transfers during logoff
occur as user profile data is transmitted.
Azure also charges for disk transfers. Disk transfer metrics, which are used in the subsequent cost
analysis, are shown below. For the Medium workload, disk transfers during steady state averaged
about 90 IOPS for the test workload of 19 users, which calculates to an average of about 5 IOPs per
user. The peak value was 255 IOPS for 19 users or about 13 IOPs per user. Disk transfer activity is also
visible during the logoff period as user profile data is recorded.
0.0000.0150.0300.0450.0600.0750.0900.1050.1200.135
Re
spo
nse
Tim
e (
sec
)
Time (mm:ss)
Disk I/O Response Time Measurements
Avg. Disk sec/Read Avg. Disk sec/Write
Steady
State
Logoff
0100020003000400050006000700080009000
100001100012000
Kb
ps
Time (mm:ss)
Network Transfer rate (sent)
Steady State Logoff

Deploying XenApp on a Microsoft Azure cloud
9
citrix.com
White Paper
9
citrix.com 9
Deploying XenApp on a Microsoft Azure cloud
Light workload results
This section shows test results and performance metrics for the A3 instance under the
Light workload. As shown below, the A3 instance supports a VSImax v4 of 28 users for the
Light workload.
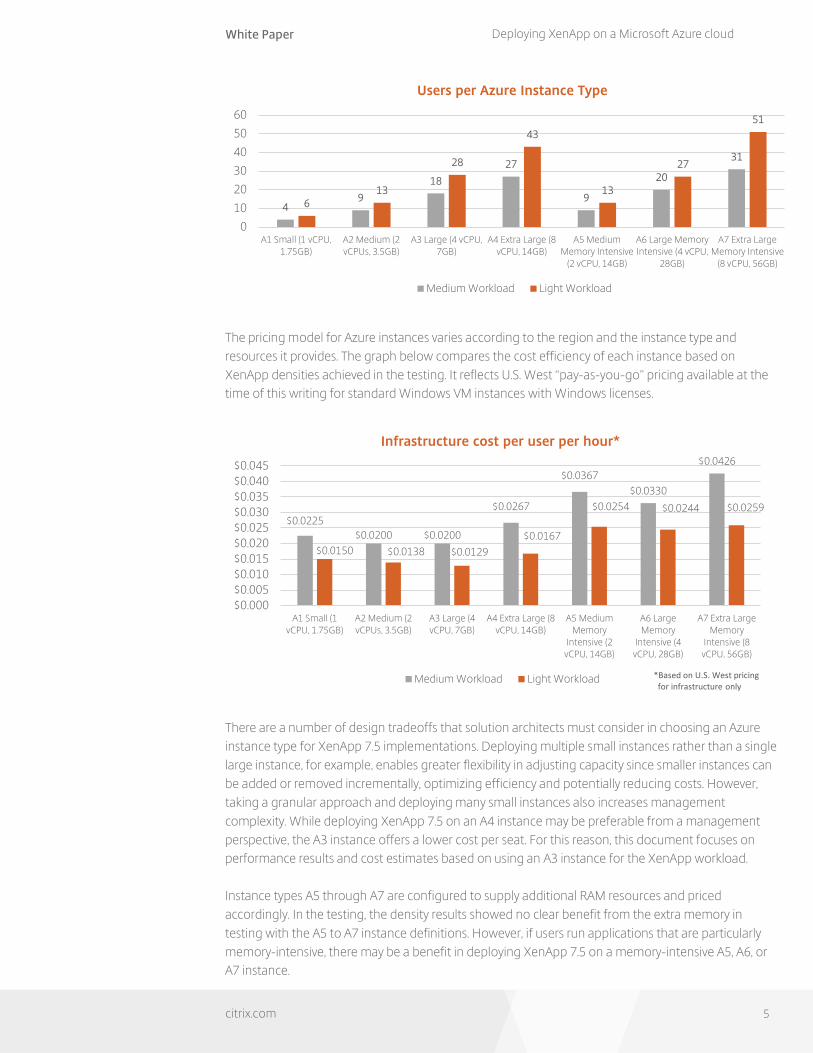
The next two graphs depict CPU and memory consumption and disk I/O response times for the
Light workload. These metrics are helpful in assessing performance under the test workload. As
the user load increases in the chart below, memory and CPU utilization peaks at the point where the
number of users approaches VSImax v4. Note that there is still more than 10% of memory available
even at the peak load during the A3 Light workload test.
Peak 254.7750638
0
30
60
90
120
150
180
210
240
270
IOP
S
Time (mm:ss)
Total Disk Transfers (read and write)
Steady
State Logoff
Deploying XenApp on a Microsoft Azure cloud
10
citrix.com
White Paper
10
citrix.com 10
Deploying XenApp on a Microsoft Azure cloud
Disk I/O response time metrics for the Light workload are shown below. Write I/O response times
averaged around 15 ms while read I/O response times averaged less than 2.5 ms. I/O metrics were
also captured for the temp disk but this I/O was negligible.
The following graphs show resource consumption metrics for network and disk I/O under the Light
workload. The outbound networking transfer rate during steady state averaged around 3000kbps for
the test workload of 30 users. This means the outbound transfer rate per user was approximately
100kbps (3000/30=100 kbps). During the logoff period, network transfer activity reflects how user
profile data is transmitted and captured at logoff.
0
1
2
3
4
5
6
7
0
20
40
60
80
100
Me
mo
ry (
Gb
yte
s)
% C
PU
uti
liza
tio
n
Time (mm:ss)
Memory and CPU consumption as users log on (Light)
% Processor Time Memory Used (Gbytes)
Idle Rampup/Logins
Steady State
Logoff
Logoff
Complete
0.0000.0200.0400.0600.0800.1000.1200.1400.1600.1800.2000.2200.2400.260
Re
spo
nse
Tim
e (
sec)
Time (mm:ss)
Disk I/O Response Time Measurements
Avg. Disk sec/Read Avg. Disk sec/Write
Steady State Logoff

Deploying XenApp on a Microsoft Azure cloud
11
citrix.com
White Paper
11
citrix.com 11
Deploying XenApp on a Microsoft Azure cloud
As shown below, the Light workload imposes an average of 75 IOPS for all 30 users or 2.5 IOPs per
user (75/30=2.5). The peak total disk transfers was 234 IOPS or about 8 IOPS per user.
Economic considerations
Microsoft Azure Cloud Services are attractive to IT organizations that seek a cost-effective way to
provision an agile application infrastructure. Companies pay for only the compute, storage and
network resources that they use rather than assuming the cost and complexity of developing and
maintaining in-house infrastructure. Microsoft provides the required resources from its global network
of datacenters, and owns the responsibility and costs associated with infrastructure maintenance,
upgrades, monitoring, cooling, power, and service.
This section discusses cost considerations for a XenApp on Azure deployment. Several elements go
into a complete XenApp on Azure budget estimate, but the cost of Azure instances (which includes
Windows licensing) is the dominant cost factor. Other costs include the cost of network and storage
I/O and the cost of the storage consumed. Citrix licensing costs are also a factor, but since these costs
are the same whether deployed on Azure or internal infrastructure, they are not considered in the
following cost analysis. The cost calculations presented here determine a monthly cost per user for
both Medium and Light workloads based on U.S. West pricing at the time of this writing.
0750
15002250300037504500525060006750750082509000
Kb
ps
Time (mm:ss)
Network Transfer rate (sent)
Steady State Logoff
Peak 234.4755334
0
30
60
90
120
150
180
210
240
IOP
S
Time (mm:ss)
Total Disk Transfers (read and write)
Steady State Logoff

Deploying XenApp on a Microsoft Azure cloud
12
citrix.com
White Paper
12
citrix.com 12
Deploying XenApp on a Microsoft Azure cloud
Azure instance costs
Instance costs are the largest factor in developing a budget estimate for an Azure deployment. The
pricing model for Azure virtual machines varies by region according to instance type and the resources
that each instance type provides (see http://azure.microsoft.com/en-us/pricing/details/virtual-
machines/).
Azure pricing is calculated on an hourly basis. For this costing exercise, it is assumed that users work
only 8-hour shifts. Using the Azure management interface (or a PowerShell script provided by Citrix),
it’s possible to manually shut down and deallocate virtual machines that are not actively in use,
reducing hourly instance charges to conserve budget. For this reason, the cost estimates given here
(except for storage capacity) assume that VMs are allocated and in use for a period of 8 hours per day.
Given this assumption, an A3 instance has a monthly cost of $89.33 and can support 18 XenApp users
under a Medium workload and 28 users under a Light workload. This equals a monthly per-user cost
of $4.96 for each Medium workload user and $3.19 for each Light workload user.
Network utilization cost
Network utilization reflects network I/O operations going out of Azure datacenters (e.g., ”outbound
data transfers” in Microsoft terminology). Charges vary according to the specific zone (region group)
providing services. Pricing is tiered according to the data quantity transferred each month. For the
most expensive bracket (zone1), the monthly cost is $0.12 per GB.
As shown in the test results, with the Medium workload, an average user consumes network
bandwidth at a rate of approximately 300kbps. Assuming an 8-hour workday, a single XenApp user
running a Medium workload consumes about 32GB of network bandwidth per month—which
translates to a cost of $3.83 per month per user. For the Light workload, network utilization is about
100kbps per user or ~11GB for an 8-hour day, which costs about $1.27 per month per user.
Storage utilization cost
The cost of I/O operations is $0.005 per 100,000 transactions to storage (transactions encompasses
both read and write operations). A Medium XenApp workload imposes about 5 IOPs per user on
average, which works out to ~4,464,000 transactions per month, assuming an 8 hour workday, at a
cost of $0.22 per user. In contrast, a Light workload requires an average 2.5 IOPs per user. This is about
~2,232,000 IOPs per month per user for an 8-hour day, which means a cost of $0.11 a month for each
Light user’s storage use.
Storage capacity cost
Azure maintains storage resources for the XenApp infrastructure even when no users are active, so the
analysis of storage consumption charges is based on a 24-hour day. Persistent disks for Azure VMs use
“page blobs”, block storage that is optimized for random access. Azure provides different storage
categories and redundancy options. Storage pricing is tiered with lower rates for higher levels of
consumption.
For XenApp infrastructure on Azure, this costing exercise assumes Geographically Redundant Storage
(GRS), which is a mid-tier availability option. There are two primary storage needs: storage for XenApp
servers and applications, and storage for each user profile. XenApp servers and applications require
approximately 30GB of storage. A reasonable size estimate for a user profile is 25GB.

Deploying XenApp on a Microsoft Azure cloud
13
citrix.com
White Paper
13
citrix.com 13
Deploying XenApp on a Microsoft Azure cloud
Given 18 users for the A3 instance running a Medium workload, storage utilization for XenApp servers
and applications per user is approximately 1.67 GB per user plus user profile storage of 25GB. For the
Light workload with 28 users, storage consumption is 1.07 GB per user plus 25GB for the user profile.
At a cost of $0.095 per GB (the highest cost bracket for GRS storage), the storage capacity cost per user
is $2.53 per month for a Medium user and $2.48 per month for a Light user.
Total estimated costs
The graph and table below show approximate total costs per user (based on U.S. West pricing) for
Medium and Light workloads. Based on the A3 compute instance, the monthly cost for each Medium
user is approximately $11.55. An approximate monthly cost for each user running a Light workload is
$7.05. Actual costs will vary, of course, depending on the region and instance infrastructure selected
and densities achieved with specific user workloads.
$4.96 $3.19
$3.83
$1.27
$0.22
$0.11
$2.53
$2.48
$-
$2.00
$4.00
$6.00
$8.00
$10.00
$12.00
$14.00
Medium ($11.55) Light ($7.05)
Storage capacity
Storage utilization
Network utilization
Compute instance
Cost per user Medium Light
A3 compute instance $4.96 $3.19
Network utilization $3.83 $1.27
Storage utilization $0.22 $0.11
Storage capacity $2.53 $2.48
Total $11.55 $7.05

Deploying XenApp on a Microsoft Azure cloud
14
citrix.com
White Paper
14
citrix.com 14
Deploying XenApp on a Microsoft Azure cloud
XenApp and Microsoft Azure cost calculator tool
Based on the test results presented here, it’s possible to estimate the costs associated with deploying
a XenApp farm on Microsoft Azure Cloud Services in your environment. To simplify this task, Citrix is
building a comprehensive XenApp and Microsoft Azure cost calculator tool. The tool will use
customer-provided inputs and the density results from this testing to approximate the Azure
infrastructure resources needed and relative solution costs. The tool will take into account
complex deployment scenarios that involve mixed user workloads, solutions that cross multiple
geographic regions, and customized user characteristics.
The XenApp on Azure scalability results presented here should be used only as guidelines in
configuring your Azure solution. Before making final sizing and deployment decisions, it is suggested
that you run proof-of-concept tests on different Azure instance types using your own workloads.
Learn more
For more information about deploying Citrix XenApp workloads on Microsoft Azure Cloud
Services, see the Citrix and Microsoft partner web site at:
http://www.citrixandmicrosoft.com/Solutions/AzureCloud.aspx
http://www.citrix.com/global-partners/microsoft/ resources.html
http://www.citrix.com/global-partners/microsoft/ resources.html
Corporate Headquarters
Fort Lauderdale, FL, USA
Silicon Valley Headquarters
Santa Clara, CA, USA
EMEA Headquarters
Schaffhausen, Switzerland
India Development Center
Bangalore, India
Online Division Headquarters
Santa Barbara, CA, USA
Pacific Headquarters
Hong Kong, China
Latin America Headquarters
Coral Gables, FL, USA
UK Development Center
Chalfont, United Kingdom
About Citrix
Citrix (NASDAQ:CTXS) is a leader in mobile workspaces, providing virtualization, mobility management, networking and cloud services to
enable new ways to work better. Citrix solutions power business mobility through secure, personal workspaces that provide people with
instant access to apps, desktops, data and communications on any device, over any network and cloud. This year Citrix is celebrating 25
years of innovation, making IT simpler and people more productive. With annual revenue in 2013 of $2.9 billion, Citrix solutions are in use at
more than 330,000 organizations and by over 100 million users globally. Learn more at www.citrix.com.
Copyright © 2014 Citrix Systems, Inc. All rights reserved. Citrix, CloudBridge and Citrix Ready are trademarks of Citrix Systems, Inc. and/or
one of its subsidiaries, and may be registered in the U.S. and other countries. Other product and company names mentioned herein may be
trademarks of their respective companies
1014/PDF citrix.com