Embed Size (px)
Citation preview

Full Terms & Conditions of access and use can be found athttp://www.tandfonline.com/action/journalInformation?journalCode=tfac20
Food Additives & Contaminants: Part A
ISSN: 1944-0049 (Print) 1944-0057 (Online) Journal homepage: http://www.tandfonline.com/loi/tfac20
Depletion of tylosin residues in feathers, muscleand liver from broiler chickens after completion ofantimicrobial therapy
Javiera Cornejo, Ekaterina Pokrant, Carolina Carvallo, Aldo Maddaleno &Betty San Martín
To cite this article: Javiera Cornejo, Ekaterina Pokrant, Carolina Carvallo, Aldo Maddaleno & BettySan Martín (2018) Depletion of tylosin residues in feathers, muscle and liver from broiler chickensafter completion of antimicrobial therapy, Food Additives & Contaminants: Part A, 35:3, 448-457,DOI: 10.1080/19440049.2017.1401740
To link to this article: https://doi.org/10.1080/19440049.2017.1401740
View supplementary material
Accepted author version posted online: 07Nov 2017.Published online: 01 Dec 2017.
Submit your article to this journal
Article views: 62
View related articles
View Crossmark data
Depletion of tylosin residues in feathers, muscle and liver from broiler chickensafter completion of antimicrobial therapyJaviera Cornejoa, Ekaterina Pokranta, Carolina Carvalloa, Aldo Maddalenob and Betty San Martínb
aPreventive Medicine Department, Faculty of Veterinary and Animal Sciences, University of Chile, La Pintana Santiago, Chile; bLaboratory ofVeterinary Pharmacology, Faculty of Veterinary and Animal Sciences, University of Chile, La Pintana Santiago, Chile
ABSTRACTTylosin is one of the most commonly used antimicrobial drugs from the macrolide family and inbroiler chickens it is used specially for the treatment of infectious pathologies. The poultry industryproduces several by-products, among which feathers account for up to 7% of a chicken’s live weight,thus they amount to a substantial mass across the whole industry. Feathers have been repurposed asan animal feed ingredient by making them feather meal. Therefore, the presence of high concentra-tions of residues from antimicrobial drugs in feathersmight pose a risk to global public health, due tore-entry of these residues into the food chain. This work aimed to characterise the depletionbehaviour of tylosin in feather samples, while considering its depletion in muscle and liver tissuesamples as a reference point. To achieve this goal, we have implemented and validated an analyticalmethodology suitable for detecting and quantifying tylosin in these matrices. Sixty broiler chickens,raised under controlled conditions, received an oral dose of 32 mg kg-1 of tylosin for 5 days. Tylosinwas quantified in muscle, liver and feathers by liquid chromatography coupled with a photodiodearray detector (HPLC-DAD). High concentrations of tylosin were detected in feather samples over thewhole experimental period after completing both the therapy and the recommended withdrawaltime (WDT). On the other hand, tylosin concentrations in muscle and liver tissue samples fell belowthe limit of detection of this method on the first sampling day. Our results indicate that the WDT forfeather samples is 27 days, hence using feather meal for the formulation of animal diets or for otheragricultural purposes could contaminate with antimicrobial residues either other livestock species orthe environment. In consequence, we recommend monitoring this matrix when birds have beentreated with tylosin, within the context of poultry farming.
ARTICLE HISTORYReceived 8 August 2017Accepted 22 October 2017
KEYWORDSTylosin; feathers; muscle;liver; antibiotic residues;depletion
Introduction
Tylosin is one of the most commonly used antimicro-bials from themacrolide family when treating infectiousdiseases of poultry. Such a widespread usage stems fromit being restricted exclusively to veterinary medicine,making it a valuable tool in the prevention of cross-resistance problems (Ji et al. 2014; Soliman and Sedeik2016). Additionally, though this antimicrobial is usuallyregarded to have bacteriostatic activity at therapeuticalconcentration levels, it can also have mild bactericidalactivity against streptococci (Landoni and Albarellos2015; Soliman and Sedeik 2016).
However, administering antimicrobials to animalsdestined for human consumption poses two majorrisks to public health. The first one relates to drugresidues that may persist in edible tissues and are
potentially capable of causing adverse effects such asdirect toxicity, allergic reactions, mutagenesis, carci-nogenicity and teratogenicity (Anadón et al. 2012;Beyene 2016). In particular, the presence of tylosinresidues in edible tissues has been associated withtoxicological effects in the short-term or hypersensi-tivity reactions in allergic individuals, as well aslong-term inhibition of Gram positive bacteria pre-sent in human gastrointestinal gut flora (Prats et al.2002; Jeong et al. 2010; Nasr et al. 2014). The secondequally important threat to public health arises fromthe constant selection pressure that these residuesimpose on bacteria, eventually leading to the devel-opment of resistant strains (Beyene 2016).
Little data have been published about depletion oftylosin residues in edible tissues of poultry, especiallyabout therapeutic dose regimes. In one study,
CONTACT Javiera Cornejo [email protected] Food Safety Unit, Preventive Medicine Department, Faculty of Veterinary and Animal Sciences,University of Chile. Avenida Santa Rosa 11735, La Pintana Santiago 8820808, ChileColor versions of one or more of the figures in the article can be found online at www.tandfonline.com/TFAC.
FOOD ADDITIVES & CONTAMINANTS: PART A, 2018VOL. 35, NO. 3, 448–457https://doi.org/10.1080/19440049.2017.1401740
© 2018 Taylor & Francis Group, LLC
Vandenberge et al. (2012) analysed several poultrymatrices to determine tylosin’s transfer from feed atconcentration levels representative of cross-contam-ination events. They found no residue concentrationlevels above the limit of quantification in musclematrix, therefore this molecule did not exceed max-imum residue limits established at 100 µg kg−1 byEU legislation (EMA 2002). Another two studiesconcluded that the administration route determinesthe concentration of tylosin in different organs.Specifically, orally administered tylosin resulted inlower concentration levels than those from tylosininjections, and it could be a consequence of low oralbioavailability (Kowalski et al. 2001; Lewicki 2006).
As for the egg matrix, Muñoz et al. (2014) reportedmeeting maximum residue limits in egg yolks after3 days of withdrawing tylosin in laying hens. Theyalso found that tylosin’s oral bioavailability, distribu-tion, molecular weight and solubility had stronglyinfluenced their results. Tylosin residues in eggswere also studied by Kan and Petz (2000), who char-acterised their distribution between yolk and white.These authors found that tylosin residues in egg whitereflected its concentration level in blood plasma andwould reach a constant level after 2–3 days. They alsoconcluded that tylosin depletion from egg yolks gen-erally takes about 10 days.
Meanwhile, for non-edible tissues such as feathersthere is no information regarding behaviour of tylo-sin residues. However, current evidence for otherantimicrobials shows that they accumulate in feath-ers of broiler chickens at higher concentration levelsand for longer periods than in edible tissues. Reportsfrom San Martin et al. (2007), Cornejo et al. (2011)and Cornejo-Kelly et al. (2012) showed that whenpoultry had been treated with therapeutical doses offluoroquinolones, that drug could persist in higherconcentration levels in their feathers than in theiredible tissues (muscle and liver). Such a high affinityand bioaccumulation of fluoroquinolones in feathershas recently been confirmed in works by Mestorinoet al. (2016) and Jansen et al. (2016).
Cornejo, Pokrant, Krogh, et al. (2017) also deter-mined concentration levels of oxytetracycline (OTC)and 4-epi-oxytetracycline residues in feathers andedible tissues of broiler chickens. After administer-ing an oral treatment based on a commercial for-mulation of 10% OTC to their birds, these authorsfound higher concentration levels of analytes in
feathers than in edible tissues. Such results are con-sistent with previous work of Berendsen et al. (2013),who showed that OTC could bioaccumulate infeather matrix after exposing chickens to differentOTC treatments and then assessing drug dispositionin several feather segments.
A final example of antimicrobials bioaccumulat-ing in feathers is florfenicol (FF). This drug and itsmetabolite, florfenicol amine (FFA), were recentlystudied by Cornejo, Pokrant, Riquelme, et al.(2017) to determine residue concentration anddepletion. They concluded that these analytesdepleted slowly and might persist for a long timein broiler chicken feathers.
The above information becomes highly relevantwhen we consider that the poultry industry producesat least 1 kilogram of carcass by-products (such asheads, bones, offals and feathers) for every 3 kilo-grams of chicken meat. From these by-products,2,000 metric tons of feathers are generated in theUnited States of America alone (Love et al. 2012).These feathers can then be industrially processed totransform them into feather meal (Meeker andHamilton 2006) following a sequence of steps: col-lection of feathers from poultry carcasses, rinsingand chopping, physical hydrolysis by autoclaving(at 115–140°C for 45 minutes), pressing the cake toremove fats from it, drying, and grinding. Thisfeather meal can then be used for several purposes,such as an organic fertiliser, raw material for biodie-sel production or even as an ingredient for bioplas-tics (Arunlertaree and Moolthongnoi 2008; Loveet al. 2012; Nachman et al. 2012), and as a low costsource of aminoacids for animal diets. The lattermakes it an interesting ingredient for feeding poul-try, swine, ruminants and fishes (Divakala et al.2009) and therefore, a potential vehicle for re-entryof antimicrobial drug residues into the food chain(Meeker and Hamilton 2006; Divakala et al. 2009).Consequently, the presence of antimicrobial residuesin feather meal poses a serious risk to public health.
To this date, the presence of tylosin residueshas not proved to be a serious risk in the edibletissues of poultry, but in light of the aforemen-tioned potential re-entry, it becomes necessary tostudy tylosin’s transfer, bioaccumulation anddepletion. This work aimed to evaluate the deple-tion phase of tylosin in broiler chicken feathersfor a tylosin tartrate pharmaceutical formula
FOOD ADDITIVES & CONTAMINANTS: PART A 449
(80% w/w), as well as to implement and validatean analytical methodology for detection andquantification of tylosin in feathers.
Materials and methods
Reagents and solutions
Tylosin of certified purity (Sigma Aldrich ChemieGmbh, Munich, Germany) was used to prepare stockand working solutions that were suitable for analysisand quantification. Stock solution was prepared bydiluting tylosin in water of HPLC grade at a con-centration of 2500 ng mL−1. A working solution tospike blank samples was also prepared by dilutingtylosin in water of HPLC grade at a concentration of1,000 ng mL−1.
Besides tylosin, the following reagents and sol-vents were also used: sodium phosphate monobasicmonohydrate (NaH2PO4 * H2O) (N° CAS:10049-21-5), HPLC-grade water, orthophosphoricacid 85% (EMSURE®), sodium phosphate dibasic(Na2HPO4) (N° CAS: 7558-79-4), methanol, aceto-nitrile and dibutylamine. All of these products weresourced from Merck (Kenilworth, New Jersey) or asimilar manufacturer.
Sample analyses required phosphate buffer solu-tions at different pH values (2.5, 4.0 and 9.0). Toprepare pH 2.5 buffer solution, 3.5 g of NaH2PO4 .H2O were dissolved in 200 mL of water and then itspH was adjusted to 2.5 ± 0.1 by using orthophosphoricacid (85% w/w). For pH 4.0 phosphate buffer solution,3.5 g of NaH2PO4 . H2O were dissolved in 200 mL ofwater and its pH was adjusted to 4.0 ± 0.1 by usingorthophosphoric acid (85% w/w). The pH 9.0 phos-phate buffer solution was prepared by dissolving 1.4 gof Na2HPO4) in 80 mL of water and its pH wasadjusted to 9.0 ± 0.1 by using orthophosphoric acid(85% w/w). Both pH 2.5 and 4.0 buffer solutions weretransferred to a 250 mL flask and filled up to the markwith water. As for the pH 9.0 buffer solution, this wastransferred to a 100 mL flask and then filled up to themark with water.
Experimental animals and controlled treatmentstudy
Animal welfare guidelines were drawn up on the basisof Directive 2010/63/UE21 recommendations for the
protection of animals used for scientific purposes(EPCEU 2010). Ethics approval was sought andgranted by the Bioethics committee from theVeterinary Sciences Faculty of the University ofChile, before commencement of the experimentalphase.
The experimental population were 60 male 1-day-old broiler chicks (Ross 308 genetic), who wereindividually caged under controlled environmentalconditions (25 ± 5°C and 50–60% relative humidity).These cages were provided with a raised wire-meshfloor to avoid faecal contamination on feathers.
Throughout the entire experiment, all birds hadad libitum access to water and non-medicated feedthat was formulated with ingredients certified tylo-sin-free by HPLC-DAD analyses. Chicks were rearedfor 22 days, when they reached an average weight of736 ± 74.9 g. These birds were then randomlyassigned to either group A (48 birds) or B (12 birds).
A commercial tylosin premix formulation (tylosintartrate 80% w/w) registered for veterinary use inpoultry in Chile was chosen for this experiment.The product label recommends a WDT of 7 daysto reach the MRL of 100 mg kg−1 as established byEU (EC 2010). An exact therapeutic dose of 32 mgkg−1 of tylosin was sourced from this premix andadministered through an orogastric catheter, once aday for five consecutive days, to birds from groupA. Meanwhile, Group B birds (control group) weresubjected to the same treatment regime as groupA regarding frequency, volume and period, butinstead of tylosin they received saline solution.
Sample collection and preparation
After completing the treatment period, eight birdsfrom group A and two from group B were randomlysampled and euthanised via cervical dislocation ondays 4, 7, 9, 11, 13 and 15 post-treatment. Theexperimental group size was defined following direc-tive VICH GL48 from the European MedicinesAgency (EMA 2009). According to these directives,the minimum size for any given sampling point is 6birds; therefore 8 birds were deemed a convenientsafety margin. As for the control group, 2 birds wereslaughtered on each sampling point to provideenough control matrices for analytical method test-ing (EMA 2009).
450 J. CORNEJO ET AL.

These samples were then collected in properlylabelled plastic bags and individually stored at −20°C,waiting to be processed for analyte extraction andchromatographic analysis. Once in the laboratory,feather samples were washed out, subjected to cryo-genic treatment with liquid nitrogen and then all sam-ples were ground in a Robot Coupe R4® food processor(Robot-coupe, France).
Extraction from feather samples
De Liguoro et al. (1998), Civitareale et al. (2004) andMuñoz et al. (2014) published analytical methodsthat, with minor modifications, became the basisfor implementing a technique to determine tylosinconcentration levels in feather samples.
Analyte extraction began by weighing 5 ± 0.05 gof feather samples in 50 mL centrifuge tubes andadding 10 mL of pH 2.5 phosphate buffer solutions,15 mL of methanol and another 15 mL of HPLC-grade water. This mixture was then subject to vortexagitation for 20 minutes, sonication and centrifuga-tion at 1780 g. The resulting supernatant was sievedthrough a 50 mL syringe body filled with glass fibre,collected in another set of 50 mL centrifuge tubesand then centrifuged at 1780 g for 5 minutes.
The solid phase extraction columns (SPE) forstrong cation exchange (SCX) with BAKERBONDspe™ aromatic sulfonic acid (sorbent size 500 mg,column size 6 mL, packing volume 400 units) man-ufactured by J.T. Baker, were conditioned with 5 mLof methanol and 5 mL of pH 4.0 phosphate bufferbefore passing samples through them (flow rate1 mL min−1). Afterwards, columns were washedout with 1 mL of water and 1 mL of pH 9.0 phos-phate buffer solution. Column elution was per-formed then using 7 mL of methanol andevaporated under mild nitrogen flow at 40–50°C.
Analytes were reconstituted with 350 µL of a 50:50solution of water and acetonitrile, vortex agitated for5 minutes and sonicated for another 5 minutes. Theresulting solution was transferred to Eppendorf tubes,centrifuged at 15,890 g for 5 minutes and then trans-ferred its supernatant to HPLC injection vials.
Extraction from muscle and liver samples
These samples were processed following the samemeth-odology used for feather samples though varying on the
volume required for each solvent (5 mL of pH 2.5phosphate buffer solutions, 5 mL of methanol and15 mL of HPLC-grade water). Additionally, samplessupernatants were sieved using smaller syringes of10 mL filled with glass fibre. Furthermore the columnwash step employed 0.4mL ofmethanol after the pH 9.0phosphate buffer solution.
HPLC-DAD analysis
An Hitachi LaChrom Elite® liquid chromatograph(Hitachi America, Ltd. Tarrytown, New York),coupled to L-2455 photodiode array detector wasused for the samples instrumental analysis.
For the chromatographic separation, we used aChromolith® HighResolution RP 18e 100 × 4.6 mm(reference number 1.52022.0001) column fromMerckMillipore (Massachusetts, USA) with a ChromolithGuard Cartridge RP 18e 10 × 4.6 mm (referencenumber 1.51452.0001) from Merck Millipore(Massachusetts, USA) pre-column and a mobilephase composed of a 1 M dibutylamine buffer solu-tion, a 300 mL acetonitrile solution (solution A),300mL of water (solution B) and 0.02M dibutylamine(solution C).
The mobile phase was kept at a constant flow rateof 1 mL min−1, an oven temperature of 50°C and awavelength of 287 nm to ensure the best chromato-graphic conditions during the analysis.
In-house validation of the analytical method
The internal validation procedure was designed fol-lowing European Union recommendations from theCommission Decision 2002/657/EC (EC 2002) forlinearity, recovery and precision of analytical meth-ods. We calculated the limit of detection (LOD) asthe mean of the assay results for 20 fortified controlsamples at 50 μg kg−1, with a 3:1 signal-to-noiseratio. The limit of quantification (LOQ) was set asthe mean of those same results plus 1.64 times thestandard deviation (SD) of the mean.
Withdrawal time (WDT) determination
To determine WDT for tylosin in feather sampleswe followed the recommendations from theGuidance Towards Harmonization of WithdrawalPeriods document published by The European
FOOD ADDITIVES & CONTAMINANTS: PART A 451
Agency for the Evaluation of Medicinal Products(EMA 2016). According to these recommendations,WDT were estimated by performing a regressionanalysis that included the concentration levelsobserved for each sampling period, as well as byplotting a depletion curve on a semi-logarithmicscale based on the K Stange equation for a 95%confidence level.
Considering that there is no established maxi-mum residue limits (MRL) for the feather matrix,we decided to use the calculated LOD as the cut-offmark for determination of its WDT.
Results
In-house validation
While for the muscle matrix we chose an analyticalmethod that had previously been validated, on thefeather matrix it was necessary to validate ourselected method before relying on its results forcalculating WDTs.
Method specificity was proved by HPLC-DADanalyses on blank liver and feather samples frombroiler chickens. Tylosin LOD was set at 50 µgkg−1 for feathers and liver and its LOQ was set forfeather of 64.1 µg kg−1 and for liver 66.03 µg kg−1.The LOD for muscle was set at 25 µg kg−1 and theLOQ at 25.9 µg kg−1. Blank samples were then ana-lysed and showed no interferences at the averageretention time (RT) for tylosin, 32.99 minutes witha CV of 3.5%. (Figure 1).
On matrix-matched calibration curves (spiked to50, 100, 150, 200 and 250 µg kg−1) our resultsshowed linearity, which was evidenced by a coeffi-cient of determination (R2) >0.97 for both feather,muscle and liver samples, as well as coefficients ofvariation (CV) of 1.03%, 6.85% and 0.34% forfeather, muscle and liver samples, respectively.Tylosin recovery in feather, muscle and liver samplesvaried between 61% and 105%.
To assess precision of this analytical method fortylosin recovery we calculated its repeatability andwithin-laboratory reproducibility parameters.Table 1 shows analytical method validation resultsfor detection and quantification of tylosin infeathers.
Quantification of tylosin in feathers, muscle andliver
In light of the absence of an established MRL forfeathers, as this tissue is not destined for humanconsumption, we decided to compare concentra-tion levels in feathers with liver and muscleMRLs. Such comparison provided a referenceframe to assess the degree of persistence of tylo-sin residues in this matrix. Furthermore, for thequantification of the samples, each batch wereanalysed with fortified samples at increasingand equidistant concentration, in order to avoidextrapolation. High concentration levels of tylo-sin were detected in feather samples starting onday 4 after treatment, averaging 9246.5 µg kg−1.By day 7 after treatment, concentrationlevels of this analyte decreased by approximately67% in this matrix, reaching an average of3001.9 µg kg−1. Day 7 is the established WDTfor muscle tissue corresponding to the pharma-ceutical formulation of tylosin tartrate (80% w/w)that we used in this work. However, in spite ofthe declining concentration we detected andquantified in feather samples over the span ofthis work, these values exceeded the MRL as setby both the Codex Alimentarius and the EU formuscle tissue samples (100 µg kg−1).
Table 2 lists tylosin concentration levels as theywere quantified in each sampling point in feathersmatrix. In the case of both muscle and liver samples,tylosin concentration levels after day 4 were notdetected (ND) as they fell below the LOD of thisanalytical method.
Depletion time in feathers
The European Medicines Agency Guide: ApproachTowards Harmonization of Withdrawal PeriodsEMA/CVMP/SWP/036/2012 (EMA 2016) providesa statistical method suitable to calculate the persis-tence of tylosin in feathers. Therefore, we deter-mined the depletion time for feather samples byplotting a semi-logarithmic scale of concentrationlevels versus time and then performed a linearregression analysis at a 95% confidence level. Basedon this curve, we determined the day when
452 J. CORNEJO ET AL.
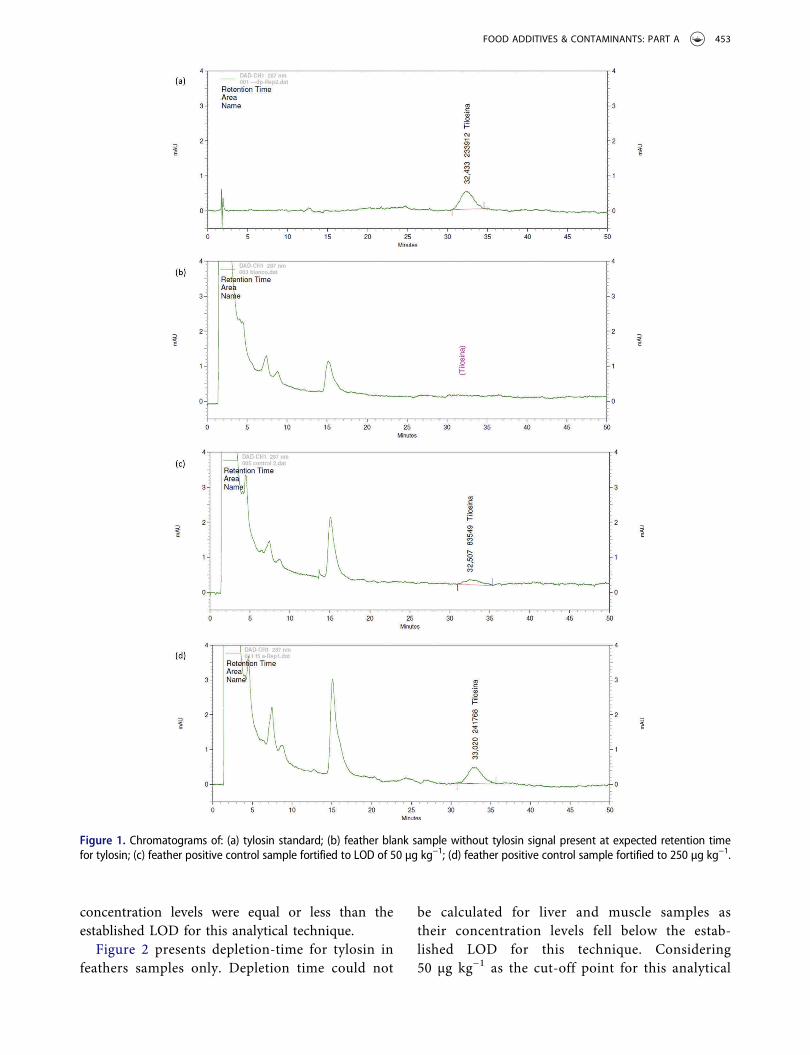
concentration levels were equal or less than theestablished LOD for this analytical technique.
Figure 2 presents depletion-time for tylosin infeathers samples only. Depletion time could not
be calculated for liver and muscle samples astheir concentration levels fell below the estab-lished LOD for this technique. Considering50 µg kg−1 as the cut-off point for this analytical
Figure 1. Chromatograms of: (a) tylosin standard; (b) feather blank sample without tylosin signal present at expected retention timefor tylosin; (c) feather positive control sample fortified to LOD of 50 µg kg−1; (d) feather positive control sample fortified to 250 µg kg−1.
FOOD ADDITIVES & CONTAMINANTS: PART A 453

method, withdrawal time for tylosin was set at26.4 (rounded up to 27 days).
Discussion
The internal validation protocol for the analyticalmethod was designed on the basis of CommissionDecision 2002/657/EC with the aim of proving thatthe method was suitable for its use with feathersamples.
The tests conducted on the fortified matrix allowedus to establish an LOD at 50 μg kg−1 with a signal-to-noise ratio greater than 3:1. As subsequent repetitionsfor the LOD yielded a CV value of less than 25%(which indicated statistical homogeneity), weaccepted both the LOD and the calculated LOQ.
The method was proved to be linear, reproducibleand repetitive according to Commission Decision2002/657/EC guideline as the results for all para-meters met its acceptance criteria (EC 2002).Therefore we deemed this method to be preciseand quantitative for the analysis of tylosin in feathermatrix.
This work joins several studies that have investi-gating the deposition into poultry feathers of drugresidues from several families of antimicrobials suchas fluoroquinolones, tetracyclines and phenicols (SanMartin et al. 2007; Cornejo et al. 2011; Cornejo-Kellyet al. 2012; Berendsen et al. 2013; Jansen et al. 2016;Cornejo, Pokrant, Krogh, et al. 2017; Cornejo,Pokrant, Riquelme, et al. 2017). In line with those
Table 1. Linearity, recovery, repeatability, reproducibility, LOD and LOQ of Tylosin in biological matrices: feathers, muscle and liver.Matrix/Analyte Linearity Recovery (%) to LOD Repeatability (%) to LOD Reproducibility (%) to LOD LOD (µg kg−1) LOQ (µg kg−1)
Feathers/Tylosin R2 > 0.97CV = 1.03%
101.6% 7.99% 11.07% 50 64.1
Muscle/Tylosin R2 > 0.99CV = 6.85%
61.1% 1.7% 2.0% 25 25.9
Liver/Tylosin R2 > 0.98CV = 0.34%
105.3% 7.77% 13.76% 50 66.03
Table 2. Tylosin concentration in feathers after oral adminis-tration of a dose of 32 mg kg−1 of tylosin tartrate (80% w/w),for 5 days.
MatrixSamplepoint
Post-treatment
dayLifetime (in
days)
Tylosin averageconcentration(µg kg−1)
Feathers 1 4 30 9246.532 7 33 3001.933 9 35 1710.594 11 37 664.775 13 39 552.236 15 41 356.59
Figure 2. Depletion-time for tylosin concentrations. Calculated depletion time in broiler chicken feathers was 27 days when plottedagainst a cut-off value equivalent to the LOD of the analytical methodology (50 µg kg−1).
454 J. CORNEJO ET AL.
studies, our results indicate that these drugs bioac-cumulate at high concentration levels in feathersfrom birds that have been treated with them, andeven though the established WDT for a given phar-maceutical formulation has been fulfilled.
The importance of studying antimicrobial con-centration levels present in feathers is due to theinclusion of feather meal as an ingredient in thediet of other animals that are destined for humanconsumption. In fact, it is been calculated thatapproximately 37% of the live weight of poultry isnot directly consumed by human beings but insteadbecomes a source of raw material for animal food(Meeker and Hamilton 2006; Divakala et al. 2009).
Tylosin depletion from feather samples was slowthroughout this study and concentration levels werehigh. Such high levels cannot be attributed to foreigncontamination as our birds were reared in cages withan elevated mesh floor, precisely to avoid faecal con-tamination, and their only sources for food and waterwere not medicated. Unlike feather samples, edibletissues exhibited fast depletion for tylosin thatbrought concentration levels down to <50 μg kg−1
(LOD for the technique) as soon as day 4 after treat-ment. These results are consistent with those reportedfor edible tissues by other authors (Kowalski et al.2001; Lewicki 2006; Vandenberge et al. 2012).
Our work shows that tylosin concentration levelsin feather samples remained elevated throughout thewhole experiment, even though in muscle samplesthese fell below the established MRL (100 µg kg−1).Such high concentration levels in feather samplescould be explained by tylosin’s pharmacokineticcharacteristics, such as being readily absorbed atthe gastrointestinal level, having low plasma proteinbinding affinity (hence it is widely distributed inbody fluids and tissues) and is highly soluble inlipids (Lewicki 2006; Vandenberge et al. 2012),which means it could possibly reach high concentra-tion levels in peripheral tissues such as skin andfeathers. It could also be due to contamination bysecretions from the uropygial gland (mainly com-posed of fatty acids and esters), that birds widelydistribute over their plumage when grooming them-selves (Sandilands et al. 2004). Furthermore, Cornejoet al. (2011) point to growth and moulting as stagesthat would determine drug kinetics within feathersthemselves. Additionally, the highly vascular pulpwithin the calamus is reabsorbed into the skin as
feathers mature and could release the drug back aftertherapy has been discontinued. In turn, this couldhelp explain the slow elimination of a drug in birds.
Feathers are, therefore, an important re-entryroute for antimicrobial drugs into the food chain;an event that presents a significant risk to publichealth, especially in regards to development of anti-microbial resistance. Hence, it becomes imperativemonitoring and controlling that animal diets do notinclude in their formulation feathers that have beensourced from animals who were treated with anti-microbial drugs.
Finally, our results also allow us to reinforce aproposal stated not long ago by other authors, thatfeathers are a suitable analytical matrix for detect-ing antimicrobial drugs, such as tylosin, in thecontext of poultry farming (Jansen et al. 2016;Wegh et al. 2016).
Disclosure statement
No potential conflict of interest was reported by the authors.
Funding
This work was supported by CONICYT (Comisión Nacionalde Investigación Científica y Tecnológica) via theFONDECYT Initiation into Research [Grant number11140530].
References
Anadón A, Gamboa F, Martínez MA, Castellano V, MartínezM, Ares I, Ramos E, Suarez FH, Martínez-Larrañaga MR.2012. Plasma disposition and tissue depletion of chlorte-tracycline in the food producing animals, chickens forfattening. Food Chem Toxicol. 50:2714–2721.
Arunlertaree C, Moolthongnoi C. 2008. The use of fermentedfeather meal for replacement of fish meal in the diet oforeochromis niloticus. Environ Nat Resour J. 6:13–24.
Berendsen BJ, Bor G, Gerritsen HW, Jansen LJ, Zuidema T.2013. The disposition of oxytetracycline to feathers afterpoultry treatment. Food Addit Contam A. 30:2102–2107.
Beyene T. 2016. Veterinary drug residues in food-animalproducts: its risk factors and potential effects on publichealth. J Vet Sci Technol. 7::285–292.
Civitareale C, Fiori M, Ballerini A, Brambilla G. 2004.Identification and quantification method of spiramycinand tylosin in feedingstuffs with HPLC–UV/DAD at1ppm level. J Pharm Biomed Anal. 36:317–325.
Cornejo J, Lapierre L, Iragüen D, Pizarro N, Hidalgo H, SanMartín B. 2011. Depletion study of three formulations of
FOOD ADDITIVES & CONTAMINANTS: PART A 455
flumequine in edible tissues and drug transfer into chickenfeathers. J Vet Pharmacol Ther. 34:168–175.
Cornejo J, Pokrant E, Krogh M, Briceño C, Hidalgo H,Maddaleno A, Araya C, San Martín B. 2017.Determination of oxytetracycline and 4-epi-oxytetracy-cline residues in feathers and edible tissues of broilerchickens using liquid chromatography coupled with tan-dem mass spectrometry. J Food Prot. 80:619–625.
Cornejo J, Pokrant E, Riquelme R, Briceño C, Maddaleno A,Araya-Jordán C, San Martin B. 2017. Single-laboratoryvalidation of an LC-MS/MS method for determining flor-fenicol (FF) and florfenicol amine (FFA) residues inchicken feathers and application to a residue-depletionstudy. Food Addit Contam A. 34:469–476.
Cornejo-Kelly J, González P, Araya C, Maddaleno A, SanMartin B. 2012. Transfer and depletion of enrofloxacinand its metabolite ciprofloxacin in feathers of treatedbroiler chickens. In: Schilt R, editor. EuroResidues VII2012. Proceedings of the EuroResidue VII Conference onResidues of Veterinary Drugs in Food; May 14–16;Egmond aan Zee. Egmond aan Zee: Board of theEuroResidue Conferences Foundation; p. 683–688.
De Liguoro M, Montesissa C, Anfossi P, Angeletti R. 1998.Determination of tylosin residues in pig tissues usinghigh-performance liquid chromatography. Analyst.123:1279–1282.
Divakala KC, Chiba LI, Kamalakar RB, Rodning SP, WellesEG, Cummins KA, Swann J, Cespedes F, Payne RL. 2009.Amino acid supplementation of hydrolyzed feather mealdiets for finisher pigs. J Anim Sci. 87:1270–1281.
[EC] European Commission. 2002. Commission decision of12 August 2002 implementing Council Directive 96/23/ECconcerning the performance of analytical methods and theinterpretation of results. Off J Eur Commun. L221:8–36.
[EC] European Commission. 2010. Commission regulation(EU) No 37/2010 of 22 December 2009 on pharmacologi-cally active substances and their classification regardingmaximum residue limits in foodstuffs of animal origin. OffJ Eur Commun. L15:1–72.
[EMA] European Medicines Agency. 2002. Committee forveterinary medicinal products. London (UK): JanuaryVeterinary Medicines and Information Technology.
[EMA] European Medicines Agency. 2009. VICH GL48Studies to evaluate the metabolism and residue kineticsof veterinary drugs in food-producing animals: marker-residue-depletion studies to establish product withdrawalperiods. [London (UK)]: Committee for VeterinaryMedicinal Products; [accessed 2017 Aug 2]. http://www.ema.europa.eu/docs/en_GB/document_library/Scientific_guideline/2011/04/WC500105052.pdf.
[EMA] European Medicines Agency. 2016. Guideline onapproach towards harmonization of withdrawal periodsEMA/CVMP/SWP/735325/2012 [draft]. [London (UK)]:Committee for Veterinary Medicinal Products; [accessed2017 Aug 2]. http://www.ema.europa.eu/docs/en_GB/document_library/Scient i f ic_guidel ine/2016/07/WC500210929.pdf.
[EPCEU] European Parliament and Council of the EuropeanUnion. 2010. Directive 2010/63/EU of the EuropeanParliament and of the Council of 22 September 2010 onthe protection of animals used for scientific purposes. OffJ Eur Commun. L176:33–79.
Jansen L, Bolck Y, Berendsen B. 2016. Feather segmentationanalysis for monitoring off-label use of antibiotics in thepoultry sector. In: [Unknown editor]. Euro Residue VIII2016. Proceedings of the EuroResidue VIII Conference onResidues of Veterinary Drugs in food; May 23–25;Egmond aan Zee. Egmond aan Zee: Board of theEuroResidue Conferences Foundation; p. 175.
Jeong S-H, Kang D, Lim M-W, Kang C-S, Sung H-J. 2010.Risk assessment of growth hormones and antimicrobialresidues in meat. Toxicol Res. 26:301–313.
Ji L-W, Dong L-L, Ji H, Feng X-W, Li D, Ding R-L, Jiang S-X.2014. Comparative pharmacokinetics and bioavailability oftylosin tartrate and tylosin phosphate after a single oral andiv administration in chickens. J Vet Pharmacol Ther.37:312–315.
Kan CA, Petz M. 2000. Residues of veterinary drugs in eggsand their distribution between yolk and white. J AgricFood Chem. 48:6397–6403.
Kowalski C, Roliński Z, Zań R, Wawron W. 2001.Pharmacokinetics of tylosin in broiler chickens. Pol J VetSci. 5:127–130.
Landoni MF, Albarellos G. 2015. The use of antimicrobialagents in broiler chickens. Vet J. 205:21–27.
Lewicki J. 2006. Tylosin A review of pharmacokinetics, resi-dues in food animals and analytical methods. Warsaw:United Nations Food and Agriculture Organization.
Love DC, Halden RU, Davis MF, Nachman KE. 2012.Feather meal: a previously unrecognized route for re-entry into the food supply of multiple pharmaceuticalsand personal care products (PPCPs). Environ SciTechnol. 46:3795–3802.
Meeker D, Hamilton C. 2006. An overview of the renderingindustry. In: Meeker D, editor. Essentials of rendering: allabout the animal by-product industry. Arlington (VA):National Renderers Association; p. 1–16.
Mestorino N, Daniele M, Dade M, Vedovato V, Marchetti M.2016. Enrofloxacin and ciprofloxacin residues in broilerchicken feathers after oral administration. In: [Unknowneditor]. Euro Residue VIII 2016. Proceedings of theEuroResidue VIII Conference on Residues of VeterinaryDrugs in food; May 23–25; Egmond aan Zee. Egmond aanZee: Board of the EuroResidue Conferences Foundation;p. 519–523.
Muñoz R, Cornejo J, Maddaleno A, Araya C, Iragüen D,Pizarro N, San Martín B. 2014. Withdrawal times of oxy-tetracycline and tylosin in eggs of laying hens after oraladministration. J Food Protect. 77:1017–1021.
Nachman KE, Raber G, Francesconi KA, Navas-Acien A,Love DC. 2012. Arsenic species in poultry feather meal.Sci Total Environ. 417–418:183–188.
Nasr JJ, Shalan S, Belal F. 2014. Simultaneous determinationof tylosin and josamycin residues in muscles, liver, eggs
456 J. CORNEJO ET AL.
and milk by MLC with a monolithic column and time-programmed UV detection: application to baby food andformulae. Chem Cent J. 8:37.
Prats C, El Korchi G, Francesch R, Arboix M, Pérez B. 2002.Tylosin depletion from edible pig tissues. Res Vet Sci.73:323–325.
San Martin B, Cornejo J, Iraguen D, Hidalgo H, Anadon A.2007. Depletion study of enrofloxacin and its metaboliteciprofloxacin in edible tissues and feathers of whiteleghorn hens by liquid chromatography coupled withtandem mass spectrometry. J Food Prot. 70:1952–1957.
Sandilands V, Savory J, Powell K. 2004. Preen gland functionin layer fowls: factors affecting morphology and featherlipid levels. Comp Biochem Physiol A. 137:217–225.
Soliman A, Sedeik M. 2016. Pharmacokinetics and tissueresidues of tylosin in broiler chickens. Pharmacol Pharm.7:36–42.
Vandenberge V, Delezie E, Delahaut P, Pierret G, De BackerP, Daeseleire E, Croubels S. 2012. Transfer of flubendazoleand tylosin from feed at cross-contamination levels tovarious poultry matrices. Poult Sci. 91:2351–2360.
Wegh R, Berendsen B, Blokland M, Zuidema T, Sterk S. 2016.Hair and feathers: the matrix of choice for antedating theuse of antibiotics, β-agonists and steroidesters? In:[Unknown editor]. Euro Residue VIII 2016. Proceedingsof the EuroResidue VIII Conference on Residues ofVeterinary Drugs in food; May 23–25; Egmond aan Zee.Egmond aan Zee: Board of the EuroResidue ConferencesFoundation; p. 175.
FOOD ADDITIVES & CONTAMINANTS: PART A 457