Embed Size (px)
Citation preview
DEPENDENT CHILDREN IN WASHINGTON STATE: CASE TIMELINESS AND OUTCOMES
2020Annual Report

This page left intentionally blank.

Dependent Children in Washington State:Case Timeliness and Outcomes2020 Annual Report
Produced by the Washington State Center for Court Research
Dr. Carl McCurley, ManagerMatt Orme, Senior Research AssociateCindy Bricker, Court Improvement Program SupervisorRachael Sanford, Research Assistant
Administrative Office of the CourtsWashington State Center for Court ResearchPO BOX 41170Olympia, WA 98504-1170(360) [email protected]
Other staff contributors: Wei Wang and Susan GouletOther external contributors: Department of Children, Youth, and Families; Court Improvement Training Academy; and DSHS Research and Data Analysis.
Photos: The images used on the cover and throughout this report are of models and are used for illustrative purposes only.
Recommended Citation:Orme, M.; McCurley, C.; Bricker, C.; Sanford, R.; Wang, W. (2021) Dependent Children in Washington State Case Timeliness and Outcomes, 2020 Annual Report. Olympia, WA: Center for Court Research, Administrative Office of the Courts.

TABLE OF CONTENTSINTRODUCTION . . . . . . . . . . . . . . . . . . . . . . . . . . . . . . . . . . . . . . . . . . . . . . . . 1Case Volumes and Filing Trends . . . . . . . . . . . . . . . . . . . . . . . . . . . . . . . . . . . . . . . . . . . . . . .2Dependency Filings and Rates by County . . . . . . . . . . . . . . . . . . . . . . . . . . . . . . . . . . . . . . .3
OBJECTIVES . . . . . . . . . . . . . . . . . . . . . . . . . . . . . . . . . . . . . . . . . . . . . . . . . . . 4Objective 1: Fact-Finding within 75 Days . . . . . . . . . . . . . . . . . . . . . . . . . . . . . . . . . . . . . . . .5Objective 2: Review Hearing every 6 Months . . . . . . . . . . . . . . . . . . . . . . . . . . . . . . . . . . . .7Objective 3: Permanency Planning Hearing within 12 Months . . . . . . . . . . . . . . . . . . . . .11Objective 4: Permanency Achieved before 15 Months of Out-of-Home Care . . . . . . . . . .15Objective 5: Termination of Parental Rights Petition Filed within 15 Months of Out-of-Home Care . . . . . . . . . . . . . . . . . . . . . . . . . . . . . . . . . . . . . . . . . . . . . . . . . . . . . . . .18Objective 6: Adoption Completed within 6 Months of Termination Order . . . . . . . . . . . .21Objective 7: Prior Dependency Statewide . . . . . . . . . . . . . . . . . . . . . . . . . . . . . . . . . . . . . .23
CAREGIVER NOTIFICATIONS AND CAREGIVER REPORTS . . . . . . . . . . 25
PROGRAMS . . . . . . . . . . . . . . . . . . . . . . . . . . . . . . . . . . . . . . . . . . . . . . . . . . . 26Dependency Court Improvement Efforts . . . . . . . . . . . . . . . . . . . . . . . . . . . . . . . . . . . . . . .26Court Improvement Program . . . . . . . . . . . . . . . . . . . . . . . . . . . . . . . . . . . . . . . . . . . . . . . . . . .26Continuous Quality Improvement . . . . . . . . . . . . . . . . . . . . . . . . . . . . . . . . . . . . . . . . . . . . . . .27Court Improvement Training Academy . . . . . . . . . . . . . . . . . . . . . . . . . . . . . . . . . . . . . . . . . . .28Early Engagement Strategies . . . . . . . . . . . . . . . . . . . . . . . . . . . . . . . . . . . . . . . . . . . . . . . . . .30 Family First Prevention Services Act . . . . . . . . . . . . . . . . . . . . . . . . . . . . . . . . . . . . . . .30 Family Practice Model . . . . . . . . . . . . . . . . . . . . . . . . . . . . . . . . . . . . . . . . . . . . . . . . . .32 Family Time . . . . . . . . . . . . . . . . . . . . . . . . . . . . . . . . . . . . . . . . . . . . . . . . . . . . . . . . . .34 Finding Fathers in Dependency Cases. . . . . . . . . . . . . . . . . . . . . . . . . . . . . . . . . . . . . .36 Mediation and Settlement Conferences . . . . . . . . . . . . . . . . . . . . . . . . . . . . . . . . . . . . .36 Meeting the Needs of Infants, Toddlers and Their Families . . . . . . . . . . . . . . . . . . . . . .38 Parents for Parents Program . . . . . . . . . . . . . . . . . . . . . . . . . . . . . . . . . . . . . . . . . . . . .40 Permanency from Day One (PFD1)—Federal Grant . . . . . . . . . . . . . . . . . . . . . . . . . . .42Local Intiatives to Improve Courts . . . . . . . . . . . . . . . . . . . . . . . . . . . . . . . . . . . . . . . . . . . . . . .44 Family and Juvenile Court Improvement Program . . . . . . . . . . . . . . . . . . . . . . . . . . . . .44 Family Treatment Courts . . . . . . . . . . . . . . . . . . . . . . . . . . . . . . . . . . . . . . . . . . . . . . . .47Collaboration with Other Child Welfare Partners . . . . . . . . . . . . . . . . . . . . . . . . . . . . . . . . . . . .48 Children’s Representation Program . . . . . . . . . . . . . . . . . . . . . . . . . . . . . . . . . . . . . . . .48 Child Advocates / Court Appointed Special Advocates. . . . . . . . . . . . . . . . . . . . . . . . . .50 The Commission on Children in Foster Care . . . . . . . . . . . . . . . . . . . . . . . . . . . . . . . . .52 Extended Foster Care. . . . . . . . . . . . . . . . . . . . . . . . . . . . . . . . . . . . . . . . . . . . . . . . . . .53 Indian Child Welfare Act Projects . . . . . . . . . . . . . . . . . . . . . . . . . . . . . . . . . . . . . . . . . .54 Innovative Dependency Court Collaborative . . . . . . . . . . . . . . . . . . . . . . . . . . . . . . . . .55 Parent’s Representation Program . . . . . . . . . . . . . . . . . . . . . . . . . . . . . . . . . . . . . . . . .56 Washington’s Program Improvement Plan . . . . . . . . . . . . . . . . . . . . . . . . . . . . . . . . . . .57 Youth Leadership Summit. . . . . . . . . . . . . . . . . . . . . . . . . . . . . . . . . . . . . . . . . . . . . . . .60

APPENDICES . . . . . . . . . . . . . . . . . . . . . . . . . . . . . . . . . . . . . . . . . . . . . . . . . . 61Appendix A: FJCIP . . . . . . . . . . . . . . . . . . . . . . . . . . . . . . . . . . . . . . . . . . . . . . . . . . . . . . . . .61Appendix B: Demographics . . . . . . . . . . . . . . . . . . . . . . . . . . . . . . . . . . . . . . . . . . . . . . . . . .61Appendix C: County Level Data . . . . . . . . . . . . . . . . . . . . . . . . . . . . . . . . . . . . . . . . . . . . . . .61
Adams . . . . . . . . . . . . . . . . . . . . . . . . . . . . . . . . . . . . . . . . . . . . . . . . . . . . . . . . . . . . . .C-6Asotin . . . . . . . . . . . . . . . . . . . . . . . . . . . . . . . . . . . . . . . . . . . . . . . . . . . . . . . . . . . . .C-10Benton . . . . . . . . . . . . . . . . . . . . . . . . . . . . . . . . . . . . . . . . . . . . . . . . . . . . . . . . . . . . .C-14Chelan . . . . . . . . . . . . . . . . . . . . . . . . . . . . . . . . . . . . . . . . . . . . . . . . . . . . . . . . . . . . .C-18Clallam . . . . . . . . . . . . . . . . . . . . . . . . . . . . . . . . . . . . . . . . . . . . . . . . . . . . . . . . . . . . .C-22Clark . . . . . . . . . . . . . . . . . . . . . . . . . . . . . . . . . . . . . . . . . . . . . . . . . . . . . . . . . . . . .C-26Columbia . . . . . . . . . . . . . . . . . . . . . . . . . . . . . . . . . . . . . . . . . . . . . . . . . . . . . . . . . . . . .C-30Cowlitz . . . . . . . . . . . . . . . . . . . . . . . . . . . . . . . . . . . . . . . . . . . . . . . . . . . . . . . . . . . . .C-34Douglas . . . . . . . . . . . . . . . . . . . . . . . . . . . . . . . . . . . . . . . . . . . . . . . . . . . . . . . . . . . . .C-38Ferry . . . . . . . . . . . . . . . . . . . . . . . . . . . . . . . . . . . . . . . . . . . . . . . . . . . . . . . . . . . . .C-42Franklin . . . . . . . . . . . . . . . . . . . . . . . . . . . . . . . . . . . . . . . . . . . . . . . . . . . . . . . . . . . . .C-46Garfield . . . . . . . . . . . . . . . . . . . . . . . . . . . . . . . . . . . . . . . . . . . . . . . . . . . . . . . . . . . . .C-50Grant . . . . . . . . . . . . . . . . . . . . . . . . . . . . . . . . . . . . . . . . . . . . . . . . . . . . . . . . . . . . .C-54Grays Harbor . . . . . . . . . . . . . . . . . . . . . . . . . . . . . . . . . . . . . . . . . . . . . . . . . . . . . . . . . . . . .C-58Island . . . . . . . . . . . . . . . . . . . . . . . . . . . . . . . . . . . . . . . . . . . . . . . . . . . . . . . . . . . . .C-62Jefferson . . . . . . . . . . . . . . . . . . . . . . . . . . . . . . . . . . . . . . . . . . . . . . . . . . . . . . . . . . . . .C-66King . . . . . . . . . . . . . . . . . . . . . . . . . . . . . . . . . . . . . . . . . . . . . . . . . . . . . . . . . . . . .C-70Kitsap . . . . . . . . . . . . . . . . . . . . . . . . . . . . . . . . . . . . . . . . . . . . . . . . . . . . . . . . . . . . .C-74Kittitas . . . . . . . . . . . . . . . . . . . . . . . . . . . . . . . . . . . . . . . . . . . . . . . . . . . . . . . . . . . . .C-78Klickitat . . . . . . . . . . . . . . . . . . . . . . . . . . . . . . . . . . . . . . . . . . . . . . . . . . . . . . . . . . . . .C-82Lewis . . . . . . . . . . . . . . . . . . . . . . . . . . . . . . . . . . . . . . . . . . . . . . . . . . . . . . . . . . . . .C-86Lincoln . . . . . . . . . . . . . . . . . . . . . . . . . . . . . . . . . . . . . . . . . . . . . . . . . . . . . . . . . . . . .C-90Mason . . . . . . . . . . . . . . . . . . . . . . . . . . . . . . . . . . . . . . . . . . . . . . . . . . . . . . . . . . . . .C-94Okanogan . . . . . . . . . . . . . . . . . . . . . . . . . . . . . . . . . . . . . . . . . . . . . . . . . . . . . . . . . . . . .C-98Pacific . . . . . . . . . . . . . . . . . . . . . . . . . . . . . . . . . . . . . . . . . . . . . . . . . . . . . . . . . . . .C-102Pend Oreille . . . . . . . . . . . . . . . . . . . . . . . . . . . . . . . . . . . . . . . . . . . . . . . . . . . . . . . . . . . .C-106Pierce . . . . . . . . . . . . . . . . . . . . . . . . . . . . . . . . . . . . . . . . . . . . . . . . . . . . . . . . . . . . C-110San Juan . . . . . . . . . . . . . . . . . . . . . . . . . . . . . . . . . . . . . . . . . . . . . . . . . . . . . . . . . . . . C-114Skagit . . . . . . . . . . . . . . . . . . . . . . . . . . . . . . . . . . . . . . . . . . . . . . . . . . . . . . . . . . . . C-118Skamania . . . . . . . . . . . . . . . . . . . . . . . . . . . . . . . . . . . . . . . . . . . . . . . . . . . . . . . . . . . .C-122Snohomish . . . . . . . . . . . . . . . . . . . . . . . . . . . . . . . . . . . . . . . . . . . . . . . . . . . . . . . . . . . .C-126Spokane . . . . . . . . . . . . . . . . . . . . . . . . . . . . . . . . . . . . . . . . . . . . . . . . . . . . . . . . . . . .C-130Stevens . . . . . . . . . . . . . . . . . . . . . . . . . . . . . . . . . . . . . . . . . . . . . . . . . . . . . . . . . . . .C-134Thurston . . . . . . . . . . . . . . . . . . . . . . . . . . . . . . . . . . . . . . . . . . . . . . . . . . . . . . . . . . . .C-138Wahkiakum . . . . . . . . . . . . . . . . . . . . . . . . . . . . . . . . . . . . . . . . . . . . . . . . . . . . . . . . . . . .C-142Walla Walla . . . . . . . . . . . . . . . . . . . . . . . . . . . . . . . . . . . . . . . . . . . . . . . . . . . . . . . . . . . .C-146Whatcom . . . . . . . . . . . . . . . . . . . . . . . . . . . . . . . . . . . . . . . . . . . . . . . . . . . . . . . . . . . .C-150Whitman . . . . . . . . . . . . . . . . . . . . . . . . . . . . . . . . . . . . . . . . . . . . . . . . . . . . . . . . . . . .C-154Yakima . . . . . . . . . . . . . . . . . . . . . . . . . . . . . . . . . . . . . . . . . . . . . . . . . . . . . . . . . . . .C-158

1
April 30, 2021
INTRODUCTION
This edition of the DEPENDENT CHILDREN IN WASHINGTON STATE: CASE TIMELINESS AND OUTCOMES adds data from 2020 to the ongoing series of dependency performance reporting produced by the Administrative Office of the Courts. Of course 2020 was a year like no other in recent times. The impacts of the COVID-19 pandemic, which was first noticed early in the year, have been pervasive:
• Court closures and virtual hearings created a challenge for courts to provide essential court functions, implement new technologies, and keep information flowing across the court community.
• With pandemic-related court closures and reduced capacity to hear cases, hearing schedules were thrown into disarray and continuances granted. The impact on all timeliness indicators was predictable as case processing slowed substantially.
• The AOC and courts sought to record the pandemics impact and so created a new public health emergency code to track hearing continuances due to COVID.
• There was a sharp decline in the number of dependency cases filed in court. Some experts predict that dependency case filings will increase when the pandemic restrictions are lifted and mandated reporters have more direct contact with children and families.
This report and the other components of Washington State’s Dependency Timeliness Reporting Program—the
Dependency Dashboard and the Interactive Dependency Timeliness Report—are used by the courts and other institutional actors in child welfare to track process and outcomes, to plan improvements, and to follow the impact of local- and state-level innovations to the dependency system. The Reporting Program also provides helpful perspective on the impact of COVID-19 on court handling of dependency cases.
Support from the federal Court Improvement Program (CIP) and the inspired work of the many people involved in all
stages, from data development to engagement with local-level court-based teams, have propelled the Reporting Program into the first rank of all such programs in the United States. We hope to continually improve our use of data from the courts, the Department of Children, Youth, and Families, and from other sources to guide our decisions about how to improve outcomes for vulnerable children and families. Sincerely,
Steven C. González Chief Justice Washington State Supreme Court

2
CASE VOLUMES AND FILING TRENDS
–
2014 2015 2016 2017 2018 2019 2020DEP Filings 5,053 4,863 4,830 4,976 4,600 4,282 3,242Dismissal Counts 4,956 4,755 4,419 4,706 4,488 4,826 4,391TER Filings 1,936 1,757 1,883 2,049 1,901 1,477 1,295DEP Rate per 1,000 3.18 3.03 2.97 3.02 2.76 2.54
3.18 3.03 2.97 3.022.76
2.54
0
1
2
3
4
0
500
1,000
1,500
2,000
2,500
3,000
3,500
4,000
4,500
5,000
5,500
Exhibit 1. Dependency and Termination Filings with Dependency Ratesper 1000 Child Population and Yearly Dismissal Counts 2014–2020
Dependency filings decreased in 2020 by over 24%. Dependency filing rates (per 1,000 children in general population) fell to 2.54 in 2019. Dismissals on dependency cases dropped 9%, while termination filings dropped by over 12%.

3
DEPENDENCY FILINGS AND RATES BY COUNTY
This map illustrates a statewide county comparison of dependency filing numbers (in parentheses) and filing rate per 1,000 child population for 2019. The larger the circle the higher the filing rate. Statewide there were 4,282 dependency petitions filed and the filing rate was 2.54.

4
OBJECTIVES
This report on dependency case processing presents analysis of timeliness of certain events in court cases for children involved in the child welfare system. The timeliness standards for these events are all specified in federal or state law, and the set of standards were initially identified by staff at the Administrative Office of the Courts (AOC) working with the Family and Juvenile Law Committee of the Superior Court Judges’ Association and the Department of Children, Youth, and Families (DCYF).
The Washington State Center for Court Research (WSCCR), which produces this report, continually checks with the organizations—courts, DCYF, the Attorney General’s Office (AGO), the Office of Public Defense (OPD), court-appointed special advocates, and the Legislature—on possible improvements to the report that will make it more useful to recipients. In response to the ongoing feedback from groups of report users, and as part of WSCCR’s commitment toContinuous Quality Improvement, WSCCR has added detail to some aspects of the report, such as separate analyses for the timeliness of specific permanency outcomes (adoption, aging out, emancipation, guardianship, and reunification), demographic analysis of court-involved dependent children, number and rate of dependency filings per year, and re-dependencies into the system for each court.
This annual report reflects all of the juvenile dependency and termination cases that were filed in Washington’s courts from January 2000 through December 2020. Court records from the AOC’s superior court case management system (CMS) were matched with information from the DCYF’s FamLink system. Information relevant to each of the performance measures represents a subset of these matched cases that were documented before January 1, 2021.
The 2020 Dependency Timeliness Report used dependency case data now available in the AOC's Enterprise Data Repository Statewide Data Warehouse (EDRSDW). The new statewide data warehouse includes dependency data from all 39 superior courts in Washington. Prior years’ Dependency Timeliness Reports used dependency data from the case management applications managed by the AOC. As of November 2018, King County Superior Court transitioned to a locally implemented and maintained case management system. At that time, King County Superior Court case information and activity data was sent and stored in the AOC’s Enterprise Data Repository (EDR), but the information could not be reported from that data source. In order to report all 39 superior courts’ dependency data, the new statewide data warehouse had to be completed. In 2020 extensive work was performed to verify data and implement the statewide data warehouse to report on dependency data. These efforts made it possible to return to statewide reporting of dependency timeliness data for 2020.
ADMINISTRATIVE OFFICE OF THE COURTS' ENTERPRISE DATA REPOSITORY STATEWIDE DATA WAREHOUSE

5
Measures:
1) percent of cases with fact-finding within 75 days of the petition; and
2) median number of days to fact-finding.
RCW 13.34.070(1): The fact-finding hearing on the petition shall be held no later than seventy-five days after the filing of the petition, unless exceptional reasons for a continuance are found.
Fact-finding is one of the first major judicial events in the dependency process, and significant delays to fact-finding may prolong court involvement and increase the amount of time a child spends in foster care. To evaluate case processing with respect to this performance measure, court data from the AOC's CMS was used to calculate the number of days to the first fact-finding hearing. However, in some instances—such as parties stipulating to a finding of dependency and waiving a fact-finding hearing, or a case dismissal prior to the hearing—action is takenon the petition without a formal hearing. In such cases where a fact-finding hearing is not documented in the CMS, the length of time from the petition to the first order of dependency or an order of dismissal was used as an imputed time to fact-finding interval.
The rate of compliance for 2020 dropped 18% from the previous reporting year to 47%. Note that cases are included in the year in which the fact-finding hearing is due, not the year in which the petition is filed.
OBJECTIVE 1: FACT-FINDING OBJECTIVE 1: FACT-FINDING WITHIN 75 DAYSWITHIN 75 DAYS
68 68 7065
47
0
20
40
60
80
100
2016 2017 2018 2019 2020
Exhibit 2. Percent of Cases with Fact-Finding within 75 Days of Petition

6
64 66 64 6674
0
20
40
60
80
100
2016 2017 2018 2019 2020
Exhibit 3. Median Number of Days from Fact-Finding to Petition
The median number of days from the date the dependency petition is filed to the fact-finding hearing rose to 74 days in 2020.
Exhibit 4 illustrates fact-finding compliance for Family and Juvenile Court Improvement Program (FJCIP) counties compared to the rest of the state.
69 69 7267
49
0
20
40
60
80
100
2016 2017 2018 2019 2020
Exhibit 4. Percent of Cases with Fact-Finding within 75 Days of Petition—FJCIP
– – – Statewide

7
Measures:
1) percent of first dependency review hearings within six months;
2) median number of days to first review hearing;
3) percent of all dependency review hearings within six months; and
4) median number of days to all review hearings .
RCW 13.34.138(1): The status of all children found to be dependent shall be reviewed by the court at least every six months from the beginning date of the placement episode or the date dependency is established, whichever is first. The purpose of the hearing shall be to review the progress of the parties and determine whether court supervision should continue.
The purpose of a review hearing is to assess the progress of the parties and determine whether court supervision should continue. Because the statutorily required due date for the first review hearing is difficult to identify for some cases, this report determines the due date for the first review hearing to be six months from the filing date of the dependency petition.
82 81 85 82
68
0
20
40
60
80
100
2016 2017 2018 2019 2020
Exhibit 5. Percent of First Dependency Review Hearings within Six Months
The rate of compliance for 2020 dropped 14% from the previous reporting year to 68%.
OBJECTIVE 2: REVIEW HEARING OBJECTIVE 2: REVIEW HEARING EVERY 6 MONTHSEVERY 6 MONTHS

8
147 146 145 142154
60
80
100
120
140
160
180
2016 2017 2018 2019 2020
Exhibit 6. Median Number of Days to First Review Hearing
The median number of days from the date the dependency petition is filed to the first review hearing increased to 154 days in 2020.
91 91 93 9383
0
20
40
60
80
100
2016 2017 2018 2019 2020
Exhibit 7. Percent of All Review Hearings Held within 6 Months
The rate of compliance for all review hearings held in 2020 fell 10% from the previous reporting year to 83%.

9
154 154 154 154 155
0
100
200
300
400
2016 2017 2018 2019 2020
Exhibit 8. Median Number of Days to All Review Hearings
The median number of days for all review hearings held in 2020 stayed stable at 155 days.
83 84 86 85
72
0
20
40
60
80
100
2016 2017 2018 2019 2020
Exhibit 9. Percent of First Dependency Review Hearings within Six Months—FJCIP
– – – Statewide
Exhibit 9 illustrates first review hearing compliance for Family and Juvenile Court Improvement Program (FJCIP) counties compared to the rest of the state.

10
92 93 94 9485
0
20
40
60
80
100
2016 2017 2018 2019 2020
Exhibit 10. Percent of Cases with All Review Hearings Held within Six Months—FJCIP
– – – Statewide
Exhibit 10 illustrates all review hearing compliance for Family and Juvenile Court Improvement Program (FJCIP) counties compared to the rest of the state.

11
Measures:
1) percent of cases with first permanency planning hearing within 12 months of placement;
2) median duration from placement to first permanency planning hearing;
3) percent of all dependency permanency planning hearings within 12 months; and
4) median number of days for all permanency planning hearings .
RCW 13.34.145(1)(a): A permanency planning hearing shall be held in all cases where the child has remained in out-of-home care for at least nine months and an adoption decree, guardianship order, or permanent custody order has not previously been entered. The hearing shall take place no later than twelve months following commencement of the current placement episode.
The purpose of a permanency planning hearing is to inquire into the welfare of the child and progress of the case, and to reach decisions regarding permanent placement. In order to calculate a due date for a permanency planning hearing, FamLink data was used to determine the beginning date of the placement episode and the length of time the child was in that placement. If the requisite nine months had passed, the due date for the permanency planning hearing was set at 12 months from the date the placement began.
85 85 86 85
69
0
20
40
60
80
100
2016 2017 2018 2019 2020
Exhibit 11. Percent of Cases with a Permanency Planning Hearing within 12 Months of Placement
The percentage of cases in which the first permanency planning hearing occurred within 12 months of the beginning of the placement episode (meeting the statutory requirement) decreased 16% in 2020 to 69%.
OBJECTIVE 3: PERMANENCY PLANNING OBJECTIVE 3: PERMANENCY PLANNING HEARING WITHIN 12 MONTHSHEARING WITHIN 12 MONTHS

12
9.9 10.0 10.0 10.0 10.2
0.0
2.0
4.0
6.0
8.0
10.0
12.0
2016 2017 2018 2019 2020
Exhibit 12. Median Number of Months to First Permanency Planning Hearing
The median number of months to the first permanency planning hearing remained stable from the previous reporting year. The 2020 median months is 10.2.
91 89 91 9385
0
20
40
60
80
100
2016 2017 2018 2019 2020
Exhibit 13. All Permanency Planning Review Hearings Held within 12 Months
The rate of compliance for all permanency planning hearings held in 2020 fell 8% from the previous reporting year to 85%.

13
88 88 89 89
74
0
20
40
60
80
100
2016 2017 2018 2019 2020– – – Statewide
Exhibit 15. Percent of Cases with a Permanency Planning Hearing within
12 Months of Placement—FJCIP
Exhibit 15 illustrates first permanency hearing compliance for Family and Juvenile Court Improvement Program (FJCIP) counties compared to the rest of the state.
301 305 303 301 308
0
100
200
300
400
2016 2017 2018 2019 2020
Exhibit 14. Median Number of Days to Permanency Planning Review Hearings
The median number of days for all permanency planning hearings held in 2020 rose to 308days.

14
92 91 91 9385
0
20
40
60
80
100
2016 2017 2018 2019 2020
Exhibit 16. Percent of All Permanency Planning Hearings Held within 12 Months—FJCIP
– – – Statewide
Exhibit 16 illustrates all permanency hearing compliance for Family and Juvenile Court Improvement Program (FJCIP) counties compared to the rest of the state.
15
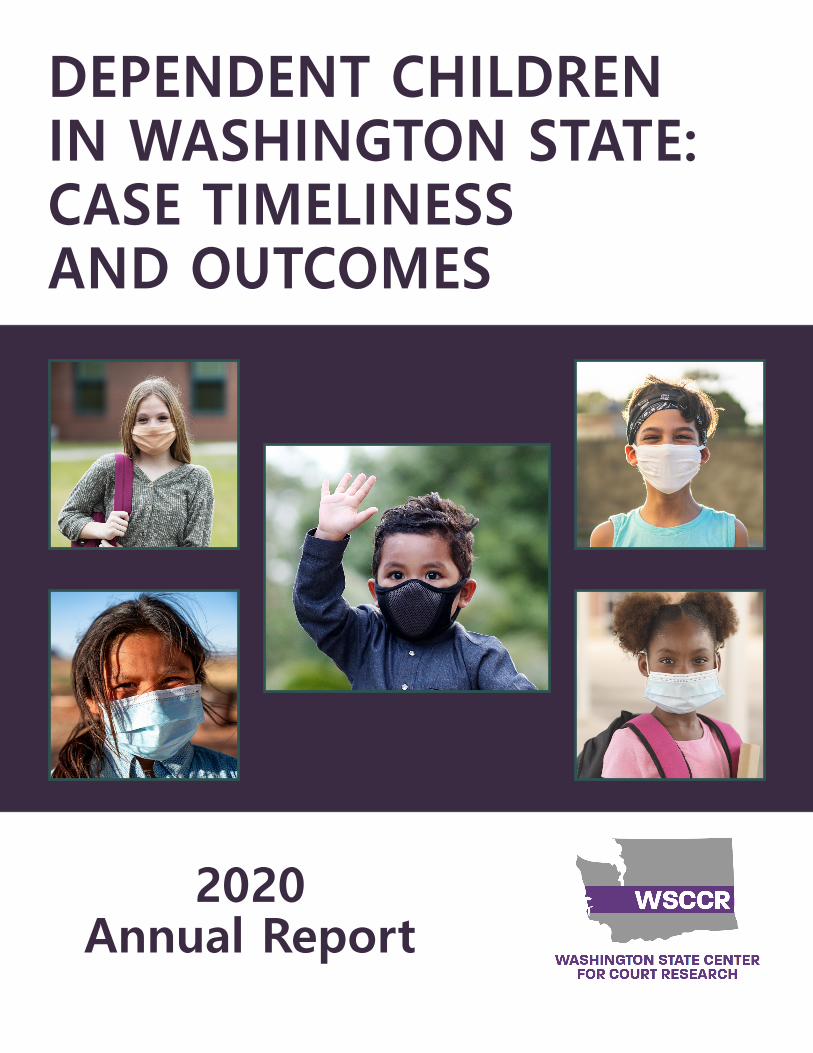
Measures:
1) percent of cases achieving permanency within 15 months of out-of-home care;
2) median number of months spent in out-of-home care prior to final outcome; and
3) percent of cases resulting in reunification before 15 months of out-of-home care .
RCW 13.34.145(1)(c): Permanency planning goals should be achieved at the earliest possible date, preferably before the child has been in out-of-home care for fifteen months.
The goal of state and federal child welfare laws is to provide children with safe, nurturing, and permanent living situations as quickly as possible. Although there is no specific statutory time requirement for achieving permanency, the Washington State Legislature has set a goal of achieving permanency before a child has spent 15 months in out-of-home care. To measure time to permanency, FamLink data was used to identify the length of time spent in out-of-home care. Final permanent outcomes (reunification, adoption, and guardianship) and other outcomes (aging out) were also taken from FamLink. A permanency due date was set as of the date the child reached 15 months in out-of-home care. This indicator shows the percentage of children who had an exit from placement by the 15-month due date, as documented in FamLink.
28 27 27 26 24
0
20
40
60
80
100
2016 2017 2018 2019 2020
Exhibit 17. Percent of Cases Achieving Exit before 15 Months of Out-of-Home Care
Permanency within 15 months of out-of-home care decreased 2% to 24% in 2020.
OBJECTIVE 4: PERMANENCY ACHIEVED BEFORE OBJECTIVE 4: PERMANENCY ACHIEVED BEFORE 15 MONTHS OF OUT-OF-HOME CARE15 MONTHS OF OUT-OF-HOME CARE
16
30 31 32 34 36
43
4855
4752
2627 27 27 24
16 16 16 17 18
05
1015202530354045505560
2016 2017 2018 2019 2020
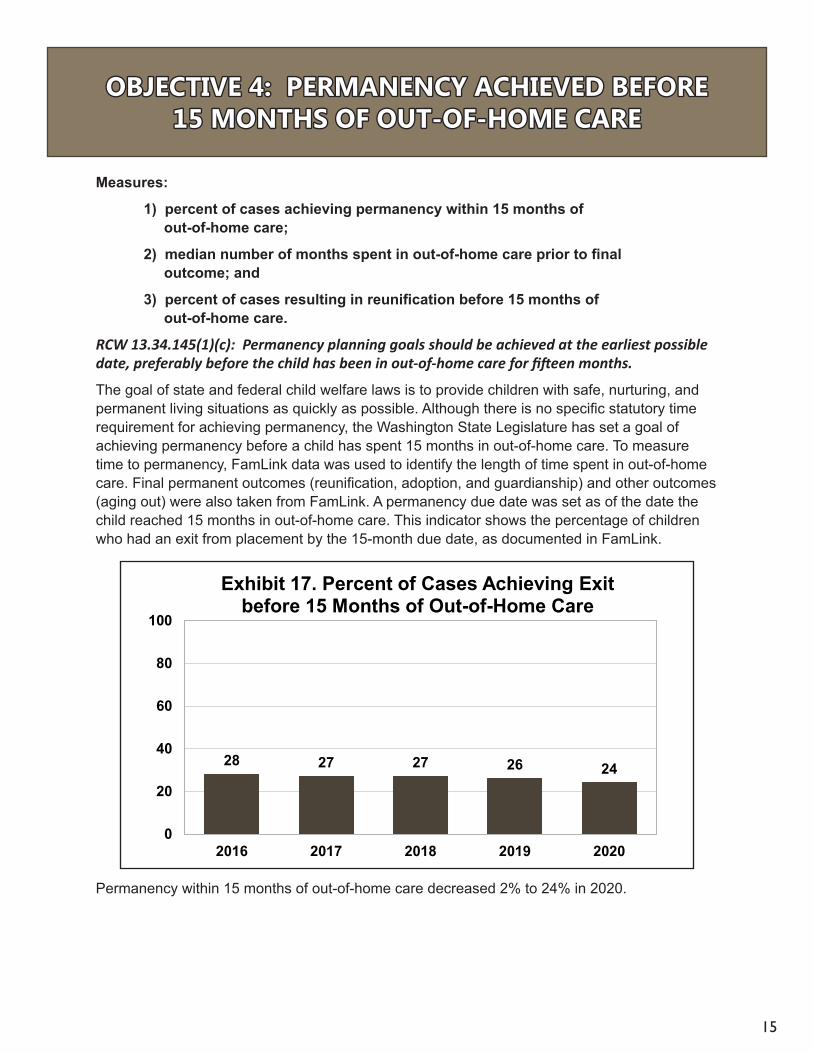
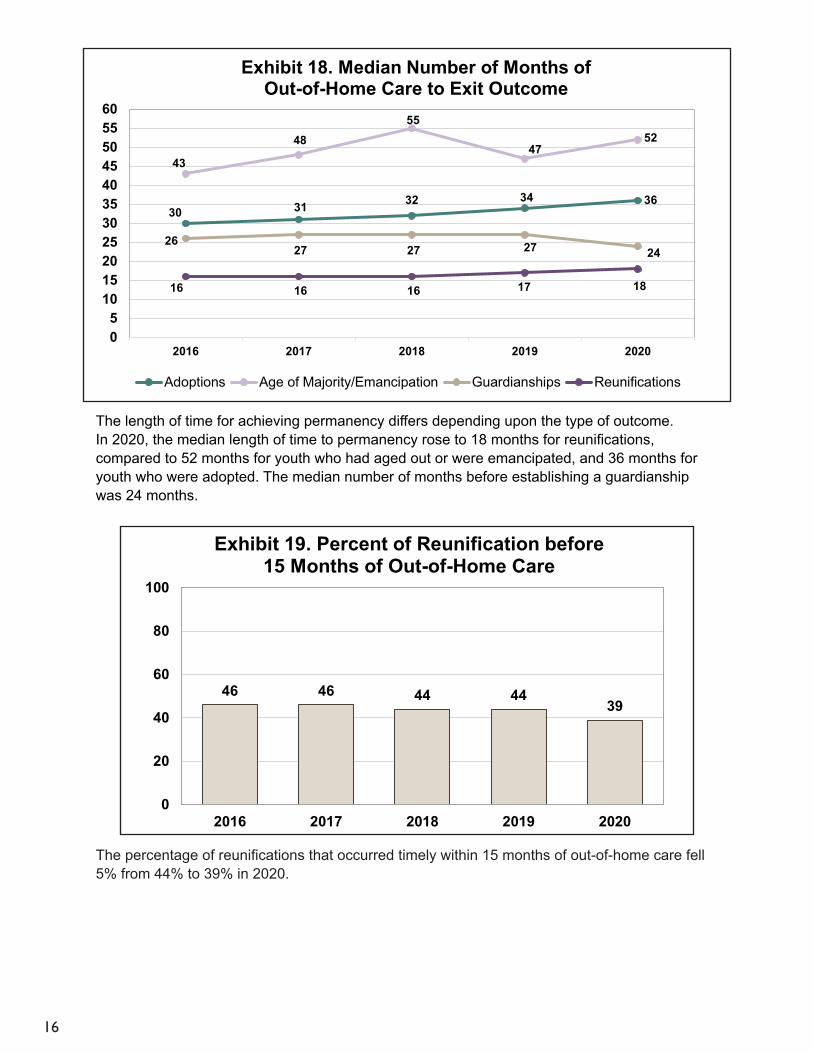
Exhibit 18. Median Number of Months of Out-of-Home Care to Exit Outcome
Adoptions Age of Majority/Emancipation Guardianships Reunifications
The length of time for achieving permanency differs depending upon the type of outcome. In 2020, the median length of time to permanency rose to 18 months for reunifications, compared to 52 months for youth who had aged out or were emancipated, and 36 months for youth who were adopted. The median number of months before establishing a guardianship was 24 months.
46 46 44 4439
0
20
40
60
80
100
2016 2017 2018 2019 2020
Exhibit 19. Percent of Reunification before 15 Months of Out-of-Home Care
The percentage of reunifications that occurred timely within 15 months of out-of-home care fell 5% from 44% to 39% in 2020.

17
30 28 28 27 25
0
20
40
60
80
100
2016 2017 2018 2019 2020
– – – Statewide
Exhibit 20. Percent of Cases Achieving Exit before 15 Months of Out-of-Home Care—FJCIP
Exhibit 20 illustrates permanency within 15 months of out-of-home care compliance for Family and Juvenile Court Improvement Program (FJCIP) counties compared to the rest of the state.
18
Measures:
1) percent of cases with termination of parental rights (TPR) petition filed within 15 months of out-of-home care;
2) median number of months of out-of-home care prior to TPR petition filing; and
3) median number of months from dependency filing to legally free status.
The Adoptions and Safe Families Act (United States Public Law 105-89, section 103) requires states to begin the process of terminating parental rights for certain cases, including those in which children have been in foster care for 15 of the most recent 22 months. Exceptions to this rule are cases where the child is being cared for by a relative, there is a compelling reason why termination would not be in the best interest of the child, or the State has failed to offer the necessary services to the family.
FamLink data was used to calculate time in out-of-home care, as well as the time from the start of the placement to the date of petition to terminate parental rights. Data from AOC was used to determine the actual filing date of the TPR petition, if one had been filed, and whether compelling reasons existed for not filing a TPR petition. In general, both the quality of data for TPR petitions and the accuracyof reporting have improved in recent years thanks to more widespread use of valid codes when documenting exceptions to the 15-month requirement based on “compelling reasons.”
Note: Calculation improvements regarding duplicate and connective Dependency (DEP)/Termination (TER) cases and closer rule alignment with the Federal Child and Family Service Review (CFSR) have been incorporated to the TPR within 15 months objective. Historical numbers have been updated.
OBJECTIVE 5: TERMINATION OF PARENTAL RIGHTS OBJECTIVE 5: TERMINATION OF PARENTAL RIGHTS PETITION FILED WITHIN 15 MONTHS OF PETITION FILED WITHIN 15 MONTHS OF
OUT-OF-HOME CAREOUT-OF-HOME CARE

19
13.7 13.4 13.1 14.012.8
0.0
4.0
8.0
12.0
16.0
20.0
24.0
2016 2017 2018 2019 2020
Exhibit 22. Median Number of Months in Out-of-Home Care Prior to TPR Petition
The median number of months in out-of-home care prior to TPR petition filing decreased to 12.8 months in 2020.
Of the dependent children who had an associated termination case or who were due for a termination case in 2020, 44% had a termination petition within 15 months of out-of-home care, a drop of 9% from the previous reporting year.
60 60 6153
44
0
20
40
60
80
100
2016 2017 2018 2019 2020
Exhibit 21. Percent of Cases with TPR Petition Filed within 15 Months of Out-of-Home Care

20
66 66 6659
47
0
20
40
60
80
100
2016 2017 2018 2019 2020
Exhibit 23. Percent of Cases with TPR Petition Filed within 15 Months
of Out-of-Home Care—FJCIP
– – – Statewide
Exhibit 23 illustrates the percent of cases with TPR petition filed within 15 months of out-of-home care for Family and Juvenile Court Improvement Program (FJCIP) counties compared to the rest of the state.
Exhibit 24 shows the median number of months from dependency filing to legally freestatus-termination cases with a resolution of either approved petition or uncontested resolution and with one or more termination orders documented on the case. Includes adjustments for relinquishment cases with no termination orders documented on the case.
22.6 22.9 23.4 23.7
25.8
12.0
16.0
20.0
24.0
28.0
2016 2017 2018 2019 2020
Exhibit 24. Median Number of Months from DEP Filing to Legally Free

21
Measures:
1) percent of cases with adoption completed within six months of the termination order; and
2) median number of months to adoption completion .
RCW 13.34.145(1)(c): In cases where parental rights have been terminated, the child is legally free for adoption, and adoption has been identified as the primary permanency planning goal, it shall be a goal to complete the adoption within six months following entry of the termination order.
In order to determine the percentage of cases that achieved the goal of adoption within six months of a termination order, a due date for a completed adoption was set at six months from the date the child became legally free. The AOC’s CMS data was used to identify the date of the termination order, and DCYF FamLink data was used to identify the date the adoption was finalized.
40 3727 29 32
0
20
40
60
80
100
2016 2017 2018 2019 2020
Exhibit 25. Percent of Cases with Adoption Completed within Six Months to Termination Order
Adoptions that achieved the statutory goal of finalization within six months of the termination order by "year adoption was completed" sits at 32% for 2020, an increase of 3% from the previous reporting year.
OBJECTIVE 6: ADOPTION COMPLETED OBJECTIVE 6: ADOPTION COMPLETED WITHIN 6 MONTHS OF TERMINATION ORDERWITHIN 6 MONTHS OF TERMINATION ORDER

22
7.0 7.6 8.3 9.2 8.6
0.0
4.0
8.0
12.0
16.0
20.0
24.0
2016 2017 2018 2019 2020
Exhibit 26. Median Number of Months from Termination Order to Adoption Completion
The median number of months from termination order to adoption completion decreased from the previous reporting year to 8.6 months for 2020.
43 35
26 27 32
0
20
40
60
80
100
2016 2017 2018 2019 2020
Exhibit 27. Percent of Cases with Adoption Completed within Six Months of
Termination Order—FJCIP
– – – Statewide
Exhibit 27 illustrates the percent of cases with adoption completed within six months of the termination order for Family and Juvenile Court Improvement Program (FJCIP) counties compared to the rest of the state.

23
Measures:
1) percent of cases with prior dependency statewide; and
2) percent of cases with prior dependency within 12 months, 13 to 24 months, or over 24 months .
Permanency is a key outcome and goal. State and federal child welfare laws and services are crafted to enable and encourage permanency as soon as possible. However, any analysisof permanency is incomplete without also examining children who reenter foster care and the dependency system. The graphs below show data collected on children who entered the system with a prior dependency case.
78 8
78
0
2
4
6
8
10
2016 2017 2018 2019 2020
Exhibit 28. Percent of Cases with Prior Dependency Statewide
OBJECTIVE 7: PRIOR DEPENDENCY STATEWIDEOBJECTIVE 7: PRIOR DEPENDENCY STATEWIDE
Dependency cases filed during the year that had a PRIOR dependency case for the child that ended with a documented dismissal. Includes priors within county only, and excludes dismissals documented as “Dependency Not Established.” Adoption disruptions leading to re-dependency are currently not available.
24
0%
1%
2%
3%
4%
5%
2016 2017 2018 2019 2020
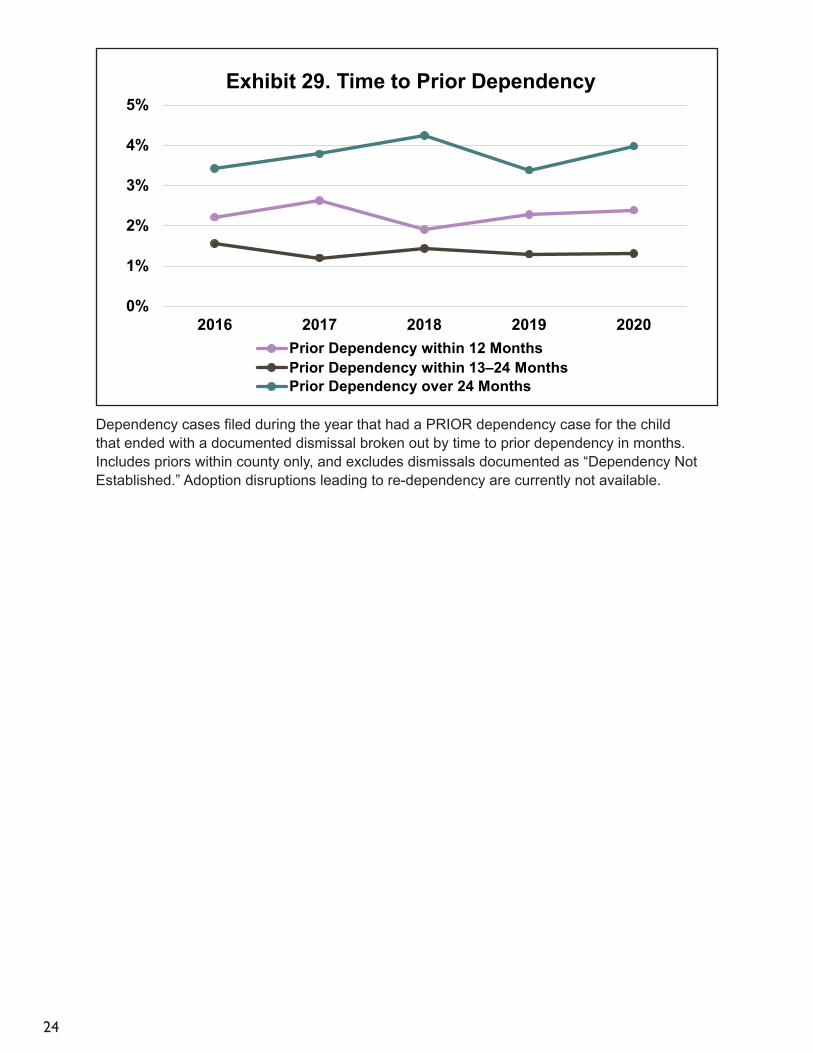
Exhibit 29. Time to Prior Dependency
Prior Dependency within 12 MonthsPrior Dependency within 13–24 MonthsPrior Dependency over 24 Months
Dependency cases filed during the year that had a PRIOR dependency case for the child that ended with a documented dismissal broken out by time to prior dependency in months. Includes priors within county only, and excludes dismissals documented as “Dependency Not Established.” Adoption disruptions leading to re-dependency are currently not available.
25
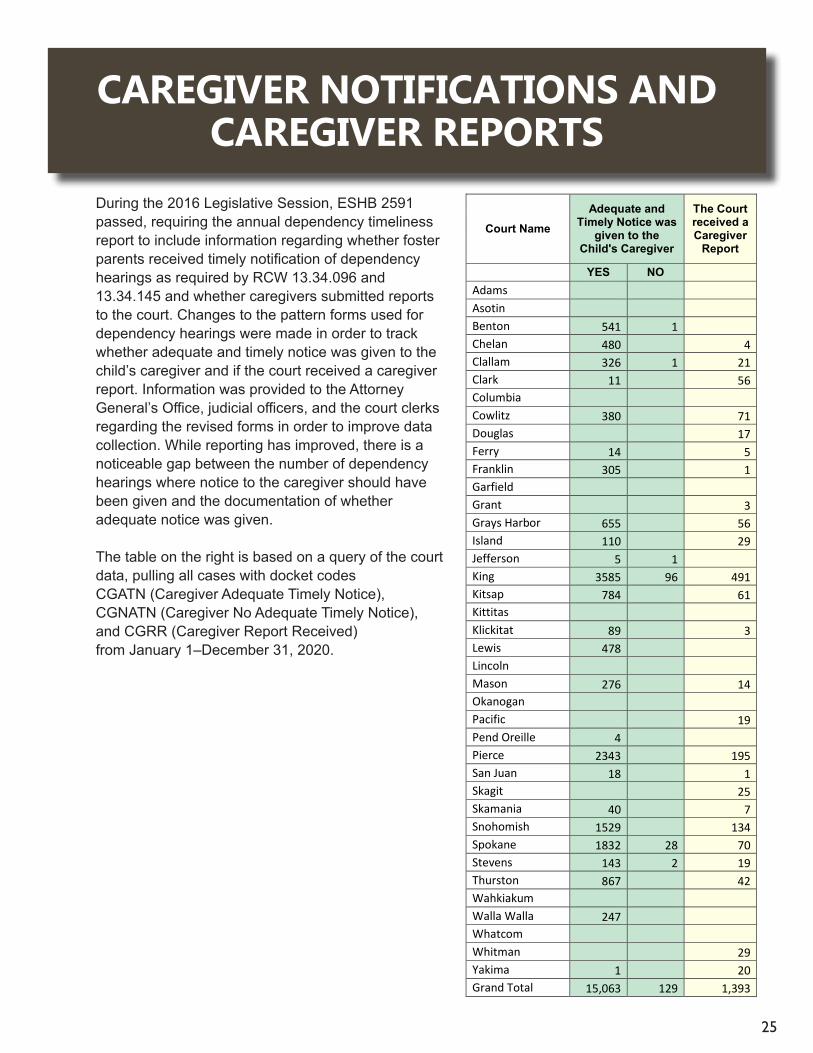
During the 2016 Legislative Session, ESHB 2591 passed, requiring the annual dependency timeliness report to include information regarding whether foster parents received timely notification of dependency hearings as required by RCW 13.34.096 and 13.34.145 and whether caregivers submitted reports to the court. Changes to the pattern forms used for dependency hearings were made in order to track whether adequate and timely notice was given to the child’s caregiver and if the court received a caregiver report. Information was provided to the Attorney General’s Office, judicial officers, and the court clerks regarding the revised forms in order to improve data collection. While reporting has improved, there is a noticeable gap between the number of dependency hearings where notice to the caregiver should have been given and the documentation of whether adequate notice was given.
The table on the right is based on a query of the court data, pulling all cases with docket codes CGATN (Caregiver Adequate Timely Notice), CGNATN (Caregiver No Adequate Timely Notice), and CGRR (Caregiver Report Received) from January 1–December 31, 2020.
Court Name Adequate and
Timely Notice was given to the
Child's Caregiver
The Court received a Caregiver
Report
YES NO Adams Asotin Benton 541 1 Chelan 480 4 Clallam 326 1 21 Clark 11 56 Columbia Cowlitz 380 71 Douglas 17 Ferry 14 5 Franklin 305 1 Garfield Grant 3 Grays Harbor 655 56 Island 110 29 Jefferson 5 1 King 3585 96 491 Kitsap 784 61 Kittitas Klickitat 89 3 Lewis 478 Lincoln Mason 276 14 Okanogan Pacific 19 Pend Oreille 4 Pierce 2343 195 San Juan 18 1 Skagit 25 Skamania 40 7 Snohomish 1529 134 Spokane 1832 28 70 Stevens 143 2 19 Thurston 867 42 Wahkiakum Walla Walla 247 Whatcom Whitman 29 Yakima 1 20 Grand Total 15,063 129 1,393
CAREGIVER NOTIFICATIONS AND CAREGIVER REPORTS

26
DEPENDENCY COURT IMPROVEMENT EFFORTSCOURT IMPROVEMENT PROGRAMThe Court Improvement Program (CIP) is a coordinated, federally-funded effort to promote the continuous quality improvement (CQI) of court proceedings in child welfare proceedings and promote collaboration between the judicial branch, child welfare agency, and tribes to improve child welfare outcomes. The Administrative Office of the Courts (AOC) administers the CIP and the three associated grants Washington State receives.
• The Basic Grant funds some of the projects detailed in this report and sponsors judicial attendance at the annual Children’s Justice Conference and other national conferences.
• The Training Grant sponsors the Court Improvement Training Academy (CITA).
• The Data Grant helps provide funding support for this report and other child welfare research efforts at the Washington State Center for Court Research (WSCCR).
With the assistance of a multidisciplinary advisory committee, the CIP strategically plans for a variety of activities and programs to improve permanency, safety, and well-being for children in foster care. CIP funds augment the funds available to the juvenile courts and the AOC to assist in the efforts of judicial officers to improve outcomes for children and families. CQI requirements provide accountability and transparency in the administration of the grants, and ultimately improve outcomes for children and families.
The CIP is continuing to provide much needed support to courts and families to address challenges during the pandemic. The CIP facilitated several work groups to address these issues, including the COVID Rapid Response Work Group and the Child Welfare Committee of the Board of Judicial Administration (BJA) Court Recovery Task Force, and assisted with the development of the Supreme Court guidance for trials during the pandemic, which included Resuming Dependency Fact Finding and Termination of Parental Rights Trials in Washington State. The CIP also worked with Family and Juvenile Court Improvement Program (FJCIP) courts, and details of those efforts can be found in the FJCIP section on page 45. Details regarding the COVID Rapid Response Work Group can be found in the Commission on Children in Foster Care section on page 53.
Additionally in 2020, CIP funding was used to provide local courts with mini grants to purchase technology and other resources to assist with dependency court operations. In December 2020, the Consolidated Appropriations Act, 2021, P.L. 116-260 was enacted into law, which includes
PROGRAMS

27
supplemental CIP funding to address needs stemming from the COVID-19 public health emergency to assist courts, judicial officers, attorneys, and clients with resources necessary to participate in hearings, whether conducted remotely or in person. The CIP will continue to work with the COVID Rapid Response Work Group and the BJA Court Recovery Task Force to assess and determine the best use of this extra source of funding.
The CIP is working closely with the Department of Children, Youth, and Families (DCYF) implementing court-related strategies of the Child and Family Services Review (CFSR) Program Improvement Plan (PIP). Two projects have been the main focus of CIP efforts in 2020, the hearing quality project and the safety guide project.
A major focus of CITA’s training efforts continues to be the American Bar Association’s Child Safety Guide (Safety Guide). The guide provides a structure and shared language for judicial officers, attorneys, and other court partners to actively participate in assessing child safety and making informed decisions about safety planning and case planning in each case. In 2020, CITA and DCYF created a multidisciplinary workgroup to enhance the Safety Guide training and support the use of consistent safety language across disciplines. Multidisciplinary training will be provided to judicial officers and court partners.
The hearing quality project will evaluate the application of the Safety Guide in court hearings. The baseline assessment of current court practice specific to discussion of safety and family time was conducted by the Capacity Building Center for Courts (CBCC). Once the Safety Guide training has occurred, an evaluation will assess the impact of Safety Guide training on the content and depth of judicial inquiry in court and, eventually, on case outcomes.
In October 2020, the AOC was awarded grant funding for two new programs that directly relate to CIP work regarding family treatment courts and baby courts. The Family Treatment Court program is described on page 48, and the Safe Babies Court Team program is described on page 39.
CONTINUOUS QUALITY IMPROVEMENTA tenet of the CIP, and all work in child welfare, is Continuous Quality Improvement (CQI). CQI is a way to determine if what we are doing works and where adjustments may be necessary.
CQI is readily apparent in the development of this report and the Interactive Dependency Timeliness Reports (iDTR), both of which have grown and become more useful and usable to the greater child welfare community.
• Through requested feedback and suggestions, WSCCR has helped the courts and stakeholders increase their accountability to children and families in the way their cases are handled, with the goal of ever-improving outcomes.
• Courts have used the data presented here and in the interactive reports to refine processes and procedures to improve timeliness of case processing.

28
COURT IMPROVEMENT TRAINING ACADEMYThe Court Improvement Training Academy (CITA) provides training and system improvement support for the dependency court communities in Washington State. CITA partners with WSCCR to use iDTR data as a tool for court learning and improvement statewide. The iDTR provides data that counties can use to manage, assess, and improve their court systems on a local level and allows CITA to more efficiently target federal training resources to maximize their effectiveness. Using data from iDTR and DCYF, CITA helps local jurisdictions identify issues where they can undertake measurable change efforts through targeted training and implementation. CITA’s approach is data informed, sensitive to local culture and needs, and mindful of the complex and multi-system nature of the work dependency courts do. The iDTR allows CITA, AOC, DCYF, and local courts to operate from a common data source when making strategic decisions. The collaborative relationship between WSCCR and CITA also allows for continuous improvement of the data system itself.
Training superior and tribal court judicial officers in dependency law, effective practice, and judicial leadership is central to CITA’s work. In January 2020, CITA supported the participation of five Washington State judicial officers at the national Capacity Building Center for Courts (CBCC) Judicial Academy on Reasonable Efforts. In early March, prior to the pandemic shutdown, CITA hosted its annual judicial officer training in Spokane. Judicial officers learned how to apply the American Bar Association safety framework to their courtroom practice and decision-making. Other sessions included making reasonable efforts findings, lessons learned from Indian Child Welfare Act (ICWA) courts and tribal court partnerships, meeting the needs of LGBTQ+ youth and families, Washington State’s implementation of the Family First Act, understanding and addressing decision fatigue on the bench, and ways courts can help families increase their hope and resilience.
• CQI procedures are also used in the Child and Family Service Review (CFSR) Program Improvement Plan (PIP).
• Expanding this report’s coverage of outcomes measures marks a significant expansion of CQI related to children involved with dependency cases.
• The Dependency Dashboard is a public-facing webpage that brings up current, point-in-time dependency data by county, updated on a monthly and quarterly basis. The interactive dashboard shows a number of measures including:
O number of dependency cases and termination of parental rights cases filed per county and by race and ethnicity; and o percent of cases with fact-finding within 75 days, first review hearing within 6 months, and cases with a prior dependency.
The easy-to-use tool assists users in tracking performance of dependency timeliness measures.

29
In August, CITA provided support for the virtual Indigenous Children, Youth and Families Conference, cosponsored by DCYF’s Office of Tribal Relations and the Alliance for Child Welfare Excellence. The conference focused on Indigenous family wellness and included legal sessions addressing ICWA, its application in Washington State, and an exploration of the ICWA court model.
As pandemic shutdowns fundamentally altered how the courts and child welfare interacted with families, CITA worked with system partners to develop COVID-related tools and virtual trainings, as well as share resources and innovative ideas. The CITA website (www.wacita.org) was redesigned to better accommodate virtual learning with recordings of online trainings available for continuing legal and judicial education credit. The website expanded to provide COVID-related resources for courts, including guidance for conducting remote hearings, sections for FJCIP court partners to access information and forms, and information about how courts can use data from the iDTR and the Dependency Dashboard to improve practice.
Between early April and June 2020, CITA developed and hosted a series of four webinars on virtual and in-person family time during COVID-19. These webinars provided guidance from experts on how to effectively utilize technology to support Family Time connections, including coaching for parents and caregivers, and tools for planning successful and safe in-person visits and addressing fears and resistance. In late summer, as students in foster and relative homes were facing a return to virtual school, CITA hosted a webinar with education advocacy tips for everyone involved in a student’s dependency case to address the specific challenges presented by the COVID-19 pandemic and remote learning.
To advance the practice of child welfare law, CITA supports Communities of Practice, groups of individuals interested in a particular issue or tool to improve their work. CITA provides technical support and assistance in forming and managing these communities to maximize their potential. In 2020, CITA and AOC continued to support the Community of Practice for Family and Juvenile Court Improvement Program Coordinators.
CITA utilizes the iDTR to support court system improvement and innovation efforts. At the local level, court partners use data from the iDTR to identify system challenges, track the impact of improvement projects, and justify effective practice and policy changes. In 2020, CITA and AOC employed iDTR data to identify courts in need of grant support to improve outcomes for families with very young children and families with substance use disorders. CITA participated in the submission of two successful federal grant applications to develop statewide assessment, training, and support for team-based courts focused on improving outcomes for families and systems—Family Treatment Courts and Safe Babies Court Teams.

30
CITA utilizes a variety of tools to facilitate court system improvement and innovation efforts. In addition to using iDTR data with court audiences, CITA employs Liberating Structures (liberatingstructures.com), facilitation, and strategic planning tools that engage diverse groups and blend “evidence based practice” with the “practice based evidence” to move people to action. The CITA website utilizes iDTR data and provides access to court improvement resources and materials, including the Juvenile Non-Offender Benchbook and Dependency Best Practices Guide.
The Washington State DCYF embraces Family First Prevention Services Act (Family First or FFPSA) implementation as an opportunity to expand the choices and support provided to children, youth, and families. Signed into law February 9, 2018, Family First focuses on creating new opportunities for states to receive federal reimbursements for services that aid in preventing children from entering foster care and improving the well-being of children already in the system.
Family First also enhances DCYF’s ability to find loving, permanent homes for children and youth who must enter foster care, and it provides guidelines for those who need intensive therapeutic environments. Increasing family-centered and trauma-informed approaches to safety, permanency, and well-being are at the core of DCYF’s mission to support Washington families and will use Family First resources to further engage communities in growing these critical efforts.
FFPSA Prevention PlanFamily First introduces the opportunity for states to claim Title IV-E funds, which are traditionally reserved for foster care and for evidence-based services that prevent entry into foster care. Under Family First, prevention services can be offered to children who are at imminent risk of entering foster care, as well as to pregnant and parenting youth in foster care, to prevent children from coming into care.
In order to access this option, states must document their FFPSA prevention approach in a five-year Title IV-E Prevention plan for approval by the Children’s Bureau. On December 20, 2019, DCYF submitted Washington State’s Prevention Plan to the federal Children’s Bureau to implement the FFPSA. On October 1, 2020, the federal Children’s Bureau approved the Family First Prevention Plan. The approved Family First Prevention Plan is on the DCYF website.
Implementation of FFPSA Prevention in Washington State is a huge transformation effort that will take multiple years to fully implement. This project will be phased, focusing on the required implementation tasks necessary to meet FFPSA requirements, and then subsequent phases will focus on roll out to the different candidacy groups.
EARLY ENGAGEMENT STRATEGIESFamily First Prevention Services Act
31
The COVID-19 pandemic delayed implementation planning, but work did begin in late 2020 on the development of new tools, processes, and gathering of technical requirements. The Family Voluntary Services (FVS) candidacy group program changes, allowing us to meet FFPSA requirements, will occur in the Fall of 2021. In addition, Family Assessment Response (FAR) pilots will also begin in Fall 2021. This will allow us to assess the best way to modify the FAR program to meet requirements.
DCYF leaders worked with Washington Tribes over the year leading up to submission of the agency’s initial FFPSA Prevention Plan to identify voluntary prevention services that are embraced in tribal communities and that could potentially be funded through the FFPSA. Based on this feedback, DCYF contracted to complete an evidentiary review of four tribal prevention practices, a review required in order to submit evidence to the Prevention Clearinghouse. The literature review on the four identified tribal prevention practices can be viewed on the DCYF website.
Licensing StandardsThe FFPSA requires each state to meet national standards to improve licensing standards for foster family homes. Until Family First, the federal government did not point to any specific standards for licensed foster homes, so states created their own standards without national guidance. Varying state standards have created barriers to both relatives and non-relatives in the licensing process. New federal licensing standards will allow more relatives caring for children in foster care to become licensed and receive ongoing monthly financial assistance, supports, and pathways to exit the system with assistance.
The majority of DCYF licensing standards were consistent with the federal model standards; however, there were some slight deviations that required changes to Washington Administrative Code (WAC) and agency policies. The WAC and policy revisions for child foster homes took effect on February 1, 2020, and now reflect the new requirements in the FFPSA. Details regarding these changes can be found on DCYF’s website.
Qualified Residential Treatment Programs (QRTP)The FFPSA establishes requirements for placement in residential treatment programs and improves the quality and oversight of services. It allows federal reimbursement for care in certain Behavior Rehabilitation Services (BRS) treatment programs, known as Qualified Residential Treatment Programs (QRTP), for children with emotional and behavioral disturbance disorders requiring special treatment.
In October 2019, child welfare policies were updated to reflect the FFPSA requirements related to the QRTP. DCYF submitted the state plan updates to the federal Children’s Bureau in December 2019, and received feedback from the Children’s Bureau in Spring 2020. DCYF addressed their questions and made minor updates to the policy. On October 8, 2020, the Children’s Bureau approved DCYF’s updated policy, state plan, and qualified individual waiver. Please see the approved policy on DCYF’s website and the waiver form.

32
Kinship (Relative) CaregiversThe FFPSA provides federal funds for evidence-based Kinship Navigator programs that link relative caregivers to a broad range of services and supports to help children remain safely with them.
DCYF is partnering with the Aging and Long-Term Support Administration (ALTSA) and the University of Washington to evaluate and further develop Washington State’s current Kinship Navigator program. The long-term goal of this work is to build program infrastructure and consistency in order to develop a promising practice that will qualify for sustainable federal funding.
Interstate Placement Family First requires that no later than October 1, 2027, states use an electronic interstate case-processing system for exchanging data and documents to help expedite the interstate placement of children in foster care, adoption, or guardianship.
In June 2020, the Interstate Compact on Placement of Children (ICPC) unit began using a secure document portal, which is a temporary tool for National Electronic Interstate Compact Enterprise (NEICE) states with signed Memorandums of Understanding (MOUs) to transmit ICPC documents securely and electronically to Clearinghouse NEICE states. This has assisted DCYF’s headquarters ICPC unit in getting ICPC documents to states that would not accept Washington encrypted emails, and this will help streamline the onboarding process to the NEICE system.
DCYF received a federal grant in October 2019 to connect to the NEICE system and make changes to its Comprehensive Child Welfare Information System (CCWIS). This project was expected to kick-off in 2020, but due to COVID-19, the project kick-off was delayed to 2021. This project will take several years to implement fully.
Family Practice ModelDCYF is invested in redesigning the Family Practice Model (FPM) which represents a system-wide standard for engagement that outlines interactions between the department and families that are referred for intervention and services. The FPM is an organizing framework that describes DCYF’s practice values, approach, and strategic direction within child welfare practice. The FPM outlines an integrated approach to using assessment tools, engagement approaches, and evidence-informed strategies to meet needs unique to each family. The goal of developing a clear practice model is to support field operations staff in applying consistent practices across the state, and creating reliability for case workers and the families they serve. This will result in improved support to case workers by aligning practice with values and policy, through a cohesive series of training and assessments.
The redesign efforts are being developed using a Human Centered Design framework, which is a problem-solving method that invites perspectives of recipients of a system into the design space to improve process or practice. Codesign methods include learning continuously from and with people closest to the work. In the case of FPM, that means field operations staff and lived experts. The codesign methodology challenges historic imbalances of power in systems where leaders make important decisions about other people’s lives and families.

33
The three major phases of this work include research, prototyping, and implementation.
• Research: The FPM development plan uses a series of codesign sessions to understand perspectives and stories, elevating parts of the current system that function well, highlighting practices and engagement strategies that are challenging, and understanding tools, training, and policy that do not align with practice. A series of codesign sessions is scheduled for case workers, with a focus on work area. There is another series of codesign sessions scheduled for lived experts, that emphasizes a specific interaction with the system (parent, youth, or caregiver).
• Prototype: Developing a FPM prototype allows DCYF to creatively test and iterate on new approaches to create better outcomes. The data gathered in the codesign sessions will be the basis for developing the prototype by a design team that includes both lived experts and case workers. The prototype will strengthen current practices and tools that meet the needs of families and staff, highlight areas that are not aligned, and identify training and development of services to match need.
• Implementation: After a slow rollout to early adopters, including adjustments, during the prototype phase, the rollout will expand to the remaining offices across the state. The full rollout includes components of training and localized support to ensure that FPM standards are supported for reliability, consistency, and fidelity through a quality assurance structure. This phase also allows for increased outcome evaluation of services provided to support families.
To ensure effective field operations casework standards, decision making must be supported and guided by a sound assessment system. The timeline to redesign the FPM coordinates practice model design with a renewed commitment to provide case workers with the best available tools, engagement strategies, and a holistic IT case management module that coordinates activities and policies for case workers. The assessment system and FPM are an integrated project, being designed simultaneously. They are both powerful mechanisms for translating values and principles into discrete practice behaviors and strategies for field operations case workers. The assessment redesign and the development of the FPM is a complex process and is anticipated to take three years to implement fully.

34
Family TimeFamily Time refers to parent-child visitation. This name is intended to reflect commitment to the idea that visitation supports healthy relationships and bonds between family members. With the focus of Family Time on maintaining healthy relationships and bonds between family members, it is anticipated that children, youth, and families will continue to thrive by maintaining those connections.
The implementation of Sprout, a web-based data and referral system, has helped to streamline the referral process for Family Time and improve the collection of data. Data currently captured in Sprout reflects visit details including: visit type—virtual, in-person, both (virtual/in-person); if visits were missed/no show; and no visit recorded (visit referral not accepted yet, no documentation for that week, or other circumstances). Data teams continue to work together to develop quality data pulls needed to continue to improve practice with visitation services.
Sprout started with Family Time and is being expanded to integrate other contracted services to include the CANS-F for Combined In-home Services, Behavior Rehabilitation Services (BRS), and Early Support for Infants and Toddlers (ESIT).
Enhanced programing continues to be developed in Sprout focusing on:
• security measures for report authentication; • billing for contracted providers; and • Performance Based Contracting implementation of outcome metrics.
Moving forward, DCYF will continue to develop Sprout as a system that provides efficiency to Family Time, CANS, BRS, and ESIT, and is also a “work horse” data system that improves practice which will improve support to our children, youth, and families.
COVID-19 Impact on Family Time
The COVID-19 pandemic directly impacted Family Time services for families that are served by DCYF. From March 2020 to August 31, 2020, DCYF operated under the Governor’s proclamation 20.33. The proclamation allowed DCYF flexibility for Family Time to be provided remotely while not suspending or preventing in-person visits. In-person Family Time was recommended if it could be carried out safely following safety protocols that were developed with the guidance from the Department of Health. If in-person Family Time could not be done safely, virtual visits were provided.

35
To manage visitation during the pandemic, the following was provided:
• statewide electronic devices and data plans through concrete goods to parents, youth, and caregivers in order to keep families connected; • retainer payments to contracted providers to help support them financially when they were unable to provide services; • guidance documents for providers, staff, parents, and caregivers: Family Time In-Person Visits Guidance Protocol Provider Family Time In-Person Visits Guidance DCYF Staff Family Time In-Person Visits Guidance Parents Family Time In-Person Visits Guidance Foster Parent and Kinship Caregivers; • Personal Protection Equipment (PPE) and cleaning protocols statewide for field offices for caseworkers, providers, and families; • communication about Family Time visitation guidelines to DCYF staff; • communication externally with parents, providers, and caregivers about timelines and changes to Family Time visitation; • DCYF office space and cleaning services to accommodate in-person visits; • instructions on motions to the courts supporting health and safety during visits; • communications with county courts on system changes in visitation so they were prepared for potential increase in hearings related to visitation; • individual responses for counties experiencing higher COVID-19 exposure rates or local orders affecting movement of residents; • weekly data report showing status of Family Time visitation; and • weekly Family Time provider calls to problem solve implementation challenges during COVID-19.
During the pandemic, billable services were added into Sprout, allowing contracted providers payments for certain activities, which helped maintain safety during visit. These activities included:
• COVID-19 screening calls completed the day before and the day of visitation using the Department of Health screening questions; • car cleaning prior to and after each transportation; • location cleaning prior to and after each visitation; and • provision of electronic devices to families, caregivers, and youth to support virtual visits.
As we continue to work through the pandemic, DCYF and contracted providers are returning to in-person Family Time visitation with requirements to maintain safety and control the spread of COVID-19. This has been a statewide approach involving our community and court partners. Looking forward, DCYF and families have found benefits in the virtual technology in and around visitation. Having virtual capabilities has extended visitation resources outside of regular in-person visits, when in-person is not an option for the parent or child.

36
Finding Fathers in Dependency CasesThe Finding Fathers in Dependency Cases project provides courts with reliable, fast, and low-cost DNA testing for alleged fathers in dependency cases. After a successful pilot project with five counties ending in 2016, Family and Juvenile Court Improvement Program (FJCIP) courts saw the benefits and have implemented this program modeled on the protocol used by Pierce County, where DNA samples were obtained at the courthouse. Based on the success of the FJCIP courts, in 2019, the Legislature approved a budget request to expand this program to every county statewide. The COVID-19 pandemic has slowed the process of the Finding Fathers program expanding statewide; however, statewide implementation is expected to resume in the future.
Establishing paternity early has been shown to have positive impacts on dependency case processing and outcomes for children. Aside from earlier dependency case resolution, it increases the likelihood of a father’s early engagement and family reunification, as well as the likelihood the reunification will be lasting. Even in cases where reunification is with the mother, fathers who become engaged early in the dependency process are more likely to stay involved in the lives of their children. Fathers’ involvement is associated with improved child well-being and lower levels of child behavior problems. Children with involved fathers are less likely to re-enter the child welfare system.1 Identifying biological fathers can also expand the pool of relative placements and resources available to children who might otherwise be placed in foster care. Since families are more likely to experience positive outcomes if paternity is established early in a case, it is important that courts have efficient access to DNA testing. More information regarding the Finding Fathers in Dependency Cases project, can be found on the CIP web page located at www.courts.wa.gov/cwcip.
1Washington State Dependency Best Practices Report, Commissioned by the Washington State Supreme Court Commission on Children in Foster Care, Co-Chaired by Justice Bobbe J. Bridge (Ret.) & Denise Revels Robinson.
Mediation and Settlement ConferencesBecause mediation is a collaborative, non-adversarial process, it can preserve and improve the relationships between parties, allowing them to focus on the action steps and behavior changes necessary for reunification. In that way, mediation is a fundamental tool for realizing the primary intention of dependency court: to safely return children to their families.
Several of the FJCIP courts use mediation, resulting in earlier case resolution and better docket management. According to research conducted by the National Council of Juvenile and Family Court Judges, the King County program achieved significant outcomes in the first five years of operation including timelier case processing, increased resolution rates, increased placement with relatives compared to foster care, and higher rates of reunification with parents. Other counties use various forms of mediation and alternative dispute resolution strategies.
Chelan County schedules early case conferences at the shelter care hearings in cases where the parties agree to engage. In addition, judicial settlement conferences are conducted before every fact-finding trial and termination of parental rights trial.
In Island County, mandatory mediation must occur in dependency cases with family law issues.

37
The King County Dependency Mediation Program started in 2009 to provide a less adversarial means for addressing and resolving issues in child protection cases filed in Seattle. In November 2017, the program was expanded to include cases filed in Kent. In dependency mediation, a specially trained neutral mediator helps guide the parties (parents, social workers, attorneys, and court appointed special advocates) through a confidential discussion of the family’s situation and the concerns that brought them to the attention of DCYF. The mediator assists parties in developing a plan that they all agree is safe, addresses parental deficiencies, and is in the best interest of the children. Specific goals of the dependency mediation program are: 1) to give parents a voice in the dependency process and encourage their engagement, 2) to support timely processing of dependency cases, 3) to give all parties the opportunity for thoughtful discussion and collaboration, and 4) to promote safe, timely permanency for children. Starting in April 2019, mediation was expanded to add At Risk Youth/Children in Need of Services (ARY/CHINS) cases, as an offer to the families, not mandatory.
King County participated in the Permanency Initiative, a joint project between the Office of Public Defense and the Attorney General’s Office since 2015. Parties involved in a termination or guardianship matter may request to have a settlement conference scheduled with a retired judicial officer. In 2020, there was a decrease in requests as no matters were scheduled between late March and mid-June due to COVID-19. Settlement conferences are now conducted via Zoom. Although there was a decrease in cases that reached a settlement, the judicial officers are able to narrow any contested issues, which results in less time spent in trial. The FJCIP Coordinator coordinates and tracks the settlement conferences.
In Kitsap County, prior to a fact-finding hearing or trial, any party to the case can ask for and be granted a settlement conference. Many of the settlement conferences result in resolution of the case.
Pierce County settlement conferences are required when a case is approaching dismissal and the parents have not agreed to a parenting plan or residential schedule. They are not required if the parties, their attorneys, DCYF, and the child advocate/guardian ad litem agree a parenting plan is not necessary. They are also required if a parent has not voluntarily agreed to a dependency. The settlement conferences are conducted by judicial officers not otherwise adjudicating the case. Settlement conferences by judicial officers are available but not mandatory in termination cases prior to the trial beginning.
In Snohomish County, mediation on the family law action within the Unified Family Court has been available for more than five years, with the intention of reducing the number of cases set to trial, decreasing the timeframe for dismissal, and improving the quality of and adherence to the final parenting plan. Upon request of the parties, settlement conferences are available in both dependency and termination cases.
Thurston County hired a third court commissioner in 2017 and began holding settlement conferences for dependency and termination cases. From August 2017 through September 2018, 59 settlement conferences were held, with 22 cases reaching full settlement, and six cases reaching partial settlement.
38
Clallam and Jefferson Counties are considering mediation for dependency cases, with the hope that the structure of mediation will allow the parents to feel that they are being heard and increase engagement in their cases. Mediation also allows all parties to identify where there is conflict and try constructive decision-making to create solutions.
Meeting the Needs of Infants, Toddlers and Their FamiliesIn 2020, the total number of dependency petitions filed in Washington State was down 24% from the previous year. However, cases involving children under one year old decreased by only 7.1%, with 1,062 infants entering the dependency court system during the COVID-19 pandemic. Toddlers between one and three years old experienced a 17.5% reduction in filings, with 430 cases filed across the state. Acknowledging the persistently high number of infants and toddlers removed from their families, and the lifelong impact of early childhood trauma, child welfare and court stakeholders worked together to develop programs to respond to the needs of this population.
Safe Babies Court Team Approach – Statewide ExpansionInspired by Pierce County’s Best for Babies Program, an interdisciplinary Design Team of stakeholders came together in early 2020 to develop a sustainable, statewide strategy to spread the Safe Babies Court Team (SBCT) approach to communities across the state. The SBCT approach, created and supported by ZERO TO THREE, is a community engagement and systems-change initiative focused on reducing trauma for young children and families by improving collaboration between courts, child welfare, and child-serving organizations. The Design Team, facilitated by the Center for Children and Youth Justice (CCYJ) and the AOC, used the iDTR and other data to assess the demographics, racial disproportionality, and case outcomes for young children under the age of three. This information, along with data on the availability of services and community readiness factors, helped identify high impact communities for SBCT expansion.
The Design Team created an implementation plan that included the start-up of three local Safe Babies courts and development of a statewide structure to provide training, oversight, and alignment to the SBCT approach. Based on this plan, CCYJ applied for and was awarded a federal grant from the U.S. Health Resources & Services Administration (HRSA) to launch the SBCT approach in Kitsap, Thurston, and Spokane Counties. These courts will focus on front-loading services and increasing family time for children birth to three and their parents, with the goal of preserving the infant-parent bond, promoting child well-being, and reducing time to permanence. The AOC, CCYJ, and ZERO TO THREE are working together to develop local and statewide oversight structures that will engage in evaluation, strategic implementation, sustainability planning, and increasing access to needed services for families in SBCT courts.
The Design Team created an implementation plan that included the start-up of three local Safe Babies courts and development of a statewide structure to provide training, oversight, and alignment to the SBCT approach. Based on this plan, CCYJ applied for and was awarded a federal grant from the HRSA to launch the SBCT approach in Kitsap, Thurston, and Spokane Counties. These courts will focus on front-loading services and increasing family time for children birth to three and their parents, with the goal of preserving the infant-parent bond, promoting child well-being, and reducing time to permanence. The AOC, CCYJ, and ZERO TO THREE are working together to develop local and statewide oversight structures that will
39
engage in evaluation, strategic implementation, sustainability planning, and increasing access to needed services for families in SBCT courts.
Pandemic Family Time and Young ChildrenDuring the COVID-19 pandemic, families of young children faced new obstacles to maintaining and healing their relationships. Family Time visits almost universally transitioned to virtual contact when Governor Jay Inslee signed a proclamation in late March, permitting DCYF to limit in-person Family Time visits in response to COVID-19. The Supreme Court issued guidance to courts in April, acknowledging that virtual visits could serve as a temporary solution to preserving family connections.
Predictable and consistent Family Time visits are critically important for children who have experienced trauma, and they favorably impact case outcomes. This is especially true for very young children, who require close physical proximity and frequent, repeated interactions with a parent in order to develop an attachment relationship. Acknowledging the challenges of remote visits for families with infants and toddlers, the AOC, Office of Public Defense (OPD), and other system partners worked with visitation expert Rose Wentz to develop a webinar series and online resources to support successful virtual visits tailored to the developmental needs of children in care.
To support the resumption of in-person Family Time, DCYF consulted with the Department of Health to create health guidance and protocols to minimize the risk of virus transmission during visits. DCYF and Family Time providers also sought out new locations for visits to occur, including outdoor spaces and larger indoor public spaces. While these efforts improved access to in-person visits for families during the summer and fall, increased disease activity in November led many Family Time providers to again reduce in-person contact.
FIRST ClinicThe Family Intervention Response to Stop Trauma (FIRST) Clinic is a prevention-oriented medical-legal partnership that launched in July 2019 in Snohomish County. Since then, the program has helped dozens of mothers avoid the removal of their newborns and the filing of a dependency petition in court. The program provides parents with legal consultation and advocacy, support from a parent ally, and quick access to substance abuse treatment, and other services, including housing and nurse home visiting.
DCYF and Casey Family Programs began working with the FIRST Clinic in 2020 to support the evaluation and expansion of this novel prevention program, including identifying sustainable funding sources. The FIRST Clinic has been highlighted in several national trainings and publications as a promising approach to addressing the substance abuse and other needs of pregnant and parenting women in their communities.

40
Plan of Safe CareDCYF worked with the Center for Children and Family Futures and a multi-disciplinary workgroup to encourage community-based responses to children born affected by substances and safely reduce child welfare involvement through the Plan of Safe Care project. This effort used a change in the federal Child Abuse Prevention and Treatment Act (CAPTA) law that allows healthcare providers to notify the child protective services system without requiring them to make a report of child abuse or neglect, provided there is no imminent risk of harm to the child and the identified infants and their parents receive a Plan of Safe Care.
DCYF has created pilot sites in Pierce and Yakima Counties to employ a new definition of “child affected by substance abuse” and try out a new pathway for DCYF notification that avoids child welfare involvement. Instead of having DCYF staff create the Plan of Safe Care, these counties are working with Help Me Grow to develop plans and engage parents. The group is also partnering with tribes to pilot the Plan of Safe Care program.
Parents for Parents ProgramThe Parents for Parents (P4P) program is a peer outreach and education program provided by parents who have successfully navigated the child welfare system to parents who have recently become engaged with the dependency system. The program supports safe and timely reunification of children with their parents, or an alternative permanency outcome when reunification is not a viable goal. Beginning in 2005, CIP funds have supported the start-up of 14 programs operating today.
During the 2015 legislative session, legislation was passed to provide funding to existing P4P programs, to expand services in three of the programs, and for two evaluations to be completed to determine if the program can be considered research-based. The legislation placed the P4P program under the direction of the Office of Public Defense, who contracts with the Children’s Home Society of Washington to provide oversight and coordination for the statewide programs.
During the 2019 legislative session, funds were appropriated to take P4P statewide, expanding the program into 22 counties and implementing a more robust model in some sites to help keep families engaged throughout the dependency process. As a result, the program has expanded to every county in the state, with the exception of Jefferson County. Planning for expansion into Jefferson County is currently underway. For newly launched programs during 2020, training and start-up is occurring. These counties include Adams, Asotin, Chelan, Columbia, Cowlitz, Douglas, Ferry, Garfield, Island, Kittitas, Klickitat, Lincoln, Okanogan, Pend Oreille, San Juan, Skagit, Skamania, Stevens, Wahkiakum, Whitman, and Yakima.
Furthermore, the program is a promising practice and is waiting to be reviewed by the Title IV-E Prevention Services Clearinghouse to see if it will be eligible to draw down federal dollars. Federal Court Improvement Program dollars have also been used to help begin and support existing programs.

41
Through court outreach at dependency hearings, a Dependency 101 class designed to educate parents about the dependency system, and ongoing peer mentoring, helps encourage positive thinking and engagement with services, gives parents someone they can relate to, and offers them hope that reunification is possible. In addition to the Dependency 101 class, multiple sites sponsor Dependency 201 classes. These classes offer an additional support and skill-building class, which is designed to provide tools and resources that help empower parents to be successful throughout their dependency cases and in life. The King and Pierce County programs also offer parent mentoring programs in the local jails.
Many programs also provide additional support classes in partnership with local agencies to include parenting classes, and domestic violence and housing clinics. Furthermore, some programs partner with local substance abuse treatment agencies to provide services and support to parents.
Additionally, the Phase I Evaluation Report for Washington State’s P4P program was completed by Chapin Hall Center for Children in 2016. Chapin Hall evaluated P4P programs in King, Spokane, and Thurston Counties. The evidence is strong about changes in attitude that result from attending the Dependency 101 class. The Phase II Evaluation was released in January 2020 and took a deeper look at outcome data and reunification rates of parents who participate in P4P. It was conducted by the Children’s Bureau Capacity Building Center for Courts and the University of Nevada under the leadership of Sarah Trescher and Dr. Alicia Summers. The evaluation can be accessed here: https://www.childrenshomesociety.org/reunification.
Below are some key findings from the newest long-term evaluation which demonstrate the significant impact P4P is having on Washington State’s dependency-involved families.
• A positive relationship was demonstrated between parent participation in Dependency 101 and increased reunification rates—a difference of 17%. o 70% of parents who participated in Dependency 101 reunified with their children. o 53% of parents who did not participate in Dependency 101 reunified with their children.
• A positive relationship between parent participation in Dependency 101 decreased termination of parental rights—a difference of 13%. o 26% of parents who participated in Dependency 101 had their parental rights terminated. o 39% of parents who did not participate in Dependency 101 had their parental rights terminated.
• For cases that received Dependency 101 plus additional peer mentoring, reunification rates increased—a difference of 26% (79% of the cases reunified compared to the comparison group of 53%).
42
• For cases that received Dependency 101 plus additional peer mentoring, rates of termination of parental rights decreased—a difference of 20% (19% in P4P group compared to 39% in the comparison group).
• There was no statistical relationship between parent participation in the one-time 2-hour Dependency 101 class and length of time until permanency. This may suggest that future studies should explore the additional parent support components the program offers and their time to permanency.
Permanency from Day One (PFD1)—Federal GrantDCYF applied for and was awarded a $7.7 million permanency grant in September 2018. Washington is one of five states nationwide to receive this grant. This is a cooperative agreement with the federal Children’s Bureau. The PFD1 grant supports and aligns with the DCYF Program Improvement Plan (PIP), the Child and Family Services Plan (CFSP), and the Court Improvement Plan (CIP). This grant focuses specifically on CFSR outcomes, including Permanency Outcome 1: Children have permanency and stability in their living situations, Well-Being Outcome 1: Families have enhanced capacity to provide for their children’s needs, and the Case Review Systemic Factor. The Children’s Bureau approved the PFD1 grant strategic interventions in April 2020.
The PFD1 grant has two strategic interventions to increase timeliness to permanency for families and youth.
1. Enhanced Permanency Planning Meetings 2. Enhanced Youth Recruitment
Enhanced Permanency Planning Meetings are a specific intervention to address systemic barriers to permanency. These meetings build on existing DCYF policy to increase engagement between caseworkers and families with an emphasis on including parents, youth, and kin. These meetings are facilitated by a grant-funded facilitator; address safety, permanency, and well-being; are expedited (occur every three months); and provide parents an opportunity to contribute to their own planning as equal team members. With increased engagement, this grant strategy strives to achieve enhanced child, youth, and family involvement in case planning, which will result in individualized case plans that meet the needs of children, youth, and families. In addition, the grant strategy will increase transparency, teaming, inclusion, and respect with DCYF staff, families, youth, caregivers, tribes, and community partners. The population for this strategy is all newly dependent cases in the identified grant intervention offices.
Enhanced Permanency Planning Meetings were initiated in October 2020 in the following DCYF grant offices: Spokane North, Spokane Valley, Spokane Central, Colfax, Newport, Clarkston, King East, King West, King Southeast, King Office of Indian Child Welfare (OICW), West Seattle, Martin Luther King Jr. (MLK), Centralia, and Shelton. In March 2021, these enhanced meetings will expand to Wenatchee, Spokane Indian Child Welfare (ICW), King Southwest, Kelso, and Tumwater DCYF offices for a total of 19 offices impacted by this strategy.

43
Enhanced Youth Recruitment is a youth-directed recruitment strategy that is driven by legally free youth who participate in their case and placement decisions as a part of a team approach. This strategy focuses statewide on all legally free youth who are not in a permanent home. The major intervention component of this strategy is Reverse Matching Events where youth take an active role in identifying a family they believe could become a permanent resource for them. This is the opposite of nationwide conventional recruitment events where families read about or meet youth and then choose youth they feel would be a good fit for their home. To further support youth engagement in their own permanency, a Youth Engagement and Permanency Plans (YEPP) tool is being developed for use by DCYF workers with legally free youth on their caseloads in need of permanency. The YEPP tool requires involvement by the youth, youth supports, and other key case participants to focus on and develop a plan that will promote permanency or a permanency connection for the youth. These plans are reviewed every three months by the youth and the youth’s team.
The expected outcomes from these strategies are an enhanced capacity within our state to:
• support caseworkers in early family engagement; • enable parents to partner effectively and earlier with their child welfare team; • align concurrent planning efforts with court improvement efforts; and • provide increased recruitment strategies and outcomes for legally free youth for adoptions.

44
LOCAL INTIATIVES TO IMPROVE COURTS
The Family and Juvenile Court Improvement Program (FJCIP) courts outperform other courts in Washington State in compliance with dependency timeliness. The FJCIP incorporates Unified Family Court (UFC) principles in a model that allows flexible implementation centered on core elements, including stable leadership, education, and case management support. In addition to the core elements, the FJCIP Coordinators gather and analyze data which is then shared with local dependency stakeholder groups working on system improvement. The state provides FJCIP funding and framework to ten superior courts to implement enhancements to their family and juvenile court operations that are consistent with UFC principles, including longer judicial rotations.
Family and Juvenile Court Improvement Program
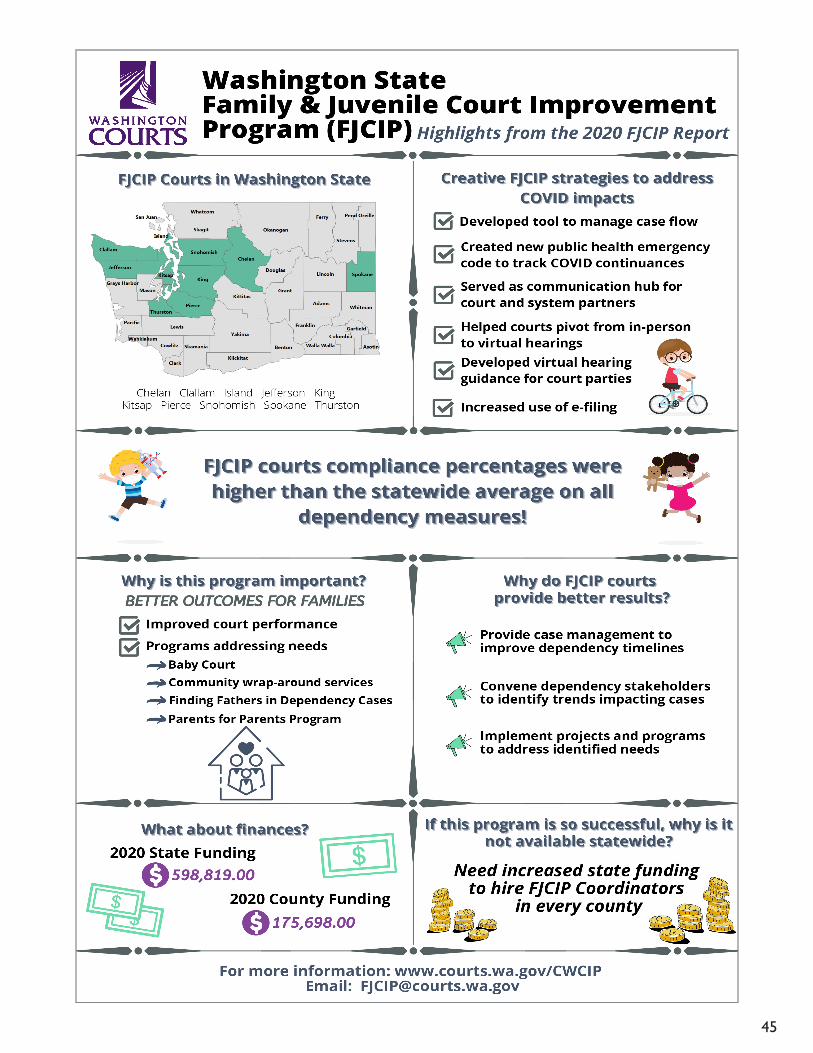
45

46
Chelan Clallam Island Jefferson King Kitsap Pierce Snohomish Spokane Thurston Unified Family Court Principles Assignment of a chief judge for the family and juvenile court for a minimum term of two years.
√ √ √ √ √ √ √ √ √ √
FJCIP Coordinator (Part-time/Full-time) Part Part Part Part Full Full Full Full Full Full
Case screening and coordinating √ √ √ √ √ √ √ √ √ √ Assistance with Family Law √ √ √ √ √ √ √ √ Multi-system Youth Coordination √ √ Developing √ Judicial officers have received at least 30 hours of specialized training √ √ √ √ √ √ √ √ √ √
Mediation/Settlement Conferences √ Developing √ Developing √ √ √ √ Specialized Court Teams Baby Court Team Developing √ Family Treatment Court √ √ √ √ √ √ √ √ √ Indian Child Welfare Court Team √ Legally Free Court Team √ √ √ Special Programs Adoption Day Celebration √ √ √ √ √ √ √ √ √ Adoption Workgroup √ √ Developing Developing √ Courthouse Dog √ Family Time (Visitation) Focus √ √ √ √ √ Finding Fathers in Dependency Cases √ Developing Developing Developing √ √ √ Developing √ Parents for Parents √ √ √ Developing √ √ √ √ √ √ Protein for All √ √ √ √ Developing √ √ Reunification Celebrations √ Developing Developing √ √ √ √ √ √ Totes for Kids √
Detailed descriptions of each program are provided in 2018 FJCIP Report to the Legislature, Appendix E.
In this year of unprecedented challenges brought on by the COVID-19 pandemic, the FJCIP demonstrated the value of having dedicated, court-level system improvement staff available to support effective dependency court operations. FJCIP coordinators helped courts and judicial officers troubleshoot challenges, implement new technologies, and keep information flowing across the court community. As a result, FJCIP courts were well-positioned to ensure that essential court functions continued, while also helping to protect staff and the public in an uncertain and rapidly changing environment. The 2020 FJCIP Report focuses on highlights of this most unusual year, including some of the creative strategies FJCIP courts used for addressing impacts related to COVID-19.
Continued funding for the FJCIP is critical, and current funding is insufficient to cover the costs of the existing FJCIP Coordinator positions. Full funding for the FJCIP Coordinator positions will make a significant difference in family law courts where many of the same litigants appear. The ultimate goal is adequate funding for all superior courts in Washington State to support an FJCIP Coordinator so that all will benefit from improvement outcomes.
More information regarding FJCIP can be found at: http://www.courts.wa.gov/CWCIP.
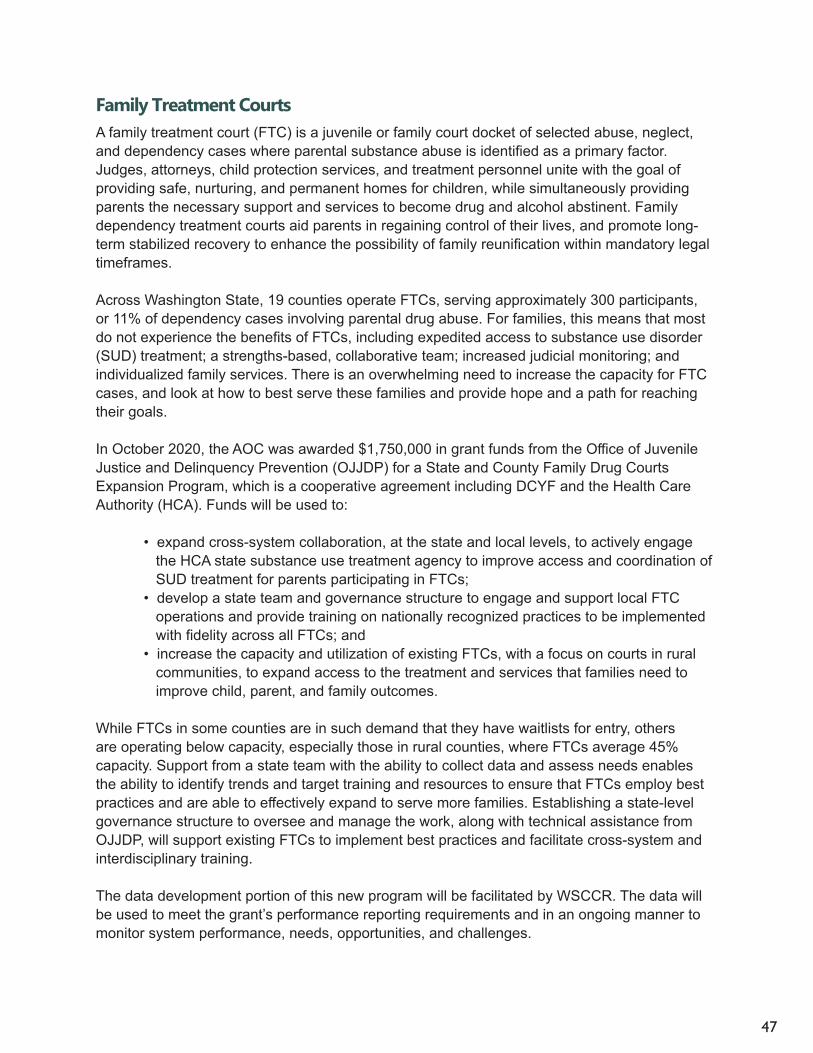
47
Family Treatment CourtsA family treatment court (FTC) is a juvenile or family court docket of selected abuse, neglect, and dependency cases where parental substance abuse is identified as a primary factor. Judges, attorneys, child protection services, and treatment personnel unite with the goal of providing safe, nurturing, and permanent homes for children, while simultaneously providing parents the necessary support and services to become drug and alcohol abstinent. Family dependency treatment courts aid parents in regaining control of their lives, and promote long-term stabilized recovery to enhance the possibility of family reunification within mandatory legal timeframes.
Across Washington State, 19 counties operate FTCs, serving approximately 300 participants, or 11% of dependency cases involving parental drug abuse. For families, this means that most do not experience the benefits of FTCs, including expedited access to substance use disorder (SUD) treatment; a strengths-based, collaborative team; increased judicial monitoring; and individualized family services. There is an overwhelming need to increase the capacity for FTC cases, and look at how to best serve these families and provide hope and a path for reaching their goals.
In October 2020, the AOC was awarded $1,750,000 in grant funds from the Office of Juvenile Justice and Delinquency Prevention (OJJDP) for a State and County Family Drug Courts Expansion Program, which is a cooperative agreement including DCYF and the Health Care Authority (HCA). Funds will be used to:
• expand cross-system collaboration, at the state and local levels, to actively engage the HCA state substance use treatment agency to improve access and coordination of SUD treatment for parents participating in FTCs; • develop a state team and governance structure to engage and support local FTC operations and provide training on nationally recognized practices to be implemented with fidelity across all FTCs; and • increase the capacity and utilization of existing FTCs, with a focus on courts in rural communities, to expand access to the treatment and services that families need to improve child, parent, and family outcomes.
While FTCs in some counties are in such demand that they have waitlists for entry, others are operating below capacity, especially those in rural counties, where FTCs average 45% capacity. Support from a state team with the ability to collect data and assess needs enables the ability to identify trends and target training and resources to ensure that FTCs employ best practices and are able to effectively expand to serve more families. Establishing a state-level governance structure to oversee and manage the work, along with technical assistance from OJJDP, will support existing FTCs to implement best practices and facilitate cross-system and interdisciplinary training.
The data development portion of this new program will be facilitated by WSCCR. The data will be used to meet the grant’s performance reporting requirements and in an ongoing manner to monitor system performance, needs, opportunities, and challenges.

48
In 2014, the Washington State Legislature established a right to counsel for children involved in dependency cases who remain dependent six months following the termination of their parents’ legal rights. The Washington State Office of Civil Legal Aid (OCLA) Children’s Representation Program (CRP) has been overseeing the legislation for over six years.
Private attorneys and publicly-funded agencies throughout Washington State provide standards-based representation for these “legally free” children. Attorneys commit to receiving OCLA-approved training, maintain caseloads consistent with legislatively recognized limits, and effectively represent the stated and legal interests of these children in dependency proceedings. The goal is to ensure effective legal representation that expedites permanency; improves well-being outcomes; addresses systemic and individualized practices and policies that drive disproportionate outcomes for: BIPOC (Black, Indigenous, and people of color), LGBTQ+, disabled, and other children and youth; and promotes and defends the legal rights and life prerogatives of children, the trajectory of whose lives will be decided in the course of the dependency proceeding.
OCLA has partnered with CITA at the AOC and JustLead Washington to provide a wide rangeof trainings. JustLead Washington has developed a race equity curriculum tailored specifically to child welfare attorneys that is required training for CRP attorneys.
Attorneys have been trained on a variety of topics including: child interviewing techniques, advocating for the legal interests of preverbal children, special considerations when representing LGBTQ+ youth, boundaries and self-care when representing children and youth, and immigration considerations when representing non-citizen children. There is also required ongoing training that helps the attorneys to understand their own implicit biases, and how structural, systemic, and institutional racism impacts the child welfare system. Through this training the attorneys are given tools to interrupt, identify, and litigate racialized practices where they see them.
A very strong children’s representation bar has developed in Washington State that is supported by a CRP listserv where attorneys regularly pose questions to one another and share information regarding current law and issues that impact children and youth in the child welfare system.
CRP attorneys regularly travel out of state to visit clients housed in foster homes, group homes, and relative placements. This not only allows attorneys to develop the necessary rapport with their clients, but it helps to ensure that the children and youth are safe in their distant placements and are able to see a familiar face.
OCLA is responsible for ensuring that CRP attorneys provide the most effective legal representation, and that outcomes achieved are consistent with the stated and legal interests of their young clients. OCLA employs multiple tools to review the performance of its contract attorneys consistent with these objectives.
COLLABORATION WITH OTHER CHILD WELFARE PARTNERSChildren’s Representation Program

49
Children’s Representation Program attorneys have represented nearly 4,971 children since the start of the program in July 2014. There have been over 3,400 adoptions, 63 guardianships, 223 youth entering into the Extended Foster Care Program, and 17 Third Party Custody Agreements executed. Because collaboration is crucial to the dependency court process, CRP attorneys work with other members of the child welfare team to ensure that the best outcomes, consistent with the child’s stated and legal interest, are achieved. When an agreement cannot be reached, CRP attorneys, consistent with their training and ethical duty, file motions for necessary services and placement changes on behalf of their clients. These motions are not only consistent with the rights that foster children are entitled to while in the state’s care, but are also critical to their well-being.
In 2017, ESSB 5890 was passed by the Legislature and signed into law. Section 28 of the bill directed OCLA to engage WSCCR at the AOC, and other research institutions, to undertake a comparative study of the impact of early representation of children in dependency cases. WSCCR secured research assistance from the University of Washington School of Social Work. The study compares time to permanency, relevant child welfare indicators and outcomes, and potential cost savings from the appointment of attorneys for children at the shelter care hearing in “treatment counties” with those for children in “control counties” who are not represented. Grant and Lewis Counties were selected as the treatment counties. Whatcom and Douglas Counties are the control counties.
Appointments of attorneys for children and youth involved with new dependency cases in study counties ended on September 1, 2019. Attorneys appointed to cases during the study will continue to represent the children through the life of the case. In Grant and Lewis Counties, 417 children and youth were represented under the study. The report from WSCCR indicated the following outcomes.
• Children with mandatory legal representation were more likely to experience reunification or guardianship than to become legally free or adopted. Specifically, the reunification or guardianship rate of children with mandatory representation is about 41% higher than the rate of reunification or guardianship for children without mandatory representation. All guardianships have been with relatives.
• Children with mandatory legal representation exited the child welfare system at a faster rate than children without mandatory legal representation.
• The mandatory appointment of attorneys for children led to cost savings to the state.
The full report will be submitted to the Legislature at the end of March 2021.

50
Child Advocates/Court Appointed Special AdvocatesWhat is a Child Advocate?A child comes to the attention of the court once a dependency petition, alleging abuse or neglect, has been filed at juvenile court. At the first hearing, the court may order that a court appointed special advocate or volunteer guardian ad litem be appointed for the child (RCW 13.34.100). The court appointed special advocates may be called child advocate, CASA, volunteer guardian ad litem, etc. For the purpose of this report, the term child advocate will be used. Child advocates are volunteer community members who provide a carefully researched background of the case to help the court make a sound decision about the child's future.
Best interest advocacy is driven by the guiding principle that children grow and develop best with their family of origin when that can be safely achieved. Child advocate duties include: information gathering and interviewing, communicating and collaborating with all parties, visiting with the child regularly, monitoring court orders, and advocating for the child in meetings with the school, caregivers, family, in court, and in court reports. The child advocate also reports the child’s stated interests. The child advocate makes a recommendation to the court on placement and follows through on the case until it is permanently resolved. Child advocates are often the only stable factor in an often frightening and difficult ordeal for a child. The goal is family reunification if that can be achieved safely.
In 2020, the network of 35 Child Advocate and CASA programs across the state needed to fundamentally restructure how volunteers and staff carried out virtually every aspect of child advocacy. Without the ability to have in-person contact or meetings, many advocate activities had to be immediately transitioned to virtual formats starting in March.
Advocate-Child VisitsOne of the core aspects of advocacy provided to the court includes getting to know the child, their family, and their caregivers by frequent communication and in-person visits in the child’s placement and other locales. Many of these visits by necessity switched to a virtual format— using videoconferencing and other virtual platforms. When safe to do so and while adhering to strict social distancing and proper use of personal protective equipment (PPE), some in-person visits were implemented and became collectively known as “Porch Visits”—meeting with the child and caregivers outdoors, masked, and appropriately distant.
Recruitment and TrainingChild advocates undergo a thorough screening, background check, and 30 hours of pre-service training and court observation, in addition to 12 hours of continuing education training annually. Program staff supervise and support child advocates. Throughout the training, family reunification (either with a child’s birth family or extended family) is the ultimate goal when it can be done safely and is in the best of interests of the child for the long term.
Two associations provide support to child advocates in Washington State and are described on the next page.
51
Washington Association of Child AdvocatesThe former Washington State CASA, now known as Washington Association of Child Advocate Programs (WACAP), had its membership terminated by National CASA in 2019. Ten of the 35 local programs retained their National CASA/GAL membership. This resulted in several name changes for local programs and their volunteers, including the switch to “Child Advocates,” “Volunteer Guardians ad Litem,” and “Dependency Guardian ad Litem,” to name of few. WACAP provides support to all child advocate programs, whether or not they belong to National CASA.
In early 2020, the AOC granted approval of the WACAP Core Training curriculum for training and certifying new volunteer advocates for Title 13 dependency cases. While initially developed to be conducted locally and in-person by local program staff, WACAP facilitated (with the assistance of local program staff) the first ever statewide on-line training for new advocates in May, June, and October. In all, WACAP trained over 225 potential new advocates from 25 local programs in 2020. Additionally, several other local programs hosted core trainings, training over 100 volunteers. Sessions are also recorded and posted to a private YouTube channel. Topics include child development, child mental health, keeping children safe while in care, child and family trauma, Adverse Childhood Experiences (ACEs) and resiliency, chemical dependency recovery, domestic violence, institutional racism and bias, working with LGBTQ youth, education advocacy, and attachment and bonding.
WACAP also conducts “Days of Data” semi-annual surveys which asks a series of questions about children the child advocates represent, including visitation, well-being, placement, and education related information. A link to the reports is provided here: http://wachildadvocates.org/current-projects/outcomes/. Washington Court Appointed Special Advocate AssociationThe Washington Court Appointed Special Advocate (CASA) Association is a network of ten local programs across Washington State, and through membership with National CASA/GAL for Children, belongs to a network of 950 community-based programs nationwide. In January of 2021, local CASA/GAL programs began to integrate the 11 updated standards that reflect a focus on becoming a highly effective organization at the state and local levels as well as the unwavering commitment to providing quality volunteer advocacy for children. The objective of Standards for Local CASA/GAL Programs is to set performance levels for local programs to ensure quality while allowing individual programs room for creativity and innovation. Washington CASA is strongly committed to high quality, best-interest advocacy and dedicated to integrating diversity, equity, and inclusion by providing technical assistance to the local network to achieve these standards.
To help local CASA/GAL programs adapt in 2020, National CASA provided technology grants so they could purchase annual subscriptions of virtual platforms such as Zoom. Local CASA/GAL programs successfully utilized the virtually modified pre-service training curriculum provided by National CASA and continued to safely train volunteers through the COVID-19 pandemic. Additionally, local programs had access to relevant and timely COVID-19 resources and webinar trainings available from the national membership network.

52
The Commission on Children in Foster CareCo-chaired by a Supreme Court Justice and the Assistant Secretary of DCYF, the Commission on Children in Foster Care’s mission is to “provide all children in foster care with safe, permanent families in which their physical, emotional, intellectual, and social needs are met.” Stakeholders, including representatives from the courts, tribes, Legislature, OPD, OCLA, Office of the Superintendent of Public Instruction, Attorney General’s Office, parent allies, foster parents, foster youth alumni, foster youth in care, and child advocates/court appointed special advocates (CASAs) work to promote communication, collaboration, and cooperation. For example, in 2016 the Commission created work groups examining legal representation for children in foster care and responding to foster youth’s perceived needs for improved sex education. The Commission also promotes Reunification Day and Adoption Day celebrations throughout the state. Additionally, the Commission initiated and supports the annual Youth Leadership Summit, where foster youth and alumni are given a voice and an opportunity to exchange concerns, challenges, and suggestions for systems improvements. Policymakers, advocates, and community members work alongside youth to address the proposed reforms.
In order to provide for the statewide consistency of practice in dependency and termination cases during the pandemic, a workgroup was formed to assist with drafting a Supreme Court order regarding dependency and termination cases, which covered procedures for shelter care hearings and other emergency matters, appointment of counsel for children, visitation motions, and overall due process requirements, among other matters. Later a stakeholder group created comprehensive guidelines for implementing the orders and reestablishing court proceedings, entitled Resuming Dependency Fact Finding and Termination of Parental Rights Trials in Washington State. These orders and guidelines have been followed by many courts throughout the state to ensure fairness for families in dependency and termination cases.
Also, in response to a proclamation from the governor allowing DCYF to limit in-person family time visits and provide virtual contact instead, the Commission created a multidisciplinary work group to address issues related to family time and to quickly and collaboratively address COVID-19 related issues impacting the child welfare and court systems. The COVID Rapid Response Work Group included CIP staff; child welfare agency leaders and several staff; youth; parents; caregivers; attorneys for youth, parents, and the agency; child advocates; CASAs; visit providers; and the Governor’s Office.
The work group addresses issues as they arise and creates uniform messages to be communicated to all involved across disciplines in the child welfare system, which is challenging. The group works collaboratively to develop processes and messages regarding topics such as: family time, delaying unnecessary termination of parental rights trials, mental health of children and youth, etc.
The Temporary COVID Aware Family Time Plan guidance was developed by the work group and creates a three-tiered process to support the co-creation of individualized plans: https://www.dcyf.wa.gov/sites/default/files/FamTimePlan.pdf.

53
In December 2020, the Commission decided to provide oversight of the State Team Action Plan. The National Judicial Leadership Summit: Ensuring Justice in Child Welfare was held in August 2020. The focus of the summit was reducing racial injustice in the child welfare system, reducing unnecessary removals of children from their parents, and improving high-quality legal representation, not only in the child welfare court system, but also upstream (preventing the case from even coming before the court by assisting families in remedying safety issues). Each state multidisciplinary team was asked to create an action plan. Using CIP funding, the AOC is hiring a part-time project manager to facilitate the stakeholder workgroups to further vet ideas proposed in the action plan and determine how to be strategic in fitting this work in with systemic changes already occurring in order to maximize resources.
Extended Foster CareExtended Foster Care (EFC) is a voluntary program that offers dependent youth the option of receiving services until age 21. Supporting youth during their transition to adulthood is vital to their success.
In 2011 legislation was enacted establishing the EFC program in Washington for youth ages 18 to 21 who were participating in or completing a secondary education program. Between 2011 and 2017, additional eligibility categories were added. As a result, the majority of youth who are dependent on their 18th birthday are now eligible for the program.
The Legislature made the most recent change to the legislation in 2017. It expands eligibility to youth who are dependent on their 18th birthday, allowing dependent youth who turn 18 years old in the care and custody of Juvenile Rehabilitation, on in home dependencies, trial return home, dependency guardianships, and any other dependent youth under 13.34 RCW to be eligible for the program. This legislation also allows youth to enter and exit the program as they choose from 18 to 21 years old. The ability to enter and exit the program provides youth the opportunity to determine the level of independence and support they need.
Eligible youth are those who are dependent on their 18th birthday and meet one of the following criteria:
• enrolled in high school or a high school equivalency program; • enrolled, applied for, or can show intent to timely enroll in a post-secondary academic or post-secondary vocational certification program; • participating in a program or activity designed to promote or remove barriers to employment, including part-time employment; • employed 80 hours or more a month; or • unable to engage in any of the above activities due to a documented medical condition.

54
Enrollment in EFC continues to increase:
• January 2015 390 • December 2015 463 • December 2016 567 • December 2017 609 • December 2018 713 • December 2019 786 • December 2020 834
Indian Child Welfare Act ProjectsThe Indian Child Welfare Act (ICWA) is designed to protect the rights of children and the integrity of Native families. Efforts have continued to educate child welfare professionals and the courts to implement the changes to the 25 CFR 23 - Indian Child Welfare Act (ICWA) Proceedings (Final Rule), published in 2016.
The Washington State Supreme Court decision In re Dependency of Z.J.G. ruled that courts in dependency proceedings must use a broad interpretation when determining if there is “reason to know” a child is an Indian child for purposes of both the state and federal Indian Child Welfare Acts.
ICWA training is provided at the annual Children’s Justice Conference sponsored by DCYF. In addition, the Court Improvement Training Academy provides ICWA training at the annual judicial dependency trainings, which include tribal court judges along with state court judicial officers.
In August 2020, CITA provided support for the virtual Indigenous Children, Youth and Families Conference, co-sponsored by DCYF’s Office of Tribal Relations and the Alliance for Child Welfare Excellence. The conference focused on Indigenous family wellness and included legal sessions addressing the Indian Child Welfare Act (ICWA), its application in Washington State, and an exploration of the ICWA court model. The recordings can be accessed here: https://www.dcyf.wa.gov/tribal-relations/training.
The following are DCYF activities related to compliance with the federal and state ICWA.
• The Tribal Policy Advisory Committee (TPAC) meetings occur quarterly. The primary focus of TPAC is to inform DCYF leadership on tribal priorities regarding child welfare, early learning, and juvenile rehabilitation programs and provide an avenue for ongoing dialogue on substantive issues impacting children and families in tribal communities. TPAC is intended to be an enhancement of the tribal consultation process by helping identify potential roundtable issues, but will not take the place of formal consultation.
• DCYF has bi-monthly Indian Child Welfare subcommittee and Indian Policy for Early Learning (IPEL) meetings. All Tribes and Recognized American Indian Organizations (RAIO’s) are invited. Due to COVID-19, all meetings have been via Zoom.

55
• Continued work on completing and updating existing Memorandums of Agreement (MOA’s) with each tribe that wants an agreement. These MOA’s help establish clear roles and responsibilities for how DCYF will work with each tribe.
• Regional ICW Case Reviews continue to occur in some offices as part of the 10.03 plans. These reviews are completed via Zoom by both tribal and DCYF staff.
• Qualified Expert Witness (QEW) training for tribal and DCYF staff have been scheduled through the Alliance. DCYF is working to develop and maintain a list of QEW’s for each Region.
• DCYF continues to work with the Alliance to improve the ICWA components of trainings.
• Tribal/State workgroups were convened to discuss changes that will be necessary to align DCYF policies with the Z.J.G. Washington State Supreme Court Opinion.
Innovative Dependency Court CollaborativeThe Innovative Dependency Court Collaborative (IDCC) was established in 2019 to encourage, generate, and support innovation with interested dependency court stakeholders and communities to empower and achieve justice for families. The Collaborative resulted from a reformation of the Permanency CQI Work Group in order to better align its work with the federal Children’s Bureau’s new vision and strategies for strengthening families. This new committee comprises a broader array of stakeholders, including early intervention/prevention services, and meets the CIP requirements for a statewide multidisciplinary task force.
In addition to DCYF and AOC staff, the IDCC consists of representatives from the judiciary, tribes, parent allies, youth, caregivers, parent representation, child representation, Attorney General’s Office, CASA/GAL, Juvenile Court Administrators, Casey Family Programs, and Partners for Our Children.
Many members of the IDCC are also members of the COVID Rapid Response Work Group of the Commission on Children in Foster Care, and due to limited time and resources, IDCC meetings were put on hold for most of 2020 while the work group focused on responding to pandemic-related issues. In an effort to provide efficiencies for staff and members participating in these two groups, there is currently a proposal to integrate the requirements of the CIP multidisciplinary task force, currently the IDCC, into the Commission on Children in Foster Care.

56
Parent’s Representation ProgramThe Washington State Office of Public Defense (OPD) Parents Representation Program (PRP) provides state-funded attorney representation and case support services to indigent parents, custodians, and legal guardians involved in child dependency and termination of parental rights proceedings. The program began in 2000 after the Legislature directed OPD to implement a pilot program providing enhanced legal representation in the Pierce and Benton/Franklin County juvenile courts.
In 2005 the PRP began expanding to other Washington counties, and effective July 1, 2018, the program provides representation in all Washington State counties. Key elements of the PRP include the implementation of caseload limits and PRP attorney and social worker standards, access to expert services, access to independent social workers, OPD oversight, and ongoing training and technical support. The program also works collaboratively with Children’s Home Society of Washington’s Parents for Parents Program and the Washington Defender Association’s Incarcerated Parents Project.
In 2020, PRP program staff participated in multiple emergent statewide committees and trainings to address issues arising during the COVID-19 pandemic as well as provided technical assistance to contractors on COVID-19 impacted issues like visitation, remote technology, and remote vs. in-person hearings. The PRP also offered a three part remote training on Anti-Racist Legal Strategies in Child Welfare Cases. On the national front, PRP program staff and the OPD agency director participated on committees for the Family Justice Initiative (FJI), a national effort to assure high-quality attorneys for every parent and child in child welfare proceedings. Work with the FJI included co-chairing the FJI executive committee as well as co-chairing the Quality Work Group to create national attributes of high-quality representations and how-to guides for states to implement those attributes. Finally, PRP program staff participated in multiple ongoing statewide committees and other efforts to collaborate with child welfare stakeholders to strengthen Washington’s child welfare system, including among others: Family Time Workgroup; Coalition for Children of the Incarcerated Parent; Washington State Parent Ally Committee; Children’s Justice Task Force; Innovative Dependency Court Collaborative; Alliance for Child Welfare Regional Core Training; Children, Youth, and Family Services Advisory Committee; and CAPTA Citizen’s Review Panel.
Since its inception, the PRP has been evaluated numerous times, finding positive outcomes. The evaluations include a national peer reviewed study of the program that found that the PRP’s enhanced legal representation reduced the days to establishing permanency for children in foster care by speeding up reunification with parents, or where reunification was not possible, by speeding up permanency through guardianship or adoption. See M.E. Courtney, J.L. Hook, “Evaluation of the Impact of Enhanced Parental Legal Representation on the Timing of Permanency Outcomes,” Children and Youth Services Review 34 (2012): 1337–1343. Additionally, the U.S. Children’s Bureau has highlighted the PRP as an exemplary model for delivering parent representation. See U.S. Department of Health and Human Services’ Administration on Children, Youth and Families, Children’s Bureau, U.S. Department of Health and Human Services’ Administration on Children, Youth and Families, Log No: ACYF-CB-IM-17-02 (January 17, 2017) available online at: https://www.acf.hhs.gov/cb/policy-guidance/im-17-02. Further information about the PRP is available at www.opd.wa.gov.

57
Washington’s Program Improvement PlanWashington State Department of Children, Youth, and Families (DCYF) participated in Round 3 of the federal Child and Family Services Review (CFSR) from April 2018 through September 2018. The CFSR enables the federal Children’s Bureau to: (1) ensure conformity with certain federal child welfare requirements, (2) determine what is actually happening to children and families as they are engaged in child welfare services, and (3) assist states in enhancing their capacity to help children and families achieve positive outcomes.
Based on the results of the CFSR, Washington State developed a Program Improvement Plan (PIP) to address the areas of non-conformity. DCYF engaged state, regional, and local stakeholder groups in the process of problem identification, root cause analysis, and the development of goals, strategies, and activities to address the areas needing improvement and develop the PIP. The federal Children’s Bureau approved the PIP on June 19, 2020, with a start date of July 1, 2020. DCYF has two years to implement the identified PIP strategies and activities with up to an additional 18 months of measurement. The Children’s Bureau identified specific measures and target PIP goals that DCYF must meet by the end of the PIP measurement period. Failure to fully implement PIP strategies and activities and meet identified PIP target goals can result in a financial penalty of up to $6.4 million for the agency.
Strategies and activities were developed related to the following federal outcomes.
• Safety Outcome 1: Children are, first and foremost, protected from abuse and neglect. • Safety Outcome 2: Children are safely maintained in their homes whenever possible and appropriate. • Permanency Outcome 1: Children have permanency and stability in their living situations. • Well-Being Outcome 1: Families have enhanced capacity to provide for their children’s needs.
Achieving safe, timely permanency will require strong partnerships and understanding of the CFSR outcomes and systemic factors across all partners in the dependency court system. While the Children’s Bureau focuses on DCYF for the CFSR, the expectation that the state as a whole will come together to improve outcomes for children as decision making and practice by the courts, attorneys, guardians ad litem, and others plays a role in achieving safe, timely permanency for children. Within the areas of needed improvement, some of the specific federal outcomes that are impacted by the system as a whole include:
• establishing timely appropriate permanency goals based on the circumstances of the case; • concerted efforts to achieve timely permanency across all types of permanent plans; • timely review and permanency planning hearings; and • timely filing of a petition for termination of parental rights or documentation of a compelling reason not to file.
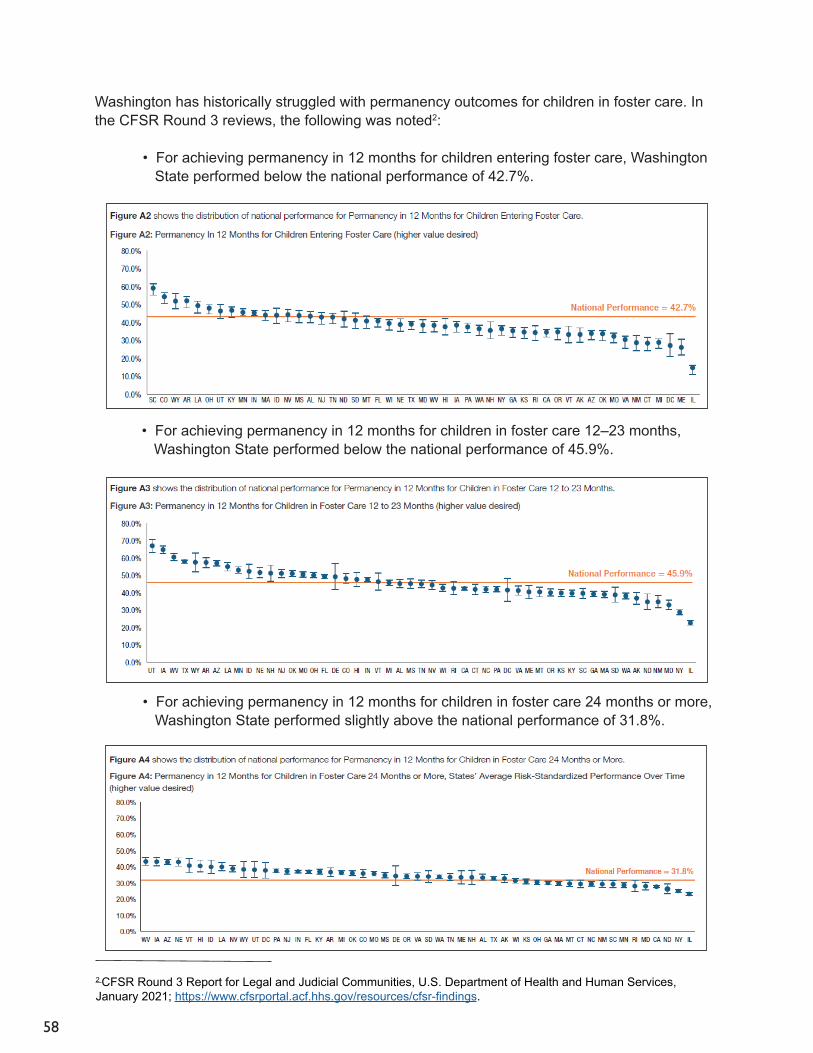
58
Washington has historically struggled with permanency outcomes for children in foster care. In the CFSR Round 3 reviews, the following was noted2:
• For achieving permanency in 12 months for children entering foster care, Washington State performed below the national performance of 42.7%.
2 CFSR Round 3 Report for Legal and Judicial Communities, U.S. Department of Health and Human Services, January 2021; https://www.cfsrportal.acf.hhs.gov/resources/cfsr-findings.
• For achieving permanency in 12 months for children in foster care 12–23 months, Washington State performed below the national performance of 45.9%.
• For achieving permanency in 12 months for children in foster care 24 months or more, Washington State performed slightly above the national performance of 31.8%.
59
DCYF continues to collaborate and partner with the Administrative Office of the Courts, key partners and stakeholders, and the Children’s Bureau to implement the PIP and improve outcomes for children and families. Below are specific strategies involving court partners.
• Developing, understanding, and articulating consistent language regarding DCYF’s Safety Framework and implementation of caseworker and court practice changes related to the Safety Framework.
• Implementing a statewide process for timely referral and filing of termination petitions that clearly delineate expectations, roles, and responsibilities for DCYF and Attorney General’s Office staff.
• Increasing earlier and more frequent engagement in the child welfare process and improve outcomes by strengthening the use of Parents for Parents (P4P).
• Improving timely referrals for and completion of home studies.
All of these strategies are aimed at systemic improvement in permanency outcomes for children and youth in out-of-home care. DCYF submits biannual reports to the Children’s Bureau on progress of implementation of strategies and activities and measurement period results.
60
Youth Leadership SummitThe Court Improvement Program provides ongoing support and funding to the Mockingbird Society to sponsor the annual Youth Leadership Summit. In 2020 the Supreme Court Commission on Children in Foster Care co-hosted the summit in partnership with the Office of Homeless Youth Prevention and Protective Programs Advisory Committee. This effort included peers from the Youth Advocates Ending Homelessness program. Policymakers, advocates, and community members work alongside youth throughout the year to address the proposed reforms. The proposals are presented by the youth at the summit to the Washington State Supreme Court Commission on Children in Foster Care, the Office of Homeless Youth Prevention and Protective Programs Advisory Committee, legislators, and other stakeholders. The presentations combine research and data to describe problems the youth identify, personal experiences that underscore the impact of these problems, and thoughtful solutions that will improve the system. These proposals initiate a year-round effort to bring positive changes that will benefit those who are currently in foster care or homeless, as well as those who have yet to enter the system.
At the 2020 summit, youth from across the state proposed the following reforms:
• improve homeless youth caseworker retention by reducing paperwork;
• address racial disproportionality and other systemic biases within Child Protective Services with an equity toolkit that includes youth voice;
• improve family connections for children and youth in foster care through centralization, data collection, and virtual visits. This includes those with siblings placed in other systems;
• establish an intergovernmental task force to identify the barriers and gaps Native youth face in accessing state services;
• ensure hygiene and wound care resources for youth and young adults experiencing homelessness after discharge from hospitals and clinics; and
• address police brutality by removing power and funding from the criminal justice system and reallocate funds to community solutions informed by those most impacted.
The first year the Youth Leadership Summit was provided in a virtual format was 2020. The recording is located here: https://www.mockingbirdsociety.org/annual-events/youth-leadership-summit.

This page left intentionally blank.

APPENDICES
SUMMARY TABLES BY COUNTY
PERFORMANCE MEASURES
OUTCOMES & DEMOGRAPHICS
DEPENDENCY FILINGS & RE-DEPENDENCY
APPENDIX A: FJCIPAPPENDIX B: DEMOGRAPHICSAPPENDIX C: COUNTY LEVEL DATA

69 69 72 67
49
0
20
40
60
80
100
2016 2017 2018 2019 2020
n = 14138
Percent of Cases with Fact-Finding within 75 Days
83 84 86 8572
0
20
40
60
80
100
2016 2017 2018 2019 2020
n = 9409
Percent of First Dependency Review Hearings within Six Months
88 88 89 8974
0
20
40
60
80
100
2016 2017 2018 2019 2020
n = 8751
Percent of Cases with Permanency Planning Hearing within 12 Months
Statewide
66 66 6659
47
0
20
40
60
80
100
2016 2017 2018 2019 2020
n = 7770
Percent of Cases with TPR Filed before 15 Months of Out-of-Home Care
Statewide
30 28 28 27 250
20
40
60
80
100
2016 2017 2018 2019 2020
n = 12874
Percent of Cases with Permanency before 15 Months of Out-of-Home Care
Statewide
4335
26 27 32
0
20
40
60
80
100
2016 2017 2018 2019 2020
n = 4086
Percent of Cases with Adoption Completed within Six Months of Termination Order
Statewide
- - -
Statewide - - -
- - - - - -
- - - - - -
Statewide
APPENDIX A: APPENDIX A: PERFORMANCE OF THE FJCIP COURTS ON PERFORMANCE OF THE FJCIP COURTS ON DEPENDENCY TIMELINESS INDICATORSDEPENDENCY TIMELINESS INDICATORS
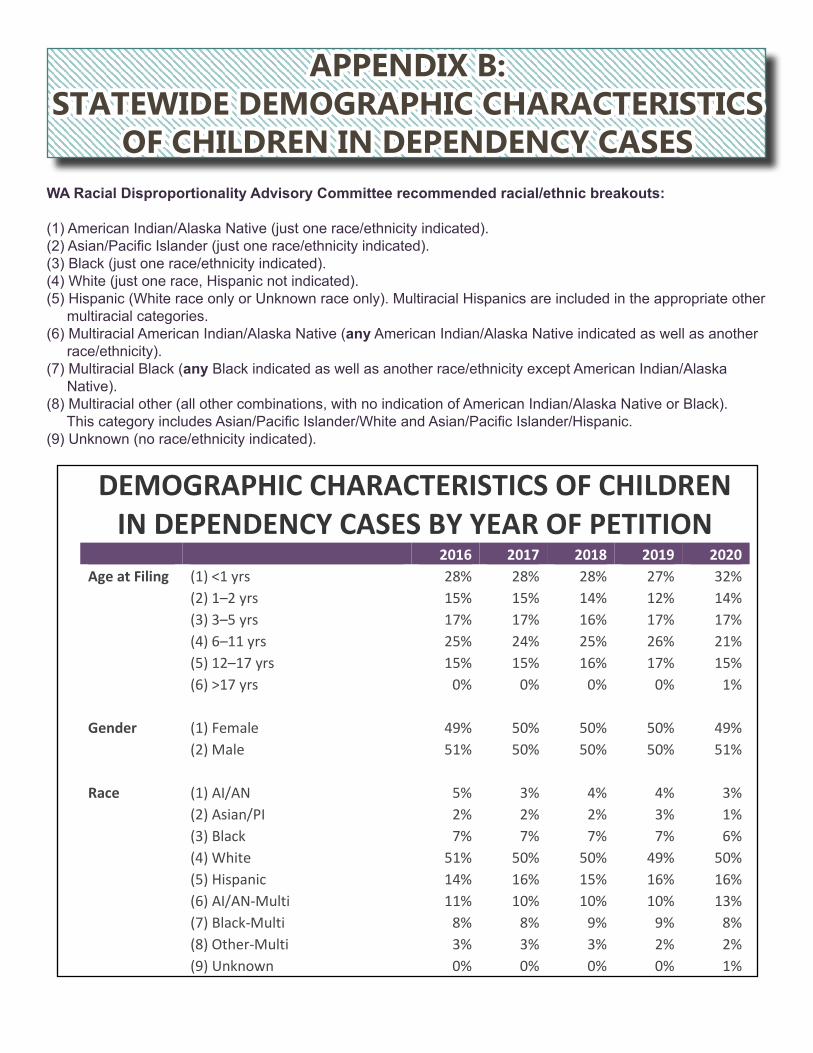
DEMOGRAPHIC CHARACTERISTICS OF CHILDREN IN DEPENDENCY CASES BY YEAR OF PETITION
2016 2017 2018 2019 2020 Age at Filing (1) <1 yrs 28% 28% 28% 27% 32%
(2) 1–2 yrs 15% 15% 14% 12% 14%
(3) 3–5 yrs 17% 17% 16% 17% 17% (4) 6–11 yrs 25% 24% 25% 26% 21% (5) 12–17 yrs 15% 15% 16% 17% 15% (6) >17 yrs 0% 0% 0% 0% 1%
Gender (1) Female 49% 50% 50% 50% 49% (2) Male 51% 50% 50% 50% 51%
Race (1) AI/AN 5% 3% 4% 4% 3% (2) Asian/PI 2% 2% 2% 3% 1%
(3) Black 7% 7% 7% 7% 6% (4) White 51% 50% 50% 49% 50% (5) Hispanic 14% 16% 15% 16% 16% (6) AI/AN-Multi 11% 10% 10% 10% 13% (7) Black-Multi 8% 8% 9% 9% 8% (8) Other-Multi 3% 3% 3% 2% 2% (9) Unknown 0% 0% 0% 0% 1%
APPENDIX B: APPENDIX B: STATEWIDE DEMOGRAPHIC CHARACTERISTICS STATEWIDE DEMOGRAPHIC CHARACTERISTICS
OF CHILDREN IN DEPENDENCY CASESOF CHILDREN IN DEPENDENCY CASESWA Racial Disproportionality Advisory Committee recommended racial/ethnic breakouts:
(1) American Indian/Alaska Native (just one race/ethnicity indicated).(2) Asian/Pacific Islander (just one race/ethnicity indicated).(3) Black (just one race/ethnicity indicated).(4) White (just one race, Hispanic not indicated).(5) Hispanic (White race only or Unknown race only). Multiracial Hispanics are included in the appropriate other multiracial categories.(6) Multiracial American Indian/Alaska Native (any American Indian/Alaska Native indicated as well as another race/ethnicity).(7) Multiracial Black (any Black indicated as well as another race/ethnicity except American Indian/Alaska Native).(8) Multiracial other (all other combinations, with no indication of American Indian/Alaska Native or Black). This category includes Asian/Pacific Islander/White and Asian/Pacific Islander/Hispanic.(9) Unknown (no race/ethnicity indicated).

RACE/ETHNICITY OF CHILDREN IN DEPENDENCY CASES

• SUMMARY TABLES BY COUNTY
• PERFORMANCE MEASURES
• OUTCOMES & DEMOGRAPHICS
• DEPENDENCY FILINGS & RE-DEPENDENCY
APPENDIX C:APPENDIX C:COUNTY LEVEL DATACOUNTY LEVEL DATA

This page left intentionally blank.

Fact-Finding
1st Review Hearing
All Review
Hearings
1st Permanency
Planning Hearing
All Permanency
Planning Hearings
Termination of Parental
Rights
Adoptions w/in 6
Months
Permanency Outcomes < 15 Months
Percent of Dependencies
with a Prior Dependency
State 47% 68% 83% 69% 85% 44% 32% 24% 8%
FJCIP 49% 72% 85% 74% 85% 47% 32% 25% 7%
State-FJCIP 44% 60% 78% 60% 84% 37% 32% 22% 9%
Adams 67% 71% 94% 83% 97% 0% 0% 28% 10%
Asotin 0% 14% 87% 60% 75% 50% 17% 41% 0%
Benton 32% 62% 80% 0% 29% 25% 29% 4%
Chelan 86% 86% 94% 100% 92% 65% 21% 20% 0%
Clallam 55% 86% 96% 84% 87% 45% 100% 48% 15%
Clark 49% 62% 75% 73% 76% 29% 40% 21% 8%
Columbia 0% 100% 50% 33%
Cowlitz 21% 20% 67% 36% 86% 30% 41% 32% 4%
Douglas 53% 50% 75% 82% 75% 13% 44% 4% 31%
Ferry 100% 100% 100% 100% 25% 0% 9% 0%
Franklin 44% 92% 86% 94% 100% 32% 60% 0% 0%
Garfield 25% 0% 44% 0% 100% 100% 25%
Grant 15% 0% 79% 39% 78% 27% 25% 22% 6%
Grays Harbor 48% 60% 80% 73% 96% 28% 10% 17% 5%
Island 19% 56% 93% 100% 97% 74% 44% 32% 0%
Jefferson 38% 50% 81% 91% 91% 43% 0% 42% 0%
King 25% 38% 73% 43% 71% 21% 19% 17% 2%
Kitsap 61% 87% 89% 94% 90% 84% 44% 14% 4%
Kittitas 65% 70% 89% 70% 81% 7% 50% 0% 0%
Klickitat 23% 67% 95% 50% 88% 25% 78% 10% 18%
Lewis 76% 93% 86% 96% 86% 42% 5% 12% 23%
Lincoln 33% 100% 0% 100% 0% 67% 0%
Mason 21% 38% 71% 55% 66% 76% 8% 21% 13%
Okanogan 78% 87% 98% 95% 95% 25% 0% 16% 0%
Pacific 36% 60% 72% 17% 100% 57% 10% 38% 0%
Pend Oreille 20% 33% 91% 33% 83% 0% 0% 13% 0%
Pierce 68% 84% 91% 88% 94% 51% 50% 26% 8%
San Juan 50% 100% 60% 30% 58% 38% 20% 0%
Skagit 73% 31% 60% 41% 65% 19% 60% 23% 5%
Skamania 29% 75% 70% 50% 79% 50% 50% 43% 29%
Snohomish 44% 66% 87% 67% 82% 66% 35% 40% 4%
Spokane 52% 86% 90% 93% 96% 50% 26% 26% 13%
Stevens 91% 82% 93% 75% 99% 44% 11% 3% 11%
Thurston 54% 72% 88% 73% 82% 59% 50% 24% 7%
Wahkiakum 25% 0% 60% 0% 0% 100% 0%
Walla Walla 45% 45% 85% 53% 77% 31% 85% 45% 15%
Whatcom 38% 54% 68% 76% 87% 43% 27% 20% 10%
Whitman 6% 33% 94% 100% 93% 50% 33% 19% 0%
Yakima 64% 83% 85% 71% 86% 55% 66% 23% 12%
SUMMARY TABLES BY COUNTY
Click on each county name in the summary tables to be linked directly to more details on their performance measures, outcomes and demographics, and dependency filings in the following section. There is a link available on each page to bring you back to this table if you would like to view another county's data.

* # of Dependent Children in Care is a point in time snapshot as of 12/31/2020 of dependent children in an open out-of-home placement episode. It includes all length of stay, and includes children on trial return home status.** Drug abuse reflects parental drug abuse on the child’s placement removal. Placement removals may have multiple removal reasons.
SUMMARY TABLES BY COUNTY
*# Dependent
Children in Care – Total
on 12/31/2020
Median LOS Days
**Removal Reason Drugs
**Drug Case
Percentage
Number of Dependencies Filed in 2020
Number of Terminations Filed in 2020
State 8952 634 3894 43% 3242 1295
Adams 20 618 6 30% 10 3
Asotin 24 781 15 63% 11 2
Benton 214 428 125 58% 113 21
Chelan 95 805 44 46% 22 21
Clallam 152 477 79 52% 82 30
Clark 607 597 212 35% 235 45
Columbia 2 2357 0 0%
Cowlitz 265 795 85 32% 92 36
Douglas 56 668 26 46% 18 4
Ferry 2 399 1 50% 1 3
Franklin 88 504 38 43% 23 16
Garfield 4 330 4 100% 5
Grant 238 603 130 55% 81 27
Grays Harbor 224 564 100 45% 87 46
Island 35 699 16 46% 18 8
Jefferson 28 434 11 39% 14 1
King 1761 845 758 43% 442 289
Kitsap 309 672 122 39% 100 49
Kittitas 62 492 23 37% 23 1
Klickitat 37 595 15 41% 11 3
Lewis 155 501 74 48% 75 23
Lincoln 9 983 4 44% 2 2
Mason 181 611 84 46% 76 8
Okanogan 58 686 29 50% 16 6
Pacific 49 752 23 47% 19 13
Pend Oreille 27 1091 17 63% 8 4
Pierce 1265 590 536 42% 456 126
San Juan 9 654 5 56% 2 3
Skagit 146 682 83 57% 42 24
Skamania 17 574 4 24% 7 1
Snohomish 678 582 338 50% 261 107
Spokane 1021 541 450 44% 455 176
Stevens 56 892 27 48% 9 16
Thurston 291 578 119 41% 123 59
Wahkiakum 6 570 1 17% 1 2
Walla Walla 121 491 57 47% 53 18
Whatcom 275 686 113 41% 88 45
Whitman 39 1175 12 31% 17 5
Yakima 326 551 108 33% 144 52

This page left intentionally blank.
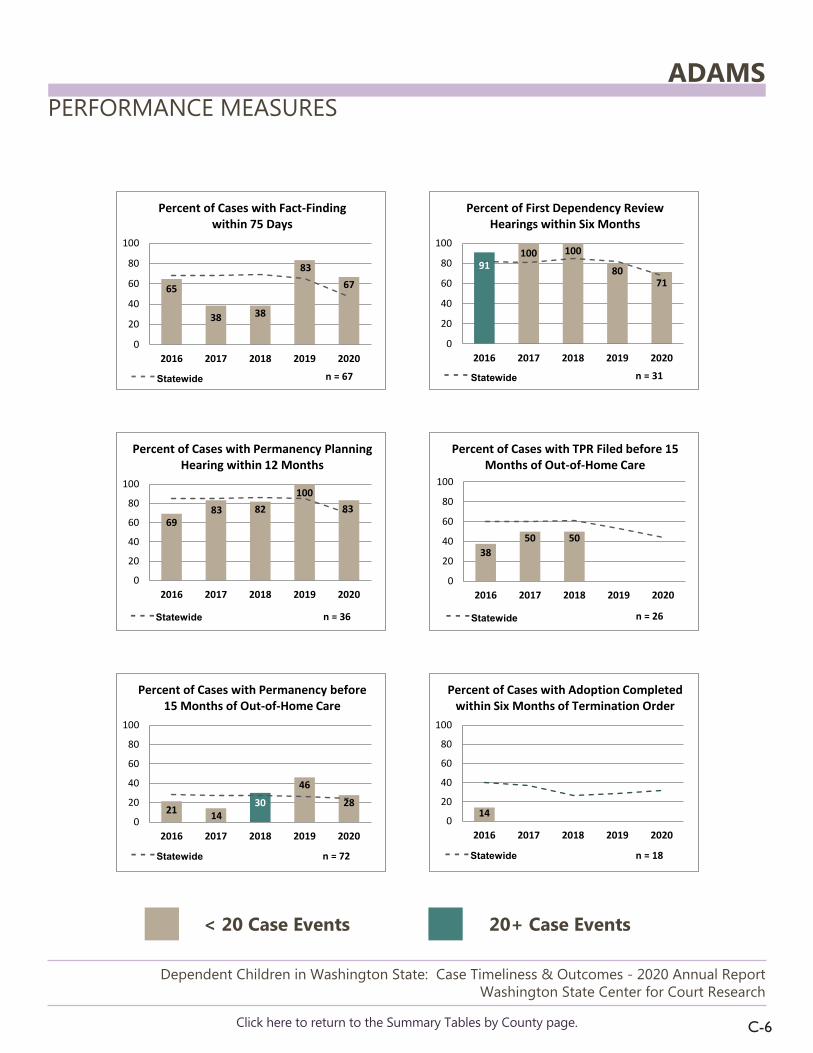
C-6
PERFORMANCE MEASURES
Dependent Children in Washington State: Case Timeliness & Outcomes - 2020 Annual ReportWashington State Center for Court Research
< 20 Case Events 20+ Case Events
Click here to return to the Summary Tables by County page.
ADAMS
65
38 38
8367
0
20
40
60
80
100
2016 2017 2018 2019 2020
n = 67
Percent of Cases with Fact-Finding within 75 Days
91100 100
8071
0
20
40
60
80
100
2016 2017 2018 2019 2020
n = 31
Percent of First Dependency Review Hearings within Six Months
6983 82
10083
0
20
40
60
80
100
2016 2017 2018 2019 2020
n = 36
Percent of Cases with Permanency Planning Hearing within 12 Months
Statewide
3850 50
0
20
40
60
80
100
2016 2017 2018 2019 2020
n = 26
Percent of Cases with TPR Filed before 15 Months of Out-of-Home Care
Statewide
3021 14
46
28
0
20
40
60
80
100
2016 2017 2018 2019 2020
n = 72
Percent of Cases with Permanency before 15 Months of Out-of-Home Care
Statewide
140
20
40
60
80
100
2016 2017 2018 2019 2020
n = 18
Percent of Cases with Adoption Completed within Six Months of Termination Order
Statewide
- - -
Statewide - - -
- - - - - -
- - - - - -
Statewide

C-7
OUTCOMES & DEMOGRAPHICS
Dependent Children in Washington State: Case Timeliness & Outcomes - 2020 Annual ReportWashington State Center for Court Research
Click here to return to the Summary Tables by County page.
ADAMS
PERMANENCY OUTCOMES Outcome Values 2016 2017 2018 2019 2020
Adoptions Median Months 39 35 45 47 56 % < 15 Months to Outcome 0% 0% 0% 0% 0%
Age of Majority/Emancipation
Median Months 18 25 % < 15 Months to Outcome 0% 0%
Guardianships Median Months 35 32 % < 15 Months to Outcome 0% 0%
Reunifications Median Months 16.5 29 27 1 9 % < 15 Months to Outcome 50% 33% 32% 86% 56%
DEMOGRAPHIC CHARACTERISTICS OF CHILDREN IN DEPENDENCY CASES BY YEAR OF PETITION
2016 2017 2018 2019 2020 Adams Age at Filing (1) <1 yrs 12% 27% 36% 40% 30%
(2) 1–2 yrs 29% 9% 9% 7% (3) 3–5 yrs 24% 36% 9% 20% 30%
(4) 6–11 yrs 35% 9% 45% 27% 40%
(5) 12–17 yrs 18% 7%
Gender (1) Female 41% 64% 45% 60% 20% (2) Male 59% 36% 55% 40% 80% Race (1) AI/AN 12% 7%
(4) White 18% 18% 27% 20% 40% (5) Hispanic 53% 73% 36% 67% 30% (6) AI/AN-Multi 9% 36% 7% 30% (7) Black-Multi 18%

C-8
DEPENDENCY FILINGS & RE-DEPENDENCY
Dependent Children in Washington State: Case Timeliness & Outcomes - 2020 Annual ReportWashington State Center for Court Research
Click here to return to the Summary Tables by County page.
ADAMS
2014 2015 2016 2017 2018 2019 2020DEP Filings 23 18 17 12 11 15 10Dismissal Counts 15 12 16 8 19 11 20TER Filings 3 3 6 11 2 4 3DEP Rate per 1000 3.17 2.38 2.26 1.58 1.45 1.99
3.17
2.38 2.26
1.58 1.451.99
0.0
0.5
1.0
1.5
2.0
2.5
3.0
3.5
0
5
10
15
20
25
Dependency and Termination Filings with Dependency Rates per 1000 Child Population and Yearly Dismissal Counts
2014-2020 - Adams
Dependency cases filed during the year that had a PRIOR dependency case for the child that ended with a documented dismissal. Includes priors within county only, and excludes dismissals documented as “Dependency Not Established.” Adoption disruptions leading to re-dependency are currently not available.
0.0%
16.7%
0.0% 0.0%
10.0%
0.0%
2.0%
4.0%
6.0%
8.0%
10.0%
12.0%
14.0%
16.0%
18.0%
2016 2017 2018 2019 2020
Prior Dependency - Adams

This page left intentionally blank.
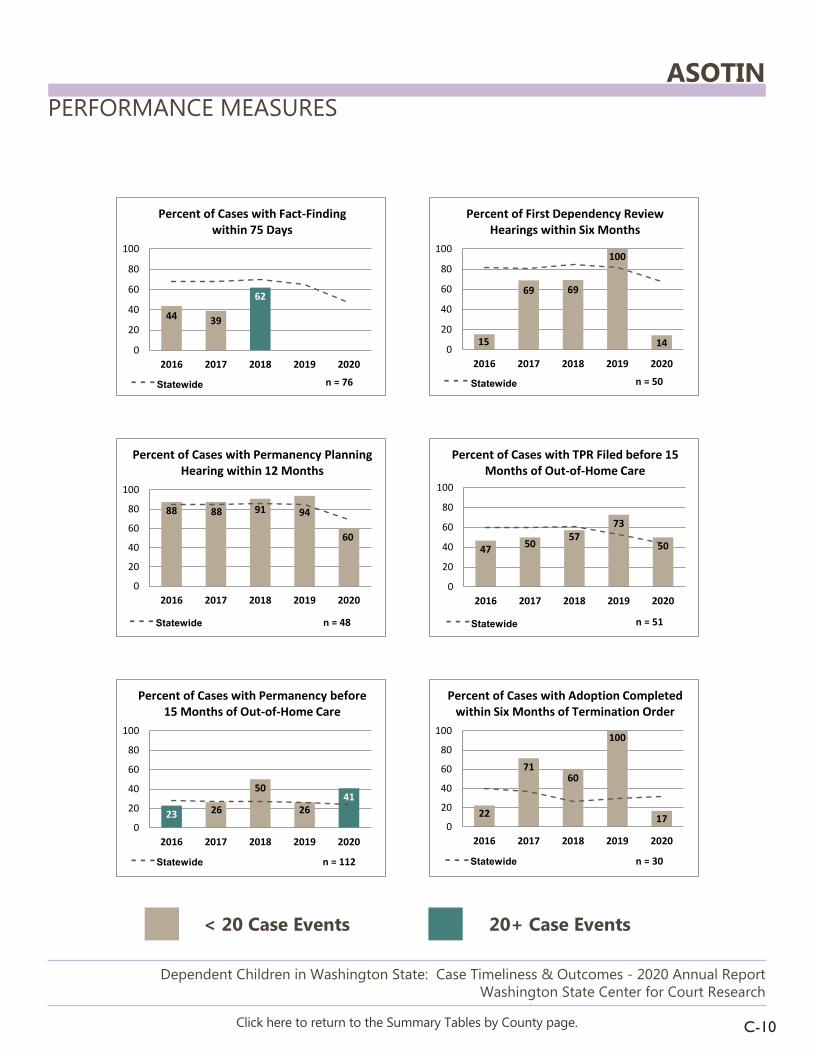
C-10
PERFORMANCE MEASURES
Dependent Children in Washington State: Case Timeliness & Outcomes - 2020 Annual ReportWashington State Center for Court Research
< 20 Case Events 20+ Case Events
Click here to return to the Summary Tables by County page.
ASOTIN
62
44 39
0
20
40
60
80
100
2016 2017 2018 2019 2020
n = 76
Percent of Cases with Fact-Finding within 75 Days
15
69 69
100
140
20
40
60
80
100
2016 2017 2018 2019 2020
n = 50
Percent of First Dependency Review Hearings within Six Months
88 88 91 94
60
0
20
40
60
80
100
2016 2017 2018 2019 2020
n = 48
Percent of Cases with Permanency Planning Hearing within 12 Months
Statewide
47 5057
73
50
0
20
40
60
80
100
2016 2017 2018 2019 2020
n = 51
Percent of Cases with TPR Filed before 15 Months of Out-of-Home Care
Statewide
23
4126
50
26
0
20
40
60
80
100
2016 2017 2018 2019 2020
n = 112
Percent of Cases with Permanency before 15 Months of Out-of-Home Care
Statewide
22
7160
100
170
20
40
60
80
100
2016 2017 2018 2019 2020
n = 30
Percent of Cases with Adoption Completed within Six Months of Termination Order
Statewide
- - -
Statewide - - -
- - - - - -
- - - - - -
Statewide

C-11
OUTCOMES & DEMOGRAPHICS
Dependent Children in Washington State: Case Timeliness & Outcomes - 2020 Annual ReportWashington State Center for Court Research
Click here to return to the Summary Tables by County page.
ASOTIN
PERMANENCY OUTCOMES Outcome Values 2016 2017 2018 2019 2020
Adoptions Median Months 27 26 32 27 22.5 % < 15 Months to Outcome 0% 14% 20% 0% 0%
Age of Majority/Emancipation
Median Months 39 % < 15 Months to Outcome 0%
Guardianships Median Months 30 31 24 % < 15 Months to Outcome 0% 0% 33%
Reunifications Median Months 21 12.5 0 17.5 13 % < 15 Months to Outcome 35% 67% 71% 38% 52%
DEMOGRAPHIC CHARACTERISTICS OF CHILDREN IN DEPENDENCY CASES BY YEAR OF PETITION
2016 2017 2018 2019 2020 Asotin Age at Filing (1) <1 yrs 57% 38% 39% 27% 18%
(2) 1–2 yrs 14% 23% 13% (3) 3–5 yrs 24% 8% 17% 18% 9%
(4) 6–11 yrs 23% 9% 27% 36%
(5) 12–17 yrs 5% 8% 22% 27% 36% Gender (1) Female 43% 46% 52% 36% 45% (2) Male 57% 54% 48% 64% 55% Race (1) AI/AN 14% 8%
(3) Black 9% 9% (4) White 67% 92% 91% 73% 73% (5) Hispanic 5% 4%
(6) AI/AN-Multi 14% (7) Black-Multi 4% 18% 18%
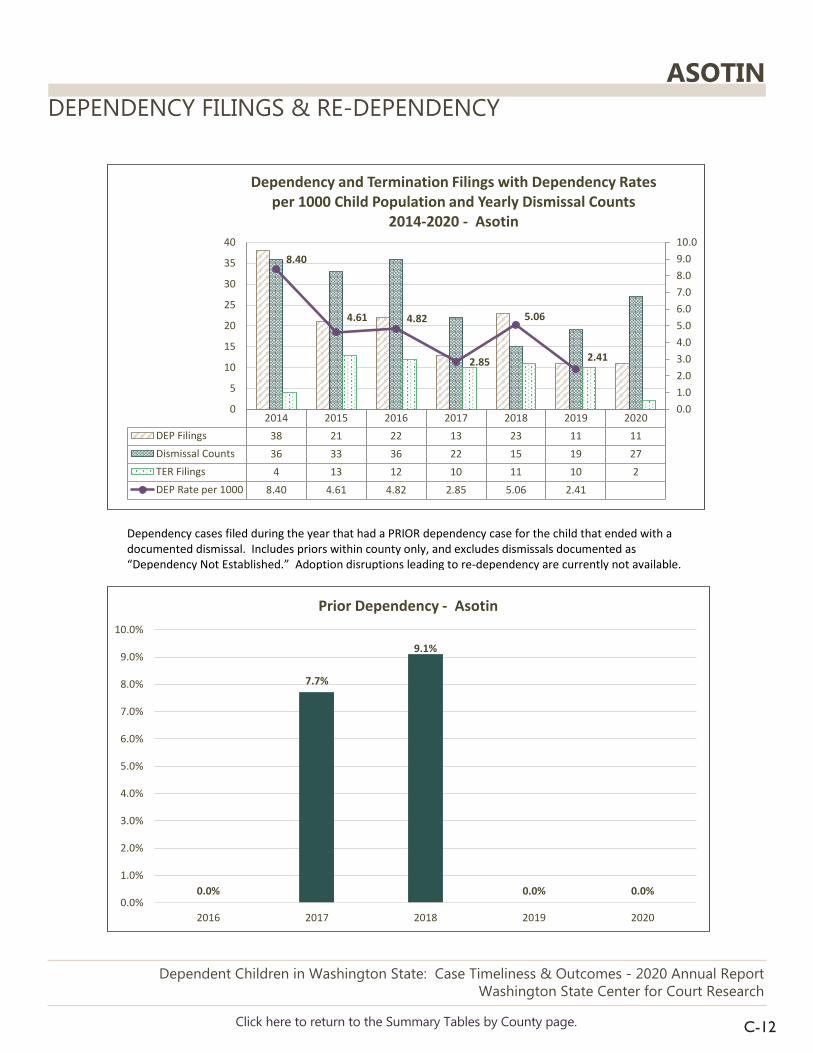
C-12
DEPENDENCY FILINGS & RE-DEPENDENCY
Dependent Children in Washington State: Case Timeliness & Outcomes - 2020 Annual ReportWashington State Center for Court Research
Click here to return to the Summary Tables by County page.
ASOTIN
2014 2015 2016 2017 2018 2019 2020DEP Filings 38 21 22 13 23 11 11Dismissal Counts 36 33 36 22 15 19 27TER Filings 4 13 12 10 11 10 2DEP Rate per 1000 8.40 4.61 4.82 2.85 5.06 2.41
8.40
4.61 4.82
2.85
5.06
2.41
0.01.02.03.04.05.06.07.08.09.010.0
0
5
10
15
20
25
30
35
40
Dependency and Termination Filings with Dependency Rates per 1000 Child Population and Yearly Dismissal Counts
2014-2020 - Asotin
Dependency cases filed during the year that had a PRIOR dependency case for the child that ended with a documented dismissal. Includes priors within county only, and excludes dismissals documented as “Dependency Not Established.” Adoption disruptions leading to re-dependency are currently not available.
0.0%
7.7%
9.1%
0.0% 0.0%0.0%
1.0%
2.0%
3.0%
4.0%
5.0%
6.0%
7.0%
8.0%
9.0%
10.0%
2016 2017 2018 2019 2020
Prior Dependency - Asotin

This page left intentionally blank.

C-14
PERFORMANCE MEASURES
Dependent Children in Washington State: Case Timeliness & Outcomes - 2020 Annual ReportWashington State Center for Court Research
< 20 Case Events 20+ Case Events
Click here to return to the Summary Tables by County page.
BENTON
8193
61
80
32
0
20
40
60
80
100
2016 2017 2018 2019 2020
n = 355
Percent of Cases with Fact-Finding within 75 Days
87
10090 93
62
0
20
40
60
80
100
2016 2017 2018 2019 2020
n = 228
Percent of First Dependency Review Hearings within Six Months
96 96 100
0
20
40
60
80
100
2016 2017 2018 2019 2020
n = 201
Percent of Cases with Permanency Planning Hearing within 12 Months
Statewide
2743 48 40
29
0
20
40
60
80
100
2016 2017 2018 2019 2020
n = 160
Percent of Cases with TPR Filed before 15 Months of Out-of-Home Care
Statewide
2233
2614
29
0
20
40
60
80
100
2016 2017 2018 2019 2020
n = 322
Percent of Cases with Permanency before 15 Months of Out-of-Home Care
Statewide
5644 46
35 250
20
40
60
80
100
2016 2017 2018 2019 2020
n = 116
Percent of Cases with Adoption Completed within Six Months of Termination Order
Statewide
- - -
Statewide - - -
- - - - - -
- - - - - -
Statewide
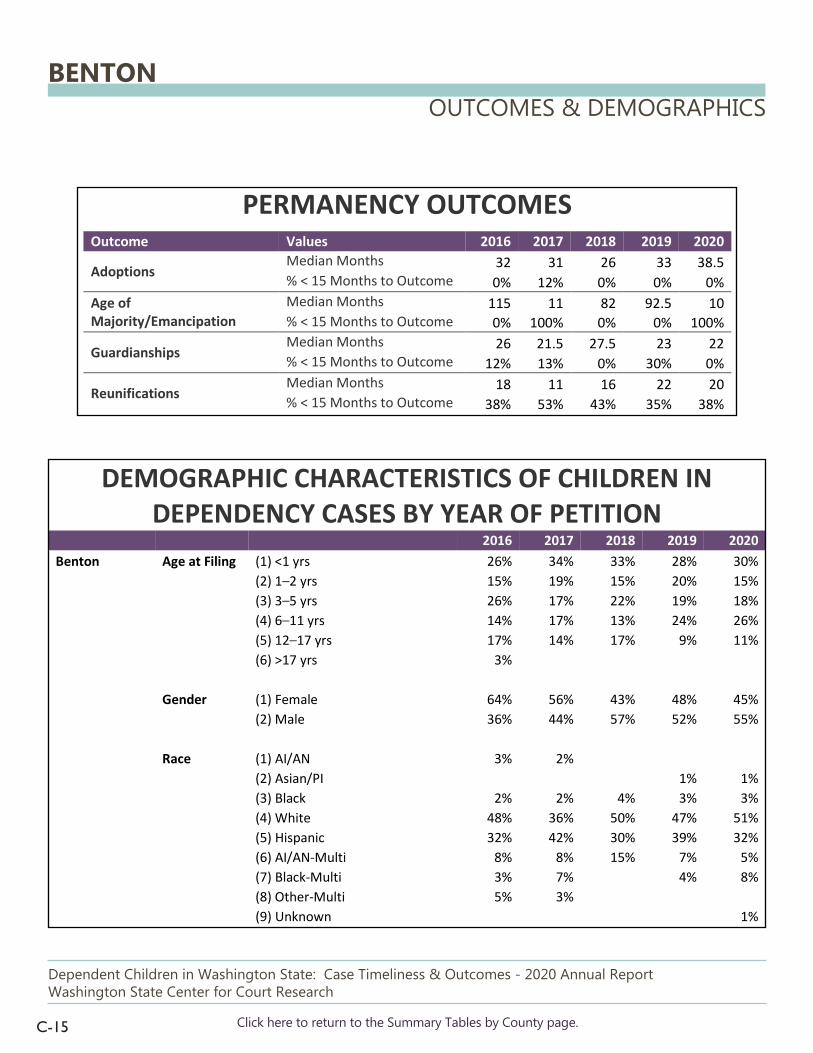
C-15
OUTCOMES & DEMOGRAPHICS
Dependent Children in Washington State: Case Timeliness & Outcomes - 2020 Annual ReportWashington State Center for Court Research
Click here to return to the Summary Tables by County page.
BENTON
PERMANENCY OUTCOMES Outcome Values 2016 2017 2018 2019 2020
Adoptions Median Months 32 31 26 33 38.5 % < 15 Months to Outcome 0% 12% 0% 0% 0%
Age of Majority/Emancipation
Median Months 115 11 82 92.5 10 % < 15 Months to Outcome 0% 100% 0% 0% 100%
Guardianships Median Months 26 21.5 27.5 23 22 % < 15 Months to Outcome 12% 13% 0% 30% 0%
Reunifications Median Months 18 11 16 22 20 % < 15 Months to Outcome 38% 53% 43% 35% 38%
DEMOGRAPHIC CHARACTERISTICS OF CHILDREN IN DEPENDENCY CASES BY YEAR OF PETITION
2016 2017 2018 2019 2020 Benton Age at Filing (1) <1 yrs 26% 34% 33% 28% 30%
(2) 1–2 yrs 15% 19% 15% 20% 15%
(3) 3–5 yrs 26% 17% 22% 19% 18%
(4) 6–11 yrs 14% 17% 13% 24% 26%
(5) 12–17 yrs 17% 14% 17% 9% 11% (6) >17 yrs 3%
Gender (1) Female 64% 56% 43% 48% 45% (2) Male 36% 44% 57% 52% 55% Race (1) AI/AN 3% 2%
(2) Asian/PI 1% 1% (3) Black 2% 2% 4% 3% 3% (4) White 48% 36% 50% 47% 51% (5) Hispanic 32% 42% 30% 39% 32% (6) AI/AN-Multi 8% 8% 15% 7% 5% (7) Black-Multi 3% 7% 4% 8% (8) Other-Multi 5% 3%
(9) Unknown 1%

C-16
DEPENDENCY FILINGS & RE-DEPENDENCY
Dependent Children in Washington State: Case Timeliness & Outcomes - 2020 Annual ReportWashington State Center for Court Research
Click here to return to the Summary Tables by County page.
BENTON
2014 2015 2016 2017 2018 2019 2020DEP Filings 107 68 67 59 46 76 113Dismissal Counts 133 88 97 78 65 73 38TER Filings 25 13 37 23 30 13 21DEP Rate per 1000 2.20 1.39 1.35 1.17 0.90 1.46
2.201.39
1.35 1.17 0.90
1.46
0.01.02.03.04.05.06.07.08.09.010.0
0
20
40
60
80
100
120
140
Dependency and Termination Filings with Dependency Rates per 1000 Child Population and Yearly Dismissal Counts
2014-2020 - Benton
Dependency cases filed during the year that had a PRIOR dependency case for the child that ended with a documented dismissal. Includes priors within county only, and excludes dismissals documented as “Dependency Not Established.” Adoption disruptions leading to re-dependency are currently not available.
6.3%
1.8%
6.5%
2.7%
3.6%
0.0%
1.0%
2.0%
3.0%
4.0%
5.0%
6.0%
7.0%
2016 2017 2018 2019 2020
Prior Dependency - Benton

This page left intentionally blank.

C-18
PERFORMANCE MEASURES
Dependent Children in Washington State: Case Timeliness & Outcomes - 2020 Annual ReportWashington State Center for Court Research
< 20 Case Events 20+ Case Events
Click here to return to the Summary Tables by County page.
CHELAN
8697 95
7486
0
20
40
60
80
100
2016 2017 2018 2019 2020
n = 225
Percent of Cases with Fact-Finding within 75 Days
100 98 96 9886
0
20
40
60
80
100
2016 2017 2018 2019 2020
n = 167
Percent of First Dependency Review Hearings within Six Months
100 100 100 98 100
0
20
40
60
80
100
2016 2017 2018 2019 2020
n = 167
Percent of Cases with Permanency Planning Hearing within 12 Months
Statewide
7588
8065
83
0
20
40
60
80
100
2016 2017 2018 2019 2020
n = 145
Percent of Cases with TPR Filed before 15 Months of Out-of-Home Care
Statewide
3043
1930
200
20
40
60
80
100
2016 2017 2018 2019 2020
n = 217
Percent of Cases with Permanency before 15 Months of Out-of-Home Care
Statewide
9 2511 18 21
0
20
40
60
80
100
2016 2017 2018 2019 2020
n = 92
Percent of Cases with Adoption Completed within Six Months of Termination Order
Statewide
- - -
Statewide - - -
- - - - - -
- - - - - -
Statewide

C-19
OUTCOMES & DEMOGRAPHICS
Dependent Children in Washington State: Case Timeliness & Outcomes - 2020 Annual ReportWashington State Center for Court Research
Click here to return to the Summary Tables by County page.
CHELAN
PERMANENCY OUTCOMES Outcome Values 2016 2017 2018 2019 2020
Adoptions Median Months 25 30 37 28 32 % < 15 Months to Outcome 11% 6% 4% 0% 5%
Age of Majority/Emancipation
Median Months 104 43 82 59 120 % < 15 Months to Outcome 0% 0% 33% 0% 0%
Guardianships Median Months 10 20 21 20 % < 15 Months to Outcome 100% 50% 0% 33%
Reunifications Median Months 17 12.5 16 4 21 % < 15 Months to Outcome 36% 75% 46% 59% 32%
DEMOGRAPHIC CHARACTERISTICS OF CHILDREN IN DEPENDENCY CASES BY YEAR OF PETITION
2016 2017 2018 2019 2020 Chelan Age at Filing (1) <1 yrs 27% 28% 28% 16% 38%
(2) 1–2 yrs 11% 13% 9% 20% 19%
(3) 3–5 yrs 20% 21% 21% 11% 19%
(4) 6–11 yrs 25% 34% 29% 40% 24%
(5) 12–17 yrs 16% 4% 14% 13%
Gender (1) Female 48% 34% 43% 53% 29% (2) Male 52% 66% 57% 47% 71% Race (4) White 45% 51% 57% 44% 57% (5) Hispanic 32% 34% 22% 49% 24% (6) AI/AN-Multi 14% 6% 12% 7% 14% (7) Black-Multi 5% 4% 5% 5% (8) Other-Multi 5% 6% 3%

C-20
DEPENDENCY FILINGS & RE-DEPENDENCY
Dependent Children in Washington State: Case Timeliness & Outcomes - 2020 Annual ReportWashington State Center for Court Research
Click here to return to the Summary Tables by County page.
CHELAN
2014 2015 2016 2017 2018 2019 2020DEP Filings 43 39 45 53 58 45 21Dismissal Counts 41 48 43 43 44 62 46TER Filings 30 17 27 25 23 25 21DEP Rate per 1000 2.43 2.19 2.51 2.94 3.21 2.49
2.43 2.192.51 2.94
3.212.49
0.01.02.03.04.05.06.07.08.09.010.0
0
10
20
30
40
50
60
70
Dependency and Termination Filings with Dependency Rates per 1000 Child Population and Yearly Dismissal Counts
2014-2020 - Chelan
Dependency cases filed during the year that had a PRIOR dependency case for the child that ended with a documented dismissal. Includes priors within county only, and excludes dismissals documented as “Dependency Not Established.” Adoption disruptions leading to re-dependency are currently not available.
2.3%
9.4%
1.8%
17.1%
0.0%0.0%
2.0%
4.0%
6.0%
8.0%
10.0%
12.0%
14.0%
16.0%
18.0%
2016 2017 2018 2019 2020
Prior Dependency - Chelan

This page left intentionally blank.
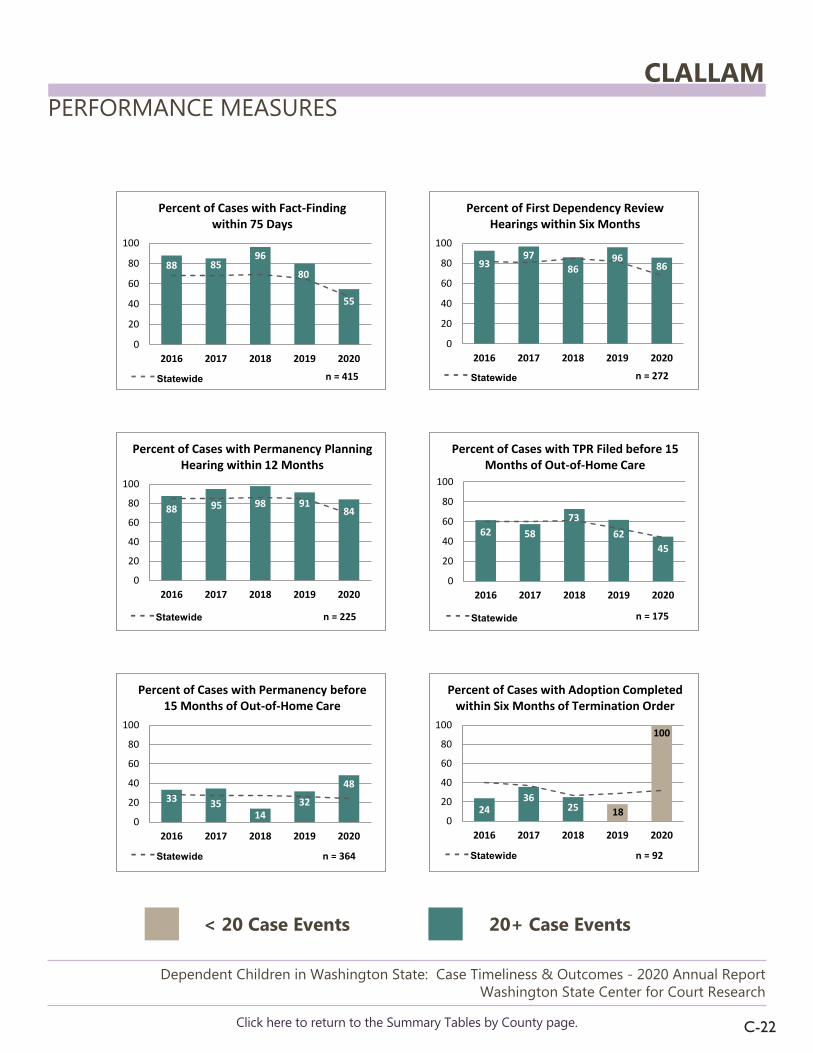
C-22
PERFORMANCE MEASURES
Dependent Children in Washington State: Case Timeliness & Outcomes - 2020 Annual ReportWashington State Center for Court Research
< 20 Case Events 20+ Case Events
Click here to return to the Summary Tables by County page.
CLALLAM
88 8596
80
55
0
20
40
60
80
100
2016 2017 2018 2019 2020
n = 415
Percent of Cases with Fact-Finding within 75 Days
9397
8696
86
0
20
40
60
80
100
2016 2017 2018 2019 2020
n = 272
Percent of First Dependency Review Hearings within Six Months
88 95 98 9184
0
20
40
60
80
100
2016 2017 2018 2019 2020
n = 225
Percent of Cases with Permanency Planning Hearing within 12 Months
Statewide
62 5873
6245
0
20
40
60
80
100
2016 2017 2018 2019 2020
n = 175
Percent of Cases with TPR Filed before 15 Months of Out-of-Home Care
Statewide
33 3514
32
48
0
20
40
60
80
100
2016 2017 2018 2019 2020
n = 364
Percent of Cases with Permanency before 15 Months of Out-of-Home Care
Statewide
2436
25 18
100
0
20
40
60
80
100
2016 2017 2018 2019 2020
n = 92
Percent of Cases with Adoption Completed within Six Months of Termination Order
Statewide
- - -
Statewide - - -
- - - - - -
- - - - - -
Statewide

C-23
OUTCOMES & DEMOGRAPHICS
Dependent Children in Washington State: Case Timeliness & Outcomes - 2020 Annual ReportWashington State Center for Court Research
Click here to return to the Summary Tables by County page.
CLALLAM
PERMANENCY OUTCOMES Outcome Values 2016 2017 2018 2019 2020
Adoptions Median Months 27 31 28.5 25 24 % < 15 Months to Outcome 0% 4% 5% 5% 0%
Age of Majority/Emancipation
Median Months 11.5 22 35 3 56 % < 15 Months to Outcome 63% 33% 0% 100% 0%
Guardianships Median Months 27.5 10.5 19 19 21 % < 15 Months to Outcome 42% 50% 20% 17% 20%
Reunifications Median Months 17 11.5 20.5 20 10 % < 15 Months to Outcome 43% 56% 19% 44% 63%
DEMOGRAPHIC CHARACTERISTICS OF CHILDREN IN DEPENDENCY CASES BY YEAR OF PETITION
2016 2017 2018 2019 2020 Clallam Age at Filing (1) <1 yrs 32% 21% 17% 13% 20%
(2) 1–2 yrs 19% 17% 14% 12% 13%
(3) 3–5 yrs 18% 16% 16% 20% 20%
(4) 6–11 yrs 16% 35% 32% 27% 33%
(5) 12–17 yrs 15% 12% 21% 27% 12% (6) >17 yrs 1% 1% Gender (1) Female 35% 48% 43% 42% 45% (2) Male 65% 52% 57% 58% 55% Race (1) AI/AN 21% 19% 21% 17% 5% (3) Black 3% 5% 2% 1% (4) White 53% 58% 57% 62% 67% (5) Hispanic 5% 4% 1% 4% 3% (6) AI/AN-Multi 11% 16% 11% 13% 17% (7) Black-Multi 2% 5% 1% 7% (8) Other-Multi 2% 3%
(9) Unknown 3%

C-24
DEPENDENCY FILINGS & RE-DEPENDENCY
Dependent Children in Washington State: Case Timeliness & Outcomes - 2020 Annual ReportWashington State Center for Court Research
Click here to return to the Summary Tables by County page.
CLALLAM
2014 2015 2016 2017 2018 2019 2020DEP Filings 77 80 63 79 92 102 82Dismissal Counts 90 79 88 92 83 96 73TER Filings 29 26 33 18 24 17 30DEP Rate per 1000 6.10 6.33 4.94 6.14 7.11 7.83
6.10 6.33
4.94
6.147.11
7.83
0.01.02.03.04.05.06.07.08.09.010.0
0
20
40
60
80
100
120
Dependency and Termination Filings with Dependency Rates per 1000 Child Population and Yearly Dismissal Counts
2014-2020 - Clallam
Dependency cases filed during the year that had a PRIOR dependency case for the child that ended with a documented dismissal. Includes priors within county only, and excludes dismissals documented as “Dependency Not Established.” Adoption disruptions leading to re-dependency are currently not available.
9.8%
12.0%
10.1%
16.8%
15.4%
0.0%
2.0%
4.0%
6.0%
8.0%
10.0%
12.0%
14.0%
16.0%
18.0%
2016 2017 2018 2019 2020
Prior Dependency - Clallam

This page left intentionally blank.

C-26
PERFORMANCE MEASURES
Dependent Children in Washington State: Case Timeliness & Outcomes - 2020 Annual ReportWashington State Center for Court Research
< 20 Case Events 20+ Case Events
Click here to return to the Summary Tables by County page.
CLARK
75 70 67
83
49
0
20
40
60
80
100
2016 2017 2018 2019 2020
n = 1331
Percent of Cases with Fact-Finding within 75 Days
82 77 85 87
62
0
20
40
60
80
100
2016 2017 2018 2019 2020
n = 897
Percent of First Dependency Review Hearings within Six Months
86 86 90 9173
0
20
40
60
80
100
2016 2017 2018 2019 2020
n = 835
Percent of Cases with Permanency Planning Hearing within 12 Months
Statewide
24 26
43 4029
0
20
40
60
80
100
2016 2017 2018 2019 2020
n = 599
Percent of Cases with TPR Filed before 15 Months of Out-of-Home Care
Statewide
20 1628 24 21
0
20
40
60
80
100
2016 2017 2018 2019 2020
n = 1245
Percent of Cases with Permanency before 15 Months of Out-of-Home Care
Statewide
4233
25 2440
0
20
40
60
80
100
2016 2017 2018 2019 2020
n = 383
Percent of Cases with Adoption Completed within Six Months of Termination Order
Statewide
- - -
Statewide - - -
- - - - - -
- - - - - -
Statewide

C-27
OUTCOMES & DEMOGRAPHICS
Dependent Children in Washington State: Case Timeliness & Outcomes - 2020 Annual ReportWashington State Center for Court Research
Click here to return to the Summary Tables by County page.
CLARK
PERMANENCY OUTCOMES Outcome Values 2016 2017 2018 2019 2020
Adoptions Median Months 35 43 38 40 41 % < 15 Months to Outcome 2% 0% 2% 1% 0%
Age of Majority/Emancipation
Median Months 66.5 51 51 66.5 44 % < 15 Months to Outcome 17% 6% 16% 14% 13%
Guardianships Median Months 47 49 29 41 23 % < 15 Months to Outcome 0% 0% 33% 21% 22%
Reunifications Median Months 19 20 17 21 21 % < 15 Months to Outcome 38% 30% 39% 36% 35%
DEMOGRAPHIC CHARACTERISTICS OF CHILDREN IN DEPENDENCY CASES BY YEAR OF PETITION
2016 2017 2018 2019 2020 Clark Age at Filing (1) <1 yrs 31% 28% 21% 22% 23%
(2) 1–2 yrs 14% 13% 8% 13% 15%
(3) 3–5 yrs 15% 15% 14% 18% 24%
(4) 6–11 yrs 24% 24% 34% 24% 21%
(5) 12–17 yrs 16% 19% 22% 21% 16% (6) >17 yrs 1%
Gender (1) Female 48% 51% 50% 49% 50% (2) Male 52% 49% 50% 51% 50% Race (1) AI/AN 2% 2% 2% 1%
(2) Asian/PI 2% 1% 1% 1% (3) Black 5% 7% 9% 2% 12%
(4) White 64% 57% 55% 70% 57% (5) Hispanic 12% 15% 16% 12% 15% (6) AI/AN-Multi 9% 6% 6% 7% 3% (7) Black-Multi 5% 6% 8% 5% 8% (8) Other-Multi 1% 4% 2% 1% 2% (9) Unknown 0% 0% 2%

C-28
DEPENDENCY FILINGS & RE-DEPENDENCY
Dependent Children in Washington State: Case Timeliness & Outcomes - 2020 Annual ReportWashington State Center for Court Research
Click here to return to the Summary Tables by County page.
CLARK
2014 2015 2016 2017 2018 2019 2020DEP Filings 281 246 291 297 273 257 235Dismissal Counts 337 262 245 276 271 315 276TER Filings 95 100 88 112 93 90 45DEP Rate per 1000 2.56 2.22 2.61 2.63 2.41 2.25
2.56 2.22 2.61 2.63 2.41 2.25
0.01.02.03.04.05.06.07.08.09.010.0
0
50
100
150
200
250
300
350
400
Dependency and Termination Filings with Dependency Rates per 1000 Child Population and Yearly Dismissal Counts
2014-2020 - Clark
Dependency cases filed during the year that had a PRIOR dependency case for the child that ended with a documented dismissal. Includes priors within county only, and excludes dismissals documented as “Dependency Not Established.” Adoption disruptions leading to re-dependency are currently not available.
6.6% 6.8%
5.3%
11.3%
8.3%
0.0%
2.0%
4.0%
6.0%
8.0%
10.0%
12.0%
2016 2017 2018 2019 2020
Prior Dependency - Clark

This page left intentionally blank.
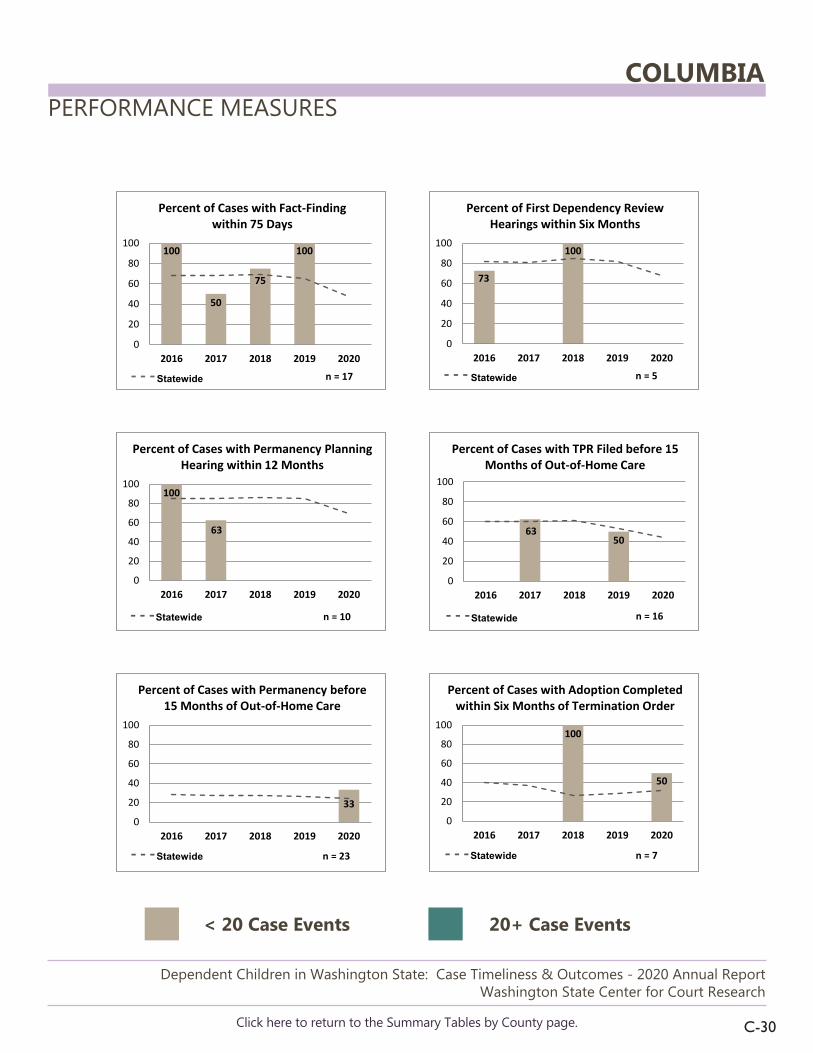
C-30
PERFORMANCE MEASURES
Dependent Children in Washington State: Case Timeliness & Outcomes - 2020 Annual ReportWashington State Center for Court Research
< 20 Case Events 20+ Case Events
Click here to return to the Summary Tables by County page.
COLUMBIA
100
50
75
100
0
20
40
60
80
100
2016 2017 2018 2019 2020
n = 17
Percent of Cases with Fact-Finding within 75 Days
73
100
0
20
40
60
80
100
2016 2017 2018 2019 2020
n = 5
Percent of First Dependency Review Hearings within Six Months
100
63
0
20
40
60
80
100
2016 2017 2018 2019 2020
n = 10
Percent of Cases with Permanency Planning Hearing within 12 Months
Statewide
6350
0
20
40
60
80
100
2016 2017 2018 2019 2020
n = 16
Percent of Cases with TPR Filed before 15 Months of Out-of-Home Care
Statewide
33
0
20
40
60
80
100
2016 2017 2018 2019 2020
n = 23
Percent of Cases with Permanency before 15 Months of Out-of-Home Care
Statewide
100
50
0
20
40
60
80
100
2016 2017 2018 2019 2020
n = 7
Percent of Cases with Adoption Completed within Six Months of Termination Order
Statewide
- - -
Statewide - - -
- - - - - -
- - - - - -
Statewide

C-31
OUTCOMES & DEMOGRAPHICS
Dependent Children in Washington State: Case Timeliness & Outcomes - 2020 Annual ReportWashington State Center for Court Research
Click here to return to the Summary Tables by County page.
COLUMBIA
PERMANENCY OUTCOMES Outcome Values 2016 2017 2018 2019 2020
Adoptions Median Months 26 16.5 % < 15 Months to Outcome 0% 50%
Age of Majority/Emancipation
Median Months 18 21 27 % < 15 Months to Outcome 0% 0% 0%
Guardianships Median Months 24 37 % < 15 Months to Outcome 0% 0%
Reunifications Median Months 28 23 52 % < 15 Months to Outcome 0% 0% 0%
DEMOGRAPHIC CHARACTERISTICS OF CHILDREN IN DEPENDENCY CASES BY YEAR OF PETITION
2016 2017 2018 2019 2020 Columbia Age at Filing (1) <1 yrs 25% 25% 100% (2) 1–2 yrs 13% 50% (3) 3–5 yrs 13% 25% (4) 6–11 yrs 38% (5) 12–17 yrs 13% (6) >17 yrs 100% Gender (1) Female 50% 100% 50% (2) Male 50% 50% 100% Race (4) White 63% 100% 75% 100% (5) Hispanic 25% (6) AI/AN-Multi 38%

C-32
DEPENDENCY FILINGS & RE-DEPENDENCY
Dependent Children in Washington State: Case Timeliness & Outcomes - 2020 Annual ReportWashington State Center for Court Research
Click here to return to the Summary Tables by County page.
COLUMBIA
2014 2015 2016 2017 2018 2019 2020DEP Filings 5 12 8 2 4 1Dismissal Counts 7 10 3 9 12 2TER Filings 1 1 6 1DEP Rate per 1000 6.52 15.66 10.61 2.63 5.22 1.31
6.52
15.66
10.61
2.63
5.22
1.310.02.04.06.08.010.012.014.016.018.020.0
0
2
4
6
8
10
12
14
Dependency and Termination Filings with Dependency Rates per 1000 Child Population and Yearly Dismissal Counts
2014-2020 - Columbia
Dependency cases filed during the year that had a PRIOR dependency case for the child that ended with a documented dismissal. Includes priors within county only, and excludes dismissals documented as “Dependency Not Established.” Adoption disruptions leading to re-dependency are currently not available.
0.0%
50.0%
0.0% 0.0% 0.0%0.0%
10.0%
20.0%
30.0%
40.0%
50.0%
60.0%
2016 2017 2018 2019 2020
Prior Dependency - Columbia

This page left intentionally blank.

C-34
PERFORMANCE MEASURES
Dependent Children in Washington State: Case Timeliness & Outcomes - 2020 Annual ReportWashington State Center for Court Research
< 20 Case Events 20+ Case Events
Click here to return to the Summary Tables by County page.
COWLITZ
69
49 49
27 210
20
40
60
80
100
2016 2017 2018 2019 2020
n = 585
Percent of Cases with Fact-Finding within 75 Days
89 82 80
51
200
20
40
60
80
100
2016 2017 2018 2019 2020
n = 410
Percent of First Dependency Review Hearings within Six Months
8493 85 79
36
0
20
40
60
80
100
2016 2017 2018 2019 2020
n = 379
Percent of Cases with Permanency Planning Hearing within 12 Months
Statewide
21 2636 41
30
0
20
40
60
80
100
2016 2017 2018 2019 2020
n = 303
Percent of Cases with TPR Filed before 15 Months of Out-of-Home Care
Statewide
34 30 3815
32
0
20
40
60
80
100
2016 2017 2018 2019 2020
n = 432
Percent of Cases with Permanency before 15 Months of Out-of-Home Care
Statewide
4226 23 33 41
0
20
40
60
80
100
2016 2017 2018 2019 2020
n = 146
Percent of Cases with Adoption Completed within Six Months of Termination Order
Statewide
- - -
Statewide - - -
- - - - - -
- - - - - -
Statewide

C-35
OUTCOMES & DEMOGRAPHICS
Dependent Children in Washington State: Case Timeliness & Outcomes - 2020 Annual ReportWashington State Center for Court Research
Click here to return to the Summary Tables by County page.
COWLITZ
PERMANENCY OUTCOMES Outcome Values 2016 2017 2018 2019 2020
Adoptions Median Months 31 32 36.5 38 37 % < 15 Months to Outcome 8% 3% 4% 0% 6%
Age of Majority/Emancipation
Median Months 77 30 101 38 14 % < 15 Months to Outcome 14% 0% 0% 50% 50%
Guardianships Median Months 11 32 21 29 % < 15 Months to Outcome 50% 25% 0% 43%
Reunifications Median Months 14 13 11.5 20 15 % < 15 Months to Outcome 52% 58% 56% 24% 38%
DEMOGRAPHIC CHARACTERISTICS OF CHILDREN IN DEPENDENCY CASES BY YEAR OF PETITION
2016 2017 2018 2019 2020 Cowlitz Age at Filing (1) <1 yrs 22% 25% 18% 18% 19%
(2) 1–2 yrs 18% 18% 17% 18% 14%
(3) 3–5 yrs 18% 17% 17% 16% 18%
(4) 6–11 yrs 26% 26% 27% 28% 27%
(5) 12–17 yrs 16% 14% 22% 21% 20% (6) >17 yrs 1% Gender (1) Female 51% 47% 45% 51% 47% (2) Male 49% 53% 55% 49% 53% Race (1) AI/AN 2% 3% 6% (2) Asian/PI 1% 1% 2% 1% (3) Black 7% 2% 2% 6% 1% (4) White 60% 64% 60% 71% 66% (5) Hispanic 19% 8% 17% 11% 10% (6) AI/AN-Multi 1% 14% 14% 3% 5% (7) Black-Multi 7% 11% 2% 8% 10% (8) Other-Multi 3% 2% 1% (9) Unknown 1%

C-36
DEPENDENCY FILINGS & RE-DEPENDENCY
Dependent Children in Washington State: Case Timeliness & Outcomes - 2020 Annual ReportWashington State Center for Court Research
Click here to return to the Summary Tables by County page.
COWLITZ
2014 2015 2016 2017 2018 2019 2020DEP Filings 99 81 137 130 132 99 93Dismissal Counts 82 58 79 96 102 113 97TER Filings 16 9 28 35 41 47 36DEP Rate per 1000 4.18 3.42 5.77 5.43 5.46 4.05
4.18 3.425.77 5.43 5.46
4.05
0.02.04.06.08.010.012.014.016.018.020.0
0
20
40
60
80
100
120
140
160
Dependency and Termination Filings with Dependency Rates per 1000 Child Population and Yearly Dismissal Counts
2014-2020 - Cowlitz
Dependency cases filed during the year that had a PRIOR dependency case for the child that ended with a documented dismissal. Includes priors within county only, and excludes dismissals documented as “Dependency Not Established.” Adoption disruptions leading to re-dependency are currently not available.
9.0%
5.6% 5.7%
3.2%
4.4%
0.0%
1.0%
2.0%
3.0%
4.0%
5.0%
6.0%
7.0%
8.0%
9.0%
10.0%
2016 2017 2018 2019 2020
Prior Dependency - Cowlitz

This page left intentionally blank.
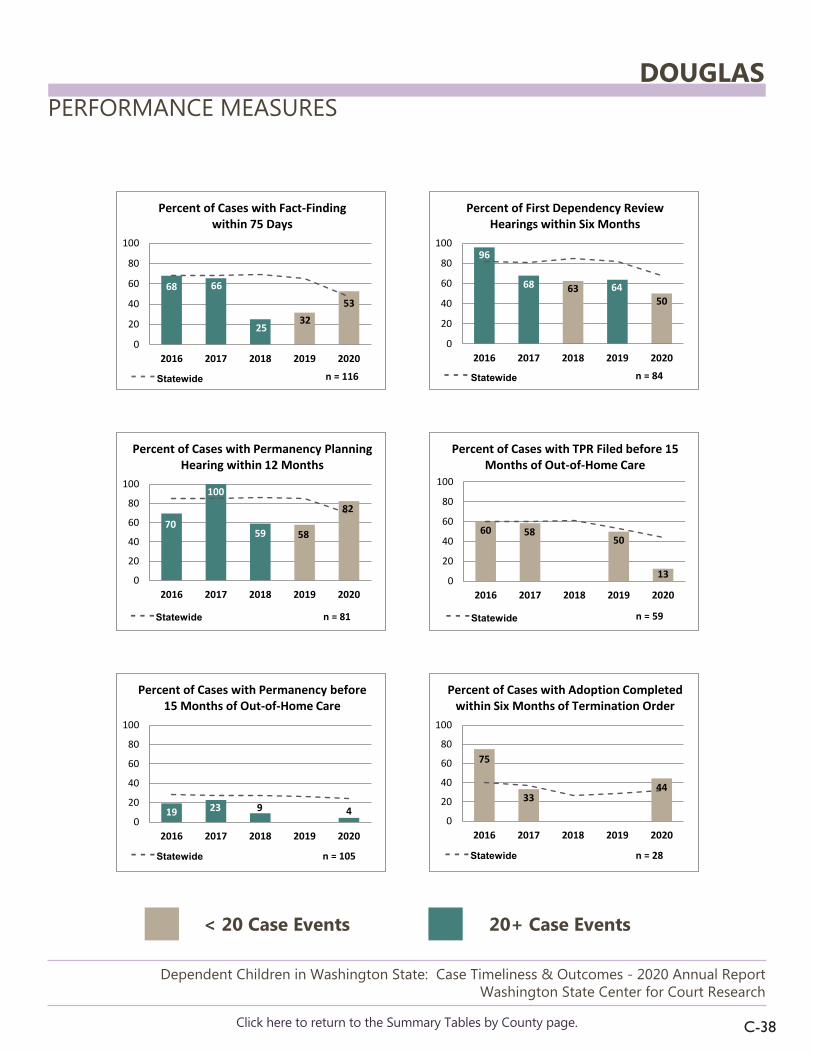
C-38
PERFORMANCE MEASURES
Dependent Children in Washington State: Case Timeliness & Outcomes - 2020 Annual ReportWashington State Center for Court Research
< 20 Case Events 20+ Case Events
Click here to return to the Summary Tables by County page.
DOUGLAS
68 66
2532
53
0
20
40
60
80
100
2016 2017 2018 2019 2020
n = 116
Percent of Cases with Fact-Finding within 75 Days
96
68 646350
0
20
40
60
80
100
2016 2017 2018 2019 2020
n = 84
Percent of First Dependency Review Hearings within Six Months
70
100
59 58
82
0
20
40
60
80
100
2016 2017 2018 2019 2020
n = 81
Percent of Cases with Permanency Planning Hearing within 12 Months
Statewide
60 5850
130
20
40
60
80
100
2016 2017 2018 2019 2020
n = 59
Percent of Cases with TPR Filed before 15 Months of Out-of-Home Care
Statewide
19 23 9 40
20
40
60
80
100
2016 2017 2018 2019 2020
n = 105
Percent of Cases with Permanency before 15 Months of Out-of-Home Care
Statewide
75
3344
0
20
40
60
80
100
2016 2017 2018 2019 2020
n = 28
Percent of Cases with Adoption Completed within Six Months of Termination Order
Statewide
- - -
Statewide - - -
- - - - - -
- - - - - -
Statewide

C-39
OUTCOMES & DEMOGRAPHICS
Dependent Children in Washington State: Case Timeliness & Outcomes - 2020 Annual ReportWashington State Center for Court Research
Click here to return to the Summary Tables by County page.
DOUGLAS
PERMANENCY OUTCOMES Outcome Values 2016 2017 2018 2019 2020
Adoptions Median Months 29 22 50 34 36 % < 15 Months to Outcome 25% 0% 0% 0% 0%
Age of Majority/Emancipation
Median Months 15 107 % < 15 Months to Outcome 0% 0%
Guardianships Median Months 43.5 % < 15 Months to Outcome 0%
Reunifications Median Months 25 29 24 24 33 % < 15 Months to Outcome 19% 26% 13% 0% 8%
DEMOGRAPHIC CHARACTERISTICS OF CHILDREN IN DEPENDENCY CASES BY YEAR OF PETITION
2016 2017 2018 2019 2020 Douglas Age at Filing (1) <1 yrs 30% 17% 5% 33% 6%
(2) 1–2 yrs 13% 17% 21% 11% 12%
(3) 3–5 yrs 10% 13% 21% 17% 24%
(4) 6–11 yrs 40% 26% 47% 11% 53%
(5) 12–17 yrs 7% 26% 5% 28% 6% Gender (1) Female 50% 52% 58% 33% 29% (2) Male 50% 48% 42% 67% 71% Race (4) White 60% 13% 47% 44% 35% (5) Hispanic 20% 52% 32% 50% 53% (6) AI/AN-Multi 17% 35% 21% 6% 6% (7) Black-Multi 3% 6%

C-40
DEPENDENCY FILINGS & RE-DEPENDENCY
Dependent Children in Washington State: Case Timeliness & Outcomes - 2020 Annual ReportWashington State Center for Court Research
Click here to return to the Summary Tables by County page.
DOUGLAS
2014 2015 2016 2017 2018 2019 2020DEP Filings 29 24 30 24 22 20 18Dismissal Counts 16 11 22 19 28 12 28TER Filings 1 15 10 7 6 11 4DEP Rate per 1000 2.83 2.35 2.89 2.28 2.07 1.86
2.83 2.35 2.89 2.28 2.07 1.86
0.02.04.06.08.010.012.014.016.018.020.0
0
5
10
15
20
25
30
35
Dependency and Termination Filings with Dependency Rates per 1000 Child Population and Yearly Dismissal Counts
2014-2020 - Douglas
Dependency cases filed during the year that had a PRIOR dependency case for the child that ended with a documented dismissal. Includes priors within county only, and excludes dismissals documented as “Dependency Not Established.” Adoption disruptions leading to re-dependency are currently not available.
0.0% 0.0%
9.5%
5.0%
31.3%
0.0%
5.0%
10.0%
15.0%
20.0%
25.0%
30.0%
35.0%
2016 2017 2018 2019 2020
Prior Dependency - Douglas

This page left intentionally blank.

C-42
PERFORMANCE MEASURES
Dependent Children in Washington State: Case Timeliness & Outcomes - 2020 Annual ReportWashington State Center for Court Research
< 20 Case Events 20+ Case Events
Click here to return to the Summary Tables by County page.
FERRY
56
10086
67
100
0
20
40
60
80
100
2016 2017 2018 2019 2020
n = 25
Percent of Cases with Fact-Finding within 75 Days
14
71
100
86
0
20
40
60
80
100
2016 2017 2018 2019 2020
n = 15
Percent of First Dependency Review Hearings within Six Months
75
10083
100
0
20
40
60
80
100
2016 2017 2018 2019 2020
n = 20
Percent of Cases with Permanency Planning Hearing within 12 Months
Statewide
67
40
100
250
20
40
60
80
100
2016 2017 2018 2019 2020
n = 18
Percent of Cases with TPR Filed before 15 Months of Out-of-Home Care
Statewide
29 3311 90
20
40
60
80
100
2016 2017 2018 2019 2020
n = 31
Percent of Cases with Permanency before 15 Months of Out-of-Home Care
Statewide
40
0
20
40
60
80
100
2016 2017 2018 2019 2020
n = 20
Percent of Cases with Adoption Completed within Six Months of Termination Order
Statewide
- - -
Statewide - - -
- - - - - -
- - - - - -
Statewide
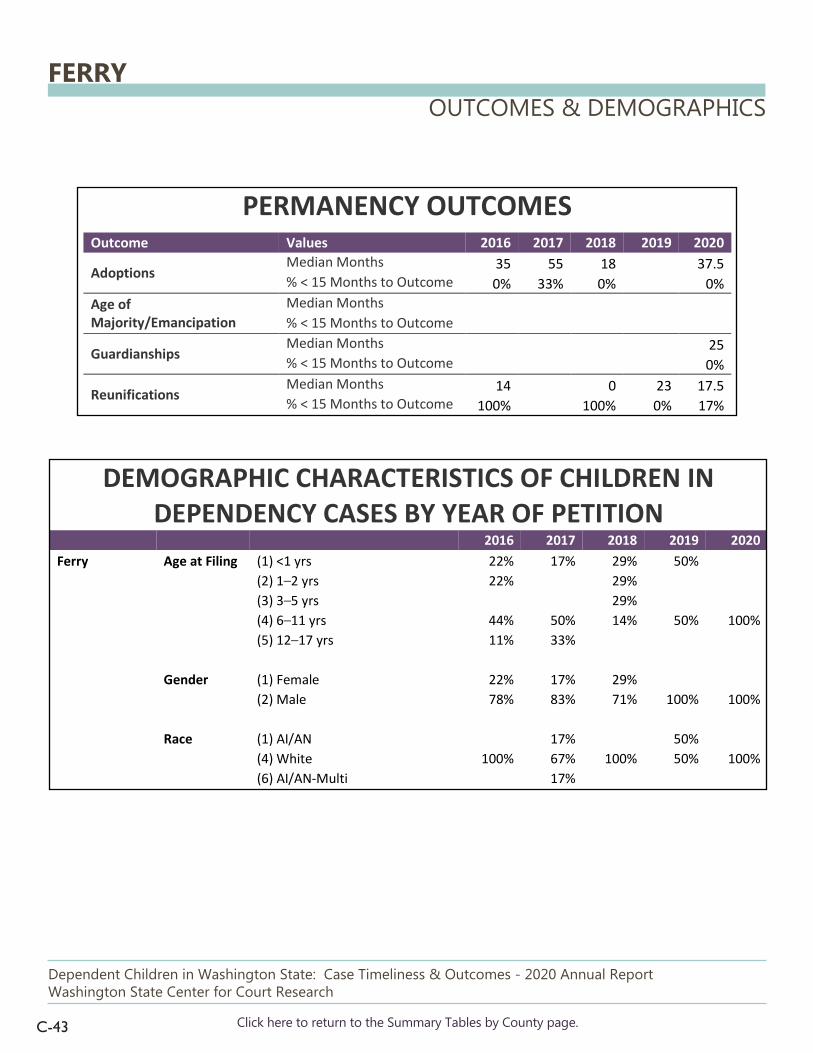
C-43
OUTCOMES & DEMOGRAPHICS
Dependent Children in Washington State: Case Timeliness & Outcomes - 2020 Annual ReportWashington State Center for Court Research
Click here to return to the Summary Tables by County page.
FERRY
PERMANENCY OUTCOMES Outcome Values 2016 2017 2018 2019 2020
Adoptions Median Months 35 55 18 37.5 % < 15 Months to Outcome 0% 33% 0% 0%
Age of Majority/Emancipation
Median Months % < 15 Months to Outcome
Guardianships Median Months 25 % < 15 Months to Outcome 0%
Reunifications Median Months 14 0 23 17.5 % < 15 Months to Outcome 100% 100% 0% 17%
DEMOGRAPHIC CHARACTERISTICS OF CHILDREN IN DEPENDENCY CASES BY YEAR OF PETITION
2016 2017 2018 2019 2020 Ferry Age at Filing (1) <1 yrs 22% 17% 29% 50% (2) 1–2 yrs 22% 29% (3) 3–5 yrs 29% (4) 6–11 yrs 44% 50% 14% 50% 100%
(5) 12–17 yrs 11% 33%
Gender (1) Female 22% 17% 29% (2) Male 78% 83% 71% 100% 100%
Race (1) AI/AN 17% 50% (4) White 100% 67% 100% 50% 100%
(6) AI/AN-Multi 17%

C-44
DEPENDENCY FILINGS & RE-DEPENDENCY
Dependent Children in Washington State: Case Timeliness & Outcomes - 2020 Annual ReportWashington State Center for Court Research
Click here to return to the Summary Tables by County page.
FERRY
2014 2015 2016 2017 2018 2019 2020DEP Filings 19 4 9 6 7 2 1Dismissal Counts 10 16 10 4 10 1 9TER Filings 7 5 2 9 1 2 3DEP Rate per 1000 13.44 2.82 6.40 4.23 4.94 1.41
13.44
2.82
6.40
4.234.94
1.41
0.02.04.06.08.010.012.014.016.018.020.0
02468
101214161820
Dependency and Termination Filings with Dependency Rates per 1000 Child Population and Yearly Dismissal Counts
2014-2020 - Ferry
Dependency cases filed during the year that had a PRIOR dependency case for the child that ended with a documented dismissal. Includes priors within county only, and excludes dismissals documented as “Dependency Not Established.” Adoption disruptions leading to re-dependency are currently not available.
0.0% 0.0% 0.0% 0.0% 0.0%0.0%
10.0%
20.0%
30.0%
40.0%
50.0%
60.0%
70.0%
80.0%
90.0%
100.0%
2016 2017 2018 2019 2020
Prior Dependency - Ferry

This page left intentionally blank.

C-46
PERFORMANCE MEASURES
Dependent Children in Washington State: Case Timeliness & Outcomes - 2020 Annual ReportWashington State Center for Court Research
< 20 Case Events 20+ Case Events
Click here to return to the Summary Tables by County page.
FRANKLIN
7883
67
86
44
0
20
40
60
80
100
2016 2017 2018 2019 2020
n = 183
Percent of Cases with Fact-Finding within 75 Days
24
97 97 95 92
0
20
40
60
80
100
2016 2017 2018 2019 2020
n = 126
Percent of First Dependency Review Hearings within Six Months
63
28
97 10094
0
20
40
60
80
100
2016 2017 2018 2019 2020
n = 122
Percent of Cases with Permanency Planning Hearing within 12 Months
Statewide
15
46
83 86
32
0
20
40
60
80
100
2016 2017 2018 2019 2020
n = 117
Percent of Cases with TPR Filed before 15 Months of Out-of-Home Care
Statewide
6 22 2717
0
20
40
60
80
100
2016 2017 2018 2019 2020
n = 201
Percent of Cases with Permanency before 15 Months of Out-of-Home Care
Statewide
50 50
71
27
60
0
20
40
60
80
100
2016 2017 2018 2019 2020
n = 78
Percent of Cases with Adoption Completed within Six Months of Termination Order
Statewide
- - -
Statewide - - -
- - - - - -
- - - - - -
Statewide

C-47
OUTCOMES & DEMOGRAPHICS
Dependent Children in Washington State: Case Timeliness & Outcomes - 2020 Annual ReportWashington State Center for Court Research
Click here to return to the Summary Tables by County page.
FRANKLIN
PERMANENCY OUTCOMES Outcome Values 2016 2017 2018 2019 2020
Adoptions Median Months 32 30 25 30 30 % < 15 Months to Outcome 0% 0% 0% 4% 0%
Age of Majority/Emancipation
Median Months 47 47 65 51 % < 15 Months to Outcome 0% 0% 0% 0%
Guardianships Median Months 28 23.5 19.5 % < 15 Months to Outcome 0% 30% 33%
Reunifications Median Months 22 21.5 16 16 33 % < 15 Months to Outcome 16% 33% 48% 46% 0%
DEMOGRAPHIC CHARACTERISTICS OF CHILDREN IN DEPENDENCY CASES BY YEAR OF PETITION
2016 2017 2018 2019 2020 Franklin Age at Filing (1) <1 yrs 43% 38% 36% 29% 52%
(2) 1–2 yrs 8% 17% 19% 17% 4%
(3) 3–5 yrs 22% 17% 17% 9% 13%
(4) 6–11 yrs 14% 12% 25% 31% 22%
(5) 12–17 yrs 14% 14% 3% 14% 9% (6) >17 yrs 2%
Gender (1) Female 54% 55% 53% 46% 52% (2) Male 46% 45% 47% 54% 48% Race (1) AI/AN 5%
(2) Asian/PI 3% 3% (3) Black 16% 31% (4) White 22% 29% 28% 6% 9%
(5) Hispanic 41% 43% 28% 57% 70% (6) AI/AN-Multi 3% 12% 3% 3% 13% (7) Black-Multi 3% 10% 33% 9% (8) Other-Multi 14% 6% 3%
(9) Unknown 2%

C-48
DEPENDENCY FILINGS & RE-DEPENDENCY
Dependent Children in Washington State: Case Timeliness & Outcomes - 2020 Annual ReportWashington State Center for Court Research
Click here to return to the Summary Tables by County page.
FRANKLIN
2014 2015 2016 2017 2018 2019 2020DEP Filings 59 51 38 42 36 35 23Dismissal Counts 66 50 57 53 51 44 12TER Filings 23 27 19 25 21 5 16DEP Rate per 1000 2.04 1.75 1.29 1.41 1.19 1.15
2.04 1.75 1.29 1.41 1.19 1.15
0.02.04.06.08.010.012.014.016.018.020.0
0
10
20
30
40
50
60
70
Dependency and Termination Filings with Dependency Rates per 1000 Child Population and Yearly Dismissal Counts
2014-2020 - Franklin
Dependency cases filed during the year that had a PRIOR dependency case for the child that ended with a documented dismissal. Includes priors within county only, and excludes dismissals documented as “Dependency Not Established.” Adoption disruptions leading to re-dependency are currently not available.
16.7%
4.9%
11.4%
8.6%
0.0%0.0%
2.0%
4.0%
6.0%
8.0%
10.0%
12.0%
14.0%
16.0%
18.0%
2016 2017 2018 2019 2020
Prior Dependency - Franklin

This page left intentionally blank.

C-50
PERFORMANCE MEASURES
Dependent Children in Washington State: Case Timeliness & Outcomes - 2020 Annual ReportWashington State Center for Court Research
< 20 Case Events 20+ Case Events
Click here to return to the Summary Tables by County page.
GARFIELD
100 100 100
250
20
40
60
80
100
2016 2017 2018 2019 2020
n = 10
Percent of Cases with Fact-Finding within 75 Days
100
0
20
40
60
80
100
2016 2017 2018 2019 2020
n = 7
Percent of First Dependency Review Hearings within Six Months
0
20
40
60
80
100
2016 2017 2018 2019 2020
n = 4
Percent of Cases with Permanency Planning Hearing within 12 Months
Statewide
0
20
40
60
80
100
2016 2017 2018 2019 2020
n = 2
Percent of Cases with TPR Filed before 15 Months of Out-of-Home Care
Statewide
33
100
0
20
40
60
80
100
2016 2017 2018 2019 2020
n = 7
Percent of Cases with Permanency before 15 Months of Out-of-Home Care
Statewide
50
0
20
40
60
80
100
2016 2017 2018 2019 2020
n = 2
Percent of Cases with Adoption Completed within Six Months of Termination Order
Statewide
- - -
Statewide - - -
- - - - - -
- - - - - -
Statewide

C-51
OUTCOMES & DEMOGRAPHICS
Dependent Children in Washington State: Case Timeliness & Outcomes - 2020 Annual ReportWashington State Center for Court Research
Click here to return to the Summary Tables by County page.
GARFIELD
PERMANENCY OUTCOMES Outcome Values 2016 2017 2018 2019 2020
Adoptions Median Months 17 % < 15 Months to Outcome 0%
Age of Majority/Emancipation
Median Months % < 15 Months to Outcome
Guardianships Median Months % < 15 Months to Outcome
Reunifications Median Months 15 14 % < 15 Months to Outcome 33% 100%
DEMOGRAPHIC CHARACTERISTICS OF CHILDREN IN DEPENDENCY CASES BY YEAR OF PETITION
2016 2017 2018 2019 2020 Garfield Age at Filing (1) <1 yrs 100% 50% 40%
(2) 1–2 yrs 20%
(3) 3–5 yrs 50% (4) 6–11 yrs 100% 20%
(5) 12–17 yrs 20% Gender (1) Female 100% 50% 40% (2) Male 100% 50% 60% Race (4) White 50% 100% 100% (5) Hispanic 100%
(7) Black-Multi 50%

C-52
DEPENDENCY FILINGS & RE-DEPENDENCY
Dependent Children in Washington State: Case Timeliness & Outcomes - 2020 Annual ReportWashington State Center for Court Research
Click here to return to the Summary Tables by County page.
GARFIELD
2014 2015 2016 2017 2018 2019 2020DEP Filings 7 4 1 2 2 5Dismissal Counts 2 5 3 1 1 1 2TER Filings 1DEP Rate per 1000 16.18 9.14 2.32 4.52 4.47
16.18
9.14
2.32 4.52 4.47
0.02.04.06.08.010.012.014.016.018.020.0
0
1
2
3
4
5
6
7
8
Dependency and Termination Filings with Dependency Rates per 1000 Child Population and Yearly Dismissal Counts
2014-2020 - Garfield
Dependency cases filed during the year that had a PRIOR dependency case for the child that ended with a documented dismissal. Includes priors within county only, and excludes dismissals documented as “Dependency Not Established.” Adoption disruptions leading to re-dependency are currently not available.
0.0% 0.0% 0.0% 0.0%
25.0%
0.0%
5.0%
10.0%
15.0%
20.0%
25.0%
30.0%
2016 2017 2018 2019 2020
Prior Dependency - Garfield

This page left intentionally blank.

C-54
PERFORMANCE MEASURES
Dependent Children in Washington State: Case Timeliness & Outcomes - 2020 Annual ReportWashington State Center for Court Research
< 20 Case Events 20+ Case Events
Click here to return to the Summary Tables by County page.
GRANT
63 57 60
41
150
20
40
60
80
100
2016 2017 2018 2019 2020
n = 530
Percent of Cases with Fact-Finding within 75 Days
89 94 87
62
0
20
40
60
80
100
2016 2017 2018 2019 2020
n = 240
Percent of First Dependency Review Hearings within Six Months
7895 91
66
39
0
20
40
60
80
100
2016 2017 2018 2019 2020
n = 354
Percent of Cases with Permanency Planning Hearing within 12 Months
Statewide
34
56 6053
27
0
20
40
60
80
100
2016 2017 2018 2019 2020
n = 262
Percent of Cases with TPR Filed before 15 Months of Out-of-Home Care
Statewide
18 19 1524 22
0
20
40
60
80
100
2016 2017 2018 2019 2020
n = 487
Percent of Cases with Permanency before 15 Months of Out-of-Home Care
Statewide
9 27 322516
0
20
40
60
80
100
2016 2017 2018 2019 2020
n = 205
Percent of Cases with Adoption Completed within Six Months of Termination Order
Statewide
- - -
Statewide - - -
- - - - - -
- - - - - -
Statewide

C-55
OUTCOMES & DEMOGRAPHICS
Dependent Children in Washington State: Case Timeliness & Outcomes - 2020 Annual ReportWashington State Center for Court Research
Click here to return to the Summary Tables by County page.
GRANT
PERMANENCY OUTCOMES Outcome Values 2016 2017 2018 2019 2020
Adoptions Median Months 48 35 35 44 35.5 % < 15 Months to Outcome 0% 0% 5% 5% 0%
Age of Majority/Emancipation
Median Months 74 59.5 137 11 29 % < 15 Months to Outcome 0% 0% 0% 67% 0%
Guardianships Median Months 37.5 22 55.5 28.5 47.5 % < 15 Months to Outcome 7% 0% 0% 0% 0%
Reunifications Median Months 22 18 15 16 19 % < 15 Months to Outcome 30% 45% 45% 40% 34%
DEMOGRAPHIC CHARACTERISTICS OF CHILDREN IN DEPENDENCY CASES BY YEAR OF PETITION
2016 2017 2018 2019 2020 Grant Age at Filing (1) <1 yrs 32% 32% 27% 33% 27%
(2) 1–2 yrs 21% 19% 13% 11% 24%
(3) 3–5 yrs 20% 22% 19% 18% 20%
(4) 6–11 yrs 16% 17% 25% 27% 22%
(5) 12–17 yrs 11% 9% 16% 10% 8% Gender (1) Female 49% 56% 57% 45% 47% (2) Male 51% 44% 43% 55% 53% Race (1) AI/AN 1% 5% (3) Black 2% 1%
(4) White 46% 32% 38% 39% 32% (5) Hispanic 44% 55% 47% 46% 43% (6) AI/AN-Multi 2% 4% 6% 9% 10% (7) Black-Multi 4% 8% 8% 4% 8% (8) Other-Multi 2% 1% 3%

C-56
DEPENDENCY FILINGS & RE-DEPENDENCY
Dependent Children in Washington State: Case Timeliness & Outcomes - 2020 Annual ReportWashington State Center for Court Research
Click here to return to the Summary Tables by County page.
GRANT
2014 2015 2016 2017 2018 2019 2020DEP Filings 93 90 105 109 123 119 80Dismissal Counts 108 78 78 126 94 107 113TER Filings 28 26 63 71 66 49 27DEP Rate per 1000 3.36 3.23 3.74 3.86 4.30 4.12
3.36 3.23 3.74 3.86 4.30 4.12
0.02.04.06.08.010.012.014.016.018.020.0
0
20
40
60
80
100
120
140
Dependency and Termination Filings with Dependency Rates per 1000 Child Population and Yearly Dismissal Counts
2014-2020 - Grant
Dependency cases filed during the year that had a PRIOR dependency case for the child that ended with a documented dismissal. Includes priors within county only, and excludes dismissals documented as “Dependency Not Established.” Adoption disruptions leading to re-dependency are currently not available.
1.0%
4.6%
1.7%
3.4%
6.5%
0.0%
1.0%
2.0%
3.0%
4.0%
5.0%
6.0%
7.0%
2016 2017 2018 2019 2020
Prior Dependency - Grant

This page left intentionally blank.

C-58
PERFORMANCE MEASURES
Dependent Children in Washington State: Case Timeliness & Outcomes - 2020 Annual ReportWashington State Center for Court Research
< 20 Case Events 20+ Case Events
Click here to return to the Summary Tables by County page.
GRAYS HARBOR
45
6559
48 48
0
20
40
60
80
100
2016 2017 2018 2019 2020
n = 565
Percent of Cases with Fact-Finding within 75 Days
39 33
86
6960
0
20
40
60
80
100
2016 2017 2018 2019 2020
n = 412
Percent of First Dependency Review Hearings within Six Months
14 12
52
8273
0
20
40
60
80
100
2016 2017 2018 2019 2020
n = 377
Percent of Cases with Permanency Planning Hearing within 12 Months
Statewide
7564 55
48
28
0
20
40
60
80
100
2016 2017 2018 2019 2020
n = 317
Percent of Cases with TPR Filed before 15 Months of Out-of-Home Care
Statewide
18 2313 21 17
0
20
40
60
80
100
2016 2017 2018 2019 2020
n = 575
Percent of Cases with Permanency before 15 Months of Out-of-Home Care
Statewide
1027
13 21 100
20
40
60
80
100
2016 2017 2018 2019 2020
n = 266
Percent of Cases with Adoption Completed within Six Months of Termination Order
Statewide
- - -
Statewide - - -
- - - - - -
- - - - - -
Statewide
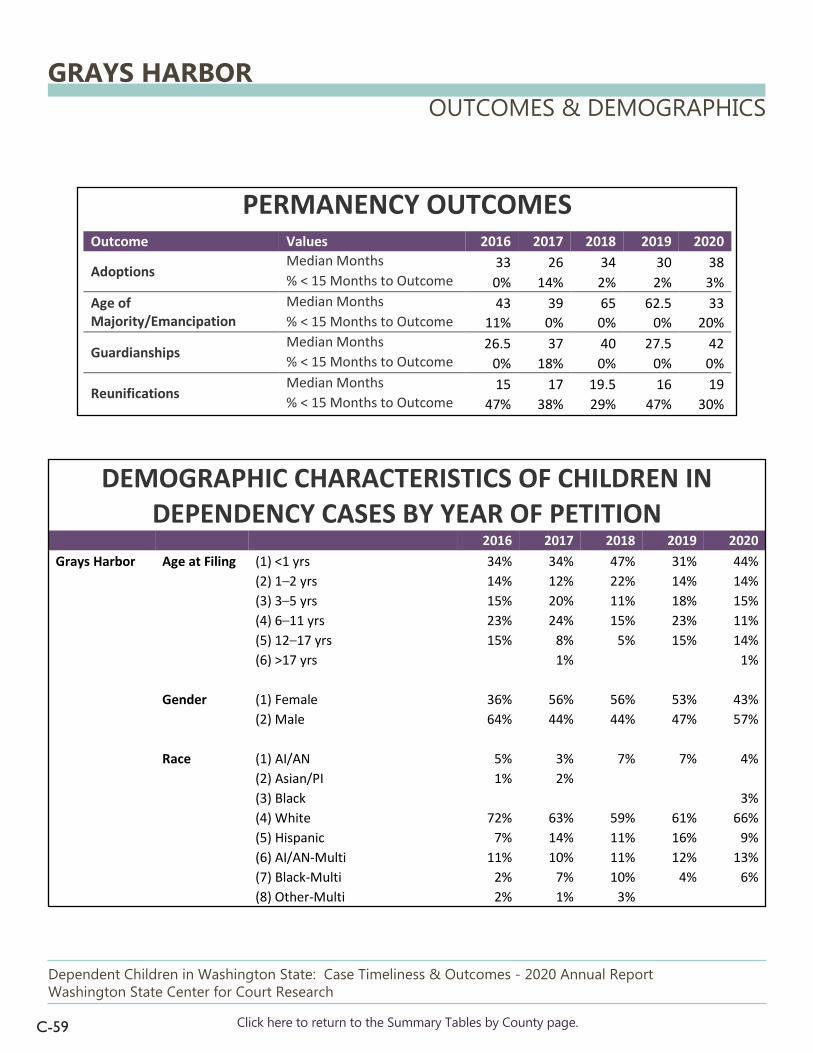
C-59
OUTCOMES & DEMOGRAPHICS
Dependent Children in Washington State: Case Timeliness & Outcomes - 2020 Annual ReportWashington State Center for Court Research
Click here to return to the Summary Tables by County page.
GRAYS HARBOR
PERMANENCY OUTCOMES Outcome Values 2016 2017 2018 2019 2020
Adoptions Median Months 33 26 34 30 38 % < 15 Months to Outcome 0% 14% 2% 2% 3%
Age of Majority/Emancipation
Median Months 43 39 65 62.5 33 % < 15 Months to Outcome 11% 0% 0% 0% 20%
Guardianships Median Months 26.5 37 40 27.5 42 % < 15 Months to Outcome 0% 18% 0% 0% 0%
Reunifications Median Months 15 17 19.5 16 19 % < 15 Months to Outcome 47% 38% 29% 47% 30%
DEMOGRAPHIC CHARACTERISTICS OF CHILDREN IN DEPENDENCY CASES BY YEAR OF PETITION
2016 2017 2018 2019 2020 Grays Harbor Age at Filing (1) <1 yrs 34% 34% 47% 31% 44%
(2) 1–2 yrs 14% 12% 22% 14% 14%
(3) 3–5 yrs 15% 20% 11% 18% 15%
(4) 6–11 yrs 23% 24% 15% 23% 11%
(5) 12–17 yrs 15% 8% 5% 15% 14% (6) >17 yrs 1% 1% Gender (1) Female 36% 56% 56% 53% 43% (2) Male 64% 44% 44% 47% 57% Race (1) AI/AN 5% 3% 7% 7% 4% (2) Asian/PI 1% 2%
(3) Black 3% (4) White 72% 63% 59% 61% 66% (5) Hispanic 7% 14% 11% 16% 9% (6) AI/AN-Multi 11% 10% 11% 12% 13% (7) Black-Multi 2% 7% 10% 4% 6% (8) Other-Multi 2% 1% 3%

C-60
DEPENDENCY FILINGS & RE-DEPENDENCY
Dependent Children in Washington State: Case Timeliness & Outcomes - 2020 Annual ReportWashington State Center for Court Research
Click here to return to the Summary Tables by County page.
GRAYS HARBOR
2014 2015 2016 2017 2018 2019 2020DEP Filings 110 97 135 149 75 116 86Dismissal Counts 137 123 133 99 102 116 147TER Filings 82 73 69 53 77 35 46DEP Rate per 1000 7.28 6.44 8.95 9.90 4.99 7.75
7.28
6.44
8.95 9.90
4.99
7.75
0.02.04.06.08.010.012.014.016.018.020.0
0
20
40
60
80
100
120
140
160
Dependency and Termination Filings with Dependency Rates per 1000 Child Population and Yearly Dismissal Counts
2014-2020 - Grays Harbor
Dependency cases filed during the year that had a PRIOR dependency case for the child that ended with a documented dismissal. Includes priors within county only, and excludes dismissals documented as “Dependency Not Established.” Adoption disruptions leading to re-dependency are currently not available.
6.8% 6.8% 6.8%
4.4%4.7%
0.0%
1.0%
2.0%
3.0%
4.0%
5.0%
6.0%
7.0%
8.0%
2016 2017 2018 2019 2020
Prior Dependency - Grays Harbor

This page left intentionally blank.
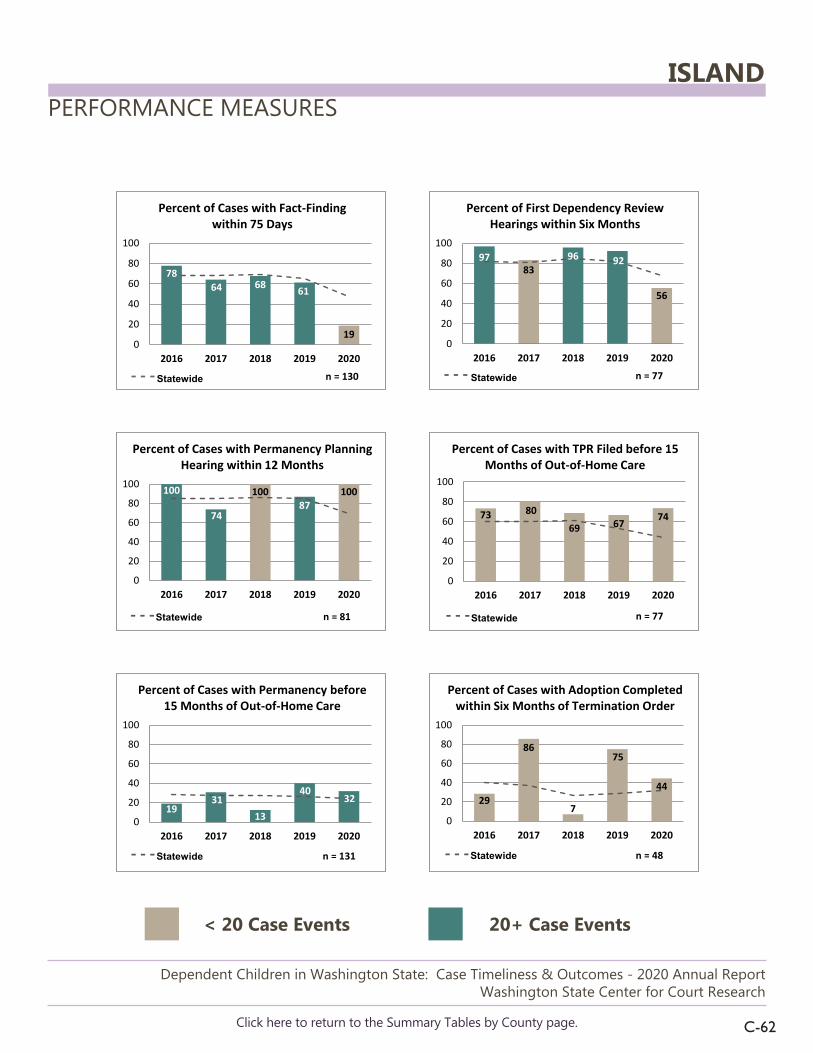
C-62
PERFORMANCE MEASURES
Dependent Children in Washington State: Case Timeliness & Outcomes - 2020 Annual ReportWashington State Center for Court Research
< 20 Case Events 20+ Case Events
Click here to return to the Summary Tables by County page.
ISLAND
7864 68 61
190
20
40
60
80
100
2016 2017 2018 2019 2020
n = 130
Percent of Cases with Fact-Finding within 75 Days
97 96 9283
56
0
20
40
60
80
100
2016 2017 2018 2019 2020
n = 77
Percent of First Dependency Review Hearings within Six Months
100
74
0
87
0
100 100
0
20
40
60
80
100
2016 2017 2018 2019 2020
n = 81
Percent of Cases with Permanency Planning Hearing within 12 Months
Statewide
73 80
69 6774
0
20
40
60
80
100
2016 2017 2018 2019 2020
n = 77
Percent of Cases with TPR Filed before 15 Months of Out-of-Home Care
Statewide
1931
13
4032
0
20
40
60
80
100
2016 2017 2018 2019 2020
n = 131
Percent of Cases with Permanency before 15 Months of Out-of-Home Care
Statewide
29
86
7
75
44
0
20
40
60
80
100
2016 2017 2018 2019 2020
n = 48
Percent of Cases with Adoption Completed within Six Months of Termination Order
Statewide
- - -
Statewide - - -
- - - - - -
- - - - - -
Statewide

C-63
OUTCOMES & DEMOGRAPHICS
Dependent Children in Washington State: Case Timeliness & Outcomes - 2020 Annual ReportWashington State Center for Court Research
Click here to return to the Summary Tables by County page.
ISLAND
PERMANENCY OUTCOMES Outcome Values 2016 2017 2018 2019 2020
Adoptions Median Months 27 25 29 24 18 % < 15 Months to Outcome 0% 0% 13% 14% 11%
Age of Majority/Emancipation
Median Months 188 19 % < 15 Months to Outcome 0% 50%
Guardianships Median Months 23 28 14.5 18 % < 15 Months to Outcome 0% 0% 50% 0%
Reunifications Median Months 14 16 27 17.5 7 % < 15 Months to Outcome 57% 47% 17% 46% 58%
DEMOGRAPHIC CHARACTERISTICS OF CHILDREN IN DEPENDENCY CASES BY YEAR OF PETITION
2016 2017 2018 2019 2020 Island Age at Filing (1) <1 yrs 26% 46% 30% 38% 24%
(2) 1–2 yrs 26% 4% 20% 15% 18%
(3) 3–5 yrs 4% 8% 13% 15% 35%
(4) 6–11 yrs 22% 27% 27% 19% 6%
(5) 12–17 yrs 22% 15% 10% 12% 18% Gender (1) Female 57% 50% 57% 50% 41% (2) Male 43% 50% 43% 50% 59% Race (1) AI/AN 4% 8%
(2) Asian/PI 4% (3) Black 8% 3% 4% 6%
(4) White 57% 50% 80% 65% 71% (5) Hispanic 9% 8% 12% (6) AI/AN-Multi 13% 15% 3% 19% 12% (7) Black-Multi 17% 15% 13% 4%

C-64
DEPENDENCY FILINGS & RE-DEPENDENCY
Dependent Children in Washington State: Case Timeliness & Outcomes - 2020 Annual ReportWashington State Center for Court Research
Click here to return to the Summary Tables by County page.
ISLAND
2014 2015 2016 2017 2018 2019 2020DEP Filings 39 26 23 26 31 27 18Dismissal Counts 31 52 21 25 21 41 27TER Filings 15 18 11 10 7 15 8DEP Rate per 1000 2.42 1.61 1.42 1.61 1.91 1.64
2.42 1.61 1.42 1.61 1.91 1.64
0.02.04.06.08.010.012.014.016.018.020.0
0
10
20
30
40
50
60
Dependency and Termination Filings with Dependency Rates per 1000 Child Population and Yearly Dismissal Counts
2014-2020 - Island
Dependency cases filed during the year that had a PRIOR dependency case for the child that ended with a documented dismissal. Includes priors within county only, and excludes dismissals documented as “Dependency Not Established.” Adoption disruptions leading to re-dependency are currently not available.
4.5%
11.5%
0.0%
14.8%
0.0%0.0%
2.0%
4.0%
6.0%
8.0%
10.0%
12.0%
14.0%
16.0%
2016 2017 2018 2019 2020
Prior Dependency - Island

This page left intentionally blank.

C-66
PERFORMANCE MEASURES
Dependent Children in Washington State: Case Timeliness & Outcomes - 2020 Annual ReportWashington State Center for Court Research
< 20 Case Events 20+ Case Events
Click here to return to the Summary Tables by County page.
JEFFERSON
71
92
78
42 38
0
20
40
60
80
100
2016 2017 2018 2019 2020
n = 71
Percent of Cases with Fact-Finding within 75 Days
100
8093
53 50
0
20
40
60
80
100
2016 2017 2018 2019 2020
n = 48
Percent of First Dependency Review Hearings within Six Months
94100 100 100
91
0
20
40
60
80
100
2016 2017 2018 2019 2020
n = 34
Percent of Cases with Permanency Planning Hearing within 12 Months
Statewide
2217
3343
0
20
40
60
80
100
2016 2017 2018 2019 2020
n = 27
Percent of Cases with TPR Filed before 15 Months of Out-of-Home Care
Statewide
8 1830
44 42
0
20
40
60
80
100
2016 2017 2018 2019 2020
n = 74
Percent of Cases with Permanency before 15 Months of Out-of-Home Care
Statewide
0
20
40
60
80
100
2016 2017 2018 2019 2020
n = 11
Percent of Cases with Adoption Completed within Six Months of Termination Order
Statewide
- - -
Statewide - - -
- - - - - -
- - - - - -
Statewide

C-67
OUTCOMES & DEMOGRAPHICS
Dependent Children in Washington State: Case Timeliness & Outcomes - 2020 Annual ReportWashington State Center for Court Research
Click here to return to the Summary Tables by County page.
JEFFERSON
PERMANENCY OUTCOMES Outcome Values 2016 2017 2018 2019 2020
Adoptions Median Months 39 51 31 % < 15 Months to Outcome 0% 0% 0%
Age of Majority/Emancipation
Median Months 59.5 % < 15 Months to Outcome 0%
Guardianships Median Months 43 22 33.5 16 % < 15 Months to Outcome 0% 0% 0% 33%
Reunifications Median Months 23 3 30 15 28 % < 15 Months to Outcome 15% 67% 38% 46% 45%
DEMOGRAPHIC CHARACTERISTICS OF CHILDREN IN DEPENDENCY CASES BY YEAR OF PETITION
2016 2017 2018 2019 2020 Jefferson Age at Filing (1) <1 yrs 13% 31% 25% 38% 21%
(2) 1–2 yrs 19% 33% 14% 7%
(3) 3–5 yrs 13% 6% 17% 10% 21%
(4) 6–11 yrs 50% 38% 17% 24% 14%
(5) 12–17 yrs 25% 6% 8% 14% 36% Gender (1) Female 50% 56% 50% 67% 36% (2) Male 50% 44% 50% 33% 64% Race (1) AI/AN 6%
(4) White 88% 88% 83% 76% 86% (5) Hispanic 5%
(6) AI/AN-Multi 17% 10% (7) Black-Multi 13% 5% 7%
(8) Other-Multi 6% 5% (9) Unknown 7%

C-68
DEPENDENCY FILINGS & RE-DEPENDENCY
Dependent Children in Washington State: Case Timeliness & Outcomes - 2020 Annual ReportWashington State Center for Court Research
Click here to return to the Summary Tables by County page.
JEFFERSON
2014 2015 2016 2017 2018 2019 2020DEP Filings 23 19 8 17 13 22 14Dismissal Counts 21 13 26 13 20 11 19TER Filings 5 5 3 4 2 4 1DEP Rate per 1000 5.56 4.65 1.97 4.19 3.24 5.49
5.56 4.651.97
4.19 3.245.49
0.02.04.06.08.010.012.014.016.018.020.0
0
5
10
15
20
25
30
Dependency and Termination Filings with Dependency Rates per 1000 Child Population and Yearly Dismissal Counts
2014-2020 - Jefferson
Dependency cases filed during the year that had a PRIOR dependency case for the child that ended with a documented dismissal. Includes priors within county only, and excludes dismissals documented as “Dependency Not Established.” Adoption disruptions leading to re-dependency are currently not available.
57.1%
0.0%
7.7%
0.0% 0.0%0.0%
10.0%
20.0%
30.0%
40.0%
50.0%
60.0%
2016 2017 2018 2019 2020
Prior Dependency - Jefferson

This page left intentionally blank.

C-70
PERFORMANCE MEASURES
Dependent Children in Washington State: Case Timeliness & Outcomes - 2020 Annual ReportWashington State Center for Court Research
< 20 Case Events 20+ Case Events
Click here to return to the Summary Tables by County page.
KING
55 4760
47
250
20
40
60
80
100
2016 2017 2018 2019 2020
n = 3613
Percent of Cases with Fact-Finding within 75 Days
6759
71 67
38
0
20
40
60
80
100
2016 2017 2018 2019 2020
n = 2240
Percent of First Dependency Review Hearings within Six Months
75 75 77 81
43
0
20
40
60
80
100
2016 2017 2018 2019 2020
n = 2098
Percent of Cases with Permanency Planning Hearing within 12 Months
Statewide
38 34 40 3921
0
20
40
60
80
100
2016 2017 2018 2019 2020
n = 1980
Percent of Cases with TPR Filed before 15 Months of Out-of-Home Care
Statewide
31 23 27 21 170
20
40
60
80
100
2016 2017 2018 2019 2020
n = 2984
Percent of Cases with Permanency before 15 Months of Out-of-Home Care
Statewide
33 23 9 6 190
20
40
60
80
100
2016 2017 2018 2019 2020
n = 928
Percent of Cases with Adoption Completed within Six Months of Termination Order
Statewide
- - -
Statewide - - -
- - - - - -
- - - - - -
Statewide

C-71
OUTCOMES & DEMOGRAPHICS
Dependent Children in Washington State: Case Timeliness & Outcomes - 2020 Annual ReportWashington State Center for Court Research
Click here to return to the Summary Tables by County page.
KING
PERMANENCY OUTCOMES Outcome Values 2016 2017 2018 2019 2020
Adoptions Median Months 35 40 42 44 42 % < 15 Months to Outcome 3% 1% 1% 1% 0%
Age of Majority/Emancipation
Median Months 64.5 62 58 55 62 % < 15 Months to Outcome 10% 2% 8% 10% 9%
Guardianships Median Months 32 34 44 43 45 % < 15 Months to Outcome 23% 3% 5% 4% 19%
Reunifications Median Months 15 18 18 18 20 % < 15 Months to Outcome 47% 42% 42% 42% 32%
DEMOGRAPHIC CHARACTERISTICS OF CHILDREN IN DEPENDENCY CASES BY YEAR OF PETITION
2016 2017 2018 2019 2020 King Age at Filing (1) <1 yrs 26% 28% 27% 31% 39%
(2) 1–2 yrs 14% 13% 15% 10% 13%
(3) 3–5 yrs 14% 16% 17% 16% 14%
(4) 6–11 yrs 27% 25% 23% 25% 16%
(5) 12–17 yrs 18% 17% 19% 18% 17% (6) >17 yrs 0% 0% 0% 1% Gender (1) Female 52% 48% 48% 50% 47% (2) Male 48% 52% 52% 50% 53% Race (1) AI/AN 4% 2% 2% 2% 1% (2) Asian/PI 7% 7% 5% 6% 3% (3) Black 21% 23% 20% 20% 22% (4) White 35% 36% 34% 31% 33% (5) Hispanic 11% 10% 16% 15% 12% (6) AI/AN-Multi 7% 6% 8% 12% 14% (7) Black-Multi 10% 11% 12% 12% 14% (8) Other-Multi 6% 4% 3% 3% 2% (9) Unknown 0% 1% 0%

C-72
DEPENDENCY FILINGS & RE-DEPENDENCY
Dependent Children in Washington State: Case Timeliness & Outcomes - 2020 Annual ReportWashington State Center for Court Research
Click here to return to the Summary Tables by County page.
KING
2014 2015 2016 2017 2018 2019 2020DEP Filings 937 854 723 795 778 761 442Dismissal Counts 822 730 695 659 654 670 814TER Filings 321 215 219 303 344 226 289DEP Rate per 1000 2.20 1.97 1.64 1.77 1.71 1.66
2.20 1.97 1.64 1.77 1.71 1.66
0.02.04.06.08.010.012.014.016.018.020.0
0100200300400500600700800900
1000
Dependency and Termination Filings with Dependency Rates per 1000 Child Population and Yearly Dismissal Counts
2014-2020 - King
Dependency cases filed during the year that had a PRIOR dependency case for the child that ended with a documented dismissal. Includes priors within county only, and excludes dismissals documented as “Dependency Not Established.” Adoption disruptions leading to re-dependency are currently not available.
3.8%
4.2% 4.2%
1.2%
2.1%
0.0%
0.5%
1.0%
1.5%
2.0%
2.5%
3.0%
3.5%
4.0%
4.5%
2016 2017 2018 2019 2020
Prior Dependency - King

This page left intentionally blank.

C-74
PERFORMANCE MEASURES
Dependent Children in Washington State: Case Timeliness & Outcomes - 2020 Annual ReportWashington State Center for Court Research
< 20 Case Events 20+ Case Events
Click here to return to the Summary Tables by County page.
KITSAP
73 78 8084
61
0
20
40
60
80
100
2016 2017 2018 2019 2020
n = 854
Percent of Cases with Fact-Finding within 75 Days
7691 95 93 87
0
20
40
60
80
100
2016 2017 2018 2019 2020
n = 572
Percent of First Dependency Review Hearings within Six Months
84 97 92 98 94
0
20
40
60
80
100
2016 2017 2018 2019 2020
n = 588
Percent of Cases with Permanency Planning Hearing within 12 Months
Statewide
62 69 70 6884
0
20
40
60
80
100
2016 2017 2018 2019 2020
n = 521
Percent of Cases with TPR Filed before 15 Months of Out-of-Home Care
Statewide
34 2519 16 140
20
40
60
80
100
2016 2017 2018 2019 2020
n = 847
Percent of Cases with Permanency before 15 Months of Out-of-Home Care
Statewide
32 29 9 19
44
0
20
40
60
80
100
2016 2017 2018 2019 2020
n = 256
Percent of Cases with Adoption Completed within Six Months of Termination Order
Statewide
- - -
Statewide - - -
- - - - - -
- - - - - -
Statewide
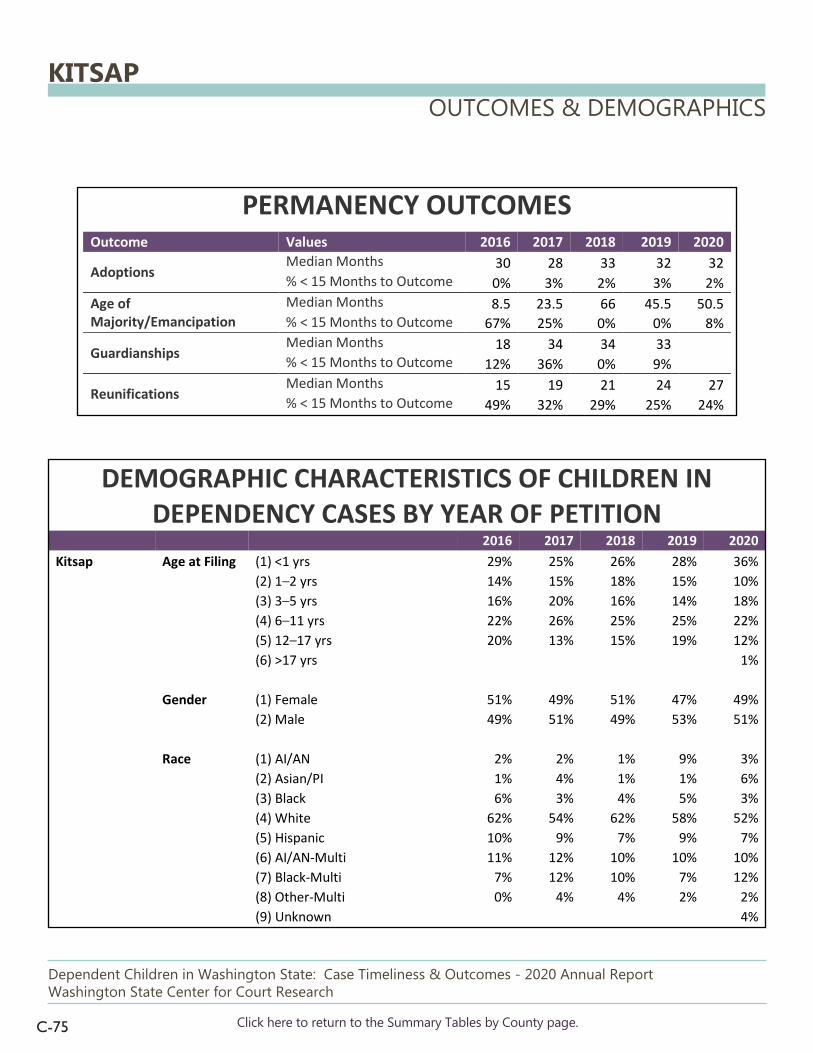
C-75
OUTCOMES & DEMOGRAPHICS
Dependent Children in Washington State: Case Timeliness & Outcomes - 2020 Annual ReportWashington State Center for Court Research
Click here to return to the Summary Tables by County page.
KITSAP
PERMANENCY OUTCOMES Outcome Values 2016 2017 2018 2019 2020
Adoptions Median Months 30 28 33 32 32 % < 15 Months to Outcome 0% 3% 2% 3% 2%
Age of Majority/Emancipation
Median Months 8.5 23.5 66 45.5 50.5 % < 15 Months to Outcome 67% 25% 0% 0% 8%
Guardianships Median Months 18 34 34 33 % < 15 Months to Outcome 12% 36% 0% 9%
Reunifications Median Months 15 19 21 24 27 % < 15 Months to Outcome 49% 32% 29% 25% 24%
DEMOGRAPHIC CHARACTERISTICS OF CHILDREN IN DEPENDENCY CASES BY YEAR OF PETITION
2016 2017 2018 2019 2020 Kitsap Age at Filing (1) <1 yrs 29% 25% 26% 28% 36%
(2) 1–2 yrs 14% 15% 18% 15% 10%
(3) 3–5 yrs 16% 20% 16% 14% 18%
(4) 6–11 yrs 22% 26% 25% 25% 22%
(5) 12–17 yrs 20% 13% 15% 19% 12% (6) >17 yrs 1% Gender (1) Female 51% 49% 51% 47% 49% (2) Male 49% 51% 49% 53% 51% Race (1) AI/AN 2% 2% 1% 9% 3% (2) Asian/PI 1% 4% 1% 1% 6% (3) Black 6% 3% 4% 5% 3% (4) White 62% 54% 62% 58% 52% (5) Hispanic 10% 9% 7% 9% 7% (6) AI/AN-Multi 11% 12% 10% 10% 10% (7) Black-Multi 7% 12% 10% 7% 12% (8) Other-Multi 0% 4% 4% 2% 2% (9) Unknown 4%

C-76
DEPENDENCY FILINGS & RE-DEPENDENCY
Dependent Children in Washington State: Case Timeliness & Outcomes - 2020 Annual ReportWashington State Center for Court Research
Click here to return to the Summary Tables by County page.
KITSAP
2014 2015 2016 2017 2018 2019 2020DEP Filings 170 239 219 223 141 133 100Dismissal Counts 192 163 189 160 190 182 179TER Filings 76 66 54 95 82 66 49DEP Rate per 1000 3.14 4.39 3.98 4.02 2.52 2.36
3.14 4.39 3.98 4.022.52 2.36
0.02.04.06.08.010.012.014.016.018.020.0
0
50
100
150
200
250
300
Dependency and Termination Filings with Dependency Rates per 1000 Child Population and Yearly Dismissal Counts
2014-2020 - Kitsap
Dependency cases filed during the year that had a PRIOR dependency case for the child that ended with a documented dismissal. Includes priors within county only, and excludes dismissals documented as “Dependency Not Established.” Adoption disruptions leading to re-dependency are currently not available.
9.7%
12.8%
10.1% 10.0%
4.1%
0.0%
2.0%
4.0%
6.0%
8.0%
10.0%
12.0%
14.0%
2016 2017 2018 2019 2020
Prior Dependency - Kitsap

This page left intentionally blank.

C-78
PERFORMANCE MEASURES
Dependent Children in Washington State: Case Timeliness & Outcomes - 2020 Annual ReportWashington State Center for Court Research
< 20 Case Events 20+ Case Events
Click here to return to the Summary Tables by County page.
KITTITAS
44
67
43
69 65
0
20
40
60
80
100
2016 2017 2018 2019 2020
n = 152
Percent of Cases with Fact-Finding within 75 Days
7464
32
5970
0
20
40
60
80
100
2016 2017 2018 2019 2020
n = 117
Percent of First Dependency Review Hearings within Six Months
6075
48
0
7062
0
20
40
60
80
100
2016 2017 2018 2019 2020
n = 97
Percent of Cases with Permanency Planning Hearing within 12 Months
Statewide
14 17 70
20
40
60
80
100
2016 2017 2018 2019 2020
n = 68
Percent of Cases with TPR Filed before 15 Months of Out-of-Home Care
Statewide
27 28 20130
20
40
60
80
100
2016 2017 2018 2019 2020
n = 146
Percent of Cases with Permanency before 15 Months of Out-of-Home Care
Statewide
14 14
7055 50
0
20
40
60
80
100
2016 2017 2018 2019 2020
n = 44
Percent of Cases with Adoption Completed within Six Months of Termination Order
Statewide
- - -
Statewide - - -
- - - - - -
- - - - - -
Statewide

C-79
OUTCOMES & DEMOGRAPHICS
Dependent Children in Washington State: Case Timeliness & Outcomes - 2020 Annual ReportWashington State Center for Court Research
Click here to return to the Summary Tables by County page.
KITTITAS
PERMANENCY OUTCOMES Outcome Values 2016 2017 2018 2019 2020
Adoptions Median Months 36 65 33 36 56 % < 15 Months to Outcome 0% 0% 0% 0% 0%
Age of Majority/Emancipation
Median Months 53 88 35 28.5 50 % < 15 Months to Outcome 0% 0% 0% 0% 0%
Guardianships Median Months 18 67 42.5 33 46 % < 15 Months to Outcome 0% 0% 0% 0% 0%
Reunifications Median Months 15 11 15.5 20 34 % < 15 Months to Outcome 40% 52% 50% 47% 0%
DEMOGRAPHIC CHARACTERISTICS OF CHILDREN IN DEPENDENCY CASES BY YEAR OF PETITION
2016 2017 2018 2019 2020 Kittitas Age at Filing (1) <1 yrs 13% 20% 17% 27% 27%
(2) 1–2 yrs 23% 2% 28% 2% 36%
(3) 3–5 yrs 20% 17% 6% 24% 27%
(4) 6–11 yrs 25% 41% 22% 22% (5) 12–17 yrs 20% 20% 28% 22% 9%
(6) >17 yrs 2%
Gender (1) Female 63% 51% 39% 56% 59% (2) Male 38% 49% 61% 44% 41% Race (1) AI/AN 3% 11%
(2) Asian/PI 5% (3) Black 3% (4) White 58% 54% 67% 46% 41%
(5) Hispanic 3% 29% 6% 29% 27% (6) AI/AN-Multi 23% 11% 15% 27% (7) Black-Multi 8% 10% 10% 5% (8) Other-Multi 5% 2% 6%

C-80
DEPENDENCY FILINGS & RE-DEPENDENCY
Dependent Children in Washington State: Case Timeliness & Outcomes - 2020 Annual ReportWashington State Center for Court Research
Click here to return to the Summary Tables by County page.
KITTITAS
2014 2015 2016 2017 2018 2019 2020DEP Filings 34 30 40 41 18 41 23Dismissal Counts 28 31 15 37 34 49 12TER Filings 11 3 7 12 9 6 1DEP Rate per 1000 4.11 3.73 4.82 4.81 2.08 4.64
4.11 3.73 4.82 4.812.08
4.64
0.02.04.06.08.010.012.014.016.018.020.0
0
10
20
30
40
50
60
Dependency and Termination Filings with Dependency Rates per 1000 Child Population and Yearly Dismissal Counts
2014-2020 - Kittitas
Dependency cases filed during the year that had a PRIOR dependency case for the child that ended with a documented dismissal. Includes priors within county only, and excludes dismissals documented as “Dependency Not Established.” Adoption disruptions leading to re-dependency are currently not available.
15.8%
22.0%
0.0%
4.9%
0.0%0.0%
5.0%
10.0%
15.0%
20.0%
25.0%
2016 2017 2018 2019 2020
Prior Dependency - Kittitas

This page left intentionally blank.

C-82
PERFORMANCE MEASURES
Dependent Children in Washington State: Case Timeliness & Outcomes - 2020 Annual ReportWashington State Center for Court Research
< 20 Case Events 20+ Case Events
Click here to return to the Summary Tables by County page.
KLICKITAT
362218
47
230
20
40
60
80
100
2016 2017 2018 2019 2020
n = 107
Percent of Cases with Fact-Finding within 75 Days
65
13 18
68 67
0
20
40
60
80
100
2016 2017 2018 2019 2020
n = 56
Percent of First Dependency Review Hearings within Six Months
28
100
69 68
50
0
20
40
60
80
100
2016 2017 2018 2019 2020
n = 71
Percent of Cases with Permanency Planning Hearing within 12 Months
Statewide
73 75
30 3325
0
20
40
60
80
100
2016 2017 2018 2019 2020
n = 49
Percent of Cases with TPR Filed before 15 Months of Out-of-Home Care
Statewide
2237
100
20
40
60
80
100
2016 2017 2018 2019 2020
n = 94
Percent of Cases with Permanency before 15 Months of Out-of-Home Care
Statewide
86
4450
100
78
0
20
40
60
80
100
2016 2017 2018 2019 2020
n = 29
Percent of Cases with Adoption Completed within Six Months of Termination Order
Statewide
- - -
Statewide - - -
- - - - - -
- - - - - -
Statewide

C-83
OUTCOMES & DEMOGRAPHICS
Dependent Children in Washington State: Case Timeliness & Outcomes - 2020 Annual ReportWashington State Center for Court Research
Click here to return to the Summary Tables by County page.
KLICKITAT
PERMANENCY OUTCOMES Outcome Values 2016 2017 2018 2019 2020
Adoptions Median Months 24 35 26 22.5 37 % < 15 Months to Outcome 0% 11% 0% 0% 0%
Age of Majority/Emancipation
Median Months 48 18 29 % < 15 Months to Outcome 0% 33% 0%
Guardianships Median Months 24 15 47 22 26 % < 15 Months to Outcome 0% 33% 0% 0% 0%
Reunifications Median Months 23 20 16 15 % < 15 Months to Outcome 27% 0% 48% 33%
DEMOGRAPHIC CHARACTERISTICS OF CHILDREN IN DEPENDENCY CASES BY YEAR OF PETITION
2016 2017 2018 2019 2020 Klickitat Age at Filing (1) <1 yrs 29% 38% 22% 21% (2) 1–2 yrs 29% 19% 13% 26% 36%
(3) 3–5 yrs 14% 19% 13% 5% 36%
(4) 6–11 yrs 19% 22% 26% 18%
(5) 12–17 yrs 29% 5% 31% 21% 9% Gender (1) Female 43% 33% 41% 63% 64% (2) Male 57% 67% 59% 37% 36% Race (1) AI/AN 21% 5%
(4) White 79% 95% 88% 68% 55% (5) Hispanic 5% 9%
(6) AI/AN-Multi 3% 21% 45% (7) Black-Multi 5%
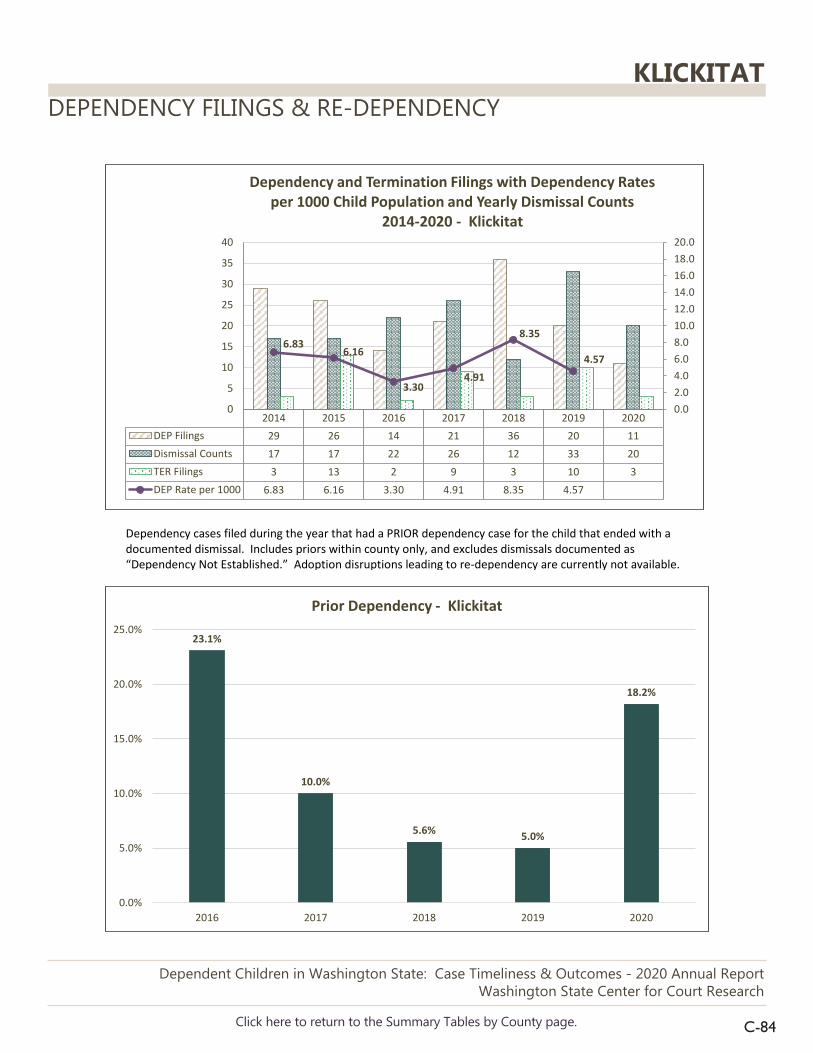
C-84
DEPENDENCY FILINGS & RE-DEPENDENCY
Dependent Children in Washington State: Case Timeliness & Outcomes - 2020 Annual ReportWashington State Center for Court Research
Click here to return to the Summary Tables by County page.
KLICKITAT
2014 2015 2016 2017 2018 2019 2020DEP Filings 29 26 14 21 36 20 11Dismissal Counts 17 17 22 26 12 33 20TER Filings 3 13 2 9 3 10 3DEP Rate per 1000 6.83 6.16 3.30 4.91 8.35 4.57
6.83 6.16
3.304.91
8.35
4.57
0.02.04.06.08.010.012.014.016.018.020.0
0
5
10
15
20
25
30
35
40
Dependency and Termination Filings with Dependency Rates per 1000 Child Population and Yearly Dismissal Counts
2014-2020 - Klickitat
Dependency cases filed during the year that had a PRIOR dependency case for the child that ended with a documented dismissal. Includes priors within county only, and excludes dismissals documented as “Dependency Not Established.” Adoption disruptions leading to re-dependency are currently not available.
23.1%
10.0%
5.6% 5.0%
18.2%
0.0%
5.0%
10.0%
15.0%
20.0%
25.0%
2016 2017 2018 2019 2020
Prior Dependency - Klickitat

This page left intentionally blank.

C-86
PERFORMANCE MEASURES
Dependent Children in Washington State: Case Timeliness & Outcomes - 2020 Annual ReportWashington State Center for Court Research
< 20 Case Events 20+ Case Events
Click here to return to the Summary Tables by County page.
LEWIS
92
64 67 71 76
0
20
40
60
80
100
2016 2017 2018 2019 2020
n = 394
Percent of Cases with Fact-Finding within 75 Days
9780 82
72
93
0
20
40
60
80
100
2016 2017 2018 2019 2020
n = 278
Percent of First Dependency Review Hearings within Six Months
94 98 87 8796
0
20
40
60
80
100
2016 2017 2018 2019 2020
n = 234
Percent of Cases with Permanency Planning Hearing within 12 Months
Statewide
12
5170
41 42
0
20
40
60
80
100
2016 2017 2018 2019 2020
n = 165
Percent of Cases with TPR Filed before 15 Months of Out-of-Home Care
Statewide
21 1832
38
120
20
40
60
80
100
2016 2017 2018 2019 2020
n = 322
Percent of Cases with Permanency before 15 Months of Out-of-Home Care
Statewide
64
33 511 190
20
40
60
80
100
2016 2017 2018 2019 2020
n = 99
Percent of Cases with Adoption Completed within Six Months of Termination Order
Statewide
- - -
Statewide - - -
- - - - - -
- - - - - -
Statewide

C-87
OUTCOMES & DEMOGRAPHICS
Dependent Children in Washington State: Case Timeliness & Outcomes - 2020 Annual ReportWashington State Center for Court Research
Click here to return to the Summary Tables by County page.
LEWIS
PERMANENCY OUTCOMES Outcome Values 2016 2017 2018 2019 2020
Adoptions Median Months 44 39 32 36 40.5 % < 15 Months to Outcome 0% 3% 3% 0% 0%
Age of Majority/Emancipation
Median Months 22 60 24 47 24 % < 15 Months to Outcome 25% 0% 50% 33% 33%
Guardianships Median Months 27 48.5 11 23 % < 15 Months to Outcome 0% 0% 57% 11%
Reunifications Median Months 29 20 12 15 23 % < 15 Months to Outcome 42% 32% 61% 49% 17%
DEMOGRAPHIC CHARACTERISTICS OF CHILDREN IN DEPENDENCY CASES BY YEAR OF PETITION
2016 2017 2018 2019 2020 Lewis Age at Filing (1) <1 yrs 38% 35% 24% 27% 32%
(2) 1–2 yrs 13% 17% 11% 19% 16%
(3) 3–5 yrs 19% 25% 14% 19% 10%
(4) 6–11 yrs 17% 15% 26% 21% 24%
(5) 12–17 yrs 15% 8% 26% 13% 18% Gender (1) Female 44% 48% 46% 50% 40% (2) Male 56% 52% 54% 50% 60% Race (1) AI/AN 2% 3% 3% 1% (2) Asian/PI 5% 1% (3) Black 2% 5% 1% (4) White 75% 74% 49% 60% 72% (5) Hispanic 13% 15% 16% 21% 19% (6) AI/AN-Multi 6% 5% 25% 5% 1% (7) Black-Multi 4% 2% 4% 6%
(8) Other-Multi 3% (9) Unknown 3%

C-88
DEPENDENCY FILINGS & RE-DEPENDENCY
Dependent Children in Washington State: Case Timeliness & Outcomes - 2020 Annual ReportWashington State Center for Court Research
Click here to return to the Summary Tables by County page.
LEWIS
2014 2015 2016 2017 2018 2019 2020DEP Filings 64 72 49 82 119 65 75Dismissal Counts 46 57 42 92 65 84 93TER Filings 24 19 22 60 25 16 23DEP Rate per 1000 3.83 4.31 2.93 4.86 7.01 3.79
3.83 4.31
2.934.86
7.01
3.79
0.02.04.06.08.010.012.014.016.018.020.0
0
20
40
60
80
100
120
140
Dependency and Termination Filings with Dependency Rates per 1000 Child Population and Yearly Dismissal Counts
2014-2020 - Lewis
Dependency cases filed during the year that had a PRIOR dependency case for the child that ended with a documented dismissal. Includes priors within county only, and excludes dismissals documented as “Dependency Not Established.” Adoption disruptions leading to re-dependency are currently not available.
6.1%
3.7%
11.9%
9.4%
22.7%
0.0%
5.0%
10.0%
15.0%
20.0%
25.0%
2016 2017 2018 2019 2020
Prior Dependency - Lewis

This page left intentionally blank.
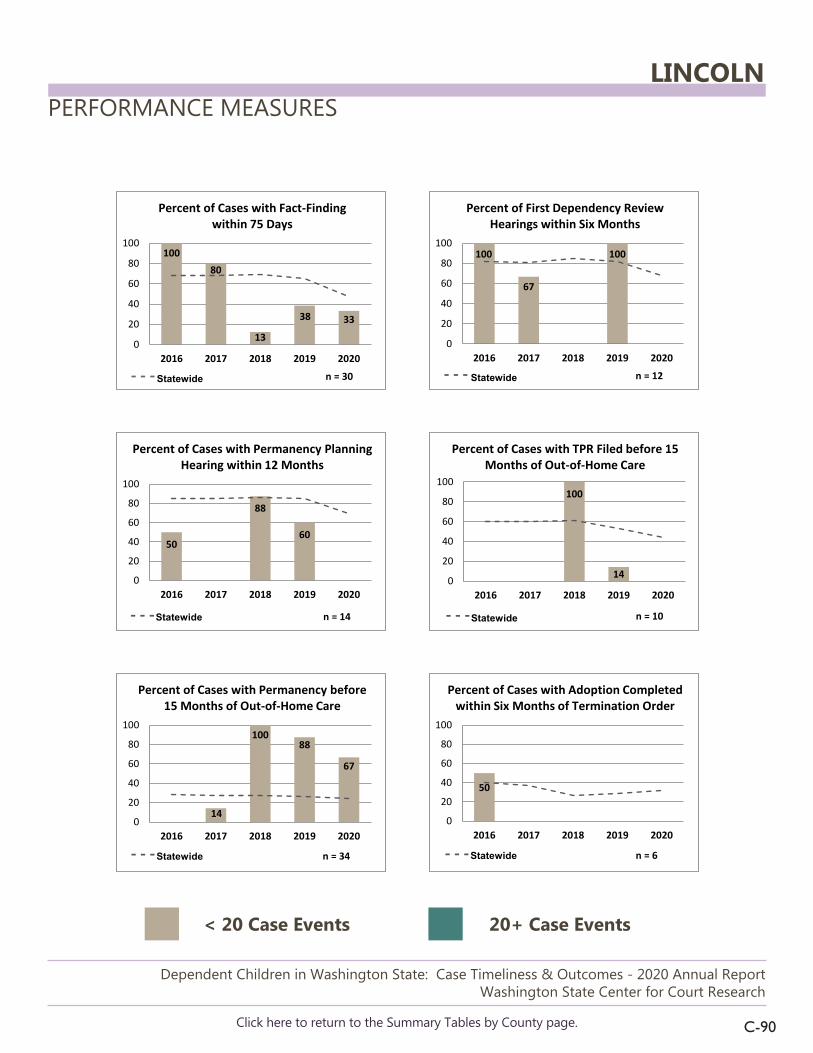
C-90
PERFORMANCE MEASURES
Dependent Children in Washington State: Case Timeliness & Outcomes - 2020 Annual ReportWashington State Center for Court Research
< 20 Case Events 20+ Case Events
Click here to return to the Summary Tables by County page.
LINCOLN
10080
13
38 33
0
20
40
60
80
100
2016 2017 2018 2019 2020
n = 30
Percent of Cases with Fact-Finding within 75 Days
100
67
100
0
20
40
60
80
100
2016 2017 2018 2019 2020
n = 12
Percent of First Dependency Review Hearings within Six Months
50
88
60
0
20
40
60
80
100
2016 2017 2018 2019 2020
n = 14
Percent of Cases with Permanency Planning Hearing within 12 Months
Statewide
100
140
20
40
60
80
100
2016 2017 2018 2019 2020
n = 10
Percent of Cases with TPR Filed before 15 Months of Out-of-Home Care
Statewide
14
10088
67
0
20
40
60
80
100
2016 2017 2018 2019 2020
n = 34
Percent of Cases with Permanency before 15 Months of Out-of-Home Care
Statewide
50
0
20
40
60
80
100
2016 2017 2018 2019 2020
n = 6
Percent of Cases with Adoption Completed within Six Months of Termination Order
Statewide
- - -
Statewide - - -
- - - - - -
- - - - - -
Statewide

C-91
OUTCOMES & DEMOGRAPHICS
Dependent Children in Washington State: Case Timeliness & Outcomes - 2020 Annual ReportWashington State Center for Court Research
Click here to return to the Summary Tables by County page.
LINCOLN
PERMANENCY OUTCOMES Outcome Values 2016 2017 2018 2019 2020
Adoptions Median Months 44 51 31 34 % < 15 Months to Outcome 0% 0% 0% 0%
Age of Majority/Emancipation
Median Months 56 % < 15 Months to Outcome 0%
Guardianships Median Months 34 31 % < 15 Months to Outcome 0% 0%
Reunifications Median Months 29 32 12 3 9 % < 15 Months to Outcome 0% 20% 100% 100% 100%
DEMOGRAPHIC CHARACTERISTICS OF CHILDREN IN DEPENDENCY CASES BY YEAR OF PETITION
2016 2017 2018 2019 2020 Lincoln Age at Filing (1) <1 yrs 11% 43% 18% (2) 1–2 yrs 50% 22% 29% 45% (3) 3–5 yrs 50% 22% 14% 9% (4) 6–11 yrs 11% 14% 27% 50%
(5) 12–17 yrs 33% 50% Gender (1) Female 100% 33% 43% 27% 100% (2) Male 67% 57% 73%
Race (1) AI/AN 27% (4) White 67% 100% 36% 100%
(5) Hispanic 11% (6) AI/AN-Multi 100% 36% (7) Black-Multi 22%
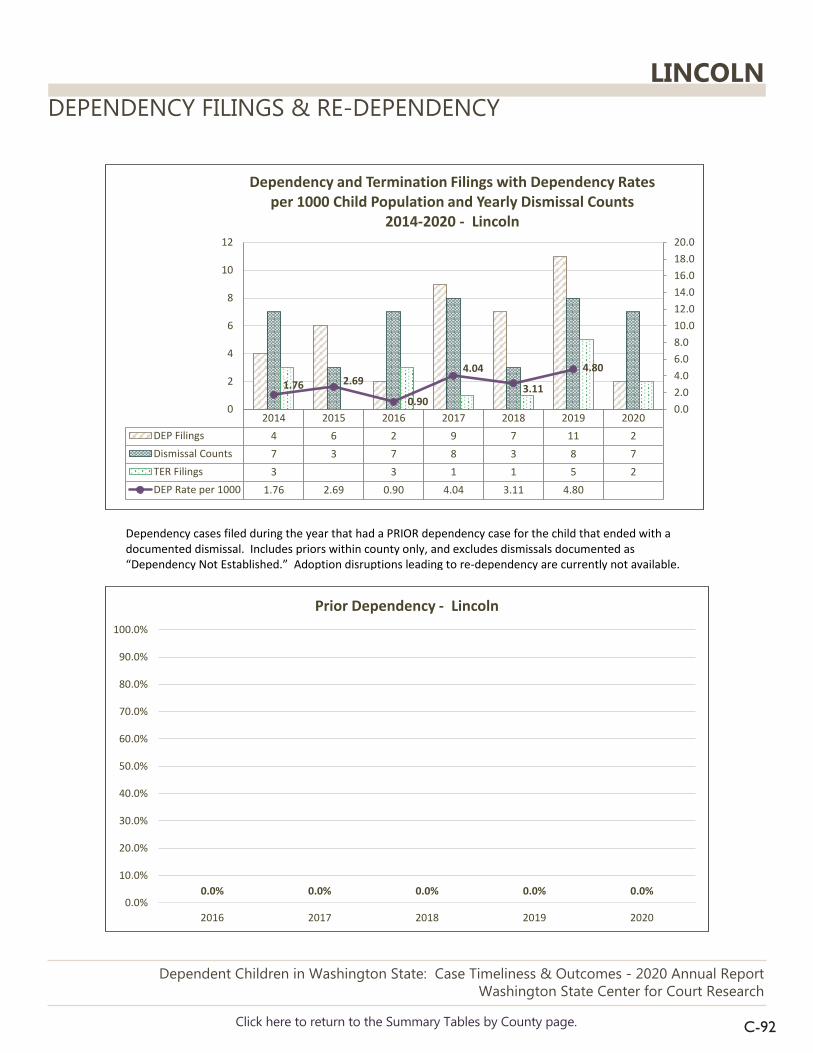
C-92
DEPENDENCY FILINGS & RE-DEPENDENCY
Dependent Children in Washington State: Case Timeliness & Outcomes - 2020 Annual ReportWashington State Center for Court Research
Click here to return to the Summary Tables by County page.
LINCOLN
2014 2015 2016 2017 2018 2019 2020DEP Filings 4 6 2 9 7 11 2Dismissal Counts 7 3 7 8 3 8 7TER Filings 3 3 1 1 5 2DEP Rate per 1000 1.76 2.69 0.90 4.04 3.11 4.80
1.76 2.69
0.90
4.04
3.11
4.80
0.02.04.06.08.010.012.014.016.018.020.0
0
2
4
6
8
10
12
Dependency and Termination Filings with Dependency Rates per 1000 Child Population and Yearly Dismissal Counts
2014-2020 - Lincoln
Dependency cases filed during the year that had a PRIOR dependency case for the child that ended with a documented dismissal. Includes priors within county only, and excludes dismissals documented as “Dependency Not Established.” Adoption disruptions leading to re-dependency are currently not available.
0.0% 0.0% 0.0% 0.0% 0.0%0.0%
10.0%
20.0%
30.0%
40.0%
50.0%
60.0%
70.0%
80.0%
90.0%
100.0%
2016 2017 2018 2019 2020
Prior Dependency - Lincoln

This page left intentionally blank.

C-94
PERFORMANCE MEASURES
Dependent Children in Washington State: Case Timeliness & Outcomes - 2020 Annual ReportWashington State Center for Court Research
< 20 Case Events 20+ Case Events
Click here to return to the Summary Tables by County page.
MASON
7460
7665
210
20
40
60
80
100
2016 2017 2018 2019 2020
n = 508
Percent of Cases with Fact-Finding within 75 Days
9376
8574
38
0
20
40
60
80
100
2016 2017 2018 2019 2020
n = 287
Percent of First Dependency Review Hearings within Six Months
9383 84 94
55
0
20
40
60
80
100
2016 2017 2018 2019 2020
n = 296
Percent of Cases with Permanency Planning Hearing within 12 Months
Statewide
55
76 76
51
76
0
20
40
60
80
100
2016 2017 2018 2019 2020
n = 261
Percent of Cases with TPR Filed before 15 Months of Out-of-Home Care
Statewide
54 57
34 3621
0
20
40
60
80
100
2016 2017 2018 2019 2020
n = 432
Percent of Cases with Permanency before 15 Months of Out-of-Home Care
Statewide
8 211710 8
0
20
40
60
80
100
2016 2017 2018 2019 2020
n = 89
Percent of Cases with Adoption Completed within Six Months of Termination Order
Statewide
- - -
Statewide - - -
- - - - - -
- - - - - -
Statewide

C-95
OUTCOMES & DEMOGRAPHICS
Dependent Children in Washington State: Case Timeliness & Outcomes - 2020 Annual ReportWashington State Center for Court Research
Click here to return to the Summary Tables by County page.
MASON
PERMANENCY OUTCOMES Outcome Values 2016 2017 2018 2019 2020
Adoptions Median Months 43.5 31 33.5 34 41.5 % < 15 Months to Outcome 6% 0% 0% 0% 0%
Age of Majority/Emancipation
Median Months 84 32 43 55 % < 15 Months to Outcome 0% 0% 0% 0%
Guardianships Median Months 12 3 38.5 39 32.5 % < 15 Months to Outcome 100% 100% 0% 0% 0%
Reunifications Median Months 9 11 14 14 18 % < 15 Months to Outcome 67% 64% 51% 56% 27%
DEMOGRAPHIC CHARACTERISTICS OF CHILDREN IN DEPENDENCY CASES BY YEAR OF PETITION
2016 2017 2018 2019 2020 Mason Age at Filing (1) <1 yrs 20% 27% 21% 25% 15%
(2) 1–2 yrs 10% 16% 11% 16% 13%
(3) 3–5 yrs 20% 17% 22% 12% 23%
(4) 6–11 yrs 29% 22% 28% 25% 30%
(5) 12–17 yrs 21% 18% 18% 23% 20% Gender (1) Female 55% 55% 53% 58% 62% (2) Male 45% 45% 47% 42% 38% Race (1) AI/AN 6% 3% 4% 6% (2) Asian/PI 2%
(3) Black 1% 2% 1% 7% (4) White 64% 82% 75% 60% 75% (5) Hispanic 9% 4% 11% 19% 6% (6) AI/AN-Multi 10% 11% 6% 12% 3% (7) Black-Multi 5% 3%
(8) Other-Multi 2% 1% 4% 1% (9) Unknown 2% 1% 1% 3%

C-96
DEPENDENCY FILINGS & RE-DEPENDENCY
Dependent Children in Washington State: Case Timeliness & Outcomes - 2020 Annual ReportWashington State Center for Court Research
Click here to return to the Summary Tables by County page.
MASON
2014 2015 2016 2017 2018 2019 2020DEP Filings 85 102 132 100 126 80 76Dismissal Counts 69 94 88 106 99 100 85TER Filings 44 19 20 49 34 5 8DEP Rate per 1000 7.01 8.44 10.91 8.16 10.18 6.39
7.01 8.44
10.91
8.16
10.18
6.39
0.02.04.06.08.010.012.014.016.018.020.0
0
20
40
60
80
100
120
140
Dependency and Termination Filings with Dependency Rates per 1000 Child Population and Yearly Dismissal Counts
2014-2020 - Mason
Dependency cases filed during the year that had a PRIOR dependency case for the child that ended with a documented dismissal. Includes priors within county only, and excludes dismissals documented as “Dependency Not Established.” Adoption disruptions leading to re-dependency are currently not available.
8.5%
2.1%
9.9%
7.8%
12.9%
0.0%
2.0%
4.0%
6.0%
8.0%
10.0%
12.0%
14.0%
2016 2017 2018 2019 2020
Prior Dependency - Mason

This page left intentionally blank.

C-98
PERFORMANCE MEASURES
Dependent Children in Washington State: Case Timeliness & Outcomes - 2020 Annual ReportWashington State Center for Court Research
< 20 Case Events 20+ Case Events
Click here to return to the Summary Tables by County page.
OKANOGAN
8779
7176 78
0
20
40
60
80
100
2016 2017 2018 2019 2020
n = 123
Percent of Cases with Fact-Finding within 75 Days
6051
9593 87
0
20
40
60
80
100
2016 2017 2018 2019 2020
n = 84
Percent of First Dependency Review Hearings within Six Months
6374 75
95
74
0
20
40
60
80
100
2016 2017 2018 2019 2020
n = 91
Percent of Cases with Permanency Planning Hearing within 12 Months
Statewide
33
5344
20 250
20
40
60
80
100
2016 2017 2018 2019 2020
n = 79
Percent of Cases with TPR Filed before 15 Months of Out-of-Home Care
Statewide
3 24 23 6 160
20
40
60
80
100
2016 2017 2018 2019 2020
n = 158
Percent of Cases with Permanency before 15 Months of Out-of-Home Care
Statewide
20 290
20
40
60
80
100
2016 2017 2018 2019 2020
n = 44
Percent of Cases with Adoption Completed within Six Months of Termination Order
Statewide
- - -
Statewide - - -
- - - - - -
- - - - - -
Statewide

C-99
OUTCOMES & DEMOGRAPHICS
Dependent Children in Washington State: Case Timeliness & Outcomes - 2020 Annual ReportWashington State Center for Court Research
Click here to return to the Summary Tables by County page.
OKANOGAN
PERMANENCY OUTCOMES Outcome Values 2016 2017 2018 2019 2020
Adoptions Median Months 37 38 32 31 62 % < 15 Months to Outcome 0% 0% 0% 0% 0%
Age of Majority/Emancipation
Median Months 67 51.5 27 % < 15 Months to Outcome 0% 50% 0%
Guardianships Median Months 46 31 62 35.5 % < 15 Months to Outcome 0% 0% 0% 13%
Reunifications Median Months 23 16 27 25 23 % < 15 Months to Outcome 5% 44% 33% 5% 44%
DEMOGRAPHIC CHARACTERISTICS OF CHILDREN IN DEPENDENCY CASES BY YEAR OF PETITION
2016 2017 2018 2019 2020 Okanogan Age at Filing (1) <1 yrs 37% 25% 42% 9% 33%
(2) 1–2 yrs 13% 9% 17% 14% 13%
(3) 3–5 yrs 3% 13% 4% 14% 7%
(4) 6–11 yrs 40% 31% 21% 18% 13%
(5) 12–17 yrs 7% 22% 17% 45% 33% Gender (1) Female 70% 53% 50% 50% 67% (2) Male 30% 47% 50% 50% 33% Race (1) AI/AN 7% 9% 25% 27%
(4) White 50% 31% 50% 50% 7% (5) Hispanic 20% 34% 13% 9% 47% (6) AI/AN-Multi 13% 22% 13% 9% 40% (7) Black-Multi 3%
(8) Other-Multi 7% 3% 5% 7%

C-100
DEPENDENCY FILINGS & RE-DEPENDENCY
Dependent Children in Washington State: Case Timeliness & Outcomes - 2020 Annual ReportWashington State Center for Court Research
Click here to return to the Summary Tables by County page.
OKANOGAN
2014 2015 2016 2017 2018 2019 2020DEP Filings 40 46 30 32 24 22 16Dismissal Counts 38 26 24 47 30 34 32TER Filings 6 14 18 29 11 5 6DEP Rate per 1000 4.17 4.79 3.12 3.31 2.47 2.26
4.17 4.793.12 3.31 2.47 2.26
0.02.04.06.08.010.012.014.016.018.020.0
05
101520253035404550
Dependency and Termination Filings with Dependency Rates per 1000 Child Population and Yearly Dismissal Counts
2014-2020 - Okanogan
Dependency cases filed during the year that had a PRIOR dependency case for the child that ended with a documented dismissal. Includes priors within county only, and excludes dismissals documented as “Dependency Not Established.” Adoption disruptions leading to re-dependency are currently not available.
0.0% 0.0% 0.0%
22.7%
0.0%0.0%
5.0%
10.0%
15.0%
20.0%
25.0%
2016 2017 2018 2019 2020
Prior Dependency - Okanogan

This page left intentionally blank.

C-102
PERFORMANCE MEASURES
Dependent Children in Washington State: Case Timeliness & Outcomes - 2020 Annual ReportWashington State Center for Court Research
< 20 Case Events 20+ Case Events
Click here to return to the Summary Tables by County page.
PACIFIC
36 4051
33 36
0
20
40
60
80
100
2016 2017 2018 2019 2020
n = 132
Percent of Cases with Fact-Finding within 75 Days
80
5868 71
60
0
20
40
60
80
100
2016 2017 2018 2019 2020
n = 90
Percent of First Dependency Review Hearings within Six Months
67
9
100
170
20
40
60
80
100
2016 2017 2018 2019 2020
n = 81
Percent of Cases with Permanency Planning Hearing within 12 Months
Statewide
56
89
53
7557
0
20
40
60
80
100
2016 2017 2018 2019 2020
n = 70
Percent of Cases with TPR Filed before 15 Months of Out-of-Home Care
Statewide
35 30 22
3844
0
20
40
60
80
100
2016 2017 2018 2019 2020
n = 108
Percent of Cases with Permanency before 15 Months of Out-of-Home Care
Statewide
22 100
20
40
60
80
100
2016 2017 2018 2019 2020
n = 41
Percent of Cases with Adoption Completed within Six Months of Termination Order
Statewide
- - -
Statewide - - -
- - - - - -
- - - - - -
Statewide

C-103
OUTCOMES & DEMOGRAPHICS
Dependent Children in Washington State: Case Timeliness & Outcomes - 2020 Annual ReportWashington State Center for Court Research
Click here to return to the Summary Tables by County page.
PACIFIC
PERMANENCY OUTCOMES Outcome Values 2016 2017 2018 2019 2020
Adoptions Median Months 35 37 23 41 34.5 % < 15 Months to Outcome 0% 0% 0% 0% 0%
Age of Majority/Emancipation
Median Months 82 57 81 % < 15 Months to Outcome 0% 0% 0%
Guardianships Median Months 21 19 % < 15 Months to Outcome 0% 33%
Reunifications Median Months 4 14 4 17 0 % < 15 Months to Outcome 88% 57% 71% 38% 91%
DEMOGRAPHIC CHARACTERISTICS OF CHILDREN IN DEPENDENCY CASES BY YEAR OF PETITION
2016 2017 2018 2019 2020 Pacific Age at Filing (1) <1 yrs 41% 31% 23% 29% 37%
(2) 1–2 yrs 7% 19% 16% 6% 11%
(3) 3–5 yrs 24% 11% 32% 18% 16%
(4) 6–11 yrs 17% 22% 16% 6% 16%
(5) 12–17 yrs 10% 17% 13% 41% 21% Gender (1) Female 34% 50% 45% 53% 37% (2) Male 66% 50% 55% 47% 63% Race (1) AI/AN 7% 11%
(4) White 66% 58% 77% 76% 58% (5) Hispanic 14% 14% 23% 12%
(6) AI/AN-Multi 14% 17% 6% 42% (8) Other-Multi 6%

C-104
DEPENDENCY FILINGS & RE-DEPENDENCY
Dependent Children in Washington State: Case Timeliness & Outcomes - 2020 Annual ReportWashington State Center for Court Research
Click here to return to the Summary Tables by County page.
PACIFIC
2014 2015 2016 2017 2018 2019 2020DEP Filings 19 15 30 36 33 20 19Dismissal Counts 27 24 14 28 25 23 24TER Filings 12 12 13 17 11 14 13DEP Rate per 1000 5.30 4.16 8.27 9.82 9.03 5.49
5.30 4.16
8.279.82
9.03
5.49
0.02.04.06.08.010.012.014.016.018.020.0
0
5
10
15
20
25
30
35
40
Dependency and Termination Filings with Dependency Rates per 1000 Child Population and Yearly Dismissal Counts
2014-2020 - Pacific
Dependency cases filed during the year that had a PRIOR dependency case for the child that ended with a documented dismissal. Includes priors within county only, and excludes dismissals documented as “Dependency Not Established.” Adoption disruptions leading to re-dependency are currently not available.
20.0%
5.6%
15.2%
0.0% 0.0%0.0%
5.0%
10.0%
15.0%
20.0%
25.0%
2016 2017 2018 2019 2020
Prior Dependency - Pacific


C-106
PERFORMANCE MEASURES
Dependent Children in Washington State: Case Timeliness & Outcomes - 2020 Annual ReportWashington State Center for Court Research
< 20 Case Events 20+ Case Events
Click here to return to the Summary Tables by County page.
PEND OREILLE
48
29 24 200
20
40
60
80
100
2016 2017 2018 2019 2020
n = 54
Percent of Cases with Fact-Finding within 75 Days
40
73
53
33 33
0
20
40
60
80
100
2016 2017 2018 2019 2020
n = 32
Percent of First Dependency Review Hearings within Six Months
100 100
75
30 33
0
20
40
60
80
100
2016 2017 2018 2019 2020
n = 28
Percent of Cases with Permanency Planning Hearing within 12 Months
Statewide
64
2530
170
20
40
60
80
100
2016 2017 2018 2019 2020
n = 38
Percent of Cases with TPR Filed before 15 Months of Out-of-Home Care
Statewide
16 1829
130
20
40
60
80
100
2016 2017 2018 2019 2020
n = 67
Percent of Cases with Permanency before 15 Months of Out-of-Home Care
Statewide
130
20
40
60
80
100
2016 2017 2018 2019 2020
n = 33
Percent of Cases with Adoption Completed within Six Months of Termination Order
Statewide
- - -
Statewide - - -
- - - - - -
- - - - - -
Statewide

C-107
OUTCOMES & DEMOGRAPHICS
Dependent Children in Washington State: Case Timeliness & Outcomes - 2020 Annual ReportWashington State Center for Court Research
Click here to return to the Summary Tables by County page.
PEND OREILLE
PERMANENCY OUTCOMES Outcome Values 2016 2017 2018 2019 2020
Adoptions Median Months 34.5 54 34 54 51 % < 15 Months to Outcome 0% 0% 0% 0% 0%
Age of Majority/Emancipation
Median Months 44 % < 15 Months to Outcome 0%
Guardianships Median Months 31 % < 15 Months to Outcome 0%
Reunifications Median Months 25 15 9 26 32 % < 15 Months to Outcome 30% 33% 80% 0% 20%
DEMOGRAPHIC CHARACTERISTICS OF CHILDREN IN DEPENDENCY CASES BY YEAR OF PETITION
2016 2017 2018 2019 2020 Pend Oreille Age at Filing (1) <1 yrs 50% 17% 25% 33% 29%
(2) 1–2 yrs 26% 8% 14%
(3) 3–5 yrs 17% 9% 8% 33% 14%
(4) 6–11 yrs 33% 39% 42% 33% 29%
(5) 12–17 yrs 9% 17% 14% Gender (1) Female 67% 39% 50% 50% 29% (2) Male 33% 61% 50% 50% 71% Race (4) White 100% 65% 67% 100% 57% (5) Hispanic 4% 8%
(6) AI/AN-Multi 22% 25% 14% (7) Black-Multi 29% (8) Other-Multi 9%

C-108
DEPENDENCY FILINGS & RE-DEPENDENCY
Dependent Children in Washington State: Case Timeliness & Outcomes - 2020 Annual ReportWashington State Center for Court Research
Click here to return to the Summary Tables by County page.
PEND OREILLE
2014 2015 2016 2017 2018 2019 2020DEP Filings 15 19 6 23 12 6 8Dismissal Counts 17 12 18 23 18 14 8TER Filings 10 7 13 4 11 7 4DEP Rate per 1000 5.83 7.46 2.37 9.10 4.73 2.34
5.83 7.46
2.37
9.10
4.73
2.340.02.04.06.08.010.012.014.016.018.020.0
0
5
10
15
20
25
Dependency and Termination Filings with Dependency Rates per 1000 Child Population and Yearly Dismissal Counts
2014-2020 - Pend Oreille
Dependency cases filed during the year that had a PRIOR dependency case for the child that ended with a documented dismissal. Includes priors within county only, and excludes dismissals documented as “Dependency Not Established.” Adoption disruptions leading to re-dependency are currently not available.
16.7%
30.4%
0.0%
16.7%
0.0%0.0%
5.0%
10.0%
15.0%
20.0%
25.0%
30.0%
35.0%
2016 2017 2018 2019 2020
Prior Dependency - Pend Oreille

This page left intentionally blank.
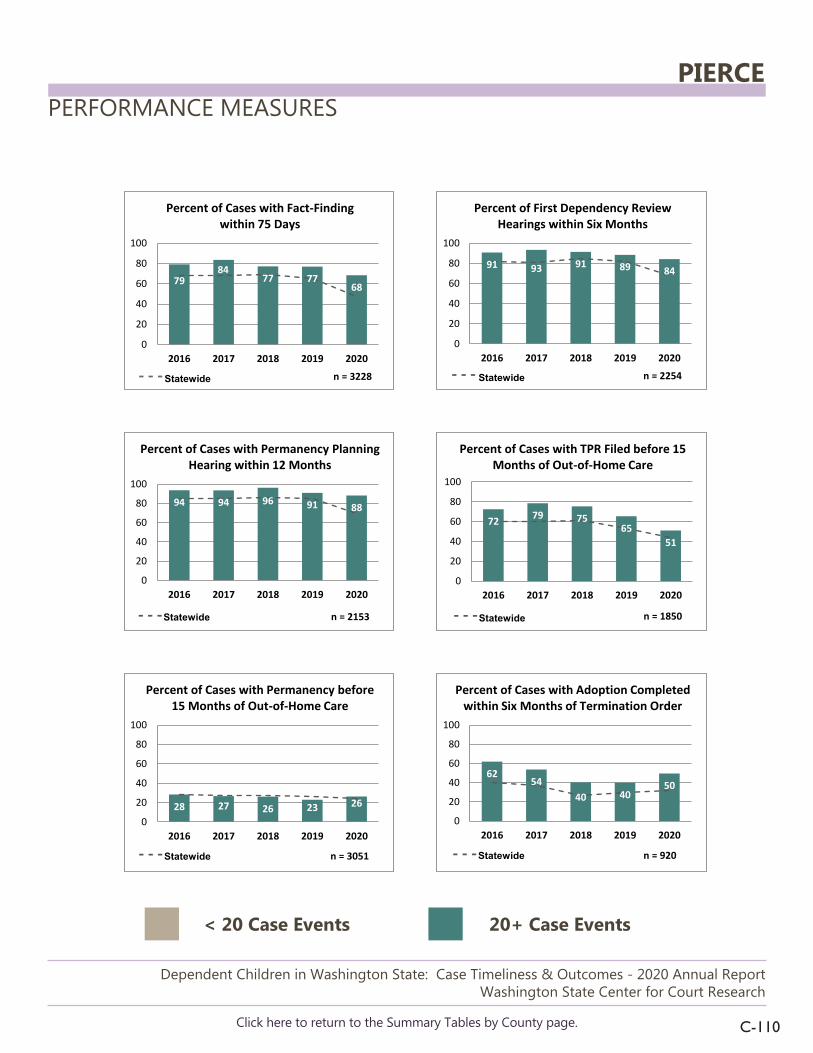
C-110
PERFORMANCE MEASURES
Dependent Children in Washington State: Case Timeliness & Outcomes - 2020 Annual ReportWashington State Center for Court Research
< 20 Case Events 20+ Case Events
Click here to return to the Summary Tables by County page.
PIERCE
7984
77 7768
0
20
40
60
80
100
2016 2017 2018 2019 2020n = 3228
Percent of Cases with Fact-Finding within 75 Days
91 93 91 89 84
0
20
40
60
80
100
2016 2017 2018 2019 2020n = 2254
Percent of First Dependency Review Hearings within Six Months
94 94 96 91 88
0
20
40
60
80
100
2016 2017 2018 2019 2020
n = 2153
Percent of Cases with Permanency Planning Hearing within 12 Months
Statewide
72 79 7565
51
0
20
40
60
80
100
2016 2017 2018 2019 2020
n = 1850
Percent of Cases with TPR Filed before 15 Months of Out-of-Home Care
Statewide
28 27 26 23 260
20
40
60
80
100
2016 2017 2018 2019 2020
n = 3051
Percent of Cases with Permanency before 15 Months of Out-of-Home Care
Statewide
6254
40 4050
0
20
40
60
80
100
2016 2017 2018 2019 2020
n = 920
Percent of Cases with Adoption Completed within Six Months of Termination Order
Statewide
- - - State
Statewide - - -
- - - - - -
- - - - - -
Statewide

C-111
OUTCOMES & DEMOGRAPHICS
Dependent Children in Washington State: Case Timeliness & Outcomes - 2020 Annual ReportWashington State Center for Court Research
Click here to return to the Summary Tables by County page.
PIERCE
PERMANENCY OUTCOMES Outcome Values 2016 2017 2018 2019 2020
Adoptions Median Months 27 29 31 33 33 % < 15 Months to Outcome 2% 2% 1% 1% 4%
Age of Majority/Emancipation
Median Months 31 41 35 52.5 54.5 % < 15 Months to Outcome 10% 7% 15% 13% 4%
Guardianships Median Months 28 33 29 31.5 25 % < 15 Months to Outcome 10% 5% 4% 4% 15%
Reunifications Median Months 16 17 17.5 18 18 % < 15 Months to Outcome 47% 42% 42% 41% 38%
DEMOGRAPHIC CHARACTERISTICS OF CHILDREN IN DEPENDENCY CASES BY YEAR OF PETITION
2016 2017 2018 2019 2020 Pierce Age at Filing (1) <1 yrs 29% 26% 35% 29% 35%
(2) 1–2 yrs 14% 15% 12% 9% 11%
(3) 3–5 yrs 16% 16% 13% 17% 12%
(4) 6–11 yrs 25% 25% 23% 28% 23%
(5) 12–17 yrs 15% 17% 16% 16% 19% (6) >17 yrs 0% 0% 0% 0% 0% Gender (1) Female 50% 50% 51% 51% 53% (2) Male 50% 50% 49% 49% 47% Race (1) AI/AN 3% 2% 2% 3% 2% (2) Asian/PI 3% 3% 4% 5% 2% (3) Black 10% 11% 12% 12% 8% (4) White 44% 43% 38% 36% 41% (5) Hispanic 7% 12% 12% 8% 11% (6) AI/AN-Multi 14% 13% 12% 14% 17% (7) Black-Multi 16% 13% 14% 17% 14% (8) Other-Multi 3% 3% 4% 4% 4% (9) Unknown 0% 0% 0% 0% 1%

C-112
DEPENDENCY FILINGS & RE-DEPENDENCY
Dependent Children in Washington State: Case Timeliness & Outcomes - 2020 Annual ReportWashington State Center for Court Research
Click here to return to the Summary Tables by County page.
PIERCE
2014 2015 2016 2017 2018 2019 2020DEP Filings 762 705 766 764 618 591 456Dismissal Counts 624 683 612 805 660 709 594TER Filings 230 260 327 340 252 154 126DEP Rate per 1000 3.85 3.52 3.75 3.67 2.93 2.76
3.85 3.52 3.75 3.67 2.932.76
0.02.04.06.08.010.012.014.016.018.020.0
0100200300400500600700800900
Dependency and Termination Filings with Dependency Rates per 1000 Child Population and Yearly Dismissal Counts
2014-2020 - Pierce
Dependency cases filed during the year that had a PRIOR dependency case for the child that ended with a documented dismissal. Includes priors within county only, and excludes dismissals documented as “Dependency Not Established.” Adoption disruptions leading to re-dependency are currently not available.
6.8%6.3%
8.8%9.1%
7.6%
0.0%
1.0%
2.0%
3.0%
4.0%
5.0%
6.0%
7.0%
8.0%
9.0%
10.0%
2016 2017 2018 2019 2020
Prior Dependency - Pierce

This page left intentionally blank.

C-114
PERFORMANCE MEASURES
Dependent Children in Washington State: Case Timeliness & Outcomes - 2020 Annual ReportWashington State Center for Court Research
< 20 Case Events 20+ Case Events
Click here to return to the Summary Tables by County page.
SAN JUAN
100
5033
91
50
0
20
40
60
80
100
2016 2017 2018 2019 2020n = 19
Percent of Cases with Fact-Finding within 75 Days
50
20
100
0
20
40
60
80
100
2016 2017 2018 2019 2020n = 13
Percent of First Dependency Review Hearings within Six Months
11
67
30
0
20
40
60
80
100
2016 2017 2018 2019 2020
n = 13
Percent of Cases with Permanency Planning Hearing within 12 Months
Statewide
38
0
20
40
60
80
100
2016 2017 2018 2019 2020
n = 11
Percent of Cases with TPR Filed before 15 Months of Out-of-Home Care
Statewide
20
50
25 200
20
40
60
80
100
2016 2017 2018 2019 2020
n = 18
Percent of Cases with Permanency before 15 Months of Out-of-Home Care
Statewide
0
20
40
60
80
100
2016 2017 2018 2019 2020
n = 0
Percent of Cases with Adoption Completed within Six Months of Termination Order
Statewide
- - - State
Statewide - - -
- - - - - -
- - - - - -
Statewide

C-115
OUTCOMES & DEMOGRAPHICS
Dependent Children in Washington State: Case Timeliness & Outcomes - 2020 Annual ReportWashington State Center for Court Research
Click here to return to the Summary Tables by County page.
SAN JUAN
PERMANENCY OUTCOMES Outcome Values 2016 2017 2018 2019 2020
Adoptions Median Months % < 15 Months to Outcome
Age of Majority/Emancipation
Median Months 1 26 % < 15 Months to Outcome 100% 0%
Guardianships Median Months 46 19 % < 15 Months to Outcome 0% 0%
Reunifications Median Months 17.5 4 36 20.5 % < 15 Months to Outcome 0% 100% 25% 25%
DEMOGRAPHIC CHARACTERISTICS OF CHILDREN IN DEPENDENCY CASES BY YEAR OF PETITION
2016 2017 2018 2019 2020 San Juan Age at Filing (1) <1 yrs 100% 30% 100%
(2) 1–2 yrs 30% (3) 3–5 yrs 75% (5) 12–17 yrs 100% 25% 40%
Gender (1) Female 50% 60% (2) Male 100% 100% 50% 40% 100%
Race (1) AI/AN 10% (3) Black 10% (4) White 100% 100% 75% 80% 100%
(5) Hispanic 25%

C-116
DEPENDENCY FILINGS & RE-DEPENDENCY
Dependent Children in Washington State: Case Timeliness & Outcomes - 2020 Annual ReportWashington State Center for Court Research
Click here to return to the Summary Tables by County page.
SAN JUAN
2014 2015 2016 2017 2018 2019 2020DEP Filings 13 1 2 4 10 2Dismissal Counts 4 5 6 3 5 2 4TER Filings 4 2 1 3DEP Rate per 1000 5.88 0.46 0.91 1.82 4.50
5.88
0.46 0.911.82
4.50
0.02.04.06.08.010.012.014.016.018.020.0
0
2
4
6
8
10
12
14
Dependency and Termination Filings with Dependency Rates per 1000 Child Population and Yearly Dismissal Counts
2014-2020 - San Juan
Dependency cases filed during the year that had a PRIOR dependency case for the child that ended with a documented dismissal. Includes priors within county only, and excludes dismissals documented as “Dependency Not Established.” Adoption disruptions leading to re-dependency are currently not available.
0.0% 0.0% 0.0% 0.0% 0.0%0.0%
10.0%
20.0%
30.0%
40.0%
50.0%
60.0%
70.0%
80.0%
90.0%
100.0%
2016 2017 2018 2019 2020
Prior Dependency - San Juan

This page left intentionally blank.
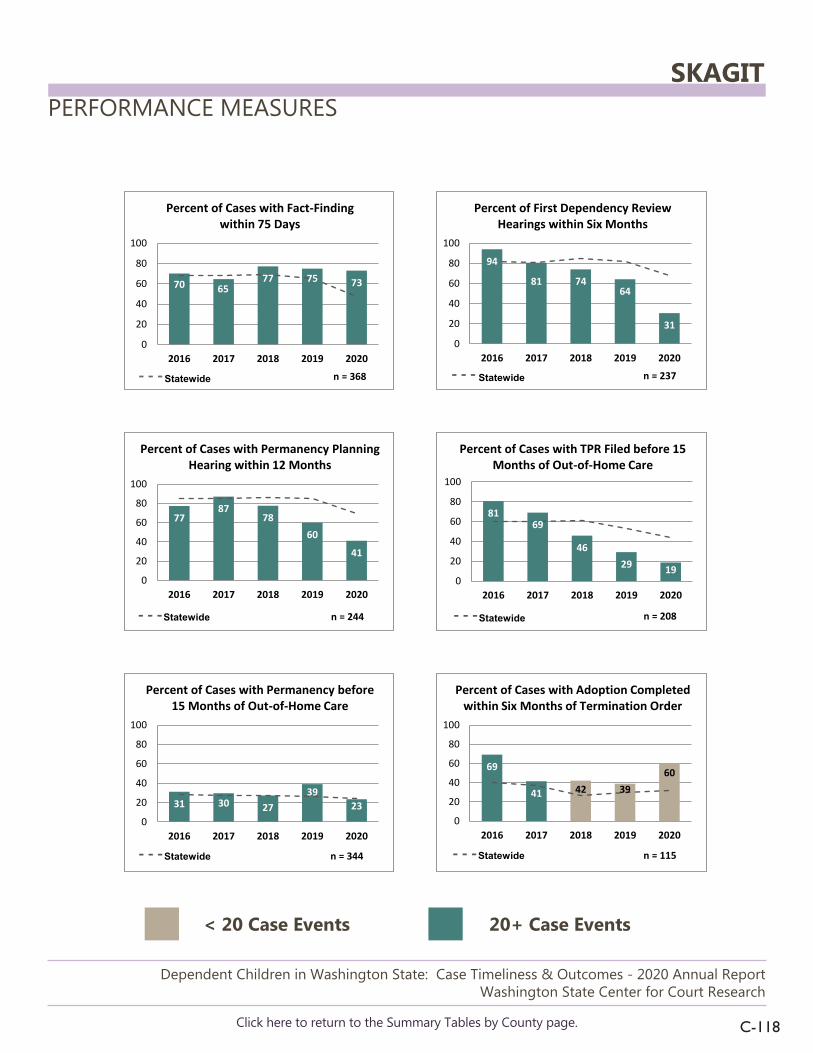
C-118
PERFORMANCE MEASURES
Dependent Children in Washington State: Case Timeliness & Outcomes - 2020 Annual ReportWashington State Center for Court Research
< 20 Case Events 20+ Case Events
Click here to return to the Summary Tables by County page.
SKAGIT
70 6577 75 73
0
20
40
60
80
100
2016 2017 2018 2019 2020n = 368
Percent of Cases with Fact-Finding within 75 Days
94
81 7464
310
20
40
60
80
100
2016 2017 2018 2019 2020n = 237
Percent of First Dependency Review Hearings within Six Months
7787
7860
41
0
20
40
60
80
100
2016 2017 2018 2019 2020
n = 244
Percent of Cases with Permanency Planning Hearing within 12 Months
Statewide
8169
4629 19
0
20
40
60
80
100
2016 2017 2018 2019 2020
n = 208
Percent of Cases with TPR Filed before 15 Months of Out-of-Home Care
Statewide
31 30 2739
230
20
40
60
80
100
2016 2017 2018 2019 2020
n = 344
Percent of Cases with Permanency before 15 Months of Out-of-Home Care
Statewide
69
41 42 3960
0
20
40
60
80
100
2016 2017 2018 2019 2020
n = 115
Percent of Cases with Adoption Completed within Six Months of Termination Order
Statewide
- - - State
Statewide - - -
- - - - - -
- - - - - -
Statewide

C-119
OUTCOMES & DEMOGRAPHICS
Dependent Children in Washington State: Case Timeliness & Outcomes - 2020 Annual ReportWashington State Center for Court Research
Click here to return to the Summary Tables by County page.
SKAGIT
PERMANENCY OUTCOMES Outcome Values 2016 2017 2018 2019 2020
Adoptions Median Months 24 28 41 28.5 30 % < 15 Months to Outcome 8% 0% 5% 6% 0%
Age of Majority/Emancipation
Median Months 23 46 54 23 58 % < 15 Months to Outcome 40% 0% 0% 0% 0%
Guardianships Median Months 41 21 84 36 % < 15 Months to Outcome 0% 33% 0% 0%
Reunifications Median Months 13 13.5 15 14 22.5 % < 15 Months to Outcome 66% 52% 48% 51% 32%
DEMOGRAPHIC CHARACTERISTICS OF CHILDREN IN DEPENDENCY CASES BY YEAR OF PETITION
2016 2017 2018 2019 2020 Skagit Age at Filing (1) <1 yrs 31% 30% 33% 22% 46%
(2) 1–2 yrs 22% 14% 15% 18% 5% (3) 3–5 yrs 16% 22% 21% 16% 21% (4) 6–11 yrs 17% 25% 26% 22% 13% (5) 12–17 yrs 14% 10% 5% 23% 15% Gender (1) Female 54% 56% 52% 49% 54%
(2) Male 46% 44% 48% 51% 46%
Race (1) AI/AN 14% 6% 19% 14% 15% (2) Asian/PI 4% 1% 4% 3%
(3) Black 1% 3% 5% (4) White 48% 49% 51% 55% 69%
(5) Hispanic 19% 33% 14% 11% 8% (6) AI/AN-Multi 7% 2% 1% 8% 8% (7) Black-Multi 1% 2% 8% 3%
(8) Other-Multi 5% 4% 1% (9) Unknown 1%

C-120
DEPENDENCY FILINGS & RE-DEPENDENCY
Dependent Children in Washington State: Case Timeliness & Outcomes - 2020 Annual ReportWashington State Center for Court Research
Click here to return to the Summary Tables by County page.
SKAGIT
2014 2015 2016 2017 2018 2019 2020DEP Filings 89 95 84 82 75 77 42Dismissal Counts 90 82 87 86 53 91 71TER Filings 42 44 62 21 20 27 24DEP Rate per 1000 3.29 3.50 3.07 2.96 2.68 2.73
3.29
3.503.07
2.96
2.682.73
0.02.04.06.08.010.012.014.016.018.020.0
0102030405060708090
100
Dependency and Termination Filings with Dependency Rates per 1000 Child Population and Yearly Dismissal Counts
2014-2020 - Skagit
Dependency cases filed during the year that had a PRIOR dependency case for the child that ended with a documented dismissal. Includes priors within county only, and excludes dismissals documented as “Dependency Not Established.” Adoption disruptions leading to re-dependency are currently not available.
9.8%
3.8%
9.5%
6.9%
5.3%
0.0%
2.0%
4.0%
6.0%
8.0%
10.0%
12.0%
2016 2017 2018 2019 2020
Prior Dependency - Skagit

This page left intentionally blank.

C-122
PERFORMANCE MEASURES
Dependent Children in Washington State: Case Timeliness & Outcomes - 2020 Annual ReportWashington State Center for Court Research
< 20 Case Events 20+ Case Events
Click here to return to the Summary Tables by County page.
SKAMANIA
13
50
25
50
290
20
40
60
80
100
2016 2017 2018 2019 2020n = 39
Percent of Cases with Fact-Finding within 75 Days
30
5040
100
75
0
20
40
60
80
100
2016 2017 2018 2019 2020n = 19
Percent of First Dependency Review Hearings within Six Months
63
3850
100
50
0
20
40
60
80
100
2016 2017 2018 2019 2020
n = 20
Percent of Cases with Permanency Planning Hearing within 12 Months
Statewide
86 80
5033
50
0
20
40
60
80
100
2016 2017 2018 2019 2020
n = 21
Percent of Cases with TPR Filed before 15 Months of Out-of-Home Care
Statewide
10
50 50 43
0
20
40
60
80
100
2016 2017 2018 2019 2020
n = 39
Percent of Cases with Permanency before 15 Months of Out-of-Home Care
Statewide
100 100
50 50
0
20
40
60
80
100
2016 2017 2018 2019 2020
n = 11
Percent of Cases with Adoption Completed within Six Months of Termination Order
Statewide
- - - State
Statewide - - -
- - - - - -
- - - - - -
Statewide

C-123
OUTCOMES & DEMOGRAPHICS
Dependent Children in Washington State: Case Timeliness & Outcomes - 2020 Annual ReportWashington State Center for Court Research
Click here to return to the Summary Tables by County page.
SKAMANIA
PERMANENCY OUTCOMES Outcome Values 2016 2017 2018 2019 2020
Adoptions Median Months 37.5 40 29.5 50 63 % < 15 Months to Outcome 0% 0% 0% 0% 0%
Age of Majority/Emancipation
Median Months 87 42 % < 15 Months to Outcome 0% 0%
Guardianships Median Months 24 % < 15 Months to Outcome 0%
Reunifications Median Months 16.5 0 9 10.5 % < 15 Months to Outcome 25% 100% 60% 75%
DEMOGRAPHIC CHARACTERISTICS OF CHILDREN IN DEPENDENCY CASES BY YEAR OF PETITION
2016 2017 2018 2019 2020 Skamania Age at Filing (1) <1 yrs 25% 36% 33% 11% 17%
(2) 1–2 yrs 25% 9% 17% 22% 17% (3) 3–5 yrs 17% 17% (4) 6–11 yrs 13% 36% 17% 44% 33% (5) 12–17 yrs 38% 18% 17% 22% 17% Gender (1) Female 50% 55% 67% 33% 33% (2) Male 50% 45% 33% 67% 67%
Race (1) AI/AN 13% 9% 17% 56% 17% (3) Black 11%
(4) White 50% 73% 83% 22% 67% (5) Hispanic 13% 9% 17%
(6) AI/AN-Multi 11% (7) Black-Multi 25% 9%

C-124
DEPENDENCY FILINGS & RE-DEPENDENCY
Dependent Children in Washington State: Case Timeliness & Outcomes - 2020 Annual ReportWashington State Center for Court Research
Click here to return to the Summary Tables by County page.
SKAMANIA
2014 2015 2016 2017 2018 2019 2020DEP Filings 13 16 8 11 8 9 7Dismissal Counts 7 22 10 7 14 5 8TER Filings 1 6 6 2 2 1DEP Rate per 1000 5.61 7.04 3.55 4.83 3.50 3.91
5.61 7.043.55 4.83
3.50 3.91
0.02.04.06.08.010.012.014.016.018.020.0
0
5
10
15
20
25
Dependency and Termination Filings with Dependency Rates per 1000 Child Population and Yearly Dismissal Counts
2014-2020 - Skamania
Dependency cases filed during the year that had a PRIOR dependency case for the child that ended with a documented dismissal. Includes priors within county only, and excludes dismissals documented as “Dependency Not Established.” Adoption disruptions leading to re-dependency are currently not available.
0.0% 0.0%
14.3%12.5%
28.6%
0.0%
5.0%
10.0%
15.0%
20.0%
25.0%
30.0%
2016 2017 2018 2019 2020
Prior Dependency - Skamania

This page left intentionally blank.

C-126
PERFORMANCE MEASURES
Dependent Children in Washington State: Case Timeliness & Outcomes - 2020 Annual ReportWashington State Center for Court Research
< 20 Case Events 20+ Case Events
Click here to return to the Summary Tables by County page.
SNOHOMISH
61 64 72 65
44
0
20
40
60
80
100
2016 2017 2018 2019 2020n = 2064
Percent of Cases with Fact-Finding within 75 Days
8881 87 86
66
0
20
40
60
80
100
2016 2017 2018 2019 2020n = 1343
Percent of First Dependency Review Hearings within Six Months
91 84 81 7867
0
20
40
60
80
100
2016 2017 2018 2019 2020
n = 1270
Percent of Cases with Permanency Planning Hearing within 12 Months
Statewide
76 72 76 8066
0
20
40
60
80
100
2016 2017 2018 2019 2020
n = 1162
Percent of Cases with TPR Filed before 15 Months of Out-of-Home Care
Statewide
24 26 31 3340
0
20
40
60
80
100
2016 2017 2018 2019 2020
n = 2083
Percent of Cases with Permanency before 15 Months of Out-of-Home Care
Statewide
31 22 25 35 35
0
20
40
60
80
100
2016 2017 2018 2019 2020
n = 692
Percent of Cases with Adoption Completed within Six Months of Termination Order
Statewide
- - - State
Statewide - - -
- - - - - -
- - - - - -
Statewide

C-127
OUTCOMES & DEMOGRAPHICS
Dependent Children in Washington State: Case Timeliness & Outcomes - 2020 Annual ReportWashington State Center for Court Research
Click here to return to the Summary Tables by County page.
SNOHOMISH
PERMANENCY OUTCOMES Outcome Values 2016 2017 2018 2019 2020
Adoptions Median Months 28 31 31 28 29.5 % < 15 Months to Outcome 3% 0% 1% 2% 0%
Age of Majority/Emancipation
Median Months 24 44.5 67 39 52.5 % < 15 Months to Outcome 29% 0% 9% 25% 0%
Guardianships Median Months 28 24 22 23 25 % < 15 Months to Outcome 18% 19% 24% 23% 17%
Reunifications Median Months 17 15 14 14 12 % < 15 Months to Outcome 40% 47% 51% 55% 64%
DEMOGRAPHIC CHARACTERISTICS OF CHILDREN IN DEPENDENCY CASES BY YEAR OF PETITION
2016 2017 2018 2019 2020 Snohomish Age at Filing (1) <1 yrs 31% 31% 29% 27% 35%
(2) 1–2 yrs 16% 17% 17% 11% 13% (3) 3–5 yrs 15% 21% 17% 20% 18% (4) 6–11 yrs 25% 21% 23% 27% 21% (5) 12–17 yrs 12% 10% 14% 15% 13% (6) >17 yrs 0% Gender (1) Female 51% 48% 51% 50% 57% (2) Male 49% 52% 49% 50% 43% Race (1) AI/AN 5% 4% 5% 4% 2% (2) Asian/PI 1% 2% 2% 5% 4% (3) Black 6% 3% 4% 5% 2% (4) White 60% 58% 60% 56% 58% (5) Hispanic 11% 14% 10% 11% 17%
(6) AI/AN-Multi 6% 4% 6% 6% 4% (7) Black-Multi 9% 12% 10% 9% 9%
(8) Other-Multi 2% 3% 2% 3% 3% (9) Unknown 0% 0% 0% 1%

C-128
DEPENDENCY FILINGS & RE-DEPENDENCY
Dependent Children in Washington State: Case Timeliness & Outcomes - 2020 Annual ReportWashington State Center for Court Research
Click here to return to the Summary Tables by County page.
SNOHOMISH
2014 2015 2016 2017 2018 2019 2020DEP Filings 445 477 383 464 489 444 258Dismissal Counts 497 463 365 423 505 560 408TER Filings 275 187 169 255 186 182 106DEP Rate per 1000 2.60 2.75 2.18 2.59 2.69 2.42
2.60 2.75 2.18 2.59 2.69 2.42
0.02.04.06.08.010.012.014.016.018.020.0
0
100
200
300
400
500
600
Dependency and Termination Filings with Dependency Rates per 1000 Child Population and Yearly Dismissal Counts
2014-2020 - Snohomish
Dependency cases filed during the year that had a PRIOR dependency case for the child that ended with a documented dismissal. Includes priors within county only, and excludes dismissals documented as “Dependency Not Established.” Adoption disruptions leading to re-dependency are currently not available.
10.0% 9.7%
11.5%
9.9%
4.1%
0.0%
2.0%
4.0%
6.0%
8.0%
10.0%
12.0%
14.0%
2016 2017 2018 2019 2020
Prior Dependency - Snohomish

This page left intentionally blank.

C-130
PERFORMANCE MEASURES
Dependent Children in Washington State: Case Timeliness & Outcomes - 2020 Annual ReportWashington State Center for Court Research
< 20 Case Events 20+ Case Events
Click here to return to the Summary Tables by County page.
SPOKANE
75 72 71 76
52
0
20
40
60
80
100
2016 2017 2018 2019 2020n = 2847
Percent of Cases with Fact-Finding within 75 Days
96 94 94 9586
0
20
40
60
80
100
2016 2017 2018 2019 2020n = 1932
Percent of First Dependency Review Hearings within Six Months
95 93 96 98 93
0
20
40
60
80
100
2016 2017 2018 2019 2020
n = 1695
Percent of Cases with Permanency Planning Hearing within 12 Months
Statewide
75 7763 57 50
0
20
40
60
80
100
2016 2017 2018 2019 2020
n = 1314
Percent of Cases with TPR Filed before 15 Months of Out-of-Home Care
Statewide
36 38 35 3626
0
20
40
60
80
100
2016 2017 2018 2019 2020
n = 2486
Percent of Cases with Permanency before 15 Months of Out-of-Home Care
Statewide
4938 36 28 26
0
20
40
60
80
100
2016 2017 2018 2019 2020
n = 850
Percent of Cases with Adoption Completed within Six Months of Termination Order
Statewide
- - - State
Statewide - - -
- - - - - -
- - - - - -
Statewide

C-131
OUTCOMES & DEMOGRAPHICS
Dependent Children in Washington State: Case Timeliness & Outcomes - 2020 Annual ReportWashington State Center for Court Research
Click here to return to the Summary Tables by County page.
SPOKANE
PERMANENCY OUTCOMES Outcome Values 2016 2017 2018 2019 2020
Adoptions Median Months 28 27 28 31 31 % < 15 Months to Outcome 5% 3% 1% 1% 2%
Age of Majority/Emancipation
Median Months 52.5 54.5 57 32.5 59 % < 15 Months to Outcome 17% 0% 0% 20% 7%
Guardianships Median Months 18.5 21 17 21 20 % < 15 Months to Outcome 28% 24% 29% 38% 39%
Reunifications Median Months 12 12 12 12 16 % < 15 Months to Outcome 58% 63% 59% 58% 41%
DEMOGRAPHIC CHARACTERISTICS OF CHILDREN IN DEPENDENCY CASES BY YEAR OF PETITION
2016 2017 2018 2019 2020 Spokane Age at Filing (1) <1 yrs 30% 32% 29% 28% 32%
(2) 1–2 yrs 18% 13% 14% 13% 18% (3) 3–5 yrs 17% 17% 16% 16% 18% (4) 6–11 yrs 25% 24% 26% 27% 23% (5) 12–17 yrs 11% 13% 14% 15% 9% (6) >17 yrs 1% 1% 1% 1% Gender (1) Female 43% 49% 49% 49% 48% (2) Male 57% 51% 51% 51% 52% Race (1) AI/AN 3% 3% 3% 3% 2% (2) Asian/PI 0% 0% 1% 1% 1% (3) Black 2% 4% 1% 3% 4% (4) White 57% 56% 54% 59% 51% (5) Hispanic 11% 7% 10% 11% 8% (6) AI/AN-Multi 20% 19% 19% 14% 25% (7) Black-Multi 7% 8% 8% 9% 5%
(8) Other-Multi 1% 3% 5% 1% 3%

C-132
DEPENDENCY FILINGS & RE-DEPENDENCY
Dependent Children in Washington State: Case Timeliness & Outcomes - 2020 Annual ReportWashington State Center for Court Research
Click here to return to the Summary Tables by County page.
SPOKANE
2014 2015 2016 2017 2018 2019 2020DEP Filings 615 547 615 625 594 540 455Dismissal Counts 665 680 582 555 521 549 543TER Filings 234 269 257 205 218 235 175DEP Rate per 1000 5.56 4.92 5.47 5.47 5.13 4.61
5.56 4.92 5.47 5.47 5.13 4.61
0.02.04.06.08.010.012.014.016.018.020.0
0
100
200
300
400
500
600
700
800
Dependency and Termination Filings with Dependency Rates per 1000 Child Population and Yearly Dismissal Counts
2014-2020 - Spokane
Dependency cases filed during the year that had a PRIOR dependency case for the child that ended with a documented dismissal. Includes priors within county only, and excludes dismissals documented as “Dependency Not Established.” Adoption disruptions leading to re-dependency are currently not available.
10.7%11.2%
11.9%
8.5%
12.6%
0.0%
2.0%
4.0%
6.0%
8.0%
10.0%
12.0%
14.0%
2016 2017 2018 2019 2020
Prior Dependency - Spokane

This page left intentionally blank.

C-134
PERFORMANCE MEASURES
Dependent Children in Washington State: Case Timeliness & Outcomes - 2020 Annual ReportWashington State Center for Court Research
< 20 Case Events 20+ Case Events
Click here to return to the Summary Tables by County page.
STEVENS
86 8295
7791
0
20
40
60
80
100
2016 2017 2018 2019 2020n = 149
Percent of Cases with Fact-Finding within 75 Days
8494 94
11
82
0
20
40
60
80
100
2016 2017 2018 2019 2020n = 123
Percent of First Dependency Review Hearings within Six Months
64
97 10089
75
0
20
40
60
80
100
2016 2017 2018 2019 2020
n = 127
Percent of Cases with Permanency Planning Hearing within 12 Months
Statewide
61 56
32
68
44
0
20
40
60
80
100
2016 2017 2018 2019 2020
n = 117
Percent of Cases with TPR Filed before 15 Months of Out-of-Home Care
Statewide
3 11 3 8 30
20
40
60
80
100
2016 2017 2018 2019 2020
n = 155
Percent of Cases with Permanency before 15 Months of Out-of-Home Care
Statewide
35732
13 110
20
40
60
80
100
2016 2017 2018 2019 2020
n = 102
Percent of Cases with Adoption Completed within Six Months of Termination Order
Statewide
- - - State
Statewide - - -
- - - - - -
- - - - - -
Statewide

C-135
OUTCOMES & DEMOGRAPHICS
Dependent Children in Washington State: Case Timeliness & Outcomes - 2020 Annual ReportWashington State Center for Court Research
Click here to return to the Summary Tables by County page.
STEVENS
PERMANENCY OUTCOMES Outcome Values 2016 2017 2018 2019 2020
Adoptions Median Months 34 28 25 31 31 % < 15 Months to Outcome 5% 5% 0% 3% 0%
Age of Majority/Emancipation
Median Months 122 136.5 98.5 % < 15 Months to Outcome 0% 0% 0%
Guardianships Median Months 15 46 23 % < 15 Months to Outcome 0% 0% 0%
Reunifications Median Months 23.5 27 21.5 18 21 % < 15 Months to Outcome 0% 40% 10% 18% 11%
DEMOGRAPHIC CHARACTERISTICS OF CHILDREN IN DEPENDENCY CASES BY YEAR OF PETITION
2016 2017 2018 2019 2020 Stevens Age at Filing (1) <1 yrs 42% 22% 28% 38% 44%
(2) 1–2 yrs 13% 22% 15% 10% 22% (3) 3–5 yrs 13% 15% 25% 14% 11% (4) 6–11 yrs 26% 29% 30% 29%
(5) 12–17 yrs 3% 12% 3% 5% (6) >17 yrs 3% 5% 22%
Gender (1) Female 61% 54% 58% 48% 33% (2) Male 39% 46% 43% 52% 67% Race (1) AI/AN 2% 10% 14% 11% (4) White 66% 76% 73% 71% 67% (5) Hispanic 8% 12%
(6) AI/AN-Multi 21% 5% 8% 14% 11% (7) Black-Multi 5% 8% 11% (8) Other-Multi 5% 3%

C-136
DEPENDENCY FILINGS & RE-DEPENDENCY
Dependent Children in Washington State: Case Timeliness & Outcomes - 2020 Annual ReportWashington State Center for Court Research
Click here to return to the Summary Tables by County page.
STEVENS
2014 2015 2016 2017 2018 2019 2020DEP Filings 30 32 38 41 40 21 9Dismissal Counts 37 49 35 32 40 43 36TER Filings 31 22 11 24 28 18 16DEP Rate per 1000 3.19 3.44 4.12 4.44 4.31 2.25
3.19 3.44 4.12 4.44 4.312.25
0.02.04.06.08.010.012.014.016.018.020.0
0
10
20
30
40
50
60
Dependency and Termination Filings with Dependency Rates per 1000 Child Population and Yearly Dismissal Counts
2014-2020 - Stevens
Dependency cases filed during the year that had a PRIOR dependency case for the child that ended with a documented dismissal. Includes priors within county only, and excludes dismissals documented as “Dependency Not Established.” Adoption disruptions leading to re-dependency are currently not available.
2.8%
10.5%
0.0%
4.8%
11.1%
0.0%
2.0%
4.0%
6.0%
8.0%
10.0%
12.0%
2016 2017 2018 2019 2020
Prior Dependency - Stevens

This page left intentionally blank.

C-138
PERFORMANCE MEASURES
Dependent Children in Washington State: Case Timeliness & Outcomes - 2020 Annual ReportWashington State Center for Court Research
< 20 Case Events 20+ Case Events
Click here to return to the Summary Tables by County page.
THURSTON
6777
8878
54
0
20
40
60
80
100
2016 2017 2018 2019 2020n = 691
Percent of Cases with Fact-Finding within 75 Days
69
88 95 98
72
0
20
40
60
80
100
2016 2017 2018 2019 2020n = 504
Percent of First Dependency Review Hearings within Six Months
96 91 96 9273
0
20
40
60
80
100
2016 2017 2018 2019 2020
n = 440
Percent of Cases with Permanency Planning Hearing within 12 Months
Statewide
93 87 9375
59
0
20
40
60
80
100
2016 2017 2018 2019 2020
n = 519
Percent of Cases with TPR Filed before 15 Months of Out-of-Home Care
Statewide
27 25 30 27 240
20
40
60
80
100
2016 2017 2018 2019 2020
n = 637
Percent of Cases with Permanency before 15 Months of Out-of-Home Care
Statewide
47 4327
49 50
0
20
40
60
80
100
2016 2017 2018 2019 2020
n = 197
Percent of Cases with Adoption Completed within Six Months of Termination Order
Statewide
- - - State
Statewide - - -
- - - - - -
- - - - - -
Statewide

C-139
OUTCOMES & DEMOGRAPHICS
Dependent Children in Washington State: Case Timeliness & Outcomes - 2020 Annual ReportWashington State Center for Court Research
Click here to return to the Summary Tables by County page.
THURSTON
PERMANENCY OUTCOMES Outcome Values 2016 2017 2018 2019 2020
Adoptions Median Months 26.5 32 28 30 37 % < 15 Months to Outcome 6% 6% 6% 2% 2%
Age of Majority/Emancipation
Median Months 21 31 59.5 52 18 % < 15 Months to Outcome 25% 0% 0% 0% 25%
Guardianships Median Months 13 22 25 18 20.5 % < 15 Months to Outcome 50% 23% 27% 44% 38%
Reunifications Median Months 17 16 16 19 17.5 % < 15 Months to Outcome 33% 43% 43% 42% 40%
DEMOGRAPHIC CHARACTERISTICS OF CHILDREN IN DEPENDENCY CASES BY YEAR OF PETITION
2016 2017 2018 2019 2020 Thurston Age at Filing (1) <1 yrs 33% 27% 27% 34% 41%
(2) 1–2 yrs 13% 16% 16% 9% 16% (3) 3–5 yrs 18% 20% 16% 14% 13% (4) 6–11 yrs 21% 20% 22% 26% 13% (5) 12–17 yrs 16% 17% 18% 16% 17% Gender (1) Female 43% 45% 55% 50% 55% (2) Male 57% 55% 45% 50% 45% Race (1) AI/AN 4% 5% 1% 2% (2) Asian/PI 3% 3% 3%
(3) Black 6% 3% 5% 9% 3% (4) White 65% 56% 69% 65% 57% (5) Hispanic 8% 11% 10% 10% 13% (6) AI/AN-Multi 5% 10% 5% 5% 7% (7) Black-Multi 1% 8% 7% 4% 7% (8) Other-Multi 7% 3% 1% 4% 10% (9) Unknown 1% 2%

C-140
DEPENDENCY FILINGS & RE-DEPENDENCY
Dependent Children in Washington State: Case Timeliness & Outcomes - 2020 Annual ReportWashington State Center for Court Research
Click here to return to the Summary Tables by County page.
THURSTON
2014 2015 2016 2017 2018 2019 2020DEP Filings 160 193 149 151 147 125 123Dismissal Counts 150 168 139 144 145 156 120TER Filings 43 30 65 54 68 40 59DEP Rate per 1000 2.75 3.29 2.49 2.49 2.39 2.01
2.75 3.29 2.49 2.49 2.39 2.01
0.02.04.06.08.010.012.014.016.018.020.0
0
50
100
150
200
250
Dependency and Termination Filings with Dependency Rates per 1000 Child Population and Yearly Dismissal Counts
2014-2020 - Thurston
Dependency cases filed during the year that had a PRIOR dependency case for the child that ended with a documented dismissal. Includes priors within county only, and excludes dismissals documented as “Dependency Not Established.” Adoption disruptions leading to re-dependency are currently not available.
2.1%
4.8%
4.2%
3.2%
6.7%
0.0%
1.0%
2.0%
3.0%
4.0%
5.0%
6.0%
7.0%
8.0%
2016 2017 2018 2019 2020
Prior Dependency - Thurston

This page left intentionally blank.

C-142
PERFORMANCE MEASURES
Dependent Children in Washington State: Case Timeliness & Outcomes - 2020 Annual ReportWashington State Center for Court Research
< 20 Case Events 20+ Case Events
Click here to return to the Summary Tables by County page.
WAHKIAKUM
100
250
20
40
60
80
100
2016 2017 2018 2019 2020n = 19
Percent of Cases with Fact-Finding within 75 Days
71
0
20
40
60
80
100
2016 2017 2018 2019 2020n = 17
Percent of First Dependency Review Hearings within Six Months
100 100
0
20
40
60
80
100
2016 2017 2018 2019 2020
n = 13
Percent of Cases with Permanency Planning Hearing within 12 Months
Statewide
100 100
0
20
40
60
80
100
2016 2017 2018 2019 2020
n = 4
Percent of Cases with TPR Filed before 15 Months of Out-of-Home Care
Statewide
67
0
20
40
60
80
100
2016 2017 2018 2019 2020
n = 12
Percent of Cases with Permanency before 15 Months of Out-of-Home Care
Statewide
100
0
20
40
60
80
100
2016 2017 2018 2019 2020
n = 1
Percent of Cases with Adoption Completed within Six Months of Termination Order
Statewide
- - - State
Statewide - - -
- - - - - -
- - - - - -
Statewide

C-143
OUTCOMES & DEMOGRAPHICS
Dependent Children in Washington State: Case Timeliness & Outcomes - 2020 Annual ReportWashington State Center for Court Research
Click here to return to the Summary Tables by County page.
WAHKIAKUM
PERMANENCY OUTCOMES Outcome Values 2016 2017 2018 2019 2020
Adoptions Median Months 20 % < 15 Months to Outcome 0%
Age of Majority/Emancipation
Median Months % < 15 Months to Outcome
Guardianships Median Months % < 15 Months to Outcome
Reunifications Median Months 22 6 % < 15 Months to Outcome 0% 80%
DEMOGRAPHIC CHARACTERISTICS OF CHILDREN IN DEPENDENCY CASES BY YEAR OF PETITION
2016 2017 2018 2019 2020 Wahkiakum Age at Filing (1) <1 yrs 17% (2) 1–2 yrs 100% 11% (3) 3–5 yrs 33% (4) 6–11 yrs 50% 44% (5) 12–17 yrs 100% 33% 11% 100%
Gender (1) Female 33% 100% 33% (2) Male 100% 67% 67% 100%
Race (4) White 100% 100% 89% 100% (5) Hispanic 100%
(7) Black-Multi 11%

C-144
DEPENDENCY FILINGS & RE-DEPENDENCY
Dependent Children in Washington State: Case Timeliness & Outcomes - 2020 Annual ReportWashington State Center for Court Research
Click here to return to the Summary Tables by County page.
WAHKIAKUM
2014 2015 2016 2017 2018 2019 2020DEP Filings 1 1 1 6 1 9 1Dismissal Counts 2 1 6 7TER Filings 2 1 2DEP Rate per 1000 1.46 1.52 1.53 9.36 1.54 13.76
1.46 1.521.53
9.36
1.54
13.76
0.02.04.06.08.010.012.014.016.018.020.0
0123456789
10
Dependency and Termination Filings with Dependency Rates per 1000 Child Population and Yearly Dismissal Counts
2014-2020 - Wahkiakum
Dependency cases filed during the year that had a PRIOR dependency case for the child that ended with a documented dismissal. Includes priors within county only, and excludes dismissals documented as “Dependency Not Established.” Adoption disruptions leading to re-dependency are currently not available.
0.0% 0.0% 0.0% 0.0% 0.0%0.0%
10.0%
20.0%
30.0%
40.0%
50.0%
60.0%
70.0%
80.0%
90.0%
100.0%
2016 2017 2018 2019 2020
Prior Dependency - Wahkiakum

This page left intentionally blank.
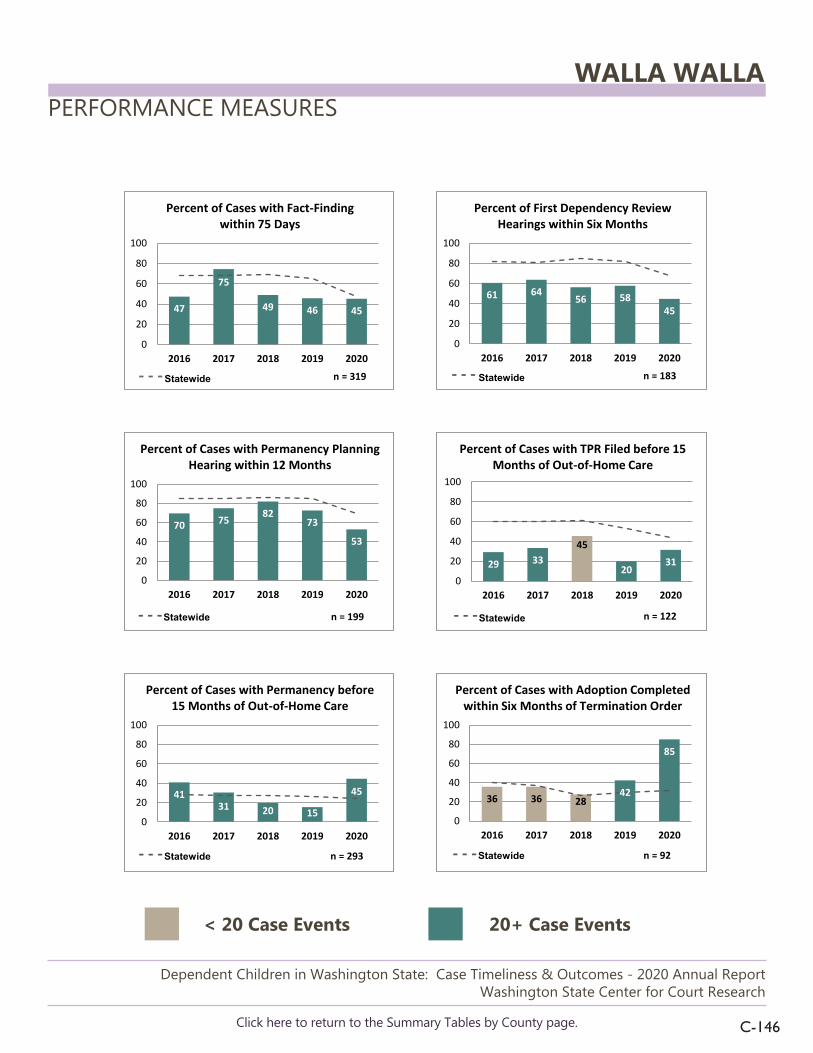
C-146
PERFORMANCE MEASURES
Dependent Children in Washington State: Case Timeliness & Outcomes - 2020 Annual ReportWashington State Center for Court Research
< 20 Case Events 20+ Case Events
Click here to return to the Summary Tables by County page.
WALLA WALLA
47
75
49 46 45
0
20
40
60
80
100
2016 2017 2018 2019 2020n = 319
Percent of Cases with Fact-Finding within 75 Days
61 64 56 5845
0
20
40
60
80
100
2016 2017 2018 2019 2020n = 183
Percent of First Dependency Review Hearings within Six Months
70 75 8273
53
0
20
40
60
80
100
2016 2017 2018 2019 2020
n = 199
Percent of Cases with Permanency Planning Hearing within 12 Months
Statewide
29 3320
3145
0
20
40
60
80
100
2016 2017 2018 2019 2020
n = 122
Percent of Cases with TPR Filed before 15 Months of Out-of-Home Care
Statewide
4131 20 15
45
0
20
40
60
80
100
2016 2017 2018 2019 2020
n = 293
Percent of Cases with Permanency before 15 Months of Out-of-Home Care
Statewide
42
85
36 36 28
0
20
40
60
80
100
2016 2017 2018 2019 2020
n = 92
Percent of Cases with Adoption Completed within Six Months of Termination Order
Statewide
- - - State
Statewide - - -
- - - - - -
- - - - - -
Statewide
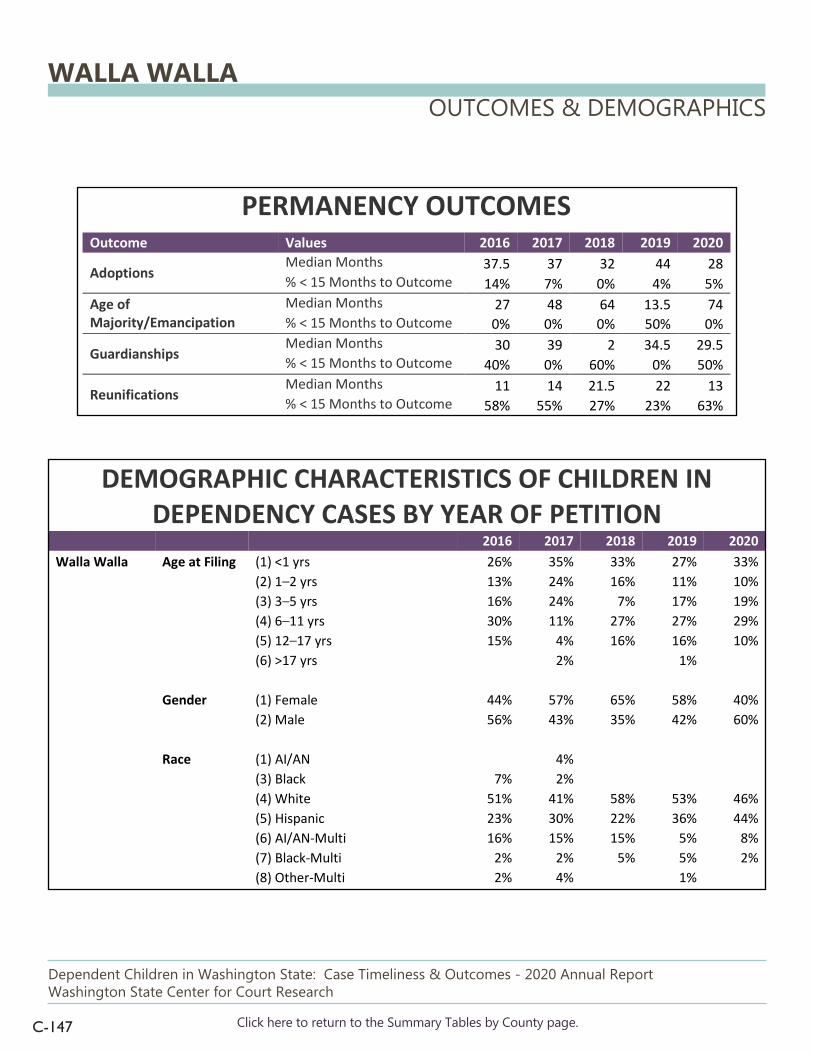
C-147
OUTCOMES & DEMOGRAPHICS
Dependent Children in Washington State: Case Timeliness & Outcomes - 2020 Annual ReportWashington State Center for Court Research
Click here to return to the Summary Tables by County page.
WALLA WALLA
PERMANENCY OUTCOMES Outcome Values 2016 2017 2018 2019 2020
Adoptions Median Months 37.5 37 32 44 28 % < 15 Months to Outcome 14% 7% 0% 4% 5%
Age of Majority/Emancipation
Median Months 27 48 64 13.5 74 % < 15 Months to Outcome 0% 0% 0% 50% 0%
Guardianships Median Months 30 39 2 34.5 29.5 % < 15 Months to Outcome 40% 0% 60% 0% 50%
Reunifications Median Months 11 14 21.5 22 13 % < 15 Months to Outcome 58% 55% 27% 23% 63%
DEMOGRAPHIC CHARACTERISTICS OF CHILDREN IN DEPENDENCY CASES BY YEAR OF PETITION
2016 2017 2018 2019 2020 Walla Walla Age at Filing (1) <1 yrs 26% 35% 33% 27% 33%
(2) 1–2 yrs 13% 24% 16% 11% 10% (3) 3–5 yrs 16% 24% 7% 17% 19% (4) 6–11 yrs 30% 11% 27% 27% 29% (5) 12–17 yrs 15% 4% 16% 16% 10% (6) >17 yrs 2% 1%
Gender (1) Female 44% 57% 65% 58% 40% (2) Male 56% 43% 35% 42% 60% Race (1) AI/AN 4%
(3) Black 7% 2% (4) White 51% 41% 58% 53% 46%
(5) Hispanic 23% 30% 22% 36% 44% (6) AI/AN-Multi 16% 15% 15% 5% 8% (7) Black-Multi 2% 2% 5% 5% 2% (8) Other-Multi 2% 4% 1%

C-148
DEPENDENCY FILINGS & RE-DEPENDENCY
Dependent Children in Washington State: Case Timeliness & Outcomes - 2020 Annual ReportWashington State Center for Court Research
Click here to return to the Summary Tables by County page.
WALLA WALLA
2014 2015 2016 2017 2018 2019 2020DEP Filings 67 58 65 46 55 81 53Dismissal Counts 65 78 66 72 49 68 81TER Filings 30 16 7 26 12 18 18DEP Rate per 1000 4.97 4.27 4.84 3.36 4.02 5.91
4.97 4.27 4.84 3.364.02 5.91
0.02.04.06.08.010.012.014.016.018.020.0
0102030405060708090
Dependency and Termination Filings with Dependency Rates per 1000 Child Population and Yearly Dismissal Counts
2014-2020 - Walla Walla
Dependency cases filed during the year that had a PRIOR dependency case for the child that ended with a documented dismissal. Includes priors within county only, and excludes dismissals documented as “Dependency Not Established.” Adoption disruptions leading to re-dependency are currently not available.
4.7%
11.1%
5.5%
2.5%
15.1%
0.0%
2.0%
4.0%
6.0%
8.0%
10.0%
12.0%
14.0%
16.0%
2016 2017 2018 2019 2020
Prior Dependency - Walla Walla

This page left intentionally blank.
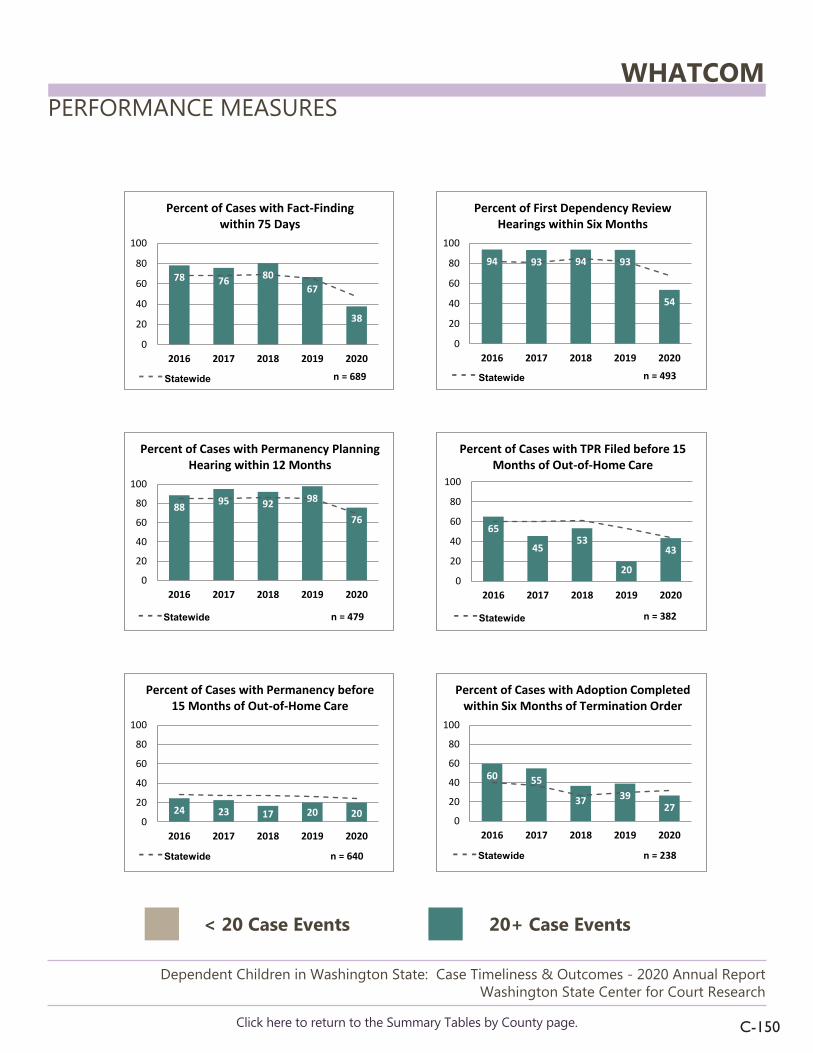
C-150
PERFORMANCE MEASURES
Dependent Children in Washington State: Case Timeliness & Outcomes - 2020 Annual ReportWashington State Center for Court Research
< 20 Case Events 20+ Case Events
Click here to return to the Summary Tables by County page.
WHATCOM
78 76 8067
38
0
20
40
60
80
100
2016 2017 2018 2019 2020n = 689
Percent of Cases with Fact-Finding within 75 Days
94 93 94 93
54
0
20
40
60
80
100
2016 2017 2018 2019 2020n = 493
Percent of First Dependency Review Hearings within Six Months
88 95 92 98
76
0
20
40
60
80
100
2016 2017 2018 2019 2020
n = 479
Percent of Cases with Permanency Planning Hearing within 12 Months
Statewide
65
4553
20
43
0
20
40
60
80
100
2016 2017 2018 2019 2020
n = 382
Percent of Cases with TPR Filed before 15 Months of Out-of-Home Care
Statewide
24 23 17 20 200
20
40
60
80
100
2016 2017 2018 2019 2020
n = 640
Percent of Cases with Permanency before 15 Months of Out-of-Home Care
Statewide
60 55
37 3927
0
20
40
60
80
100
2016 2017 2018 2019 2020
n = 238
Percent of Cases with Adoption Completed within Six Months of Termination Order
Statewide
- - - State
Statewide - - -
- - - - - -
- - - - - -
Statewide

C-151
OUTCOMES & DEMOGRAPHICS
Dependent Children in Washington State: Case Timeliness & Outcomes - 2020 Annual ReportWashington State Center for Court Research
Click here to return to the Summary Tables by County page.
WHATCOM
PERMANENCY OUTCOMES Outcome Values 2016 2017 2018 2019 2020
Adoptions Median Months 27 32.5 32 34 40.5 % < 15 Months to Outcome 5% 0% 0% 3% 0%
Age of Majority/Emancipation
Median Months 38 50.5 50 34 36 % < 15 Months to Outcome 20% 0% 0% 0% 0%
Guardianships Median Months 27.5 24.5 34.5 32 26 % < 15 Months to Outcome 20% 20% 0% 14% 33%
Reunifications Median Months 18 17 18 22 16 % < 15 Months to Outcome 40% 41% 29% 38% 31%
DEMOGRAPHIC CHARACTERISTICS OF CHILDREN IN DEPENDENCY CASES BY YEAR OF PETITION
2016 2017 2018 2019 2020 Whatcom Age at Filing (1) <1 yrs 25% 27% 40% 23% 33%
(2) 1–2 yrs 19% 15% 11% 18% 7% (3) 3–5 yrs 22% 17% 20% 20% 24% (4) 6–11 yrs 23% 24% 21% 24% 28% (5) 12–17 yrs 11% 17% 7% 15% 9% (6) >17 yrs 1%
Gender (1) Female 47% 53% 49% 50% 49% (2) Male 53% 47% 51% 50% 51% Race (1) AI/AN 18% 15% 24% 16% 16% (2) Asian/PI 1% 1% 5%
(3) Black 2% 1% 1% 2% (4) White 48% 52% 39% 52% 57%
(5) Hispanic 13% 13% 15% 11% 13% (6) AI/AN-Multi 8% 10% 10% 6% 11% (7) Black-Multi 11% 6% 6% 7% 4% (8) Other-Multi 1% 1% 3% 1%
(9) Unknown 1%

C-152
DEPENDENCY FILINGS & RE-DEPENDENCY
Dependent Children in Washington State: Case Timeliness & Outcomes - 2020 Annual ReportWashington State Center for Court Research
Click here to return to the Summary Tables by County page.
WHATCOM
2014 2015 2016 2017 2018 2019 2020DEP Filings 193 149 183 168 105 119 88Dismissal Counts 153 155 141 167 144 154 132TER Filings 82 92 73 64 82 37 45DEP Rate per 1000 4.52 3.47 4.22 3.82 2.37 2.65
4.52 3.47 4.22 3.82 2.37 2.65
0.02.04.06.08.010.012.014.016.018.020.0
0
50
100
150
200
250
Dependency and Termination Filings with Dependency Rates per 1000 Child Population and Yearly Dismissal Counts
2014-2020 - Whatcom
Dependency cases filed during the year that had a PRIOR dependency case for the child that ended with a documented dismissal. Includes priors within county only, and excludes dismissals documented as “Dependency Not Established.” Adoption disruptions leading to re-dependency are currently not available.
3.9%
15.2%
6.8% 7.1%
10.5%
0.0%
2.0%
4.0%
6.0%
8.0%
10.0%
12.0%
14.0%
16.0%
18.0%
2016 2017 2018 2019 2020
Prior Dependency - Whatcom

This page left intentionally blank.

C-154
PERFORMANCE MEASURES
Dependent Children in Washington State: Case Timeliness & Outcomes - 2020 Annual ReportWashington State Center for Court Research
< 20 Case Events 20+ Case Events
Click here to return to the Summary Tables by County page.
WHITMAN
2341
2740
60
20
40
60
80
100
2016 2017 2018 2019 2020n = 125
Percent of Cases with Fact-Finding within 75 Days
10095 92100
33
0
20
40
60
80
100
2016 2017 2018 2019 2020n = 40
Percent of First Dependency Review Hearings within Six Months
71
10092 100 100
0
20
40
60
80
100
2016 2017 2018 2019 2020
n = 66
Percent of Cases with Permanency Planning Hearing within 12 Months
Statewide
6 7
50
0
20
40
60
80
100
2016 2017 2018 2019 2020
n = 49
Percent of Cases with TPR Filed before 15 Months of Out-of-Home Care
Statewide
4050
19
54
320
20
40
60
80
100
2016 2017 2018 2019 2020
n = 105
Percent of Cases with Permanency before 15 Months of Out-of-Home Care
Statewide
25
100
33
0
20
40
60
80
100
2016 2017 2018 2019 2020
n = 18
Percent of Cases with Adoption Completed within Six Months of Termination Order
Statewide
- - - State
Statewide - - -
- - - - - -
- - - - - -
Statewide

C-155
OUTCOMES & DEMOGRAPHICS
Dependent Children in Washington State: Case Timeliness & Outcomes - 2020 Annual ReportWashington State Center for Court Research
Click here to return to the Summary Tables by County page.
WHITMAN
PERMANENCY OUTCOMES Outcome Values 2016 2017 2018 2019 2020
Adoptions Median Months 39.5 53 28 51 38 % < 15 Months to Outcome 0% 0% 0% 33% 0%
Age of Majority/Emancipation
Median Months 45 30.5 % < 15 Months to Outcome 0% 50%
Guardianships Median Months 0 27 28 33 % < 15 Months to Outcome 100% 0% 0% 0%
Reunifications Median Months 10 14 5 28 29 % < 15 Months to Outcome 64% 50% 71% 33% 29%
DEMOGRAPHIC CHARACTERISTICS OF CHILDREN IN DEPENDENCY CASES BY YEAR OF PETITION
2016 2017 2018 2019 2020 Whitman Age at Filing (1) <1 yrs 14% 19% 20% 43% 21%
(2) 1–2 yrs 17% 16% 25% 7% 21% (3) 3–5 yrs 24% 22% 35% 14% 21% (4) 6–11 yrs 33% 25% 10% 7% 21% (5) 12–17 yrs 12% 19% 5% 29% 14% (6) >17 yrs 5%
Gender (1) Female 40% 66% 55% 57% 64% (2) Male 60% 34% 45% 43% 36% Race (2) Asian/PI 6%
(3) Black 7% (4) White 76% 59% 60% 50% 86% (5) Hispanic 5% 6% 15% 29% 7% (6) AI/AN-Multi 14% 25% 25% 21%
(7) Black-Multi 5% 3%

C-156
DEPENDENCY FILINGS & RE-DEPENDENCY
Dependent Children in Washington State: Case Timeliness & Outcomes - 2020 Annual ReportWashington State Center for Court Research
Click here to return to the Summary Tables by County page.
WHITMAN
2014 2015 2016 2017 2018 2019 2020DEP Filings 18 15 44 32 20 14 17Dismissal Counts 13 18 15 24 32 22 28TER Filings 4 3 5 6 11 15 5DEP Rate per 1000 2.32 1.96 5.57 4.00 2.50 1.74
2.321.96
5.574.00
2.50 1.74
0.02.04.06.08.010.012.014.016.018.020.0
05
101520253035404550
Dependency and Termination Filings with Dependency Rates per 1000 Child Population and Yearly Dismissal Counts
2014-2020 - Whitman
Dependency cases filed during the year that had a PRIOR dependency case for the child that ended with a documented dismissal. Includes priors within county only, and excludes dismissals documented as “Dependency Not Established.” Adoption disruptions leading to re-dependency are currently not available.
4.9%
3.4%
10.5%
8.3%
0.0%0.0%
2.0%
4.0%
6.0%
8.0%
10.0%
12.0%
2016 2017 2018 2019 2020
Prior Dependency - Whitman

This page left intentionally blank.

C-158
PERFORMANCE MEASURES
Dependent Children in Washington State: Case Timeliness & Outcomes - 2020 Annual ReportWashington State Center for Court Research
< 20 Case Events 20+ Case Events
Click here to return to the Summary Tables by County page.
YAKIMA
69 6977 74
64
0
20
40
60
80
100
2016 2017 2018 2019 2020
n = 962
Percent of Cases with Fact-Finding within 75 Days
8979
88 89 83
0
20
40
60
80
100
2016 2017 2018 2019 2020
n = 612
Percent of First Dependency Review Hearings within Six Months
87 81 8593
71
0
20
40
60
80
100
2016 2017 2018 2019 2020
n = 600
Percent of Cases with Permanency Planning Hearing within 12 Months
Statewide
76 71
48 54 55
0
20
40
60
80
100
2016 2017 2018 2019 2020
n = 518
Percent of Cases with TPR Filed before 15 Months of Out-of-Home Care
Statewide
3624
36 28 230
20
40
60
80
100
2016 2017 2018 2019 2020
n = 954
Percent of Cases with Permanency before 15 Months of Out-of-Home Care
Statewide
30
66
44 44
66
0
20
40
60
80
100
2016 2017 2018 2019 2020
n = 310
Percent of Cases with Adoption Completed within Six Months of Termination Order
Statewide
- - -
Statewide - - -
- - - - - -
- - - - - -
Statewide

C-159
OUTCOMES & DEMOGRAPHICS
Dependent Children in Washington State: Case Timeliness & Outcomes - 2020 Annual ReportWashington State Center for Court Research
Click here to return to the Summary Tables by County page.
YAKIMA
PERMANENCY OUTCOMES Outcome Values 2016 2017 2018 2019 2020
Adoptions Median Months 30 25 29 25 26.5 % < 15 Months to Outcome 9% 6% 10% 5% 5%
Age of Majority/Emancipation
Median Months 34.5 37 30 26 31.5 % < 15 Months to Outcome 13% 22% 33% 38% 13%
Guardianships Median Months 17 15 21.5 21 15 % < 15 Months to Outcome 46% 38% 38% 22% 50%
Reunifications Median Months 11 18 16 20 21 % < 15 Months to Outcome 55% 39% 45% 40% 29%
DEMOGRAPHIC CHARACTERISTICS OF CHILDREN IN DEPENDENCY CASES BY YEAR OF PETITION
2016 2017 2018 2019 2020 Yakima Age at Filing (1) <1 yrs 21% 22% 25% 22% 32%
(2) 1–2 yrs 12% 11% 14% 14% 11% (3) 3–5 yrs 17% 16% 21% 18% 20% (4) 6–11 yrs 33% 21% 22% 18% 21% (5) 12–17 yrs 17% 28% 16% 27% 17% (6) >17 yrs 1% 2% 2%
Gender (1) Female 50% 55% 44% 46% 38% (2) Male 50% 45% 56% 54% 62% Race (1) AI/AN 9% 1% 5% 4% 3% (3) Black 0% 1% 1% 1% (4) White 27% 34% 33% 22% 36% (5) Hispanic 55% 49% 51% 58% 43% (6) AI/AN-Multi 4% 13% 6% 8% 14% (7) Black-Multi 4% 1% 3% 7% 2% (8) Other-Multi 0% 0% 2%
(9) Unknown 1%

C-160
DEPENDENCY FILINGS & RE-DEPENDENCY
Dependent Children in Washington State: Case Timeliness & Outcomes - 2020 Annual ReportWashington State Center for Court Research
Click here to return to the Summary Tables by County page.
YAKIMA
2014 2015 2016 2017 2018 2019 2020DEP Filings 212 274 249 204 202 132 143Dismissal Counts 256 255 290 238 244 233 147TER Filings 88 106 121 53 86 59 52DEP Rate per 1000 2.80 3.57 3.23 2.63 2.60 1.70
2.80 3.57 3.23 2.63 2.601.70
0.02.04.06.08.010.012.014.016.018.020.0
0
50
100
150
200
250
300
350
Dependency and Termination Filings with Dependency Rates per 1000 Child Population and Yearly Dismissal Counts
2014-2020 - Yakima
Dependency cases filed during the year that had a PRIOR dependency case for the child that ended with a documented dismissal. Includes priors within county only, and excludes dismissals documented as “Dependency Not Established.” Adoption disruptions leading to re-dependency are currently not available.
10.2%11.2%
8.9%
11.0%11.5%
0.0%
2.0%
4.0%
6.0%
8.0%
10.0%
12.0%
14.0%
2016 2017 2018 2019 2020
Prior Dependency - Yakima

Washington State Center for Court Researchwww.courts.wa.gov/[email protected]