Embed Size (px)
Citation preview
Dependence of Fatty-Acid Composition of EdibleOils on Their Enrichment in Olive Phenols
MARIA VICTORIA GIRON, JOSE RUIZ-JIMENEZ,* AND
MARIA DOLORES LUQUE DE CASTRO
Department of Analytical Chemistry, Annex Marie Curie Building, Campus of Rabanales, Universityof Cordoba, 14071 Cordoba, Spain
Olive phenol extracts from waste from olive-oil production (alperujo) have been obtained by microwave-assisted extraction and used for edible oil enrichment. The extracts as such or after extractant removalwere used to enrich edible oils of different fatty acid composition by liquid-liquid or solid-liquidextraction, respectively. The distribution ratios of the phenols in the different oils [olive-orujo (thewaste of milled olives from which low-quality oil is obtained), sunflower, high oleic-acid contentsunflower, coconut, and linseed] showed a given order as a function of phenol polarity and molecularweight, with higher distribution factors for more polar and lower molecular-weight phenols. Concerningoil composition, those oils with higher concentration of polyunsaturated fatty acids yielded higherphenol distribution factors; oils with higher concentrations of saturated fatty acids yielded lowerdistribution factors.
KEYWORDS: Edible oil-enrichment; olive phenols; alperujo; distribution factor; microwave-assisted
extraction
INTRODUCTION
It is well-known that the Mediterranean diet involves theintake of moderate amounts of olive oil, which contribute todecrease the incidence of chronic diseases thanks to its healthfulproperties (1).
The components of olive oil can be divided into two groupsas a function of their concentration, major and minor com-pounds. The first group, known as the saponifiable fraction,represents more than 98% of the total weight of the oil andconsists of triglycerides, diglycerides, monoglycerides and freefatty acids. The second group, the unsaponifiable fraction,comprising about 2% of the total weight, is constituted by agreat variety of compounds such as aliphatic and triterpenicalcohols, sterols, hydrocarbons, volatile compounds and anti-oxidants. Most of these antioxidants are carotenes and phenols(2).
The phenolic fraction of virgin olive oil has not beencompletely characterized due to the complexity of both phenolsand matrix. In recent studies it has been found that olive oil isa source of at least 30 phenolic compounds (3, 4) which can bedivided into six families, namely, phenolic acids, phenyl ethylalcohols, hydroxy-isochromans, flavonoids, lignans and secor-oiridoids. The main constituents of the phenolic fraction of theolive oil, hydroxytyrosol, tyrosol, oleuropein and their conju-gated forms, belong to one of these families (5).
Phenolics present in olive oil are used for their nutraceuticalcapabilities, well-known by consumers. For example, apigenin-
7-glucoside is used in the therapy of Alzheimer’s (6) and liverdiseases; hydroxytyrosol is a strong antioxidant (7); luteolin-7-glucoside avoids the abnormal proliferation of aortic vascularsmooth muscle cells that is a common cause of atherosclerosis(8); oleuropein prevents cardiac diseases and improves lipidmetabolism (9); and tyrosol is an antioxidant protector of thecirculating system (10).
While lipophilic phenols such as tocopherols can be foundin other vegetable oils, most hydrophilic phenols found in oliveoil are not common to other oils or fats such as coconut andsunflower (11). Taking into account the high price of olive oiland the antioxidant and nutraceutical capacities of olive phenols,which may be added to selected foods, there is a growing interestin the use of these compounds to enrich low-priced oils (12, 13),which contain a minimum concentration of or no phenoliccompounds, in order to obtain a healthful added-value product.
The main sources of olive phenols (14, 15) are olive leavesand olive oil industry wastes, orujo, alpechın or alperujo,depending on the manufacturing process of the oil. Alperujo isa semisolid residue from three-phase olive oil production witha high polluting organic load, which includes sugars, tannins,phenols, polyalcohols, pectins and lipids. The concentration ofphenolic compounds in alperujo is 100 times higher than in oliveoil, a fact which can be explained by the polar nature of thealperujo phase versus the nonpolar olive oil (16). Thesecompounds can be removed from alperujo by conventionalsolid-liquid extraction or by new extraction methods based onthe use of auxiliary energies such as microwaves, ultrasound
* Corresponding author. Tel: +34957218615. Fax: +34957218615.E-mail: [email protected].
J. Agric. Food Chem. 2009, 57, 2797–2802 2797
10.1021/jf803455f CCC: $40.75 2009 American Chemical SocietyPublished on Web 03/02/2009
(16) or superheated liquids, which accelerate and/or improvethe extraction step.
A cleanup step of the extract can be necessary prior to itsuse as an enricher phase. Conventional cleaning strategies areliquid-liquid extraction using hexane as extractant or solid-phase extraction. In the latter case, Amberlite XAD type is themost usual sorbent (17).
There are three alternatives in the literature for oil enrichmentwith these valuable compounds from the olive tree: liquid-liquidextraction (18), in which the oil is put into contact with analcoholic phenol solution, the phenols are transferred to the oilyphase as a function of their distribution factor and the alcoholicphase is removed by centrifugation; solid-liquid extraction (19),in which the purified phenolic extract is dried under appropriateconditions and the paste obtained is partially dissolved intothe oil as a function of the solubility of the different pastecomponents in the oily phase; and a combination of theseprocedures, in which the alcoholic extract and the oil are putinto contact and the two-phase system is subject to alcoholremoval in a rotary evaporator.
The aims of the present research were to study phenol mass-transfer to edible oils with different fatty acid composition, i.e.coconut, sunflower, high oleic sunflower, linseed and orujo; toestablish the dependence of enrichment factors on the type ofoil and enrichment procedure; and to enrich edible oils withphenols from alperujo extracts.
MATERIAL AND METHODS
Samples. Alperujo from Nunez de Prado, C.B. (Cordoba, Spain),obtained during the 2007/2008 crop season, was taken directly fromthe production line and stored at -20 °C until use in order to avoiddegradation (16). Edible oils were purchased from a local supermarket(olive-orujo, sunflower and high-oleic acid-content sunflower oils), fromQuimics Dalmau, Barcelona, Spain (coconut oil), and from Guinama,Valencia, Spain (linseed oil).
Reagents. HPLC-grade ethanol, methanol, acetonitrile, sodiumcarbonate, Folin Ciocalteu (F-C) reagent and orthophosphoric acidwere from Panreac (Barcelona, Spain).
The most representative phenolic compounds in olive oil, hydroxy-tyrosol, tyrosol, oleuropein, luteolin 7-glucoside and apigenin 7-gly-coside, were purchased from Extrasynthese (Genay, France). Vanillin,caffeic acid, vanillic acid, p- and o-coumaric acids, ferulic acid andthe internal standard syringic acid were from Sigma (St. Louis, MO).The stock standard solution of each phenol was prepared at 1000 µg/mL by dissolving 10 mg of each phenol in 10 mL of methanol. Thestandard solutions, which contained the 11 phenols, were prepared bydilution of the appropriate volume of each stock solution in methanol.All the above solutions were stored at -20 °C in glass vials and keptin the dark until use.
Eighteen microohms deionized water from a Millipore Milli-Q waterpurification system was used to prepare mobile chromatographicphases.
Apparatus and Instruments. Microwave irradiation was appliedby means of a MIC-II microwave oven of 400 W maximum power,from SEV (Puebla, Mexico), furnished with a manual power controlunit.
A Selecta Mixtasel (Barcelona, Spain) centrifuge was used to removesolid particles from the extract and to break the oil-extract emulsions.
An MS2 minishaker from IKA (Wilmington, NC) was used to favorphenol transfer from the ethanolic solution to the oil. A dry nitrogenstream was used to remove ethanol from the extract-oil system and/or ethanol traces from oil.
An Agilent 1100 liquid chromatograph (Pittsburgh, PA) consistingof a G1311A quaternary pump, a G1322A vacuum degasser, a G1315Adiode array detector (DAD) and a Reodyne 7725 high pressure injectionvalve (20 µL injection loop) was used for the analysis of the targetanalytes. The analytical column was a 250 × 4.6 mm i.d., 5 µm, InertisilODS-2 from GL Sciences Inc. (Tokyo, Japan).
An Agilent 8453E UV/vis spectrophotometer was used for deter-mination of total phenol concentration by the F-C method.
A Varian CP-3800 gas chromatograph (Walnut Creek, CA) equippedwith a split/splitless SPI/1079 programmable-temperature injector andcoupled to a Saturn 2200 ion-trap mass spectrometer (Sunnyvale, TX)was used for the determination fatty acid profiles of oils. Thechromatograph was furnished with a Varian COP 8400 autosamplerand a 60 m × 0.25 mm i.d., 0.2 µm film thickness SP-2380 fused silicacapillary column from Supelco (Bellefonte, PA).
Procedures for Extraction of Phenols from Alperujo. Twelvegrams of alperujo and 100 mL of ethanol were placed into the quartzextraction vessel located in the microwave irradiation zone of the oven.After extraction (10 min microwave irradiation at 400 W) the suspensionwas centrifuged at 3000 rpm for 5 min for phase separation. Thisprocess was repeated 15 times in order to obtain 1.5 L of extract, whichwas concentrated in a rotary evaporator at 35 °C to obtain 150 mL ofconcentrated extract with 15 g/L total phenol concentration, determinedby the F-C method using caffeic acid as standard (20). This extractwas used for preparation of diluted phenol solutions by dilution withan 80:20 ethanol-water solution.
Enrichment of Edible Oils with Phenols from Alperujo Ex-tracts. Solid-Liquid (S-L) Enrichment Method. A volume of dilutedphenol solution was put into contact with 3 mL of oil and vigorouslyshaken for 30 min. The ethanol-water phase was completely evaporatedunder a nitrogen stream to achieve the maximum transference of phenolsto the given oil. The oil thus enriched was centrifuged for 10 min at3000 rpm to remove solid particles from the dried diluted phenolsolution. The resulting oil was analyzed to determine total and individualphenol concentration.
Liquid-Liquid (L-L) Enrichment Method. The procedure wassimilar to that previously developed by Japon-Lujan et al. (18). Briefly,a volume of the diluted phenol solution and 3 mL of oil were put intocontact in an electrical stirrer for 30 min. After that, the ethanol-waterphase was removed by centrifugation at 3000 rpm for 10 min. Theresulting enriched oil was analyzed to determine total and individualphenol concentration.
Determination of Phenols. The overall concentration of phenolswas determined by the Folin-Ciocalteu method and that of eachindividual phenol following chromatographic separation. Determinationsin the extracts were carried out after dilution with 80:20 ethanol-water,and after liquid-liquid extraction with methanol in the case of enrichedoils.
Extraction of the Phenolic Compounds from the Oil. A small portion(1.5 mL) of enriched oil was shaken for 30 min with 1.5 mL ofmethanol. The methanolic phase, which contained the phenoliccompounds, was removed by centrifugation and stored at -20 °C forsubsequent analysis.
Determination of Total Phenol Content. After extraction, totalconcentration of phenols was estimated by the Folin-Ciocalteu method.Briefly, 0.1 mL of the methanolic extract was mixed with 2 mL ofwater, 0.2 mL of Folin-Ciocalteu reagent and 0.6 mL of 20% (w/v)Na2CO3 aqueous solution, in that order. The resulting mixture wasdiluted with water in order to obtain a 5 mL final volume and then
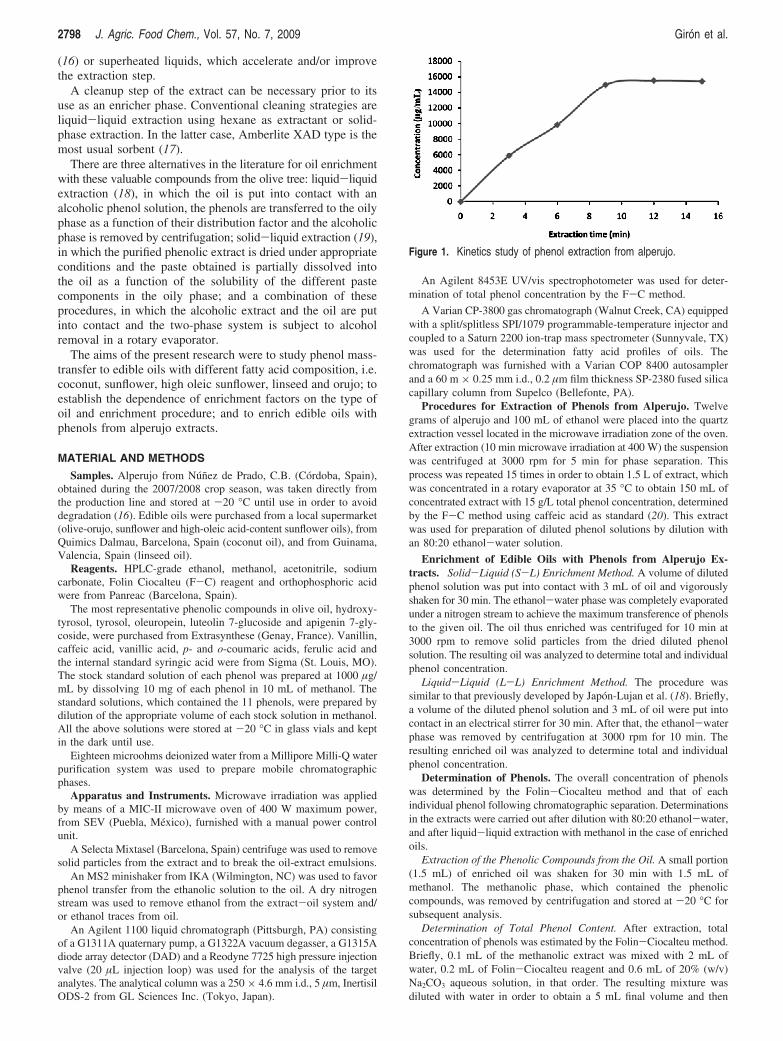
Figure 1. Kinetics study of phenol extraction from alperujo.
2798 J. Agric. Food Chem., Vol. 57, No. 7, 2009 Giron et al.
incubated for 30 min in a water bath at 50 °C. The reaction productwas monitored at 725 nm. Caffeic acid was used as standard forcalibration.
HPLC-DAD Separation-Quantification. The applied method wasthat proposed by the International Oleic Council (IOC) for the individualdetermination of phenolic compounds in olive oil (21).
The analytical column used was a 250 × 4 mm i.d., 5 µm, reversed-phase Inertisil ODS-2; the injection volume 10 µL; and the mobile
phase a mixture of A (water acidified with 0.2% phosphoric acid) andB (acetonitrile-methanol, 1:1 v/v) at 1 mL/min. An initial lineargradient elution from 0 to 50% B in 40 min was followed by otherlinear elution gradient from 50 to 60% B in 5 min and a third gradientfrom 60 to 100% B in 10 min. Finally, the instrument was kept underisocratic conditions (100% B) for 2 min. A 5 min equilibration stepenabled the initial conditions and mobile phase stabilization to bereached. The eluted phenols were monitored at 230, 280, 325 and 350nm (elution time shorter than 57 min).
Calculation of the Distribution Factor. The distribution factor,defined as the quotient between the phenol concentration in the oil andthat in the methanolic or in the solid phase after reaching transferequilibrium, was calculated for each individual phenol and the totalphenol concentration for each enrichment method. In the S-Lenrichment method the solid residue was reconstituted in methanol priorto the determination step.
Determination of the Fatty Acid Profile. The fatty acids in the oilwere derivatized to more volatile compounds (fatty acid methyl esters,FAMEs) for proper individual separation by gas chromatography. TheIOC method for FAME preparation was used (22).
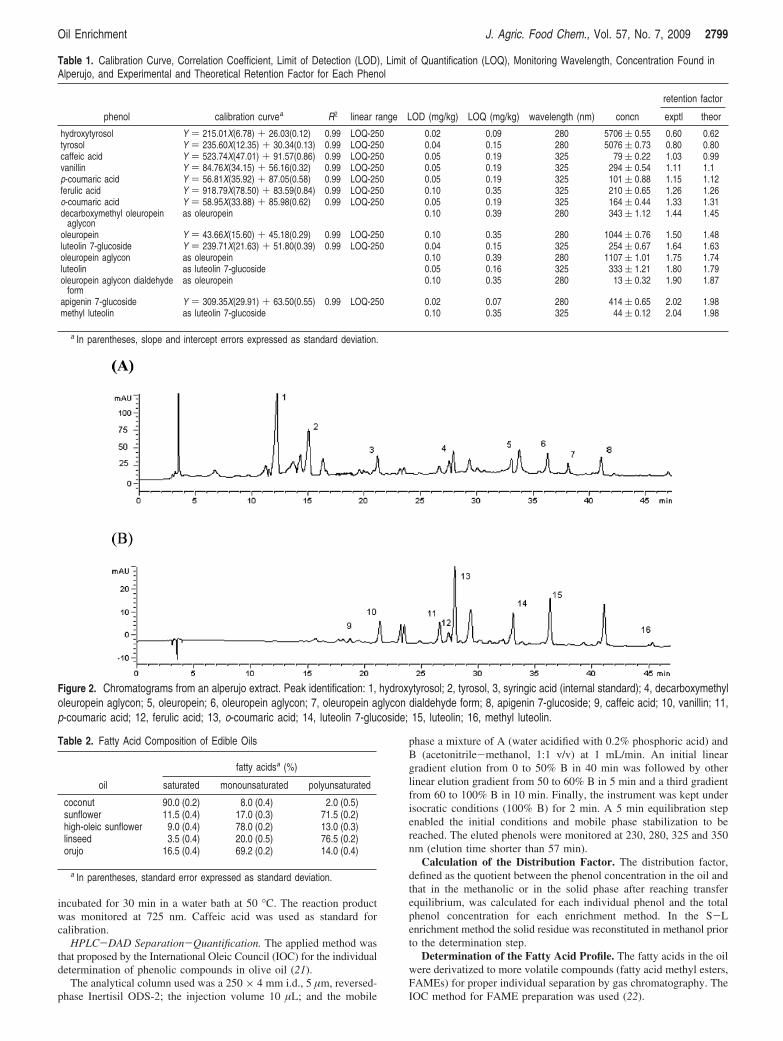
Table 1. Calibration Curve, Correlation Coefficient, Limit of Detection (LOD), Limit of Quantification (LOQ), Monitoring Wavelength, Concentration Found inAlperujo, and Experimental and Theoretical Retention Factor for Each Phenol
retention factor
phenol calibration curvea R2 linear range LOD (mg/kg) LOQ (mg/kg) wavelength (nm) concn exptl theor
hydroxytyrosol Y ) 215.01X(6.78) + 26.03(0.12) 0.99 LOQ-250 0.02 0.09 280 5706 ( 0.55 0.60 0.62tyrosol Y ) 235.60X(12.35) + 30.34(0.13) 0.99 LOQ-250 0.04 0.15 280 5076 ( 0.73 0.80 0.80caffeic acid Y ) 523.74X(47.01) + 91.57(0.86) 0.99 LOQ-250 0.05 0.19 325 79 ( 0.22 1.03 0.99vanillin Y ) 84.76X(34.15) + 56.16(0.32) 0.99 LOQ-250 0.05 0.19 325 294 ( 0.54 1.11 1.1p-coumaric acid Y ) 56.81X(35.92) + 87.05(0.58) 0.99 LOQ-250 0.05 0.19 325 101 ( 0.88 1.15 1.12ferulic acid Y ) 918.79X(78.50) + 83.59(0.84) 0.99 LOQ-250 0.10 0.35 325 210 ( 0.65 1.26 1.26o-coumaric acid Y ) 58.95X(33.88) + 85.98(0.62) 0.99 LOQ-250 0.05 0.19 325 164 ( 0.44 1.33 1.31decarboxymethyl oleuropein
aglyconas oleuropein 0.10 0.39 280 343 ( 1.12 1.44 1.45
oleuropein Y ) 43.66X(15.60) + 45.18(0.29) 0.99 LOQ-250 0.10 0.35 280 1044 ( 0.76 1.50 1.48luteolin 7-glucoside Y ) 239.71X(21.63) + 51.80(0.39) 0.99 LOQ-250 0.04 0.15 325 254 ( 0.67 1.64 1.63oleuropein aglycon as oleuropein 0.10 0.39 280 1107 ( 1.01 1.75 1.74luteolin as luteolin 7-glucoside 0.05 0.16 325 333 ( 1.21 1.80 1.79oleuropein aglycon dialdehyde
formas oleuropein 0.10 0.35 280 13 ( 0.32 1.90 1.87
apigenin 7-glucoside Y ) 309.35X(29.91) + 63.50(0.55) 0.99 LOQ-250 0.02 0.07 280 414 ( 0.65 2.02 1.98methyl luteolin as luteolin 7-glucoside 0.10 0.35 325 44 ( 0.12 2.04 1.98
a In parentheses, slope and intercept errors expressed as standard deviation.
Figure 2. Chromatograms from an alperujo extract. Peak identification: 1, hydroxytyrosol; 2, tyrosol, 3, syringic acid (internal standard); 4, decarboxymethyloleuropein aglycon; 5, oleuropein; 6, oleuropein aglycon; 7, oleuropein aglycon dialdehyde form; 8, apigenin 7-glucoside; 9, caffeic acid; 10, vanillin; 11,p-coumaric acid; 12, ferulic acid; 13, o-coumaric acid; 14, luteolin 7-glucoside; 15, luteolin; 16, methyl luteolin.
Table 2. Fatty Acid Composition of Edible Oils
fatty acidsa (%)
oil saturated monounsaturated polyunsaturated
coconut 90.0 (0.2) 8.0 (0.4) 2.0 (0.5)sunflower 11.5 (0.4) 17.0 (0.3) 71.5 (0.2)high-oleic sunflower 9.0 (0.4) 78.0 (0.2) 13.0 (0.3)linseed 3.5 (0.4) 20.0 (0.5) 76.5 (0.2)orujo 16.5 (0.4) 69.2 (0.2) 14.0 (0.4)
a In parentheses, standard error expressed as standard deviation.
Oil Enrichment J. Agric. Food Chem., Vol. 57, No. 7, 2009 2799
The individual separation of FAMEs was carried out by GC, andthen they were detected and quantified by MS using the GC-MSmethod developed by Sanchez-Avila et al. (personal communication).Briefly, the injection volume was 10 µL and the temperature programof the injector was as follows: started at 70 °C, held for 0.5 min,increased at 100 °C/min to 250 °C, and then kept for 78 min. Theinjection was in split-splitless mode. The splitter was opened (100:1)for 0.5 min, closed for 3.5 min and then opened at a 100:1 split ratiofor 10 min.
The samples were analyzed using the following oven temperatureprogram: initial temperature 70 °C (held for 1.2 min), increased at 25°C/min to 120 °C and followed by a second gradient of 2 °C/min to243 °C and, finally, increased by 40 °C/min to 270 °C and held at thistemperature for 5 min.
The mass spectrometer was operated in the EI mode, and the ionpreparation mode was µ_Selected Ion Storage (µ_SIS, similar toSelected Ion Monitoring). The manifold, trap, and transfer linetemperatures were set at 60, 170 and 200 °C, respectively.
Chemometric Analysis. The potential influential variables on theenrichment procedure were studied by a multivariate approach.Furthermore, a study, based on multiple single regressions, wasdeveloped in order to find relationships between the main fatty acidfamilies (saturated, monounsaturated and polyunsaturated fatty acids)expressed as percentage and used as variables; and the partitioncoefficient of each phenol used as response. Multiple parameters suchas p-value, R-square statistic or standard error of estimate werecalculated in order to study the characteristics of the relationship.Statgraphics Centurion XV was used as statistical software in all thecases.
RESULTS AND DISCUSSION
Optimization of the Procedure for Extraction of Phenolsfrom Alperujo. It is well-known that microwaves, workingunder optimal conditions, accelerate the extraction of phenolswithout degradation of the target compounds (23). The extractionprocess is economic due to the fact that the sample is a wasteresulting from the oil industry and ethanol used as extractant istotally recovered and reused after concentration of extract.
The influence of three inter-related variables on the extractionstep (i.e., irradiation power, irradiation time and extractantcomposition) was studied using a multivariate approach. Theresponse variable was the total phenol concentration obtainedby the Folin-Ciocalteu method.
A full two-level factorial design allowing four degrees offreedom and involving 11 randomized runs including threecenter points was built for a screening study of the behavior ofthe three variables influencing the extraction process. The upperand lower values given to each variable were selected from theavailable data and experience gathered in the preliminaryexperiments (23).
The results of this screening study were that the extractantcomposition was not a statistically influential factor within theranges under study, so pure ethanol was selected for subsequentexperiments as it is easier to remove, as required in thesubsequent enrichment process, than ethanol-water mixtures.Concerning the irradiation power, the results indicated that thisvariable should be increased. Taking into account that themaximum allowable irradiation power of the microwave device(400 W) was included in the screening study, this value wasfixed for subsequent experiments.
A kinetics study was developed to determine the timenecessary for maximum removal of phenolic compounds fromalperujo, which was obtained after irradiation for 10 min, thetime selected for further experiments. The extracts obtained withlonger times provided similar results with no detectabledegradation, as can be seen in Figure 1.
Characterization of the Individual Separation-DetectionMethod. The method used for the individual separation-detectionof phenols was that of the International Oleic Council. Identi-fication of hydroxytyrosol, tyrosol, oleuropein, apigenin 7-glu-coside, caffeic acid, vanillin, p-coumaric acid, ferulic acid,o-coumaric acid and luteolin 7-glycoside was based on com-parison of the retention times and the UV/vis spectra obtainedfor a standard solution. On the other hand, as there are notcommercial standards available for decarboxymethyl oleuropeinaglycon, oleuropein aglycon, oleuropein aglycon (dialdehydeform), luteolin and methyl luteolin, these compounds wereidentified by comparing the retention factors and the UV/visspectra with those provided in the literature. The wavelengthof maximum absorbance and the experimental retention factorsare shown for each analyte in Table 1. The alperujo extractprovided the chromatogram shown in Figure 2.
Calibration plots were run for the ten analytes for whichcommercial standards were available using the peak area as afunction of the standard concentration of each compound. Thecalibration equations, the regression coefficients and the lineardynamic ranges are listed in Table 1. Compounds with nocommercial standards were quantified by the calibration curveof the most similar phenol (Table 1). Syringic acid was usedas internal standard.
The limit of detection (LOD) for each analyte was expressed asthe concentration of analyte which gives a signal 3σ above themean blank signal (where σ is the standard deviation of the blanksignal). The LODs are between 0.02 and 0.10 µg/mL for all the
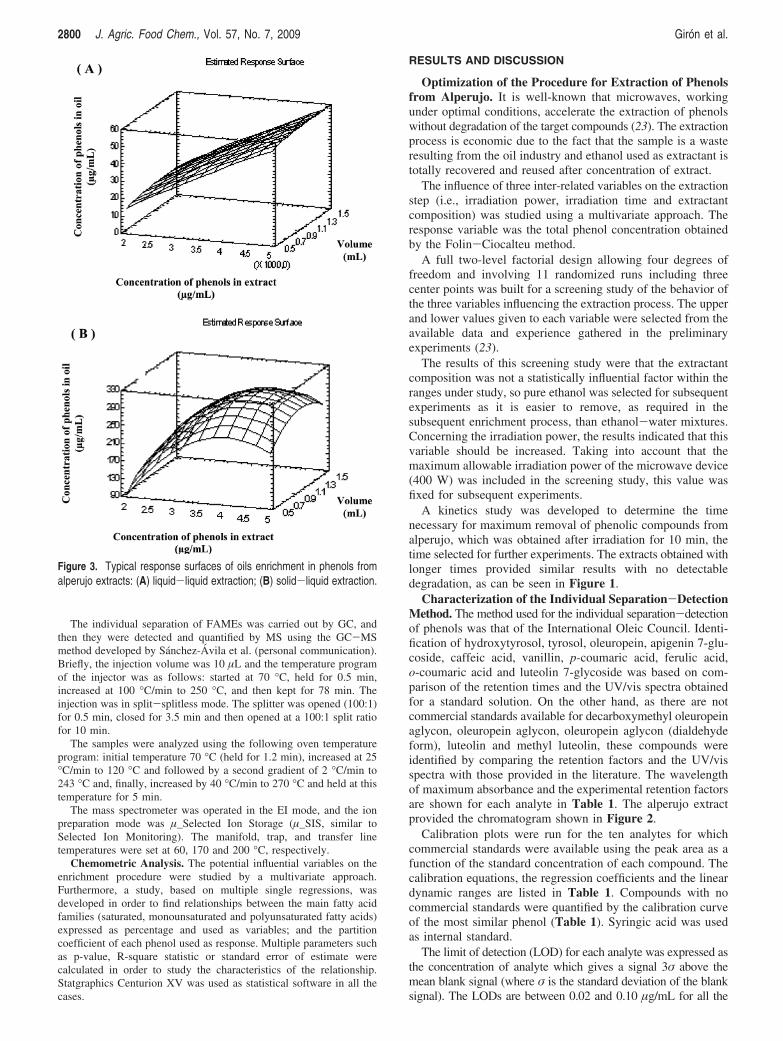
Figure 3. Typical response surfaces of oils enrichment in phenols fromalperujo extracts: (A) liquid-liquid extraction; (B) solid-liquid extraction.
2800 J. Agric. Food Chem., Vol. 57, No. 7, 2009 Giron et al.
analytes. The limits of quantification (LOQs), expressed as theconcentrations of analytes which gave a signal 10σ the mean blanksignal, are 0.09 and 0.39 µg/mL for all the analytes under study(Table 1). Both limits were calculated from alperujo extracts.
Characterization of the Phenolic Extract. In order to fitthe signals within the linear range of the calibration curves, theextract was diluted 50 times with 80:20 ethanol-water solutionprior to injection in the chromatograph. The concentrationsobtained for each individual phenol and precision of the method,calculated by the analysis of five replicates, are shown in Table1. The target analytes can be divided into three groups as afunction of their concentration. The first, hydroxytyrosol, tyrosol,oleuropein and oleuropein aglycon, includes those compoundsfound at concentrations higher than 1000 µg/mL. The secondgroup, decarboxymethyl oleuropein aglycon, oleuropein aglycon(dialdehyde form), apigenin 7-glucoside, luteolin, vanillin andluteolin 7-glucoside, includes phenols with concentration closeto 300 µg/mL. Finally, the third group is formed by simplephenols as caffeic acid, o-coumaric, p-coumaric and ferulic acidsat concentrations lower than 200 mg/L. A chromatogram ofalperujo extract is shown in Figure 2.
Characterization of Edible Oils. The extraction and individualseparation-quantification method was used for the analysis of thephenolic compounds in the different oils prior to the enrichmentprocess. The results showed that the concentration for thesecompounds in all the studied oils was under the LOD.
The fatty acid profile was determined by the proceduredescribed in Materials and Methods. The percentage of saturated,monounsaturated and polyunsaturated fatty acids (Table 2) wascalculated from the results obtained by this analysis.
Optimization of the Enrichment Procedures. The influenceof two variables (i.e., extract volume and extract concentration)on both enrichment procedures was studied using a multivariateapproach. The response variable used in these studies was theconcentration of each phenol as obtained by the HPLC method.
A central composite design 22 + star, characterized by anaxial distance of 1.41 (orthogonal) allowing four degrees offreedom and involving 12 randomized runs including two centerpoints, was built to study the behavior of the two variablesinfluencing the enrichment processes. The values of the fixedexperimental variables (i.e., enrichment time and ethanolic phasecomposition) and upper and lower values given to each variableunder study were selected from the available data and experiencegathered in the preliminary experiments.
The typical response surfaces obtained for both enrichmentprocedures are shown in Figure 3, which shows that for theS-L procedure the transference of phenols from the solid phaseto the oil is a function of both variables, extract volume andconcentration. The minimum value of each variable to obtainthe highest enrichment for each phenol is shown in Table 3.
In the L-L procedure the mass transference from theethanolic to the oily phase is exclusively dependent on thephenol concentration. In this case, the maximum enrichment isnot achieved within the studied range; so higher enrichmentscan be achieved, if required.
Distribution of the Phenolic Compounds after Applicationof the Enrichment Procedures. The partition coefficient wascalculated for each phenol and enrichment procedure asdescribed in Materials and Methods. All the experiments werein triplicate. The experimental error, expressed as relative
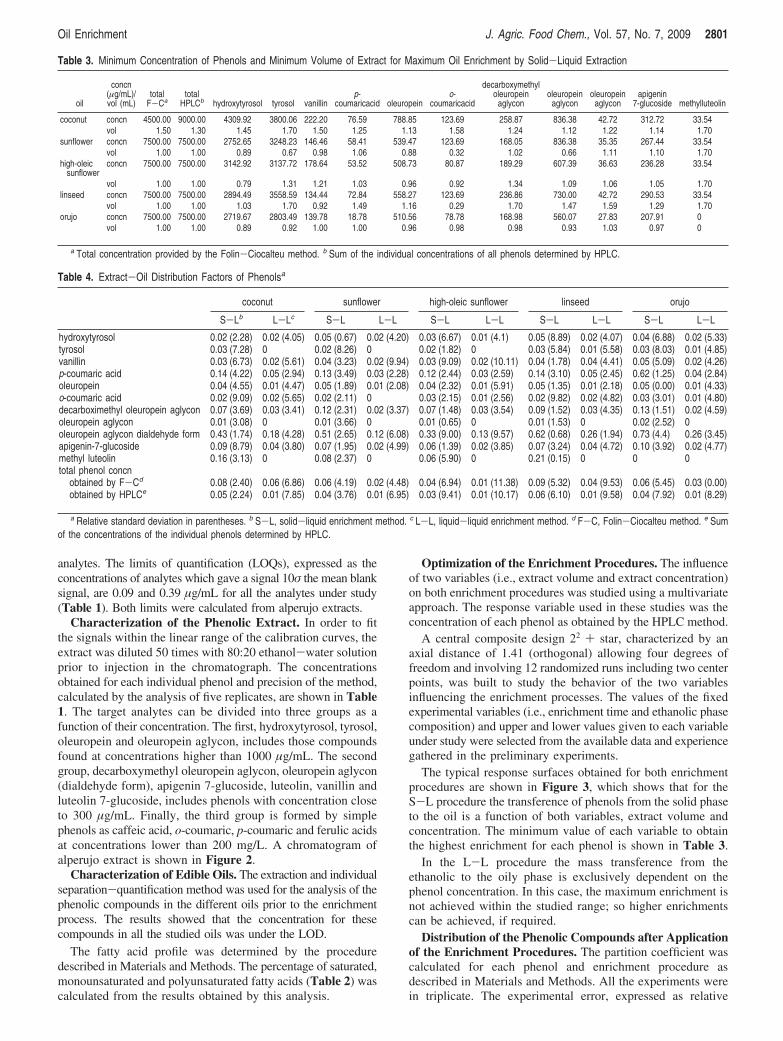
Table 3. Minimum Concentration of Phenols and Minimum Volume of Extract for Maximum Oil Enrichment by Solid-Liquid Extraction
oil
concn(µg/mL)/vol (mL)
totalF-Ca
totalHPLCb hydroxytyrosol tyrosol vanillin
p-coumaricacid oleuropein
o-coumaricacid
decarboxymethyloleuropein
aglyconoleuropein
aglyconoleuropein
aglyconapigenin
7-glucoside methylluteolin
coconut concn 4500.00 9000.00 4309.92 3800.06 222.20 76.59 788.85 123.69 258.87 836.38 42.72 312.72 33.54vol 1.50 1.30 1.45 1.70 1.50 1.25 1.13 1.58 1.24 1.12 1.22 1.14 1.70
sunflower concn 7500.00 7500.00 2752.65 3248.23 146.46 58.41 539.47 123.69 168.05 836.38 35.35 267.44 33.54vol 1.00 1.00 0.89 0.67 0.98 1.06 0.88 0.32 1.02 0.66 1.11 1.10 1.70
high-oleicsunflower
concn 7500.00 7500.00 3142.92 3137.72 178.64 53.52 508.73 80.87 189.29 607.39 36.63 236.28 33.54
vol 1.00 1.00 0.79 1.31 1.21 1.03 0.96 0.92 1.34 1.09 1.06 1.05 1.70linseed concn 7500.00 7500.00 2894.49 3558.59 134.44 72.84 558.27 123.69 236.86 730.00 42.72 290.53 33.54
vol 1.00 1.00 1.03 1.70 0.92 1.49 1.16 0.29 1.70 1.47 1.59 1.29 1.70orujo concn 7500.00 7500.00 2719.67 2803.49 139.78 18.78 510.56 78.78 168.98 560.07 27.83 207.91 0
vol 1.00 1.00 0.89 0.92 1.00 1.00 0.96 0.98 0.98 0.93 1.03 0.97 0
a Total concentration provided by the Folin-Ciocalteu method. b Sum of the individual concentrations of all phenols determined by HPLC.
Table 4. Extract-Oil Distribution Factors of Phenolsa
coconut sunflower high-oleic sunflower linseed orujo
S-Lb L-Lc S-L L-L S-L L-L S-L L-L S-L L-L
hydroxytyrosol 0.02 (2.28) 0.02 (4.05) 0.05 (0.67) 0.02 (4.20) 0.03 (6.67) 0.01 (4.1) 0.05 (8.89) 0.02 (4.07) 0.04 (6.88) 0.02 (5.33)tyrosol 0.03 (7.28) 0 0.02 (8.26) 0 0.02 (1.82) 0 0.03 (5.84) 0.01 (5.58) 0.03 (8.03) 0.01 (4.85)vanillin 0.03 (6.73) 0.02 (5.61) 0.04 (3.23) 0.02 (9.94) 0.03 (9.09) 0.02 (10.11) 0.04 (1.78) 0.04 (4.41) 0.05 (5.09) 0.02 (4.26)p-coumaric acid 0.14 (4.22) 0.05 (2.94) 0.13 (3.49) 0.03 (2.28) 0.12 (2.44) 0.03 (2.59) 0.14 (3.10) 0.05 (2.45) 0.62 (1.25) 0.04 (2.84)oleuropein 0.04 (4.55) 0.01 (4.47) 0.05 (1.89) 0.01 (2.08) 0.04 (2.32) 0.01 (5.91) 0.05 (1.35) 0.01 (2.18) 0.05 (0.00) 0.01 (4.33)o-coumaric acid 0.02 (9.09) 0.02 (5.65) 0.02 (2.11) 0 0.03 (2.15) 0.01 (2.56) 0.02 (9.82) 0.02 (4.82) 0.03 (3.01) 0.01 (4.80)decarboximethyl oleuropein aglycon 0.07 (3.69) 0.03 (3.41) 0.12 (2.31) 0.02 (3.37) 0.07 (1.48) 0.03 (3.54) 0.09 (1.52) 0.03 (4.35) 0.13 (1.51) 0.02 (4.59)oleuropein aglycon 0.01 (3.08) 0 0.01 (3.66) 0 0.01 (0.65) 0 0.01 (1.53) 0 0.02 (2.52) 0oleuropein aglycon dialdehyde form 0.43 (1.74) 0.18 (4.28) 0.51 (2.65) 0.12 (6.08) 0.33 (9.00) 0.13 (9.57) 0.62 (0.68) 0.26 (1.94) 0.73 (4.4) 0.26 (3.45)apigenin-7-glucoside 0.09 (8.79) 0.04 (3.80) 0.07 (1.95) 0.02 (4.99) 0.06 (1.39) 0.02 (3.85) 0.07 (3.24) 0.04 (4.72) 0.10 (3.92) 0.02 (4.77)methyl luteolin 0.16 (3.13) 0 0.08 (2.37) 0 0.06 (5.90) 0 0.21 (0.15) 0 0 0total phenol concn
obtained by F-Cd 0.08 (2.40) 0.06 (6.86) 0.06 (4.19) 0.02 (4.48) 0.04 (6.94) 0.01 (11.38) 0.09 (5.32) 0.04 (9.53) 0.06 (5.45) 0.03 (0.00)obtained by HPLCe 0.05 (2.24) 0.01 (7.85) 0.04 (3.76) 0.01 (6.95) 0.03 (9.41) 0.01 (10.17) 0.06 (6.10) 0.01 (9.58) 0.04 (7.92) 0.01 (8.29)
a Relative standard deviation in parentheses. b S-L, solid-liquid enrichment method. c L-L, liquid-liquid enrichment method. d F-C, Folin-Ciocalteu method. e Sumof the concentrations of the individual phenols determined by HPLC.
Oil Enrichment J. Agric. Food Chem., Vol. 57, No. 7, 2009 2801
standard deviation, ranged between 0.15 and 11.67. As can beseen in Table 4, the S-L procedure provides better results(between 2 and 17 times higher) than the L-L procedure interms of partition coefficient.
The phenols can be ordered as a function of their distributionfactors as follows: oleuropein aglycon < tyrosol < o-coumaricacid < hydroxytyrosol ∼ vanillin < oleuropein < apigenin7-glucoside < decarboxy oleuropein aglycon < methyl luteolin< p-coumaric acid < oleuropein aglycon (dialdehyde form). Thisorder was the same for all the studied oils, and it is a functionof the polarity and molecular weight of the transferred phenolswith the exception of oleuropein aglycon and p-coumaric acid,which have lower and higher partition coefficients, respectively,than expected. High-polarity and low-molecular-weight phenolshave lower distribution factors than middle- or low-polarity andhigh-molecular-weight phenols.
Relationship between Fatty Acid Composition and Dis-tribution of Phenolic Compounds. As can be seen in Table4, the distribution factors obtained were similar for oils withsimilar fatty acid composition.
The study of the relationship between the saturated fatty acidsand the partition coefficient shows that this parameter decreaseswith increasing concentration of these fatty acids. Since thecalculated p-value (0.14) is equal to or higher than 0.05, thereis not a statistically significant relationship between these acidsand their partition coefficient. The R-square statistic indicatesthat the proposed model explains 75% of the variability. Thestandard error of the estimate shows that the standard deviationof the residuals is 0.010.
In the case of the monounsaturated fatty acids their presencein the oil increases the distribution factor. As the calculatedp-value (0.03) is lower than 0.05, a significant relationshipbetween both variables can be established. The proposed modelexplains 90% of the variance. The standard deviation of theresidual is 0.006.
Finally, the results obtained for polyunsaturated fatty acidswere similar to those obtained for monounsaturated, the maindifference between both models being that the calculated p-valuefor this variable (0.21) is higher than 0.05; and therefore, thereis not a significant relationship between polyunsaturated fattyacids and partition coefficient. The explained variance washigher than 80%, and the standard deviation of the residual is0.009.
This research shows that all phenols under study behavesimilarly in their transfer to a given oil; and the presence ofmono- and polyunsaturated fatty acids in the oil increases thedistribution factor. This factor decreases with increasing con-centration of saturated fatty acids.
LITERATURE CITED
(1) Saura-Calixto, F.; Goni, I. Antioxidant capacity of the SpanishMediterranean diet. Food Chem. 2006, 94, 442–447.
(2) Garcıa-Gonzalez, D. L.; Aparicio-Ruiz, R. Virgin olive oil-chemical implications on quality and health. Eur. J. Lipid Sci.Technol. 2008, 110, 602–607.
(3) Bendini, A.; Cerretani, L.; Carrasco-Pancorbo, A.; Gomez-Caravaca, A. M.; Segura-Carretero, A.; Fernandez-Gutierrez, A.;Lercker, G. Phenolic molecules in virgin olive oils:a survey oftheir sensory properties, health effects, antioxidant activity andanalytical methods.An overview of the last decade. Molecules2007, 12, 1679–1719.
(4) Tuck, K. L.; Hayball, P. J. Major phenolic compounds in oliveoil: metabolism and health effects. J. Nutr. Biochem. 2002, 13,636–644.
(5) Patil, S. C.; Singh, V. P.; Satyanarayan, P. S. V.; Jain, N. K.;Singh, A.; Kulkarni, S. K. Protective effect of flavonoids againstaging and lipopolysaccharide induced cognitive impairment inmice. Pharmacology 2003, 69, 59–67.
(6) Zheng, Q. S.; Sun, X. L.; Xu, B.; Li, G.; Song, M. Mechanism ofapigenin-7-glucoside as a hepatoprotective agent. Biomed. EnVi-ron. Sci. 2005, 18, 65–70. Visioli, F.; Bellomo, G.; Galli, C. Freeradical-scavenging properties of olive oil polyphenols. Biochem.Biophys. Res. Commun. 1998, 247, 60–64.
(7) Fabiani, R.; De Bartolomeo, A.; Rosignoli, P.; Servili, M.;Montedoro, G. F.; Morozzi, G. Cancer chemoprevention byhydroxytyrosol isolated from virgin olive oil through G1 cell cyclearrest and apoptosis. Eur. J. Cancer PreV. 2002, 11, 351–358.
(8) Tim, T. J.; Kim, J. H.; Jin, Y. R.; Yun, Y. P. The inhibitory effectand mechanism of luteolin 7-glucoside on rat aortic vascularsmooth muscle cell proliferation. Arch. Pharmacol. Res. 2006,29, 67–72.
(9) Luque de Castro, M. D.; Japon-Lujan, R. State of the art and trendsin the analysis of oleuropein and derivatives. Trends Anal. Chem.2006, 25, 501–510.
(10) Fernandez-Pachon, M.S:; Villano, D.; Troncoso, A. M.; Garcıa-Parrilla, M. C. Determination of the phenolic composition ofsherry and table wines by liquid chromatography and their relationwith antioxidant activity. Anal. Chim. Acta 2006, 503, 101–108.
(11) Rass, M.; Schein, C.; Matthaus, B. Virgin sunflower oil. Eur. J.Lipid Sci. Technol. 2008, 110, 619–624.
(12) Salta, F. N.; Chiou, A.; Boskou, G.; Andrikopoulos, N. K.Oxidative stability of edible oils enriched in polyphenols witholive leaf extract. J. Food Sci. Technol. Int. 2007, 42, 413–421.
(13) Kalantzakis, G.; Blekas, G. Effect of Greek sage and summersavory extracts on vegetable oil thermal stability. Eur. J. LipidSci. Technol. 2006, 108, 842–847.
(14) Benavente-Garcia, O.; Castillo, J.; Lorente, J.; Ortuno, A.; DelRio, J. A. Antioxidant activity of phenolics extracted from Oleaeuropaea. J. Food Chem. 2000, 68, 457–462.
(15) Lesage-Meessen, L.; Navarro, D.; Maunier, S.; Sigoillot, J. C.;Lorquin, J.; Delattre, M.; Simon, J. L.; Asther, M.; Labat, M.Simple phenolic content in olive oil residues as a function ofextraction systems. Food Chem. 2001, 75, 501–507.
(16) Priego-Capote, F.; Ruiz-Jimenez, J.; Luque de Castro, M. D. Fastseparation and determination of phenolic compounds by capillaryelectrophoresis-diode array detection. Application to the charac-terisation of alperujo after ultrasound assisted extraction. J. Chro-matogr. A 2004, 1045, 239–246.
(17) Rohm and Haas Company. Amberlite XAD 16. Application noteIE-543 EDS. 2003.
(18) Japon-Lujan, R.; Luque de Castro, M. D. Liquid-liquid extractionfor the enrichment of edible oils with biophenols from olive leafextracts. J. Agric. Food Chem. 2008, 56, 2505–2511.
(19) Japon-Lujan, R.; Janeiro, P.; Luque de Castro, M. D. Solid-liquidtransfer of biophenols from olive leaves for the enrichment ofedible oils by a dynamic ultrasound-assisted approach. J. Agric.Food Chem. 2008, 56, 7231–7235.
(20) Gutfinger, T. Polyphenols in olive oils. J. Am. Oil Chem. Soc.1981, 58, 966–968.
(21) Identification and determination of phenolic compounds in oliveoil. International Olive Council. Resolution RES-4/94-/VO6.
(22) Identification and determination of fatty acids compounds in oliveoil. International Olive Council.
(23) Japon-Lujan, R.; Luque-Rodrıguez, J. M.; Luque de Castro, M. D.Multivariate optimisation of microwave assisted extraction ofoleuropein and related biophenols from olive leaves. Anal.Bioanal. Chem. 2006, 385, 753–766.
Received for review November 4, 2008. Revised manuscript receivedFebruary 3, 2009. Accepted February 3, 2009. The Spanish Ministeriode Educacion y Ciencia is gratefully acknowledged for financial support(project No. CTQ 2006-01614). J.R.-J. is also grateful to FundacionNunez de Prado for financial support.
JF803455F
2802 J. Agric. Food Chem., Vol. 57, No. 7, 2009 Giron et al.