Embed Size (px)
Citation preview

l--. ... \a)
I. .-' J .>
~ \.. . ~ _,.
'z_
l
-..._ ~
UNITED STATES DEPARTMENT OF THE INTERIOR
BUREAU OF RECLAMATION
HYDRAULIC MODEL STUDIES OF MORROW POINT DAM SPILLWAY, OUTLET WORKS, AND POWERPLANT
TAILRACE COLORADO RIVER STORAGE PROJECT
CURECANTI UNIT, COLORADO
Report No. Hyd -55 7
Hydraulics Branch DIVISION OF RESEARCH
OFFICE OF CHIEF ENGINEER DENVER, COLORADO
April 1, 1966

The information contained in this report may not be used in any publication., advertising., or other promotion in such a manner as to constitute an endorsement by the United States Government or the Bureau of Reclamation., either explicit or implicit. of any material. product. device. or process that may be referred to in the report.

MORROW POINT DAM & POWER PLANT COLORADO RIVER STORAGE PROJECT
Abstract •. Purpose Summary of Results
CONTENTS
General Comments on Spillway Operation Acknowledgment ... Introduction
The Model ..... . The Investigation
The Preliminary Design ..........•.. The Alternate Design .............. . Spillway Conduit Bellmouth Entrances Revision of the Model to Include
Additional Details Development of Details of the Recommended
Design
Stilling basin topography ..•......... Test discharges ................... . Impact pressures on the stilling basin
floor and weir ............... . .................. Flow conditions in the powerplant
tailrac e ........................................... . Impact pressures (recommended
design) Riprap test ................... . Movement of rock in the stilling
basin .•. Reservoir flow conditions ....•... Spillway discharge capacity Miscellaneous observations
......
Appendix .•.••.•..........................................
Metric Equivalents of Important Quantities .................. .
Location Map ..... Plan and Elevation . Sections Spillways Outlet Works
i
iv 1 1 3 4 4
6 7
7 8 9
11
11
11 11
12
13
14 14
15 15 17 17
19
Table
1
Figure
1 2 3 4 5

CONTENTS- -Continued
Tailwater Curve . . . . . . . . . . . . . . . . . . . . . . . . . . . . . . . . . . . . . . . . . . . 6 Stilling. Basin Flow Conditions. Gates Tipped
15° Below Horizontal. Preliminary Design .•. ~ •.......•.... Stilling Basin Flow Conditions. Gates Tipped
15° Below Horizontal. Weir 100 Feet Downstream from Original Position ........•...............
Stilling Basin Flow Conditions. Gates Tipped 24° Below Horizontal .................................... .
Stilling Basin Flow Conditions with 24-foot-
7
8
9
wide Horizontal Baffle on Upstream Face of Weir . . . . . . . . . . . . . . . . . . . . . . . . .. . . . . . . . . . . . . . . . . . . . . . . . . 10
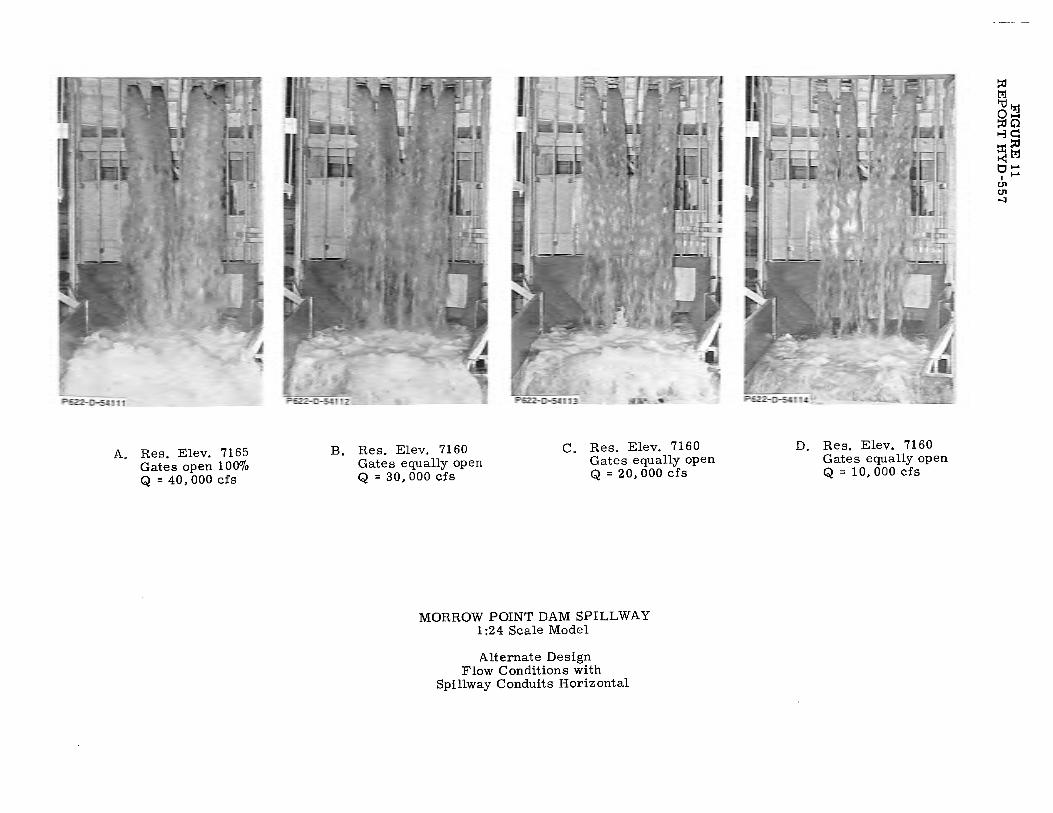
Alternate Design. Flow Conditions with Spillway Conduits Horizontal . . . . . . . . . . . . . . . . . . . . . . . . . . . . . . . . . . . . . . 11
Maximum Water Manometer Pressures on Weir and Stilling Basin Floor . . . . . . . . . . . . . . . . . . . . . . . . . . . . . . . . . . 12
Stilling Basin Flow Conditions for Operation of Inside or Outside Conduits Alone. Spillway Conduits Horizontal ....................... ·. . . . . . . . . . . . . . . 13
Stilling Basin Flow Conditions with Deflecting Hoods on Inside Conduits ........ ·. . . . . . . . . . . . . . . . . . . . . . . . . 14
Stilling Basin Flow Conditions with Inside Conduits Tipped 27° Downward . . . . . . . . . . . . . . . . . . . . . . . . . . . . 15
Maximum Instantaneous Pressures on Upstream Face of Weir. Inside Conduits Tipped 27° Downward . . . . • . . . . 16
Modifications to the Spillway Entrances.. . . . . . . . . . . . . . . . . . . . . 17 Water Manometer Pressures in Recommended
Bellmouth Entrances . . . . . . . . . . . . . . . . . . . . . . . . . . . . . . . . . . . . . 18 Stilling Basin and Tailrace Flow Conditions. Max
imum Spillway Discharge and 1/ 2 Maximum Discharge. Revised Alternate Design . . . . . . . . . . . . . . . . . . . . • . 19
Maximum Instantaneous Pressures on Upstream Face of Weir. Revised Alternate Design . . . . . . • . . . . . . . . . . . . . 20
Maximum Instantaneous Pressures on the Stilling Basin Floor. Revised Alternate Design . . . . . . . . . . . . . . . . . . . . . 21
Tailrace Topography Before and After Stream-lining . . . . . . . . . ........... ~ ..... --.... , . . . . . . . . . . . . . . . . . . . . . 2 2
Flow Constriction Immediately Downstream from Weir .............................................. . 23
Stilling Basin and Tailrace Flow Conditions with Excavated Right Channel Bank . . . . . . • . . . . . . . . . . . . . . . . . . . . . . 24
Stilling Basin and Tailrace Flow Conditions with Excavated Right Channel Bank .............. ·. . . . . . . . . . . . . . . 25
Stilling Basin and Tailrace Flow Conditions with Excavated Right Channel Bank . . . . . . . . . . . . . . . . . . . . . . . . . . . . . 26
Stilling Basin and Tailrace Flow Conditions with Excavated Right Channel Bank . . . . . . . . . . . . . . . . . . . . . . . . . . . . . 27
ii

CONTENTS- -Continued
Removal of Weir Piers and Extension of Stilling Pool Lining .................................... .
Tailrace Flow Conditions with Revised Weir Topography ............................................ .
Stilling Basin Flow Conditions with Revised Weir Topography ...................................... .
Flood Wall Tests ........................................ .
Maximum Instantaneous Pressures on the Upstream Face of the Weir, Recommended
Figure
28
29
30 31
Design .................................................. 32
Maximum Instantaneous Pressures on the Stilling Basin Floor, Recommended Design . . . . . . . . . . . . . . . . . . . . . . . . . . . . . . . . . . . . . . . . . . . . . . . . . 3 3
Frequency Distribution of Impact Pressures on Stilling Basin Floor and Weir . . . . . . . . . . . . . . . . . . . . . . . . . . 34
Movement of Material in Stilling Basin . . . . . . . . . . . . . . . . . . . . . 3 5
Movement of Material in Stilling Basin . . . . . . . . . . . . . . . . . . . . . 36
Reservoir Flow Patterns . . . . . . . . . . . . . . . . . . . . . . . . . . . . . . . . . . 37
Symmetrical Spillway Operation, Recommended Design ................................................. 38
Symmetrical Spillway Operation, Recommended Design ...... " . . . . . . . . . . . . . . . . . . . . . . . . . . . . . . . . . . . . . . . . . . 39
Operation of Outlet Works and Powerplant Tailrace ....... 0 ••••• a • II •••••••••••••••• •. 0 • • • • • • • • • • • • • 40
Symmetrical and Asymmetrical Spillway Operation, Recommended Design . . . . . . . . . . . . . . . . . . . . . . . . . 41
Asymmetrical Spillway Operation, Recommended De sign . . . . . . . . . . . . . . . . . . . . . . . . . . . . . . . . . . . . . . . . . . . . . . . . 4 2
Asymmetrical Spillway Operation, Recommended Design . . . . . .. . . . . . . . . . . . . . . . . . . . . . . . . . . . . . . . . . . . . . . . . . . 43
Asymmetrical Spillway Operation, Recommended De sign . . . . . . . . . . . . . . . . . . . . . . . . . . . . . . . . . . . . . . . . . . . . . . . . 44
iii

ABSTRACT
The preliminary design of an overflow spillway at the crest of the dam and a slide-gate-controlled outlet works near the dam base was abandoned because of undesirable flow conditions in the stilling basin resulting from high velocity efflux from the outlet works. An alternate design, consisting of four fixed-wheel gate-controlled outlets near the dam crest and a small outlet works near the base, was recommended following several modifications. A 1 :24 scale model was used in developing the design of the spillway and to determine the hydraulic operating characteristics of the recommended freefall orifice-type spillway, slide-gate controlled outlet works, and tailrace channels of the underground powerplant. Comprehensive data were obtained concerning pressure distribution in the spillway conduits and bellmouth entrances, on the stilling basin floor, and on the stilling basin weir. Minor modifications were made to the topography in the tailrace area to improve flow conditions during large spillway discharges. The stability of riprap protection was determined, and tests were made concerning movement of material in the stilling pool. Operating characteristics of all features of the recommended design were observed.
DESCRIPTORS- - ,:carch dams/ ,:cspillways / >:-<outlet works/ ,:cfree fall/ ,:cmodel. tests/ hydraulic models/ manometers/ orifices/ tailrace / water pressures/ weirs/ instrumentation/ piezometers/ pressure measuring equip/ discharges/ underground powerplants/ fixed wheel gates/ slide gates/ impact/ energy dissipation/ riprap/ research and development IDENTIFIERS-- *bellmouths/ Morrow Point Dam, Colorado/ Curecanti Unit, Colorado/ Colorado River Storage Project/ Colorado
iv

UNITED STATES DEPARTMENT OF THE INTERIOR
BUREAU OF RECLAMATION
Office of Chief Engineer Division of Research Hydraulics Branch Denver, Colorado
Report No. Author:
Hyd-557
Checked by: Reviewed by:
April 1, 1966 Submitted by:
HYDRAULIC MODEL STUDI'ES OF
D. L. King T. J. Rhone W. E. Wagner H. M. Martin
MORROW POINT DAM SPILLWAY, OUTLET WORKS, AND POWERPLANT TAILRACE
COLORADO RIVER STORAGE PROJECT CURECANTI UNIT, COLORADO
PURPOSE
The purpose of the model studies was to assist in developing the design of the spillway and to determine the hydraulic operating characteristics of the recommended spillway, outlet works, and powerplant tailrace.
SUMMARY OF RESULTS
1. The preliminary design of the outlet works, consisting of two highhead slide-gate-controlled conduits near the bottom of the dam, caused
undesirable stilling basin flow conditions, Figures 7 through 10, and was abandoned.
2. The alternate (recommended) design consisted of four fixed-wheel gate-controlled spillway outlets located about 35 feet below the top of
the dam, Figure 4, and a small slide-gate-controlled outlet works near the base of the dam, Figure 5.
3. To improve the hydraulic performance of the stilling basin at the base of the dam, the two inside spillway conduits were tipped 27° downward. The bellmouth entrances to the spillway conduits were revised to be compatible with the geometry of the conduits.
4. The shape and location of the weir were modified and the stilling basin size and shape were changed slightly to improve the energy dissipating efficiency and flow appearance of the stilling pool.
5. Extensive data concerning pressures in the bellmouth entrances and spillway conduits, on the stilling basin floor, and on the weir were ob
tained. Pressures in the bellmouths and conduits were slightly subatmospheric (8 feet of water) with the control gates 100 percent open, Figure 18. With the gates closed approximately 1 percent, all pres
sures were above atmospheric.

6. Pressures observed on the upstream face of the weir reflected the deviation from hydrostatic due to impact, Figure 32, and were used in the structural design of the weir. Pressures on the downstream face of the weir were steady and nearly hydrostatic.
7. The magnitude of impact pressures on the stilling basin floor varied with the discharge and the pattern of gate operation. The maximum impact head wa~ about 200 feet of water for the maximum spillway discharge, Figure 33.
8. The discharge capacity of the spillway was measured as 40, 000 cfs at maximum reservoir elevation (7165) with all four gates 100 percent open; however, most tests were restricted to a spillway discharge of 34, 400 second-feet which is that required to accommodate the inflow design flood.
9. Portions of the powerplant tailrace channels and the river topography downstream from the weir were modified to improve flow conditions in those areas, particularly for the maximum discharge. The topography in the vicinity of the tailrace channels was strea:i;nlined to reduce eddies. The right river bank topography was excavated to provide some relief from a backwater effect due to a constriction in the channel. See Figures 22 through 30.
10. A floodwall on the left side of the tailraces was tested and recommended for use in the vicinity of the visitor's area to provide protection against wave action during large spillway discharges, Figure 31.
11. Minor vortex action occurred in the reservoir near the spillway entrances, particularly during large discharges, Figure 37. The observed vortices pulled small amounts of air into the conduits.
12. Undesirable surging was noted 'with the gates wide open and the reservoir lowered to near the top of the entrances. However, this is not an operating condition. The minimum submergence, measured from the top of the bellmouth entrances, will be about 10 feet for the inside conduits and about 1 7 feet for the outside conduits.
13. Extension or rounding of the corners of the vertical section on the upstream face of the dam which contains the bellmouth entrances had no effect on the bellmouth pressures.
14. Tests were made to determine the movement of rock material that may fall into the stilling basin from the cliffs on either side. It was concluded that for the maximum discharge, all material downstream from the point of impact of the jets would be swept out of the basin. For discharges less than maximum, material would be left to circulate in the basin, conceivably causing abrasive damage to the concrete lining.
2

Material remaining upstream from the point of impact should remain in an essentially stable position, with relatively little circulation as compared to that downstream from the impact point. Test results are shown in Figures 35 and 36.
15. Riprap protection immediately downstream from the weir was stable with the exception of movement of a small amount of material during the maximum discharge. It was also noted that some material was deposited near the downstream end of the right powerplant tailrace channel. The model indicated that the talus slope on the right side of the river channel might be subject to erosion damage.
GENERAL COMMENTS ON SPILLWAY OPERATION
Several comments on operation of the features are listed for consideration:
1. Surging in the tailrace channels may necessitate suspension of powerplant operation for spillway discharges at or near the design discharge.
2. Protection should be provided for the powerplant access tunnel to eliminate possible flooding during spillway discharges above approximately 26, 000 cfs.
3. Spray from the spillway discharge may have some effect on operation of the switchyard.
4. Strong vibrations were noted in the model during large spillway discharges.
5. Inspection of the stilling basin pool lining is desirable after spillway operation, because of the possibility of abrasion damage.
6. To avoid subatmospheric pressures in the conduits, the spillway gates should be opened not more than 99 percent.
7. The spillway gates should not be opened more than approximately 75 percent unless the bellmouth entrances are submerged at least 2 or 3 feet.
8. The best flow conditions and lowest impact pressures in the stilling basin occur for symmetrical operation of the spillway with equal discharges through each of the four conduits.
3
ACKNOWLEDGMENT
The model studies described in this repo-rt were accomplished primarily through cooperation between the Hydraulics Branch, Division of Research and the Concrete Dams Section, Dams Branch, Division of Design. Specific phases of the study were of direct concern to personnel of the Structural and Architectural Branch and the Mechanical Branch who made frequent visits to the laboratory and offered many helpful suggestions. Also, many foreign and domestic visitors observed the model throughout the course of the study. Photography was by W. M. Batts. Office Services Branch.
INTRODUCTION
Morrow Point Dam, located ofi the Gunnison River, 22 miles east of Montrose, Colorado, Figure 1, is one of the key features of the Curecanti Unit of the Colorado River Storage Project. The other features include Blue Mesa Dam, upstream from Morrow Point. and Crystal Dam, downstream from Morrow Point.
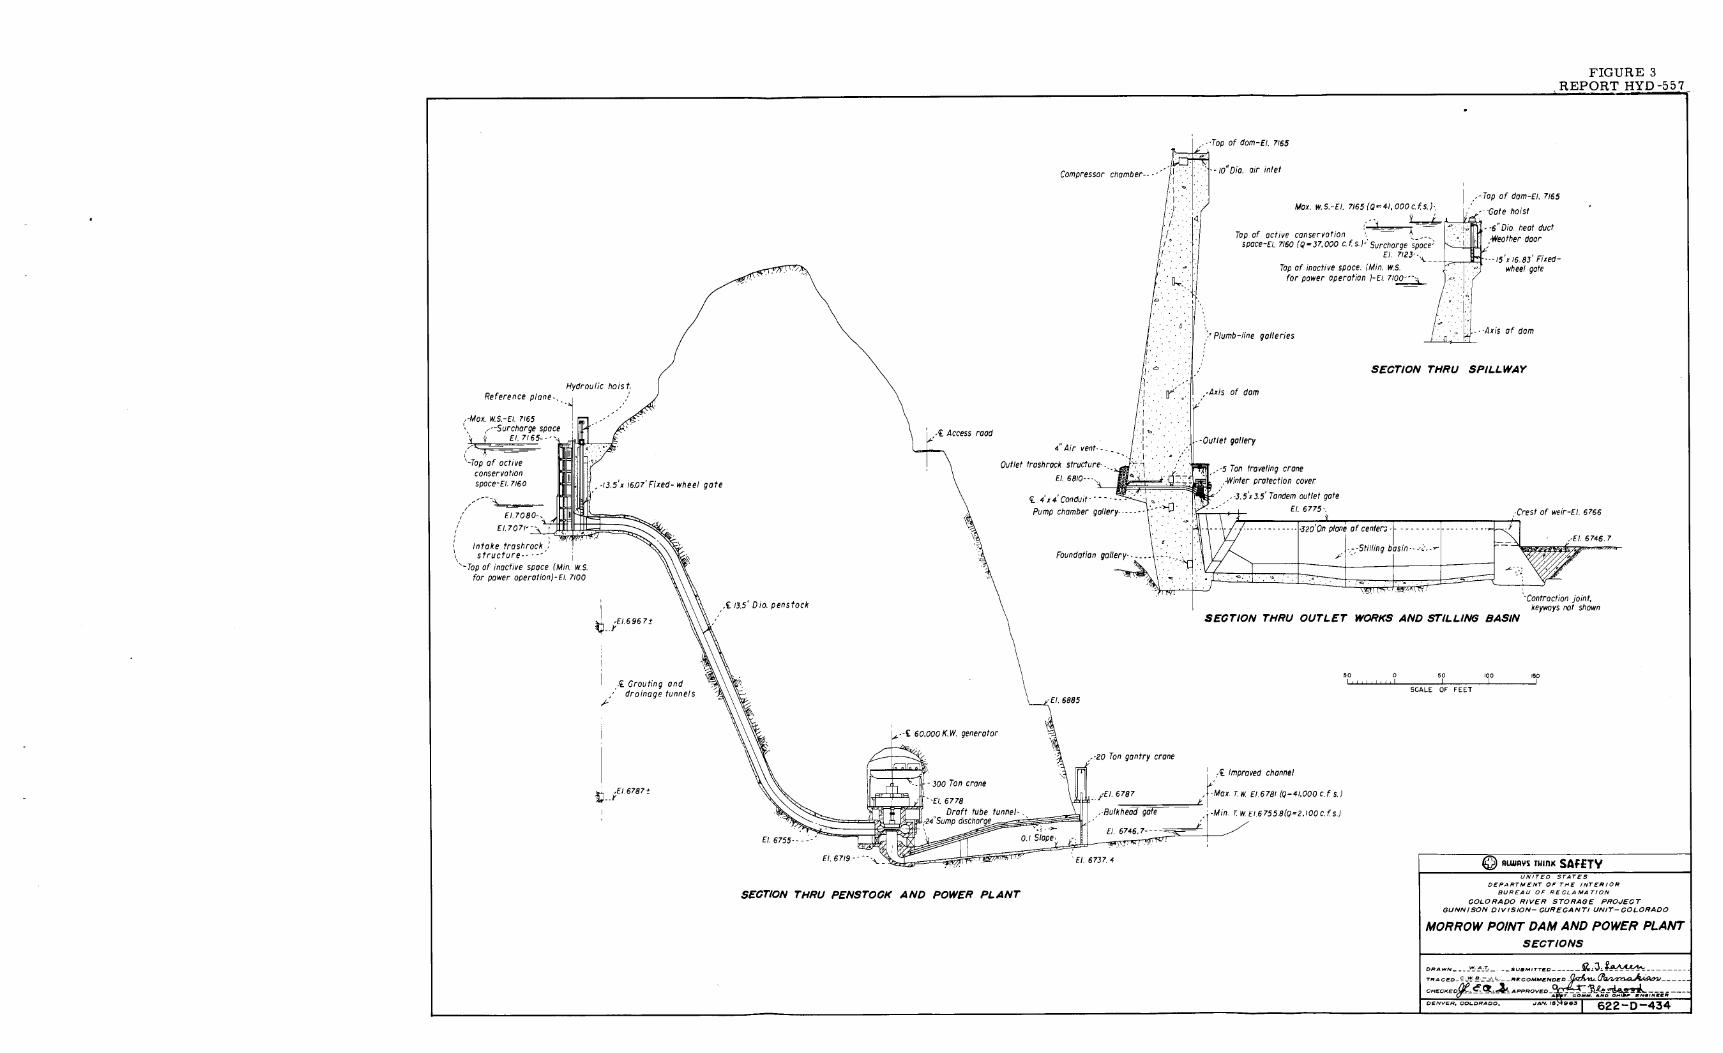
Morrow Point Dam, the Bureau of Reclamation's first double-curvature, thin-arch concrete dam, contains the Bureau's first orifice-type freefall spillway, and its first underground powerplant, Figures 2 and 3. The dam varies in thickness from 12 feet at the crest to 52 feet at the base and rises 465 feet above the foundation. It contains 360, 000 cubic yards of concrete and has a crest length of 720 feet. The reservoir has a storage capacity of 117, 000 acre-feet, extending upstream to within one -half mile of Blue Mesa Dam.
The spillway includes four 15- by 15-foot openings controlled by fixedwheel gates, Figure 4, with a capacity of 40, 000 cubic feet per second. The discharge jets fall freely, approximately 400 feet to a stilling basin at the base of the dam. The basin, formed by a 65-foot-high weir, is lined with 5-foot-thick concrete and is about 180 feet wide. The weir is 3 2 0 feet downstream from the dam axis .
The outlet works near the base of the dam consists of a 4- by 4-foot steel-lined conduit controlled by 3. 5- by 3. 5-foot tandem slide gates, Figure 5. The outlet wor~s discharges up to 1, 500 cfs. Model studies of the outlet works gates are described in a separate report.
The underground powerplant, Figures 2 and 3, located in the left canyon wall, contains two 60, 000-kilowatt generators and discharges up to 5,200 cfs through two tailrace channels into the river. The river channel is improved for a distance of approximately 1,200 feet downstream from the powerplant tailrace channels.
4

The preliminary design of the spillway and outlet works which provided a basis for the first model tests, consisted of a free overflow spillway at the dam crest with a discharge capacity of 19, 500 second-feet, and a two-conduit, slide-gate-controlled, low-level outlet works with a discharge capacity of 19, 000 second-feet. The spillway discharge fell almost vertically into the stilling pool and the outlet works discharged into the pool at an angle of 15 ° below horizontal. The length of the stilling basin was limited by the location of the powerplant tailrace channels.
Although many modifications were tested, the outlet works arrangement was found to be unsatisfactory. The energy of the high-velocity outlet works efflux was not effectively dissipated in the stilling basin, resulting in excessive impact on the upstream face of the weir and undesirable flow turbulence and spray at the weir. The design was therefore abandoned without testing the overflow spillway. An alternative design was proposed that combined the spillway and outlet works discharges into a free-falling spillway discharge through four gatecontrolled outlets near the crest of the dam. The hydraulic model studies proved this design to be satisfactory. In the preliminary design the top of the parapets on the dam and the .maximum water surface were elevation 7174. The normal water surface elevation was 716 0. In the recommended design the maximum water surface was elevation 7165 and the normal water surface remained at elevation 7160.
5

THE MODEL
The portions of the preliminary design simulated in the original 1:24 model included the slide-gate-controlled outlet works, the stilling basin, and the weir. The outlet works discharge was supplied through a pressure tank connected directly to the laboratory water supply system. Only the control gates were built; the upstream guard gates were not included in the model. The stilling basin topography was :formed with concrete and the weir was formed with con -crete screeded to sheet metal templates.
Following abandonment of the preliminary design, a headbox was included in which the spillway conduits and a portion of the upstream face- of the dam were installed. The spillway conduits and bellmouth entrances were fabricated with sheet metal and included piezometers for pressure measurement. The fixed-wheel gates controlling the spillway flow were simulated by slide gates with correctly proportioned gate slots. The low-level outlet works was added later, with water supplied directly from the headbox. Discharge through the outlet works was controlled with a slide gate.
Piezometers were included in the stilling basin floor and the upstream face of the weir for determination of impact pressures. Final revisions included improved stilling basin topography, the powerplant tailrace channels, and a portion of the improved river channel to approximately Station 4+00.
Water was supplied to the spillway and outlet works through a recirculating system by centrifugal pumps . The combined spillway and outlet works discharges were measured by permanent volumetrically calibrated venturi meters. A portable centrifugal pump supplied the powerplant discharge which was measured by a portable orifice meter.
The tailwater was controlled with an adjustable tailgate and the tailwater elevation was measured by a staff gage at improved river channel Station 4+25. Elevations were set' according to the curve of Figure 6.
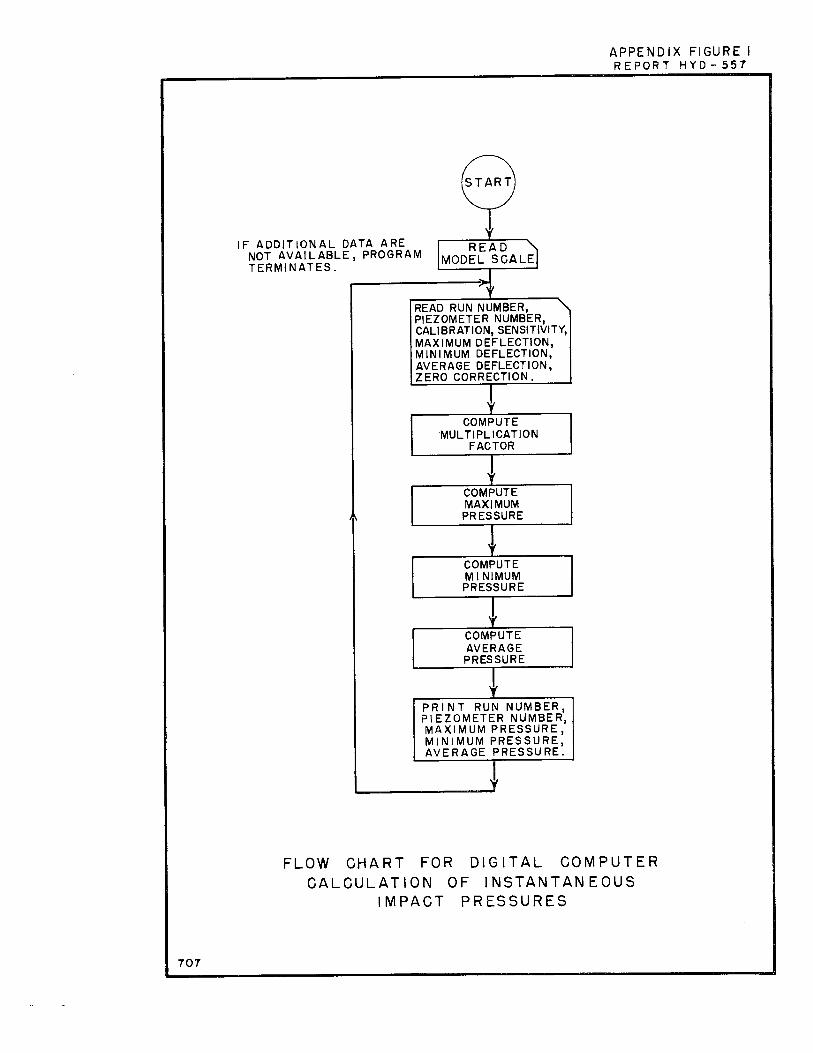
Special instrumentation consisted of pressure transducers which were used to record the variation in impact pressure on the stilling basin floor and weir face and to more closely examine the pressures in the spillway conduits and bellmouth entrances. The transducers were connected to a six-channel direct writing oscillograph. The oscillograph records were analyzed with the aid of a short electronic digital computer program (see Appendix), which converted oscillograph- deflections directly to pro -totype pressure heads. ·
6

THE INVESTIGATION
The investigation was initiated to determine the hydraulic characteristics of the preliminary design. Following abandonment of this design, the model aided in the development of the alternate scheme and provided information as to the operating characteristics of the recommended design.
The Preliminary Design
The preliminary design included an outlet works and a spillway. The outlet works consisted of two 7- by 10. 5-foot conduits, located at elevation 6800 near the base of the dam and controlled by tandem highhead slide gates, which discharged at an angle of 15° below horizontal. The maximum outlet works design discharge was 19, 000 cfs with the reservoir at the top of the parapet, elevation 7174. At normal reservoir elevation 7160 the outlets were designed to discharge approximately 18, 600 cfs. The high-velocity jets (approximately 130 feet per second) discharged into a stilling basin formed by a 65-foothigh weir located about 180 feet downstream from the slide gates. The preliminary spillway was 132 feet wide with the crest at elevation 7162; its discharge capacity was 19, 500 cfs.
The early model configuration included only the outlet works and stilling basin, Figure 7A. The spillway was to be added and tested after completion of the outlet works investigation.
Operation of the preliminary design model at the maximum discharge is shown in Figure 7B and C. The high-velocity jets were not effectively diffused in the stilling basin and struck the upstream face of the weir with great force; there was practically no energy dissipation in the basin. The initial tests indicated that the stilling basin was too short; therefore, the weir was moved downstream approximately 100 feet and the tests were repeated. Flow conditions were improved, but the flow appearance and energy dissipation were still unsatisfactory for the maximum discharge, Figure 8. Even at 50 percent gate opening, the flow conditions were undesirable. Increasing the downward tip angle of the conduits from 15° to 24° did not improve the energy dissipation or flow appearance, Figure 9.
A 24-foot-wide horizontal baffle was attached to the top of the upstream weir face, Figure 10, in an attempt to improve the energy dissipation and confine the turbulence to the stilling basin. Again, little improvement was noted in the flow conditions.
These preliminary observations indicated that a longer stilling basin was needed for adequate energy dissipation. However, the weir could
7

not be moved farther downstream because it would interfere with the powerplant tailrace, and the powerplant location could not be changed because of economic and geologic considerations. Other modifications of the preliminary design to achieve satisfactory operation, such as widening or deepening the basin, were considered impracticable. Therefore, the preliminary design of the outlet works and the overflow spillway was abandoned and an entirely new concept was proposed.
The Alternate Design
The alternate design consisted of four 15-foot-square conduits with their inverts at elevation 7123. All four conduits discharged hori
zontally. The maximum design reservoir elevation was lowered to elevation 7165. Thus, the centers of the fixed-wheel gates control
ling the discharge were submerged 34. 5 feet. The stilling basin design, including the weir, remained the same as at the completion of tests on the preliminary design. The four conduits, which will hereafter be referred to as the spillway, were designed to have the same capacity as the combined total discharge of the preliminary spillway and outlet works, or 38, 500 cfs. In reality, the model indicated that the spillway had a discharge capacity of approximately 40, 000 cfs, at the maximum reservoir elevation.
Figure 11 shows discharge from the spillway for symmetrical operation at one-fourth, one-half, three-fourths, and full maximum capac
ity, and the corresponding stilling basin flow conditions. The jets penetrated through the pool to the floor of the basin with a strong downstream velocity along the basin floor. This caused flow conditions at the weir similar to those observed for the preliminary design, but the flow was more evenly distributed across the width of the basin and weir.
The maximum impact pressures on the upstream face of the weir and on the stilling basin floor were measured by piezometers connected to
open tube water manometers. Piezometer locations and contours of equal pressure are shown in Figure 12A; all pressures are refer-enced to the piezometer opening. The maximum pressure on the floor
was about 120 feet of water, occurring near the bottom of the left slope of the stilling basin (Piezometer 11) about 75 feet upstream from the weir. Pressures on the upstream face of the weir varied from about 40 feet of water near the corbel to a maximum of approximately
80 feet of water near the center of the weir base (Piezometer 20). Piezometer coverage was limited to the left half of the basin and weir, assuming that the pressure distribution would be essentially symmetrical about the centerline. Later tests included more complete coverage.
8

Figure 13 shows operation of the spillway with approximately onehalf the maximum discharge through either the two inside conduits or the two outside conduits. This operation indicated that the undesirable flow conditions at the weir were due primarily to discharge from the two inside gates. Deflecting hoods were placed on the downstream side of the inside conduits to test this premise. The hoods deflected the inside jets, causing them to strike the stilling basin water surface 75 to 100 feet upstream from the zone of impact of the outside jets. Figure 14, when compared with Figures 11 and 13, illustrates the improved stilling basin flow conditions. Figure 12B shows the reduction in impact pressure on the stilling basin floor and weir with the deflecting hoods installed. Maximum impact pressures on the stilling basin floor were reduced from 120 feet to about 70 feet of water, and the maximum impact pressure on the weir was reduced from 80 feet to about 50 feet.
Although the deflecting hoods resulted in satisfactory flow conditions, their inclusion in the recommended design was impractical because of structural design problems. Also, as the captions on Figures 1 lA and 14A indicate, the hoods slightly reduced the spillway discharge capacity.
A practical method to move the impact zone of the inside jets upstream and make use of a large area of the stilling basin was to tip the inside conduits downward. Computations using the path of projectile equations showed that a tip angle of 27° would cause the inside jets to strike the pool in approximately the same location as observed with the deflecting hoods. Stilling basin flow conditions were greatly improved with the tipped conduits, Figure 15, and were considered satisfactory.
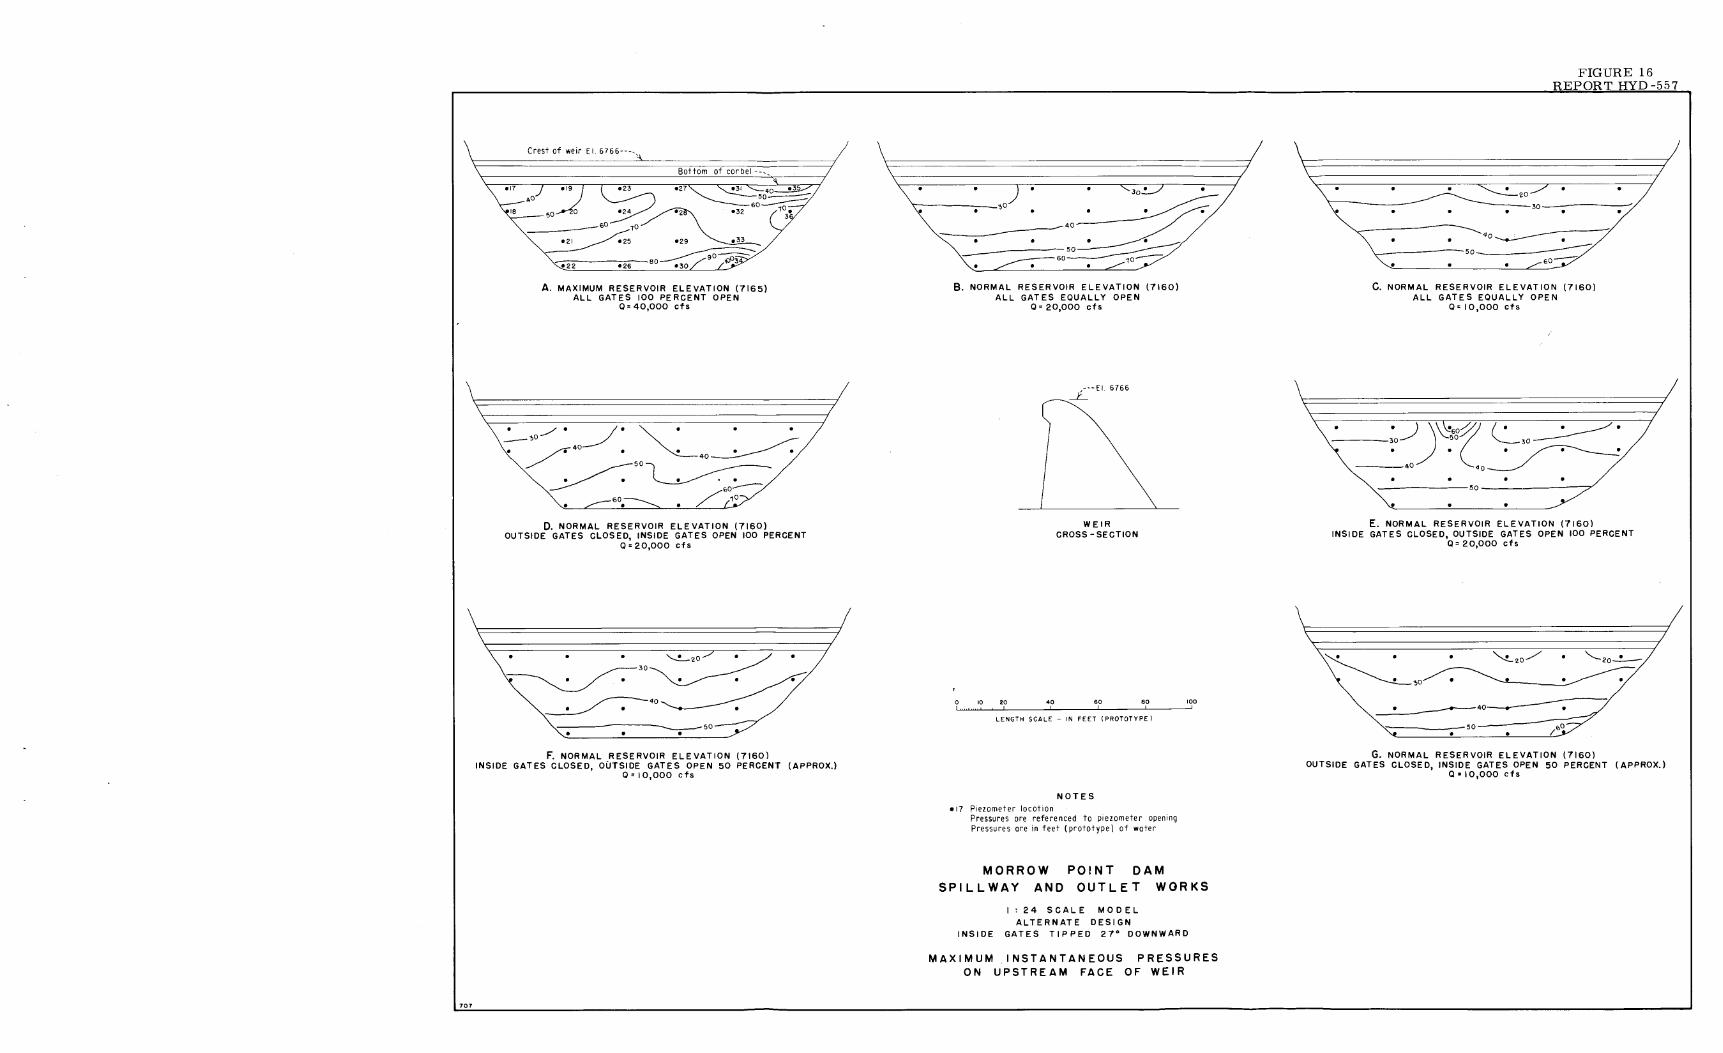
Figure 16 shows the magnitude of maximum impact pressures on the weir, obtained with electronic pressure transducers and a direct writing oscillograph. The pressures indicated are instantaneous absolute maximums, and therefore cannot be directly compared with those of Figure 12, which were recorded with water manometers. A concentration of higher pressures was noted under the weir corbel for several combinations of gate operation. For example, at the maximum spillway discharge of 40, 000 cfs, Figure 16A, a pressure of about 60 feet of water occurred immediately under the corbel near the center of the weir. Since this force near the top of the weir would significantly increase the over-turning moment of the weir, the corbel was removed in later studies when the model was revised to include the powerplant tailrace, outlet works, and improved downstream river channel.
Spillway Conduit Bellmouth Entrances
The original alternate design, with the four spillway conduits horizontal, included symmetrical, elliptical bellmouth entrances, designed
9

according to Corps of Engineers data .. !J With the two inside conduits tipped downward, it became necessary to modify the bellmouth entrance shapes of the two inside conduits. The inside bellmouths were modified to include an approximate ogee crest shape on the conduit bottom, with the roof a combination of an elliptical curve and a reverse curve approximately paralleling the downstream end of the ogee section. The sides remained elliptical as before. Figure 4 shows the recommended configurations. The model was changed to include one revised bellmouth and the upstream face of the dam was simulated for the two right conduits, Figure 17. Sixty-eight piezometers were installed in the two right conduits to determine the effects of the bellmouth shapes on the pressure distribution. Piezometer locations and pressure profiles for 100 percent gate opening are shown in Figure 18. The pressures were obtained from water manometers, and in all cases the pressures exhibited negligible fluctuation.
Under maximum reservoir head, Figure 18A, subatmospheric pressures as low as approximately 6 feet of water occurred on the roof of the horizontal conduit. Pressures on the roof were above atmospheric from the entrance to a point about 7 feet downstream from the entrance and throughout the conduit floor. Subatmospheric pressures as low as 8 feet of water existed on the floor of the tipped conduit, between the gate and a point about 7 feet downstream from the entrance. Subatmospheric pressures as low as 5 feet of water occurred on the conduit roof between the gate and a point about 3 feet downstream from the entrance.
A pressure of 9 feet of water below atmospheric was recorded at Piezometer 66 in the horizontal conduit during one test run. Attempts to repeat this reading showed a subatmospheric pressure of only 3 feet of water. The former reading was apparently caused by separation of the flow from the conduit roof. It is expected that either condition could exist in the prototype. Slight subatmospheric pressures were observed on the floor of the horizontal conduit downstream from the gate (Piezometers 59-61); these low pressures apparently were caused by the slight divergence of the floor and the tendency of the jet to separate from the invert.
Pressures were also recorded with the reservoir at normal elevation to determine the effect of reduced upstream head on the pressure magnitude. This would not be a prototype condition, since full gate opening is required only at the maximum reservoir elevation. Figure 18B shows a pressure distribution similar to that of Figure 18A, except that the subatmospheric pressures are not as low because of lower velocities through the conduits. The slight subatmospheric pressures on the conduit floor downstream from the gate in the horizontal conduit (Piezometers 59-61) and the apparent flow separation on the roof of the horizontal conduit (Piezometer 66) were again noted.
1) "Investigation of Entrance Flared in Four Directions, " Entrances to Conduits of Rectangular Cross Section, Report No. 1, Technical Memorandum No. 2-428, Waterways Experiment Station, March 1956.
10

The tests showed that if the gates were closed slightly (approximately 1 percent), so that the bottom of the leaf controlled the flow, pressures at all points upstream from the gates were above atmospheric.
Revision of the Model to Include Additional Details
Since model data indicated that the revised design would provide satisfactory operation, it was decided to include additional details to more accurately evaluate the hydraulic performance of the structure.
The recommended bellmouth spillway entrances were installed in the head box, and the upstream face of the dam was correctly simulated. The stilling basin topography was reshaped to correspond to the most recent field surveys. The weir was modified to eliminate the corbel, making the upstream face vertical, and was placed so that the vertical face was 320 feet downstream from the dam axis. The 3. 5-foot-square outlet works was installed near the base of the dam to discharge .into the stilling basin. The outlet works flow was supplied from the head box and controlled by a slide gate.
The powerplant tailrace channels and a portion of the improved downstream river channel were also included. The powerplant discharge was supplied by a portable centrifugal pump and was measured by a portable orifice meter.
Development of Details of the Recommended Design
Stilling basin topography. - -The right spillway jet struck the topography near the intersection of the right bank and the pool water surface, while the left spillway jet cleared the topography by some distance. This indicated that the model basin layout might be in error. A careful check of the model topography revealed that the right bank was 2 to 3 inches too near the centerline. The left topography was correctly simulated except near the dam and the weir. These errors were considered too small to materially affect the flow conditions in the basin. Therefore, the right side of the basin was widened about 3 feet (prototype) (making the right side 7 to 9 feet wider than originally represented in the model) so that the right jet would not strike the topography. The top of the lining was raised 10 feet (prototype) between the weir and a point 140 feet downstream from the dam axis. From this point, the top of the lining sloped downward at 6: 1 toward the dam until intersecting the original top of lining. The left side of the basin near the weir was made 3 to 6 feet narrower than before. Figure 19 shows the flow conditions in the revised stilling basin for spillway discharges of 40, 000 and 20, 000 cfs.
Test discharges. --Up to this time, the model operation had been based on the total capacity of the spillway with all gates wide open under maximum reservoir head, which resulted in a discharge of approximately
11

40, 000 cfs. With an outlet works discharge of 1, 500 cfs and a powerplant discharge of 5, 200 cfs, the total river flow was approximately 46, 700 cfs.
Since the actual inflow design flood peaks at about 41, 100 or 5, 600 cfs less than the above indicated capacity, it could be released as a spillway discharge of 34, 400 cfs, plus 1, 500 cfs through the outlet works and 5, 200 cfs through the powerplant. Subsequent tests included runs at the maximum spillway capacity of 40, 000 cfs, the design discharge of 34, 400 cfs, and three-fourths, one-half, and onefourth of the design discharge, with the outlet works and powerplant operating as described above. Another possible operating condition consisted of the total design inflow discharging through the spillway and outlet works, with the powerplant shut down. This condition corresponds to a spillway discharge of 39, 600 cfs (41, 100 minus 1, 500 through the outlet works). This is nearly the same as the maximum spillway capacity and was therefore not included in the model test program.
Impact pressures on the stilling basin floor and weir. - -Earlier tests indicated that the corbel on the upstream face of the weir was causing a concentration of high pressures immediately under the corbel, Figure 16. The revised weir configuration, with the corbel removed, showed substantially lower pressures near the top of the weir, Fig-ure 20. In general, the pressure increased with an increase in depth, without the isolated high pressures which were noted previously.
The impact zones of the outside jets on the stilling basin floor were clearly apparent, Figure 21. For the maximum spillway capacity of 40, 000 cfs, Figure 21A, the maximum impact pressure for the outside jets was about 200 feet of water and the maximum impact pressure for the inside jets was about 340 feet of water (referenced to the piezometer opening). For the maximum design discharge of 34,400 cfs, Figure 21B, these pressures in both areas were approximately 200 feet. The model piezometer distribution did not allow determination of the configuration of the impact zones of the inside jets; however, the patterns should be similar to those observed for the outside jets. Pressures under the right outside jet were higher than those under the left outside jet because the topography was clos~r to the water surface on the right side.
Impact pressure patterns for other conditions of symmetrical and asymmetrical gate operations are also shown in Figure 21. Figure 21E demonstrates the effect of the shallow pool in the right side of the stilling basin; no concentrated impact is apparent from the left outside jet. Figure 21F again indicates that the piezometer coverage was inadequate to define the impact zone of the inside jets. The maximum impact of 239 feet of water compares closely with the impact of 250 feet observed
12

with the outside gates operating alone, Figure 2 lG. These impact pressures fluctuated at a frequency of about 3 to 5 cycles per second over a maximum range of approximately 100 feet of water.
Flow conditions in the powerplant tailrace. --The extreme turbulence which occurred in the stilling basin for spillway discharges greater than approximately 26, 000 cfs resulted in large waves and surges which were carried downstream to the powerplant tailrace, as shown in Figure 19B. The topography surrounding the tailrace channels was subjected to sudden large impact forces because of these flow conditions. Also, there was a drawdown in the water surface at the downstream end of the left bank of the left tailrace channel during operation of the powerplant alone, Figure 22A. The tailrace topography was modified to alleviate the possibility of the rock being dislodged by these flow conditions and falling into the tailraces. The area between the tailraces was shortened and rounded to eliminate thin sections, Figure 22B. The right bank of the right tailrace channel was shortened and rounded and the left bank of the left tailrace channel was rounded, Figure 22B.
The relatively narrow entrance to the improved channel downstream from the weir acted as a control section, causing high tailwater immediately downstream from the weir and a drop in the water surface at the control section, Figure 23 . The right channel bank, which is a talus slope in the prototype, was excavated in an attempt to alleviate the backwater condition. Figures 24 through 27 show flow conditions immediately downstream from the weir and in the stilling basin. The excavation resulted in the control section being moved farther downstream, causing some improvement, even though the backwater condition was not eliminated. The visitor's area on the left bank and the gate deck at the upstream end of the tailrace were periodically inundated during the maximum design discharge.
To improve flow conditions at the weir, the piers on either side of the weir were removed and the stilling basin lining was extended downstream. In addition, the topography at the right downstream end of the right tailrace channel was revised by cutting off the thin tapering rock section. The modified basin and tailrace are shown in Figure 28. Although there was no apparent improvement in the flow conditions in the tailrace area, Figure 29B, the stilling basin flow conditions were slightly improved, Figure 3 0.
The topography between the tailrace channels was modified in an attempt to reduce wave action in the left tailrace channel near the visitors' center parking area. The elevation of the top of the topography was increased first by 5 feet and then by 10 feet. The 5-foot increase was ineffective, but the 10-foot increase reduced the splashing during the
13

maximum design· discharge. A 4-foot-high floodwall around the visitors' center was also tested, Figure 31. The floodwall protected the area from inundation for spillway discharges below approximately 26, 000 cfs. At 26, 000 cfs, minor infrequent splashing over the wall occurred. At a spillway discharge of about 31, 000 cfs, large waves frequently overtopped the wall. For discharges above 31, 000 cfs, the wall was ineffective.
Because of the infrequency of occurrence of the design discharge, it was decided not to attempt additional improvements to the stilling basin and tailrace channel flow conditions. Also, since the spillway and outlet works were capable of discharging the maximum design inflow, powerplant operation could be suspended during high spillway flows.
Impact pressures (recommended desi n). --Impact pressures were obtained on the sti mg basm oor and weir of the recommended design, Figures 32 and 33. Pressure patterns on the floor and weir were similar to those shown in Figures 20 and 21 and the previous discussion applies. However, the magnitudes of the maximum impacts were in general less in the more recent data. The figure captions show that some of the test discharges were lower in the final tests. Asymmetrical flow conditions in the initial tests included wide open gates, (Q = 20, 000 cfs) while for the recommended design the gate openings were limited to allow a discharge of only one-half the design discharge (17,200 cfs). Therefore, the lower impact pressures observed in the final tests were probably due to the lower discharges.
Pressure fluctuations on the downstream face of the weir were relatively steady, with the largest fluctuation being approximately plus or minus 2 feet of water for the maximum design discharge. The average magnitude of the pressures was approximately hydrostatic, i.e., due to the tail water depth alone.
The frequency distributions of the pressures at several representative piezometers on the basin floor were determined. For example, at Piezometer 24 on the stilling basin floor, for one-half spillway design discharge of 17, 200 cfs, Figure 33G, the absolute maximum pressure was approximately 110 _feet of water; however, a pressure with one-half the maximum magnitude (55 feet of water) occurred about 70 percent of the time, Figure 34.
Riprap test. - -The stability of the protective riprap on the channel floor immediately downstream from the weir was estimated by operating all gates symmetrically for a representative time interval at one-fourth, one-half, three-fourths, and full design discharge. After 2 hours (equivalent to about 10 hours prototype operation) at one-fourth the design discharge, very slight movement of the riprap
14

was noted. No further movement was observed after 1 hour operation at either one-half or three-fourths design discharge. After 1 hour operation at the design discharge (34, 400 cfs). several pieces were removed from the upstream left corner of the riprap layer and material along the right side of the layer was washed toward the center of the layer. No material was observed to move into the tailrace. The rock used in the model had a maximum size of 2 to 3 inches. which is representative of the specified prototype material, with a maximum dimension of 5 feet.
Movement of rock in the stilling basin. - -The possibility exists that rock f rorri the cliffs above the stilling bas.in could fall into the basin and cause abrasive damage during operation of the spillway. A series of tests was made to determine movement of material in the basin for several spillway discharges. Material of the same size used in the riprap test was placed in the bottom of the stilling basin and sections were identified with white spray paint, Figure 35A. The model was operated for 1 hour for each of the discharges used for the riprap test, and for operation of the outlet works alone with no spillway discharge.
Independent operation of the outlet works caused no movement of the rock material. After symmetrical operation of all gates at one-fourth design spillway discharge, the material remained relatively stable except in the impact zone of the jets. The material was piled immediately downstream from the impact zone, Figure 35B. Figure 35C shows that with one-half design discharge, material was swept against the weir. Some material was swept over the weir and deposited immediately downstream. Three-fourths design discharge showed similar results with more material swept out of the basin, Figure 35D, The design discharge resulted in essentially complete removal of all material downstream from the impact zone, Figure 36A. Figure 36B shows a closeup of the tailrace and the amount of material deposited downstream from the weir. A small amount of material was deposited in the right tailrace channel. The tests indicated that material which falls into the basin will circulate during operation of the spillway with probable accompanying abrasive damage to the concrete lining.
Reservoir flow conditions. --Observations were made of flow conditions in the reservoir near the spillway entrances to determine possible adverse operating conditions. With the reservoir water surface at the maximum elevation (7165) and with all four spillway gates 100 percent open, discharge = 40, 000 cfs, small vortices formed at the corners of the vertical section on the upstream face of the dam which contains the bellmouth entrances, Figure 37A. At times, these vortices became large enough to take small quantities of air. Smaller vortices formed over the inside bellmouth entrances, taking minute quantities of air.
15
Strong circulation was apparent above the outside entrances, but no vortices formed. For 39, 600 cfs, with the gates slightly closed, conditions were similar to those describeq above.
At a spillway discharge of approximately 27, 500 cfs, with the gates 100 percent open, the reservoir water surface was immediately below the top of the two inside entrances. The inside conduits flowed full for a short period of time, increasing the discharge, and the reser-voir dropped so that a free water surface existed through the con-duits. The lower reservoir elevation resulted in a decreased dis-charge and the reservoir elevation increased until the conduits again flowed full. This cycle was repeated and resulted in a periodic surging with a frequency of about one surge per second. Such a condition could cause undesirable flow conditions in the conduits and vibration in the gate mechanisms. With one inside gate closed about 25 percent, surg-ing was eliminated in that conduit but continued in the other inside con-duit. By closing one of the outside gates to increase the reservoir elevation, surging was stopped in both inside conduits when the water surface rose 2 to 3 feet (prototype) above the top of the entrances. Similar surging was noted in the outside conduits with the water sur-face near the top of the outside entrances, and was eliminated by a gate closure of about 25 percent. The surging condition is a function of the conduit geometry and a critical reservoir elevation and can be eliminated by gate closure or adequate submergence of the entrances. According to the prototype operating criteria, the conditions described above will not be allowed to occur. The minimum submergence, meas-ured from the top of the bellmouth entrances, will be about 10 feet for the inside conduits and about 1 7 feet for the outside conduits.'
With either the two inside or two outside conduits operating alone with the gates 100 percent open and the reservoir at elevation 7160, vortex action similar to that described for the maximum spillway discharge was observed. At three-fourths maximum discharge, with the gates equally open and the reservoir at elevation 7160, Figure 37B, the vortex was somewhat stronger and larger than that observed for the maximum discharge because of the lower reservoir elevation. Vortex action diminished with a further decrease in discharge, until at onehalf maximum discharge only a dimpled water surface was observed above the entrances.
Modifications to the corners of the vertical face were tested in the model to determine if such modifications would improve the pressure distribution in the outside bellmouth entrances. First, the right corner of the vertical face was extended 12 feet (prototype) away from the entrance. No noticeable change occurred in the bellmouth pressures. The extension was removed and a 4-foot radius rounding was applied to the right corner. Again, no change was noted in the pressure distribution. On the basis of these observations, no modifications were made to the prototype design.
16

Spillway discharge capacity. --The discharge capacity of the recommended spillway was determined for various conditions of symmetrical and asymmetrical operation. With all four gates 100 percent open, the discharge capacity was 40, 000 cfs at reservoir elevation 7165. The capacity of the two outside conduits, with the inside gates closed, was 20, 000 at reservoir elevation 7165. The corresponding capacity of the two inside conduits was also 20, 000. One inside conduit operating alone discharged 10, 000 cfs at elevation 7165, as did one inside gate alone. Data for operation at partial gate openings, which would occur in the range between normal and maximum reservoir elevations, were not obtained.
The model gates, did not correctly simulate the prototype gates, and it was felt that such data would not be sufficiently accurate.
Miscellaneous observations. - -The average elevation of the backwater on the downstream face of the dam was found to be 6780 for the design spillway discharge, with waves as high as elevation 6790. For onehalf design discharge, the backwater stood at an average elevation of 6770. The downstream tailwater was set for the total river flow, including the outlet works and powerplant discharges.
Operation of the low-level outlet works was satisfactory either with or without the spillway operating.
The feasibility of calibrating the model weir was investigated, to determine the possibility of using the prototype weir for discharge measurement. With only the outlet works operating, the stilling basin water surface was too rough to allow an accurate elevation reading. Also, the two 3-foot-square openings in the weir would not be easily plugged. Use of the prototype weir for this purpose was therefore considered impractical.
Photographs of operations of the recommended design are shown in Figures 38 through 44. Colored movies (including slow motion) were also taken for future reference.
17

Table 1
Metric Equivalents of Important Quantities
e r1c uni s
Dam thickness at crest 12 feet 3. 66 meters Dam thickness at base 52 feet 15. 85 meters
Dam height above foundation 465 feet 141. 73 meters
Volume of concrete 360, 000 cubic 273, 600 cubic yards meters
Length at crest 720 feet 219. 46 meters
Reservoir capacity 117. 000 acre- 144,319.500 feet cubic meters
Reservoir length 12 miles 19. 31 kilometers
Spillway capacity 40, 000 cfs 1. 132 m 3 / sec Spillway gate size 15 feet square 4. 57 meters square
Height of fall 400 feet 121. 92 meters
Stilling pool length 320 feet 97. 54 meters Stilling pool width 180 feet 54. 86 meters
Weir height 65 feet 19. 81 meters
Lining thickness 5 feet 1. 52 meters Outlet works capacity 1. 500 cfs 42. 45 m3 / sec Outlet works gate size 3. 5 feet square 1. 07 meters square
Powerplant generation 120. 000 kilo- 120. 000 kilo-watts watts
Powerplant discharge 5, 200 cfs 147.16m3/sec
18

---·--='·
;

APPENDIX
Electronic Digital Computer Program for Calculation of Maximum Instantaneous Impact Pressures
The subject computer program was written for the purpose of calculating prototype pressures from deflections on an oscillograph recording obtained with electronic pressure transducers. The program is short, but practical because of the large volume of data analyzed.
The program is written in the FORTRAN II (FORmula TRANslation) language. No special operating procedures are required. The program can be used on most digital computers. Input data consist of the test run number and piezometer number for identification; the· maximum, minimum, and average stylus deflection (in millimeters) from the oscillograph record, and calibration and sensitivity data for the recording instrument. A zero datum plane correction factor and the model scale are also included as input. A sample data sheet is included in this appendix.
A multiplication factor is computed from the sensitivity, calibration, and model scale. This factor is applied to the stylus deflections, resulting in the prototype pressure heads, in feet of water, which are adjusted to the piezometer opening for zero datum with the zero correction factor. These steps are presented in the flow chart and program listing. Output consists of the identifying run and piezometer numbers, and the maximum, minimum, and average prototype pressure heads as shown on the output listing in this Appendix.
Approximately 800 oscillograph records were analyzed, corresponding to about 7, 000 computation steps.
19

DEFINITION OF VARIABLES USED IN THE PROGRAM
SCALE
RUN
PIEZ
CALIB
SENS
Model scale
Test run number
Piezometer number
Recorder attenuation at which 1. 0 foot of water results in a stylus deflection of 10 mm
Recorder attenuation setting for test run
DEFMAX Maximum stylus deflection for test run
DEFMIN Minimum stylus deflection
DEFAVE Average stylus deflection
ZEROC Correction factor to shift zero datum to piezometer opening
FACTOR Multiplication factor to change stylus deflection to pro-totype pressure head
PRMAX Maximum prototype pressure head
PRMIN Minimum prototype pressure head
PRAVE Average prototype pressure head
Variables are defined in the order in which they first appear in the program.
20

-----
----
----
--
i1so
r--
-T--
--,-
----
r---
,---
---,
----
.---
----
----
--
~ , 7
70
L __
__ JL
----~
~----
~~---
--=:::
:;;;;~
.... ~~
=-t
----
--t-
----
-,--
---r
-7
I z 0 1- <t
>
W
67
60
_
j w
Q: w
I- ; 6
75
0 lL:
__ ___
J--~
--+
----
-+--
----
t---
---i
----
-i--
---t
----
-r-1
<t
I-
67
40
0
5 No
te:
10
15
20
2
5
30
35
TO
TA
L
RIV
ER
D
ISC
HA
RG
E -
TH
OU
SA
ND
S O
F C
FS
Me
asu
rin
g
sta
tio
n
42
5 f
ee
t d
ow
nst
rea
m f
rom
axi
s o
f w
eir.
C
urv
e
deriv
ed
from
-F
igu
re
5B,
11T
ailw
ote
r S
tud
y fo
r F
ina
l D
esig
n P
urpo
ses
II
Hyd
rolo
gy
Bra
nch
, D
ece
mb
er
19
62
.
MO
RR
OW
P
OIN
T
DA
M
TA
ILW
AT
ER
C
UR
VE
40
:::u
l"I .,, .
,, 0
-::a
(i)
-IC
%
::0
-< IT
I 0 I "'°
' U
I ...

FIG
UR
E 7
RE
PO
RT
HY
D-5
57
B.
1 00o/o gate o
pen
ing
s Q
= 1
9,0
00
cfs
A.
Pre
limin
ary
desig
n
C.
l00o/o gate o
pen
ing
s Q
= 1
9,0
00
cfs
MO
RR
OW
PO
IN'l' D
AM
OU
TL
ET
WO
RK
S
PR
EL
IMIN
AR
Y D
ES
IGN
1 :24 S
cale Mo
del
Stillin
g B
asin
Flo
w C
on
ditio
ns
Gate
s Tip
ped
15° Belo
w H
oriz
on
tal

A. 50% gate openings Q. = 8,180 cfs
MORROW POINT DAM OUTLET WORKS PRELIMINARY DESIGN
1 :24 Scale Model
Stilling Basin Flow Conditions Gates Tipped 15° Below Horizontal
B, 100% gate openings Q = 19,000 cfs
Weir 100 feet Downstream from Original Position
~ '1::1 Ql-tj ::cs 1-j c:: ·~~ t, 00 I
c:.n c:.n "-:1

A. 50% gate openings Q = 8,180 cfs
MORROW POINT DAM OUTLET WORKS PRELIMINARY DESIGN
1 :24 Scale Model
Stilling Basin Flow Conditions Gates Tipped 24° Below Horizontal
B. 100% gate openings Q = 19,000 cfs
::0 t,:j "ti Ol%J ::0 s t-:3 c:: -el~ Oco
I C.fl C.fl ..J

B. 50% gate openings Q = 8, 180 cfs
A. Upstream face of weir with 24-foot-wide horizontal baffle.
MORROW POINT DAM OUTLET WORKS PRELIMINARY DESIGN
1 :24 Scale Mo9el
Stilling Basin Flow Conditions with 24 -foot-wide Horizontal Baffle
on Upstream Face of Weir
C. 100% gate openings Q = 19,000 cfs
~ ttj "'d '%j 0 1-t ~o ~q
~~ tJ .... 10
CII CII -.J
A. Res. Elev. 7165 Gates open 1 OOo/o Q = 40,000 cfs
B. J;tes. Elev. 7160 Gates equally open Q = 30,000 cfs
C. Res. Elev. 7160 Gates equally open Q = 20,000 cfs
MORROW POINT DAM SPILLWAY 1 :24 Scale Model
Alternate Design Flow Conditions with
Spillway Conduits Horizontal
D. Res. Elev. 7160 Gates equally open Q = 10, 000 cfs
~ t_:rj
'"01:cj
@s i-3«:l ~: t, .... I I-'
CTI CTI -.1

707
,,-Upstream face of weir
Bottom of left slope ~/ "'"' of o,ofecs
70+' 60
2•~
50 I
PRESSURE CONTOURS ON STILLING BASIN FLOOR
WITHOUT DEFLECTING HOODS ON INSIDE JETS
•24 )
-·" 25
Crest of weir El. 6766-.
•21 ) •17
•22 •18
..,.....---,o .,,------------ . ,,o 21/,~o~
·- Bottom of corbel
/ /s~~ ,-El. 6720
PRESSURE CONTOURS ON UPSTREAM FACE OF WEIR
WITHOUT DEFLECTING HOODS ON INSIDE JETS
A.
10 20 40 60 BO 100 LENGTH SCALE - IN FEET (PROTOTYPE)
Q = 40,000 cfs. ALL GATES 100 PER CENT OPEN
,-- El. 6766 .....L..____
WEIR
CROSS - SECTION
MORROW POINT DAM
SPILLWAY AND OUTLET WORKS
: 24 SCALE MODEL ALTERNATE DESIGN
MAXIMUM WATER MANOMETER PRESSURES
ON WEIR AND STILLING BASIN FLOOR
-")
•
•
J __,.,o •
PRESSURE CONTOURS ON STILLING BASIN FLOOR
WITH DEFLECTING HOODS ON INSIDE JETS
. / . \----30__/
~40
/"o
PRESSURE CONTOURS ON UPSTREAM FACE OF WEIR
WITH DEFLECTING HOODS ON INSIDE JETS
B.
NOTES •24 - P1ezameter location
Pressures are referenced to p1ezometer opening Pressures ore 1n feet of water (prototype)
FIGURE 12 REPORT HYD-557
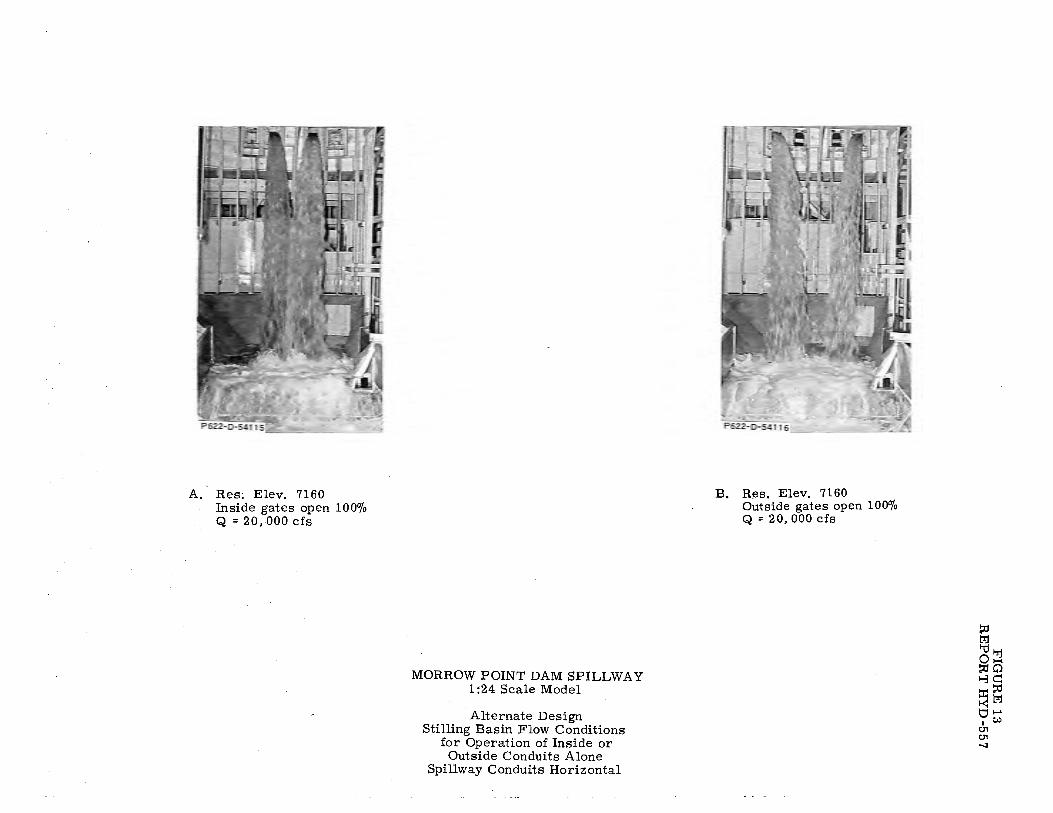
A. Res; Elev. 7160 Inside gates open 100% Q = 20,000 cfs
MORROW POINT DAM SPILLWAY 1 :24 Scale Model
Alternate Design Stilling Basin Flow Conditions
for Operation of Inside or Outside Conduits Alone
Spillway Conduits Horizontal
B. Res. Elev. 7160 Outside gates open 100% Q = 20, 000 cfs
:;:I trj '"d l'rj
@s ~ c:: ~~ t,i-
1 c,:, C]l C]l
-J
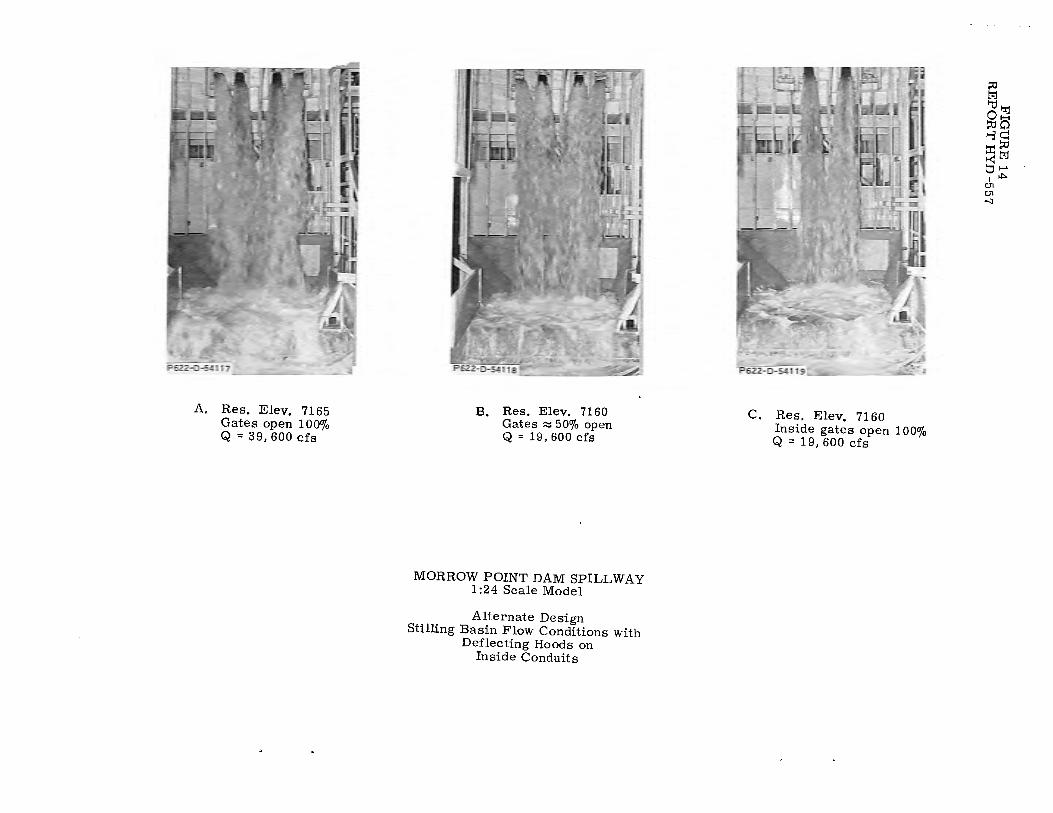
A. Res, Elev, 7165 Gates open 100% Q = 39,600 cfs
B. Res. Elev. 7160 Gates R: 50% open Q = 19,600 cfs
MORROW POINT DAM SPILLWAY 1 :24 Scale Model
Alternate Design Stilling Basin Flow Conditions with
Deflecting Hoods on Inside Conduits
C. Res. Elev, 7160 Inside gates open 100% Q = 19,600 cfs
~ l:tj "ol:cj
@s ~q
R~ t, I-' .~ c:.n c:.n -.J

Res. Elev. 7165 Gates open lOOo/o Q = 40,000 cfs
MORROW POINT DAM SPILLWAY 1 :24 Scale Model
Alternate Design Stilling Basin Flow Conditions with
Inside Conduits Tipped 2 7° Downward
FIGURE 15 REPORT HYD-557
707
Crest of weir El. 6766----,
019
50 0
.•22 •26
A. MAXIMUM RESERVOIR ELEVATION (7165) ALL GATES 100 PERCENT OPEN
Q = 40,000 cts
. _,o/ • /• . ~'"__.../ . ~ . .
~50 40 ~ ~ .' ------/ ~ . . - / /60--/ • / .,.10
D. NORMAL RESERVOIR ELEVATION (7160) OUTSIDE GATES CLOSED, INSIDE GATES OPEN 100 PERCENT
Q = 20,000 cts
~'"~ /1/7: ~ ~ / '-. ___ ,a
F. NORMAL RESERVOIR ELEVATION (7160) INSIDE GATES CLOSED, OUTSIDE GATES OPEN 50 PERCENT (APPROX.)
Q=I0,000 cfs
• ) • • '30.!._../ •
.-,a ·===u - -. -~ ~ ----40~ / 1/ . . . . 0
---------60~ ------=-:so
B. NORMAL RESERVOIR ELEVATION (7160) ALL GATES EQUALLY OPEN
Q=20,000 cts
10 20 40
____i:__--E I. 6766
WEIR CROSS - SECTION
60 80 100
LENGTH SCALE - IN FEET {PROTOTYPE I
NOTES
• 17 Piezorneter locot,on Pressures ore referenced to piezorneter opening Pressures are in feet (prototype) of water
MORROW POINT DAM
SPILLWAY AND OUTLET WORKS
I: 24 SCALE MODEL
ALTERNATE DESIGN INSIDE GATES TIPPED 27° DOWNWARD
MAXIMUM INSTANTANEOUS PRESSURES ON UPSTREAM FACE OF WEIR
FIGURE 16 REf>ORT HYD-557
. . ~ / . ~ . . • 30 •
. . •o ~
. . so_---;? • __. 60--:;::,
C. NORMAL RESERVOIR ELEVATION (7160) ALL GATES EQUALLY OPEN
Q= 10,000 cts
. •
/
. _) \~60~(.- L ~-!o _,) :o • 3o~
--~ •o~ /
so
E. NORMAL RESERVOIR ELEVATION (7160) INSIDE GATES CLOSED, OUTSIDE GATES OPEN 100 PERCENT
Q = 20,000 cts
~ 0 0 ~20/
0 '-----20~
\ ~~o • • •/
so~
G. NORMAL RESERVOIR ELEVATION (7160) OUTSIDE GATES CLOSED, INSIDE GATES OPEN 50 PERCENT (APPROX.)
Q • 10,000 cfs
707
IF ADDITIONAL DATA ARE READ NOT AVAILABLE, PROGRAM MODEL SCALE TERMINATES.
READ RUN NUMBER, PIEZOMETER NUMBER, CALIBRATION, SENSITIVITY, MAXIMUM DEFLECTION, MINIMUM DEFLECTION, AVERAGE DEFLECTION, ZERO CORRECTION.
COMPUTE MUL Tl PLICATION
FACTOR
COMPUTE MAXIMUM PRESSURE
COMPUTE MINIMUM PRESSURE
COMPUTE AVERAGE PRESSURE
PRINT RUN NUMBER, PIEZOMETER NUMBER, MAXIMUM PRESSURE, MINIMUM PRESSURE, AVERAGE PRESSURE.
APPENDIX FIGURE I REPORT HYO - 557
FLOW CHART FOR DIGITAL COMPUTER
CALCULATION OF INSTANTANEOUS IMPACT PRESSURES

PROGRAM LISTING
CALCULATION OF INSTANTANEOUS PRESSURES
MORROW POINT OAM SPILLWAY MODEL 1 FORMAT (F8.0) 2 FORMAT (218,6F8.0) 3 FORMAT (18,1X,18,6X,F8.l,9X,F8.1,11X,F8.l) 40FORMAT (1Hl,73H RUN NO PIEZ NO MAXIMUM PRESS MINIMUM. P
lRESS AVERAGE PRESS) 50FORMAT (1H0,75H PRESSURES ARE IN PROTOTYPE FEET OF WATER MEASURED
lABOVE PIEZOMETER OPENING) WRITE OUTPUT TAPE 6,5 WRITE OUTPUT TAPE 6,4 READ INPUT TAPE 5 1 1,SCALE
6 READ INPUT TAPE 5,2,RUN,PIEZ,CALIB,SENS,OEFMAX,DEFMIN,DEFAVE,ZEROC FACTOR=(SENS•SCALE)/(CAL18•10.0) PRMAX=DEFMAX•FACTOR+ZEROC PRMIN=DEFMIN•FACTOR+ZEROC PRAVE=DEFAVE•FACTOR+ZEROC WRITE OUTPUT TAPE 6,3,RUN,PIEZ,PRMAX,PRMIN,PRAVE GO TO 6 ENo,1,0,0,o,o,o,1,o,o,o,o,o,o,o,o,

BUREAU OF RECLAMATION LABORATORY PUNCH CARD DATA
PROBLEM IMPACT PRESSURES JOB NO. 41-4-622-01-02-01 USE
BUFF DETAIL STILLING BASIN FLOOR AND WEIR # 029 896 ••••• oO o o o O o O o I
COLORED FEATURE MORROW POINT SPILLWAY 1:24 MODEL RETURN TO King CARDS
PROJECT CRSP ROOM 25 E BLDG. 56 PHONE 8508
1l21314l5l611la s \lo I II I 12 li3 li4 li5 li6 11 I 18 I 19 l2ol21 l22l23 l24 25126121 l2a 129130131 I 32 33134135136131138139140 41142143144145146147148 49150151152153154155156 51l5al59 l&ol 61162163164 65166161168169110111 I 12 73l14l15l 16l11l1al19IBO
MODJET. sr. I .F. I I I I ~Al\/f PT .R I I I I I I I I
214 • I I I I I I I I I I
~µ11 I :PtejZ; I I Max Min , , Ave I I Zero I I I I I I I
Ntljmber ~\up.l;>er I Gail~b I I ~ep:lf? I I P~f,l(:lctip:r;i P~:t;l~cti,o:r;i DeO.ec:tion Cor.recti on I I ,
I 1 I 1 2 01. 1 01. 191. 2 11. 7 81. 0 121. 0 I I
I 1 I 2 101. 51. 1 21. 0 81. 2 1 01. 2 121. 0 I I I
I 1 I 3 1 01. 1 01. 2 21. 8 - 11. 4 11 I. 0, , 121, 0, I I I I I
I 1 I 4 101. 1 01. 151. 1 1 I. 0 71. 2 1 21. 0 I I I I I
I 1 I ,5 ,101. 51. 171. 0, I 21 ,,0 I I ,l,31, 151 I I 1. 21, I 0, I I I I I
I 1 I 6 1 01. 51. 181. 8 -51. 3 71. 5 3 21, 0 I I I I I I I I I
I 2 I 7 2 01. 2 01. I I 181. 6, - 11. 5 I 51. 2 3 21. 0 I I I I
I I I 2 I 8 1 01. 1 OI. 2 81. 7 11. 9 91. 8 3 21, 0 I I I I I I
I I , , ,2 I I I I 9 1 01. I I 1 01. 2 01. ,0 I I 31.,0, I ,1.01, 101 I I 13121,,01 I I I I I I I
I , , 2 I I 1 ( 1,01. I 51. 2,81. 8 I ,51, 0, I I I 121. 17 ~ 'JI .0 I I
I 2 I 1 1 1 Q. 1 01. 2 61. 5 - 01. 5 ,71 ,5 , fi. ?.I n. I I
I 2 I 12 1 Oi. 1 01, I 151. 0 - 111 0 41 ,!=) !'l 21 0 I I I I I o
' ' I I 3 t 13 2 01. 1 01. 2 21. 5 . - 41. 2
' 71. 4, 5,21. ,0 , I I I ' ' I I ' I
I 3 , , I , ,1,4 I 1, Q, I I I I ,5,01, I I ,1,21, ,2 I I ,-,21, ,0 31. 5 I ,5 81, 0 I I . I
I 3 I 15 1 01. 51. 181. 3 ,, - 1 61. 6 .41. 5 3 11. 3 I I I I
I 3 I 16 1 01. 2 01 •. 81. 0 - 141. 9, , ' - 21. 2 5 11. 3 I I
REMARKS
BY DLK DATE 6-9-64 CHECKED SHEET 1 OF 23

EXAMPLE OF OUTPUT LISTING
RUN NO Pl[Z NO MAXIMUM PRESS MINIMUM PRESS AVERAGE PRESS 19 36 47.9 22.5 33.0
19 29 51.4 -2.0 33.0
l<J 37 '• 3. 5 26.q 34.7
20 .3 5 37.8 16.4 28.6
20 36 36.9 16.8 28.6
20 29 38.2 13.7 28.6
20 37 38.6 24.2 30.2
21 35 36.5 -5.5 19.0
21 36 37.4 11.1 19.0
21 29 55.7 -19.5 24.2
21 37 ,, 5. 2 19.0 28.6
22 35 46.l 10.2 27.7
22 36 43.9 ·14.2 27.7
22 29 57.5 -2.0 33.0
22 37 37.9 22.8 29.5
23 35 40.9 2.4 28.6
23 36 45.2 19.0 29.5
23 29 39.l 6.7 24.2
23 37 45.9 22.1 30.9
24 3-5 45.7 10.7 21.1 24 36 36.9 19.0 27.7
24 29 63.6 12.0 33.0
24 37 38.6 22.1 29.5
25 35 30.8 14.6 22.s
25 36 29.9 11.1 21 .6

R.94W.
D
BLACK CANYON NATION A
E
R.93W. R. 92W. R. 9!W.
L A
------
KEY MAP
R.90 W. R.89W.
THIRD CORRECTION
~ u\ G
R. 6 W. R. 5 W. R. 4 W
R.88W. R. 87 W. R.86W. R. 85 W.
I T.155
11 ·, I LI NE
R. 3 W.
SOUTH
s 0
T.49N.
,-~-L-----
T.48N.
I SAGUACHE
T.47N.
R. 2 W. t½ W R, I W.
0
SCALE Of MILES
EXPLANATION
PAVED
UNCLASSIFIED
@ ALWAYS TlllnK SAfETV UNITED STATES
DEPARTMENT OF THE INTERIOR BUREAU OF RECLAMATION
R. I E.
12
COLORADO RIVER STORAGE: PROJECT GUNNISON DIVISION-CURE:CANTI UNIT- COLORADO
MORROW POINT DAM AND POWER PLANi LOCATION MAP

+
--.:s 13°-6"0,a pen slacks, s11°oo'w '
I I : ----~" I I -----1 I ' I -,' ,,,~C---- w ,s•" w - +cc" LContract10n JO /j of centers~r ---:- ' \
I / "'"' -,+; "'-"'' ' I -- I ,/ --St,11,ng basin-- r'r" I -. ----- I. [ 1,4116,227" I ~f ~,SI I /f- h-----1
~t-:::c--<_-r-~ i k-:. -31s' R·--r I 7 ==fi~_::
SCALE OF FEET
Hydraulic ha1s I hauses~T /-35 Ton gantry crane
' ', -- --,
of parapet-[! 7168 92
\ \ \
',, ',
'
-8 Spcs @ 40'· 5
Gate ho, sts0,, 1', I
-- :)--\- ---1 1s'+1s'r- ---£ l.,_ I IQ I
/.--:---r~ C,:5 Spillways
11 /l~L·'·-~ i. rJir 11 >_J_J 1/ [ k
FIGURE 2 REPORT HY0_-55__7
Spcs@ 1-0'·280'-- -------------"'I
(--r '-Water level
recorder house
I
ill1 l0 ~s Spillways
--l-c,,, .. oww ,,,,,, __ _ /
/ /
,,,,,,,,,,,, //
:::::J;::~,;:;::;:;;!":J;:~;:;i;:==".',,~ro--Power plant ---_,,-- -- access rood ~
<[
w
7200/----f--+--
~ 7100
z z« ~; ~~ > O 7000 -/t-,iL w« _,a. w«
0
'.:~ o<.? >QC a: <1 6900 WI u,O Wu,
'"a
-_,.__
10
I
I I
\
',
Plane of centers Sta 10 ,oo-----
Outlet trash rack structure--- ---
1 I -! ~Outlet U6810-J
I:
/
/
/
/
UPSTREAM ELEVATION DEVELOPED ALONG AXIS
RESERVOIR AREA- 100 ACRES
RESERVOIR CAPACITY - 10,000 ACRE FEET
10 15 20
r-l
+-
- -r
I
Imo~ - 6780 ~
w --'
Present ta,lwater---
- --~--
- +----'-- L 1 -
~ -l - 20 6'50
'5
H~oRGE - 100 C.F S 30
20
40 OUTLET DISC 20 ATI0N -1,000 CFS.
FOR TW ELEV DISCHARGE
TAIL WATER, AREA, CAPACITY, AND OUTLET DISCHARGE CURVES
I
I
I I
I
I
I I
I I
I
/
1"', , ', -Origmal ground surface I I
:·--Assumed line of J excavot,on
NOTES /lctual required foundat,on may vary widely from assumed
excovot,on lines shown •LI,• RI, etc -TheodolJ/e p1ers-Locat1ons may vary from
those shown
UNITED STATES
DEPARTMENT OF THE INTERIOR
BUREAU OF RECLAMATION
COLORADO RIVER STORAGE PROJECT
GUNNISON DtVIS!ON-CURECANT! UNIT-COLORADO
MORROW POINT DAM AND POWER PLANT
PLAN AND ELEVATION
DRAWN_ WA T - __ SUBMITTED ___ -~~.J~~ TRACED_ ~ ~-S _____ RECOMMENDED_~fP~_
CHECKECQ_M ~-~-.l,. _.PPROVEO_ Q,.,..,."..,:t''\3~ -0 ASST~,:,-;;. -;,-NO C-,:-,-,.;~-,..;-~--;~EER
DENVER, COI....ORADO, .JANUARY 1~, 19)!J3
( I I
/ I
Hydraulic hais t, Reference plane-. __ ~ :
,-Mox. w.s.-EJ. 7165 I
'- ,--Surcharge space \ ~ El.7165----~ /~s.. = -\-Ta/af active
conservation space-El. 7160
//,,,,.,...-
El.7080-, El.7071···
\ structure- - · --· 1
'-Top of inactive space (Min. w s. far power operotian)-EJ. 1100
' I
(1../'·6967!
.(£ Grouting and , ' drainage tunnels
,)-
t] . .l' 6787t
I
,.£ 13.5' Dia. pens tack
--•r · 300 Tan crane
El. 6755· -- · •
Compressor chamber-. · • •
"ik:_
·. ,·
.I(.
4" Air vent-._
Outlet troshrock structure-.
El. 6810----.
,.-20 Ton gantry crone
FIGURE 3 . REPORT HYD-5__Q_7 _
,· - ·Top of dom-E/. 7165
.'1,. 10" Dia. air inlet
,.-Top af dam-El. 7165 Max. w.S.-EI. 7l65(Q~4-1,oooc.fs.)-.
:j y i-1~ Tap af active conservation '-, -· { __ _
space-El. 7160 (Q = 37, ooo c. f s.)-' Surcharge space'
- · -Gate hoist
- -6" Dio heat duct :Weather door
El. 7123·-'I.. ___ _ Top of inactive space. (Min. w.s. f'.·.
far power operation )-E1. 7100--::::i._ 1 ~. ---,s'x 16.83' Fixed-
wheel gate
\ Plumb-line galleries .. 1-- · -Axis of dam
SECTION THRU SPILLWAY
,,Axis of dam I,'
_,-5 Ton traveling crone ,-Winter protection caver
_: • -3. 5', 3.5' Tandem outlet gate
El. 6775 ·., ,-Crest of weir-El. 6766
··--- - -- - -- --1-J2o'On plane of center;;-,- - - - - - - - _,_ -- - .Y
-.· -Stilling basin---·~·---> I ~ I
·.7:.:_,_ "·
SEOTION THRU OUTLET WORKS AND STILLING BASIN
50 O 50 JQO
SCALE OF FEET
'·contraction joint, keywoys not shown
150
1 ,1£ Improved channel
_ .fEl.6787 -f~ax r.w. El.67Bl(Q=4l,OOOc.fs.)
,.-Bulkhead gate ,;-Min. r. W.£16755B(Q=2,IOOc.fs)
":~ ->-
0./ Slope,, i'
. El. 6737. 4 €]) AlWAYS Tlllnl< SAfETV UNITEO STATES
SEOnON THRU PENSTOOK AND POWER PLANT DEPARTMENT or THE INTERIOR
BUREAU OF RECLAMATION
COLORAOO RIVER STORAGE PRO.JECT GUNNISON O/VISION-CURECANT/ UNIT-COLORAOO
MORROW POINT DAM AND POWER PLANT SECTIONS
ORAWN----~~.:.!: ___ SU9Ml'T'TED------~.!.J!.~---------
'TRACEO-~:..~-!!.-.::.::L1=..· __ l'fECOMMENO~D-(?~-----CMl!.CKE0/1:f~~!...~.!.~!.APPROVEO- ___ -~-~~~--- ____ _
_"r-_· A T. ClOMM. ANO-o~ IEN41NE~# __ _
OE.NVER, OOL.ORAOO, 622-D-434

:'f. Black 7 I"'
:::'
tl-3:: ., "' '--> :-
.... "' C 'q,
" :a,: C a: ,-8'-o"(Meosured along ox,s)
: -<7A __
'f. Block 13-- .-'>\,
12'' El 7168 92 .
"\_
El 716575-
Stop-log guide blackout- - - -
Ha,st,heoter.andheoter ,, platfarmnatshaw~. -~.,:-<·i5
~-,-----------~.. ,- , yE/716575 ' - c717·
El 716500-
Ax,s afdom._
- 20-d' -.~--.----·1· '' < ' ' ' ,, y2 .
Or1g1n .afell,pse:-2+ -,""-'' i Gate track-.
18'.d'-
5"0,a heat duct "' ·ci,
,o'·~ c<· "
El 7168 92-
E/7165 75---
Stop-log guide blackout.
~ :-,12
20'd'
FIGURE 4
Ha,st,heater. and heater platform not sh awn ·". :-< 15"
5".,, :-<·,. El
--18'-d'-
,-£17165 75 .f
I I
Cantract,an Joint in parapet
r ,d' . · , , . a e sea_ 1 f--.- _- - - '15-0· - - - -'~ , l·G t I I ,, · • , ,, (15) (5) . •, ~ l 24"' El 7150 7f I seat I -Symmetrical ob out 'f. 'I Gate seal
O
:
I , seat
1 -l- 8'-o" ~bed' _ .- 5" D,o heat duct
{Open Joint Spillways .. _ ·f' Open JO int ,n parapet
·r - ._ . , ...... r - - -- r---8-0 _,., -o I -~ p: 8 11' - '. I ' ' ' :
--7'--" ~--~
in parapet-_ J-. -0
f BLoc~ 8 aLoc,K 12 "' "' Sc
.Catch for lifting slings far bulkhead gate
I I· '· I _ . ·, ,El 714085 11
I l ' , I El 7144 76' · - .• , .;,_,24"1
12 V)
I!,) 0,
& -..,J,4
~
~ a,
,'2 V)
-.Gate erection bearing plates
"' "' di C t;
BLO'c:K II
"' BLOCK 10
'l.' 0, 0 "'
B
-1:! 'i'
:;: Q
V) Q
Q J C .i2 4-V)
V) A
PLA N
f ~ ~ :g 0
""'le : --is ;;:, -<7 D i? ""'la ~ 4- - ,E: O 0
... 0,
"' "' . 0
l= V)
-•·f {Open JOmts v, ".' ": ,P!one af centers t; i'.;;
mporapet\_ ~: -_-_- ~:: ---~---_-_-_-r- ---~ ~ -_- _-r-__ -~- _- ~ ~ -~~ __ -J-_1
~~~--~~~ :.~- ~--J ~: :·_:_ ~ ___ ·-:~ ~ _J ___ -1- _ -->- _
Jl _I I I I I I I I I I
"' "-... Sc
l= V)
0 +<J)
El 716892_:
-~ 12''
,, ,,
9" '-<::"
-~-Grout pad
El.7165751--{ ~: ~:--,f _;_~ _ _:-~'(_ l'>;~'Slope
41''
1_1-..c-g' :_I~,:- I
0.137, 1,i· I •. ·. \2 : :·. \ 0 I .i o, -i- -,,- ·; - . C
Bulkhead gate . ; · · · I R
guide blackout- - . J7
I
"' SECTION D-D
'l' Q
.:: V)
· ·Contraction joints --~----,---,., inparapet
_J
E r Crest-EJ.712951.
El 7125 73-
E/712107-
'\ _
10"-•co
-u.{ X'I -~
I .• E-' I ;7 , I , I'
,Q: -? ~
1 Ax, s af crest. I
·, ...
: \/,/ },,":' ;-rr:
._2"Std csk plug,galv __
LI}
;Stop-log gui,des~I 'f 1 l? ~.~ 0 7!f TI"-1FRaadwaydroins-
_.,.
k-!o ~ ,-'f.s Spillways. IC'
Tap af dam,, ,5"x2''Stdbush,ng) ,
f--,-,-~-'~--1' _in_s_,~e hex. golv ,El 710076:
-. /0'.o" ---~ , 5 Std couphng . 0, i :'fs Spillways •• "' L V) (/) , ' Q fl
"' \,_ " / \,_ ;: 7 ~ '0-" ·,V)
14-0 I'---. I /
'D1aa1rinlet-:. ___ , ,,-\;! 'galv j ,·'.:;'Ax,sofdam.
!·;.. ! ·0· , - ~."Std pipe .. ,, . . ,
'.t Ky '.]'K ., '
'.,,
:E1 70935,~, !-/ _,...., ·, . " {--~".
· · --6.43--
Re in farcement not shown
,-Go te seat
·El 7138 00
SECTION
Embedded guide ' for weather door
F-F
(weather door not shown).
Axis af dam,
,-El 7117 90 __ [
~-vFr' 711600
u: ·1.,2" m El 7113 00
'c:,
- ,,, Symmetrical about,:;:_ ' ·? I '
:::():)
'c/,
- Gate seat
,:~
·,-.'
SECTION G-G
=~:
I ' 1 x2 Y":. ,,, 1 Origin of ellipse (15)2+ (5f°' 1 Gotetrock-
"1 '." . ··1
15 0 · · · ''l .· •
--r- I' =~ 7E (713800
G~ ,E/7123 00 -
'~~~-·-.··
24°'.R,
7G
,Embedded guide for weather door (weather door not shown)
El. 7118.00, I JI-'
15-0 - -- - ,.j\ ·
:.f El 7122 50
1
_ 1 ,,.-n 7121 oo "! =~ ,---,,-· · L.j,_:_. '. , . . " . 1· . 'El 7122 00.
· = · :-origin of ellipse
. ,)l'"'"''" -12''
I_
. X 2 y2
(15)2 .,. (5)2 ""''
.C>.
• J r · Axis of dom.
·~
()
p
w I I I. Y:L __ _._ __ ..,L
Plane of centers~
:Roadway reinforcement not shown ./ ..... I/ ......
i I/ "---- - - 31'.o"- .,,.; ,. Bulkhead gate I
f<- - guides I >-<--- --- 31-0 -- .,.; I -
t-<-- --- ---- - , -- 1---------------- f< - - --f . -- f<. ·Cantract,on J01nts -, - - - -----------<
C
_,,..,,2" '-<--
B UPSTREAM
B ELEVATION
DEVELOPED ALONG A.XIS
C
;-<t5"~
El 7168.92,-'\. !_J!J· Slope {'
I" . ----r,-1 35" Wire mesh fabric; :,-2{' Pipe handrail
2 Open Joint- --9" --
->--, JQ" 5"~- I" '':--~
Eu,65 75 __ .,._ __ :.Jc , Slope , -- __ u:Eu165.75 '-,,,, Axis af dam, _:E/7165.00 ,,__
• Q >· . '--~+-~-~o-t - I J''Std.galvpipetf_ .. Jt::_,:.:.
0 ,_,. , ·c; c· 1"R,· 5"0,axlO"deep
roadway dr~~n~:~~"i; .--, R · i.. _ _ handrail past recess
30°-~.,...)_,.-- - . ·...;, '.
SECTION A-A
El. 7152 5o-· , '·£ 12'' 0,a formed 3'' Std. pipe drain. Connect' plumb-line well ta 5" d1a. farmed drain - ·,
SECTION H-H
. I I...2 -or,g,n af e/1,p se, (1Si2+(
5}2 - 1;
:9 ____L
5co'..,
SECTION E-E
SECTION
El 712/.00.
B-B
,-2{ Pipe handrail
:El. 7122.50 J
SECTION K-K
:E/7116 00
f
El.7116.00. I
,El 7113.00 L
·= r f -.
"'' :~L ~k-L 0do:'>>' ( . . --: . ~
SECTION J-J
--El 7(8,00-
El. 712250, _y__
DOWNSTREAM ELEVATION DEVELOPED
3'.o",3'.o'' Opening
18"Metal ladder
El.7152.50
;El 7121 00
]'
SECTION c-c
NOTES All stot,ans are measured along axis of dam Chamfer all exposed corners {unless otherwise specified
CONCRETE FINISHES Spillway surfaces_______ __ ________ F4 ar U3 Roadway side of parapet __ __________________ F3 Upstream face af dam below El 7100_ _ _ ___ Fl All other dom surfaces except as noted on other drawings_ ___ .. _ _ _ __ _ ___ __ .. F2 ar u2.
Contract ion ja, nt surfaces _________________ .Fl
ALWAYS TIIIRK SAf£TV UNITED STATES
DEPARTMENT OF THE INTERIOR
BUREAU OF RECLAMATION
COLORADO RIVER STORAGE PROJECT GUNNISON DIVISION-CURECANTI UNIT-COLORADO
MORROW POINT DAM SPILLWAYS
::::::~-~~;~-~-;~;--::::::::~:_o~~~-~-~-: !DENVER, COLORADO, .,JANUARY IS, 1963 622-D -440
~

See Deto, I z ..
' -
"o -~
£•.1 ' ' " . :Fl Pin,sh below El 7100· · - 5 'x 7 '-6"0utlet
1,1
, gallery . . _ .• I I
I ,5 x 7-6 Ad1t to ~ate _hous_e L~- _____ . ___ _
£4x4° Ste I H,.,; e conduit l,ners-Sto I0-tOO : : I ' , . --_-.·
~=r=~~=j~s==~=p=c:r:,C,,~ " . rJ , I . "'"'"' , ' . - - - - -' -:_ .~ ----'- 1 _±1::j,_3 DJOmonhole'.0~--;-
"6 'l'
"a, Control cabinet, -<7K
12"~
g __ ·; DETAIL Z
SHOWING TYPICAL COLUMN ANO RIB REINFORCEMENT
' t 71 , 1 U'"'"'' ;:•oo . .,,,,$ .. ,.~., --9-0 . - ' .. · · - ·• -7- 0. -. c · 24
Guide surfaces shall be parallel to the reference plane w,th,n :--/;"in any 10· w,thaut offsets ar gaps at the ~int~.
Ancharbalts· ,. · · · · • · · · - -""l'f)
•lane
"' }---~~--==wF I ~: _ y; · l Y · ltt;:-,_..,:1 __ . °'rj --+-~~
:El.6836 00
Gate l,ft,ng stem- - _
~ ~
I I
FIGURE 5 REPORT HYD-5
./--Battom of gate guide blackout I
·~ L~~=-=~,---·~i*li _-.~-~~ r --:i;~:·· r~, 1
·tl-. - . . -w,nter pr t .• ' ·, !• ' , : v,·• - , - - , - , ' ' '"'"' . "''''" "'" , , _c,,,• ~ 'lf· , ., . , . , • '" , I . winchnotshown)
' ,' ,,,,,~ ,,.:r '*'''":;,--t--c.·-c:.~.~ ~ ... .: " . ~ 5
"' '''"'"""' f~'":"'_f '
:g'.,'\f f taf Guides-·
· Extend guides to top of parapet- El. 7168. 92
V)
<..,
-12 ;_
'-<- .9'- o" _,_,:.,,-.Fl Pin,sh below El 7100-
·. Reference plane
P V C· I 1., ~·lli._ U 11 l
SECTION A-A
Top af second-stage concrete-,
·~ -~ ~
~![[]·,· ~f~ :-Typical reinforcement
T-.;. ~ Second stage .... '-' ... ·:. concrete not shown-
. . ,"."' .. . . .
SECTION E-E
. /'
12''. ,-· ,6"·.. ,-Anchor bar for gate olinement,
SECTION H-H
El.68I0.50
·<i.'s Anchor bars for gate alinement
-,30°
-· re~~--_.-.~,,-~_-· .-~-,...1~"'1~:i;.,..l,;.,,..,.1,' Ad1ust.1ng port,on of anchor bolt f ~ tobe fastened to anchor bar ~ and will be furnished with the gate KEYS FOR SEC. J-J IDENTICAL EXCEPT OPPOSITE HANO
SECTION N-N
Cr,-- ,-Meta/gate slat closure not shawn
f ::__9•_/_rr- ~ -~/ 6836 o·o .. l~c .. · ·. 'i-~:,L __ '-c-c_j y
£Conduit-.
SECT
'a,
ON G-G
:'·- 0.137:1. · p I I !
';" 'I -- r 11 .P •• '
1· ,,, 1.11
- :}_5 -Tan trove.ling crane
• -i?ere;enc~ piane 1 ·
._,'.. : ;. . I_ r 20'.o"( Measured a_long
.. --1·Anchar bars ,n , •. ·:.first stage concrete
4''A,r vent
Ad1usting anchor bolts ,n second stage concrete
Rib blackout. 3" deep.
0 -~
'Guide. faces shall be t----~ --, parallel to a vertical ' plane thru the 1£ of i-condu,t within +f;'many
~ KJ' without affsers or gaps r.. at the o,nts
i. -~o/-. " .. : " : ": " : '' ' " . ,,,,,2 --24~,2-24 -»12 ""lr· .... -8-0 .. - --- -~
: , " ii'-' - -- -- --8-0 .. - -- ..
HALF SECTION B- B HALF SECTION C-C
fl 6836.00
rl ~
.. 7'.o" --+- -.7'.o''.
f-- --- - 19-o"I--- - . +---4-d'
D ---- ,13-d'
r,,,,,,, :D
-EJ
D
Surface between gate gwde blackouts ta be constructed to a :-1" tolerance fram reference plane
k -1-5'.4j"-- .
.21fj l Gate gu, de'·
,Gate guide blackout. '.-. anchor baits not shown ,. I
I
I
El 6836.oo.
----11 ... ... y
-- - - - - ->
CJ ,_ H•8'0" . . ~
r [:] "~
, L"-7 yu >-tl2''t .... -
G
EJ
~~:~:t;:~e0:?c~:!:;• p/;ne of ce~te~s~Sta IO+~d' i-6''x 6-'8" Metal door: ,.Observat,on window
~ ~-
£ Intake for filling line-- - - - -
I
..... ,_Gl "'6 "6 ';)
Sta I0-to_o__ . :1
•. ... ___ ,_"\._=-~-. -\_->:'">-.
_-Face_ af bellmauth · ~ .
1 r8
·. 1£ 5' x 7°-6" Outlet
gal_lery
·Top of lift. , _ .v . El.68I5. . . 3 Dia .
~=.===.===.;1 ;=;: ,.-.- · D · Er> ~anhole:.
" .. _, , , ., p' 3-6 . --5 X 7-6 Ad1t to
gate house .. i
,Hand winch fol op eratian :' of winter pro-/Ection cover
-2'' Std. pipe handrail
.·Metal platform
I
I I I
Hand winch nat shawn
I I
EJ I I I
:El.68I5.001 I
?--2"s1/-pipe
II' ; ~handrail ·E/.68I0.50
$ ,-<7M '<n B
D El
D
L -r -+---11+++11--J..11-;L
El.68I5.00 ..
<;:
<.i ,;,,Ql ,;
.{
·Bulkhead
,-£ El. 6810. 00
_ _,......,-+-_ ----~-+ _i__
<;: Conduit-·
_-f-Face af seats and seal seats shall be in 'atrueplane within tH in any 1o'and parallel to the reference plane within:!: ;f' without offsets or gaps at the joints .
SECTION M-M SHOWING BULKHEAD GATE
I I" ~--- -- -- ---4-92 -
y --->-·>-
Reference plane-._ '.6'.u''c. toe Seals
Face of bellmouth.
{'Normal clearancer';;.:.;_, ··seal
1£ Conduit--·
Cote stem-
··6.67°x6.72'Bulkheod gate
HALF SECTION L- L SHOWING BULKHEAD GATE
NOTES
.Symmetrical ; about £
The reference plane is tangent to the upstream face of dam at El. 6986.34. Chamfer ollexpased corners-j"un/ess otherwise specified. The structural bu/ khead gate shall be fabricated ond shipped assembled as a unit. The cantractar shall install seals. gate seats. guide shoes. stem and minor parts. Embedded anchor bolts shall be positioned to a tolerance of:!:{'. This drawing shall nat be used for field installation.
"~7i- -11J'~~-11J~-><,
,Y_ . \'-·. '·4 'x4' Steel EL'>-: . 111 -- iGJ-+-
f _.,.. . 1 · · canduithner --~-\. · :Pi~c-e m·anolith1c;. I·
Bulkhead gate not shown· ..
· :-·,:with dam-.' .. · . · ·1i"
El.6803.~-
ol. NOTE: Sharing for farms for both upstream,.
and downstream overhangs shall not be removed until mass concrete below El.68I5 is at/east 14 days old.
SECTION
Transit,an from 4'x4°ta 3.5'x3_5'- :'-/.· ,·_
Axis af dam·
THRU OUTLET WORKS
~~' .. \· . I. . . ·~ I E/6800.~ :
____ L_ · __ d ?(·M;;s·u~ed along PO)/ane ~f_1~'.~~;,1 Sta 10+0 .. · of centers- .
E/6795.00'
ELEVATION K-K
D ~ E] _,J ·.:Gate frame
1M _ ,-
~ ~' SECTION F-F
CONCRETE FINISHES
ALIIIAYS THlnK ~Afl:TV UNITED STATES
DEPARTMENT OF THE INTERIOR BUREAU OF RECLAMATION
COLORADO R/VE:R STORAGE: PROJE:CT GUNNISON DIVISION- CURE:CANTI UNIT-COLO RA DO
MORROW POINT DAM OUTLET WORKS
HALF SECTION D-D SHOWING CONCRETE PLACED WITH DAM
Al/surfaces loRAWN- . . ",~-- susM1TTEo ~-CS/.._~ except OS noted - - - - - - -- F 2 or uz. C. w. s. RECOMMENDED - -~---i! ~
TRACED ______ - - -~ - .
HALF SECTION D-D A.O. ,.,,.;r.._,,_APPROVED_<ln-1,~.(f'~-----CHECKED - - - _'--ff, -~- _,,."ifF..1c.,.1-1""iE., DESIGNING ENG/NIE~_
DENVER, COLORADO, JANUARY 15;1963 622-D -443
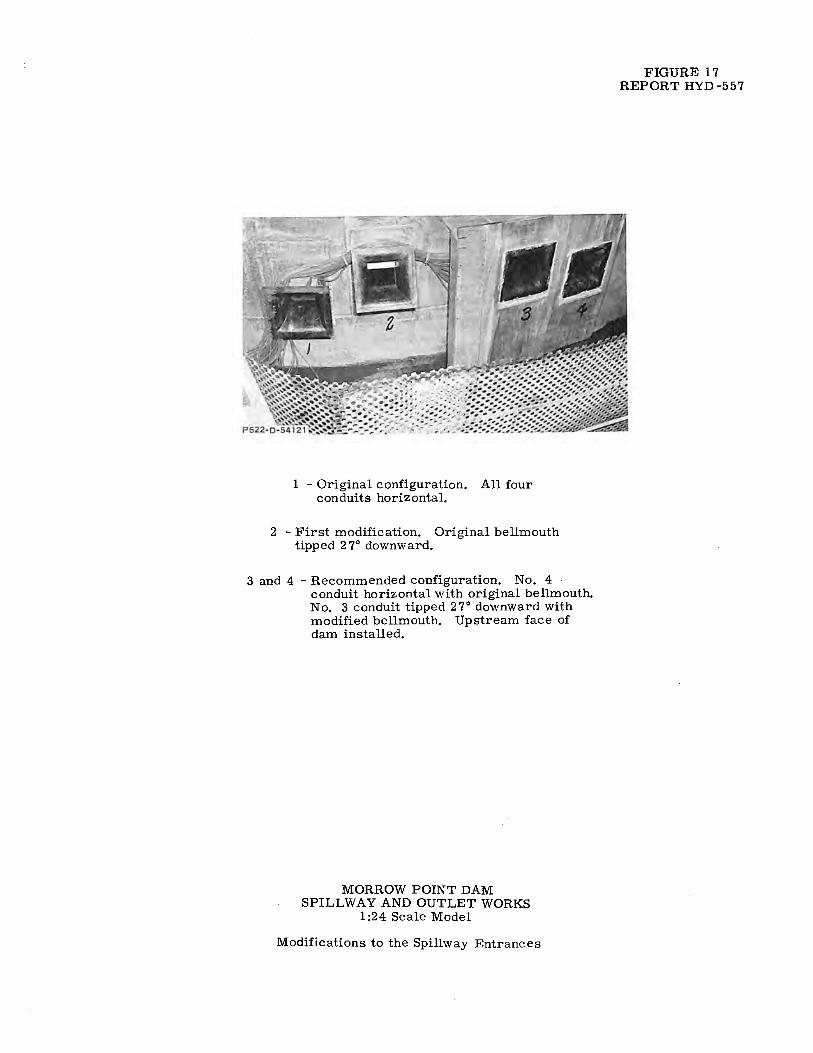
1 - Original configuration. All four conduits horizontal.
2 - First modification. Original bellmouth tipped 2 7° downward.
3 and 4 - Recommended configuration. No. 4 conduit horizontal with original bellmouth. No. 3 conduit tipped 27° downward with modified bellmouth. Upstream face of dam installed.
MORROW POINT DAM SPILLWAY AND OUTLET WORKS
1 :24 Scale Model
Modifications to the Spillway Entrances
FIGURE 17 REPORT HYD-557

707
1->-
L>A
B ,>-
k->-
INSIDE BELLMOUTH
66 68
8 16
64 I 1.,..----Seporotion ,,
><.
OUT SIDE BELLMOUTH
10 15 20
LENGTH SCALE - IN FEET I PROTOTYPE I
10 20 30 40
25
MAXIMUM RESERVOIR ELEVATION - 7165.0 GATES OPEN 100 PERCENT
30
50
PRESSURE SCALE - IN FEET (PROTOTYPE I OF WATER
I I I
--'" I !
'-- Row A Nos. 1-8
,,- Row C ' Nos. 17-23.62
' ',~ I I
SECTION A-A
I
I I I
/'i ' I
'-- Row A Nos. 31-37,64,66
,-- Row C ,' Nos. 45-51,59-: 61,63,65
',~ I I I I
SECTION B-B
--Row B Nos. 9-16
--Row D Nos. 24-30
-L-Row B Nos. 38 -44, 68
,-Row D
l ____ ,i __ Nos. 52-58,67
MORROW POINT DAM SPILLWAY
: 24 SCALE MODEL
RECOMMENDED DESIGN
WATER MANOMETER PRESSURES IN BELLMOUTH ENTRANCES
FIGURE 18 REPORT HYD-557
INSIDE BELLMOUTH
..,,----Separation
59
OUTSIDE BELLMOUTH
NORMAL RESERVOIR ELEVATION - 7160.0 GATES OPEN 100 PERCENT
NOTES
o Top. <t_ piezometers ( Row Al o Top, right corner piezometers ( Row B) • Bottom, <t_ piezometers ( Row Cl d Side, <t_ or bottom, right corner piezometers (Row D)
Pressures plotted perpendicular to profile with positive pressure5 towards <t_ of conduits

A. Spwy. Q = 20,000 cfs O. W. Q = 1, 5'00 cfs P,P. Q= 5,200cfs
B. Spwy. Q = 40,000 cfs 0, W. Q = 1,500 cfs P. P. Q = 5, 2 00 cfs
MORROW POINT DAM SPILLWAY AND OUTLET WORKS
· 1 :24 Scale Model
Revised Alternate Design Stilling Basin and Tailrace Flow Conditions
FIGURE 19 REPORT HYD-557
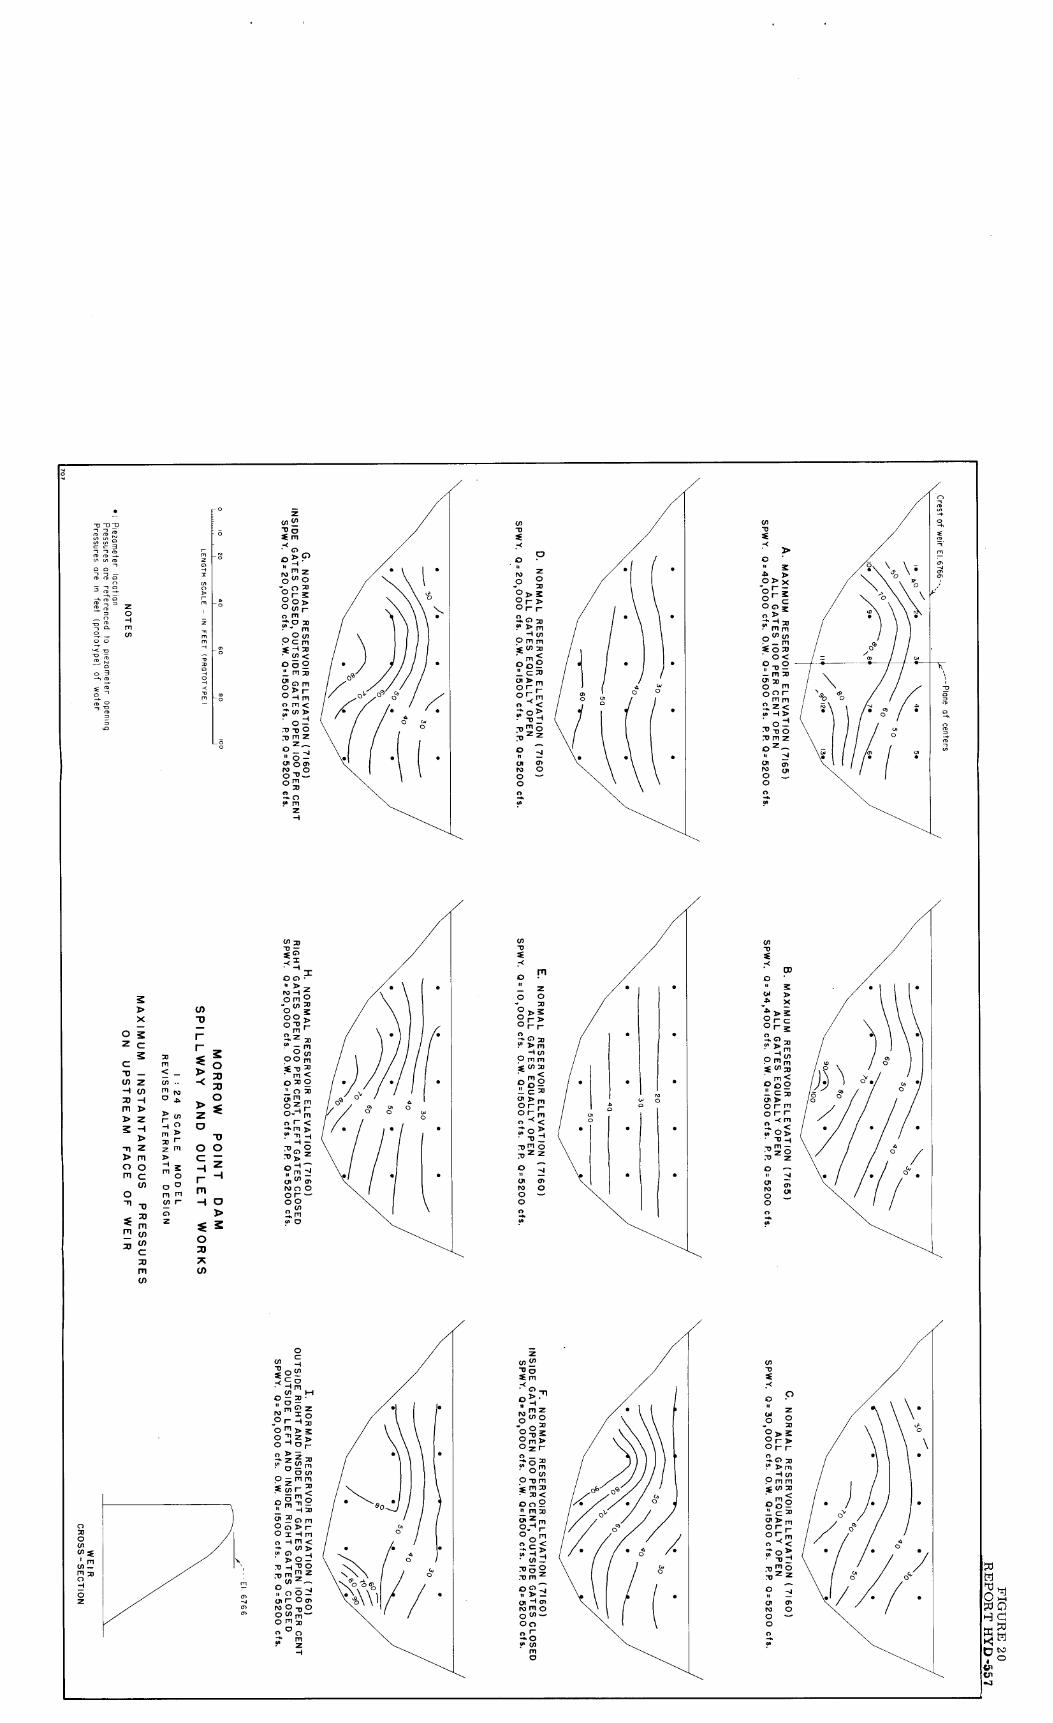
(I) 0
O rn
z O 0 0 0 r > o r r
• >m • xi
w p m m
O 0 0 ▪ C CM > m Or r.o r- m 0 C 4C
• .1./ 21m 3 z z
0
* SP
00
Z9
=0
0
0
*0 M
7< D. 0
" Z 0▪ W 0
0 0 m > 0 z r a • 0 m 9 -0 m * m • xi < 0 o 0 • m
z rn • r O m n < -•• C
:0 0 0 m C) • D
• -I a) 0CA
m 0
00 n r 0 r mu)
0
0 •
O • o 0 x, 0 r > 0 r r
G) Dm
cn P m m
cri
m < 0 0 ▪ c
a m o r r 0 r m O << ;,;" 0 > • -a -1 70 m z z
'SP
00
Z9
=0
0
how
EI ,%) M1• 1-1 0 •
o m = Z
or -xi
0 m o z o - or O > 2
z m 0 a w
p m m cc) r - m O m0m 0
xi
-0M OM 00 r 0 2 m O m <
cn r D O-
M Z Z
• 43 0 3 •-4 p rom
cn N) 0 -o 0 0, 0 ITI
0 M
• 0
5" Z
C) 0
m rn C)
0 z
`11
O z
INV3H1Sdn
<rn _ cn
0 0
> W r m ▪ >
1- z a] rn 0 0
C— rn- M -1 Z 0 0 M M co r • 0
• * 0
U)
0 M
7( 0
0 /'24 te •
rn, Z of/3 0
"0 C") 23 O ra 0 0 3, 0 o) o • 0 MI
m m 0 w
C m S -I 73
-0 0
D orn 0o x„ r 0 _1 m 0 M <
(/) > •
0 - 71 -0 0 :0 m z
Z 0 - -4 • 0 w 0 N 0 0 m •-• 0 ri
▪ o M z
-a *
O G)- • • > ▪ z 0 m °
cn 0 00 3> 0 -0 mr 2 z
- m o P 0 m
-13 rri 0 xi o
• m
oz rrn O r, n r < m
- - 713 0
°> Z
0 m-1 -
0) NC) 0 0 r 0 0
M r 0
•
0 0
• •
• •
-0
0 •
O▪ °
° > 3 Ora o r
20 • >
xm
P m cf, m s xi
m• < 0 0 0 "_ c am • > m o r r. or m n <
0 • -0
m Z z
0 • (A 0 1.0 0 O --** 0 c.)
LE
NG
TH
SC
AL
E - IN
FE
ET
(PR
OT
OT
YPE
)
A
-c
O
'
•
A ),
0 To x
r —
o
o
O
>
•
mm
w
0
•
M
0 73
0<
0 0
II
13
•-•
_ m om CT
xi
O
M
0 0
m m 2, z
< co -1
D •
0 -I
M 13 0
M Z
Z
01
0
O
0
-0
▪
co
O
'
•
to >
x
.1 g%
0
r c
r
o
f."
D
m
P m
m
* u)
m
0
0 0
•
5
cam
>
o
r m
0 r r
n -C m a
l.
OD
7 0
0
Z
ti
'Sp
00
ZS
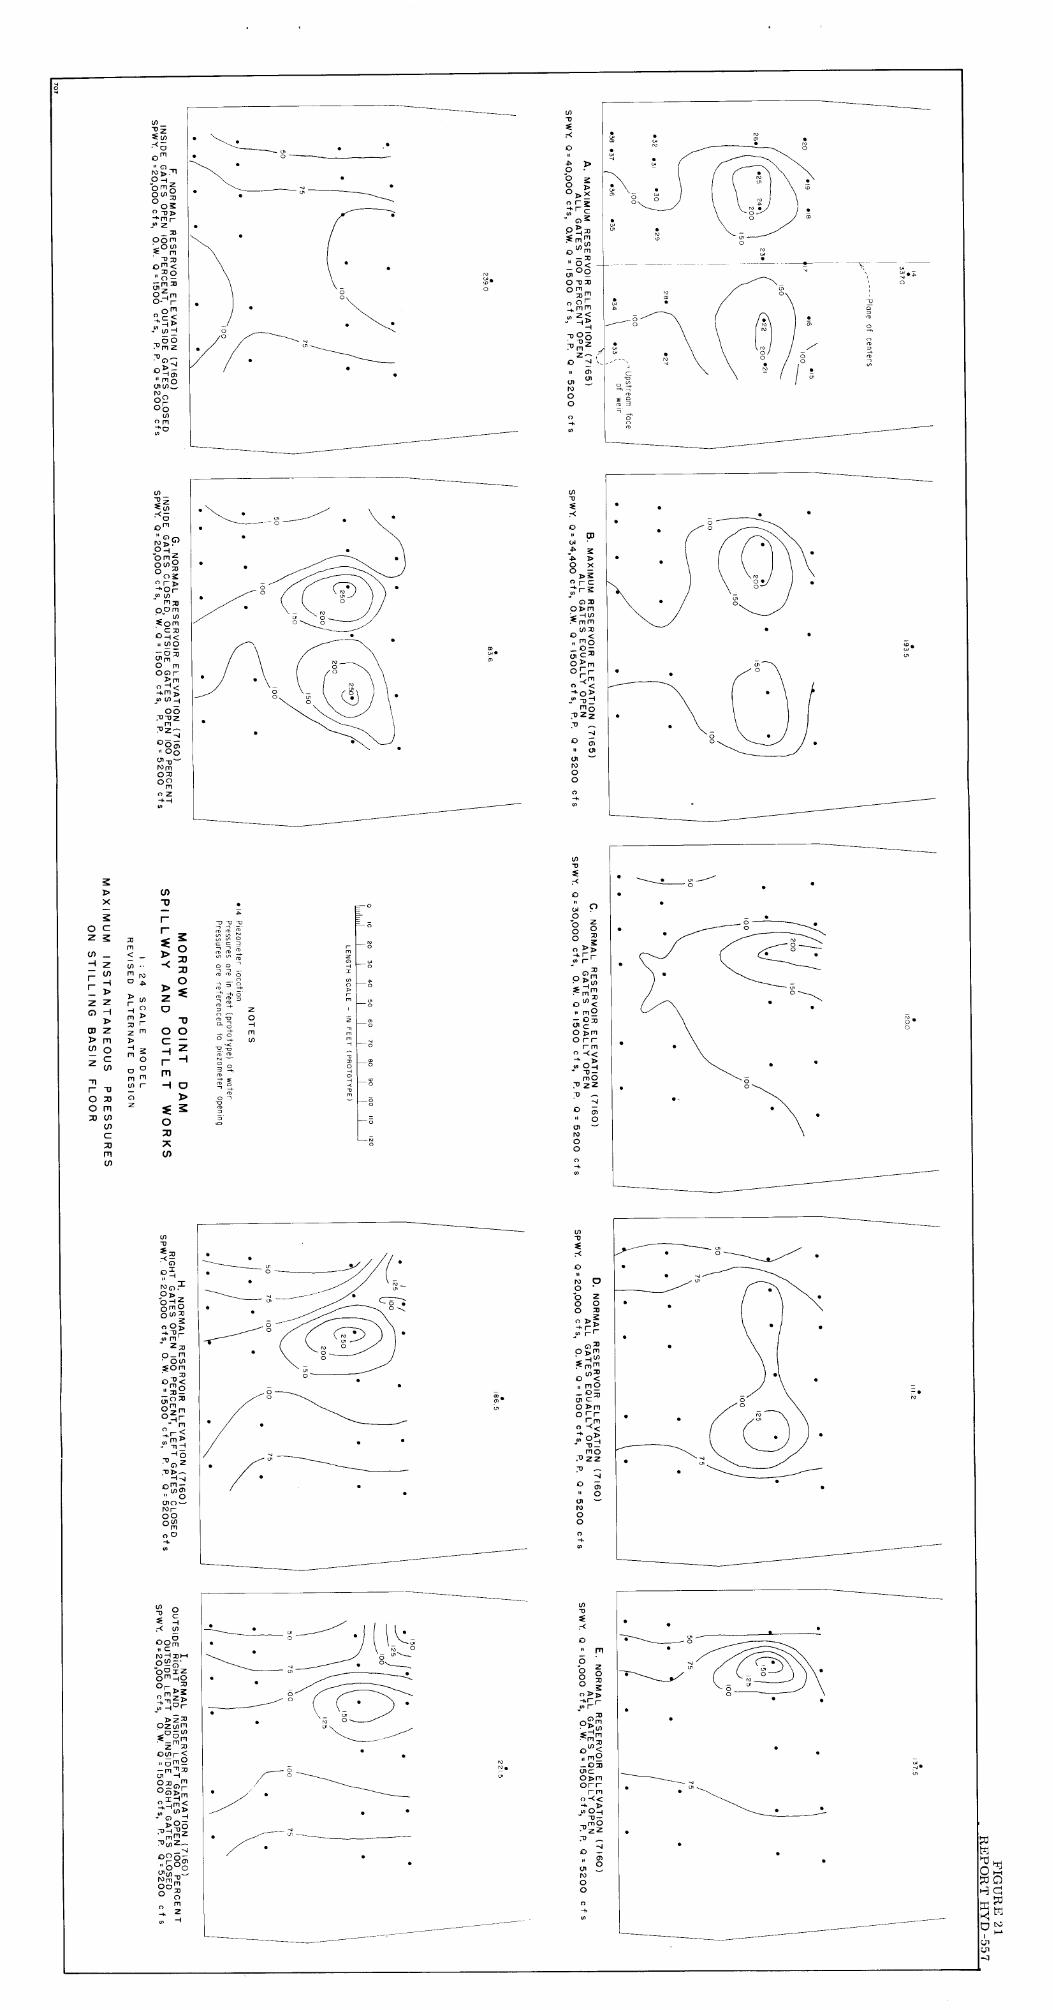
O g O r, 0 > x o r E
•c
og P )473 *m rirnl 0 m - 0 <
- 0 r.) Cfl O <4404 • 0D2 o 0 m
0 0 r ▪ M cr, 41
—1 70 0 0
Z
0 -4 11 & CT
N 0
sJa
{uao
au
pld
-
0 z
9N
i-1
111
S
•
•
• •
c 0 > m orr
r m -<<
)> t.n 0 —I
-1) M 0
• 444 Z Z
O „
0 0
00'0 1 =
0
),MdS
z 0 2
2, wrr
G-)m 0)›.1 • en
• 0 < • M -053
• Cr,
•
•
•
• 0
0 0▪ 0 m o C N -1 2 )-I 0 .4P a
440 0 O M -10 0r
n.,>g 0"z > 0 -.Pr
r"Z2 0z wm for u) z im
ocnr< it m2
o2„r1 oorsr
rn _I wl mr, 0 0 >06
7°71-Im.°z 70u)z-
--4 a on - 1- 0)
0°0 N m 1, „„ 0 0 " 0 0 • m
O▪ -I
0
U) _ -0
o o m
N > 0 -1 ° z 71 ow m
0 003 -0
Z
8 rn
'o m -0 xi
Om < 0 0 _
- pl 4)4 O hm 0• r
m C < :-13" - -I
CO :Trn z 7)0 0 >
0) ° m0 CA ...-No or
U) o m
•
•
• •
•
•
•
rTh
•
•
•
•
U) Z
C r"
N 0
> -1 M Z
O w 0 003
r > -*or 0 (J)
m rn
0 m
01< n en
m o o r
Dm • < ▪ >
00 :0 -0Z
frl :0 2
O En ▪ 0 0
N m 02 00 oz
•
(f)
0 CD
(.• • g >
O X 0 -
>K r
02 o>m
: -̀ mm (Am
O < mo _0
m -
C 0_3> m 0' r m
-• < < '0>
m 022 70
-4 O o-n
CT 44-4 N 0 0
cn
•
3IVN83.1.1V
N
o D 0
U) Z
0 0 C
3 Z 0 r
o rri m rn cn r 0
z
0
(1)
• • 6 0
`8•
0
W C7 O
0 >> -k
• r 0 2
pr4,1 fmm
0 0< m0
-02 cn 0 >m o rr
r m 0 >
Jo 01 1) m0
° ZZ
0 -0) o
NO 0
-
O
0 *713
o-
0> '0-1Z OM° 00:4X
0 > -1.13
rrl z,
P—m *on 0 -0 <
—002 02m
< -•m >
-10 73 0 z
-.4 O m "
ni " 0
(..• is) r 00 ON
N
0
N o O • O z O o O o ja m r
H r 02
P>m :=r 11 O <
mo (Tic o>m orr rm
"< < >
M 0 0zz :0 0 rn " 0
N 0 0 fi cfl
•
- •
• •
• •
• •
•
•
• •

A. Before streamlining
B. After streamlining
Powerplant Discharge = 5,200 cfs
MORROW POINT DAM SPILLWAY AND OUTLET WORKS
1 :24 Scale Model
Revised Alternate Design Tailrace Topography Before
and After Streamlining
FIGURE 22 REPORT HYD-557

FIGURE 23 REPORT HYD-557
A. Spwy. Q = 20,000 cfs O. W. Q = 1,500 cfs P. P. Q = 5,200 cfs
B. Spwy. Q = 40,000 cfs O. W. Q = 1,500 cfs P.P. Q = 5,200 cfs
MORROW POINT DAM SPILLWAY AND OUTLET WORKS
1 :24 Scale Model
Revised Alternate Design Flow Constriction Immediately
Downstream from Weir

MORROW POINT DAM SPILLWAY AND OUTLET WORKS
1 :24 Scale Model
Revised Alternate Design Excavated Right Channel Bank
Spwy. Q = 8,600 cfs, 0. W. Q = 1,500 cfs, P.P. Q = 5,200 cfs
FIGURE 24 REPORT HYD-557
I

!
FIGURE 25 REPORT HYD-557
MORROW POINT DAM SPILLWAY AND OUTLET WORKS
1 :24 Scale Model
Revised Alternate Design Excavated Right Channel Bank
Spwy. Q = 17,200 cfs, O. W. Q = 1,500 cfs, P. P. Q = 5,200 cfs

MORROW POINT DAM SPILLWAY AND OUTLET WORKS
1 :24 Scale Model
Revised Alternate Design Excavated Right Channel Bank
Spwy. Q = 25,800 cfs, O. W. Q = 1,500 cfs, P.P. Q = 5,200Cfs
FIGURE 26 REPORT HYD-557

FIGURE 27 REPORT HYD-557
MORROW POINT DAM SPILLWAY AND OUTLET WORKS
1 :24 Scale Model
Revised Alternate Design Excavated Right Channel Bank
Spwy. Q = 34,400 cfs, O. W. Q = 1,500 cfs, P.P. Q = 5,200 cfs

Looking upstream.
Looking downstream.
MORROW POINT DAM SPILLWAY ANO.OUTLET WORKS
1 :24 Scaile Model
Recommended Design Removal of Weir Piers and
Extension of Stilling Basin Lining
FIGURE 28 REPORT HYD-557
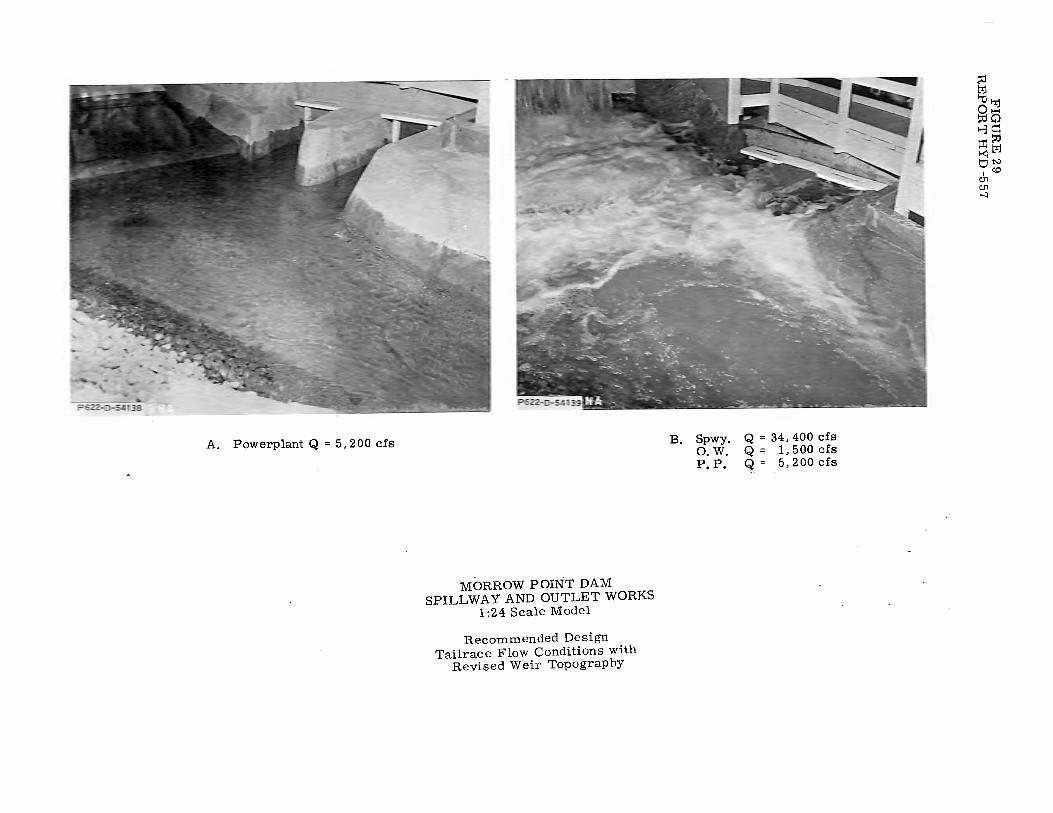
A. Powerplant Q = 5,200 cfs
MORROW POINT DAM SPILLWAY AND OUTLET WORKS
1:24 Scale Model
Recommended Design Tailrace Flow Conditions with
Revised Weir Topography
B. Spwy. Q = 34,400 cfs O. W. Q = 1, 5 00 cfs P. P. Q = 5, 2 00 cfs
~ t:i:J 11:IP.Cj
~s t-:10
~~ t:J i,.:)
I to CJ1 CJ1 ...:J

Spwy. Q = 8,600 cfs O. W. Q = 1, 500 cfs P.P. Q:;: 5,200 cfs
FIGURE 30 REPORT HYD-557
Spwy. Q = 34,400 cfs O. W. Q = 1,500 cfs P,P. Q= 5,200cfs
MORROW POINT DAM SPILLWAY AND OUTLET WORKS
1 :24 Scale Model
Recommended Design Stilling Basin Flow Conditions
with Revised Weir Topography

FIGURE 31 REPORT HYD-557
Spwy. Q = 26,000 cfs
Spwy. Q = 31~ 000 cfs
Spwy. Q = 32,900 cfs
MORROW POINT DAM SPILLWAY AND OUTLET WORKS
1 :24 Scale Model
Recommended Design Flood Wall Tests
O. W. Q = 1,500 cfs P.P. Q = 5,200 cfs

O z
C)
o
,,,
0 z
0 m o 3 4' 3 (s) Z rn 0
O • > r -0 m O m 0 0
NIV3H1Sdn
LEN
GT
H S
CALE
- IN F
EE
T (P
RO
TO
TY
PE
)
0 c C) -I •
z 00 m 0
r • m
* 0 m m
0 z < o _ _ Z CO N3 —
0 ° r 0 m m o <
N —I —1 R1
z C)
o a)
m0 0"
I a) •
z I 0 - M
3 0 D r
u) rn * w m <0 m -,, 0 1'9
z 0 r
Nm m O m• r
Nan
_1 N O
r 0 ▪ ""•1 —
m 00
3 -4 o C . o z 0 0 m ). 44. z r-
co arm * m m
- M - Z < _ 0
.,-•1 0 71 m r,
O , 0 r.
- m • < 01 -I
0 - -00 M Z Z
5 o s
2 O z -I
O 2
> r r> r
-0 rTi
r< m fri 0 (n " m 0 -.I 0 M
rrl Orr o r m O j <
O m o zz H
O
rrl
0 3 3>
r rx" r
-o 0 23 * > r< m ON E
rn 03 2 Y, 1:7) > m Orr 0 r m 0 -"( <
0 > co
— m0 zz
H
oCT)
T co • a z
o 0 3
r>
o rTri -4 Z 73 0. 0 2
▪ C 71 N N rn o 3 r ° m m O < -OD D
m0 (i) Z 0 — r O;
0
> x r
co 0 -13 > *m m • N
O - 0 < a 0 0 o -0 Tr, b m o 2 m o o r
mm o z <
o m z
a)
3
)4. E r c
(.0 r 7'O 73
In <1 0)
fr1 0N 2 o < (.0 0 °
0 r 171 0 r r O -4
0 > -o m 0 z z
H a) 01
z 73
T. 1, r r r
-o al * > rc; 7‹ m
0 01 rn O_
cn 0 C Co > m Orr 0 r m • < 00 -I
m0 zz
O
C 3 Z
m o r (11 0 rri
G.)--
* c 0 2:1
Cl)
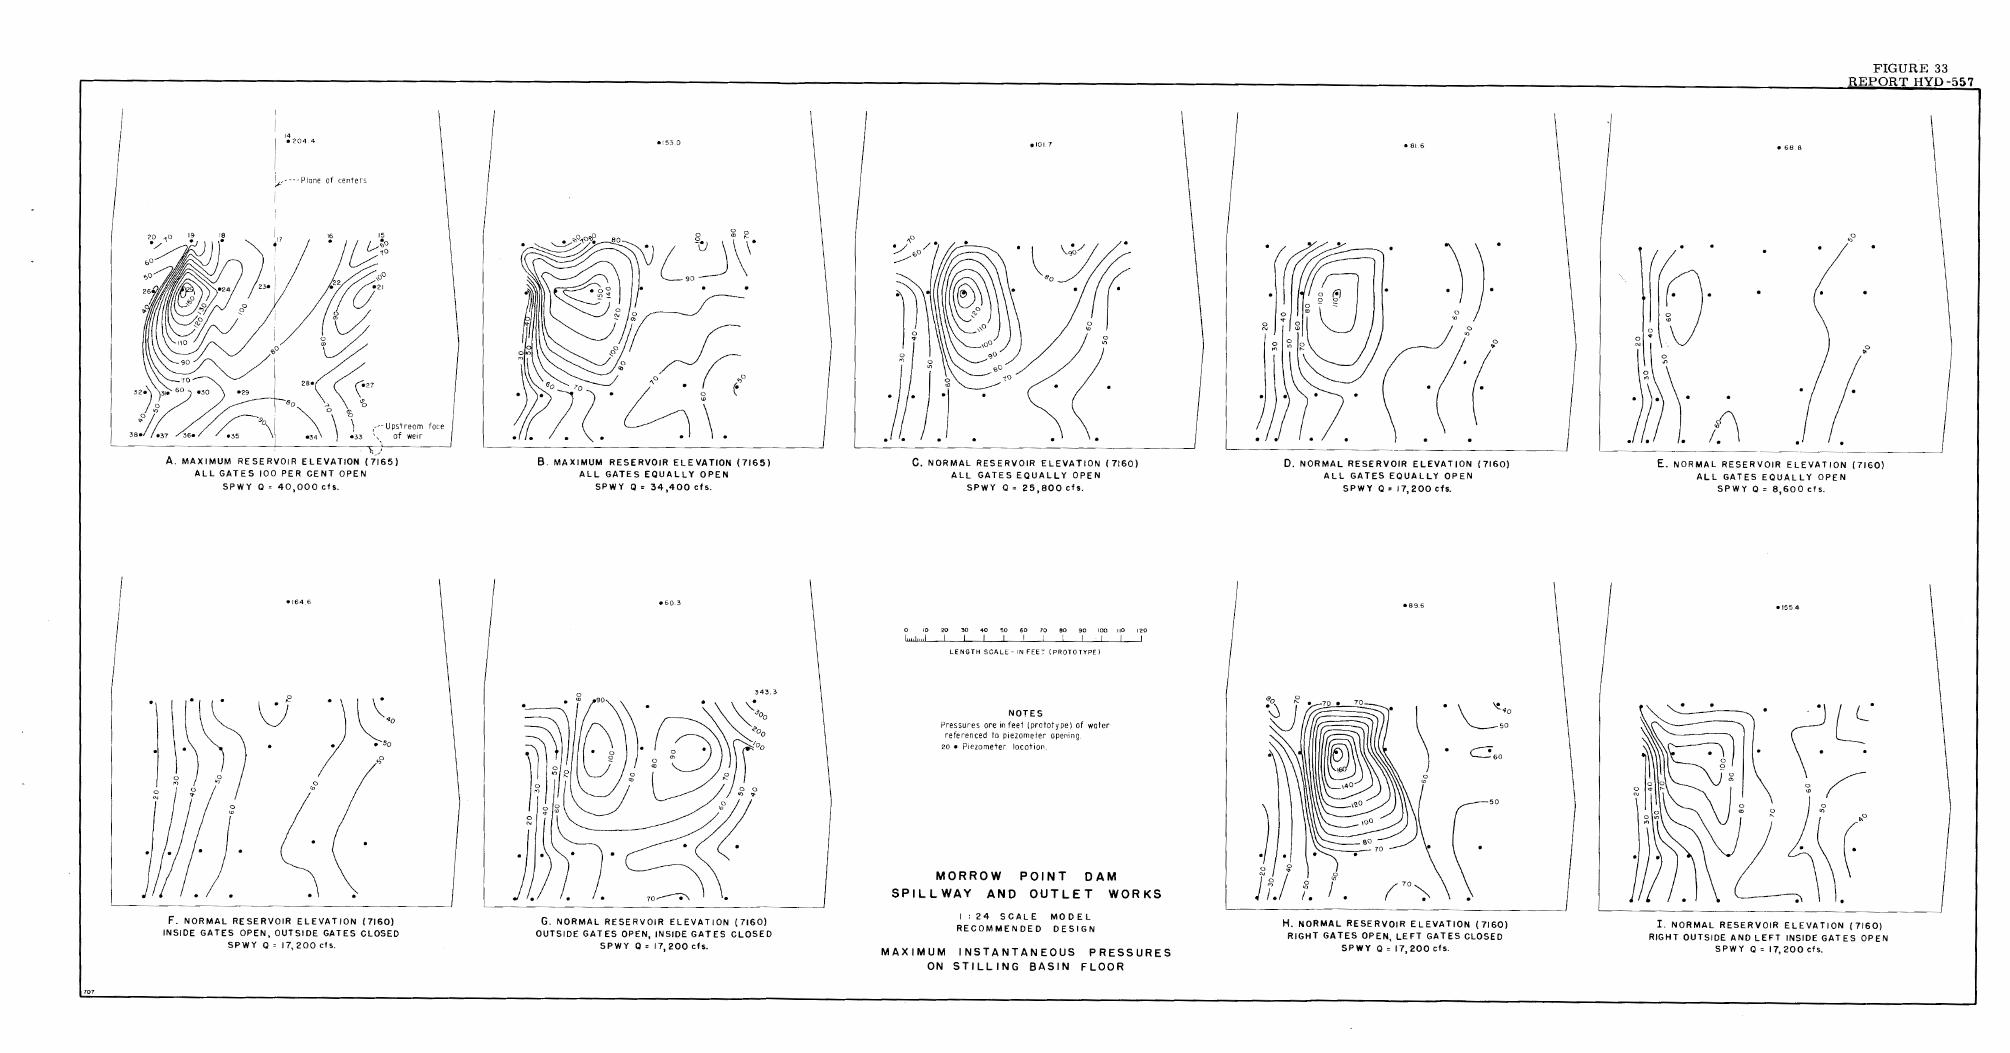
107
0
"'
14 • 204 4
~----Plane of centers
16 15 • , I v~o ~10
,':~oO ·/()~'
0i - "' ~" •o"' (, \ \
_,\ \
0
1 .--- Upstream face • 34 } • 33 1
,, of we1 r
, '-'
A. MAXIMUM RESERVOIR ELEVATION (7165)
ALL GATES 100 PER CENT OPEN
SPWY Q = 40,000 cfs.
\-\~ ,,,o
•164_6
0 0
"'
)~:o
. ' . F. NORMAL RESERVOIR ELEVATION (7160)
INSIDE GATES OPEN, OUTSIDE GATES CLOSED
SPWY Q = 17,200 cfs.
•153.0
8. MAXIMUM RESERVOIR ELEVATION (7165)
ALL GATES EQUALLY OPEN
SPWY Q = 34,400 cfs,
•60.3
343. 3
f. 7 0 ~
G. NORMAL RESERVOIR ELEVATION (7160)
OUTSIDE GATES OPEN, INSIDE GATES CLOSED
SPWY Q = 17,200 cfs.
TI
}i} . . .
elOI. 7
. \.0~1( "'
0
"'
C. NORMAL RESERVOIR ELEVATION ( 7160)
ALL GATES EQUALLY OPEN
SPWY Q = 25,800 cfs.
0 10 20 30 40 50 60 70 80 90 \00 110 120
LENGTH SCALE- IN FEE, (PROTOTYPE)
NOTES
Pressures are in feet (prototype) of water referenced to piezometer opening
20 • Piezometer location.
MORROW POINT DAM
SPILLWAY AND OUTLET WORKS
I: 24 SCALE MODEL
RECOMMENDED DESIGN
MAXIMUM INSTANTANEOUS PRESSURES
ON STILLING BASIN FLOOR
• 81.6
) )-· 0
"'
'( 0
"
0. NORMAL RESERVOIR ELEVATION (7160)
ALL GATES EQUALLY OPEN
)I' J f.l 1.
SPWY Q = 17,200 cfs_
• 89.6
. ~-•o 50
0
"' I • (70~
c60
50
H. NORMAL RESERVOIR ELEVATION (7160)
RIGHT GATES OPEN, LEFT GATES CLOSED
SPWY Q = 17,200 cfs.
• 68. 8
. .
FIGURE 33 REPORT HYD -55 7
,,,o
f(O"' ___ · · o\"' ~ I ,.o
0
"'
j)\ /1 E. NORMAL RESERVOIR ELEVATION (7160)
ALL GATES EQUALLY OPEN
SPWY Q = 8,600 cfs.
• 155.4
. . . ~ L;' ~ ~ , I 0
0 <r, 0 ,_ . ~
(-
I. NORMAL RESERVOIR ELEVATION (7160)
RIGHT OUTSIDE AND LEFT INSIDE GATES OPEN
SPWY Q = 17,200 cfs.
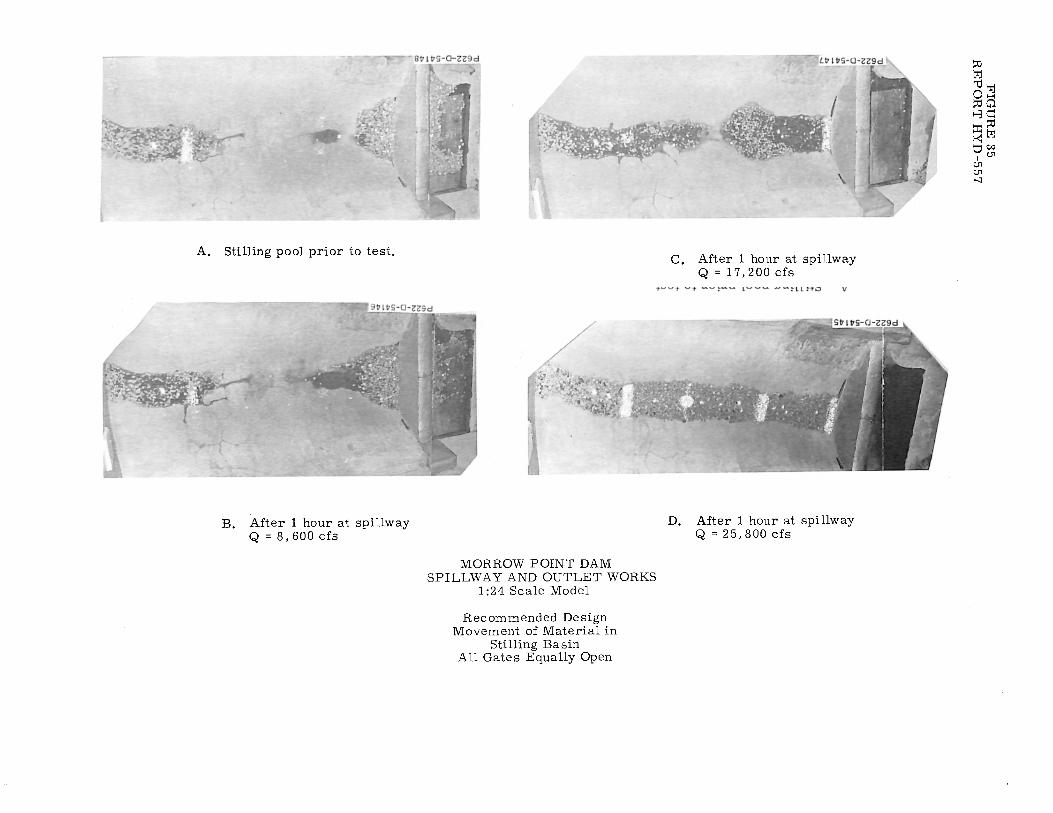
A. Stilling pool prior to test.
B. After 1 hour at spillway Q = 8,600 cfs
MORROW POINT DAM SPILLWAY AND OUTLET WORKS
1 :24 Scale Model
Recommended Design Movement of Material in
Stilling Basin All Gates Equally Open
C. After 1 hour at spillway Q = 17,200 cfs
D. After 1 hour at spillway Q = 25,800 cfs
::0 ·tr.1 t-cl lzj
@c5 t-3 q ::c: ::0 Kl t,tj t:1 ~
I CJ1 CJ1 CJ1 ..::,

707
a: w ~ 12 0 3: LL 0 I- IO 0 w w LL
I 80 0 <[ w ::c 60 w a: ::::> en en 4 o w a: a.. w 20 a.. >-1-0
\ ~
\ \
' ' .....
-
1---
r-,......f-- - PIEZOMETER 24
----------i---_
-------- -------
' ''Pl EZOMETER 30
,-·PIE ZOM ETE R 5 ' ,.. _ _j --- --- ---
--Pl EZOMET ER I I - ....___ I
"""',:_ _ -- ..}_ ---........... ~ .. - ~ .....
""" --' '~
' ' --- ---- --- --- ---
EXPLANATION Weir piezometers Floor piezometers
NOTES Doto for operation with outside
gates 100 percent open, inside gates closed.
Pressures measured above piezometer openings.
Spillway discharge= 11,200 cfs.
I- 0 0 0 er: 10 20 30 40 50 60 70 80 90 100 a.. PERCENT OF TIME
MORROW POINT DAM SPILLWAY AND OUTLET WORKS
I: 24 SCALE MODEL RECOMMENDED DESIGN
FREQUENCY DISTRIBUTION OF IMPACT PRESSURES ON ST ILL ING BASIN FL 00 R A ND WE I R
I~ ~ o:S ~o ~c::: l:r::~ t<l t:i.1 t:i c,.:, ,~ t11 t11 ...:J

A. After 1 hour at spillway· Q = 34,400 cfs
B. After 1 hour at spillway Q = 34, 400 cfs
MORROW POINT DAM SPILLWAY AND OUTLET WORKS
1 :24 Scale Model
. Recommended Design Movement of Material in
Stilling Basin All Gates Equally Open
FIGURE 36 REPORT HYD-557

FIGURE 37 REPORT HYD-557
A. Spillway Q = 40,000 cfs, gates 100% open, reservoir at elevation 7165.
B. Spillway Q = 25,800 cfs, reservoir at elevation 7160.
MORROW POINT DAM SPILLWAY AND OUTLET WORKS
1 :24 Scale Model
Recommended Design Reservoir Flow Patterns

A. Spwy. Q = 40, 000 cfs O. W. Q = 1,500 cfs P,P. Q= 5,200cfs
B. Spwy. Q = 34, 400 cfs 0, W. Q = 1,500 cfs P,P. Q= 5,200cfs
C. Spwy. Q = 25,800 cfs 0, W. Q = 1,500 cfs P. P. Q = 5, 2 00 cfs
MORROW POINT DAM SPILLWAY AND OUTLET WORKS
1 :24 Scale Model
Recommended Design Symmetrical Spillway Operation
FIGURE 38 REPORT HYD-557
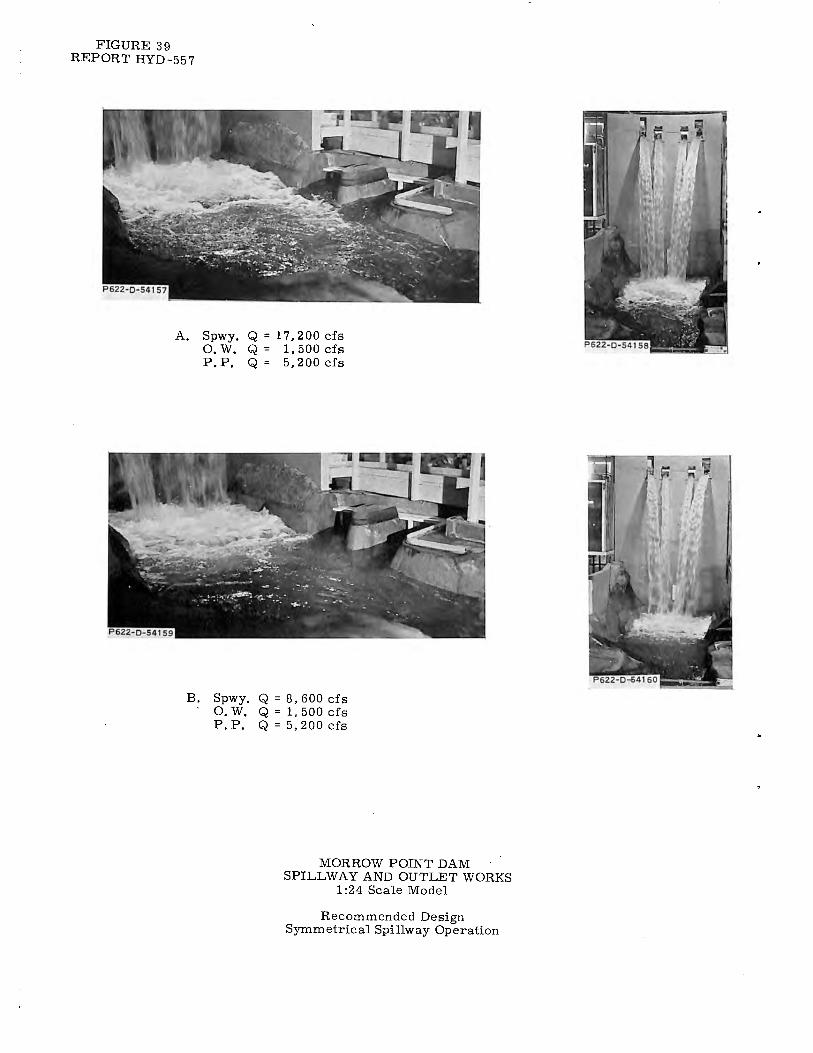
FIGURE 39 REPORT HYD-557
A. Spwy. Q = 17,200 cfs O. W. Q = 1,500 cfs P.P. Q= 5,200cfs
B. Spwy. Q = 8, 600 cfs O. W. Q = 1,500 cfs P.P. Q = 5,200 cfs
MORROW POINT DAM SPILLWAY AND OUTLET WORKS
1 :24 Scale Model
Recommended Design Symmetrical Spillway Operation

A. Powerplant Q = 5,200 cfs
B. Outlet works Q = 1,500 cfs Powerplant Q = 5,200 cfs
MORROW POINT DAM SPILLWAY AND OUTLET WORKS
1 :24 Scale Model
Recommended Design Powerplant Operating Alone, and
Outlet Works and Powerplant Operating
FIGURE 40 REPORT HYD -557

FIGURE 41 REPORT HYD-557
Spwy. Q = 17,200 cfs All photos O. W. Q = 1,500 cfs
P. P. Q = 5,200 cfs
MORROW POINT DAM SPILLWAY AND OUTLET WORKS
1 :24 Scale Model
Recommended Design Symmetrical and Asymmetrical Spillway Operation

Spwy. Q = 17,200 cfs O. W. Q = 1,500 cfs P.P. Q= 5,200cfs
All photos
MORROW POINT DAM SPILLWAY AND OUTLET WORKS
1 :24 Seal~ Model
Recommended Design Asymmetrical Spillway Operation
FIGURE 42 REPORT HYD-557

FIGURE 43 REPORT HYD-557
Spwy. Q = 8,600 cfs 0, W. Q = 1,500 cfs P.P. Q = 5,200 cfs
All photos
MORROW POINT DAM SPILLWAY AND OUTLET WORKS
1:24 Scale Model
Recommended Design Asymmetrical Spillway Operation
.

Spwy. Q = 8,600 cfs O. W. Q = 1, 500 cfs P.P. Q = 5,200 cfs
All photos
MORROW POINT DAM SPILLWAY AND OUTLET WORKS
1 :24 Scale Model
Recommended Design Asymmetrical Spillway Operation
FIGURE 44 REPORT HYO -5 5 7
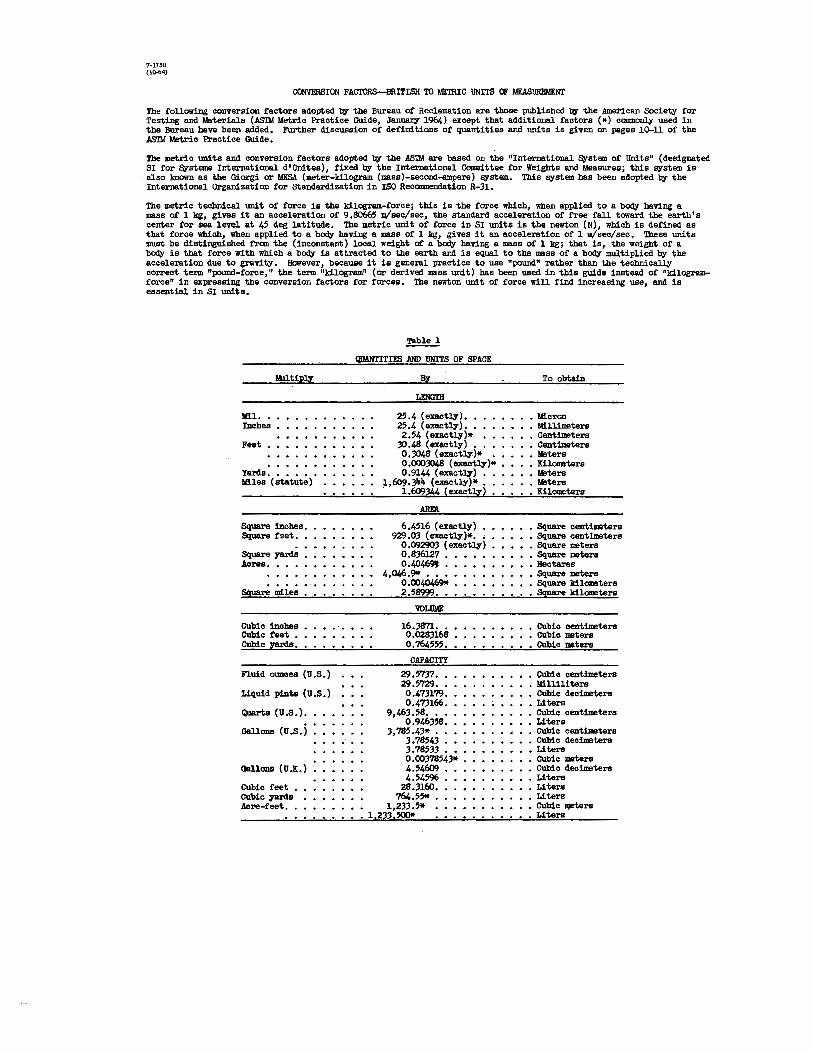
7-1750 (lo-64)
CONVERSION FACTORS-BRITISH TO METRIC UNITS OF MEASUREMENT
The following conversion factors adopted by the Bureau of Reclamation are those published by the American Society for Testing and .Materials (.ASTM Metric Practice Guide, January 1964) except that additional factors (*) commonzy used in the Bureau have been added, Further discussion or definitions or quantities and units is given on pages 10-ll of the ASTMMetric Practice Guide,
The metric units and conversion factors adopted by the ASThl are based on the "International System of Units" (designated SI for Systeme International d'Unites), fixed by the International Committee for Weights and Measures; this system is also lalOWn as the Giorgi or MKSA (meter-kilogram (mass)-second-ampere) system, This system has been adopted by the International Organization for Standardization in ISO Recamnendation R-Jl,
The metric technical unit of' force is the kilogram-force; this is the force which, when applied to a boey having a mass of' 1 kg, gives it an acceleration of 9,80665 111,isec/sec, the standard acceleration of free fall toward the earth's center for sea level at 45 deg latitude, The metric unit or force in SI units is the newton (N), which is defined as that force which, when applied to a boey having a mass of 1 kg, gives it an acceleration of 1 111,isec/sec, These units must be distinguished from the (inconstant) local weight of a bod;y having a mass of 1 kg; that is, the weight of a boey is that force with which a bod;y. is attracted to the llarth and is equal to the mass of a bod;y multiplied by the acceleration due to gravity, However, because it is general practice to use "pound" rather than the technically correct term "pound-force," the term "kilogram" (or derived mass unit) has been used in this guide instead of "kilogramforce" in expressing the conversion factors for forces, The newton unit of force will find increasing use, and is essential in SI units.
Table 1
QIJANTITIFS AND UNITS OF SPACE
Multil?!l !!l To obtain
LENGTH
Mil. 25.4 (exactly). • Micron Inches 25.4 (exactly) •• • l\1:1.llimeters
2,54 (exactly)* • Centimeters Feet • )0.48 (exactly) •.• • Centimeters
O. 3048 ( exactly)• • • Miters 0 .0003048 (exactly)* • Kilometers
Yards ••••• 0.9144 (exactly) • • Meters Miles (statute) 1,609.3'14 (exactly}* • • Meters
· 1.609344 ( exact!ll • Kilometers
AREA.
Square inches. 6.4516 (exactly} • Square centimeters Square feet. 929,03 (exactly}*, • • Square centimeters
0.092903 (exactly) • Square meters Square yards 0.836127 • • Square meters Acres . ••. 0 .4()/,691j • • Hectares
4,046.9* ••• • Square meters 0 .0040469* • Square kilometers
Square miles 2.58999 •• • Square kilometers
VOLUME
Cubic inches 16.3871 •• • Cubic centimeters Cubic feet • 0.0283168 • Cubic meters Cubic ~s. 0.764555. • Cubic meters
CAPACITY Fluid ounces (U .s.) 29.5737 •• • Cubic centimeters
29.5729 •• • l\1:1.llili ters Liquid pints (U.S.) 0.473179. • Cubic decimeters
0.473166. • Liters Quarts (U.S.). 9,463.58 ••• • Cubic centimeters
Gallons (U .s. ) 0.946358. • Liters
3,785.43* •• • Cubic centimeters 3.78543 • • Cubic decimeters 3.78533 •• • Liters 0.00378543* • Cubic meters
Gallons (U.K.) 4.54609 • Cubic decimeters 4,54596 • Liters
Cubic feet • 28.3160. • Liters Cubic yards 764.55* • Liters Acre-feet, 1,233.5* • Cubic 1119ters
• l,2JJ,500* • Liters

!.llllti£l.
Grains (1/7,000 lb) •• , 'fl'03' ounces (480 grains). Ounoes (avdp) • • • • • POllllds (avdp) • • • • • Short tons (2,000 lb) •
Leg tons (2.~ lb) '.
Pounds par square inch
Pounds per square root
Ounoes per cubic inch • · • • POllllds per cubic foot • • •
TCIIIS (1m,g) per cubic :;&rd·
Inch-pounds
Foct-pc,mds
Poet-pounds ~ ~h' Ounoe-iDcllas ..........
Feet per seccm4
Feet per ;year • • Ml.lee per hour
Feet :per secQlld"l.
!'l
64. '/9891. ( exaotl;r). 31.1035 •••••• 28.3495 ••••••• 0.45359237 (exaot:cy)
907.1115 •••• • 0. 90718, • • • .1,016.05 • • • • , • I •
JOIICE/~ .a.mom.· .. 0.689476 • , • 4.88243 , ••
47.8803 • • • • !,!ASS/VOL'llME (DINSITI)
1.72999 ••• • 16.0185 • '• • · 0.0160185. • •• 1.32894. • • I '
MASS/CAPACITI
7.4893 •.• , •• 6.2362 •• , , ,
119.1129 • , , , , , • 99.779 , , , •• , ,
BENDING YJMENT ORlQ!!!I!!!.
0.011521 , .!t., 1.12985 X .WW 0,138255 • , , 1,35582 X 10⁷ 5,4431 , , • ,
72,008 , , ••
~ITX' 30.48 (exactl;r) •• 0.3048 (axactl;r)• 0 • 96'873 X l,()-f>,, • • 1.609344 (exaot:cy) • 0,44794 ( exaotl.y)
ACOELERATION*
cubic feet per aeocm4 ( aeccmd• feet) •••••••••••• 0 ,028317*.
0,4719 •• 9.06309 •
OUbic feet per m1mlte , • • CJaUans cu.s,) per mlnuta •
I!!!!!..1l QUANTITIES .AHD UNITS OF Ml!CIWIICJI;
To obtain
• Milligrams • Grama • Grams • Kilograms • Kilograms • Matric tcms • Kilograms
• Kilograms par square clllltillleter • Newtons par square centimeter • Kilograms per square meter • Newtons per aguare ~~
, Grams per cubic centimeter , Kilograms per cubic meter , Grams per cubic centimeter • Grams per cubic Cel!timetsr
• Grams per liter • Orama par liter • Orama per liter • Orams~tsr
• Meter-kilograms , Centiimter~s • Meter-kilograms , Centimeter~s , centimllter-kilograms per clllltillleter .. Qnm-091!-l)imetera
, Cent1meters par aeocm4 , lfetars per aeccm4 • Centimeters par aeocmd • KilcmaterB per hour • Jlaters per aaccmd
• Meters per aaccm4"l.
• Cubic meters per seccm4 • Li tars par aeocmd • Litare per ~(!1!4
~tiply 117
PORCI*
POllllds • 0.453592* ••• 4.4482* ••• · • 4.4482 X 10•5* •
WQBK AJm IHDQY*
British thermal units (Btu).
Btu par pound.
• 0.252* ••••• • 1,055.06 ••••••
2 .326 ( exact:cy). 1.35582* ••• Foot-pounds.
H01'IHIJIOllll1' , ' Btu par boUl' • • • • Poet-pounds per saccm4
Btu in./1,r tt2 deg F (k, tbe1'1181 ccmduoti vi v)
Btu tt/1,r tt2 deg F • , • • •
B~~~~C'.~ Deg F bl' tt2/Bi,;_ (R; ~ •
resistance) • • • • • • • • • Btu/lb deg F ( c, heat capaoi v), Btu/lb deg F • •. • • • • • • , , n2/l,r (thermal dif'tusivit.,)
Graina/1,r tt2 (water vapor t1'111111111lsaian) • • • • • •
Pel'IIIII ( pel'lllllenCe) • • • • • Perm-inches (permeability)
».il~ Cubic feet par square toot per
dq (seepage) • • ' • • • ' • Pound-eeccmds per square toot
( viscoai v). , . . . , . . . . . Square feet per aeccm4 (viscosity) Fahrellhei-t degrees ( ohenp )• • Volta per mil ••••••••• LIIIDIIIIB per square foot (toot-
candlea) Obm-airouler ml.la par toot • 111.llicuries par cubic toot • 141.ll.iampa per square toot Gallana per square ;yard • • PQUll48 :per :!Doh. • • • • , •
J'!lWJII 745,700.
0 .29'J(111 • 1.3'582 •
~~FIR
1.442 • o.~. l.4,880tt
o.'68 • 4.882 •
1.761 • 4.1868 • 1.000* • 0.2581 • , 0.09290* ,
WATER VAPQR TJWB,IISSimi
16.7 • o.6,9 1.67.
!!'!!!!.lli. ~~nr.,_ .AHD l!NllS
!I.
304,8* •••
4.8824* •• , • , 0.02903* (exact:cy) 5/9 exactl;r. 0,03937. ,
10.764 •• 0.001662 •
35.3147* • 10.7639* •
4.527219* 0.1785~
To obtain
Kilograms Newtons l?ll!!S
• Kilogram calories • Joules • Jmles per 11'111'1 ,Joul.e_!I_
• Watts • Watts , Watts
• Milli'IIBtts/cm deg C • Kg cal/1,r m deg C .Kgcalm/hrm2degC
• Jlilli'118tta/cm2 deg C • Kg cal/1,r m2 deg C
• Deg o cm2/milliwatt • J/g deg 0 • oal./srem deg o • om2/aec :.Jf1JE.
• Orams/24 br m2 • Jlatric pel'IIIII • Jlatric pel'lll-oentimete:I;"-'!
To obtail!
• Liters per square meter par dq
• Kilogram aeccmd per square meter , Square metare per aeoand • Oelaiua or ltelvin degrees (cbange)* .• Kilovolts per millimeter
• LumDs per square meter • Ohm-square millimeters per meter • Millicuriea par oubic meter • Millillll!PB per square meter • Li tere per square meter • Kilograms per c•imeter
GPO 845-237

ABSTRACT
The preliminary design of an overflow spillway at the crest of the dam and a slide-gate-controlled outlet works near the dam base was abandoned because of undesirable fl.ow conditions in the stilling basin resulting from high velocity effl:µx from the outlet works. An alternate design, consisting of four fixed-wheel gate-controlled outlets near the dam crest and a small outlet works near the base, was recommended following several modifications. A 1:24 scale model was used in developing the design of the spillway and to determine the hydraulic operating characteristics of the recommended freefall orifice-type spillway, slide-gate controlled outlet works, and tailrace channels of the underground powerplant. Comprehensive data were obtained concerning pressure distribution in the spillway conduits and bellmouth entrances, on the stilling basin floor, and on the stilling basin weir. Minor modifications were made to the topography in the tailrace area to improve flow conditions during large spillway discharges. The stability of riprap protection was -determined, and tests were made concerning movement of material in the stilling pool. Operating characteristics of all features of the recommended design were observed.
ABSTRACT
The preliminary design of an overflow spillway at the crest of the dam and a slide-gate-controlled outlet works near the dam base was abandoned because of undesirable flow _conditions in the stilling basin resulting from high velocity efflux from the outlet works. An alternate design, consisting of four fixed-wheel gate-controlled outlets near the dam crest and a small outlet works near the base, was recommended following several modifications. A 1:24 scale model was used in developing the design of the spillway and to determine the hydraulic operating characteristics of the recommended freefall orifice-type spillway, slide-gate controlled outlet works, and tailrace channels of the underground powerplant. Comprehensive data were obtained concerning pressure distribution in the spillway conduits and bellmouth entrances, on the stilling basin floor, and on the stilling basin weir. Minor modifications were made to the topography in the tailrace area to improve flow conditions during large spillway discharges. The stability of riprap protection was determined, and tests were made concerning movement of material in the stilling pool. Operating characteristics of all features of the recommended design were observed.
I I ,1
,1
I I ) I I ,1
I ·1
I I I I I I I I I I I I I I I
':
I I I I I I I I (
ABSTRACT
The preliminary design of an overflow spillway at the crest of the dam and a slide-gate-controlled outlet works near the dam base was abandoned because of undesirable flow conditions in the stilling basin resulting from high velocity efflux from the outlet works. An alternate design, consisting of four fixed-wheel gate-controlled outlets near the dam crest and a small outlet works near the base, was recommended following several modifications. A 1:24 scale model was used in developing the design of the spillway and to determine the hydraulic operating characteristics of the recommended freefall orifice-type spillway, slide-gate controlled outlet works, and tailrace channels of the underground powerplant. Comprehensive data were obtained concerning pressure distribution in the spillway conduits and bellmouth entrances, on the stilling basin floor, and on the stilling basin weir. Minor modifications were made to the topography in the tailrace area to improve flow conditions during large spillway discharges. The stability of riprap protection was determined, and tests were made concerning movement of material in the stilling pool. Operating characteristics of all features of the recommended design were observed.
ABSTRACT
The preliminary design of an overflow spillway at the crest of the dam and a slide-gate-controlled outlet works 1_1ear the dam base was abandoned because of undesirable flow conditions in the stilling basin resulting from high-velocity efflux from the outlet works. An alternate design, consisting of four fixed-wheel gate-controlled outlets near the dam crest and a small outlet works near the base, was recon:imended following several modifications. A 1:2f scale model was used in developing the design of the spillway and to determine the hydraulic operating characteristics of the recommended freefall orifice-type spillway, slide-gate controlled outlet works, and tailrace channels of the underground powerplant. Comprehensive data were obtained concerning pressure distribution in the spillway conduits and bellmouth entrances, on the, stilling basin filoor, and on the stilling basin weir. Minor modifications were made 'to the topography in the tailrace area to improve flow conditions during large spillway discharges. The stability of riprap protection was determined, and tests were made concerning movement of material in the stilling pool. Operating characteristics of all features of the recommended design were observed.

HYDRAULIC MODEL STUDIES OF MORROW POINT DAM SPILLWAY, OUTLET WORKS, AND POWERPLANT TAILRACE--COLORADO RIVER STORAGE PROJECT--CURECANTI UNIT, COLORADO. USBR Lab Rept Hyd-557, Hyd Br, Apr 1966. Bureau of Reclamation, Denver, 20 p, 46 fig, 5 tab, 1 ref, append
DESCRIPTORS-- *arch dams/ *spillways/ *outlet works/ *free fall/ *model.tests/ hydraulic models/ manometers/ orifices/ tailrace/ water pressures/ weirs/ instrumentation/ piezometers/ pressure measuring equip/ discharges/ underground powerplants/ fixed wheel gates/ slide gates/ impact/ energy dissipation/ riprap/ research and development IDENTIFIERS-- *bellmouths/ Morrow Point Dam, Colorado/ Curecanti Unit, Colorado/ Colorado River Storage Project/ Colorado
HYDRAULIC MODEL STUDIES OF MORROW POINT DAM SPILLWAY, OUTLET WORKS, AND POWERPLANT TAILRACE--COLORADO RIVER STORAGE PROJECT--CURECANTI UNIT, COLORADO. USBR Lab Rept Hyd-557, Hyd Br, Apr 1966. Bureau of Reclamation, Denver, 20 p, 46 fig, 5 tab, 1 ref, append
DESCRIPTORS-- *arch dams/ *spillways/ *outlet works/ *free fall/ *model. tests/ hydraulic models/_ manometers/ orifices/ tailrace / water pressures/ weirs/ instrumentation/ piezometers/ pressure measuring equip/ discharges/ underground powerplants/ fixed wheel gates/ slide gates/ impact/ energy dissipation/ riprap/ research and development IDENTIFIERS-- *bellmouths/ Morrow Point Dam, Colorado/ Curecanti Unit, Colorado/ Colorado River Storage Project/ Colorado
HYDRAULIC MODEL STUDIES OF MORROW POINT DAM SPILLWAY,· OUTLET WORKS, AND POWERPLANT TAILRACE--COLORADO RIVER STORAGE PROJECT--CURECANTI UNIT, COLORADO. USBR Lab Rept Hyd-557, Hyd Br, Apr 1966. Bureau of Reclamation, Denver, 20 p, 46 fig, 5 tab, 1 ref, append
DESCRIPTORS-- *arch dams/ *spillways/ *outlet works/ *free fall/ *model tests/ hydraulic models/ manometers/ orifices/ tailrace/ water pressures/ weirs/ instrumentation/ piezometers/ pressure measuring equip/ discharges/ underground powerplants/ fixed wheel gates/ slide gates/ impact/ energy dissipation/ riprap/ research and development IDENTIFIERS-- *bellmouths/ Morrow Point Dam, Colorado/ Curecanti Unit, Colorado/ Colorado River Storage Project/ Colorado
HYDRAULIC MODEL STUDIES OF MORROW POINT DAM SPILLWAY, OUTLET WORKS, AND POWERPLANT TAILRACE--COLORADO RIVER STORAGE PROJECT--CURECANTI UNIT, COLORADO. USBR Lab Rept Hyd-557, Hyd Br, Apr 1966. Bureau of Reclamation, Denver, 20 p, 46 fig, 5 tab, 1 ref, append
DESCRIPTORS-- *arch dams/ *spillways/ *outlet works/ *free fall/ *model.tests/ hydraulic models/ manometers/ orifices/ tailrace/ water pressures/ weirs/ instrumentation/ piezometers/ pressure measuring equip/ discharges/ underground powerplants/ fixed wheel gates/ slide gates/ impact/ energy dissipation/ riprap/ research and development IDENTIFIERS-- *bellmouths/ Morrow Point Dam, Colorado/ Curecanti Unit, Colorado/ Colorado River Storage Project/ Colorado