Embed Size (px)
Citation preview
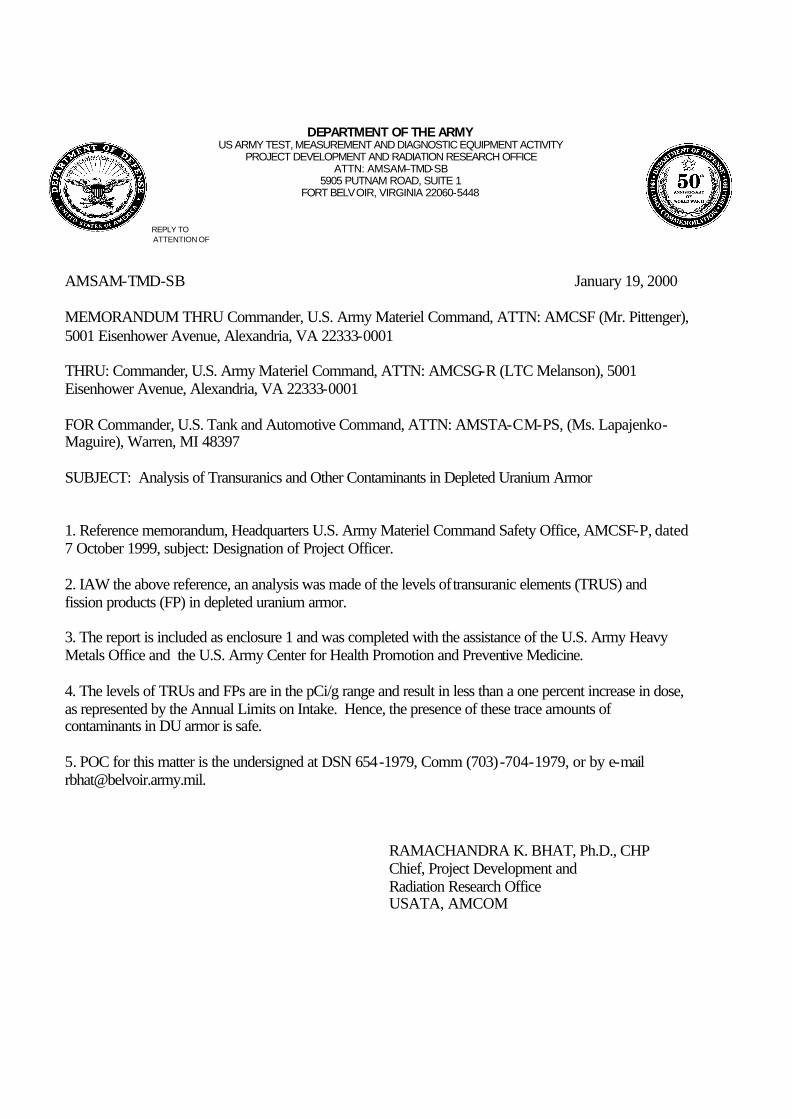
DEPARTMENT OF THE ARMY
US ARMY TEST, MEASUREMENT AND DIAGNOSTIC EQUIPMENT ACTIVITY PROJECT DEVELOPMENT AND RADIATION RESEARCH OFFICE
ATTN: AMSAM–TMD-SB 5905 PUTNAM ROAD, SUITE 1
FORT BELVOIR, VIRGINIA 22060-5448 REPLY TO ATTENTION OF
AMSAM-TMD-SB January 19, 2000 MEMORANDUM THRU Commander, U.S. Army Materiel Command, ATTN: AMCSF (Mr. Pittenger), 5001 Eisenhower Avenue, Alexandria, VA 22333-0001 THRU: Commander, U.S. Army Materiel Command, ATTN: AMCSG-R (LTC Melanson), 5001 Eisenhower Avenue, Alexandria, VA 22333-0001 FOR Commander, U.S. Tank and Automotive Command, ATTN: AMSTA-CM-PS, (Ms. Lapajenko-Maguire), Warren, MI 48397 SUBJECT: Analysis of Transuranics and Other Contaminants in Depleted Uranium Armor 1. Reference memorandum, Headquarters U.S. Army Materiel Command Safety Office, AMCSF-P, dated 7 October 1999, subject: Designation of Project Officer. 2. IAW the above reference, an analysis was made of the levels of transuranic elements (TRUS) and fission products (FP) in depleted uranium armor. 3. The report is included as enclosure 1 and was completed with the assistance of the U.S. Army Heavy Metals Office and the U.S. Army Center for Health Promotion and Preventive Medicine. 4. The levels of TRUs and FPs are in the pCi/g range and result in less than a one percent increase in dose, as represented by the Annual Limits on Intake. Hence, the presence of these trace amounts of contaminants in DU armor is safe. 5. POC for this matter is the undersigned at DSN 654-1979, Comm (703)-704-1979, or by e-mail [email protected].
RAMACHANDRA K. BHAT, Ph.D., CHP Chief, Project Development and Radiation Research Office USATA, AMCOM
2
Enclosure 1 Tank-Automotive and Armaments Command (TACOM) and Army Materiel Command (AMC) Review of Transuranics (TRU) in Depleted Uranium (DU)
Armor
Project Officer: Ramachandra K. Bhat, Ph.D., CHP
January 19, 2000 BACKGROUND The United States Department of the Army (DA) Nuclear Regulatory Commission (NRC) license for Depleted Uranium (DU) armor is managed by the Tank-automotive and Armaments Command (TACOM). In August 1999, the Department of Energy (DOE) informed the Army that DU armor carried trace amounts of transuranics (TRU) and Technetium-99 (Tc-99). The NRC subsequently requested the Army submit an amendment to its DU Armor license (NRC Materials License No. SUB-1536, Docket No. 040-08994) to reflect the quantities of TRU contained in the Army’s DU Armor based on more extensive sampling/lab analysis. To provide the NRC with such analysis, the Army Materiel Command (AMC) developed a plan designed to quantitatively assess TRU content in DU Armor. QUALITY ASSURANCE (QA) According to ANSI/HPS N13.1-1999, quality assurance includes “planned and systematic actions necessary to provide confidence that a system or component will perform satisfactorily in service and that the results are both correct and traceable.” Dr. Bhat was tasked by AMC headquarters as Project Officer of the Analysis of Transuranics in Depleted Uranium Project. The project’s goals are to assess levels of TRU in DU for the Army’s DU Armor license and characterize the risk in terms of relative increase in Annual Limits on Intake (ALI). In order to accomplish this objective, Dr. Bhat consulted with the NRC license holder and Army agencies including the U.S. Army Center for Health Promotion and Preventive Medicine (USA CHPPM). Collectively, the agencies designed a quality assurance program establishing guidelines to be followed by the designated laboratories during the analysis of TRU in DU Armor. Highlights of the established criteria are listed below. Each selected laboratory should have: - An established performance record in DOE Quality Assurance Program (QAP)/Mixed Analyte Performance Evaluation Program (MAPEP). -The capability to analyze spiked samples to check for both chemical and radiological accuracy prior to sample analysis. -The capability to analyze one spiked TRU in uranium sample prior to sample analysis. -The capability to obtain a Minimum Detectable Concentration (MDC) of 1 pCi of TRU/g of DU. -Laboratory procedures which are well established and published in the literature.
3
Dr. Ramachandra Bhat traveled to the Idaho National Engineering and Environmental Laboratory (INEEL) to visit the Idaho Nuclear Technology and Engineering Center (INTEC) and the Radiological and Environmental Science Laboratory (RESL). Dr. Bhat reviewed INTEC’s established quality assurance program and subsequently determined that their assistance would be beneficial to the DU Armor project and designated INTEC as the primary laboratory. A secondary laboratory, RESL (RESL evaluates the performance of DOE laboratories by administering a QC program called MAPEP), was designated as an additional laboratory to verify the analytical performance of INTEC, the primary laboratory. QC measures established by RESL include the production of TRU spiked standards in a uranium matrix for the performance evaluation of INTEC. As a QC measure, Dr. Bhat requested that 10% of the samples analyzed by INTEC be analyzed by RESL. Dr. Bhat established the Video Teleconference (VTC) format as the forum for a collaborative decision-making process involving participants from DOE, INTEC, RESL, DA, and Air Force officials (who were observers). VTCs took place in November and December 1999 and January 2000. In each VTC session, QA was granted the highest priority to obtain the credibility of the TRU in DU Armor values reported by INTEC. SAMPLE PREPARATION AND LOGISTICS DOE shipped DU billets to a contractor, Specific Manufacturing Capability (SMC) located in Idaho Falls, Idaho. SMC produced the DU armor from DU billets.
DU armor is shipped from SMC to Lima Tank Plant for insertion into tanks. SMC ships the scraps from armor production to another contractor, Starmet Inc., in Boston, MA. This is then melted and recast into billets and is then sent back to SMC. During recycling of nuclear fuel, TRUs and long-lived fission products entered the DU stream. The Army decided to analyze, both quantitatively and qualitatively, random samples from three different generations, or populations, of finished billets. Population #1 is comprised of billets from the original shipment of DU Armor. Scraps from the production process are melted and recast into billets. Population #2 contains billets recast from Population #1. Population #3 contains billets recast from the production of Population #2. This process of recasting scrap is the reason no additional DU Armor has been added to the process since the first shipment. At the request of TACOM, DOE prepared three sets of sixty billet samples. Samples from Population #1 billets were taken at SMC. Two samples were taken from each billet selected, one inch removed from the edges of the long face of each billet. Two samples, one from each end of the billet, were taken to assess the homogeneity of the billet. The samples were obtained by drilling at an approximately 1” depth and collecting 40g of DU turnings, or shavings, per sample. Because DU is highly pyrophoric, the drilling had to be done with the block submerged in a coolant comprised of water and Trimor. A fresh drill bit was used for each end of each block to eliminate the possibility of cross-contamination. Starmet Inc. archived one-inch cubes taken from the top crop of Population #2 and #3 billets. The selected cubes were sent to SMC for sampling. The sampling of these cubes was performed as described above for Population #1 billet samples. When the three sets of sixty were completed, SMC shipped one set of 60 samples to INTEC; the second set was designated for AMC; and the third set was put into storage for future research.
4
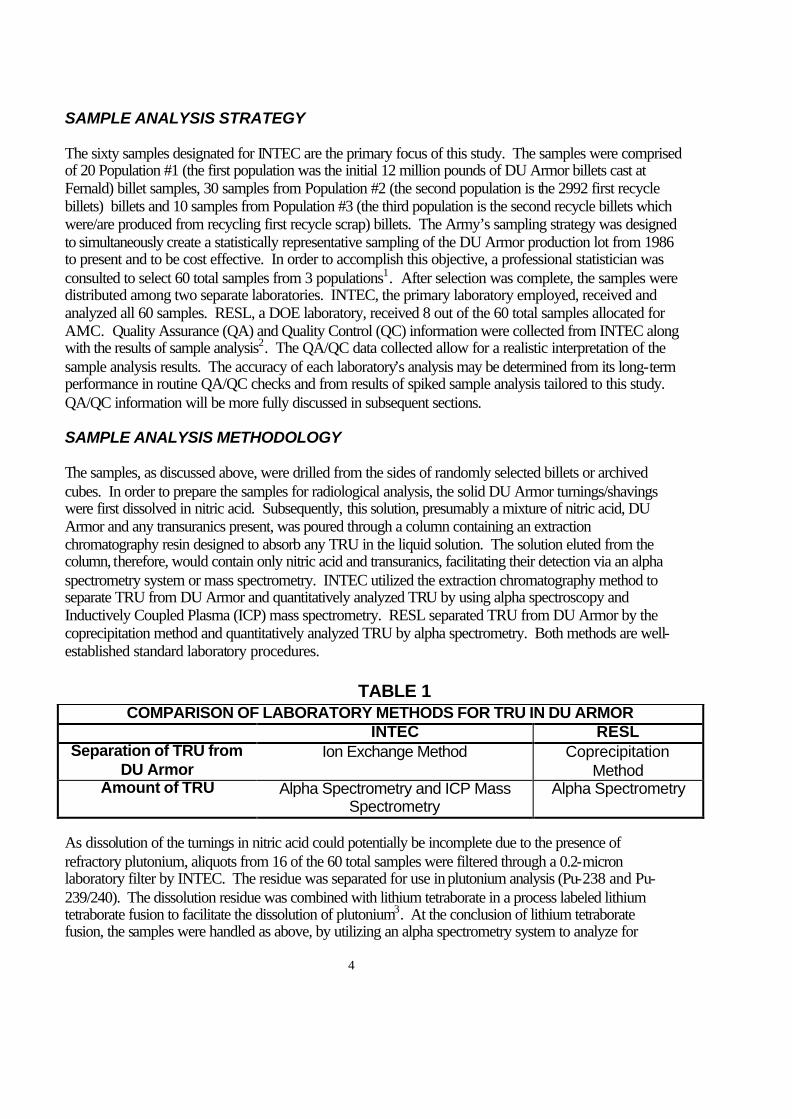
SAMPLE ANALYSIS STRATEGY The sixty samples designated for INTEC are the primary focus of this study. The samples were comprised of 20 Population #1 (the first population was the initial 12 million pounds of DU Armor billets cast at Fernald) billet samples, 30 samples from Population #2 (the second population is the 2992 first recycle billets) billets and 10 samples from Population #3 (the third population is the second recycle billets which were/are produced from recycling first recycle scrap) billets. The Army’s sampling strategy was designed to simultaneously create a statistically representative sampling of the DU Armor production lot from 1986 to present and to be cost effective. In order to accomplish this objective, a professional statistician was consulted to select 60 total samples from 3 populations1. After selection was complete, the samples were distributed among two separate laboratories. INTEC, the primary laboratory employed, received and analyzed all 60 samples. RESL, a DOE laboratory, received 8 out of the 60 total samples allocated for AMC. Quality Assurance (QA) and Quality Control (QC) information were collected from INTEC along with the results of sample analysis2. The QA/QC data collected allow for a realistic interpretation of the sample analysis results. The accuracy of each laboratory’s analysis may be determined from its long-term performance in routine QA/QC checks and from results of spiked sample analysis tailored to this study. QA/QC information will be more fully discussed in subsequent sections. SAMPLE ANALYSIS METHODOLOGY The samples, as discussed above, were drilled from the sides of randomly selected billets or archived cubes. In order to prepare the samples for radiological analysis, the solid DU Armor turnings/shavings were first dissolved in nitric acid. Subsequently, this solution, presumably a mixture of nitric acid, DU Armor and any transuranics present, was poured through a column containing an extraction chromatography resin designed to absorb any TRU in the liquid solution. The solution eluted from the column, therefore, would contain only nitric acid and transuranics, facilitating their detection via an alpha spectrometry system or mass spectrometry. INTEC utilized the extraction chromatography method to separate TRU from DU Armor and quantitatively analyzed TRU by using alpha spectroscopy and Inductively Coupled Plasma (ICP) mass spectrometry. RESL separated TRU from DU Armor by the coprecipitation method and quantitatively analyzed TRU by alpha spectrometry. Both methods are well-established standard laboratory procedures.
TABLE 1
COMPARISON OF LABORATORY METHODS FOR TRU IN DU ARMOR INTEC RESL
Separation of TRU from DU Armor
Ion Exchange Method Coprecipitation Method
Amount of TRU Alpha Spectrometry and ICP Mass Spectrometry
Alpha Spectrometry
As dissolution of the turnings in nitric acid could potentially be incomplete due to the presence of refractory plutonium, aliquots from 16 of the 60 total samples were filtered through a 0.2-micron laboratory filter by INTEC. The residue was separated for use in plutonium analysis (Pu-238 and Pu-239/240). The dissolution residue was combined with lithium tetraborate in a process labeled lithium tetraborate fusion to facilitate the dissolution of plutonium3. At the conclusion of lithium tetraborate fusion, the samples were handled as above, by utilizing an alpha spectrometry system to analyze for
5
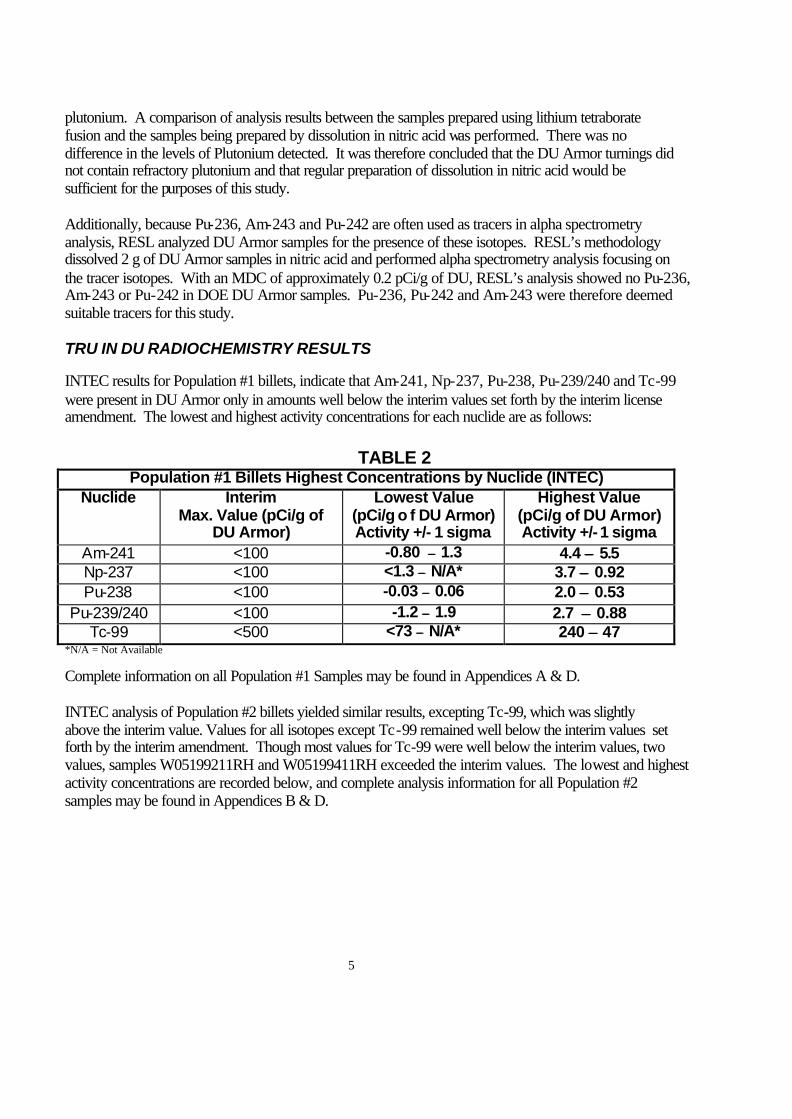
plutonium. A comparison of analysis results between the samples prepared using lithium tetraborate fusion and the samples being prepared by dissolution in nitric acid was performed. There was no difference in the levels of Plutonium detected. It was therefore concluded that the DU Armor turnings did not contain refractory plutonium and that regular preparation of dissolution in nitric acid would be sufficient for the purposes of this study. Additionally, because Pu-236, Am-243 and Pu-242 are often used as tracers in alpha spectrometry analysis, RESL analyzed DU Armor samples for the presence of these isotopes. RESL’s methodology dissolved 2 g of DU Armor samples in nitric acid and performed alpha spectrometry analysis focusing on the tracer isotopes. With an MDC of approximately 0.2 pCi/g of DU, RESL’s analysis showed no Pu-236, Am-243 or Pu-242 in DOE DU Armor samples. Pu-236, Pu-242 and Am-243 were therefore deemed suitable tracers for this study. TRU IN DU RADIOCHEMISTRY RESULTS INTEC results for Population #1 billets, indicate that Am-241, Np-237, Pu-238, Pu-239/240 and Tc-99 were present in DU Armor only in amounts well below the interim values set forth by the interim license amendment. The lowest and highest activity concentrations for each nuclide are as follows:
TABLE 2
Population #1 Billets Highest Concentrations by Nuclide (INTEC) Nuclide
Interim
Max. Value (pCi/g of DU Armor)
Lowest Value (pCi/g o f DU Armor) Activity +/- 1 sigma
Highest Value (pCi/g of DU Armor) Activity +/- 1 sigma
Am-241 <100 -0.80 ±± 1.3 4.4 ±± 5.5 Np-237 <100 <1.3 ±± N/A* 3.7 ±± 0.92 Pu-238 <100 -0.03 ±± 0.06 2.0 ±± 0.53
Pu-239/240 <100 -1.2 ±± 1.9 2.7 ±± 0.88 Tc-99 <500 <73 ±± N/A* 240 ±± 47
*N/A = Not Available
Complete information on all Population #1 Samples may be found in Appendices A & D. INTEC analysis of Population #2 billets yielded similar results, excepting Tc-99, which was slightly above the interim value. Values for all isotopes except Tc-99 remained well below the interim values set forth by the interim amendment. Though most values for Tc-99 were well below the interim values, two values, samples W05199211RH and W05199411RH exceeded the interim values. The lowest and highest activity concentrations are recorded below, and complete analysis information for all Population #2 samples may be found in Appendices B & D.
6
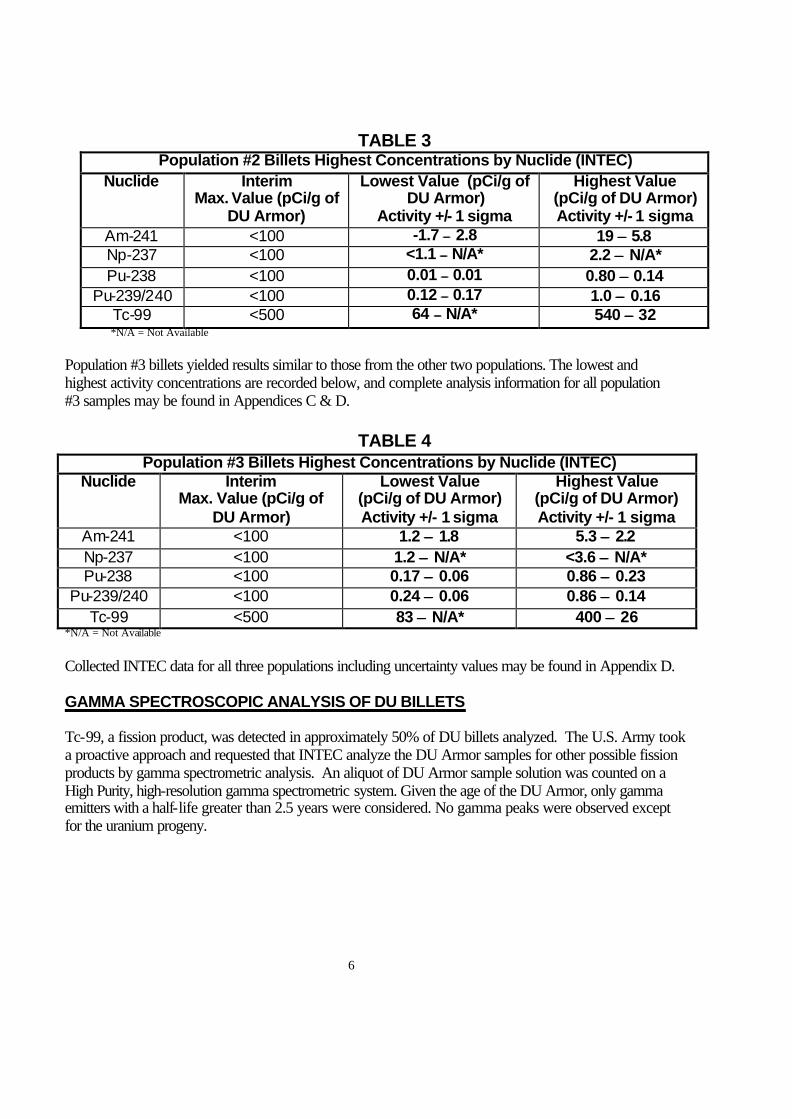
TABLE 3
Population #2 Billets Highest Concentrations by Nuclide (INTEC) Nuclide
Interim
Max. Value (pCi/g of DU Armor)
Lowest Value (pCi/g of DU Armor)
Activity +/- 1 sigma
Highest Value (pCi/g of DU Armor) Activity +/- 1 sigma
Am-241 <100 -1.7 ±± 2.8 19 ±± 5.8 Np-237 <100 <1.1 ±± N/A* 2.2 ±± N/A* Pu-238 <100 0.01 ±± 0.01 0.80 ±± 0.14
Pu-239/240 <100 0.12 ±± 0.17 1.0 ±± 0.16 Tc-99 <500 64 ±± N/A* 540 ±± 32 *N/A = Not Available
Population #3 billets yielded results similar to those from the other two populations. The lowest and highest activity concentrations are recorded below, and complete analysis information for all population #3 samples may be found in Appendices C & D.
TABLE 4 Population #3 Billets Highest Concentrations by Nuclide (INTEC)
Nuclide
Interim Max. Value (pCi/g of
DU Armor)
Lowest Value (pCi/g of DU Armor) Activity +/- 1 sigma
Highest Value (pCi/g of DU Armor) Activity +/- 1 sigma
Am-241 <100 1.2 ±± 1.8 5.3 ±± 2.2 Np-237 <100 1.2 ±± N/A* <3.6 ±± N/A* Pu-238 <100 0.17 ±± 0.06 0.86 ±± 0.23
Pu-239/240 <100 0.24 ±± 0.06 0.86 ±± 0.14 Tc-99 <500 83 ±± N/A* 400 ±± 26
*N/A = Not Available
Collected INTEC data for all three populations including uncertainty values may be found in Appendix D. GAMMA SPECTROSCOPIC ANALYSIS OF DU BILLETS Tc-99, a fission product, was detected in approximately 50% of DU billets analyzed. The U.S. Army took a proactive approach and requested that INTEC analyze the DU Armor samples for other possible fission products by gamma spectrometric analysis. An aliquot of DU Armor sample solution was counted on a High Purity, high-resolution gamma spectrometric system. Given the age of the DU Armor, only gamma emitters with a half-life greater than 2.5 years were considered. No gamma peaks were observed except for the uranium progeny.
7
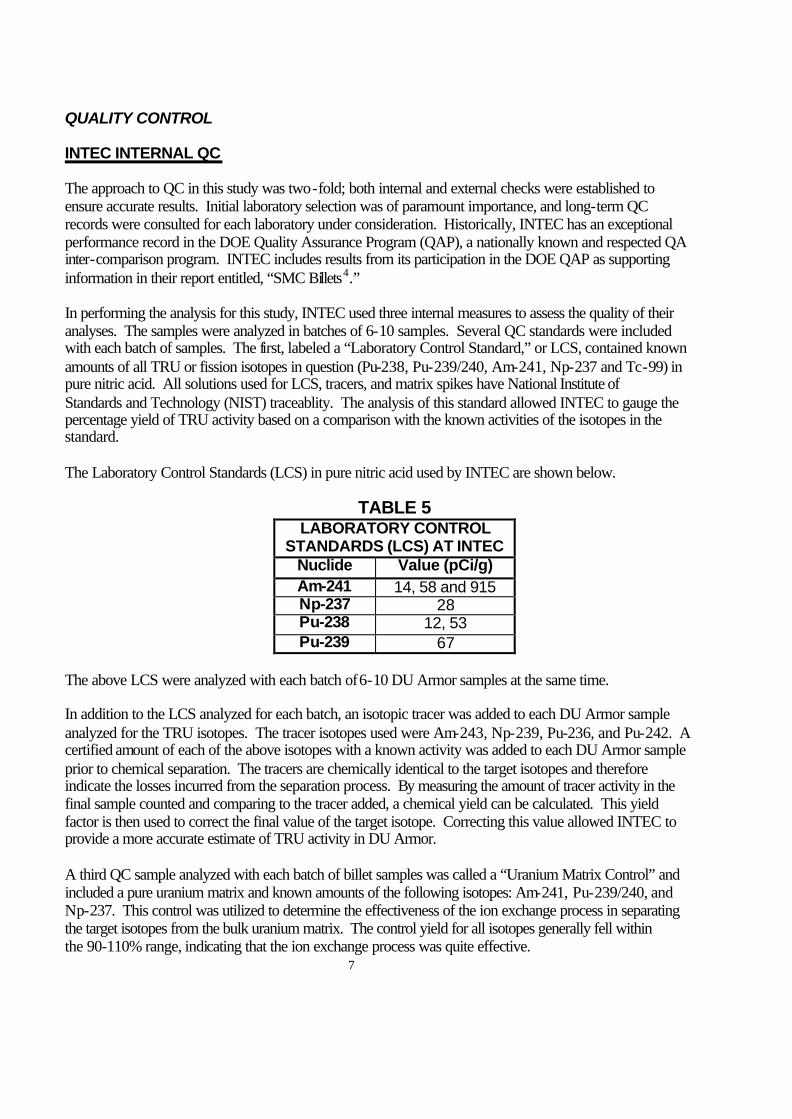
QUALITY CONTROL INTEC INTERNAL QC The approach to QC in this study was two-fold; both internal and external checks were established to ensure accurate results. Initial laboratory selection was of paramount importance, and long-term QC records were consulted for each laboratory under consideration. Historically, INTEC has an exceptional performance record in the DOE Quality Assurance Program (QAP), a nationally known and respected QA inter-comparison program. INTEC includes results from its participation in the DOE QAP as supporting information in their report entitled, “SMC Billets4.” In performing the analysis for this study, INTEC used three internal measures to assess the quality of their analyses. The samples were analyzed in batches of 6-10 samples. Several QC standards were included with each batch of samples. The first, labeled a “Laboratory Control Standard,” or LCS, contained known amounts of all TRU or fission isotopes in question (Pu-238, Pu-239/240, Am-241, Np-237 and Tc-99) in pure nitric acid. All solutions used for LCS, tracers, and matrix spikes have National Institute of Standards and Technology (NIST) traceablity. The analysis of this standard allowed INTEC to gauge the percentage yield of TRU activity based on a comparison with the known activities of the isotopes in the standard. The Laboratory Control Standards (LCS) in pure nitric acid used by INTEC are shown below.
TABLE 5 LABORATORY CONTROL
STANDARDS (LCS) AT INTEC Nuclide Value (pCi/g) Am-241 14, 58 and 915 Np-237 28 Pu-238 12, 53 Pu-239 67
The above LCS were analyzed with each batch of 6-10 DU Armor samples at the same time. In addition to the LCS analyzed for each batch, an isotopic tracer was added to each DU Armor sample analyzed for the TRU isotopes. The tracer isotopes used were Am-243, Np-239, Pu-236, and Pu-242. A certified amount of each of the above isotopes with a known activity was added to each DU Armor sample prior to chemical separation. The tracers are chemically identical to the target isotopes and therefore indicate the losses incurred from the separation process. By measuring the amount of tracer activity in the final sample counted and comparing to the tracer added, a chemical yield can be calculated. This yield factor is then used to correct the final value of the target isotope. Correcting this value allowed INTEC to provide a more accurate estimate of TRU activity in DU Armor. A third QC sample analyzed with each batch of billet samples was called a “Uranium Matrix Control” and included a pure uranium matrix and known amounts of the following isotopes: Am-241, Pu-239/240, and Np-237. This control was utilized to determine the effectiveness of the ion exchange process in separating the target isotopes from the bulk uranium matrix. The control yield for all isotopes generally fell within the 90-110% range, indicating that the ion exchange process was quite effective.
8
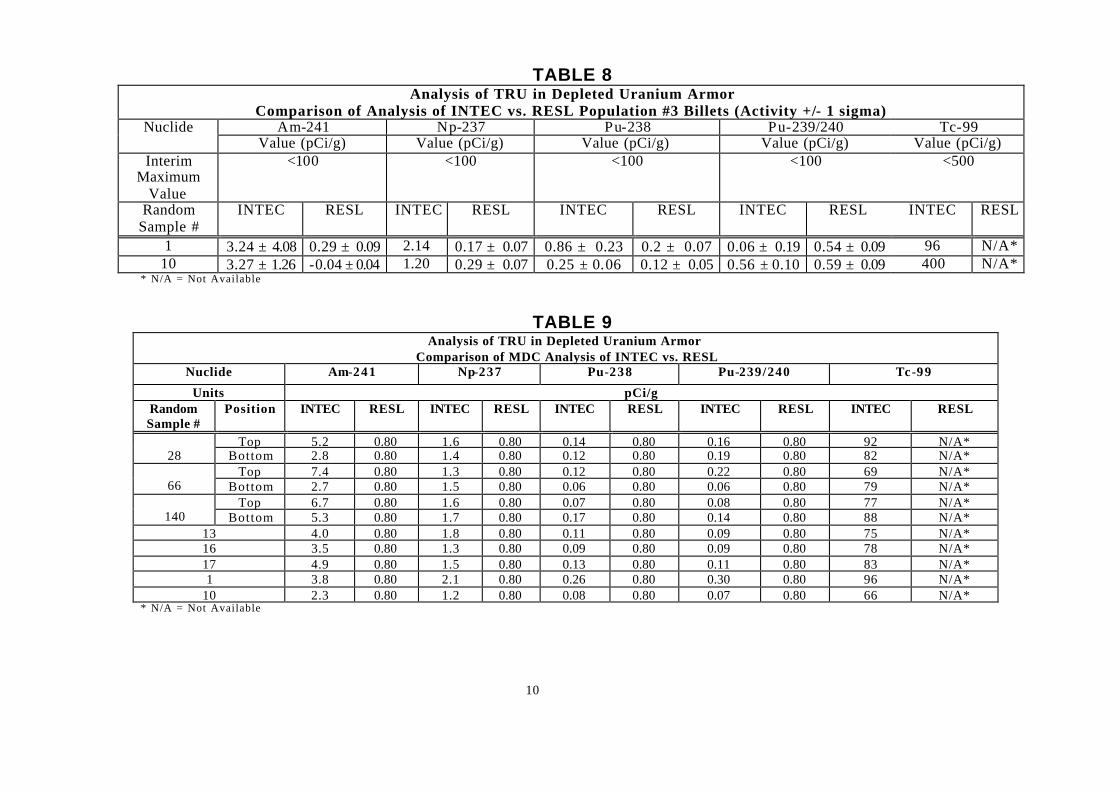
INTEC LABORATORY MINIMUM DETECTABLE CONCENTRATIONS The detection limit set by the DA analysis protocol was 1 pCi/g of DU Armor sample. The MDC levels achieved by INTEC were approximately one order of magnitude lower than the requested value. Most of the MDC results were close to 0.1 pCi/g of DU Armor sample. Therefore, the methodologies achieved appropriate levels of sensitivity. EXTERNAL QC As discussed above, RESL participated in this study in order to provide analysis results to compare with those from INTEC. RESL received 8 of the total 60 samples, including 3 samples from Population #1, 3 samples from Population #2, and 2 samples from Population #3. Data comparisons can be found below. MDCs achieved by each lab for the compared samples can found in Table 9. Variability exists between INTEC and RESL analysis results and MDCs achieved. These differences may be due to different methodologies employed and for possible sample inhomogeneities.
9
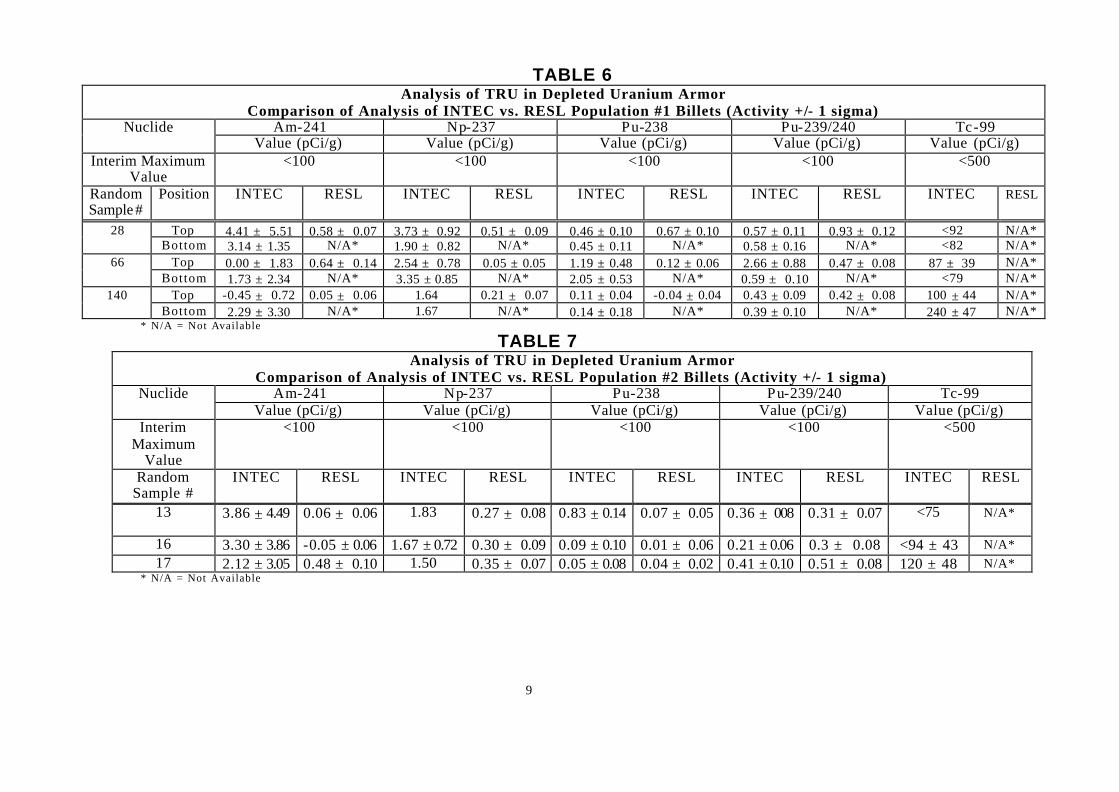
TABLE 6 Analysis of TRU in Depleted Uranium Armor
Comparison of Analysis of INTEC vs. RESL Population #1 Billets (Activity +/- 1 sigma) Am-241 Np-237 Pu-238 Pu-239/240 Tc-99 Nuclide
Value (pCi/g) Value (pCi/g) Value (pCi/g) Value (pCi/g) Value (pCi/g) Interim Maximum
Value <100 <100 <100 <100 <500
Random Sample #
Position INTEC RESL INTEC RESL INTEC RESL INTEC RESL INTEC RESL
Top 4.41 ± 5.51 0.58 ± 0.07 3.73 ± 0.92 0.51 ± 0.09 0.46 ± 0.10 0.67 ± 0.10 0.57 ± 0.11 0.93 ± 0.12 <92 N/A* 28 Bottom 3.14 ± 1.35 N/A* 1.90 ± 0.82 N/A* 0.45 ± 0.11 N/A* 0.58 ± 0.16 N/A* <82 N/A*
Top 0.00 ± 1.83 0.64 ± 0.14 2.54 ± 0.78 0.05 ± 0.05 1.19 ± 0.48 0.12 ± 0.06 2.66 ± 0.88 0.47 ± 0.08 87 ± 39 N/A* 66 Bottom 1.73 ± 2.34 N/A* 3.35 ± 0.85 N/A* 2.05 ± 0.53 N/A* 0.59 ± 0.10 N/A* <79 N/A*
Top -0.45 ± 0.72 0.05 ± 0.06 1.64 0.21 ± 0.07 0.11 ± 0.04 -0.04 ± 0.04 0.43 ± 0.09 0.42 ± 0.08 100 ± 44 N/A* 140 Bottom 2.29 ± 3.30 N/A* 1.67 N/A* 0.14 ± 0.18 N/A* 0.39 ± 0.10 N/A* 240 ± 47 N/A*
* N/A = Not Available
TABLE 7 Analysis of TRU in Depleted Uranium Armor
Comparison of Analysis of INTEC vs. RESL Population #2 Billets (Activity +/- 1 sigma) Am-241 Np-237 Pu-238 Pu-239/240 Tc-99 Nuclide
Value (pCi/g) Value (pCi/g) Value (pCi/g) Value (pCi/g) Value (pCi/g) Interim
Maximum Value
<100 <100 <100 <100 <500
Random Sample #
INTEC RESL INTEC RESL INTEC RESL INTEC RESL INTEC RESL
13
3.86 ± 4.49 0.06 ± 0.06 1.83 0.27 ± 0.08 0.83 ± 0.14 0.07 ± 0.05 0.36 ± 008 0.31 ± 0.07 <75 N/A*
16 3.30 ± 3.86 -0.05 ± 0.06 1.67 ± 0.72 0.30 ± 0.09 0.09 ± 0.10 0.01 ± 0.06 0.21 ± 0.06 0.3 ± 0.08 <94 ± 43 N/A* 17 2.12 ± 3.05 0.48 ± 0.10 1.50 0.35 ± 0.07 0.05 ± 0.08 0.04 ± 0.02 0.41 ± 0.10 0.51 ± 0.08 120 ± 48 N/A*
* N/A = Not Available
10
TABLE 8 Analysis of TRU in Depleted Uranium Armor
Comparison of Analysis of INTEC vs. RESL Population #3 Billets (Activity +/- 1 sigma) Am-241 Np-237 Pu-238 Pu-239/240 Tc-99 Nuclide
Value (pCi/g) Value (pCi/g) Value (pCi/g) Value (pCi/g) Value (pCi/g) Interim
Maximum Value
<100 <100 <100 <100 <500
Random Sample #
INTEC RESL INTEC RESL INTEC RESL INTEC RESL INTEC RESL
1 3.24 ± 4.08 0.29 ± 0.09 2.14 0.17 ± 0.07 0.86 ± 0.23 0.2 ± 0.07 0.06 ± 0.19 0.54 ± 0.09 96 N/A* 10 3.27 ± 1.26 -0.04 ± 0.04 1.20 0.29 ± 0.07 0.25 ± 0.06 0.12 ± 0.05 0.56 ± 0.10 0.59 ± 0.09 400 N/A*
* N/A = Not Available
TABLE 9 Analysis of TRU in Depleted Uranium Armor
Comparison of MDC Analysis of INTEC vs. RESL Nuclide Am-241 Np-237 Pu-238 Pu-239/240 Tc-99
Units pCi/g Random Sample #
Position INTEC RESL INTEC RESL INTEC RESL INTEC RESL INTEC RESL
Top 5.2 0.80 1.6 0.80 0.14 0.80 0.16 0.80 92 N/A* 28 Bottom 2.8 0.80 1.4 0.80 0.12 0.80 0.19 0.80 82 N/A*
Top 7.4 0.80 1.3 0.80 0.12 0.80 0.22 0.80 69 N/A* 66 Bottom 2.7 0.80 1.5 0.80 0.06 0.80 0.06 0.80 79 N/A*
Top 6.7 0.80 1.6 0.80 0.07 0.80 0.08 0.80 77 N/A* 140 Bottom 5.3 0.80 1.7 0.80 0.17 0.80 0.14 0.80 88 N/A*
13 4.0 0.80 1.8 0.80 0.11 0.80 0.09 0.80 75 N/A* 16 3.5 0.80 1.3 0.80 0.09 0.80 0.09 0.80 78 N/A* 17 4.9 0.80 1.5 0.80 0.13 0.80 0.11 0.80 83 N/A* 1 3.8 0.80 2.1 0.80 0.26 0.80 0.30 0.80 96 N/A*
10 2.3 0.80 1.2 0.80 0.08 0.80 0.07 0.80 66 N/A* * N/A = Not Available
11
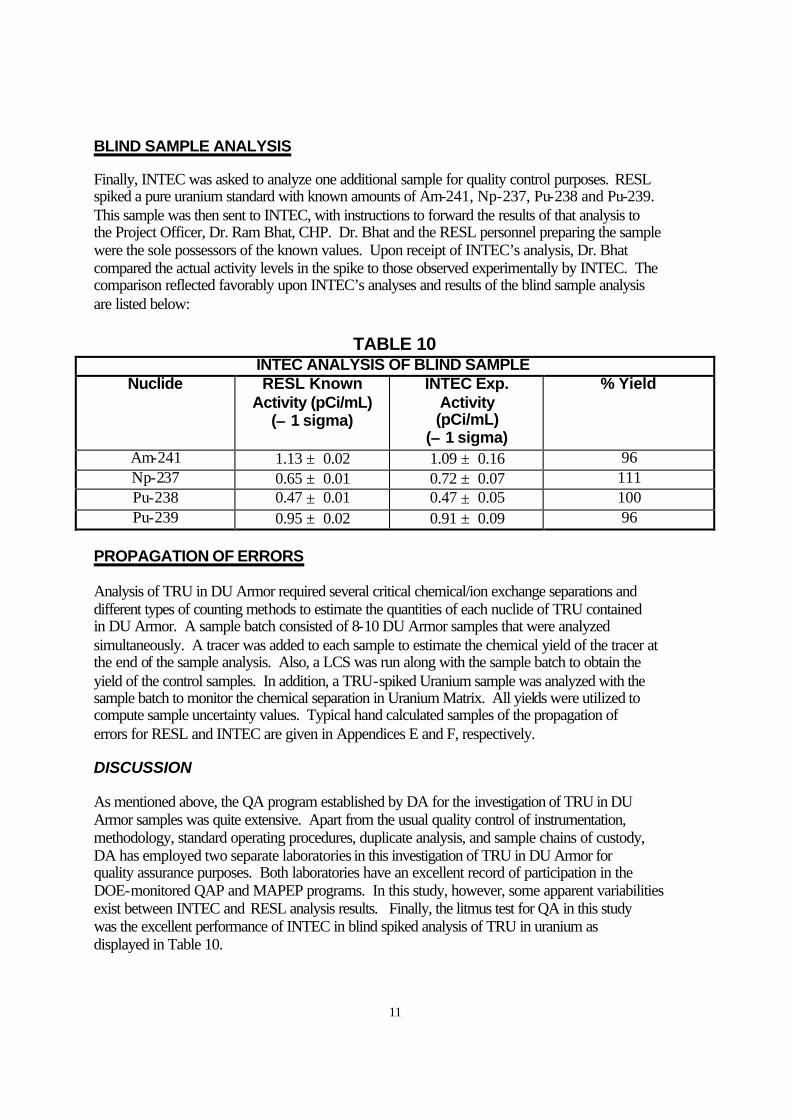
BLIND SAMPLE ANALYSIS Finally, INTEC was asked to analyze one additional sample for quality control purposes. RESL spiked a pure uranium standard with known amounts of Am-241, Np-237, Pu-238 and Pu-239. This sample was then sent to INTEC, with instructions to forward the results of that analysis to the Project Officer, Dr. Ram Bhat, CHP. Dr. Bhat and the RESL personnel preparing the sample were the sole possessors of the known values. Upon receipt of INTEC’s analysis, Dr. Bhat compared the actual activity levels in the spike to those observed experimentally by INTEC. The comparison reflected favorably upon INTEC’s analyses and results of the blind sample analysis are listed below:
TABLE 10
INTEC ANALYSIS OF BLIND SAMPLE Nuclide RESL Known
Activity (pCi/mL) (±± 1 sigma)
INTEC Exp. Activity (pCi/mL)
(±± 1 sigma)
% Yield
Am-241 1.13 ± 0.02 1.09 ± 0.16 96 Np-237 0.65 ± 0.01 0.72 ± 0.07 111 Pu-238 0.47 ± 0.01 0.47 ± 0.05 100 Pu-239 0.95 ± 0.02 0.91 ± 0.09 96
PROPAGATION OF ERRORS Analysis of TRU in DU Armor required several critical chemical/ion exchange separations and different types of counting methods to estimate the quantities of each nuclide of TRU contained in DU Armor. A sample batch consisted of 8-10 DU Armor samples that were analyzed simultaneously. A tracer was added to each sample to estimate the chemical yield of the tracer at the end of the sample analysis. Also, a LCS was run along with the sample batch to obtain the yield of the control samples. In addition, a TRU-spiked Uranium sample was analyzed with the sample batch to monitor the chemical separation in Uranium Matrix. All yields were utilized to compute sample uncertainty values. Typical hand calculated samples of the propagation of errors for RESL and INTEC are given in Appendices E and F, respectively. DISCUSSION As mentioned above, the QA program established by DA for the investigation of TRU in DU Armor samples was quite extensive. Apart from the usual quality control of instrumentation, methodology, standard operating procedures, duplicate analysis, and sample chains of custody, DA has employed two separate laboratories in this investigation of TRU in DU Armor for quality assurance purposes. Both laboratories have an excellent record of participation in the DOE-monitored QAP and MAPEP programs. In this study, however, some apparent variabilities exist between INTEC and RESL analysis results. Finally, the litmus test for QA in this study was the excellent performance of INTEC in blind spiked analysis of TRU in uranium as displayed in Table 10.
12
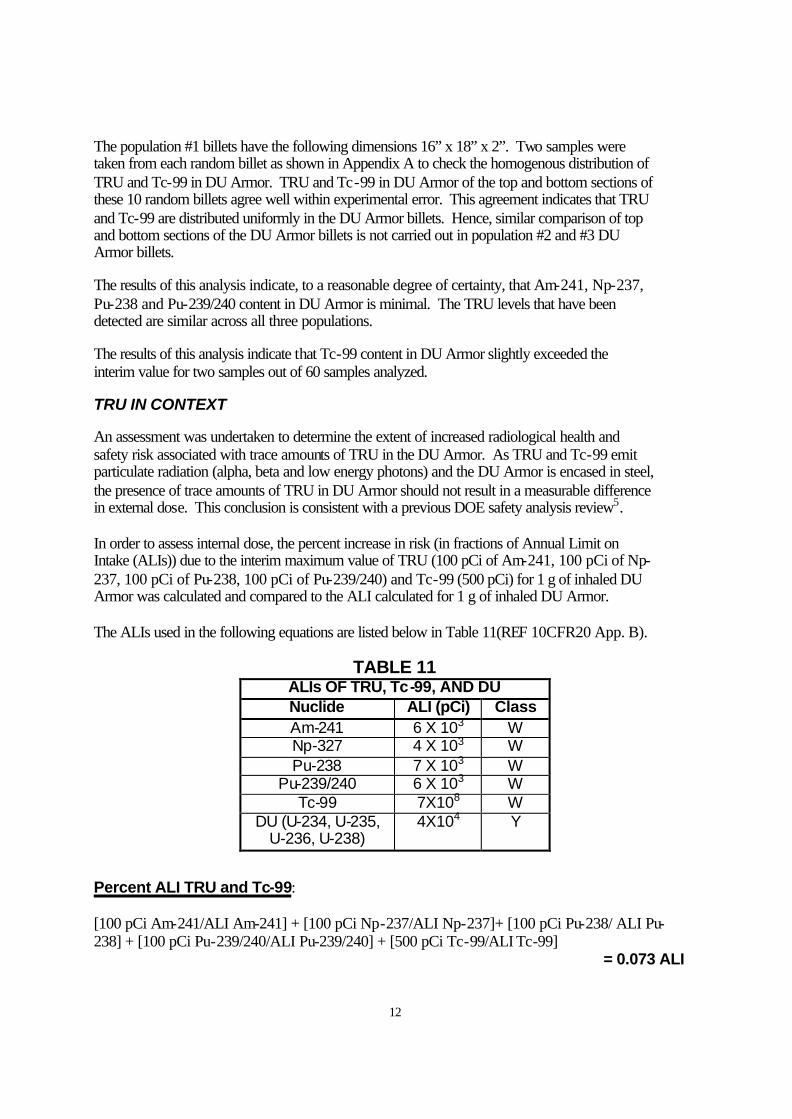
The population #1 billets have the following dimensions 16” x 18” x 2”. Two samples were taken from each random billet as shown in Appendix A to check the homogenous distribution of TRU and Tc-99 in DU Armor. TRU and Tc-99 in DU Armor of the top and bottom sections of these 10 random billets agree well within experimental error. This agreement indicates that TRU and Tc-99 are distributed uniformly in the DU Armor billets. Hence, similar comparison of top and bottom sections of the DU Armor billets is not carried out in population #2 and #3 DU Armor billets. The results of this analysis indicate, to a reasonable degree of certainty, that Am-241, Np-237, Pu-238 and Pu-239/240 content in DU Armor is minimal. The TRU levels that have been detected are similar across all three populations. The results of this analysis indicate that Tc-99 content in DU Armor slightly exceeded the interim value for two samples out of 60 samples analyzed. TRU IN CONTEXT An assessment was undertaken to determine the extent of increased radiological health and safety risk associated with trace amounts of TRU in the DU Armor. As TRU and Tc-99 emit particulate radiation (alpha, beta and low energy photons) and the DU Armor is encased in steel, the presence of trace amounts of TRU in DU Armor should not result in a measurable difference in external dose. This conclusion is consistent with a previous DOE safety analysis review5. In order to assess internal dose, the percent increase in risk (in fractions of Annual Limit on Intake (ALIs)) due to the interim maximum value of TRU (100 pCi of Am-241, 100 pCi of Np-237, 100 pCi of Pu-238, 100 pCi of Pu-239/240) and Tc-99 (500 pCi) for 1 g of inhaled DU Armor was calculated and compared to the ALI calculated for 1 g of inhaled DU Armor. The ALIs used in the following equations are listed below in Table 11(REF 10CFR20 App. B).
TABLE 11 ALIs OF TRU, Tc-99, AND DU Nuclide ALI (pCi) Class Am-241 6 X 10³ W Np-327 4 X 10³ W Pu-238 7 X 10³ W
Pu-239/240 6 X 10³ W Tc-99 7X10⁸ W
DU (U-234, U-235, U-236, U-238)
4X10⁴ Y
Percent ALI TRU and Tc-99: [100 pCi Am-241/ALI Am-241] + [100 pCi Np-237/ALI Np-237]+ [100 pCi Pu-238/ ALI Pu-238] + [100 pCi Pu-239/240/ALI Pu-239/240] + [500 pCi Tc-99/ALI Tc-99]
= 0.073 ALI
13
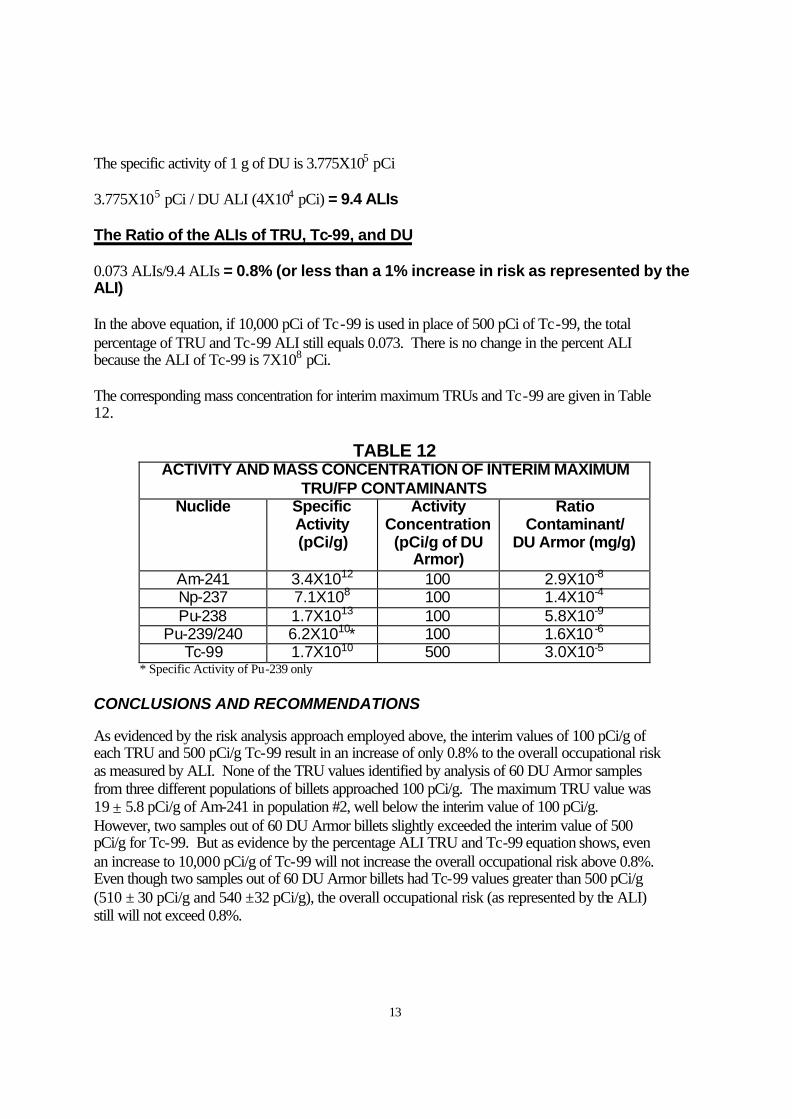
The specific activity of 1 g of DU is 3.775X10⁵ pCi 3.775X10⁵ pCi / DU ALI (4X10⁴ pCi) = 9.4 ALIs The Ratio of the ALIs of TRU, Tc-99, and DU 0.073 ALIs/9.4 ALIs = 0.8% (or less than a 1% increase in risk as represented by the ALI) In the above equation, if 10,000 pCi of Tc-99 is used in place of 500 pCi of Tc-99, the total percentage of TRU and Tc-99 ALI still equals 0.073. There is no change in the percent ALI because the ALI of Tc-99 is 7X10⁸ pCi. The corresponding mass concentration for interim maximum TRUs and Tc-99 are given in Table 12.
TABLE 12 ACTIVITY AND MASS CONCENTRATION OF INTERIM MAXIMUM
TRU/FP CONTAMINANTS Nuclide Specific
Activity (pCi/g)
Activity Concentration
(pCi/g of DU Armor)
Ratio Contaminant/
DU Armor (mg/g)
Am-241 3.4X10¹² 100 2.9X10⁻⁸
Np-237 7.1X10⁸ 100 1.4X10⁻⁴
Pu-238 1.7X10¹³ 100 5.8X10⁻⁹
Pu-239/240 6.2X1010* 100 1.6X10 -6
Tc-99 1.7X10¹⁰ 500 3.0X10⁻⁵
* Specific Activity of Pu-239 only CONCLUSIONS AND RECOMMENDATIONS As evidenced by the risk analysis approach employed above, the interim values of 100 pCi/g of each TRU and 500 pCi/g Tc-99 result in an increase of only 0.8% to the overall occupational risk as measured by ALI. None of the TRU values identified by analysis of 60 DU Armor samples from three different populations of billets approached 100 pCi/g. The maximum TRU value was 19 ± 5.8 pCi/g of Am-241 in population #2, well below the interim value of 100 pCi/g. However, two samples out of 60 DU Armor billets slightly exceeded the interim value of 500 pCi/g for Tc-99. But as evidence by the percentage ALI TRU and Tc-99 equation shows, even an increase to 10,000 pCi/g of Tc-99 will not increase the overall occupational risk above 0.8%. Even though two samples out of 60 DU Armor billets had Tc-99 values greater than 500 pCi/g (510 ± 30 pCi/g and 540 ±32 pCi/g), the overall occupational risk (as represented by the ALI) still will not exceed 0.8%.
14
It is also important to underscore that the radiation protection program currently in place in support of the DU Armor program also adequately protects against these minute quantities of TRU and Tc-99. Therefore, the presence of these trace radionuclides in DU Armor is safe. REFERENCES 1. Idaho National Engineering and Environmental Laboratory, Lmitco, Idaho Falls, ID 83415, “Abbreviate Sampling and Analysis Plan for SMC Depleted Uranium,” WG5-051-99, September 30, 1999. 2. “Quality Assurance Project Plan for the Analytical Laboratories Department Radioanalytical Section,” December 31, 1997, Lockheed Martin Idaho Technologies Company. 3. C.W. Sill and D.S. Sill, “Sample Dissolution,” Radioactivity and Radiochemistry, 6(2), 8, (1995). 4. “SMC Billets,” INEEL/INT-99-01228, INTEC Radiochemistry, December 15,1999. 5. “Analysis of the Transuranic Contamination of the Depleted Uranium Draft,” Internal Draft Report dated, September 9, 1999.
15
Am-241 Pu-238 Pu-239/240Units
Interim Values <100 <100 <100
Top W05199011RH 2.0 < 1.4 -0.03 0.35 110
Bottom W05199021RH 2.5 < 1.3 0.10 0.23 130
Top W05199031RH 4.4 3.7 0.50 0.57 < 92Bottom W05199041RH 3.1 1.9 0.50 0.58 < 82
Top W05199051RH 0.55 < 1.5 0.03 -0.02 < 78Bottom W05199061RH 1.6 < 1.6 0.06 0.06 < 73
Top W05199071RH 0.00 2.5 1.20 2.7 87
Bottom W05199081RH 1.7 3.4 2.00 0.59 < 79
Top W05199091RH 1.6 3.2 0.32 0.27 < 92
Bottom W05199101RH 2.9 1.4 0.33 0.66 150
Top W05199111RH 3.6 < 1.6 0.19 0.28 < 80
Bottom W05199121RH 4.2 1.7 0.09 0.34 < 79
Top W05199131RH -0.80 1.8 0.12 0.31 < 74
Bottom W05199141RH 2.4 < 1.5 0.03 -1.2 < 82
Top W05199151RH -0.45 < 1.6 0.11 0.43 100
Bottom W05199161RH 2.3 < 1.7 0.14 0.39 240
Top W05199171RH 2.4 < 1.5 0.26 0.37 < 84
Bottom W05199181RH 1.5 < 1.6 0.14 0.26 < 87
Top W05199191RH 0.00 < 1.5 0.11 0.14 < 83Bottom W05199201RH 2.1 < 1.6 0.23 0.18 < 81
Appendix A: Analysis of TRU in Depleted Uranium Armor
INTEC Samples of Population #1 Billets
122
140
Position
10
28
47
66
84
Nuclide
<100
Np-237
<500
Tc-99 Value (pCi/g of DU Armor)
103
159
170
Sample ID#Random #
16
Am-241 Pu-238 Pu-239/240Units
Interim Values <100 <100 <100W05199211RH 4.9 < 1.5 0.62 1.0 510W05199221RH 12 < 1.8 0.23 0.34 < 94W05199231RH 19 < 2.0 0.16 0.21 < 95W05199241RH 5.3 < 1.8 0.22 0.20 < 83W05199251RH 3.4 < 1.3 0.14 0.43 < 64W05199261RH 2.3 < 1.9 0.16 0.21 < 89W05199271RH 3.6 < 2.0 0.36 0.55 < 93W05199281RH 1.0 < 1.4 0.18 0.12 110W05199291RH -0.20 < 1.8 0.21 0.16 < 84W05199301RH -1.7 < 1.4 0.23 0.41 99W05199311RH -1.6 < 1.6 0.17 0.19 < 88W05199321RH 3.1 < 1.6 0.53 0.47 < 85W05199331RH 3.9 < 1.8 0.83 0.36 < 75W05199341RH 4.0 < 1.7 0.20 0.49 < 90W05199351RH 2.0 < 1.6 0.07 0.58 240W05199361RH 3.3 1.7 0.09 0.21 95W05199371RH 2.1 < 1.5 0.05 0.41 120W05199381RH 1.5 < 2.0 0.12 0.43 < 96W05199391RH 2.5 < 1.8 0.21 0.69 170W05199401RH 3.4 < 2.2 0.07 0.33 230W05199411RH 3.1 < 1.5 0.21 0.59 540W05199421RH 4.4 < 1.4 0.09 0.44 160W05199431RH 1.0 < 1.5 0.01 0.37 < 82W05199441RH 0.39 1.8 0.08 0.17 190W05199451RH 1.5 < 1.3 0.09 0.23 330W05199461RH 2.6 < 1.2 0.17 0.63 280W05199471RH 3.7 < 1.4 0.19 0.43 270W05199481RH 2.5 < 1.1 0.18 0.55 430W05199491RH 5.0 1.6 0.09 0.30 270W05199501RH 1.9 < 1.4 0.14 0.38 280
<500<100
Value (pCi/g of DU Armor)Np-237 Tc-99
Appendix B: Analysis of TRU in Depleted Uranium ArmorINTEC Samples of Population #2 Billets
NuclideSample ID#
17
Am-241 Pu-238 Pu-239/240Units
Interim Values <100 <100 <100W05199511RH 3.2 < 2.1 0.86 0.60 < 96W05199521RH 1.2 < 1.8 0.44 0.86 < 89W05199531RH 3.6 < 1.9 0.41 0.53 140W05199541RH 5.3 < 3.1 0.48 0.60 330W05199551RH 3.6 < 1.8 0.45 0.74 220W05199561RH 3.9 < 3.6 0.17 0.29 < 93W05199571RH 1.9 < 2.1 0.28 0.24 180W05199581RH 2.5 < 1.5 0.29 0.59 < 83W05199591RH 2.8 < 1.5 0.54 0.72 360W05199601RH 3.3 < 1.2 0.25 0.56 400
<500<100
Sample ID#
Appendix C: Analysis of TRU in Depleted Uranium ArmorINTEC Samples of Population #3 Billets
NuclideNp-237 Tc-99
Value (pCi/g of DU Armor)
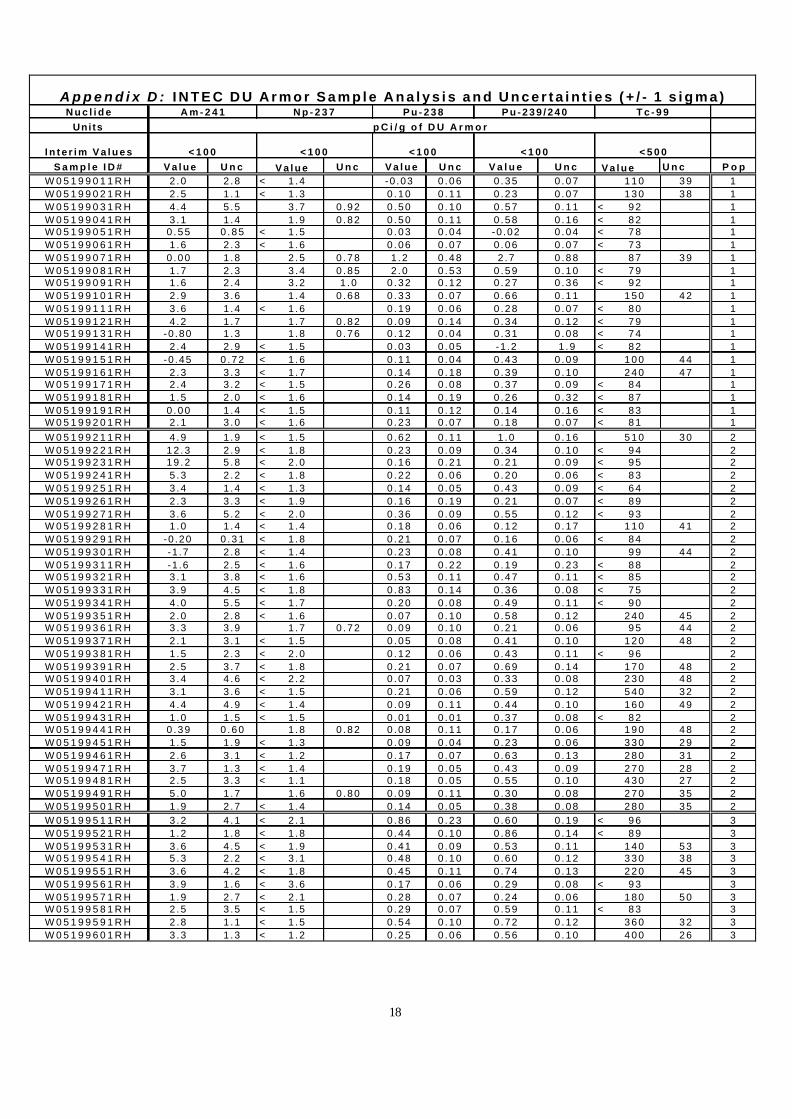
18
N u c l i d e
Uni ts
I n t e r i m V a l u e s
S a m p l e I D # V a l u e U n c U n c V a l u e U n c V a l u e U n c U n c P o pW 0 5 1 9 9 0 1 1 R H 2 .0 2 .8 < 1 .4 -0 .03 0 .06 0 .35 0 .07 1 1 0 3 9 1W 0 5 1 9 9 0 2 1 R H 2 .5 1 .1 < 1 .3 0 .10 0 .11 0 .23 0 .07 1 3 0 3 8 1W 0 5 1 9 9 0 3 1 R H 4 .4 5 .5 3 .7 0 .92 0 .50 0 .10 0 .57 0 .11 < 9 2 1W 0 5 1 9 9 0 4 1 R H 3 .1 1 .4 1 .9 0 .82 0 .50 0 .11 0 .58 0 .16 < 8 2 1W 0 5 1 9 9 0 5 1 R H 0 .55 0 .85 < 1 .5 0 .03 0 .04 -0 .02 0 .04 < 7 8 1W 0 5 1 9 9 0 6 1 R H 1 .6 2 .3 < 1 .6 0 .06 0 .07 0 .06 0 .07 < 7 3 1W 0 5 1 9 9 0 7 1 R H 0 .00 1 .8 2 .5 0 .78 1 .2 0 .48 2 .7 0 .88 8 7 3 9 1W 0 5 1 9 9 0 8 1 R H 1 .7 2 .3 3 .4 0 .85 2 .0 0 .53 0 .59 0 .10 < 7 9 1W 0 5 1 9 9 0 9 1 R H 1 .6 2 .4 3 .2 1 .0 0 .32 0 .12 0 .27 0 .36 < 9 2 1W 0 5 1 9 9 1 0 1 R H 2 .9 3 .6 1 .4 0 .68 0 .33 0 .07 0 .66 0 .11 1 5 0 4 2 1W 0 5 1 9 9 1 1 1 R H 3 .6 1 .4 < 1 .6 0 .19 0 .06 0 .28 0 .07 < 8 0 1W 0 5 1 9 9 1 2 1 R H 4 .2 1 .7 1 .7 0 .82 0 .09 0 .14 0 .34 0 .12 < 7 9 1W 0 5 1 9 9 1 3 1 R H -0 .80 1 .3 1 .8 0 .76 0 .12 0 .04 0 .31 0 .08 < 7 4 1W 0 5 1 9 9 1 4 1 R H 2 .4 2 .9 < 1 .5 0 .03 0 .05 -1 .2 1 .9 < 8 2 1W 0 5 1 9 9 1 5 1 R H -0 .45 0 .72 < 1 .6 0 .11 0 .04 0 .43 0 .09 1 0 0 4 4 1W 0 5 1 9 9 1 6 1 R H 2 .3 3 .3 < 1 .7 0 .14 0 .18 0 .39 0 .10 2 4 0 4 7 1W 0 5 1 9 9 1 7 1 R H 2 .4 3 .2 < 1 .5 0 .26 0 .08 0 .37 0 .09 < 8 4 1W 0 5 1 9 9 1 8 1 R H 1 .5 2 .0 < 1 .6 0 .14 0 .19 0 .26 0 .32 < 8 7 1W 0 5 1 9 9 1 9 1 R H 0 .00 1 .4 < 1 .5 0 .11 0 .12 0 .14 0 .16 < 8 3 1W 0 5 1 9 9 2 0 1 R H 2 .1 3 .0 < 1 .6 0 .23 0 .07 0 .18 0 .07 < 8 1 1W 0 5 1 9 9 2 1 1 R H 4 .9 1 .9 < 1 .5 0 .62 0 .11 1 .0 0 .16 5 1 0 3 0 2W 0 5 1 9 9 2 2 1 R H 12 .3 2 .9 < 1 .8 0 .23 0 .09 0 .34 0 .10 < 9 4 2W 0 5 1 9 9 2 3 1 R H 19 .2 5 .8 < 2 .0 0 .16 0 .21 0 .21 0 .09 < 9 5 2W 0 5 1 9 9 2 4 1 R H 5 .3 2 .2 < 1 .8 0 .22 0 .06 0 .20 0 .06 < 8 3 2W 0 5 1 9 9 2 5 1 R H 3 .4 1 .4 < 1 .3 0 .14 0 .05 0 .43 0 .09 < 6 4 2W 0 5 1 9 9 2 6 1 R H 2 .3 3 .3 < 1 .9 0 .16 0 .19 0 .21 0 .07 < 8 9 2W 0 5 1 9 9 2 7 1 R H 3 .6 5 .2 < 2 .0 0 .36 0 .09 0 .55 0 .12 < 9 3 2W 0 5 1 9 9 2 8 1 R H 1 .0 1 .4 < 1 .4 0 .18 0 .06 0 .12 0 .17 1 1 0 4 1 2W 0 5 1 9 9 2 9 1 R H -0 .20 0 .31 < 1 .8 0 .21 0 .07 0 .16 0 .06 < 8 4 2W 0 5 1 9 9 3 0 1 R H -1.7 2 .8 < 1 .4 0 .23 0 .08 0 .41 0 .10 9 9 4 4 2W 0 5 1 9 9 3 1 1 R H -1.6 2 .5 < 1 .6 0 .17 0 .22 0 .19 0 .23 < 8 8 2W 0 5 1 9 9 3 2 1 R H 3 .1 3 .8 < 1 .6 0 .53 0 .11 0 .47 0 .11 < 8 5 2W 0 5 1 9 9 3 3 1 R H 3 .9 4 .5 < 1 .8 0 .83 0 .14 0 .36 0 .08 < 7 5 2W 0 5 1 9 9 3 4 1 R H 4 .0 5 .5 < 1 .7 0 .20 0 .08 0 .49 0 .11 < 9 0 2W 0 5 1 9 9 3 5 1 R H 2 .0 2 .8 < 1 .6 0 .07 0 .10 0 .58 0 .12 2 4 0 4 5 2W 0 5 1 9 9 3 6 1 R H 3 .3 3 .9 1 .7 0 .72 0 .09 0 .10 0 .21 0 .06 9 5 4 4 2W 0 5 1 9 9 3 7 1 R H 2 .1 3 .1 < 1 .5 0 .05 0 .08 0 .41 0 .10 1 2 0 4 8 2W 0 5 1 9 9 3 8 1 R H 1 .5 2 .3 < 2 .0 0 .12 0 .06 0 .43 0 .11 < 9 6 2W 0 5 1 9 9 3 9 1 R H 2 .5 3 .7 < 1 .8 0 .21 0 .07 0 .69 0 .14 1 7 0 4 8 2W 0 5 1 9 9 4 0 1 R H 3 .4 4 .6 < 2 .2 0 .07 0 .03 0 .33 0 .08 2 3 0 4 8 2W 0 5 1 9 9 4 1 1 R H 3 .1 3 .6 < 1 .5 0 .21 0 .06 0 .59 0 .12 5 4 0 3 2 2W 0 5 1 9 9 4 2 1 R H 4 .4 4 .9 < 1 .4 0 .09 0 .11 0 .44 0 .10 1 6 0 4 9 2W 0 5 1 9 9 4 3 1 R H 1 .0 1 .5 < 1 .5 0 .01 0 .01 0 .37 0 .08 < 8 2 2W 0 5 1 9 9 4 4 1 R H 0 .39 0 .60 1 .8 0 .82 0 .08 0 .11 0 .17 0 .06 1 9 0 4 8 2W 0 5 1 9 9 4 5 1 R H 1 .5 1 .9 < 1 .3 0 .09 0 .04 0 .23 0 .06 3 3 0 2 9 2W 0 5 1 9 9 4 6 1 R H 2 .6 3 .1 < 1 .2 0 .17 0 .07 0 .63 0 .13 2 8 0 3 1 2W 0 5 1 9 9 4 7 1 R H 3 .7 1 .3 < 1 .4 0 .19 0 .05 0 .43 0 .09 2 7 0 2 8 2W 0 5 1 9 9 4 8 1 R H 2 .5 3 .3 < 1 .1 0 .18 0 .05 0 .55 0 .10 4 3 0 2 7 2W 0 5 1 9 9 4 9 1 R H 5 .0 1 .7 1 .6 0 .80 0 .09 0 .11 0 .30 0 .08 2 7 0 3 5 2W 0 5 1 9 9 5 0 1 R H 1 .9 2 .7 < 1 .4 0 .14 0 .05 0 .38 0 .08 2 8 0 3 5 2W 0 5 1 9 9 5 1 1 R H 3 .2 4 .1 < 2 .1 0 .86 0 .23 0 .60 0 .19 < 9 6 3W 0 5 1 9 9 5 2 1 R H 1 .2 1 .8 < 1 .8 0 .44 0 .10 0 .86 0 .14 < 8 9 3W 0 5 1 9 9 5 3 1 R H 3 .6 4 .5 < 1 .9 0 .41 0 .09 0 .53 0 .11 1 4 0 5 3 3W 0 5 1 9 9 5 4 1 R H 5 .3 2 .2 < 3 .1 0 .48 0 .10 0 .60 0 .12 3 3 0 3 8 3W 0 5 1 9 9 5 5 1 R H 3 .6 4 .2 < 1 .8 0 .45 0 .11 0 .74 0 .13 2 2 0 4 5 3W 0 5 1 9 9 5 6 1 R H 3 .9 1 .6 < 3 .6 0 .17 0 .06 0 .29 0 .08 < 9 3 3W 0 5 1 9 9 5 7 1 R H 1 .9 2 .7 < 2 .1 0 .28 0 .07 0 .24 0 .06 1 8 0 5 0 3W 0 5 1 9 9 5 8 1 R H 2 .5 3 .5 < 1 .5 0 .29 0 .07 0 .59 0 .11 < 8 3 3W 0 5 1 9 9 5 9 1 R H 2 .8 1 .1 < 1 .5 0 .54 0 .10 0 .72 0 .12 3 6 0 3 2 3W 0 5 1 9 9 6 0 1 R H 3 .3 1 .3 < 1 .2 0 .25 0 .06 0 .56 0 .10 4 0 0 2 6 3
< 1 0 0 < 1 0 0 < 1 0 0
V a l u e V a l u e
< 1 0 0 < 5 0 0
p C i / g o f D U A r m o r
A p p e n d i x D : I N T E C D U A r m o r S a m p l e A n a l y s i s a n d U n c e r t a i n t i e s ( + / - 1 s i g m a ) A m - 2 4 1 N p - 2 3 7 P u - 2 3 8 P u - 2 3 9 / 2 4 0 T c - 9 9
19
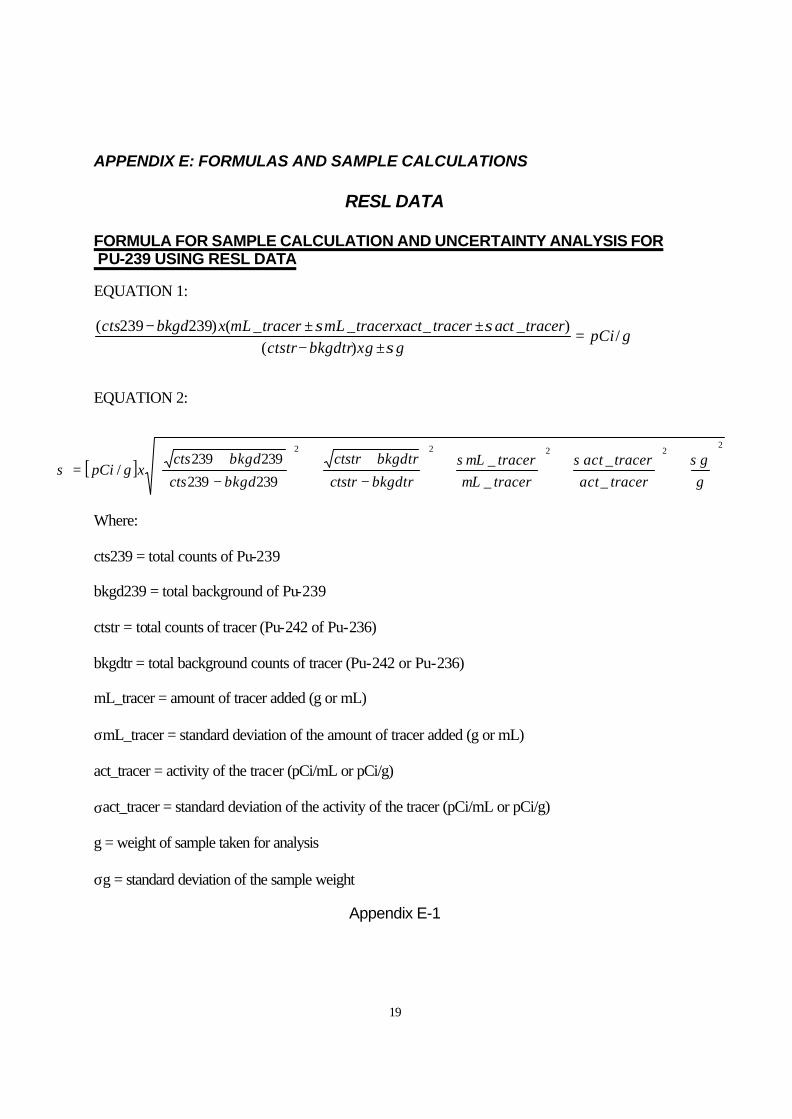
APPENDIX E: FORMULAS AND SAMPLE CALCULATIONS
RESL DATA
FORMULA FOR SAMPLE CALCULATION AND UNCERTAINTY ANALYSIS FOR PU-239 USING RESL DATA
EQUATION 1:
EQUATION 2:
Where: cts239 = total counts of Pu-239 bkgd239 = total background of Pu-239 ctstr = total counts of tracer (Pu-242 of Pu-236) bkgdtr = total background counts of tracer (Pu-242 or Pu-236) mL_tracer = amount of tracer added (g or mL) σmL_tracer = standard deviation of the amount of tracer added (g or mL) act_tracer = activity of the tracer (pCi/mL or pCi/g) σact_tracer = standard deviation of the activity of the tracer (pCi/mL or pCi/g) g = weight of sample taken for analysis σg = standard deviation of the sample weight
Appendix E-1
gpCigxgbkgdtrctstr
traceracttracertracerxactmLtracermLxbkgdcts/
)()____()239239(
=±−
±±−σ
σσ
[ ]2
2222
__
__
239239
239239/
+
+
+
−+
+
−+
=gg
traceracttraceract
tracermLtracermL
bkgdtrctstr
bkgdtrctstr
bkgdcts
bkgdctsxgpCi
σσσσ
20
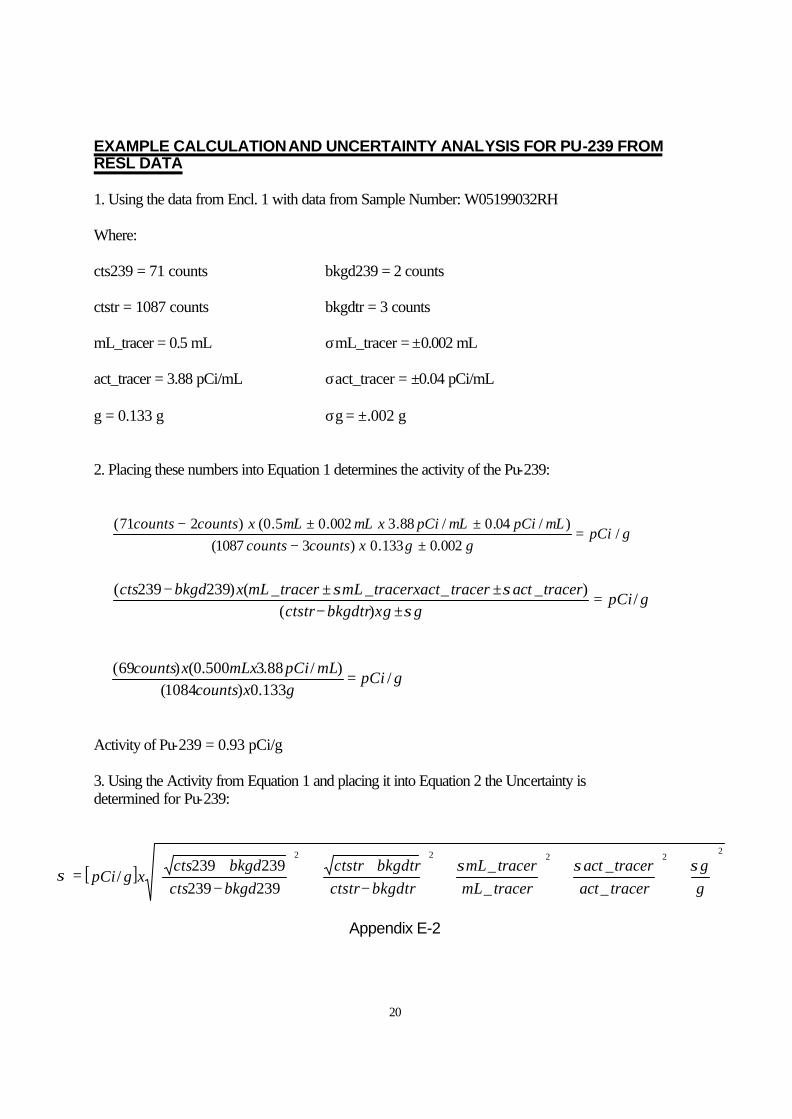
EXAMPLE CALCULATION AND UNCERTAINTY ANALYSIS FOR PU-239 FROM RESL DATA 1. Using the data from Encl. 1 with data from Sample Number: W05199032RH Where: cts239 = 71 counts bkgd239 = 2 counts ctstr = 1087 counts bkgdtr = 3 counts mL_tracer = 0.5 mL σmL_tracer = ±0.002 mL act_tracer = 3.88 pCi/mL σact_tracer = ±0.04 pCi/mL g = 0.133 g σg = ±.002 g 2. Placing these numbers into Equation 1 determines the activity of the Pu-239:
Activity of Pu-239 = 0.93 pCi/g 3. Using the Activity from Equation 1 and placing it into Equation 2 the Uncertainty is determined for Pu-239:
Appendix E-2
gpCiggxcountscounts
mLpCimLpCixmLmLxcountscounts/
002.0133.0)31087()/04.0/88.3002.05.0()271(
=±−
±±−
gpCigxcounts
mLpCimLxxcounts/
133.0)1084()/88.3500.0()69(
=
[ ]2
2222
__
__
239239239239
/
+
+
+
−+
+
−+
=gg
traceracttraceract
tracermLtracermL
bkgdtrctstrbkgdtrctstr
bkgdctsbkgdcts
xgpCiσσσσ
gpCigxgbkgdtrctstr
traceracttracertracerxactmLtracermLxbkgdcts/
)()____()239239(
=±−
±±−σ
σσ
21
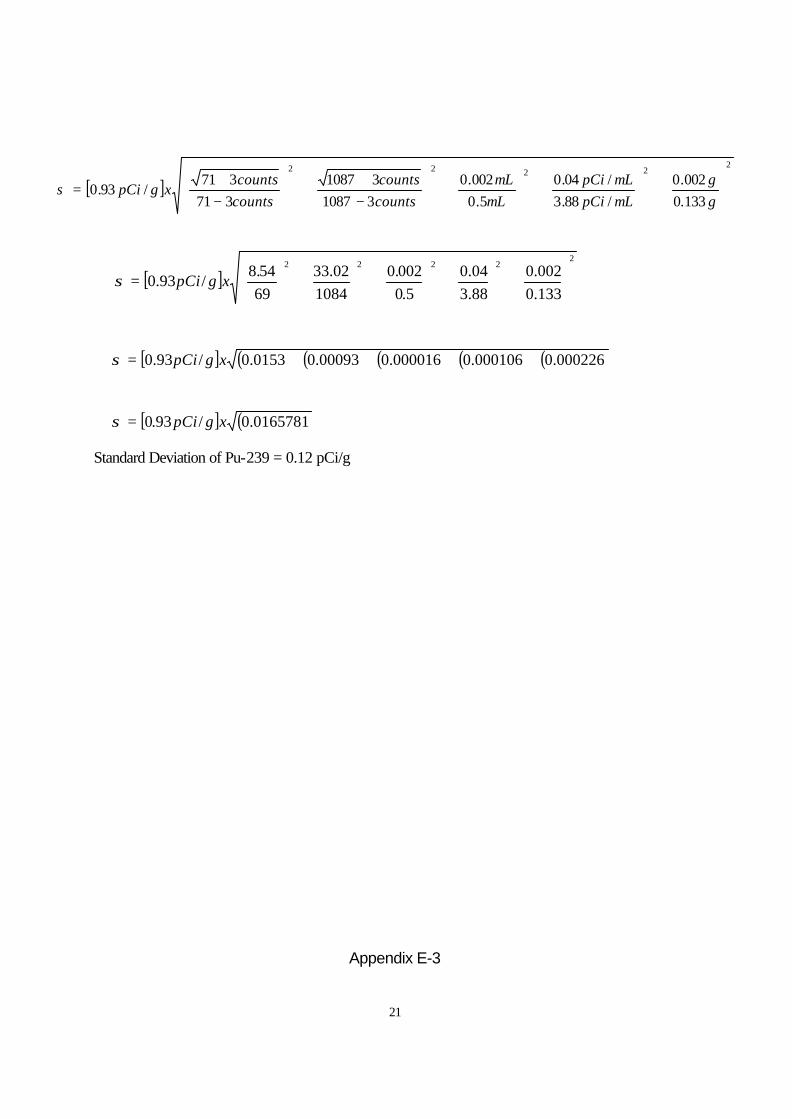
Standard Deviation of Pu-239 = 0.12 pCi/g
Appendix E-3
[ ]2
2222
133.0002.0
/88.3/04.0
5.0002.0
3108731087
371371
/93.0
+
+
+
−+
+
−+
=gg
mLpCimLpCi
mLmL
countscounts
countscounts
xgpCiσ
[ ]2
2222
133.0002.0
88.304.0
5.0002.0
108402.33
6954.8
/93.0
+
+
+
+
= xgpCiσ
[ ] ( ) ( ) ( ) ( ) ( )000226.0000106.0000016.000093.00153.0/93.0 ++++= xgpCiσ
[ ] ( )0165781.0/93.0 xgpCi=σ
22
APPENDIX F: FORMULAS AND SAMPLE CALCULATIONS
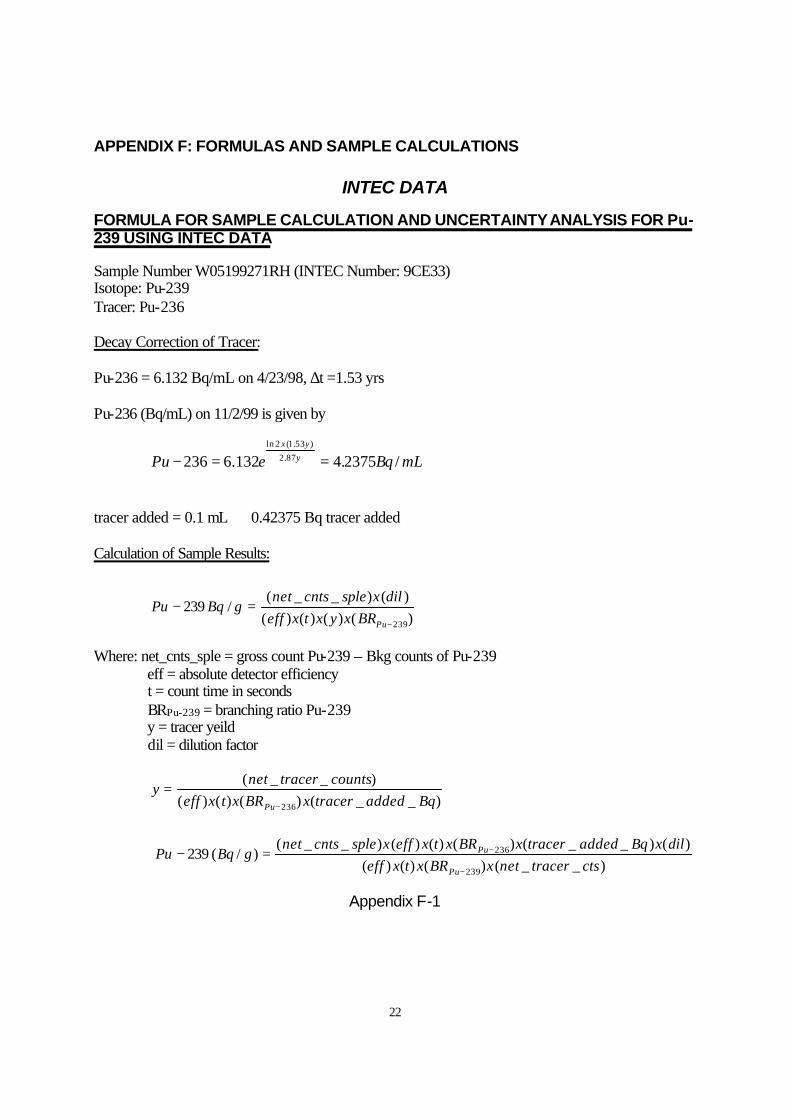
INTEC DATA FORMULA FOR SAMPLE CALCULATION AND UNCERTAINTY ANALYSIS FOR Pu-239 USING INTEC DATA Sample Number W05199271RH (INTEC Number: 9CE33) Isotope: Pu-239 Tracer: Pu-236 Decay Correction of Tracer: Pu-236 = 6.132 Bq/mL on 4/23/98, ∆t =1.53 yrs Pu-236 (Bq/mL) on 11/2/99 is given by
tracer added = 0.1 mL ⇒ 0.42375 Bq tracer added Calculation of Sample Results:
Where: net_cnts_sple = gross count Pu-239 – Bkg counts of Pu-239 eff = absolute detector efficiency t = count time in seconds BRPu-239 = branching ratio Pu-239 y = tracer yeild dil = dilution factor
Appendix F-1
mLBqePu y
yx
/2375.4132.6236 87.2
)53.1(2ln
==−
)()()()()()__(
/239239−
=−PuBRxyxtxeff
dilxsplecntsnetgBqPu
)__()()()()__(
236 BqaddedtracerxBRxtxeffcountstracernet
yPu−
=
)__()()()()()__()()()()__(
)/(239239
236
ctstracernetxBRxtxeffdilxBqaddedtracerxBRxtxeffxsplecntsnet
gBqPuPu
Pu
−
−=−∴
23
For sample W05199271RH:
net_cnts_Pu-239 = 54.4 counts net_cnts_Pu-236_tracer = 3074.7 counts
Uncertainty Calculations: UTotal = Urand + Usys = Total Relative Uncertainty
Where: UI = relative uncertainty in the spike peak branching ratio (intensity) D = natural logarithm of decay correction factor UHL = relative uncertainty of nuclide half-life Uspk = total relative uncertainty of tracer UL = relative uncertainty due to laboratory sample prep Uspk = Urand_tracer + Usys tracer Where:
Appendix F-2
)_236__()999.0())(42375.0()00.1()239__(
tracerPucntsnetxdilBqxxPucntsnet
−−
=
174.2)832.1()96.9(
50 −== ggxmL
mLdil
gBqXcountsx
gxBqxxcountsgBqPu /1005.2
)7.3074()999.0()74.2()42375.0()00.1()4.54(
)/(239 21
−−
==−⇒
splecntsnetsplecntstotal
U rand ____
=
21
22222 )( LHLIspksys UUDUUU +++=
tracercntsnettracercntstotal
U tracerrand ____
_ =
24
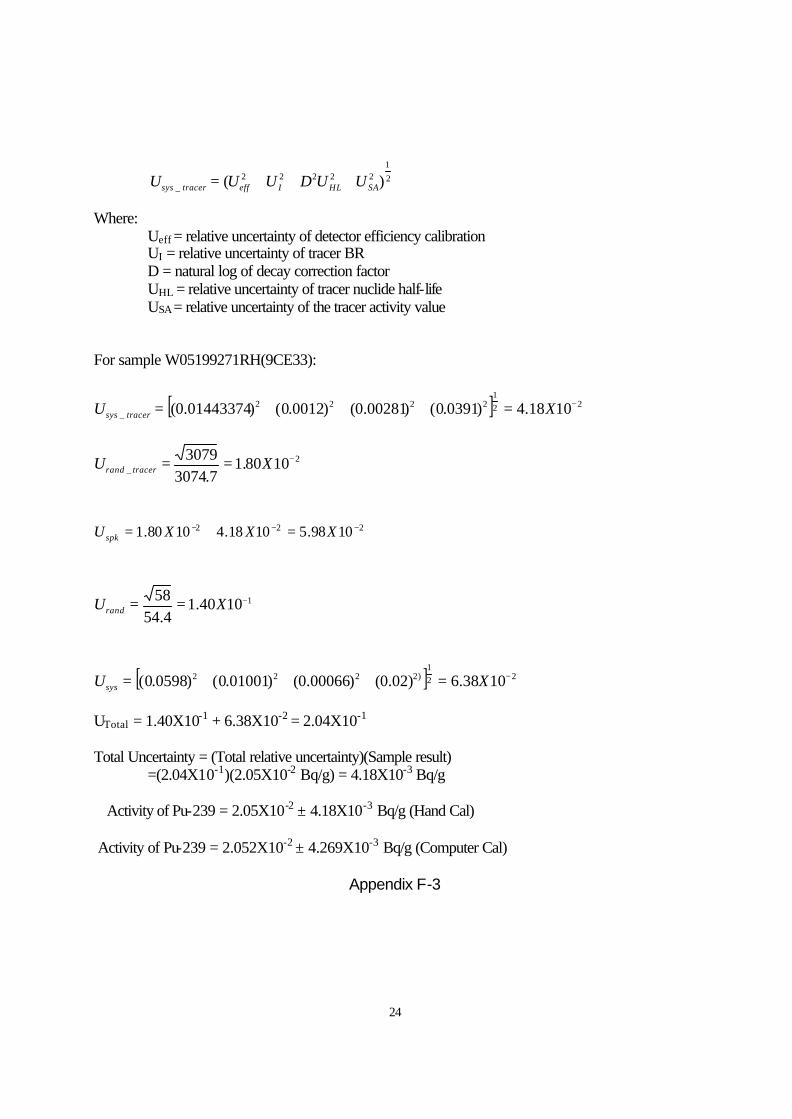
Where: Ueff = relative uncertainty of detector efficiency calibration UI = relative uncertainty of tracer BR D = natural log of decay correction factor UHL = relative uncertainty of tracer nuclide half-life USA = relative uncertainty of the tracer activity value For sample W05199271RH(9CE33):
UTotal = 1.40X10⁻¹ + 6.38X10-2 = 2.04X10⁻¹
Total Uncertainty = (Total relative uncertainty)(Sample result) =(2.04X10⁻¹)(2.05X10⁻² Bq/g) = 4.18X10⁻³ Bq/g ∴Activity of Pu-239 = 2.05X10⁻² ± 4.18X10⁻³ Bq/g (Hand Cal) Activity of Pu-239 = 2.052X10⁻² ± 4.269X10⁻³ Bq/g (Computer Cal)
Appendix F-3
2
122222
_ )( SAHLIefftracersys UUDUUU +++=
[ ] 221
2222_ 1018.4)0391.0()00281.0()0012.0()01443374.0( −=+++= XU tracersys
2_ 1080.1
7.30743079 −== XU tracerrand
222 1098.51018.41080.1 −−− =+= XXXU spk
11040.14.54
58 −== XUrand
[ ] 221
)2222 1038.6)02.0()00066.0()01001.0()0598.0( −=+++= XUsys