Embed Size (px)
Citation preview
The Science Education Institute (SEI) of the Department of Science and Technology (DOST), by virtue of Republic Act No. 7687, otherwise known as the S&T Scholarship Act of 1994, and Executive Order No. 128, is mandated to undertake efforts in accelerating the production of the country’s S&T human resource through the grant of scholarships in Science, Technology, Engineering, and Mathematics (STEM).
Thus, the Tracking Actual Career Experience Report or TRACER Study is regularly conducted by the Institute to track the whereabouts of its scholar-graduates after graduation. This Tracer Study Fact Sheet No. 5 focuses on the employment outcomes of 2,205 DOST-SEI scholar-graduates at the Undergraduate Level, particularly on their employment location and status, including their professional achievements and relevant contributions both in the local and international arena.
The data for this study were obtained mainly from the SEI online registration system of scholar-graduates, and from the TRACER study questionnaires accomplished by the scholar-graduates from October 2018 to December 2019. Hence, the results presented below refer only to the post-scholarship careers of scholar-graduates being studied.
ISSN 2449-4925 | Fact Sheet No. 5December 2020
The TRACER StudyTracking of Actual Career Experience Report (TRACER) Study amongDOST-SEI S&T Scholar Graduates (Undergraduate Level)
Department of Science and TechnologyScience Education Institute
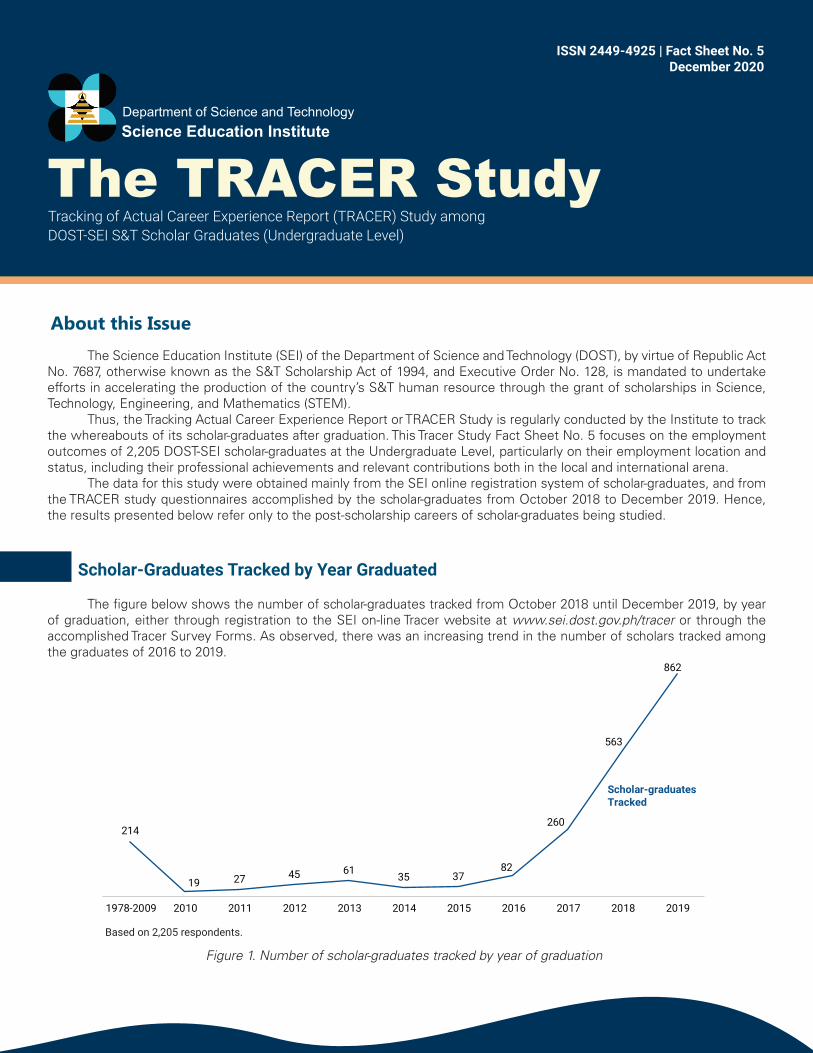
The �gure below shows the number of scholar-graduates tracked from October 2018 until December 2019, by year of graduation, either through registration to the SEI on-line Tracer website at www.sei.dost.gov.ph/tracer or through the accomplished Tracer Survey Forms. As observed, there was an increasing trend in the number of scholars tracked among the graduates of 2016 to 2019.
About this Issue
Scholar-Graduates Tracked by Year Graduated
Figure 1. Number of scholar-graduates tracked by year of graduation
Scholar-graduatesTracked
214
19 27 45 61 35 3782
260
563
862
1978-2009 2010 2011 2012 2013 2014 2015 2016 2017 2018 2019
Based on 2,205 respondents.
The Tracer Study | Fact Sheet No. 5December 2020 | page 2
Department of Science and TechnologyScience Education Institute
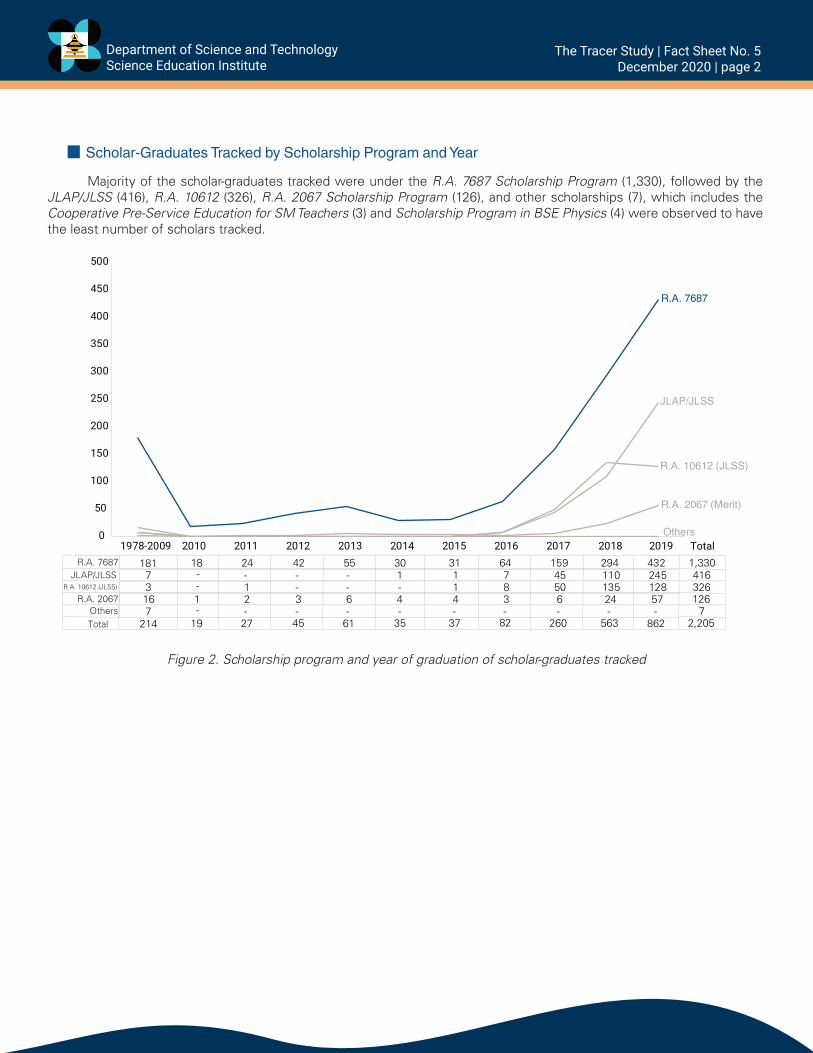
Majority of the scholar-graduates tracked were under the R.A. 7687 Scholarship Program (1,330), followed by the JLAP/JLSS (416), R.A. 10612 (326), R.A. 2067 Scholarship Program (126), and other scholarships (7), which includes the Cooperative Pre-Service Education for SM Teachers (3) and Scholarship Program in BSE Physics (4) were observed to have the least number of scholars tracked.
Figure 2. Scholarship program and year of graduation of scholar-graduates tracked
Scholar-Graduates Tracked by Scholarship Program and Year
R.A. 7687
JLAP/JLSS
R.A. 2067 (Merit)
Others0
50
100
150
200
250
300
350
400
450
500
1978-2009 2010 2011 2012 2013 2014 2015 2016 2017 2018 2019
R.A. 10612 (JLSS)
181 18 24 42 55 30 31 64 159 294 4327 - - - - 1 1 7 45 110 2453 - 1 - - - 1 8 50 135 12816 1 2 3 6 4 4 3 6 24 577 - - - - - - - - - -
1,330416326126
7
Total
JLAP/JLSSR.A. 7687
R.A. 10612 (JLSS)
R.A. 2067OthersTotal 214 19 27 45 61 35 37 82 260 563 862 2,205
The Tracer Study | Fact Sheet No. 5December 2020 | page 3
Department of Science and TechnologyScience Education Institute
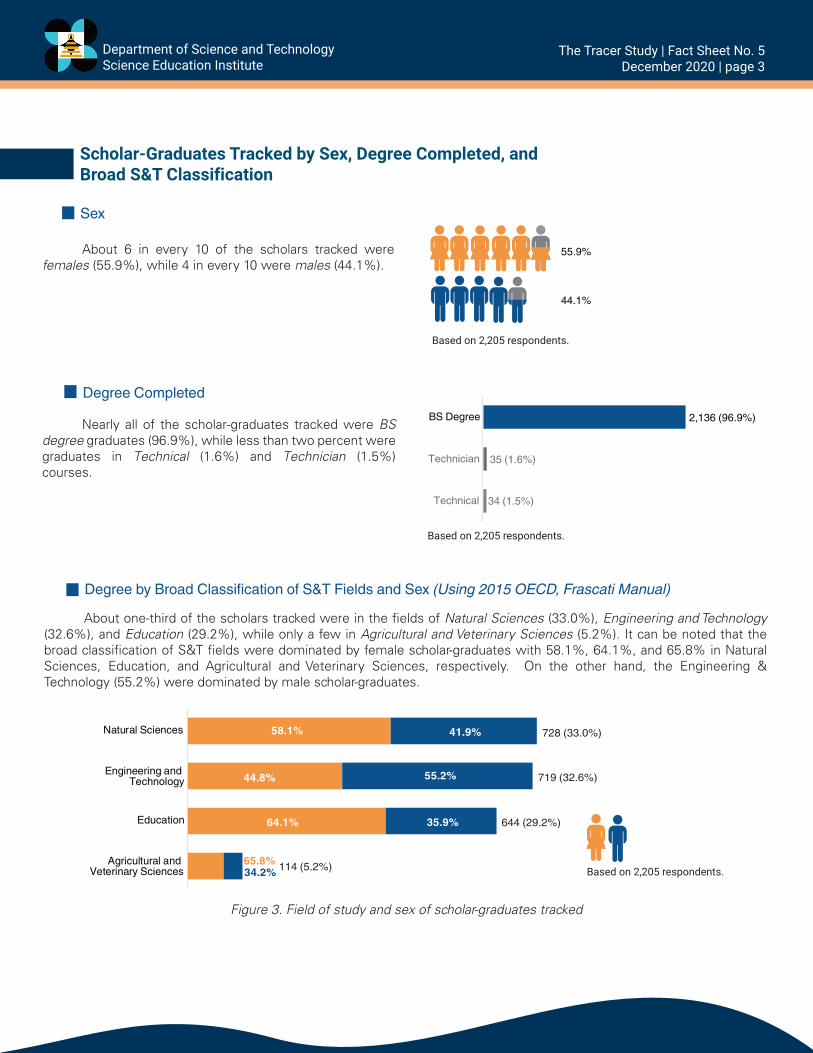
About one-third of the scholars tracked were in the �elds of Natural Sciences (33.0%), Engineering and Technology (32.6%), and Education (29.2%), while only a few in Agricultural and Veterinary Sciences (5.2%). It can be noted that the broad classi�cation of S&T �elds were dominated by female scholar-graduates with 58.1%, 64.1%, and 65.8% in Natural Sciences, Education, and Agricultural and Veterinary Sciences, respectively. On the other hand, the Engineering & Technology (55.2%) were dominated by male scholar-graduates.
Figure 3. Field of study and sex of scholar-graduates tracked
Degree by Broad Classification of S&T Fields and Sex (Using 2015 OECD, Frascati Manual)
About 6 in every 10 of the scholars tracked were females (55.9%), while 4 in every 10 were males (44.1%).
Scholar-Graduates Tracked by Sex, Degree Completed, and Broad S&T Classification
Nearly all of the scholar-graduates tracked were BS degree graduates (96.9%), while less than two percent were graduates in Technical (1.6%) and Technician (1.5%) courses.
34 (1.5%)
35 (1.6%)
Based on 2,205 respondents.
BS Degree
Technical
Technician
2,136 (96.9%)
Sex
Degree Completed
Based on 2,205 respondents.
55.9%
44.1%
Based on 2,205 respondents.Agricultural and
Veterinary Sciences
Education
Engineering and Technology
Natural Sciences 728 (33.0%)
719 (32.6%)
644 (29.2%)
114 (5.2%)
58.1%
44.8%
64.1%
65.8%34.2%
41.9%
55.2%
35.9%
The Tracer Study | Fact Sheet No. 5December 2020 | page 4
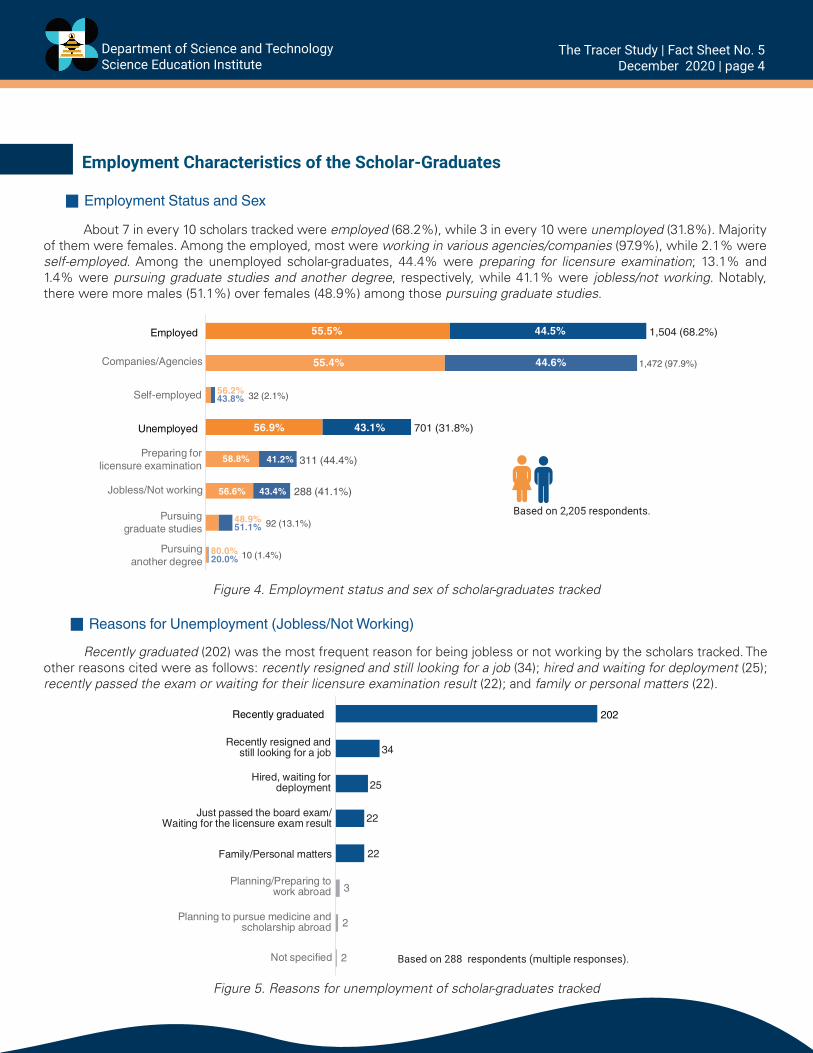
Recently graduated (202) was the most frequent reason for being jobless or not working by the scholars tracked. The other reasons cited were as follows: recently resigned and still looking for a job (34); hired and waiting for deployment (25); recently passed the exam or waiting for their licensure examination result (22); and family or personal matters (22).
Figure 5. Reasons for unemployment of scholar-graduates tracked
Department of Science and TechnologyScience Education Institute
2
2
3
22
22
25
34
202
Not specified
Planning to pursue medicine andscholarship abroad
Planning/Preparing towork abroad
Family/Personal matters
Just passed the board exam/Waiting for the licensure exam result
Hired, waiting fordeployment
Recently resigned andstill looking for a job
Recently graduated
Based on 288 respondents (multiple responses).
Reasons for Unemployment (Jobless/Not Working)
About 7 in every 10 scholars tracked were employed (68.2%), while 3 in every 10 were unemployed (31.8%). Majority of them were females. Among the employed, most were working in various agencies/companies (97.9%), while 2.1% were self-employed. Among the unemployed scholar-graduates, 44.4% were preparing for licensure examination; 13.1% and 1.4% were pursuing graduate studies and another degree, respectively, while 41.1% were jobless/not working. Notably, there were more males (51.1%) over females (48.9%) among those pursuing graduate studies.
Employment Characteristics of the Scholar-Graduates
Figure 4. Employment status and sex of scholar-graduates tracked
Employment Status and Sex
Based on 2,205 respondents.
Pursuinganother degree
Pursuinggraduate studies
Jobless/Not working
Preparing forlicensure examination
Unemployed
Self-employed
Companies/Agencies
Employed 1,504 (68.2%)
701 (31.8%)
1,472 (97.9%)
32 (2.1%)
92 (13.1%)
288 (41.1%)
10 (1.4%)
311 (44.4%)
55.5% 44.5%
56.9% 43.1%
55.4% 44.6%
58.8% 41.2%
56.6% 43.4%
48.9%51.1%
80.0%20.0%
56.2%43.8%
The Tracer Study | Fact Sheet No. 5December 2020 | page 5
Department of Science and TechnologyScience Education Institute
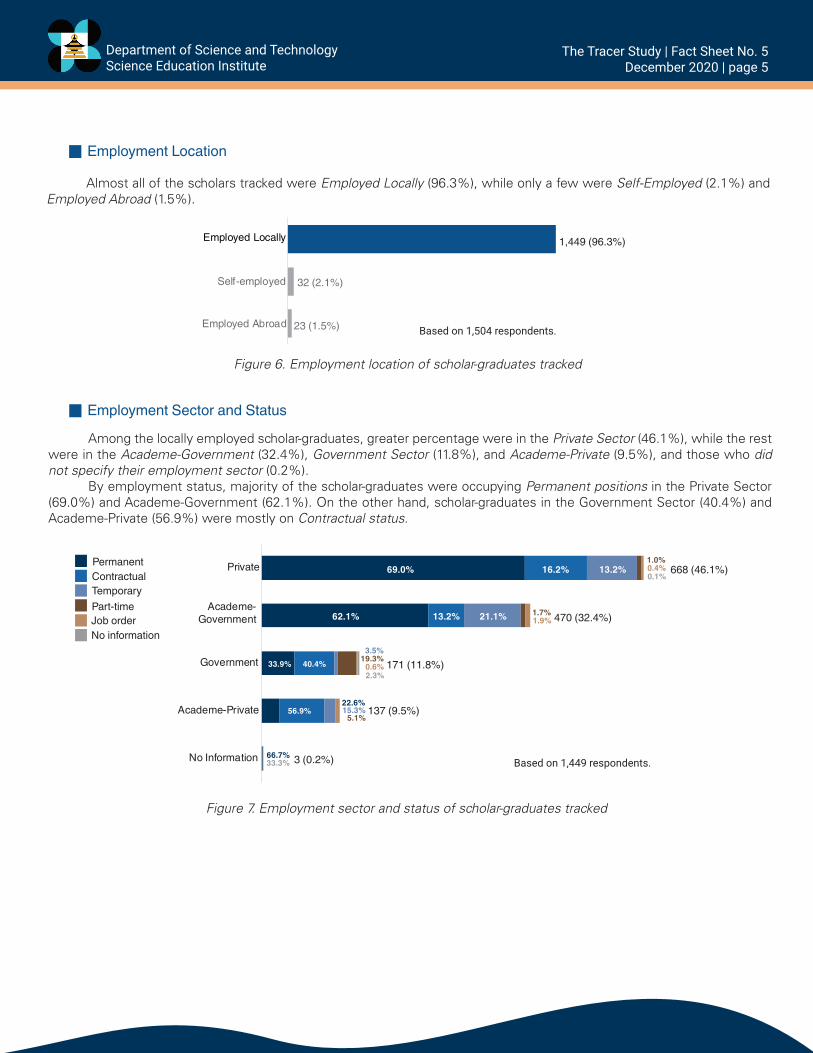
Among the locally employed scholar-graduates, greater percentage were in the Private Sector (46.1%), while the rest were in the Academe-Government (32.4%), Government Sector (11.8%), and Academe-Private (9.5%), and those who did not specify their employment sector (0.2%).
By employment status, majority of the scholar-graduates were occupying Permanent positions in the Private Sector (69.0%) and Academe-Government (62.1%). On the other hand, scholar-graduates in the Government Sector (40.4%) and Academe-Private (56.9%) were mostly on Contractual status.
Figure 7. Employment sector and status of scholar-graduates tracked
Employment Sector and Status
Almost all of the scholars tracked were Employed Locally (96.3%), while only a few were Self-Employed (2.1%) and Employed Abroad (1.5%).
Based on 1,504 respondents.Employed Abroad
Self-employed
Employed Locally 1,449 (96.3%)
23 (1.5%)
32 (2.1%)
Figure 6. Employment location of scholar-graduates tracked
Employment Location
Based on 1,449 respondents.
PermanentContractualTemporaryPart-timeJob orderNo information
No Information
Academe-Private
Government
Academe-Government
Private 668 (46.1%)
470 (32.4%)
171 (11.8%)
137 (9.5%)
3 (0.2%)
69.0%
62.1%
13.2%16.2%
21.1%13.2%
33.9% 40.4%
56.9%
1.0%0.4%0.1%
1.7%1.9%
66.7%33.3%
22.6%15.3%
5.1%
3.5%19.3%
0.6%2.3%
The Tracer Study | Fact Sheet No. 5December 2020 | page 6
Department of Science and TechnologyScience Education Institute
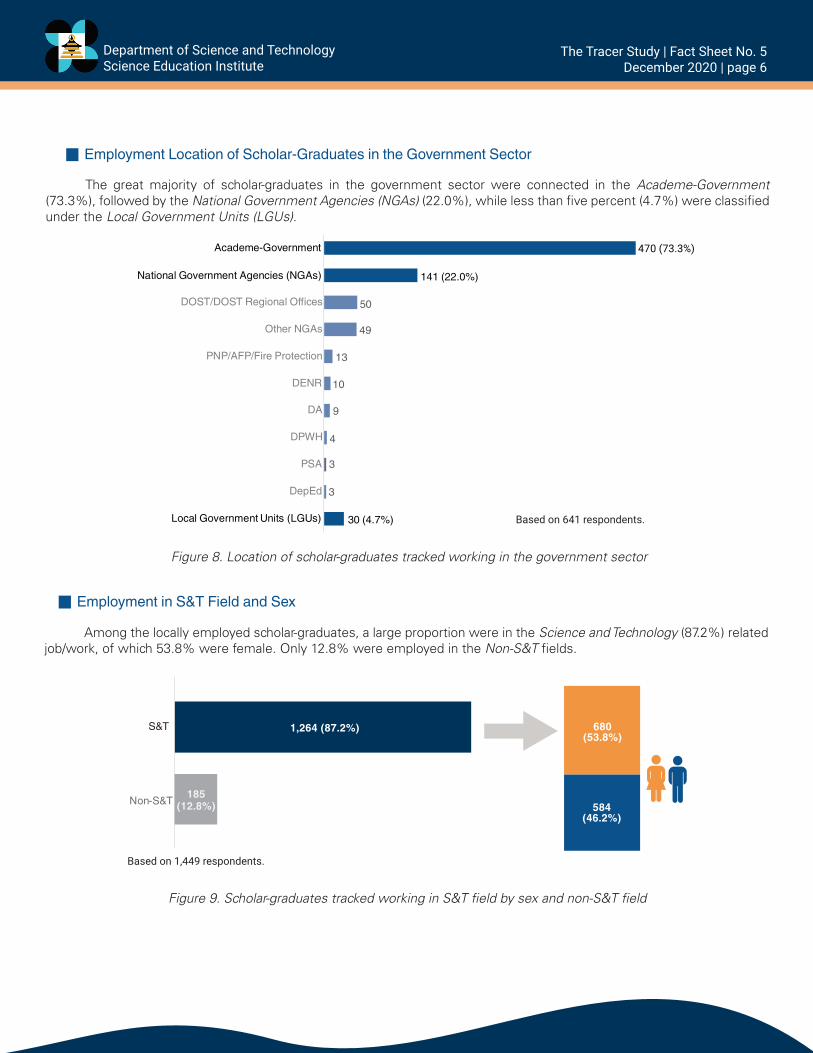
Among the locally employed scholar-graduates, a large proportion were in the Science and Technology (87.2%) related job/work, of which 53.8% were female. Only 12.8% were employed in the Non-S&T �elds.
Figure 9. Scholar-graduates tracked working in S&T �eld by sex and non-S&T �eld
Employment in S&T Field and Sex
Based on 1,449 respondents.
680(53.8%)
584(46.2%)
Non-S&T
S&T
185(12.8%)
1,264 (87.2%)
The great majority of scholar-graduates in the government sector were connected in the Academe-Government (73.3%), followed by the National Government Agencies (NGAs) (22.0%), while less than �ve percent (4.7%) were classi�ed under the Local Government Units (LGUs).
Figure 8. Location of scholar-graduates tracked working in the government sector
Employment Location of Scholar-Graduates in the Government Sector
Based on 641 respondents.30 (4.7%)
3
3
4
9
10
13
49
50
141 (22.0%)
DepEd
PSA
DPWH
DA
DENR
PNP/AFP/Fire Protection
Other NGAs
DOST/DOST Regional Offices
National Government Agencies (NGAs)
Academe-Government
Local Government Units (LGUs)
470 (73.3%)
The Tracer Study | Fact Sheet No. 5December 2020 | page 7
Department of Science and TechnologyScience Education Institute
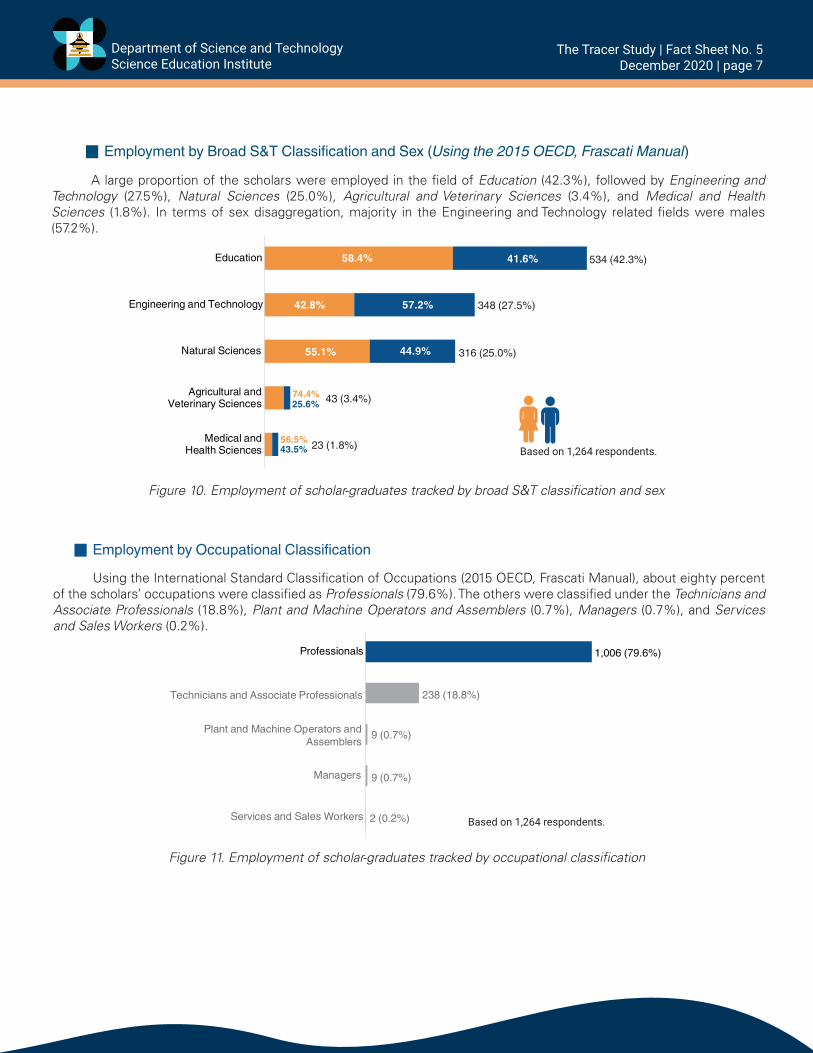
Using the International Standard Classi�cation of Occupations (2015 OECD, Frascati Manual), about eighty percent of the scholars’ occupations were classi�ed as Professionals (79.6%). The others were classi�ed under the Technicians and Associate Professionals (18.8%), Plant and Machine Operators and Assemblers (0.7%), Managers (0.7%), and Services and Sales Workers (0.2%).
Figure 11. Employment of scholar-graduates tracked by occupational classi�cation
Employment by Occupational Classification
Based on 1,264 respondents.2 (0.2%)
9 (0.7%)
9 (0.7%)
238 (18.8%)
1,006 (79.6%)
Services and Sales Workers
Managers
Plant and Machine Operators andAssemblers
Technicians and Associate Professionals
Professionals
A large proportion of the scholars were employed in the �eld of Education (42.3%), followed by Engineering and Technology (27.5%), Natural Sciences (25.0%), Agricultural and Veterinary Sciences (3.4%), and Medical and Health Sciences (1.8%). In terms of sex disaggregation, majority in the Engineering and Technology related �elds were males (57.2%).
Figure 10. Employment of scholar-graduates tracked by broad S&T classi�cation and sex
Employment by Broad S&T Classification and Sex (Using the 2015 OECD, Frascati Manual)
Based on 1,264 respondents.Medical and
Health Sciences
Agricultural andVeterinary Sciences
Natural Sciences
Engineering and Technology
Education 534 (42.3%)
348 (27.5%)
316 (25.0%)
43 (3.4%)
23 (1.8%)
58.4% 41.6%
42.8% 57.2%
55.1% 44.9%
74.4%25.6%
56.5%43.5%
The Tracer Study | Fact Sheet No. 5December 2020 | page 8
Department of Science and TechnologyScience Education Institute
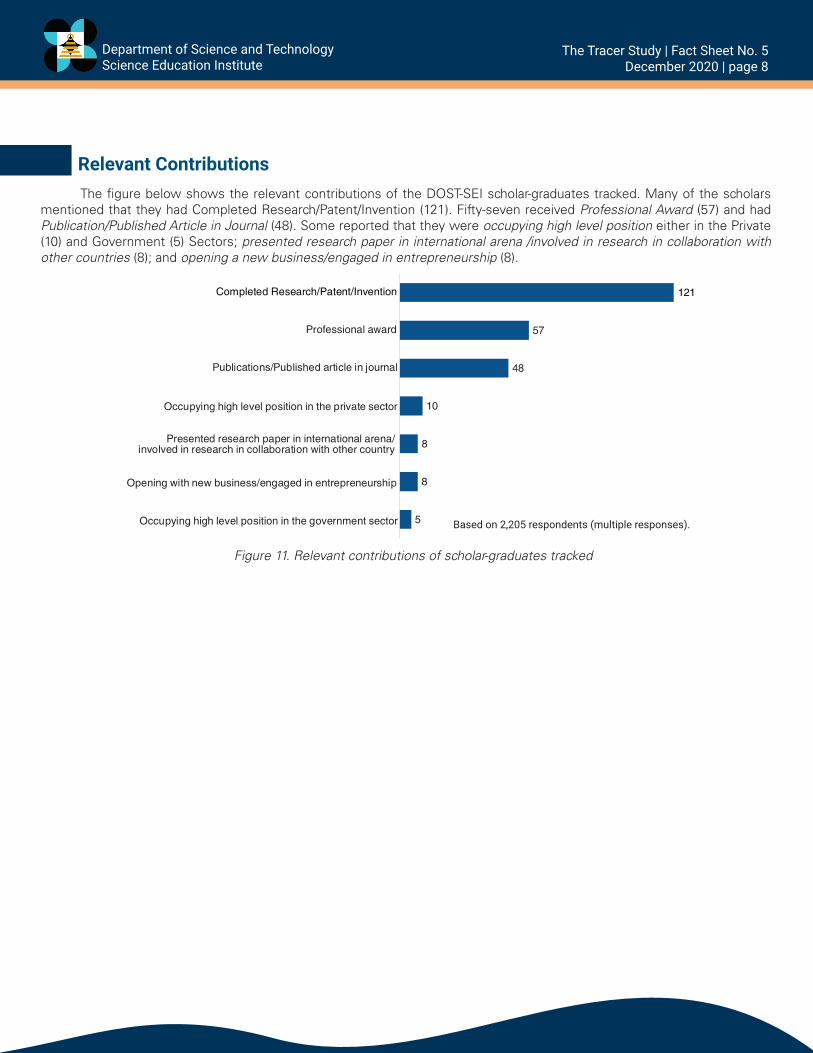
Relevant ContributionsThe �gure below shows the relevant contributions of the DOST-SEI scholar-graduates tracked. Many of the scholars
mentioned that they had Completed Research/Patent/Invention (121). Fifty-seven received Professional Award (57) and had Publication/Published Article in Journal (48). Some reported that they were occupying high level position either in the Private (10) and Government (5) Sectors; presented research paper in international arena /involved in research in collaboration with other countries (8); and opening a new business/engaged in entrepreneurship (8).
Figure 11. Relevant contributions of scholar-graduates tracked
5
8
8
10
48
57
121
Occupying high level position in the government sector
Opening with new business/engaged in entrepreneurship
Presented research paper in international arena/involved in research in collaboration with other country
Occupying high level position in the private sector
Publications/Published article in journal
Professional award
Completed Research/Patent/Invention
Based on 2,205 respondents (multiple responses).
The Tracer Study | Fact Sheet No. 5December 2020 | page 9
Department of Science and TechnologyScience Education Institute
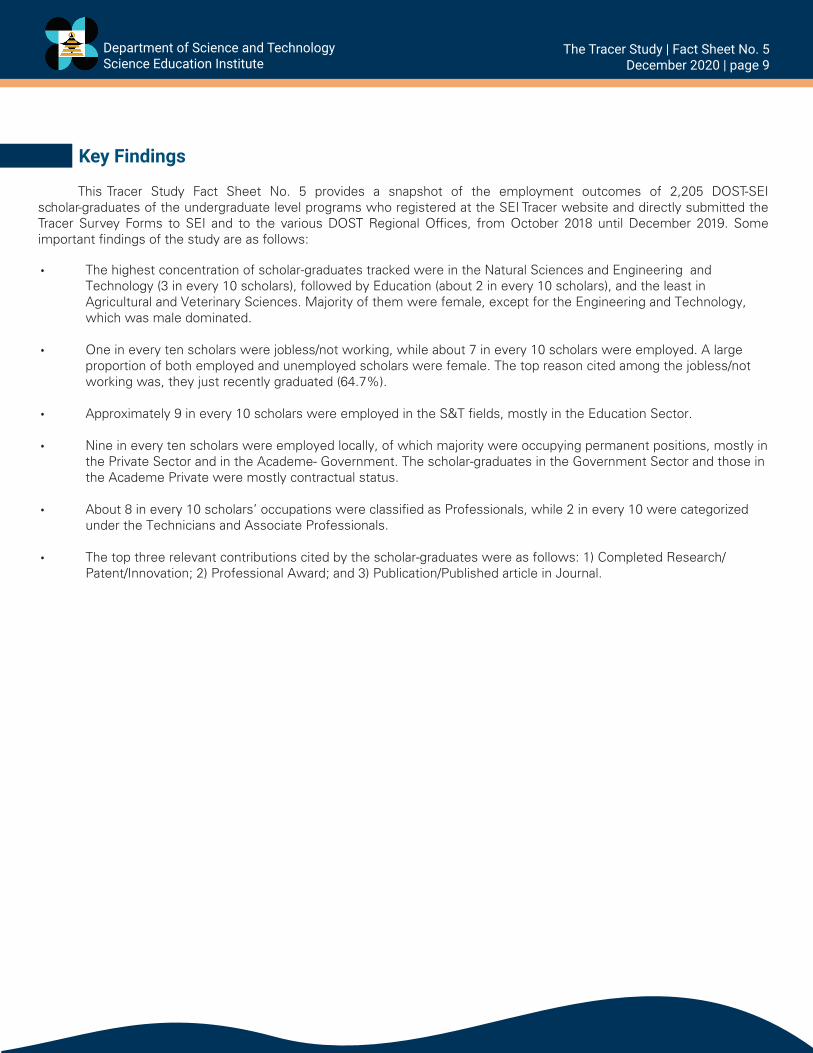
This Tracer Study Fact Sheet No. 5 provides a snapshot of the employment outcomes of 2,205 DOST-SEI scholar-graduates of the undergraduate level programs who registered at the SEI Tracer website and directly submitted the Tracer Survey Forms to SEI and to the various DOST Regional Of�ces, from October 2018 until December 2019. Some important �ndings of the study are as follows:
Key Findings
The highest concentration of scholar-graduates tracked were in the Natural Sciences and Engineering and Technology (3 in every 10 scholars), followed by Education (about 2 in every 10 scholars), and the least in Agricultural and Veterinary Sciences. Majority of them were female, except for the Engineering and Technology, which was male dominated.
One in every ten scholars were jobless/not working, while about 7 in every 10 scholars were employed. A large proportion of both employed and unemployed scholars were female. The top reason cited among the jobless/not working was, they just recently graduated (64.7%).
Approximately 9 in every 10 scholars were employed in the S&T �elds, mostly in the Education Sector.
Nine in every ten scholars were employed locally, of which majority were occupying permanent positions, mostly in the Private Sector and in the Academe- Government. The scholar-graduates in the Government Sector and those in the Academe Private were mostly contractual status.
About 8 in every 10 scholars’ occupations were classi�ed as Professionals, while 2 in every 10 were categorized under the Technicians and Associate Professionals.
The top three relevant contributions cited by the scholar-graduates were as follows: 1) Completed Research/Patent/Innovation; 2) Professional Award; and 3) Publication/Published article in Journal.
•
•
•
•
•
•
Editorial TeamExecutive Adviser
Josette T. Biyo, Ph.D.Director
Adviser and Chief Editor
Ruby R. Cristobal, Ph.D.Chief Science Research Specialist
Lay-out Artist/Proofreader
Glennise Shyra P. BaykingScience Research Specialist II
Vergel P. RebutaScience Research Specialist II
Data Collectors/Encoders
Vergel P. RebutaScience Research Specialist II
Lew Jorden R. JulveScience Research Specialist I
Data Analysts/Writers
Imelda S. SarioSupervising Science Research Specialist
Glennise Shyra P. BaykingScience Research Specialist II
Randolf S. SasotaSenior Science Research Specialist
Lew Jorden R. JulveScience Research Specialist I

Department of Science and TechnologyScience Education Institute
1st and 2nd Levels, Science Heritage BuildingDOST Compound, General Santos AvenueBicutan, Taguig City, Metro Manila
www.sei.dost.gov.ph